
Overview of 177 dive sites (166 with their own page). Figures are averages across the sites that report them (n = sites with a value); each site's own page has its individual values. Regional summaries: Far North: Blue stations (Habitat Protection Zone reefs), Far North: Green stations (no-take reefs), Far North: Pink stations (Preservation Zone reefs), Central (Whitsundays / Townsville / Cairns).
⬇ Download this overview as a report card

Heat stress
Long-term record: 10 years since 1985 reached 8 or more °C-weeks at NOAA’s Central GBR, Far Northern GBR, Northern GBR, Southern GBR stations. Download the annual DHW data (CSV): torres-strait-northern-great-barrier-reef, central-and-southern-great-barrier-reef.
177 sites in this region — click a marker to open that site.
Overview
The Great Barrier Reef runs for well over 2,000 km along Australia's northeast coast, and Spalding et al. (2001) describe it as a system of nearly 3,000 reefs and shoals plus high islands with their own fringing reefs. Its character changes along that length. North of Raine Island the shelf narrows to less than 50 km and its outer rim is lined by ribbon reefs, slender reefs typically under 500 m wide and up to 25 km long, sitting on the shelf break with water deepening past 1,000 m a few hundred meters seaward. Behind them are mid-shelf and inner-shelf reefs, submerged Halimeda banks, and some of the few GBR fringing reefs that adjoin the mainland directly. The central section, from Mossman south to the Whitsunday and Lindeman barrier, sits on a widening shelf where most reef growth is confined to the outer third and nearshore waters swing in turbidity and salinity when rivers flood. Most of the reef's roughly 350 coral species occur in the north. Spalding et al. (2001) put Australia's national reef area at about 48,960 km²; Souter et al. (2021) give 35,487 km² for the GCRMN subregion made up of the Torres Strait-northern GBR, central-southern GBR, and Tweed-Moreton ecoregions.
This page covers 177 sites. Three regional groups, 166 sites, are one survey set: the northern Great Barrier Reef stations of the 2014 Global Reef Expedition, surveyed between 3 September and 2 October 2014 (Anderson dived 84 of them; the GRE team surveyed the other 82), grouped by the expedition's zone strata. Blue (Habitat Protection Zone reefs) holds 54, Green (no-take reefs) 54, and Pink (Preservation Zone reefs) 58. The other eleven sites are of a different kind entirely. Central (Whitsundays / Townsville / Cairns) holds nine sites, six of them reef dive sites in Whitsunday bays and points, plus Davies Reef, one area marker, and Hill Inlet, which is a tidal sand and seagrass system rather than a reef. The last two, Heron Island and Lady Elliot Island in the Capricorn-Bunker group, form a southern group that has no regional page of its own. Neither the central nor the southern sites have a transect value or a photograph; between them they rest on four logged dives from early 2007 and on other organizations' surveys nearby.
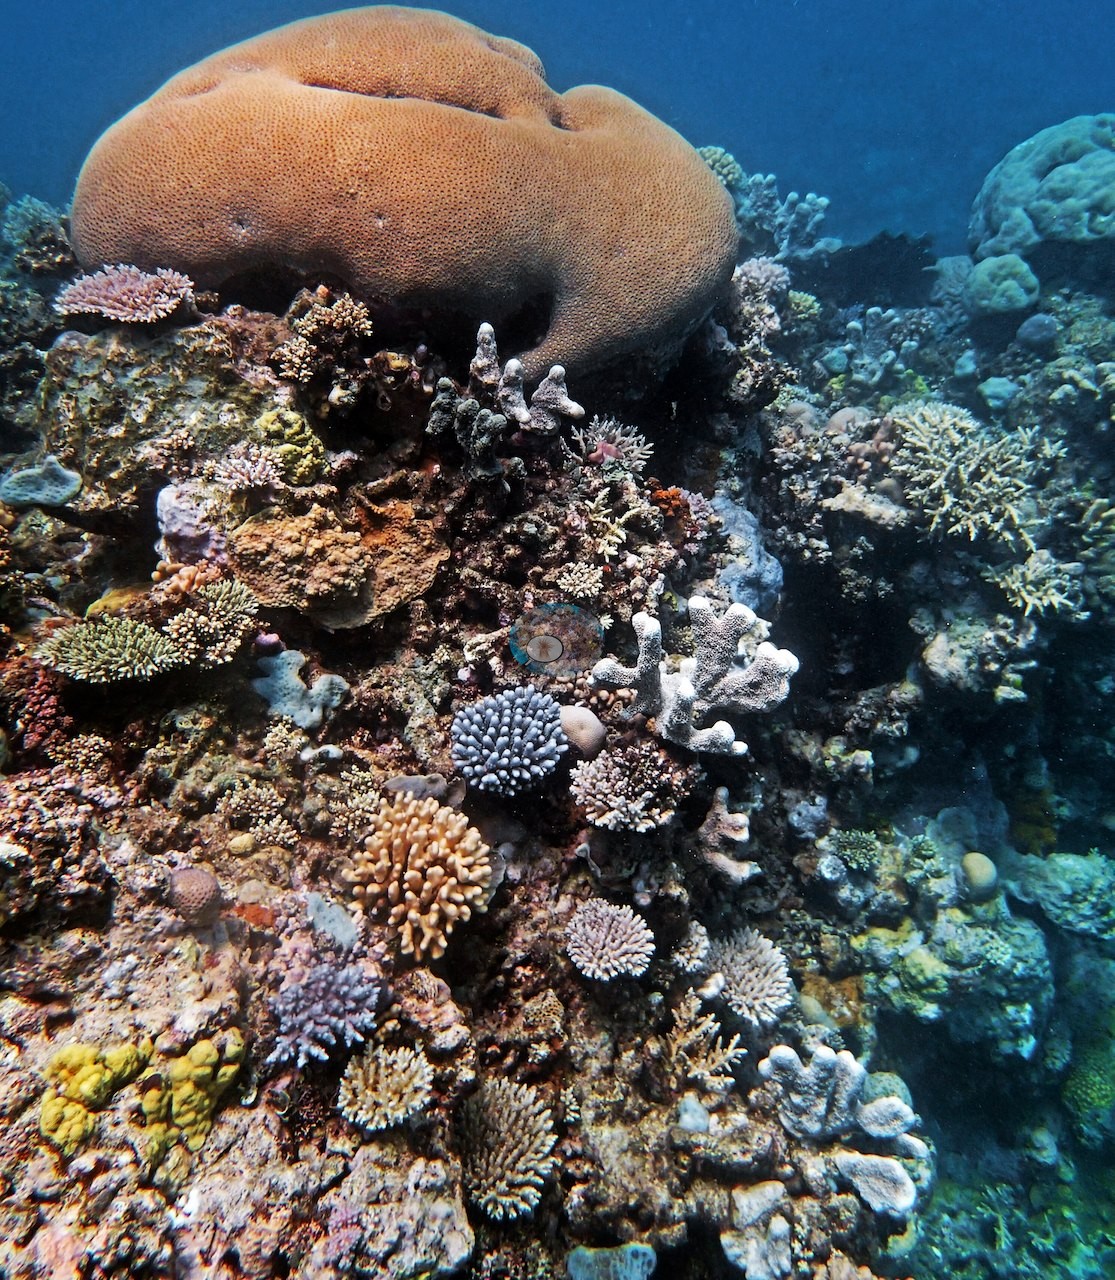
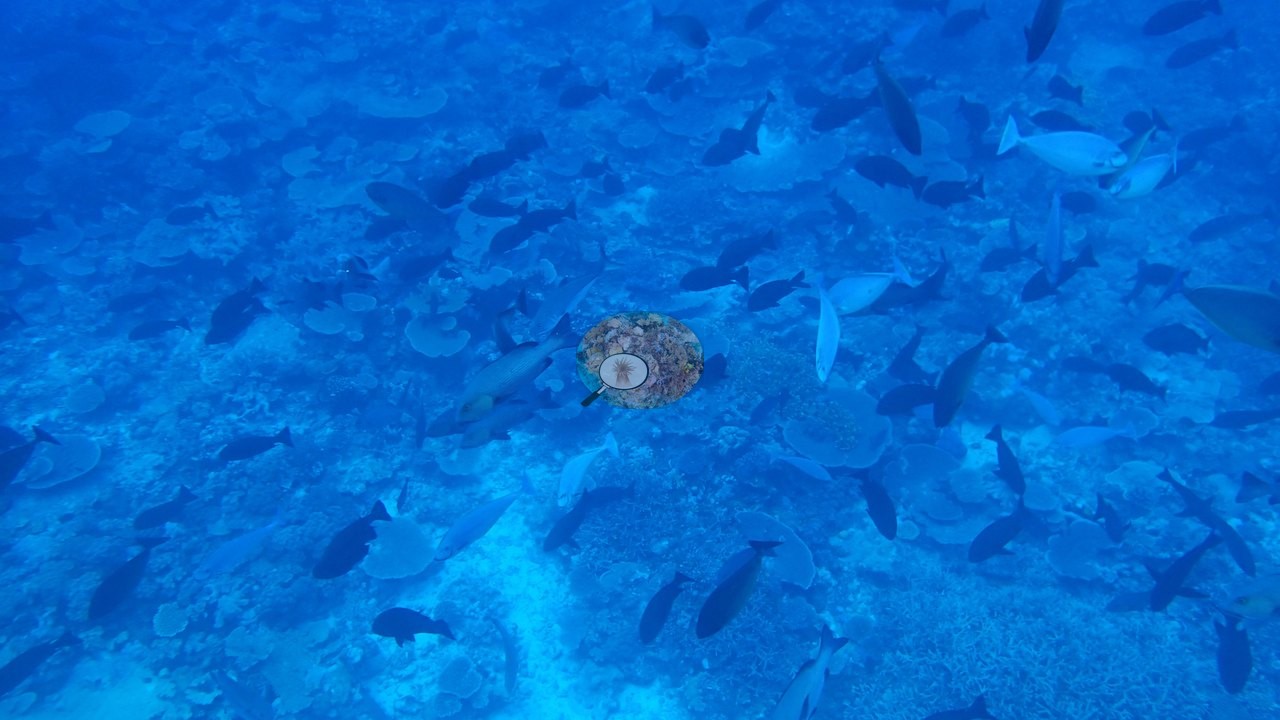
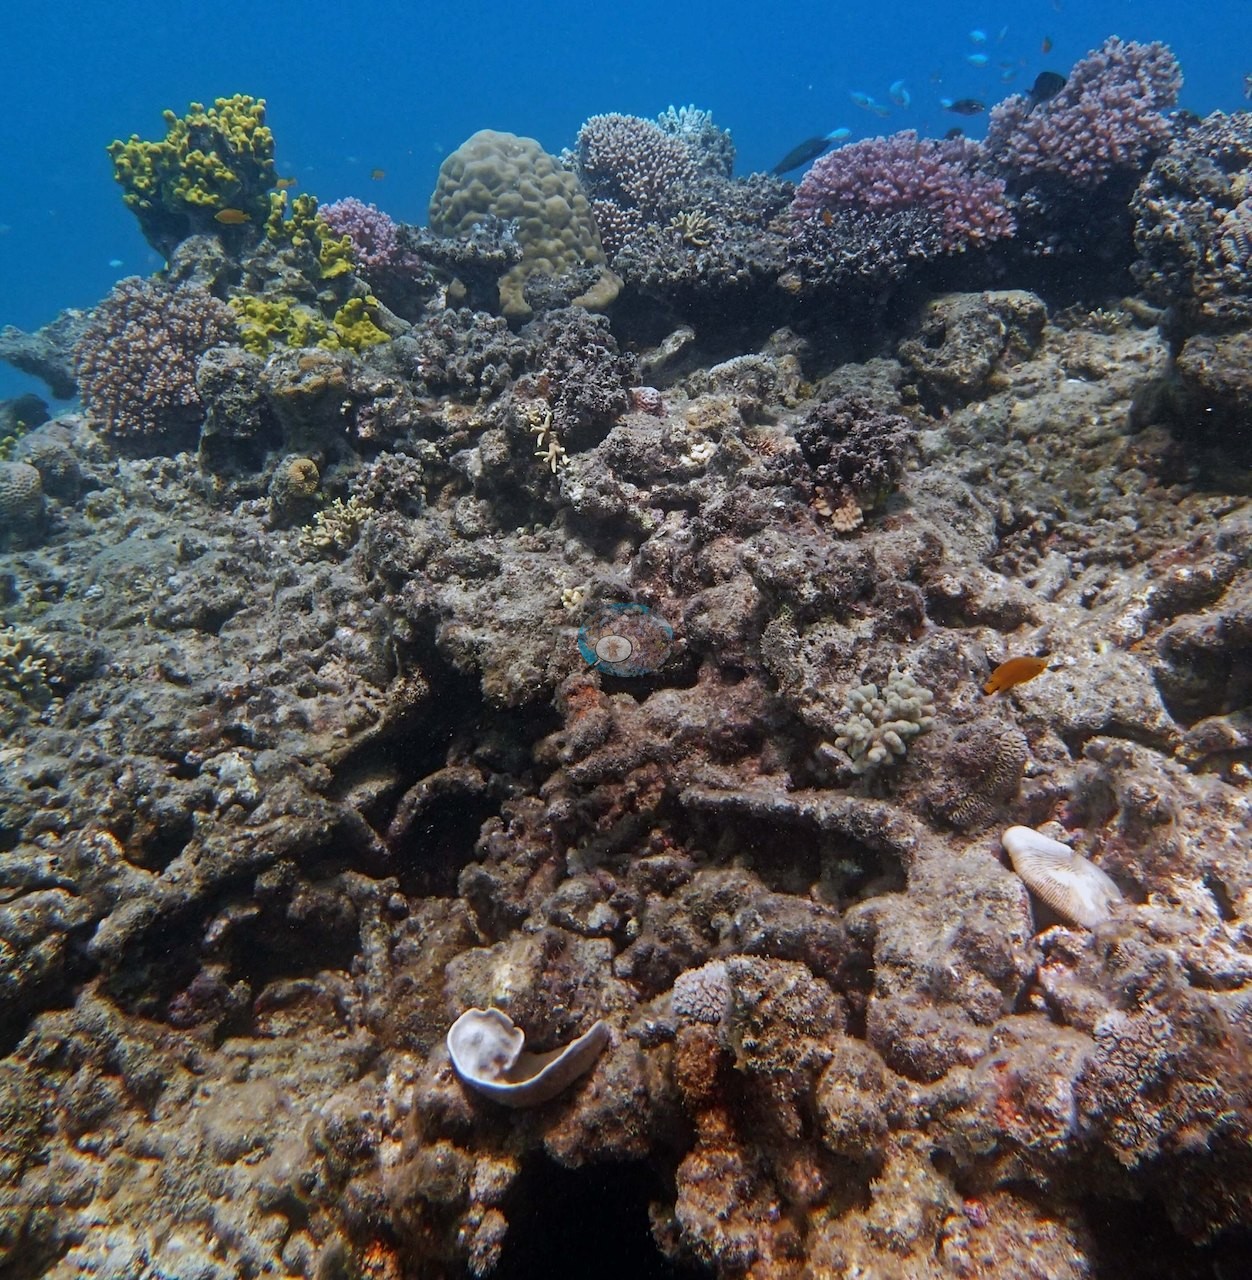
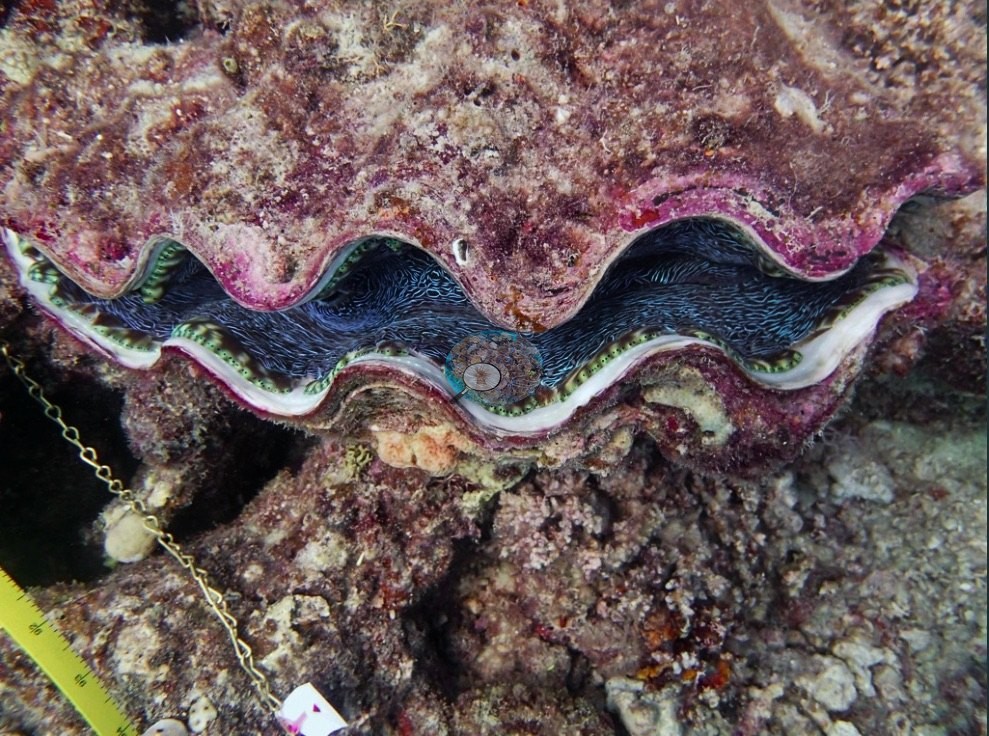
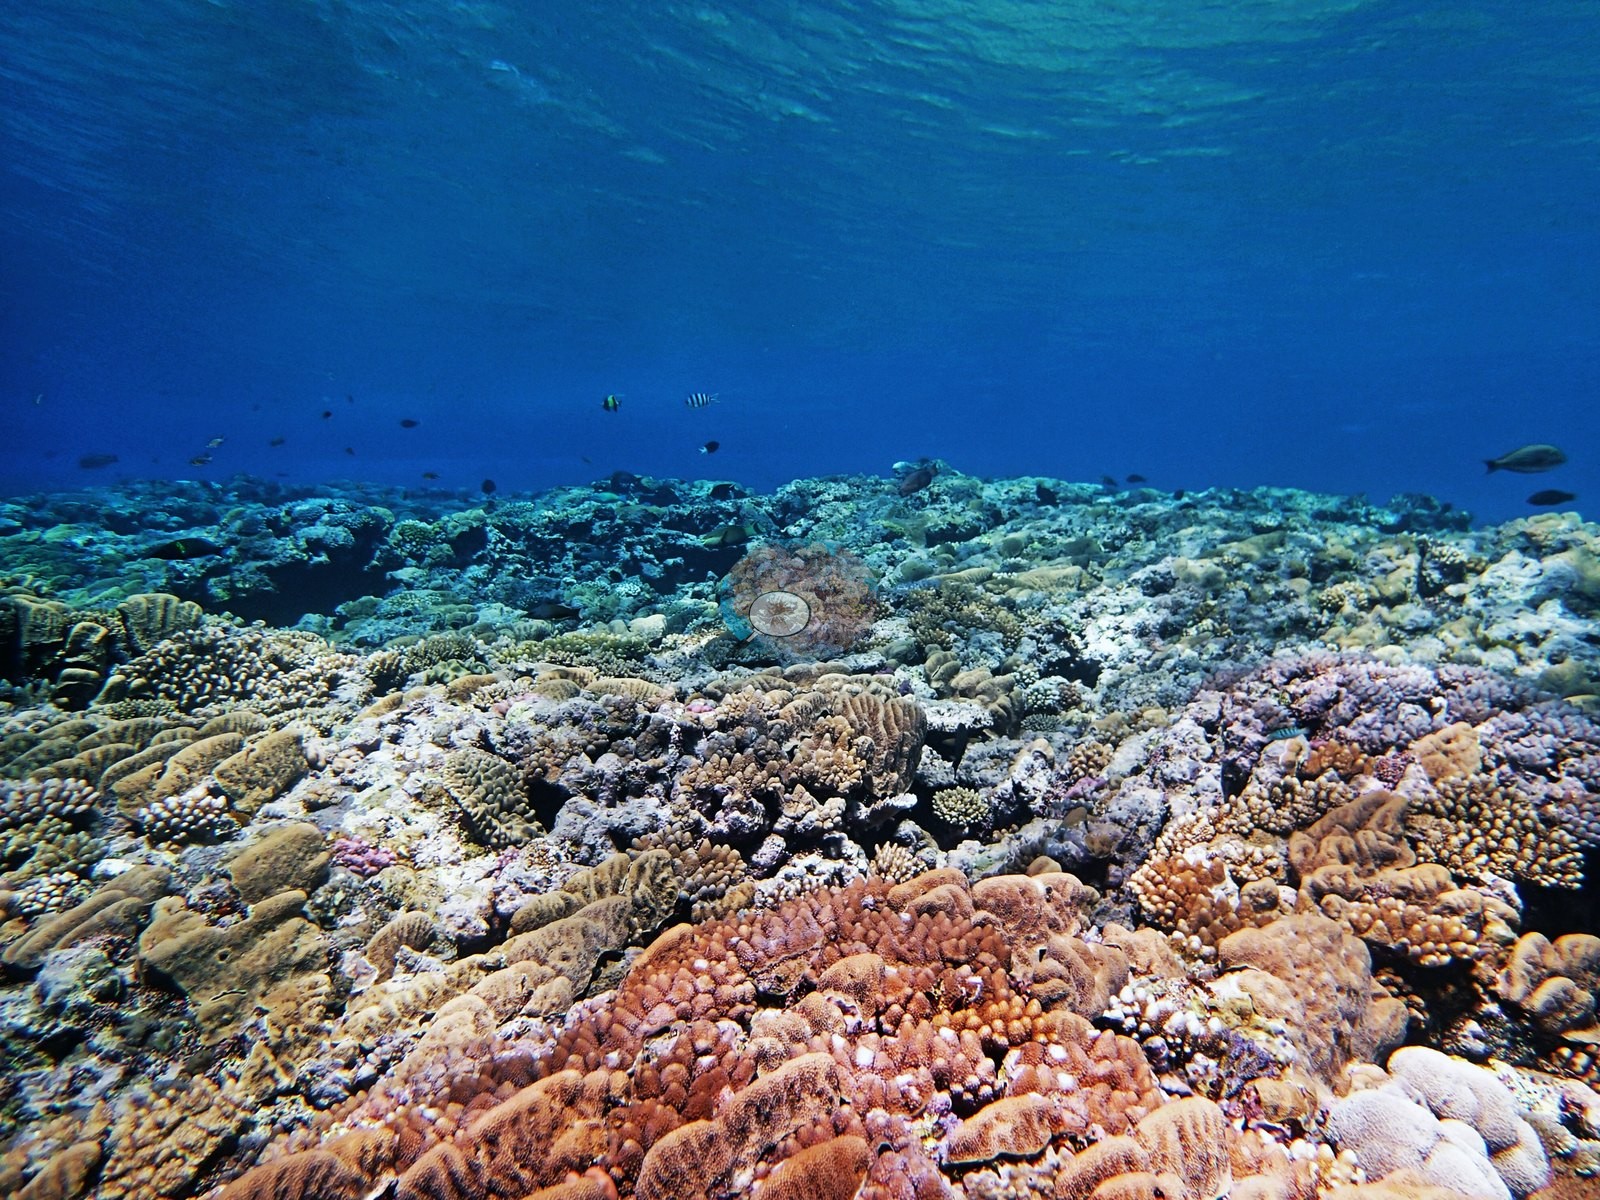
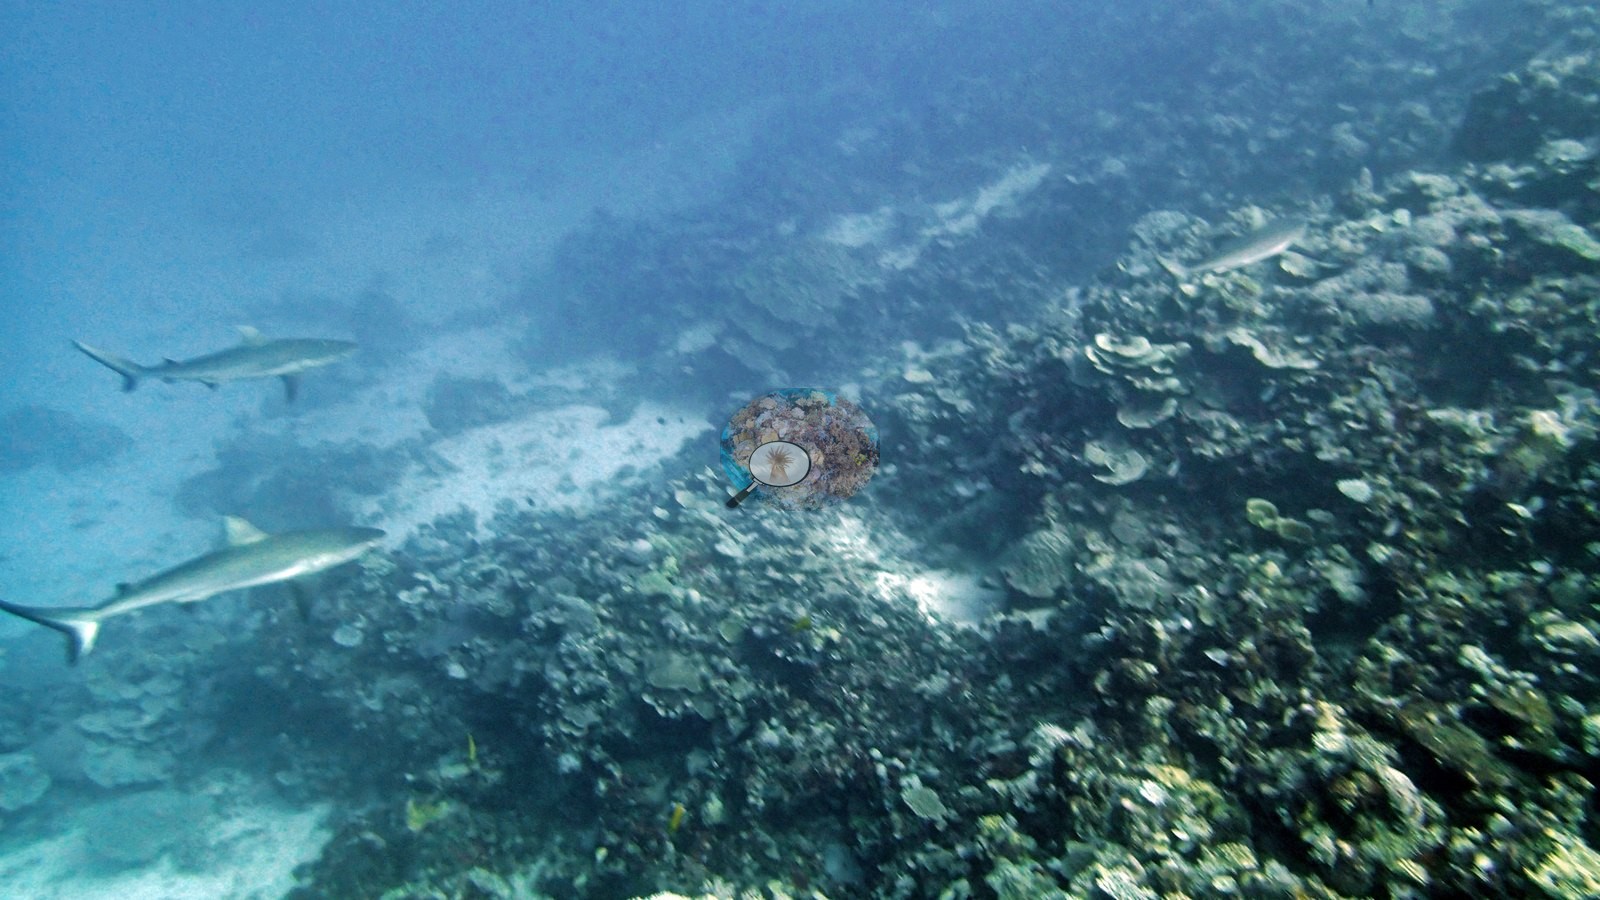
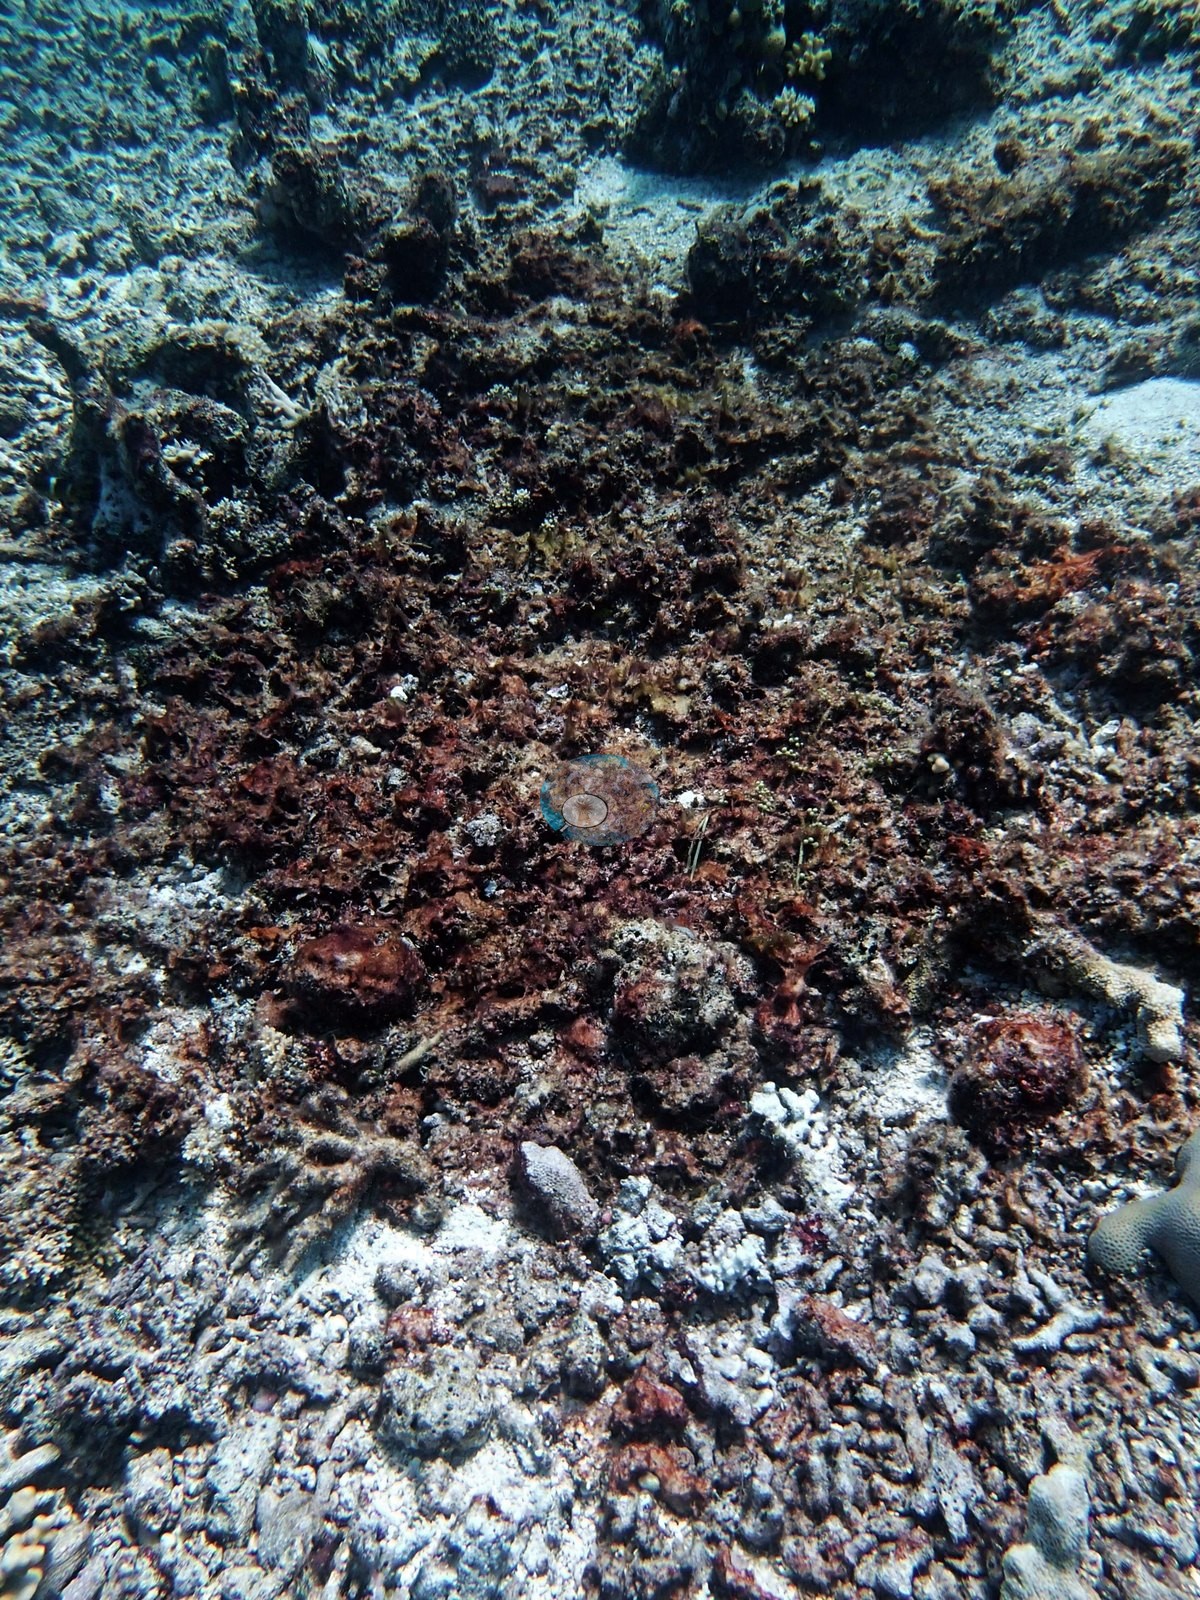
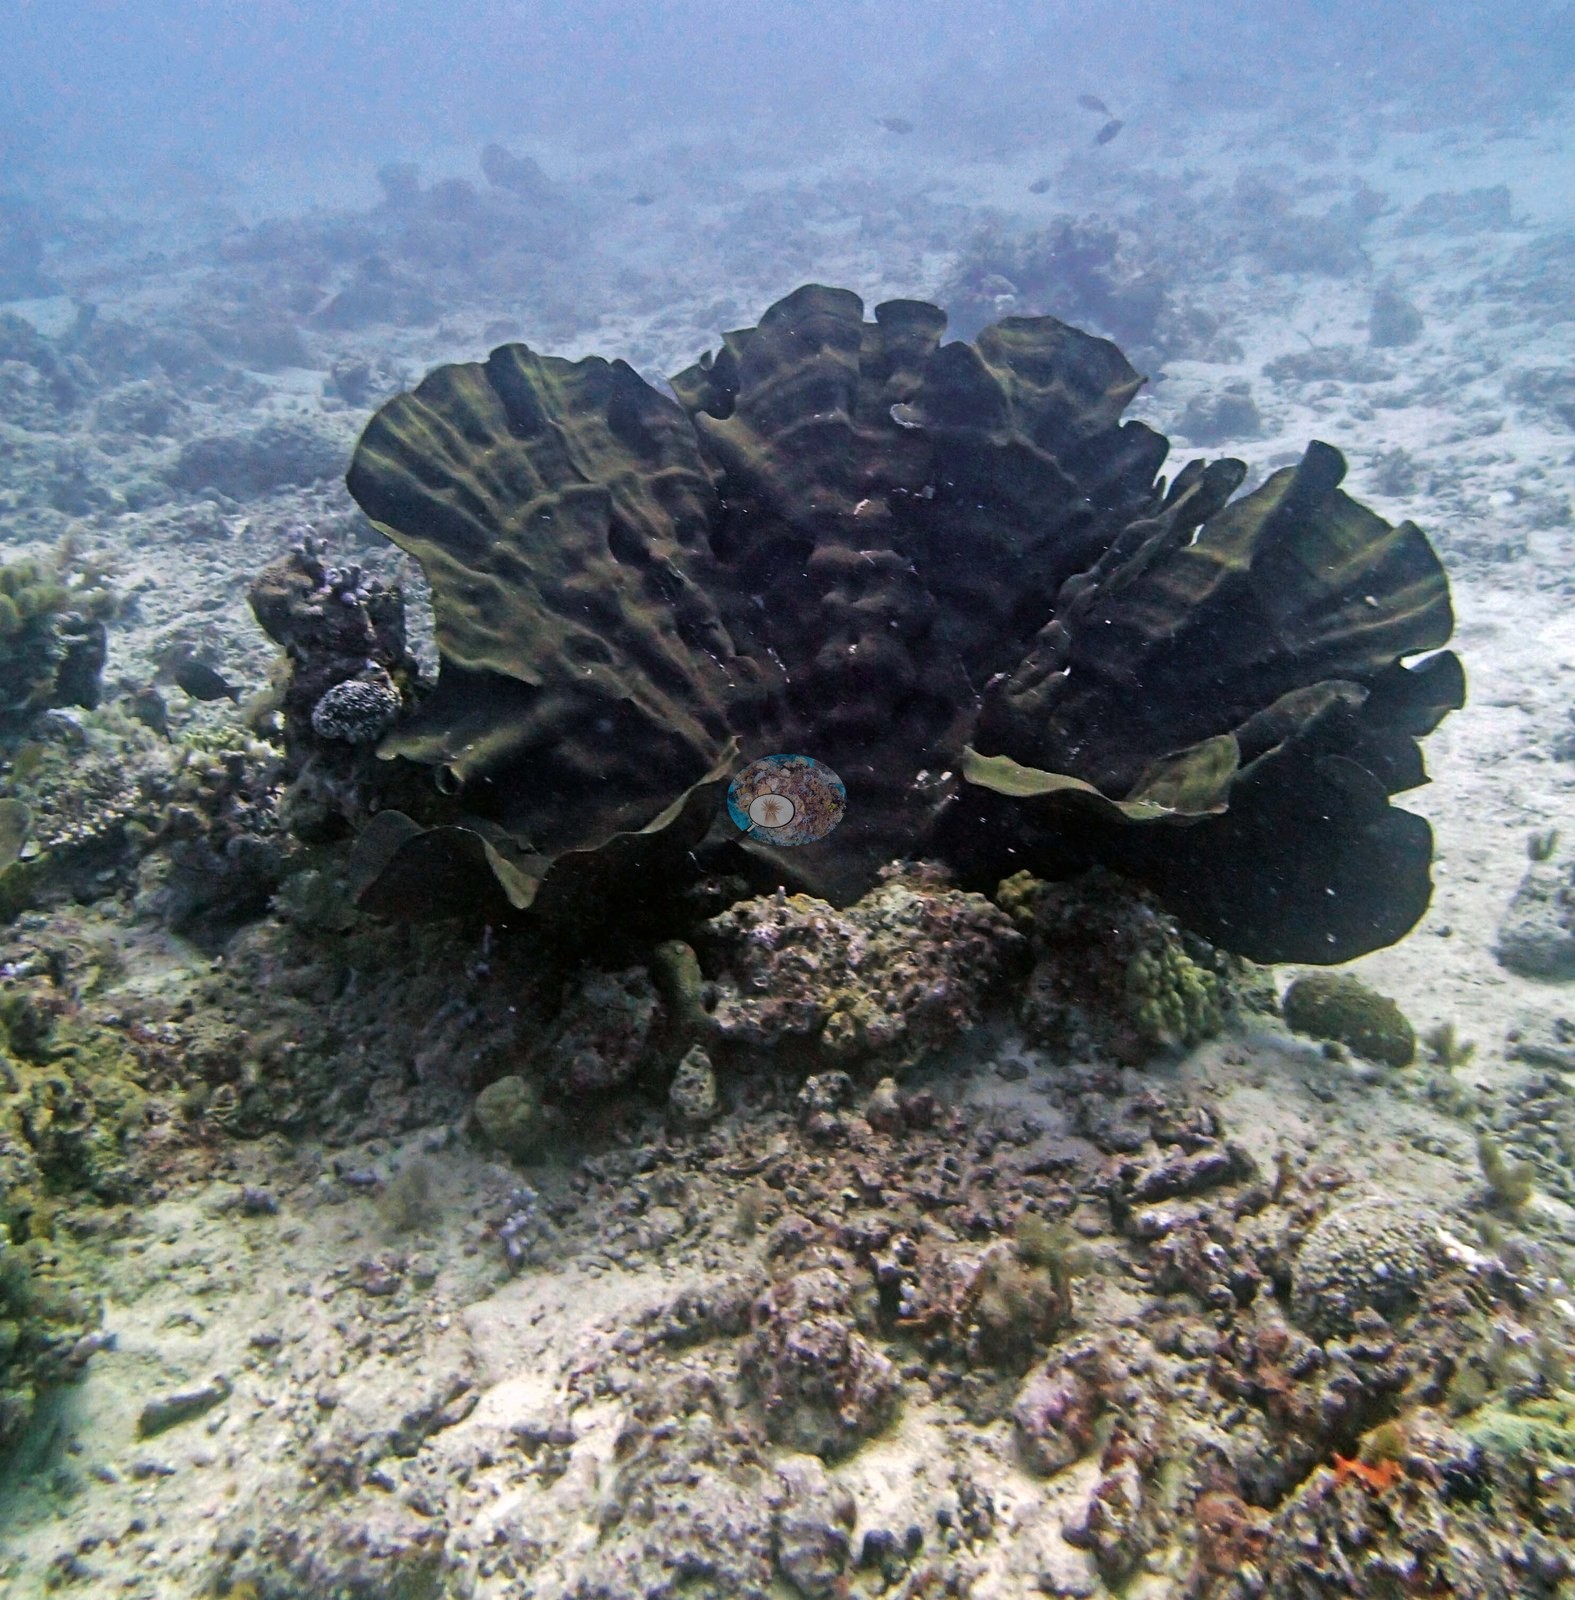
Across the 166 northern stations with an in situ transect value, hard coral cover averaged 39% and algal cover 36%. Forty-four stations reached 50% or more and four reached 70% or more; six were below 10%. The three zones were close to each other in the mean, at 38% on the Blue Habitat Protection Zone reefs (n = 54), 39% on the Green no-take reefs (n = 54), and 40% on the Pink Preservation Zone reefs (n = 58), so protection status did not separate them. The spread within each zone was what mattered: every zone held stations below 10% and stations at 60% or more. Station depths ran from 4.9 m at AU238142 (the other expedition team's survey depth) to 24.7 m at AUPE127, with about half of the stations (81 of 166) between 5 and 9 m. Structure varied from near-vertical ribbon-reef walls carrying coral to about 30 m, through backreef bommie mazes over 30 m across and Acropora meadows hundreds of meters wide on Siddons Reef, to silty inshore reefs where soft corals, sponges, and sea fans have taken over the old framework.
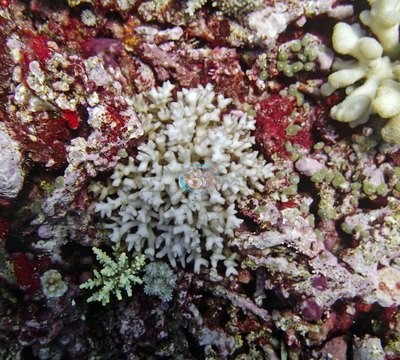
Two condition signals recur across all three northern zones. The first is crown-of-thorns starfish, recorded on Lark, Siddons, Pearson, Milman, Parkinson, and Williamson Reefs, on Unnamed Reef 74, as feeding damage on Unnamed Reef 122, and on the 11°S lagoon reefs. Anderson counted at least 22 starfish on one Williamson Reef dive (AUWL27), where he believed they drove the loss, and estimated about 30 in an active outbreak at AU4335. At other stations he read the damage differently: on Lark Reef, where 90% or more of the staghorn was dead, he judged the die-off to predate the starfish. The second signal is needle coral. Pale, sickly, bleached, or dying Seriatopora was logged on most reefs in all three zones, reaching about 95% of colonies bleached at the Wood Reef station AUWO103 and near-uniform bleaching at 20-25 m on Ribbon Reef 7. On Ribbon Reef 6 (AUR611), some mostly bleached Pocillopora were covered in mucus that Anderson noted looked exogenous rather than produced by the corals ("Very strange").
The timing is what gives this set its value. All 166 northern stations were surveyed about eighteen months before the 2016 mass bleaching, which Souter et al. (2021) report killed roughly 30% of shallow-reef coral in the northern third of the GBR, with effects detected to 40 m. A second event in 2017 centered on the central third, so between them the two events touched the reef's northern two-thirds. Across the whole GBR, average hard coral cover fell from about 34% in the late 1990s to 24% in 2018 and 24% in 2019, while algal cover almost doubled between 1996 and 2019. The central and southern sites have no such data directly, but the surveys around them show large swings rather than a steady slide: within 2 km of Butterfly Bay, six Reef Check surveys from 2018 to 2023 ranged from 13% to 32% hard coral, and within 2 km of Heron Island, 144 Reef Check surveys from 1997 to 2023 ranged from 0.0% to 82%. Severe Tropical Cyclone Debbie crossed the Whitsundays in March 2017, so every Whitsunday survey since then describes reefs after that storm.
Highlights
- Cover of 79% against 7.8% algae on Unnamed Reef 74 (AU74147, Marine National Park Zone).
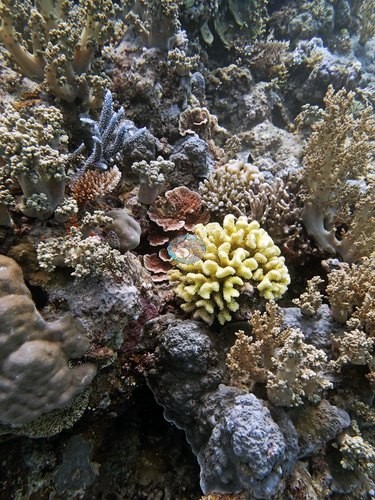
- 75% at AU61A63 on the Unnamed Reef 61A backreef, with a very large Pavona colony in Anderson's notes; nearby AU61A61 is a maze of bommies, some over 30 m across, with at least 20 hard coral species on two transects (Preservation Zone).
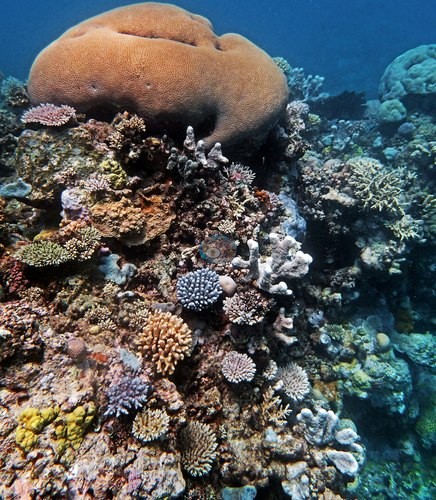
- The second Wood Reef dive, at 61% cover against 9.3% algae on a slope of layered table corals (AUWO105); at the neighboring Wood Reef station AUWO103, about 95% of the needle coral was badly bleached (his field estimate).
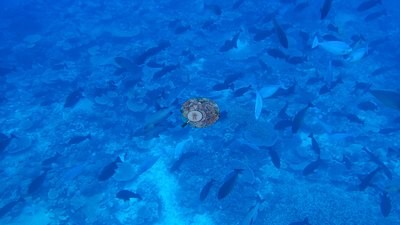
- At least 22 crown-of-thorns starfish on one Williamson Reef dive, with freshly killed white skeleton (AUWL27); the Global Reef Expedition (GRE) team's neighboring AUWL28 station recorded 3.4% cover.
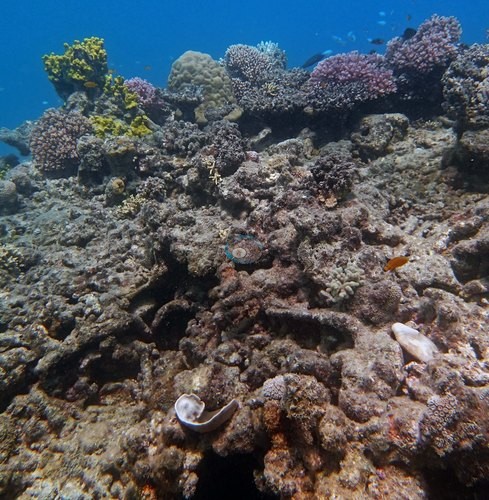
- Lark Reef, where 90% or more of the staghorn framework was dead and the expedition's first crown-of-thorns starfish were found, though Anderson judged the die-off to predate them (AULK19).
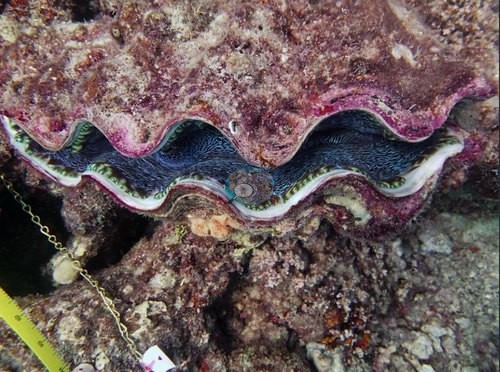
- Pale, sickly, or bleached needle coral (Seriatopora) recorded in all three far-northern zones, on Wood, Ribbon 6, Ribbon 7, Yule Detached, Pearson, Hilder, Monkman, Siddons, Carter, and Jewell Reefs among others.
- An intermediate-exposure pinnacle on Ribbon Reef 6 that Anderson called "beautiful" and "interesting" on the survey's second day (AUR611), and a Pearson Reef slope his notes describe as highly rugose (AUPE123).
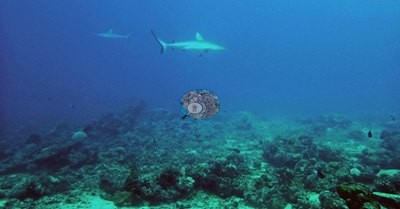
- The central and southern sites have no transect data of their own: within 2 km of Butterfly Bay alone, six Reef Check surveys from 2018 to 2023 ranged from 13% to 32% hard coral.
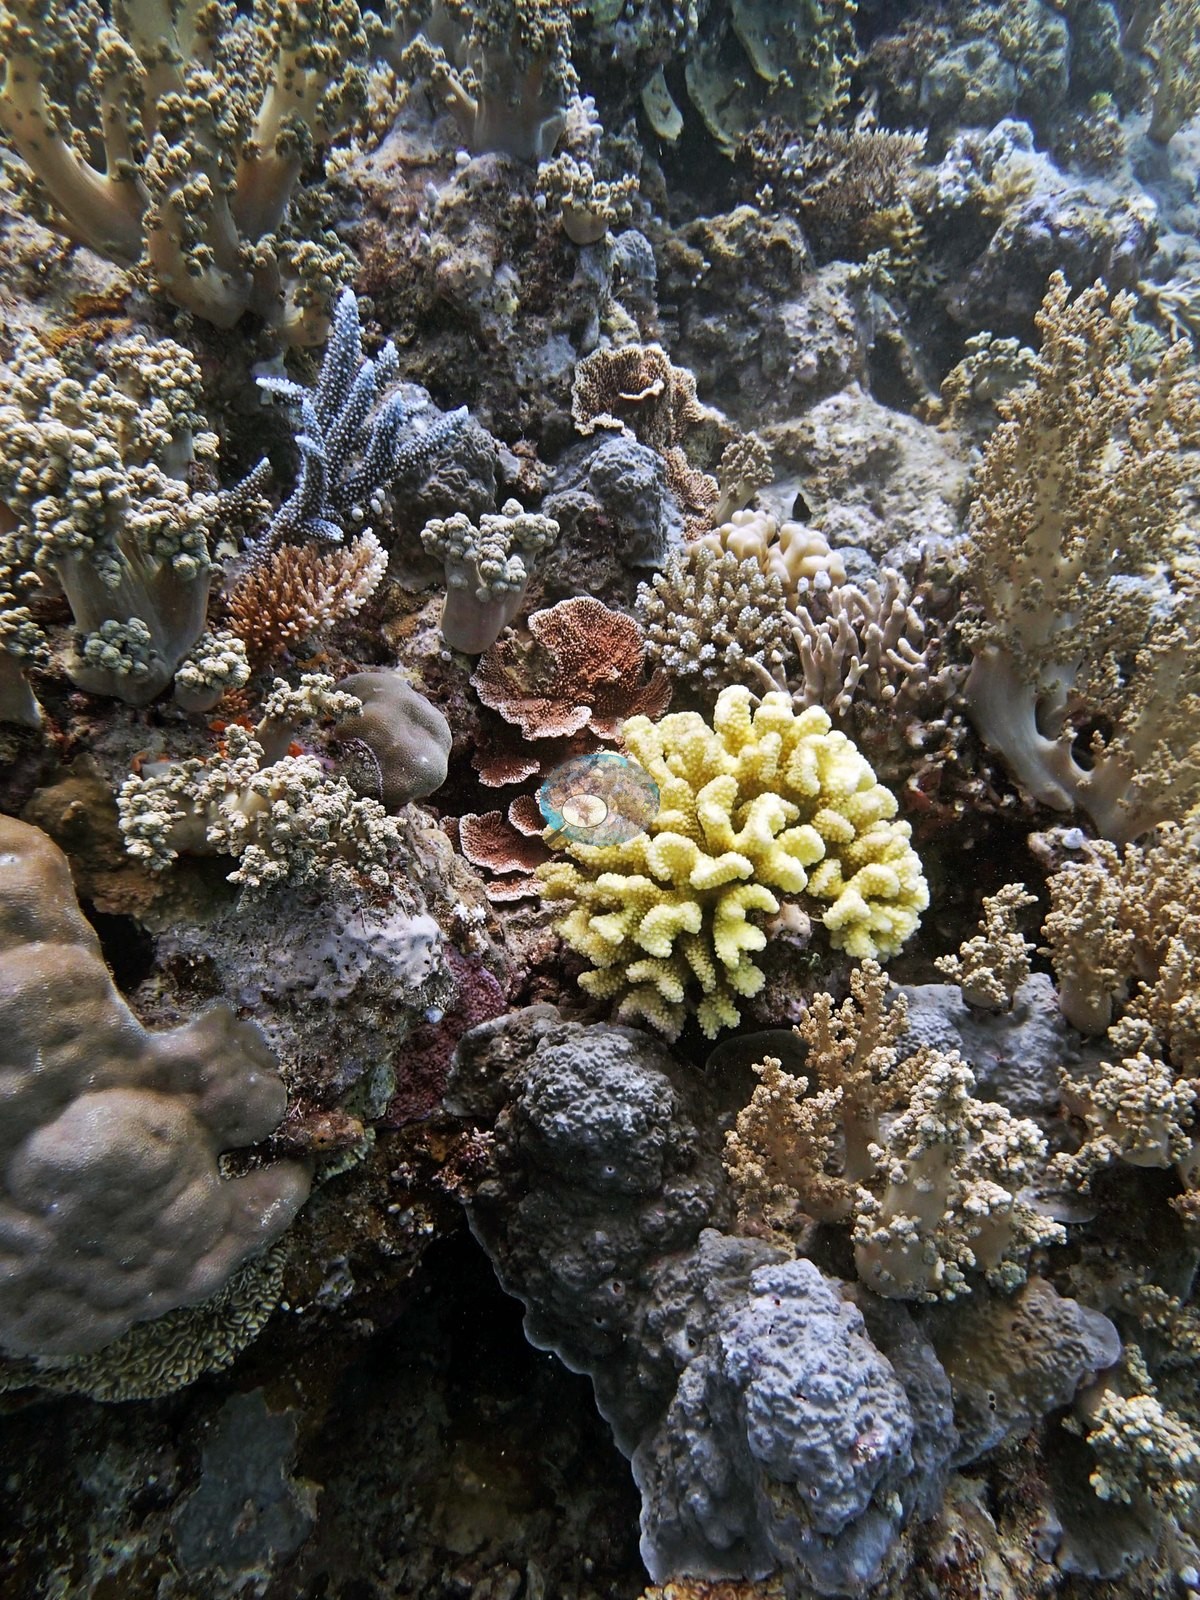
Notable observations (14)
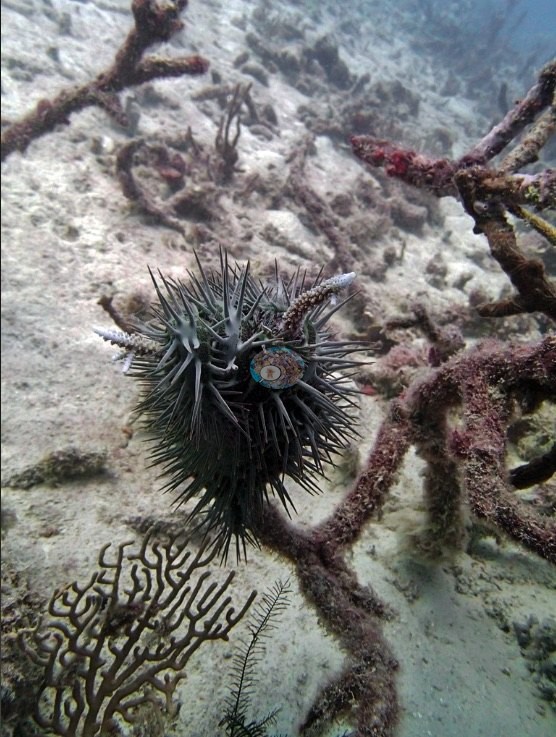
- N. GBR - Pink (AUWL27): Crown-of-thorns: at least 22 starfish counted on one dive, with freshly killed white skeleton; Anderson believed the starfish drove the heavy mortality.
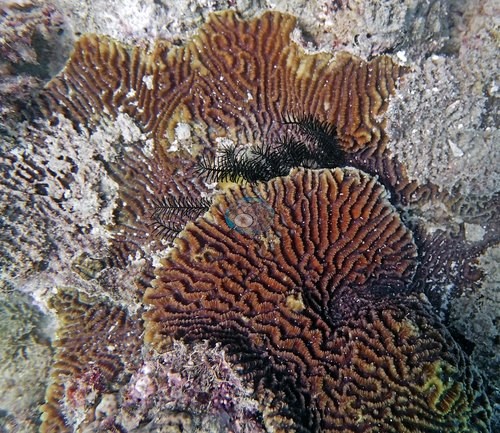
- N. GBR - Blue (AU4335): Crown-of-thorns: an active outbreak of an estimated 30 starfish; one had devoured an entire Leptoseris 'garden', others were grazing Millepora fire coral.
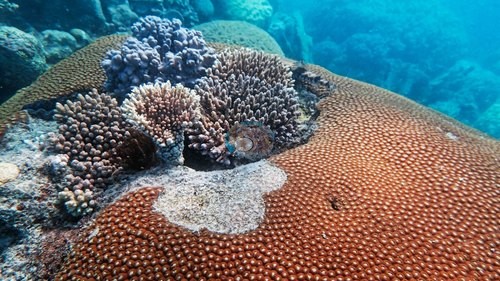
- N. GBR - Green (AULK19): Crown-of-thorns and old mortality: staghorn thickets 90% dead or worse and five crown-of-thorns starfish, mostly feeding; Anderson concluded the die-off predated the starfish.
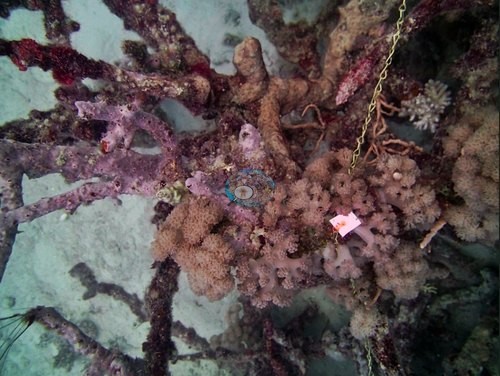
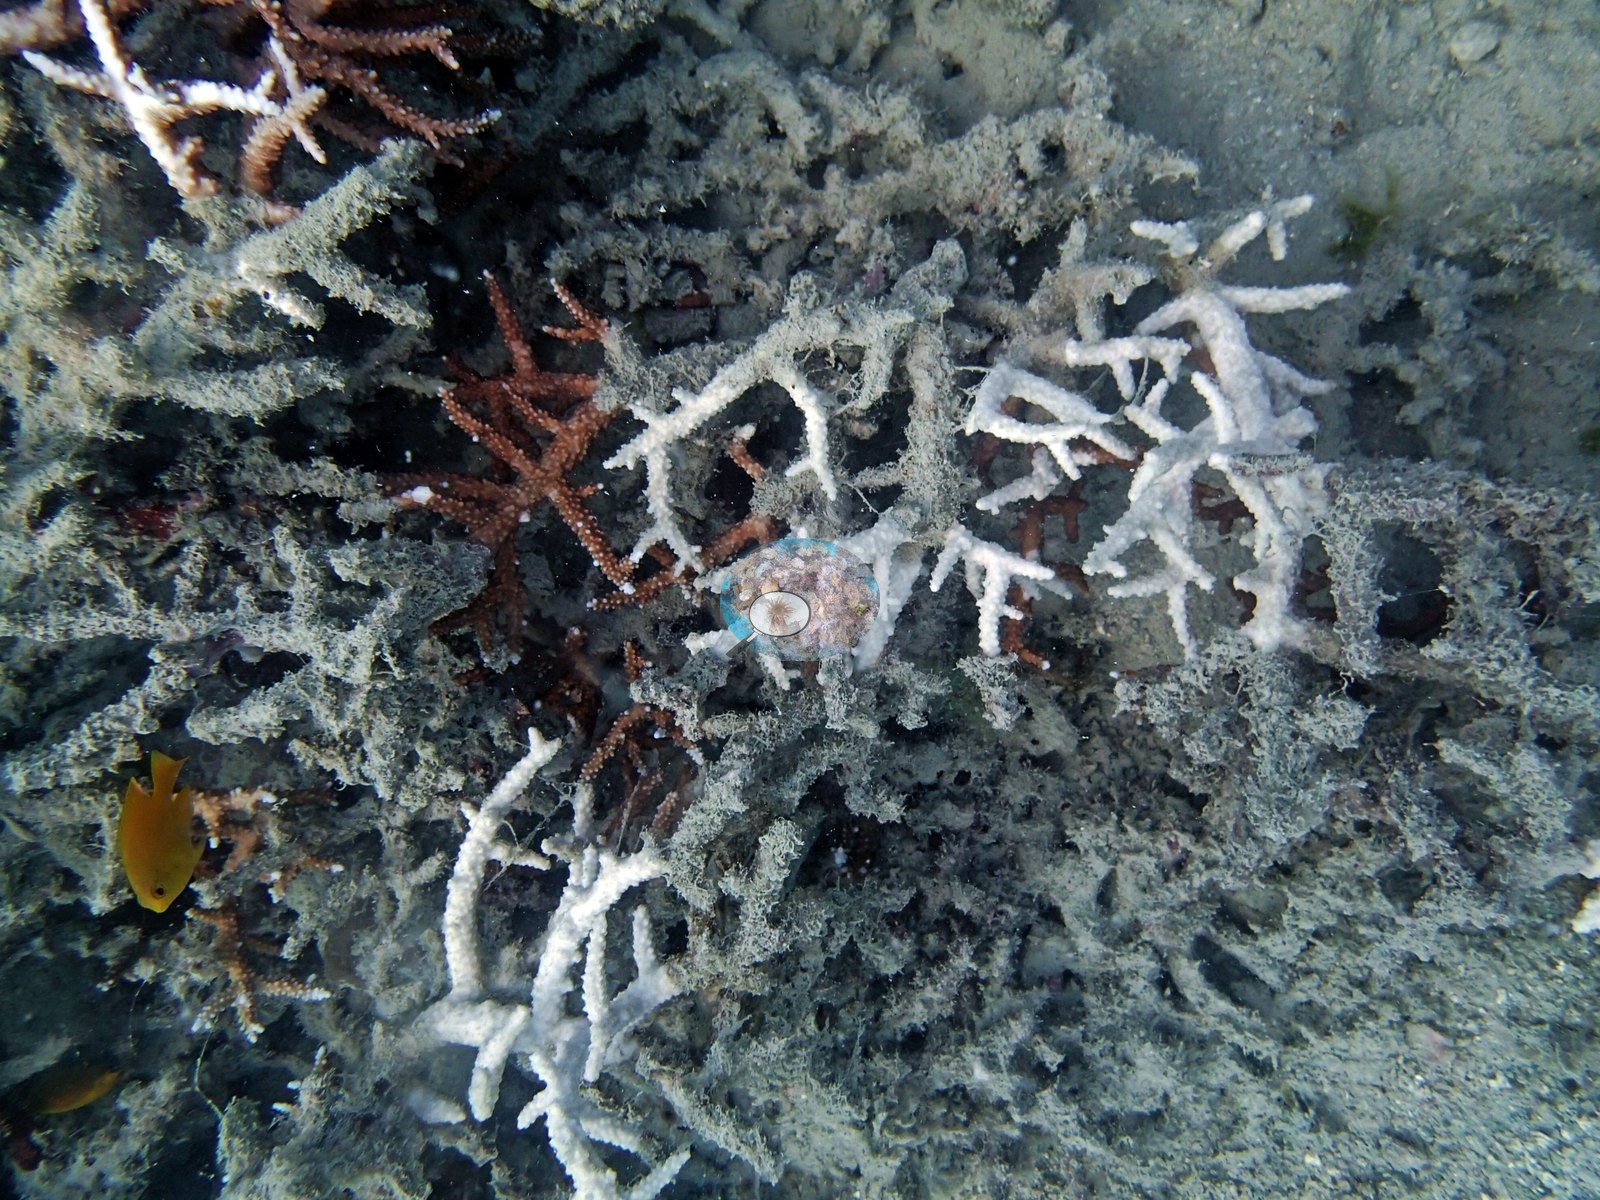
- N. GBR - Pink (AUWL25): Old mortality: 90-95% of the staghorn framework dead and smothered in cyanobacteria; two crown-of-thorns starfish present; his notes do not assign a cause.
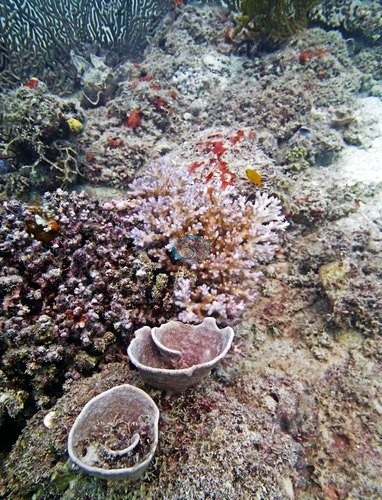
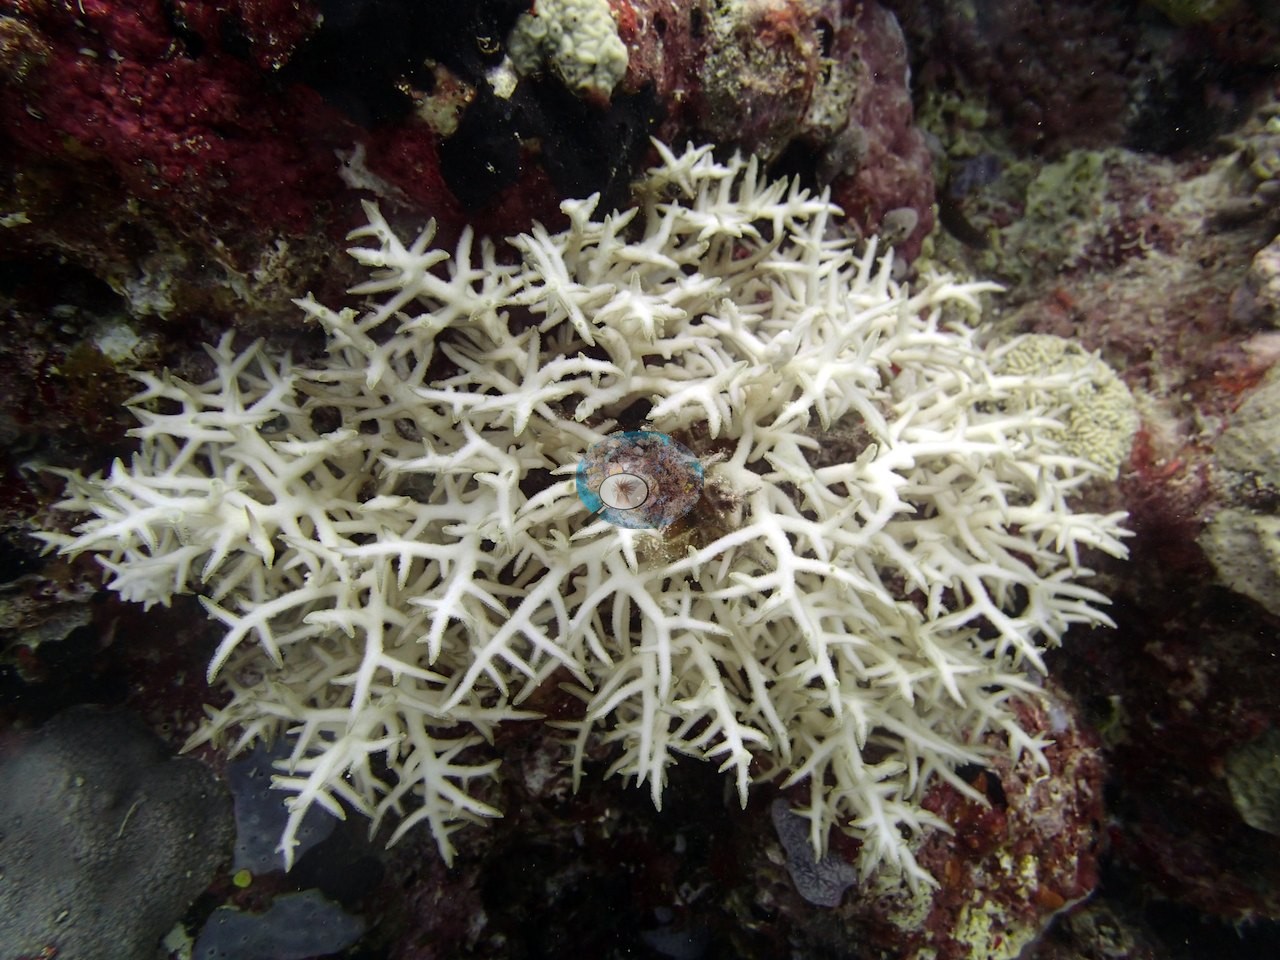
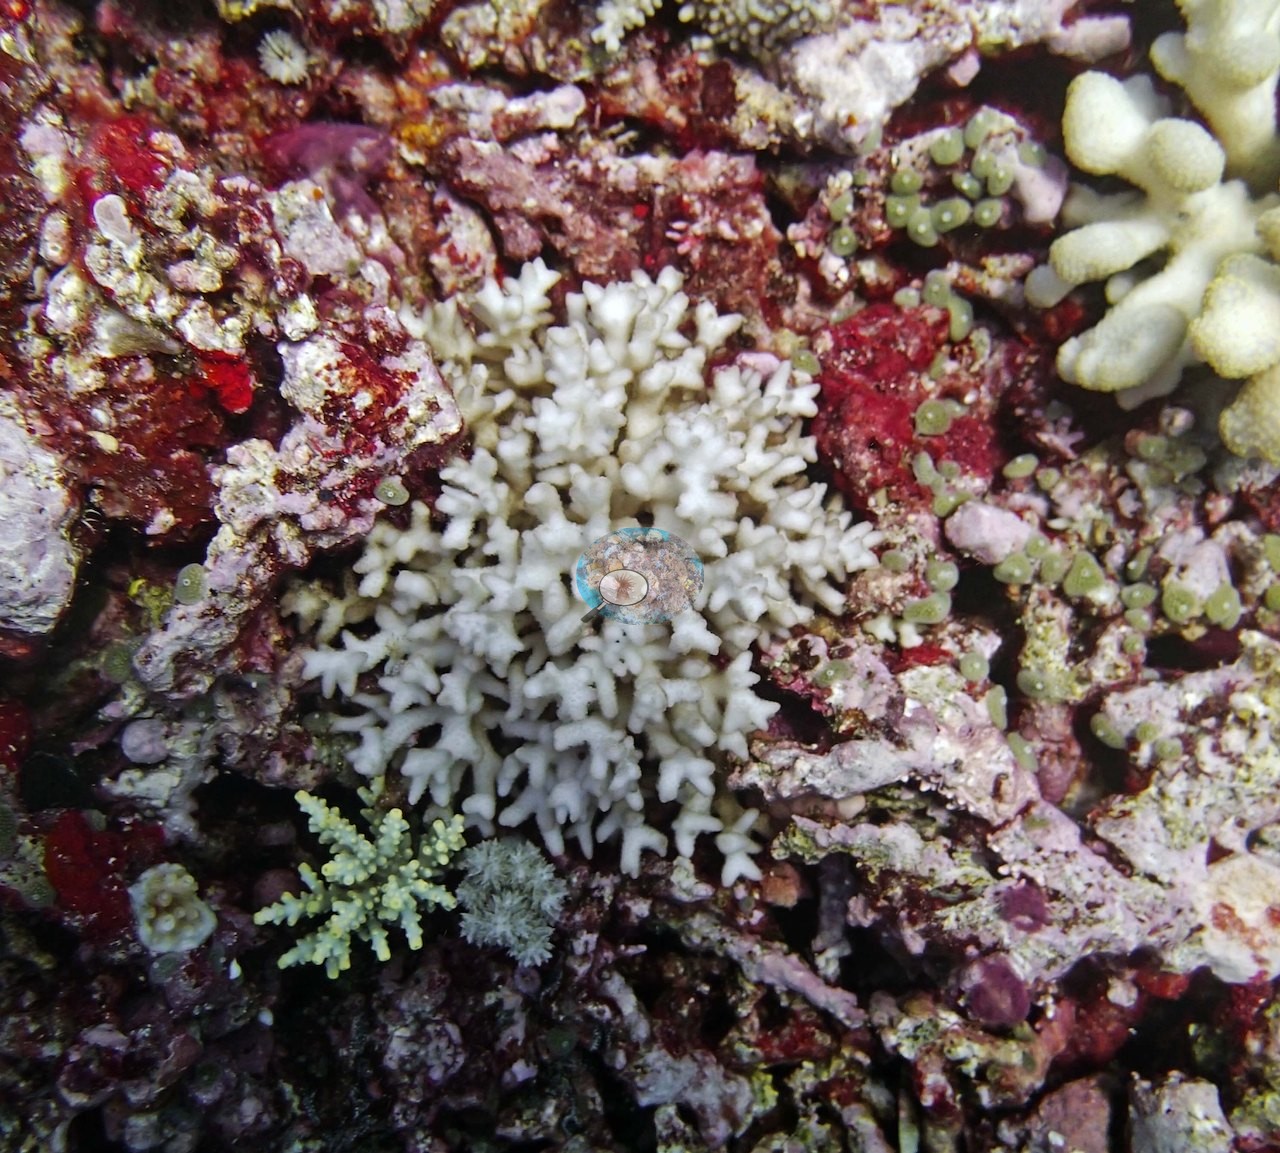
- N. GBR - Green (AUWO103): Bleaching: about 95% of the Seriatopora badly bleached (Anderson's field estimate), though most colonies were still alive; white fine-branched colonies sit beside pigmented neighbors in his photographs.
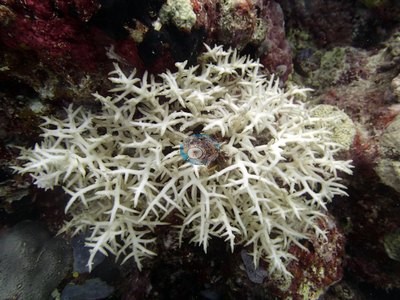
- N. GBR - Green (AUR702): Bleaching: nearly every Seriatopora at 20-25 m on the Ribbon Reef 7 windward face paled or bleached, many already dead.
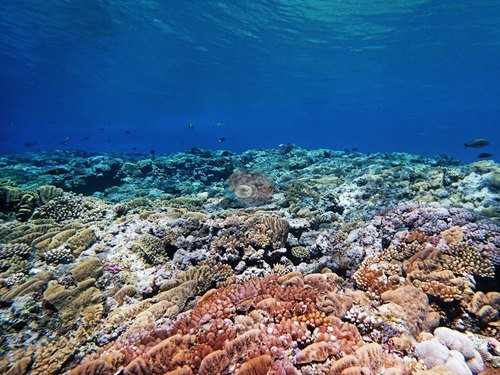
- N. GBR - Pink (AUYD107): Bleaching: every Seriatopora hystrix and S. caliendrum colony at 15.5 m on Yule Detached Reef bleached, sick, or dying.
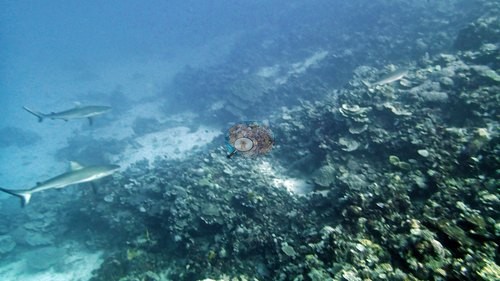
- N. GBR - Blue (AU238141): Bleaching and mortality: Seriatopora hystrix 'looks terrible virtually everywhere'; dead colonies at 15 m alongside dead Acropora; two bleached branching colonies photographed side by side.
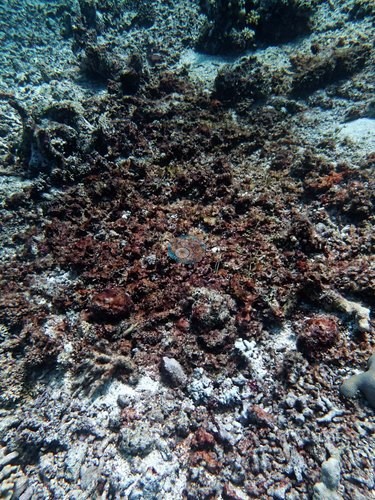
- N. GBR - Pink (AUR611): Bleaching: some Pocillopora mostly bleached and covered in mucus that looked exogenous in origin (his note: "Very strange"), on the Ribbon Reef 6 pinnacle (AUR611).
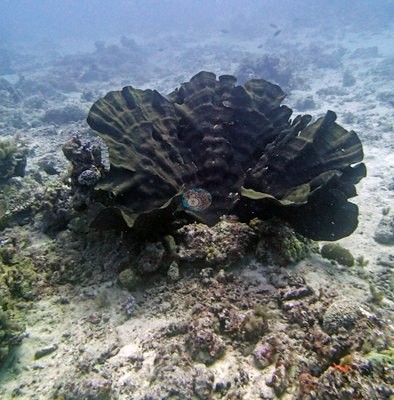
- N. GBR - Blue (AU2591): Old dead staghorn and a smothered brain coral on the deeper transects of the 11°S lagoon reefs.
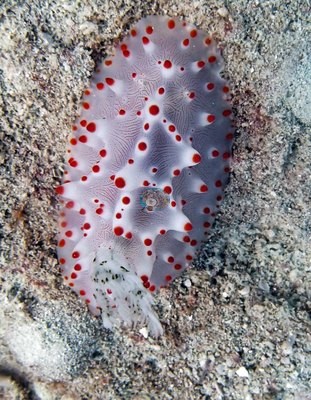
- N. GBR - Pink (AUHI159): Storm damage: apparent recent storm damage on Hilder Reef, live cover down to about 1% in a rubble field at 10 m.
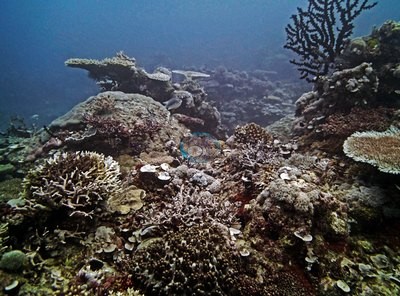
- N. GBR - Pink (AUMM89): Sediment: branching framework caked in silt on Milman Reef, some freshly dead and white; one crown-of-thorns starfish logged.
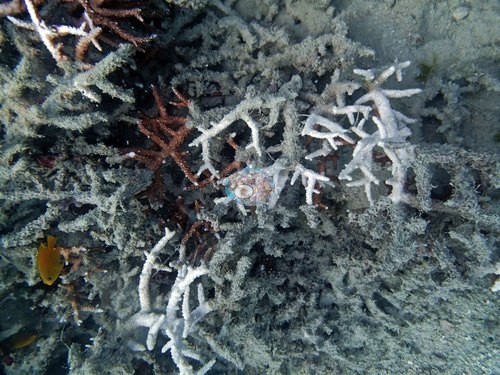
- N. GBR - Green (AULK29): Lark Reef: 90% or more of the staghorn dead; two crown-of-thorns starfish, too few in Anderson's reading to explain the damage.
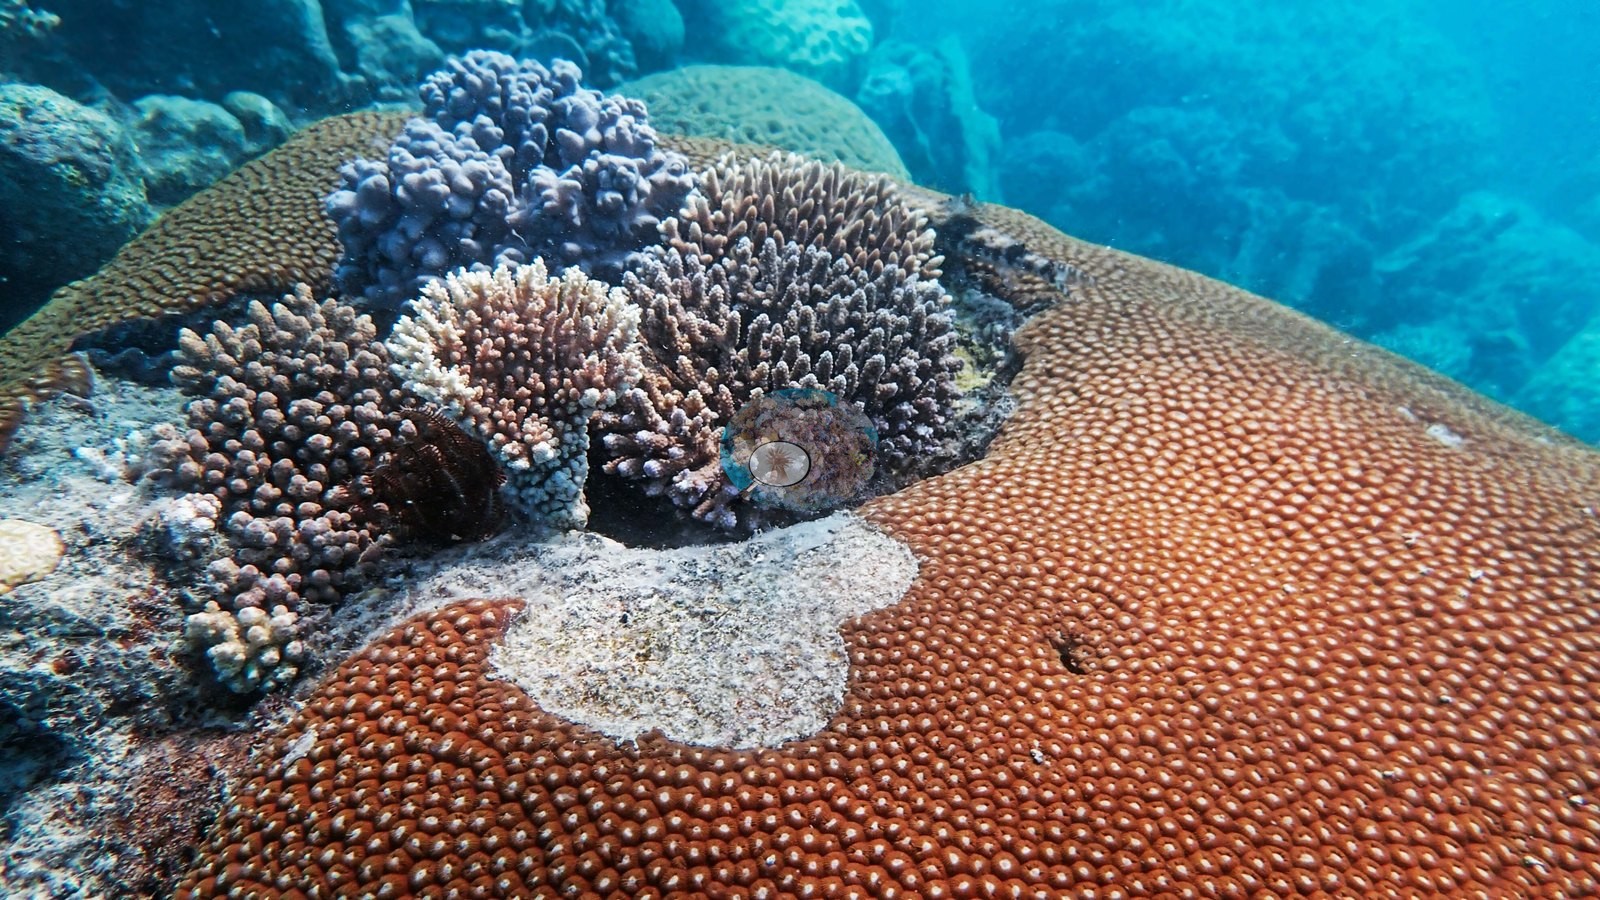
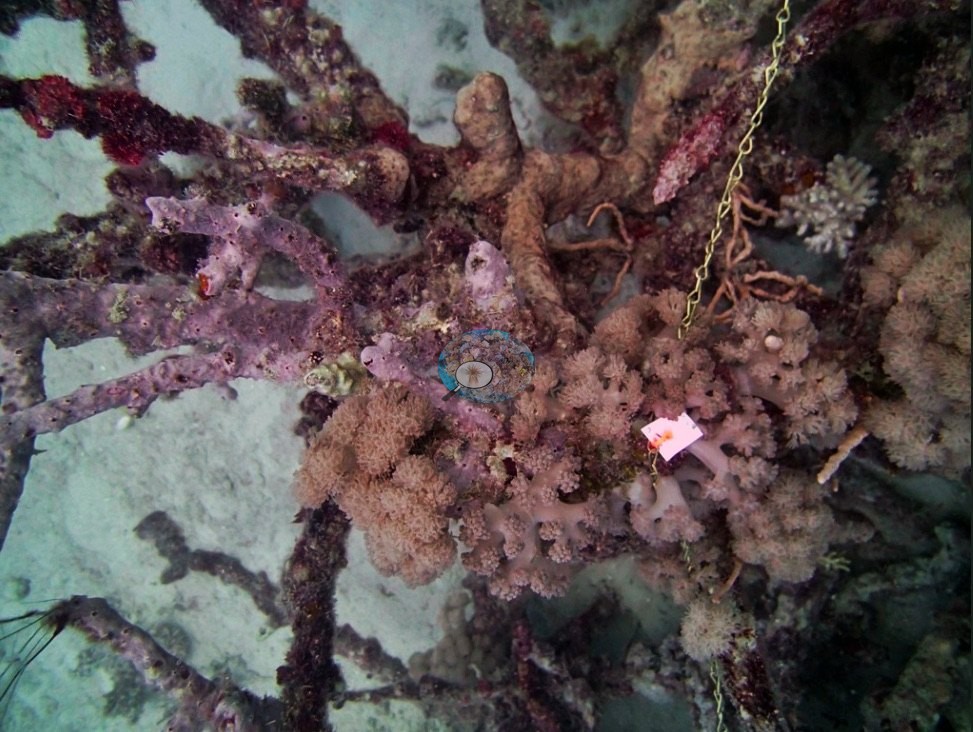
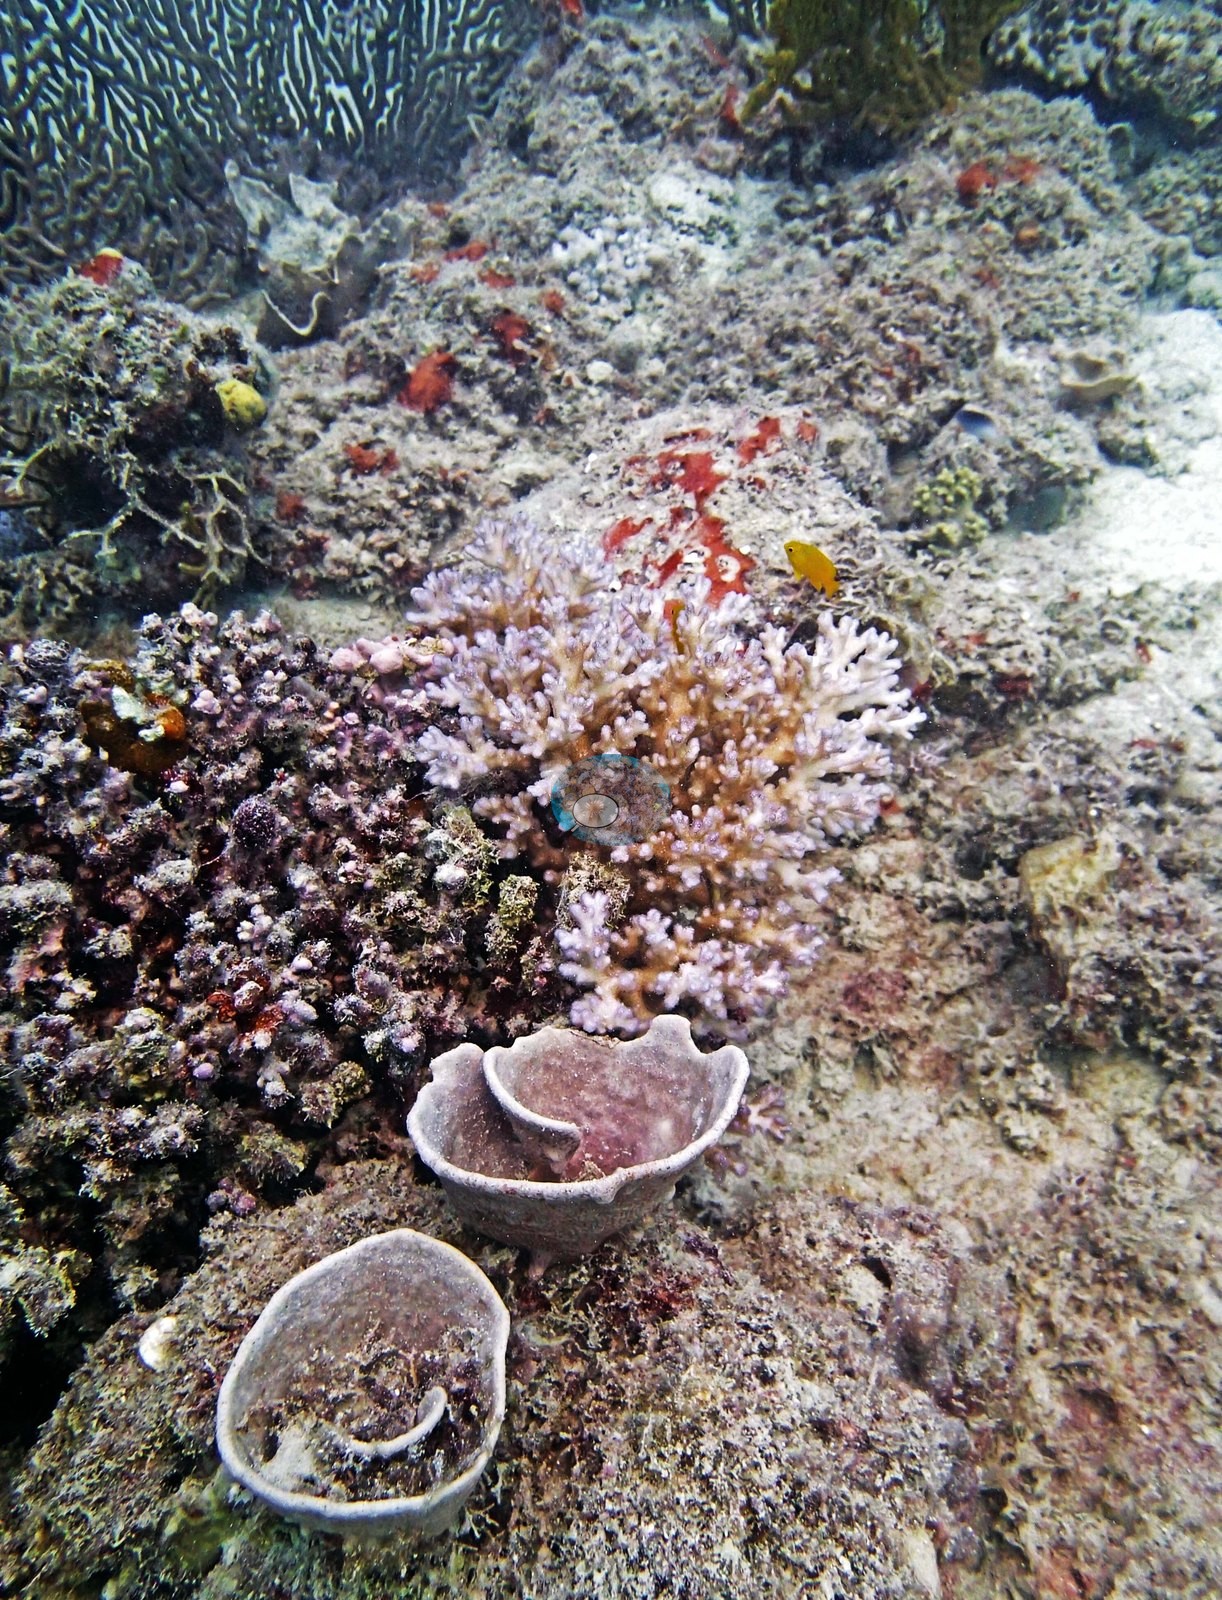
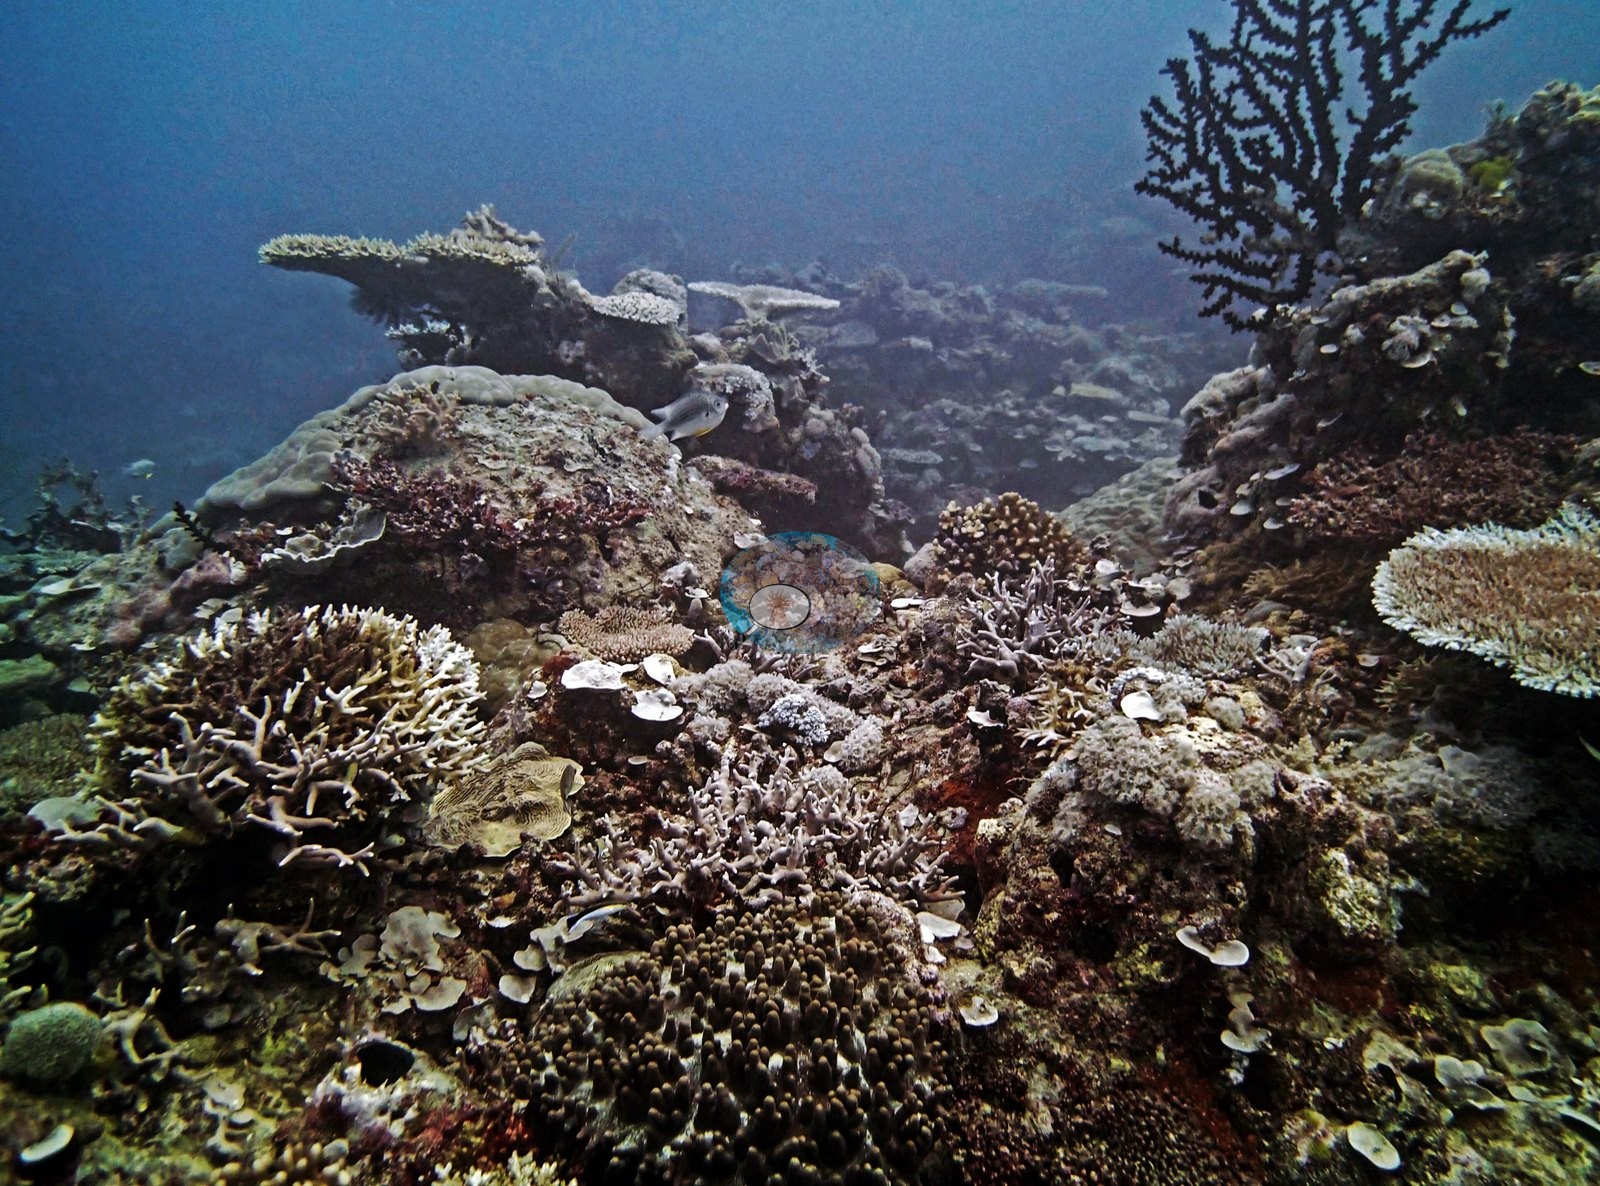
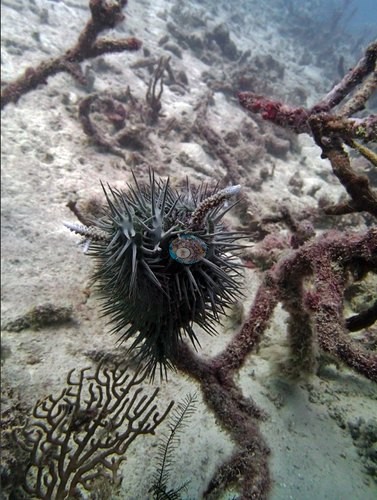 photo: N. GBR - Green (AULK19)
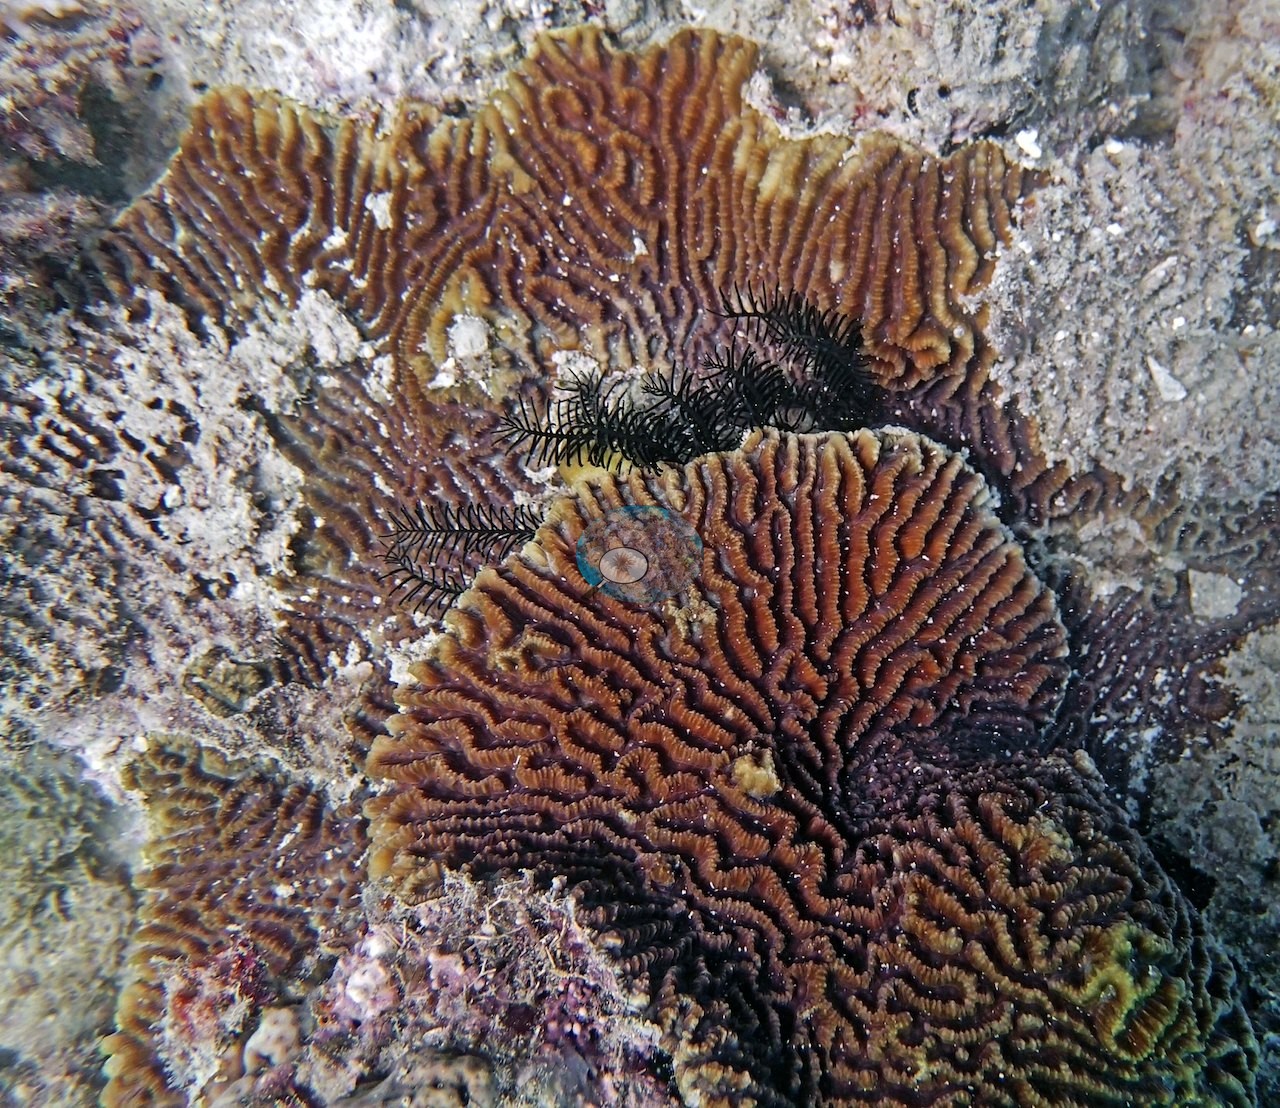
- N. GBR - Pink (AUR607): Bleaching: his field notes record nearly all of the Seriatopora bleached on the Ribbon Reef 6 windward slope; six frames show stark-white needle coral and Pocillopora colonies beside pigmented neighbors.
Coral cover over time (pooled)
 the year includes his Global Reef Expedition dives with the Khaled bin Sultan Living Oceans Foundation (CRD+LOF data).
Sites in this region (177)
- Australia GBR - Whitsundays
- Great Barrier Reef - Heron Island (southern) — 12% (newest survey within 0.5 km, not this site: Reef Check, Heron Reef - White Wedding (Reef flat) Site 1 station, 2023-10-01, 0.24 km away; a best-patch value above 70% is not shown)
- Great Barrier Reef - Lady Elliot Island (southern) — 63% (newest survey within 0.5 km, not this site: Reef Check, Lady Elliot Island - Sandy Seconds (Fringing reef seaward) Site 1 station, 2021-11-14, 0.38 km away; a best-patch value above 70% is not shown)
- Great Barrier Reef - Townsville / Davies Reef — 49% (nearest station surveyed in the last 10 years, not this site: AIMS manta tow, DAVIES REEF station, 2023, 1.52 km away)
- N. GBR - Blue (AU116153) — 57% coral cover
- N. GBR - Blue (AU116154) — 53% coral cover
- N. GBR - Blue (AU116155) — 63% coral cover
- N. GBR - Blue (AU116156) — 37% coral cover
- N. GBR - Blue (AU116157) — 70% coral cover
- N. GBR - Blue (AU116158) — 41% coral cover
- N. GBR - Blue (AU122135) — 18% coral cover
- N. GBR - Blue (AU122136) — 50% coral cover
- N. GBR - Blue (AU122137) — 46% coral cover
- N. GBR - Blue (AU122138) — 57% coral cover
- N. GBR - Blue (AU238141) — 55% coral cover
- N. GBR - Blue (AU238142) — 48% coral cover
- N. GBR - Blue (AU238144) — 52% coral cover
- N. GBR - Blue (AU2577) — 32% coral cover
- N. GBR - Blue (AU2578) — 42% coral cover
- N. GBR - Blue (AU2591) — 42% coral cover
- N. GBR - Blue (AU2592) — 29% coral cover
- N. GBR - Blue (AU2593) — 23% coral cover
- N. GBR - Blue (AU2594) — 39% coral cover
- N. GBR - Blue (AU3973) — 49% coral cover
- N. GBR - Blue (AU3974) — 59% coral cover
- N. GBR - Blue (AU3975) — 46% coral cover
- N. GBR - Blue (AU3976) — 50% coral cover
- N. GBR - Blue (AU3995) — 41% coral cover
- N. GBR - Blue (AU3996) — 47% coral cover
- N. GBR - Blue (AU4331) — 20% coral cover
- N. GBR - Blue (AU4332) — 10% coral cover
- N. GBR - Blue (AU4333) — 9.8% coral cover
- N. GBR - Blue (AU4334) — 20% coral cover
- N. GBR - Blue (AU4335) — 23% coral cover
- N. GBR - Blue (AU4336) — 10% coral cover
- N. GBR - Blue (AU5R139) — 51% coral cover
- N. GBR - Blue (AU5R140) — 51% coral cover
- N. GBR - Blue (AU5R143) — 59% coral cover
- N. GBR - Blue (AU5R145) — 62% coral cover
- N. GBR - Blue (AU5R146) — 37% coral cover
- N. GBR - Blue (AUHK43) — 37% coral cover
- N. GBR - Blue (AUHK44) — 33% coral cover
- N. GBR - Blue (AUHK45) — 28% coral cover
- N. GBR - Blue (AUHK46) — 31% coral cover
- N. GBR - Blue (AUHK47) — 21% coral cover
- N. GBR - Blue (AUHK48) — 27% coral cover
- N. GBR - Blue (AUJW55) — 20% coral cover
- N. GBR - Blue (AUJW56) — 48% coral cover
- N. GBR - Blue (AUJW57) — 23% coral cover
- N. GBR - Blue (AUJW58) — 16% coral cover
- N. GBR - Blue (AUPK59) — 20% coral cover
- N. GBR - Blue (AUPK60) — 17% coral cover
- N. GBR - Blue (AUR513) — 50% coral cover
- N. GBR - Blue (AUR514) — 48% coral cover
- N. GBR - Blue (AUR515) — 45% coral cover
- N. GBR - Blue (AUR516) — 25% coral cover
- N. GBR - Blue (AUR517) — 37% coral cover
- N. GBR - Blue (AUR518) — 31% coral cover
- N. GBR - Green (AU3479) — 46% coral cover
- N. GBR - Green (AU3480) — 40% coral cover
- N. GBR - Green (AU3481) — 44% coral cover
- N. GBR - Green (AU3482) — 25% coral cover
- N. GBR - Green (AU3483) — 50% coral cover
- N. GBR - Green (AU3484) — 58% coral cover
- N. GBR - Green (AU74147) — 79% coral cover
- N. GBR - Green (AU74148) — 47% coral cover
- N. GBR - Green (AU74149) — 52% coral cover
- N. GBR - Green (AU74150) — 67% coral cover
- N. GBR - Green (AU74151) — 35% coral cover
- N. GBR - Green (AU74152) — 41% coral cover
- N. GBR - Green (AU96117) — 26% coral cover
- N. GBR - Green (AU96118) — 16% coral cover
- N. GBR - Green (AU96119) — 36% coral cover
- N. GBR - Green (AU96120) — 21% coral cover
- N. GBR - Green (AU96121) — 36% coral cover
- N. GBR - Green (AU96122) — 35% coral cover
- N. GBR - Green (AUEY163) — 26% coral cover
- N. GBR - Green (AUEY164) — 33% coral cover
- N. GBR - Green (AULK19) — 33% coral cover
- N. GBR - Green (AULK20) — 51% coral cover
- N. GBR - Green (AULK21) — 19% coral cover
- N. GBR - Green (AULK22) — 4.0% coral cover
- N. GBR - Green (AULK29) — 16% coral cover
- N. GBR - Green (AULK30) — 1.8% coral cover
- N. GBR - Green (AUMO100) — 49% coral cover
- N. GBR - Green (AUMO101) — 44% coral cover
- N. GBR - Green (AUMO102) — 40% coral cover
- N. GBR - Green (AUMO97) — 68% coral cover
- N. GBR - Green (AUMO98) — 46% coral cover
- N. GBR - Green (AUMO99) — 28% coral cover
- N. GBR - Green (AUR701) — 40% coral cover
- N. GBR - Green (AUR702) — 46% coral cover
- N. GBR - Green (AUR703) — 44% coral cover
- N. GBR - Green (AUR704) — 44% coral cover
- N. GBR - Green (AUR705) — 37% coral cover
- N. GBR - Green (AUR706) — 22% coral cover
- N. GBR - Green (AUSD129) — 52% coral cover
- N. GBR - Green (AUSD130) — 41% coral cover
- N. GBR - Green (AUSD131) — 53% coral cover
- N. GBR - Green (AUSD132) — 63% coral cover
- N. GBR - Green (AUSD133) — 47% coral cover
- N. GBR - Green (AUSD134) — 55% coral cover
- N. GBR - Green (AUWD104) — 37% coral cover
- N. GBR - Green (AUWD106) — 36% coral cover
- N. GBR - Green (AUWO103) — 36% coral cover
- N. GBR - Green (AUWO105) — 61% coral cover
- N. GBR - Green (AUYG37) — 24% coral cover
- N. GBR - Green (AUYG38) — 57% coral cover
- N. GBR - Green (AUYG39) — 36% coral cover
- N. GBR - Green (AUYG40) — 11% coral cover
- N. GBR - Green (AUYG41) — 24% coral cover
- N. GBR - Green (AUYG42) — 41% coral cover
- N. GBR - Pink (AU61A61) — 53% coral cover
- N. GBR - Pink (AU61A62) — 51% coral cover
- N. GBR - Pink (AU61A63) — 75% coral cover
- N. GBR - Pink (AU61A64) — 57% coral cover
- N. GBR - Pink (AU61A65) — 49% coral cover
- N. GBR - Pink (AU61A66) — 58% coral cover
- N. GBR - Pink (AU91111) — 36% coral cover
- N. GBR - Pink (AU91112) — 33% coral cover
- N. GBR - Pink (AU91113) — 38% coral cover
- N. GBR - Pink (AU91114) — 38% coral cover
- N. GBR - Pink (AU91115) — 46% coral cover
- N. GBR - Pink (AU91116) — 41% coral cover
- N. GBR - Pink (AUCT49) — 13% coral cover
- N. GBR - Pink (AUCT50) — 46% coral cover
- N. GBR - Pink (AUCT51) — 14% coral cover
- N. GBR - Pink (AUCT52) — 22% coral cover
- N. GBR - Pink (AUCT53) — 31% coral cover
- N. GBR - Pink (AUCT54) — 30% coral cover
- N. GBR - Pink (AUHI159) — 70% coral cover
- N. GBR - Pink (AUHI160) — 37% coral cover
- N. GBR - Pink (AUHI161) — 43% coral cover
- N. GBR - Pink (AUHI162) — 39% coral cover
- N. GBR - Pink (AUHI165) — 29% coral cover
- N. GBR - Pink (AUHI166) — 36% coral cover
- N. GBR - Pink (AUMM85) — 47% coral cover
- N. GBR - Pink (AUMM86) — 52% coral cover
- N. GBR - Pink (AUMM87) — 46% coral cover
- N. GBR - Pink (AUMM88) — 51% coral cover
- N. GBR - Pink (AUMM89) — 51% coral cover
- N. GBR - Pink (AUMM90) — 53% coral cover
- N. GBR - Pink (AUPE123) — 65% coral cover
- N. GBR - Pink (AUPE124) — 37% coral cover
- N. GBR - Pink (AUPE125) — 62% coral cover
- N. GBR - Pink (AUPE126) — 55% coral cover
- N. GBR - Pink (AUPE127) — 58% coral cover
- N. GBR - Pink (AUPE128) — 34% coral cover
- N. GBR - Pink (AUPS67) — 19% coral cover
- N. GBR - Pink (AUPS68) — 42% coral cover
- N. GBR - Pink (AUPS69) — 54% coral cover
- N. GBR - Pink (AUPS70) — 57% coral cover
- N. GBR - Pink (AUPS71) — 55% coral cover
- N. GBR - Pink (AUPS72) — 55% coral cover
- N. GBR - Pink (AUR607) — 35% coral cover
- N. GBR - Pink (AUR608) — 19% coral cover
- N. GBR - Pink (AUR609) — 36% coral cover
- N. GBR - Pink (AUR610) — 59% coral cover
- N. GBR - Pink (AUR611) — 37% coral cover
- N. GBR - Pink (AUR612) — 41% coral cover
- N. GBR - Pink (AUWL23) — 24% coral cover
- N. GBR - Pink (AUWL24) — 9.4% coral cover
- N. GBR - Pink (AUWL25) — 18% coral cover
- N. GBR - Pink (AUWL26) — 4.6% coral cover
- N. GBR - Pink (AUWL27) — 15% coral cover
- N. GBR - Pink (AUWL28) — 3.4% coral cover
- N. GBR - Pink (AUYD107) — 19% coral cover
- N. GBR - Pink (AUYD108) — 48% coral cover
- N. GBR - Pink (AUYD109) — 37% coral cover
- N. GBR - Pink (AUYD110) — 45% coral cover
- Whitsundays - Blue Pearl Bay (Hayman Island) — 23% (nearest station surveyed in the last 10 years, not this site: Reef Check, Hayman Island Reefs - Blue Pearl Bay (Fringing reef leeward) Site 1 station, 2023-10-15, 0.90 km away)
- Whitsundays - Butterfly Bay (Hook Island) — 29% (nearest survey station, not this site: Reef Check, Hook Island - Butterfly Bay Site 1 station, 2023-10-21, 0.64 km away)
- Whitsundays - Cateran Bay (Border Island) — 13% (nearest survey station, not this site: AIMS LTMP, BORDER ISLAND REEF (NO 1) site 3 station, 2023, 0.60 km away)
- Whitsundays - Hill Inlet / Whitehaven (Whitsunday Island)
- Whitsundays - Luncheon Bay (Hook Island) — 8.1% (newest survey within 0.5 km, not this site: Reef Check, Hook Island - Luncheon Bay (Fringing reef leeward) Site 1 station, 2023-10-21, 0.30 km away)
- Whitsundays - Maureen's Cove (Hook Island) — 29% (nearest survey station, not this site: Reef Check, Hook Island - Butterfly Bay Site 1 station, 2023-10-21, 0.90 km away)
- Whitsundays - Pinnacle Point (Hook Island) — 8.1% (nearest survey station, not this site: Reef Check, Hook Island - Luncheon Bay (Fringing reef leeward) Site 1 station, 2023-10-21, 0.92 km away)
Nearby external survey stations
1320 independent survey records within 5 km of a site in this region (each record counted once).
Show all 1320 records
- AIMS — Border (2023): 27% hard coral cover, 1.14 km from Whitsundays - Cateran Bay (Border Island)
- AIMS LTMP — BORDER ISLAND REEF (NO 1) site 1 (1994): 36% hard coral cover, 1.14 km from Whitsundays - Cateran Bay (Border Island)
- AIMS LTMP — BORDER ISLAND REEF (NO 1) site 1 (1995): 34% hard coral cover, 1.14 km from Whitsundays - Cateran Bay (Border Island)
- AIMS LTMP — BORDER ISLAND REEF (NO 1) site 1 (1996): 37% hard coral cover, 1.14 km from Whitsundays - Cateran Bay (Border Island)
- AIMS LTMP — BORDER ISLAND REEF (NO 1) site 1 (1997): 35% hard coral cover, 1.14 km from Whitsundays - Cateran Bay (Border Island)
- AIMS LTMP — BORDER ISLAND REEF (NO 1) site 1 (1998): 37% hard coral cover, 1.14 km from Whitsundays - Cateran Bay (Border Island)
- AIMS LTMP — BORDER ISLAND REEF (NO 1) site 1 (1999): 38% hard coral cover, 1.14 km from Whitsundays - Cateran Bay (Border Island)
- AIMS LTMP — BORDER ISLAND REEF (NO 1) site 1 (2000): 38% hard coral cover, 1.14 km from Whitsundays - Cateran Bay (Border Island)
- AIMS LTMP — BORDER ISLAND REEF (NO 1) site 1 (2001): 34% hard coral cover, 1.14 km from Whitsundays - Cateran Bay (Border Island)
- AIMS LTMP — BORDER ISLAND REEF (NO 1) site 1 (2002): 37% hard coral cover, 1.14 km from Whitsundays - Cateran Bay (Border Island)
- AIMS LTMP — BORDER ISLAND REEF (NO 1) site 1 (2004): 38% hard coral cover, 1.14 km from Whitsundays - Cateran Bay (Border Island)
- AIMS LTMP — BORDER ISLAND REEF (NO 1) site 1 (2005): 36% hard coral cover, 1.14 km from Whitsundays - Cateran Bay (Border Island)
- AIMS LTMP — BORDER ISLAND REEF (NO 1) site 1 (2007): 35% hard coral cover, 1.14 km from Whitsundays - Cateran Bay (Border Island)
- AIMS LTMP — BORDER ISLAND REEF (NO 1) site 1 (2009): 36% hard coral cover, 1.14 km from Whitsundays - Cateran Bay (Border Island)
- AIMS LTMP — BORDER ISLAND REEF (NO 1) site 1 (2011): 42% hard coral cover, 1.14 km from Whitsundays - Cateran Bay (Border Island)
- AIMS LTMP — BORDER ISLAND REEF (NO 1) site 1 (2013): 38% hard coral cover, 1.14 km from Whitsundays - Cateran Bay (Border Island)
- AIMS LTMP — BORDER ISLAND REEF (NO 1) site 1 (2015): 34% hard coral cover, 1.14 km from Whitsundays - Cateran Bay (Border Island)
- AIMS LTMP — BORDER ISLAND REEF (NO 1) site 1 (2017): 41% hard coral cover, 1.14 km from Whitsundays - Cateran Bay (Border Island)
- AIMS LTMP — BORDER ISLAND REEF (NO 1) site 1 (2019): 33% hard coral cover, 1.14 km from Whitsundays - Cateran Bay (Border Island)
- AIMS LTMP — BORDER ISLAND REEF (NO 1) site 1 (2021): 31% hard coral cover, 1.14 km from Whitsundays - Cateran Bay (Border Island)
- AIMS LTMP — BORDER ISLAND REEF (NO 1) site 1 (2022): 28% hard coral cover, 1.14 km from Whitsundays - Cateran Bay (Border Island)
- AIMS LTMP — BORDER ISLAND REEF (NO 1) site 1 (2023): 30% hard coral cover, 1.14 km from Whitsundays - Cateran Bay (Border Island)
- AIMS LTMP — BORDER ISLAND REEF (NO 1) site 1 (2023): 36% hard coral cover, 1.14 km from Whitsundays - Cateran Bay (Border Island)
- AIMS LTMP — BORDER ISLAND REEF (NO 1) site 2 (1994): 16% hard coral cover, 1.90 km from Whitsundays - Cateran Bay (Border Island)
- AIMS LTMP — BORDER ISLAND REEF (NO 1) site 2 (1995): 18% hard coral cover, 1.90 km from Whitsundays - Cateran Bay (Border Island)
- AIMS LTMP — BORDER ISLAND REEF (NO 1) site 2 (1996): 19% hard coral cover, 1.90 km from Whitsundays - Cateran Bay (Border Island)
- AIMS LTMP — BORDER ISLAND REEF (NO 1) site 2 (1997): 16% hard coral cover, 1.90 km from Whitsundays - Cateran Bay (Border Island)
- AIMS LTMP — BORDER ISLAND REEF (NO 1) site 2 (1998): 19% hard coral cover, 1.90 km from Whitsundays - Cateran Bay (Border Island)
- AIMS LTMP — BORDER ISLAND REEF (NO 1) site 2 (1999): 21% hard coral cover, 1.90 km from Whitsundays - Cateran Bay (Border Island)
- AIMS LTMP — BORDER ISLAND REEF (NO 1) site 2 (2000): 19% hard coral cover, 1.90 km from Whitsundays - Cateran Bay (Border Island)
- AIMS LTMP — BORDER ISLAND REEF (NO 1) site 2 (2001): 21% hard coral cover, 1.90 km from Whitsundays - Cateran Bay (Border Island)
- AIMS LTMP — BORDER ISLAND REEF (NO 1) site 2 (2002): 22% hard coral cover, 1.90 km from Whitsundays - Cateran Bay (Border Island)
- AIMS LTMP — BORDER ISLAND REEF (NO 1) site 2 (2004): 25% hard coral cover, 1.90 km from Whitsundays - Cateran Bay (Border Island)
- AIMS LTMP — BORDER ISLAND REEF (NO 1) site 2 (2005): 22% hard coral cover, 1.90 km from Whitsundays - Cateran Bay (Border Island)
- AIMS LTMP — BORDER ISLAND REEF (NO 1) site 2 (2007): 22% hard coral cover, 1.90 km from Whitsundays - Cateran Bay (Border Island)
- AIMS LTMP — BORDER ISLAND REEF (NO 1) site 2 (2009): 23% hard coral cover, 1.90 km from Whitsundays - Cateran Bay (Border Island)
- AIMS LTMP — BORDER ISLAND REEF (NO 1) site 2 (2011): 30% hard coral cover, 1.90 km from Whitsundays - Cateran Bay (Border Island)
- AIMS LTMP — BORDER ISLAND REEF (NO 1) site 2 (2013): 27% hard coral cover, 1.90 km from Whitsundays - Cateran Bay (Border Island)
- AIMS LTMP — BORDER ISLAND REEF (NO 1) site 2 (2015): 34% hard coral cover, 1.90 km from Whitsundays - Cateran Bay (Border Island)
- AIMS LTMP — BORDER ISLAND REEF (NO 1) site 2 (2017): 34% hard coral cover, 1.90 km from Whitsundays - Cateran Bay (Border Island)
- AIMS LTMP — BORDER ISLAND REEF (NO 1) site 2 (2019): 15% hard coral cover, 1.90 km from Whitsundays - Cateran Bay (Border Island)
- AIMS LTMP — BORDER ISLAND REEF (NO 1) site 2 (2021): 16% hard coral cover, 1.90 km from Whitsundays - Cateran Bay (Border Island)
- AIMS LTMP — BORDER ISLAND REEF (NO 1) site 2 (2022): 14% hard coral cover, 1.90 km from Whitsundays - Cateran Bay (Border Island)
- AIMS LTMP — BORDER ISLAND REEF (NO 1) site 2 (2023): 13% hard coral cover, 1.90 km from Whitsundays - Cateran Bay (Border Island)
- AIMS LTMP — BORDER ISLAND REEF (NO 1) site 2 (2023): 21% hard coral cover, 1.90 km from Whitsundays - Cateran Bay (Border Island)
- AIMS LTMP — BORDER ISLAND REEF (NO 1) site 3 (1994): 24% hard coral cover, 0.60 km from Whitsundays - Cateran Bay (Border Island)
- AIMS LTMP — BORDER ISLAND REEF (NO 1) site 3 (1995): 27% hard coral cover, 0.60 km from Whitsundays - Cateran Bay (Border Island)
- AIMS LTMP — BORDER ISLAND REEF (NO 1) site 3 (1996): 26% hard coral cover, 0.60 km from Whitsundays - Cateran Bay (Border Island)
- AIMS LTMP — BORDER ISLAND REEF (NO 1) site 3 (1997): 29% hard coral cover, 0.60 km from Whitsundays - Cateran Bay (Border Island)
- AIMS LTMP — BORDER ISLAND REEF (NO 1) site 3 (1998): 29% hard coral cover, 0.60 km from Whitsundays - Cateran Bay (Border Island)
- AIMS LTMP — BORDER ISLAND REEF (NO 1) site 3 (1999): 30% hard coral cover, 0.60 km from Whitsundays - Cateran Bay (Border Island)
- AIMS LTMP — BORDER ISLAND REEF (NO 1) site 3 (2000): 27% hard coral cover, 0.60 km from Whitsundays - Cateran Bay (Border Island)
- AIMS LTMP — BORDER ISLAND REEF (NO 1) site 3 (2001): 27% hard coral cover, 0.60 km from Whitsundays - Cateran Bay (Border Island)
- AIMS LTMP — BORDER ISLAND REEF (NO 1) site 3 (2002): 25% hard coral cover, 0.60 km from Whitsundays - Cateran Bay (Border Island)
- AIMS LTMP — BORDER ISLAND REEF (NO 1) site 3 (2004): 24% hard coral cover, 0.60 km from Whitsundays - Cateran Bay (Border Island)
- AIMS LTMP — BORDER ISLAND REEF (NO 1) site 3 (2005): 24% hard coral cover, 0.60 km from Whitsundays - Cateran Bay (Border Island)
- AIMS LTMP — BORDER ISLAND REEF (NO 1) site 3 (2007): 20% hard coral cover, 0.60 km from Whitsundays - Cateran Bay (Border Island)
- AIMS LTMP — BORDER ISLAND REEF (NO 1) site 3 (2009): 22% hard coral cover, 0.60 km from Whitsundays - Cateran Bay (Border Island)
- AIMS LTMP — BORDER ISLAND REEF (NO 1) site 3 (2011): 22% hard coral cover, 0.60 km from Whitsundays - Cateran Bay (Border Island)
- AIMS LTMP — BORDER ISLAND REEF (NO 1) site 3 (2013): 27% hard coral cover, 0.60 km from Whitsundays - Cateran Bay (Border Island)
- AIMS LTMP — BORDER ISLAND REEF (NO 1) site 3 (2015): 30% hard coral cover, 0.60 km from Whitsundays - Cateran Bay (Border Island)
- AIMS LTMP — BORDER ISLAND REEF (NO 1) site 3 (2017): 30% hard coral cover, 0.60 km from Whitsundays - Cateran Bay (Border Island)
- AIMS LTMP — BORDER ISLAND REEF (NO 1) site 3 (2019): 12% hard coral cover, 0.60 km from Whitsundays - Cateran Bay (Border Island)
- AIMS LTMP — BORDER ISLAND REEF (NO 1) site 3 (2021): 14% hard coral cover, 0.60 km from Whitsundays - Cateran Bay (Border Island)
- AIMS LTMP — BORDER ISLAND REEF (NO 1) site 3 (2022): 9.9% hard coral cover, 0.60 km from Whitsundays - Cateran Bay (Border Island)
- AIMS LTMP — BORDER ISLAND REEF (NO 1) site 3 (2023): 13% hard coral cover, 0.60 km from Whitsundays - Cateran Bay (Border Island)
- AIMS LTMP — BORDER ISLAND REEF (NO 1) site 3 (2023): 24% hard coral cover, 0.60 km from Whitsundays - Cateran Bay (Border Island)
- AIMS LTMP — CARTER REEF site 1 (1993): 7.5% hard coral cover, 0.90 km from N. GBR - Pink (AUCT53)
- AIMS LTMP — CARTER REEF site 1 (1994): 20% hard coral cover, 0.90 km from N. GBR - Pink (AUCT53)
- AIMS LTMP — CARTER REEF site 1 (1995): 31% hard coral cover, 0.90 km from N. GBR - Pink (AUCT53)
- AIMS LTMP — CARTER REEF site 1 (1997): 55% hard coral cover, 0.90 km from N. GBR - Pink (AUCT53)
- AIMS LTMP — CARTER REEF site 1 (1998): 73% hard coral cover, 0.90 km from N. GBR - Pink (AUCT53)
- AIMS LTMP — CARTER REEF site 1 (1999): 65% hard coral cover, 0.90 km from N. GBR - Pink (AUCT53)
- AIMS LTMP — CARTER REEF site 1 (2000): 62% hard coral cover, 0.90 km from N. GBR - Pink (AUCT53)
- AIMS LTMP — CARTER REEF site 1 (2001): 61% hard coral cover, 0.90 km from N. GBR - Pink (AUCT53)
- AIMS LTMP — CARTER REEF site 1 (2002): 51% hard coral cover, 0.90 km from N. GBR - Pink (AUCT53)
- AIMS LTMP — CARTER REEF site 1 (2003): 61% hard coral cover, 0.90 km from N. GBR - Pink (AUCT53)
- AIMS LTMP — CARTER REEF site 1 (2004): 43% hard coral cover, 0.90 km from N. GBR - Pink (AUCT53)
- AIMS LTMP — CARTER REEF site 1 (2006): 34% hard coral cover, 0.90 km from N. GBR - Pink (AUCT53)
- AIMS LTMP — CARTER REEF site 1 (2008): 34% hard coral cover, 0.90 km from N. GBR - Pink (AUCT53)
- AIMS LTMP — CARTER REEF site 1 (2010): 45% hard coral cover, 0.90 km from N. GBR - Pink (AUCT53)
- AIMS LTMP — CARTER REEF site 1 (2012): 34% hard coral cover, 0.90 km from N. GBR - Pink (AUCT53)
- AIMS LTMP — CARTER REEF site 1 (2014): 28% hard coral cover, 0.90 km from N. GBR - Pink (AUCT53)
- AIMS LTMP — CARTER REEF site 1 (2016): 9.0% hard coral cover, 0.90 km from N. GBR - Pink (AUCT53)
- AIMS LTMP — CARTER REEF site 1 (2018): 13% hard coral cover, 0.90 km from N. GBR - Pink (AUCT53)
- AIMS LTMP — CARTER REEF site 1 (2020): 22% hard coral cover, 0.90 km from N. GBR - Pink (AUCT53)
- AIMS LTMP — CARTER REEF site 1 (2021): 29% hard coral cover, 0.90 km from N. GBR - Pink (AUCT53)
- AIMS LTMP — CARTER REEF site 1 (2022): 34% hard coral cover, 0.90 km from N. GBR - Pink (AUCT53)
- AIMS LTMP — CARTER REEF site 1 (2022): 39% hard coral cover, 0.90 km from N. GBR - Pink (AUCT53)
- AIMS LTMP — CARTER REEF site 2 (1993): 14% hard coral cover, 0.45 km from N. GBR - Pink (AUCT53)
- AIMS LTMP — CARTER REEF site 2 (1994): 23% hard coral cover, 0.45 km from N. GBR - Pink (AUCT53)
- AIMS LTMP — CARTER REEF site 2 (1995): 33% hard coral cover, 0.45 km from N. GBR - Pink (AUCT53)
- AIMS LTMP — CARTER REEF site 2 (1997): 57% hard coral cover, 0.45 km from N. GBR - Pink (AUCT53)
- AIMS LTMP — CARTER REEF site 2 (1998): 64% hard coral cover, 0.45 km from N. GBR - Pink (AUCT53)
- AIMS LTMP — CARTER REEF site 2 (1999): 65% hard coral cover, 0.45 km from N. GBR - Pink (AUCT53)
- AIMS LTMP — CARTER REEF site 2 (2000): 62% hard coral cover, 0.45 km from N. GBR - Pink (AUCT53)
- AIMS LTMP — CARTER REEF site 2 (2001): 58% hard coral cover, 0.45 km from N. GBR - Pink (AUCT53)
- AIMS LTMP — CARTER REEF site 2 (2002): 58% hard coral cover, 0.45 km from N. GBR - Pink (AUCT53)
- AIMS LTMP — CARTER REEF site 2 (2003): 55% hard coral cover, 0.45 km from N. GBR - Pink (AUCT53)
- AIMS LTMP — CARTER REEF site 2 (2004): 42% hard coral cover, 0.45 km from N. GBR - Pink (AUCT53)
- AIMS LTMP — CARTER REEF site 2 (2006): 30% hard coral cover, 0.45 km from N. GBR - Pink (AUCT53)
- AIMS LTMP — CARTER REEF site 2 (2008): 40% hard coral cover, 0.45 km from N. GBR - Pink (AUCT53)
- AIMS LTMP — CARTER REEF site 2 (2010): 42% hard coral cover, 0.45 km from N. GBR - Pink (AUCT53)
- AIMS LTMP — CARTER REEF site 2 (2012): 32% hard coral cover, 0.45 km from N. GBR - Pink (AUCT53)
- AIMS LTMP — CARTER REEF site 2 (2014): 27% hard coral cover, 0.45 km from N. GBR - Pink (AUCT53)
- AIMS LTMP — CARTER REEF site 2 (2016): 8.8% hard coral cover, 0.45 km from N. GBR - Pink (AUCT53)
- AIMS LTMP — CARTER REEF site 2 (2018): 12% hard coral cover, 0.45 km from N. GBR - Pink (AUCT53)
- AIMS LTMP — CARTER REEF site 2 (2020): 24% hard coral cover, 0.45 km from N. GBR - Pink (AUCT53)
- AIMS LTMP — CARTER REEF site 2 (2021): 30% hard coral cover, 0.45 km from N. GBR - Pink (AUCT53)
- AIMS LTMP — CARTER REEF site 2 (2022): 36% hard coral cover, 0.45 km from N. GBR - Pink (AUCT53)
- AIMS LTMP — CARTER REEF site 2 (2022): 40% hard coral cover, 0.46 km from N. GBR - Pink (AUCT53)
- AIMS LTMP — CARTER REEF site 3 (1993): 17% hard coral cover, 0.17 km from N. GBR - Pink (AUCT53)
- AIMS LTMP — CARTER REEF site 3 (1994): 26% hard coral cover, 0.17 km from N. GBR - Pink (AUCT53)
- AIMS LTMP — CARTER REEF site 3 (1995): 34% hard coral cover, 0.17 km from N. GBR - Pink (AUCT53)
- AIMS LTMP — CARTER REEF site 3 (1997): 45% hard coral cover, 0.17 km from N. GBR - Pink (AUCT53)
- AIMS LTMP — CARTER REEF site 3 (1998): 58% hard coral cover, 0.17 km from N. GBR - Pink (AUCT53)
- AIMS LTMP — CARTER REEF site 3 (1999): 56% hard coral cover, 0.17 km from N. GBR - Pink (AUCT53)
- AIMS LTMP — CARTER REEF site 3 (2000): 58% hard coral cover, 0.17 km from N. GBR - Pink (AUCT53)
- AIMS LTMP — CARTER REEF site 3 (2001): 55% hard coral cover, 0.17 km from N. GBR - Pink (AUCT53)
- AIMS LTMP — CARTER REEF site 3 (2002): 59% hard coral cover, 0.17 km from N. GBR - Pink (AUCT53)
- AIMS LTMP — CARTER REEF site 3 (2003): 56% hard coral cover, 0.17 km from N. GBR - Pink (AUCT53)
- AIMS LTMP — CARTER REEF site 3 (2004): 32% hard coral cover, 0.17 km from N. GBR - Pink (AUCT53)
- AIMS LTMP — CARTER REEF site 3 (2006): 27% hard coral cover, 0.17 km from N. GBR - Pink (AUCT53)
- AIMS LTMP — CARTER REEF site 3 (2008): 34% hard coral cover, 0.17 km from N. GBR - Pink (AUCT53)
- AIMS LTMP — CARTER REEF site 3 (2010): 40% hard coral cover, 0.17 km from N. GBR - Pink (AUCT53)
- AIMS LTMP — CARTER REEF site 3 (2012): 24% hard coral cover, 0.17 km from N. GBR - Pink (AUCT53)
- AIMS LTMP — CARTER REEF site 3 (2014): 22% hard coral cover, 0.17 km from N. GBR - Pink (AUCT53)
- AIMS LTMP — CARTER REEF site 3 (2016): 7.7% hard coral cover, 0.17 km from N. GBR - Pink (AUCT53)
- AIMS LTMP — CARTER REEF site 3 (2018): 11% hard coral cover, 0.17 km from N. GBR - Pink (AUCT53)
- AIMS LTMP — CARTER REEF site 3 (2020): 20% hard coral cover, 0.17 km from N. GBR - Pink (AUCT53)
- AIMS LTMP — CARTER REEF site 3 (2021): 27% hard coral cover, 0.17 km from N. GBR - Pink (AUCT53)
- AIMS LTMP — CARTER REEF site 3 (2022): 28% hard coral cover, 0.17 km from N. GBR - Pink (AUCT53)
- AIMS LTMP — CARTER REEF site 3 (2022): 36% hard coral cover, 0.17 km from N. GBR - Pink (AUCT53)
- AIMS LTMP — DAVIES REEF site 1 (1992): 31% hard coral cover, 4.90 km from Great Barrier Reef - Townsville / Davies Reef
- AIMS LTMP — DAVIES REEF site 1 (1993): 29% hard coral cover, 4.90 km from Great Barrier Reef - Townsville / Davies Reef
- AIMS LTMP — DAVIES REEF site 1 (1995): 35% hard coral cover, 4.90 km from Great Barrier Reef - Townsville / Davies Reef
- AIMS LTMP — DAVIES REEF site 1 (1996): 37% hard coral cover, 4.90 km from Great Barrier Reef - Townsville / Davies Reef
- AIMS LTMP — DAVIES REEF site 1 (1997): 35% hard coral cover, 4.90 km from Great Barrier Reef - Townsville / Davies Reef
- AIMS LTMP — DAVIES REEF site 1 (1998): 42% hard coral cover, 4.90 km from Great Barrier Reef - Townsville / Davies Reef
- AIMS LTMP — DAVIES REEF site 1 (1999): 38% hard coral cover, 4.90 km from Great Barrier Reef - Townsville / Davies Reef
- AIMS LTMP — DAVIES REEF site 1 (2000): 31% hard coral cover, 4.90 km from Great Barrier Reef - Townsville / Davies Reef
- AIMS LTMP — DAVIES REEF site 1 (2001): 31% hard coral cover, 4.90 km from Great Barrier Reef - Townsville / Davies Reef
- AIMS LTMP — DAVIES REEF site 1 (2002): 31% hard coral cover, 4.90 km from Great Barrier Reef - Townsville / Davies Reef
- AIMS LTMP — DAVIES REEF site 1 (2003): 24% hard coral cover, 4.90 km from Great Barrier Reef - Townsville / Davies Reef
- AIMS LTMP — DAVIES REEF site 1 (2004): 25% hard coral cover, 4.90 km from Great Barrier Reef - Townsville / Davies Reef
- AIMS LTMP — DAVIES REEF site 1 (2005): 30% hard coral cover, 4.90 km from Great Barrier Reef - Townsville / Davies Reef
- AIMS LTMP — DAVIES REEF site 1 (2007): 28% hard coral cover, 4.90 km from Great Barrier Reef - Townsville / Davies Reef
- AIMS LTMP — DAVIES REEF site 1 (2009): 28% hard coral cover, 4.90 km from Great Barrier Reef - Townsville / Davies Reef
- AIMS LTMP — DAVIES REEF site 1 (2011): 21% hard coral cover, 4.90 km from Great Barrier Reef - Townsville / Davies Reef
- AIMS LTMP — DAVIES REEF site 1 (2013): 30% hard coral cover, 4.90 km from Great Barrier Reef - Townsville / Davies Reef
- AIMS LTMP — DAVIES REEF site 1 (2015): 29% hard coral cover, 4.90 km from Great Barrier Reef - Townsville / Davies Reef
- AIMS LTMP — DAVIES REEF site 1 (2017): 33% hard coral cover, 4.90 km from Great Barrier Reef - Townsville / Davies Reef
- AIMS LTMP — DAVIES REEF site 1 (2019): 43% hard coral cover, 4.90 km from Great Barrier Reef - Townsville / Davies Reef
- AIMS LTMP — DAVIES REEF site 1 (2021): 42% hard coral cover, 4.90 km from Great Barrier Reef - Townsville / Davies Reef
- AIMS LTMP — DAVIES REEF site 1 (2022): 42% hard coral cover, 4.90 km from Great Barrier Reef - Townsville / Davies Reef
- AIMS LTMP — DAVIES REEF site 1 (2023): 40% hard coral cover, 4.90 km from Great Barrier Reef - Townsville / Davies Reef
- AIMS LTMP — DAVIES REEF site 2 (1992): 31% hard coral cover, 4.85 km from Great Barrier Reef - Townsville / Davies Reef
- AIMS LTMP — DAVIES REEF site 2 (1993): 25% hard coral cover, 4.85 km from Great Barrier Reef - Townsville / Davies Reef
- AIMS LTMP — DAVIES REEF site 2 (1995): 35% hard coral cover, 4.85 km from Great Barrier Reef - Townsville / Davies Reef
- AIMS LTMP — DAVIES REEF site 2 (1996): 38% hard coral cover, 4.85 km from Great Barrier Reef - Townsville / Davies Reef
- AIMS LTMP — DAVIES REEF site 2 (1997): 37% hard coral cover, 4.85 km from Great Barrier Reef - Townsville / Davies Reef
- AIMS LTMP — DAVIES REEF site 2 (1998): 38% hard coral cover, 4.85 km from Great Barrier Reef - Townsville / Davies Reef
- AIMS LTMP — DAVIES REEF site 2 (1999): 37% hard coral cover, 4.85 km from Great Barrier Reef - Townsville / Davies Reef
- AIMS LTMP — DAVIES REEF site 2 (2000): 32% hard coral cover, 4.85 km from Great Barrier Reef - Townsville / Davies Reef
- AIMS LTMP — DAVIES REEF site 2 (2001): 34% hard coral cover, 4.85 km from Great Barrier Reef - Townsville / Davies Reef
- AIMS LTMP — DAVIES REEF site 2 (2002): 32% hard coral cover, 4.85 km from Great Barrier Reef - Townsville / Davies Reef
- AIMS LTMP — DAVIES REEF site 2 (2003): 30% hard coral cover, 4.85 km from Great Barrier Reef - Townsville / Davies Reef
- AIMS LTMP — DAVIES REEF site 2 (2004): 29% hard coral cover, 4.85 km from Great Barrier Reef - Townsville / Davies Reef
- AIMS LTMP — DAVIES REEF site 2 (2005): 31% hard coral cover, 4.85 km from Great Barrier Reef - Townsville / Davies Reef
- AIMS LTMP — DAVIES REEF site 2 (2007): 27% hard coral cover, 4.85 km from Great Barrier Reef - Townsville / Davies Reef
- AIMS LTMP — DAVIES REEF site 2 (2009): 30% hard coral cover, 4.85 km from Great Barrier Reef - Townsville / Davies Reef
- AIMS LTMP — DAVIES REEF site 2 (2011): 16% hard coral cover, 4.85 km from Great Barrier Reef - Townsville / Davies Reef
- AIMS LTMP — DAVIES REEF site 2 (2013): 23% hard coral cover, 4.85 km from Great Barrier Reef - Townsville / Davies Reef
- AIMS LTMP — DAVIES REEF site 2 (2015): 20% hard coral cover, 4.85 km from Great Barrier Reef - Townsville / Davies Reef
- AIMS LTMP — DAVIES REEF site 2 (2017): 28% hard coral cover, 4.85 km from Great Barrier Reef - Townsville / Davies Reef
- AIMS LTMP — DAVIES REEF site 2 (2019): 37% hard coral cover, 4.85 km from Great Barrier Reef - Townsville / Davies Reef
- AIMS LTMP — DAVIES REEF site 2 (2021): 35% hard coral cover, 4.85 km from Great Barrier Reef - Townsville / Davies Reef
- AIMS LTMP — DAVIES REEF site 2 (2022): 38% hard coral cover, 4.85 km from Great Barrier Reef - Townsville / Davies Reef
- AIMS LTMP — DAVIES REEF site 2 (2023): 36% hard coral cover, 4.85 km from Great Barrier Reef - Townsville / Davies Reef
- AIMS LTMP — DAVIES REEF site 3 (1992): 22% hard coral cover, 4.22 km from Great Barrier Reef - Townsville / Davies Reef
- AIMS LTMP — DAVIES REEF site 3 (1993): 25% hard coral cover, 4.22 km from Great Barrier Reef - Townsville / Davies Reef
- AIMS LTMP — DAVIES REEF site 3 (1995): 33% hard coral cover, 4.22 km from Great Barrier Reef - Townsville / Davies Reef
- AIMS LTMP — DAVIES REEF site 3 (1996): 41% hard coral cover, 4.22 km from Great Barrier Reef - Townsville / Davies Reef
- AIMS LTMP — DAVIES REEF site 3 (1997): 41% hard coral cover, 4.22 km from Great Barrier Reef - Townsville / Davies Reef
- AIMS LTMP — DAVIES REEF site 3 (1998): 42% hard coral cover, 4.22 km from Great Barrier Reef - Townsville / Davies Reef
- AIMS LTMP — DAVIES REEF site 3 (1999): 46% hard coral cover, 4.22 km from Great Barrier Reef - Townsville / Davies Reef
- AIMS LTMP — DAVIES REEF site 3 (2000): 41% hard coral cover, 4.22 km from Great Barrier Reef - Townsville / Davies Reef
- AIMS LTMP — DAVIES REEF site 3 (2001): 35% hard coral cover, 4.22 km from Great Barrier Reef - Townsville / Davies Reef
- AIMS LTMP — DAVIES REEF site 3 (2002): 35% hard coral cover, 4.22 km from Great Barrier Reef - Townsville / Davies Reef
- AIMS LTMP — DAVIES REEF site 3 (2003): 32% hard coral cover, 4.22 km from Great Barrier Reef - Townsville / Davies Reef
- AIMS LTMP — DAVIES REEF site 3 (2004): 27% hard coral cover, 4.22 km from Great Barrier Reef - Townsville / Davies Reef
- AIMS LTMP — DAVIES REEF site 3 (2005): 34% hard coral cover, 4.22 km from Great Barrier Reef - Townsville / Davies Reef
- AIMS LTMP — DAVIES REEF site 3 (2007): 28% hard coral cover, 4.22 km from Great Barrier Reef - Townsville / Davies Reef
- AIMS LTMP — DAVIES REEF site 3 (2009): 37% hard coral cover, 4.22 km from Great Barrier Reef - Townsville / Davies Reef
- AIMS LTMP — DAVIES REEF site 3 (2011): 19% hard coral cover, 4.22 km from Great Barrier Reef - Townsville / Davies Reef
- AIMS LTMP — DAVIES REEF site 3 (2013): 27% hard coral cover, 4.22 km from Great Barrier Reef - Townsville / Davies Reef
- AIMS LTMP — DAVIES REEF site 3 (2015): 28% hard coral cover, 4.22 km from Great Barrier Reef - Townsville / Davies Reef
- AIMS LTMP — DAVIES REEF site 3 (2017): 28% hard coral cover, 4.22 km from Great Barrier Reef - Townsville / Davies Reef
- AIMS LTMP — DAVIES REEF site 3 (2019): 35% hard coral cover, 4.22 km from Great Barrier Reef - Townsville / Davies Reef
- AIMS LTMP — DAVIES REEF site 3 (2021): 41% hard coral cover, 4.22 km from Great Barrier Reef - Townsville / Davies Reef
- AIMS LTMP — DAVIES REEF site 3 (2022): 36% hard coral cover, 4.22 km from Great Barrier Reef - Townsville / Davies Reef
- AIMS LTMP — DAVIES REEF site 3 (2023): 32% hard coral cover, 4.22 km from Great Barrier Reef - Townsville / Davies Reef
- AIMS LTMP — HAYMAN ISLAND REEF site 1 (1992): 35% hard coral cover, 2.38 km from Whitsundays - Blue Pearl Bay (Hayman Island)
- AIMS LTMP — HAYMAN ISLAND REEF site 1 (1993): 42% hard coral cover, 2.38 km from Whitsundays - Blue Pearl Bay (Hayman Island)
- AIMS LTMP — HAYMAN ISLAND REEF site 1 (1994): 34% hard coral cover, 2.38 km from Whitsundays - Blue Pearl Bay (Hayman Island)
- AIMS LTMP — HAYMAN ISLAND REEF site 1 (1995): 39% hard coral cover, 2.38 km from Whitsundays - Blue Pearl Bay (Hayman Island)
- AIMS LTMP — HAYMAN ISLAND REEF site 1 (1996): 41% hard coral cover, 2.38 km from Whitsundays - Blue Pearl Bay (Hayman Island)
- AIMS LTMP — HAYMAN ISLAND REEF site 1 (1997): 32% hard coral cover, 2.38 km from Whitsundays - Blue Pearl Bay (Hayman Island)
- AIMS LTMP — HAYMAN ISLAND REEF site 1 (1998): 32% hard coral cover, 2.38 km from Whitsundays - Blue Pearl Bay (Hayman Island)
- AIMS LTMP — HAYMAN ISLAND REEF site 1 (1999): 35% hard coral cover, 2.38 km from Whitsundays - Blue Pearl Bay (Hayman Island)
- AIMS LTMP — HAYMAN ISLAND REEF site 1 (2000): 37% hard coral cover, 2.38 km from Whitsundays - Blue Pearl Bay (Hayman Island)
- AIMS LTMP — HAYMAN ISLAND REEF site 1 (2001): 42% hard coral cover, 2.38 km from Whitsundays - Blue Pearl Bay (Hayman Island)
- AIMS LTMP — HAYMAN ISLAND REEF site 1 (2002): 43% hard coral cover, 2.38 km from Whitsundays - Blue Pearl Bay (Hayman Island)
- AIMS LTMP — HAYMAN ISLAND REEF site 1 (2004): 44% hard coral cover, 2.38 km from Whitsundays - Blue Pearl Bay (Hayman Island)
- AIMS LTMP — HAYMAN ISLAND REEF site 1 (2005): 47% hard coral cover, 2.38 km from Whitsundays - Blue Pearl Bay (Hayman Island)
- AIMS LTMP — HAYMAN ISLAND REEF site 1 (2007): 49% hard coral cover, 2.38 km from Whitsundays - Blue Pearl Bay (Hayman Island)
- AIMS LTMP — HAYMAN ISLAND REEF site 1 (2009): 49% hard coral cover, 2.38 km from Whitsundays - Blue Pearl Bay (Hayman Island)
- AIMS LTMP — HAYMAN ISLAND REEF site 1 (2011): 31% hard coral cover, 2.38 km from Whitsundays - Blue Pearl Bay (Hayman Island)
- AIMS LTMP — HAYMAN ISLAND REEF site 1 (2013): 37% hard coral cover, 2.38 km from Whitsundays - Blue Pearl Bay (Hayman Island)
- AIMS LTMP — HAYMAN ISLAND REEF site 1 (2015): 41% hard coral cover, 2.38 km from Whitsundays - Blue Pearl Bay (Hayman Island)
- AIMS LTMP — HAYMAN ISLAND REEF site 1 (2017): 41% hard coral cover, 2.38 km from Whitsundays - Blue Pearl Bay (Hayman Island)
- AIMS LTMP — HAYMAN ISLAND REEF site 1 (2019): 1.6% hard coral cover, 2.38 km from Whitsundays - Blue Pearl Bay (Hayman Island)
- AIMS LTMP — HAYMAN ISLAND REEF site 1 (2021): 4.2% hard coral cover, 2.38 km from Whitsundays - Blue Pearl Bay (Hayman Island)
- AIMS LTMP — HAYMAN ISLAND REEF site 1 (2022): 2.9% hard coral cover, 2.38 km from Whitsundays - Blue Pearl Bay (Hayman Island)
- AIMS LTMP — HAYMAN ISLAND REEF site 1 (2023): 10% hard coral cover, 2.38 km from Whitsundays - Blue Pearl Bay (Hayman Island)
- AIMS LTMP — HAYMAN ISLAND REEF site 2 (1992): 51% hard coral cover, 2.74 km from Whitsundays - Blue Pearl Bay (Hayman Island)
- AIMS LTMP — HAYMAN ISLAND REEF site 2 (1993): 51% hard coral cover, 2.74 km from Whitsundays - Blue Pearl Bay (Hayman Island)
- AIMS LTMP — HAYMAN ISLAND REEF site 2 (1994): 50% hard coral cover, 2.74 km from Whitsundays - Blue Pearl Bay (Hayman Island)
- AIMS LTMP — HAYMAN ISLAND REEF site 2 (1995): 55% hard coral cover, 2.74 km from Whitsundays - Blue Pearl Bay (Hayman Island)
- AIMS LTMP — HAYMAN ISLAND REEF site 2 (1996): 53% hard coral cover, 2.74 km from Whitsundays - Blue Pearl Bay (Hayman Island)
- AIMS LTMP — HAYMAN ISLAND REEF site 2 (1997): 45% hard coral cover, 2.74 km from Whitsundays - Blue Pearl Bay (Hayman Island)
- AIMS LTMP — HAYMAN ISLAND REEF site 2 (1998): 50% hard coral cover, 2.74 km from Whitsundays - Blue Pearl Bay (Hayman Island)
- AIMS LTMP — HAYMAN ISLAND REEF site 2 (1999): 47% hard coral cover, 2.74 km from Whitsundays - Blue Pearl Bay (Hayman Island)
- AIMS LTMP — HAYMAN ISLAND REEF site 2 (2000): 51% hard coral cover, 2.74 km from Whitsundays - Blue Pearl Bay (Hayman Island)
- AIMS LTMP — HAYMAN ISLAND REEF site 2 (2001): 54% hard coral cover, 2.74 km from Whitsundays - Blue Pearl Bay (Hayman Island)
- AIMS LTMP — HAYMAN ISLAND REEF site 2 (2002): 50% hard coral cover, 2.74 km from Whitsundays - Blue Pearl Bay (Hayman Island)
- AIMS LTMP — HAYMAN ISLAND REEF site 2 (2004): 53% hard coral cover, 2.74 km from Whitsundays - Blue Pearl Bay (Hayman Island)
- AIMS LTMP — HAYMAN ISLAND REEF site 2 (2005): 54% hard coral cover, 2.74 km from Whitsundays - Blue Pearl Bay (Hayman Island)
- AIMS LTMP — HAYMAN ISLAND REEF site 2 (2007): 59% hard coral cover, 2.74 km from Whitsundays - Blue Pearl Bay (Hayman Island)
- AIMS LTMP — HAYMAN ISLAND REEF site 2 (2009): 54% hard coral cover, 2.74 km from Whitsundays - Blue Pearl Bay (Hayman Island)
- AIMS LTMP — HAYMAN ISLAND REEF site 2 (2011): 41% hard coral cover, 2.74 km from Whitsundays - Blue Pearl Bay (Hayman Island)
- AIMS LTMP — HAYMAN ISLAND REEF site 2 (2013): 35% hard coral cover, 2.74 km from Whitsundays - Blue Pearl Bay (Hayman Island)
- AIMS LTMP — HAYMAN ISLAND REEF site 2 (2015): 41% hard coral cover, 2.74 km from Whitsundays - Blue Pearl Bay (Hayman Island)
- AIMS LTMP — HAYMAN ISLAND REEF site 2 (2017): 38% hard coral cover, 2.74 km from Whitsundays - Blue Pearl Bay (Hayman Island)
- AIMS LTMP — HAYMAN ISLAND REEF site 2 (2019): 8.1% hard coral cover, 2.74 km from Whitsundays - Blue Pearl Bay (Hayman Island)
- AIMS LTMP — HAYMAN ISLAND REEF site 2 (2021): 12% hard coral cover, 2.74 km from Whitsundays - Blue Pearl Bay (Hayman Island)
- AIMS LTMP — HAYMAN ISLAND REEF site 2 (2022): 15% hard coral cover, 2.74 km from Whitsundays - Blue Pearl Bay (Hayman Island)
- AIMS LTMP — HAYMAN ISLAND REEF site 2 (2023): 18% hard coral cover, 2.74 km from Whitsundays - Blue Pearl Bay (Hayman Island)
- AIMS LTMP — HAYMAN ISLAND REEF site 3 (1992): 28% hard coral cover, 2.74 km from Whitsundays - Butterfly Bay (Hook Island)
- AIMS LTMP — HAYMAN ISLAND REEF site 3 (1993): 35% hard coral cover, 2.74 km from Whitsundays - Butterfly Bay (Hook Island)
- AIMS LTMP — HAYMAN ISLAND REEF site 3 (1994): 34% hard coral cover, 2.74 km from Whitsundays - Butterfly Bay (Hook Island)
- AIMS LTMP — HAYMAN ISLAND REEF site 3 (1995): 39% hard coral cover, 2.74 km from Whitsundays - Butterfly Bay (Hook Island)
- AIMS LTMP — HAYMAN ISLAND REEF site 3 (1996): 35% hard coral cover, 2.74 km from Whitsundays - Butterfly Bay (Hook Island)
- AIMS LTMP — HAYMAN ISLAND REEF site 3 (1997): 39% hard coral cover, 2.74 km from Whitsundays - Butterfly Bay (Hook Island)
- AIMS LTMP — HAYMAN ISLAND REEF site 3 (1998): 33% hard coral cover, 2.74 km from Whitsundays - Butterfly Bay (Hook Island)
- AIMS LTMP — HAYMAN ISLAND REEF site 3 (1999): 41% hard coral cover, 2.74 km from Whitsundays - Butterfly Bay (Hook Island)
- AIMS LTMP — HAYMAN ISLAND REEF site 3 (2000): 38% hard coral cover, 2.74 km from Whitsundays - Butterfly Bay (Hook Island)
- AIMS LTMP — HAYMAN ISLAND REEF site 3 (2001): 40% hard coral cover, 2.74 km from Whitsundays - Butterfly Bay (Hook Island)
- AIMS LTMP — HAYMAN ISLAND REEF site 3 (2002): 39% hard coral cover, 2.74 km from Whitsundays - Butterfly Bay (Hook Island)
- AIMS LTMP — HAYMAN ISLAND REEF site 3 (2004): 38% hard coral cover, 2.74 km from Whitsundays - Butterfly Bay (Hook Island)
- AIMS LTMP — HAYMAN ISLAND REEF site 3 (2005): 36% hard coral cover, 2.74 km from Whitsundays - Butterfly Bay (Hook Island)
- AIMS LTMP — HAYMAN ISLAND REEF site 3 (2007): 44% hard coral cover, 2.74 km from Whitsundays - Butterfly Bay (Hook Island)
- AIMS LTMP — HAYMAN ISLAND REEF site 3 (2009): 37% hard coral cover, 2.74 km from Whitsundays - Butterfly Bay (Hook Island)
- AIMS LTMP — HAYMAN ISLAND REEF site 3 (2011): 21% hard coral cover, 2.74 km from Whitsundays - Butterfly Bay (Hook Island)
- AIMS LTMP — HAYMAN ISLAND REEF site 3 (2013): 28% hard coral cover, 2.74 km from Whitsundays - Butterfly Bay (Hook Island)
- AIMS LTMP — HAYMAN ISLAND REEF site 3 (2015): 24% hard coral cover, 2.74 km from Whitsundays - Butterfly Bay (Hook Island)
- AIMS LTMP — HAYMAN ISLAND REEF site 3 (2017): 36% hard coral cover, 2.74 km from Whitsundays - Butterfly Bay (Hook Island)
- AIMS LTMP — HAYMAN ISLAND REEF site 3 (2019): 6.9% hard coral cover, 2.74 km from Whitsundays - Butterfly Bay (Hook Island)
- AIMS LTMP — HAYMAN ISLAND REEF site 3 (2021): 6.3% hard coral cover, 2.74 km from Whitsundays - Butterfly Bay (Hook Island)
- AIMS LTMP — HAYMAN ISLAND REEF site 3 (2022): 10% hard coral cover, 2.74 km from Whitsundays - Butterfly Bay (Hook Island)
- AIMS LTMP — HAYMAN ISLAND REEF site 3 (2023): 14% hard coral cover, 2.74 km from Whitsundays - Butterfly Bay (Hook Island)
- AIMS LTMP — LANGFORD-BIRD REEF site 1 (1992): 19% hard coral cover, 3.58 km from Whitsundays - Blue Pearl Bay (Hayman Island)
- AIMS LTMP — LANGFORD-BIRD REEF site 1 (1993): 17% hard coral cover, 3.58 km from Whitsundays - Blue Pearl Bay (Hayman Island)
- AIMS LTMP — LANGFORD-BIRD REEF site 1 (1995): 20% hard coral cover, 3.58 km from Whitsundays - Blue Pearl Bay (Hayman Island)
- AIMS LTMP — LANGFORD-BIRD REEF site 1 (1996): 23% hard coral cover, 3.58 km from Whitsundays - Blue Pearl Bay (Hayman Island)
- AIMS LTMP — LANGFORD-BIRD REEF site 1 (1997): 20% hard coral cover, 3.58 km from Whitsundays - Blue Pearl Bay (Hayman Island)
- AIMS LTMP — LANGFORD-BIRD REEF site 1 (1998): 20% hard coral cover, 3.58 km from Whitsundays - Blue Pearl Bay (Hayman Island)
- AIMS LTMP — LANGFORD-BIRD REEF site 1 (1999): 20% hard coral cover, 3.58 km from Whitsundays - Blue Pearl Bay (Hayman Island)
- AIMS LTMP — LANGFORD-BIRD REEF site 1 (2000): 18% hard coral cover, 3.58 km from Whitsundays - Blue Pearl Bay (Hayman Island)
- AIMS LTMP — LANGFORD-BIRD REEF site 1 (2001): 21% hard coral cover, 3.58 km from Whitsundays - Blue Pearl Bay (Hayman Island)
- AIMS LTMP — LANGFORD-BIRD REEF site 1 (2002): 20% hard coral cover, 3.58 km from Whitsundays - Blue Pearl Bay (Hayman Island)
- AIMS LTMP — LANGFORD-BIRD REEF site 1 (2004): 21% hard coral cover, 3.58 km from Whitsundays - Blue Pearl Bay (Hayman Island)
- AIMS LTMP — LANGFORD-BIRD REEF site 1 (2005): 19% hard coral cover, 3.58 km from Whitsundays - Blue Pearl Bay (Hayman Island)
- AIMS LTMP — LANGFORD-BIRD REEF site 1 (2007): 27% hard coral cover, 3.58 km from Whitsundays - Blue Pearl Bay (Hayman Island)
- AIMS LTMP — LANGFORD-BIRD REEF site 1 (2009): 25% hard coral cover, 3.58 km from Whitsundays - Blue Pearl Bay (Hayman Island)
- AIMS LTMP — LANGFORD-BIRD REEF site 1 (2011): 28% hard coral cover, 3.58 km from Whitsundays - Blue Pearl Bay (Hayman Island)
- AIMS LTMP — LANGFORD-BIRD REEF site 1 (2013): 29% hard coral cover, 3.58 km from Whitsundays - Blue Pearl Bay (Hayman Island)
- AIMS LTMP — LANGFORD-BIRD REEF site 1 (2015): 27% hard coral cover, 3.58 km from Whitsundays - Blue Pearl Bay (Hayman Island)
- AIMS LTMP — LANGFORD-BIRD REEF site 1 (2017): 21% hard coral cover, 3.58 km from Whitsundays - Blue Pearl Bay (Hayman Island)
- AIMS LTMP — LANGFORD-BIRD REEF site 1 (2019): 10% hard coral cover, 3.58 km from Whitsundays - Blue Pearl Bay (Hayman Island)
- AIMS LTMP — LANGFORD-BIRD REEF site 1 (2021): 8.2% hard coral cover, 3.58 km from Whitsundays - Blue Pearl Bay (Hayman Island)
- AIMS LTMP — LANGFORD-BIRD REEF site 2 (1992): 16% hard coral cover, 3.73 km from Whitsundays - Blue Pearl Bay (Hayman Island)
- AIMS LTMP — LANGFORD-BIRD REEF site 2 (1993): 16% hard coral cover, 3.73 km from Whitsundays - Blue Pearl Bay (Hayman Island)
- AIMS LTMP — LANGFORD-BIRD REEF site 2 (1995): 20% hard coral cover, 3.73 km from Whitsundays - Blue Pearl Bay (Hayman Island)
- AIMS LTMP — LANGFORD-BIRD REEF site 2 (1996): 17% hard coral cover, 3.73 km from Whitsundays - Blue Pearl Bay (Hayman Island)
- AIMS LTMP — LANGFORD-BIRD REEF site 2 (1997): 17% hard coral cover, 3.73 km from Whitsundays - Blue Pearl Bay (Hayman Island)
- AIMS LTMP — LANGFORD-BIRD REEF site 2 (1998): 19% hard coral cover, 3.73 km from Whitsundays - Blue Pearl Bay (Hayman Island)
- AIMS LTMP — LANGFORD-BIRD REEF site 2 (1999): 17% hard coral cover, 3.73 km from Whitsundays - Blue Pearl Bay (Hayman Island)
- AIMS LTMP — LANGFORD-BIRD REEF site 2 (2000): 17% hard coral cover, 3.73 km from Whitsundays - Blue Pearl Bay (Hayman Island)
- AIMS LTMP — LANGFORD-BIRD REEF site 2 (2001): 21% hard coral cover, 3.73 km from Whitsundays - Blue Pearl Bay (Hayman Island)
- AIMS LTMP — LANGFORD-BIRD REEF site 2 (2002): 21% hard coral cover, 3.73 km from Whitsundays - Blue Pearl Bay (Hayman Island)
- AIMS LTMP — LANGFORD-BIRD REEF site 2 (2004): 25% hard coral cover, 3.73 km from Whitsundays - Blue Pearl Bay (Hayman Island)
- AIMS LTMP — LANGFORD-BIRD REEF site 2 (2005): 25% hard coral cover, 3.73 km from Whitsundays - Blue Pearl Bay (Hayman Island)
- AIMS LTMP — LANGFORD-BIRD REEF site 2 (2007): 28% hard coral cover, 3.73 km from Whitsundays - Blue Pearl Bay (Hayman Island)
- AIMS LTMP — LANGFORD-BIRD REEF site 2 (2009): 22% hard coral cover, 3.73 km from Whitsundays - Blue Pearl Bay (Hayman Island)
- AIMS LTMP — LANGFORD-BIRD REEF site 2 (2011): 28% hard coral cover, 3.73 km from Whitsundays - Blue Pearl Bay (Hayman Island)
- AIMS LTMP — LANGFORD-BIRD REEF site 2 (2013): 26% hard coral cover, 3.73 km from Whitsundays - Blue Pearl Bay (Hayman Island)
- AIMS LTMP — LANGFORD-BIRD REEF site 2 (2015): 32% hard coral cover, 3.73 km from Whitsundays - Blue Pearl Bay (Hayman Island)
- AIMS LTMP — LANGFORD-BIRD REEF site 2 (2017): 31% hard coral cover, 3.73 km from Whitsundays - Blue Pearl Bay (Hayman Island)
- AIMS LTMP — LANGFORD-BIRD REEF site 2 (2019): 17% hard coral cover, 3.73 km from Whitsundays - Blue Pearl Bay (Hayman Island)
- AIMS LTMP — LANGFORD-BIRD REEF site 2 (2021): 18% hard coral cover, 3.73 km from Whitsundays - Blue Pearl Bay (Hayman Island)
- AIMS LTMP — LANGFORD-BIRD REEF site 3 (1992): 14% hard coral cover, 3.95 km from Whitsundays - Blue Pearl Bay (Hayman Island)
- AIMS LTMP — LANGFORD-BIRD REEF site 3 (1993): 17% hard coral cover, 3.95 km from Whitsundays - Blue Pearl Bay (Hayman Island)
- AIMS LTMP — LANGFORD-BIRD REEF site 3 (1995): 15% hard coral cover, 3.95 km from Whitsundays - Blue Pearl Bay (Hayman Island)
- AIMS LTMP — LANGFORD-BIRD REEF site 3 (1996): 15% hard coral cover, 3.95 km from Whitsundays - Blue Pearl Bay (Hayman Island)
- AIMS LTMP — LANGFORD-BIRD REEF site 3 (1997): 13% hard coral cover, 3.95 km from Whitsundays - Blue Pearl Bay (Hayman Island)
- AIMS LTMP — LANGFORD-BIRD REEF site 3 (1998): 15% hard coral cover, 3.95 km from Whitsundays - Blue Pearl Bay (Hayman Island)
- AIMS LTMP — LANGFORD-BIRD REEF site 3 (1999): 16% hard coral cover, 3.95 km from Whitsundays - Blue Pearl Bay (Hayman Island)
- AIMS LTMP — LANGFORD-BIRD REEF site 3 (2000): 16% hard coral cover, 3.95 km from Whitsundays - Blue Pearl Bay (Hayman Island)
- AIMS LTMP — LANGFORD-BIRD REEF site 3 (2001): 23% hard coral cover, 3.95 km from Whitsundays - Blue Pearl Bay (Hayman Island)
- AIMS LTMP — LANGFORD-BIRD REEF site 3 (2002): 25% hard coral cover, 3.95 km from Whitsundays - Blue Pearl Bay (Hayman Island)
- AIMS LTMP — LANGFORD-BIRD REEF site 3 (2004): 24% hard coral cover, 3.95 km from Whitsundays - Blue Pearl Bay (Hayman Island)
- AIMS LTMP — LANGFORD-BIRD REEF site 3 (2005): 22% hard coral cover, 3.95 km from Whitsundays - Blue Pearl Bay (Hayman Island)
- AIMS LTMP — LANGFORD-BIRD REEF site 3 (2007): 28% hard coral cover, 3.95 km from Whitsundays - Blue Pearl Bay (Hayman Island)
- AIMS LTMP — LANGFORD-BIRD REEF site 3 (2009): 24% hard coral cover, 3.95 km from Whitsundays - Blue Pearl Bay (Hayman Island)
- AIMS LTMP — LANGFORD-BIRD REEF site 3 (2011): 32% hard coral cover, 3.95 km from Whitsundays - Blue Pearl Bay (Hayman Island)
- AIMS LTMP — LANGFORD-BIRD REEF site 3 (2013): 20% hard coral cover, 3.95 km from Whitsundays - Blue Pearl Bay (Hayman Island)
- AIMS LTMP — LANGFORD-BIRD REEF site 3 (2015): 17% hard coral cover, 3.95 km from Whitsundays - Blue Pearl Bay (Hayman Island)
- AIMS LTMP — LANGFORD-BIRD REEF site 3 (2017): 17% hard coral cover, 3.95 km from Whitsundays - Blue Pearl Bay (Hayman Island)
- AIMS LTMP — LANGFORD-BIRD REEF site 3 (2019): 4.6% hard coral cover, 3.95 km from Whitsundays - Blue Pearl Bay (Hayman Island)
- AIMS LTMP — LANGFORD-BIRD REEF site 3 (2021): 4.2% hard coral cover, 3.95 km from Whitsundays - Blue Pearl Bay (Hayman Island)
- AIMS LTMP — NO NAME REEF site 1 (1993): 18% hard coral cover, 1.81 km from N. GBR - Green (AUYG41)
- AIMS LTMP — NO NAME REEF site 1 (1994): 26% hard coral cover, 1.81 km from N. GBR - Green (AUYG41)
- AIMS LTMP — NO NAME REEF site 1 (1995): 39% hard coral cover, 1.81 km from N. GBR - Green (AUYG41)
- AIMS LTMP — NO NAME REEF site 1 (1996): 45% hard coral cover, 1.81 km from N. GBR - Green (AUYG41)
- AIMS LTMP — NO NAME REEF site 1 (1997): 52% hard coral cover, 1.81 km from N. GBR - Green (AUYG41)
- AIMS LTMP — NO NAME REEF site 1 (1998): 66% hard coral cover, 1.81 km from N. GBR - Green (AUYG41)
- AIMS LTMP — NO NAME REEF site 1 (1999): 58% hard coral cover, 1.81 km from N. GBR - Green (AUYG41)
- AIMS LTMP — NO NAME REEF site 1 (2000): 55% hard coral cover, 1.81 km from N. GBR - Green (AUYG41)
- AIMS LTMP — NO NAME REEF site 1 (2001): 63% hard coral cover, 1.81 km from N. GBR - Green (AUYG41)
- AIMS LTMP — NO NAME REEF site 1 (2002): 58% hard coral cover, 1.81 km from N. GBR - Green (AUYG41)
- AIMS LTMP — NO NAME REEF site 1 (2003): 51% hard coral cover, 1.81 km from N. GBR - Green (AUYG41)
- AIMS LTMP — NO NAME REEF site 1 (2004): 40% hard coral cover, 1.81 km from N. GBR - Green (AUYG41)
- AIMS LTMP — NO NAME REEF site 1 (2006): 21% hard coral cover, 1.81 km from N. GBR - Green (AUYG41)
- AIMS LTMP — NO NAME REEF site 1 (2008): 37% hard coral cover, 1.81 km from N. GBR - Green (AUYG41)
- AIMS LTMP — NO NAME REEF site 1 (2010): 37% hard coral cover, 1.81 km from N. GBR - Green (AUYG41)
- AIMS LTMP — NO NAME REEF site 1 (2012): 43% hard coral cover, 1.81 km from N. GBR - Green (AUYG41)
- AIMS LTMP — NO NAME REEF site 1 (2014): 12% hard coral cover, 1.81 km from N. GBR - Green (AUYG41)
- AIMS LTMP — NO NAME REEF site 1 (2016): 8.2% hard coral cover, 1.81 km from N. GBR - Green (AUYG41)
- AIMS LTMP — NO NAME REEF site 1 (2018): 11% hard coral cover, 1.81 km from N. GBR - Green (AUYG41)
- AIMS LTMP — NO NAME REEF site 1 (2020): 20% hard coral cover, 1.81 km from N. GBR - Green (AUYG41)
- AIMS LTMP — NO NAME REEF site 1 (2021): 29% hard coral cover, 1.81 km from N. GBR - Green (AUYG41)
- AIMS LTMP — NO NAME REEF site 1 (2022): 33% hard coral cover, 1.81 km from N. GBR - Green (AUYG41)
- AIMS LTMP — NO NAME REEF site 1 (2022): 37% hard coral cover, 1.81 km from N. GBR - Green (AUYG41)
- AIMS LTMP — NO NAME REEF site 2 (1993): 18% hard coral cover, 2.25 km from N. GBR - Green (AUYG41)
- AIMS LTMP — NO NAME REEF site 2 (1994): 26% hard coral cover, 2.25 km from N. GBR - Green (AUYG41)
- AIMS LTMP — NO NAME REEF site 2 (1995): 39% hard coral cover, 2.25 km from N. GBR - Green (AUYG41)
- AIMS LTMP — NO NAME REEF site 2 (1996): 41% hard coral cover, 2.25 km from N. GBR - Green (AUYG41)
- AIMS LTMP — NO NAME REEF site 2 (1997): 50% hard coral cover, 2.25 km from N. GBR - Green (AUYG41)
- AIMS LTMP — NO NAME REEF site 2 (1998): 56% hard coral cover, 2.25 km from N. GBR - Green (AUYG41)
- AIMS LTMP — NO NAME REEF site 2 (1999): 46% hard coral cover, 2.25 km from N. GBR - Green (AUYG41)
- AIMS LTMP — NO NAME REEF site 2 (2000): 48% hard coral cover, 2.25 km from N. GBR - Green (AUYG41)
- AIMS LTMP — NO NAME REEF site 2 (2001): 56% hard coral cover, 2.25 km from N. GBR - Green (AUYG41)
- AIMS LTMP — NO NAME REEF site 2 (2002): 53% hard coral cover, 2.25 km from N. GBR - Green (AUYG41)
- AIMS LTMP — NO NAME REEF site 2 (2003): 54% hard coral cover, 2.25 km from N. GBR - Green (AUYG41)
- AIMS LTMP — NO NAME REEF site 2 (2004): 35% hard coral cover, 2.25 km from N. GBR - Green (AUYG41)
- AIMS LTMP — NO NAME REEF site 2 (2008): 29% hard coral cover, 2.25 km from N. GBR - Green (AUYG41)
- AIMS LTMP — NO NAME REEF site 2 (2010): 37% hard coral cover, 2.25 km from N. GBR - Green (AUYG41)
- AIMS LTMP — NO NAME REEF site 2 (2012): 29% hard coral cover, 2.25 km from N. GBR - Green (AUYG41)
- AIMS LTMP — NO NAME REEF site 2 (2014): 24% hard coral cover, 2.25 km from N. GBR - Green (AUYG41)
- AIMS LTMP — NO NAME REEF site 2 (2016): 13% hard coral cover, 2.25 km from N. GBR - Green (AUYG41)
- AIMS LTMP — NO NAME REEF site 2 (2018): 14% hard coral cover, 2.25 km from N. GBR - Green (AUYG41)
- AIMS LTMP — NO NAME REEF site 2 (2020): 26% hard coral cover, 2.25 km from N. GBR - Green (AUYG41)
- AIMS LTMP — NO NAME REEF site 2 (2021): 31% hard coral cover, 2.25 km from N. GBR - Green (AUYG41)
- AIMS LTMP — NO NAME REEF site 2 (2022): 31% hard coral cover, 2.25 km from N. GBR - Green (AUYG41)
- AIMS LTMP — NO NAME REEF site 3 (1993): 27% hard coral cover, 2.65 km from N. GBR - Green (AUYG41)
- AIMS LTMP — NO NAME REEF site 3 (1994): 34% hard coral cover, 2.65 km from N. GBR - Green (AUYG41)
- AIMS LTMP — NO NAME REEF site 3 (1995): 43% hard coral cover, 2.65 km from N. GBR - Green (AUYG41)
- AIMS LTMP — NO NAME REEF site 3 (1996): 46% hard coral cover, 2.65 km from N. GBR - Green (AUYG41)
- AIMS LTMP — NO NAME REEF site 3 (1997): 52% hard coral cover, 2.65 km from N. GBR - Green (AUYG41)
- AIMS LTMP — NO NAME REEF site 3 (1998): 57% hard coral cover, 2.65 km from N. GBR - Green (AUYG41)
- AIMS LTMP — NO NAME REEF site 3 (1999): 51% hard coral cover, 2.65 km from N. GBR - Green (AUYG41)
- AIMS LTMP — NO NAME REEF site 3 (2000): 53% hard coral cover, 2.65 km from N. GBR - Green (AUYG41)
- AIMS LTMP — NO NAME REEF site 3 (2001): 51% hard coral cover, 2.65 km from N. GBR - Green (AUYG41)
- AIMS LTMP — NO NAME REEF site 3 (2002): 45% hard coral cover, 2.65 km from N. GBR - Green (AUYG41)
- AIMS LTMP — NO NAME REEF site 3 (2003): 48% hard coral cover, 2.65 km from N. GBR - Green (AUYG41)
- AIMS LTMP — NO NAME REEF site 3 (2004): 38% hard coral cover, 2.65 km from N. GBR - Green (AUYG41)
- AIMS LTMP — NO NAME REEF site 3 (2006): 27% hard coral cover, 2.65 km from N. GBR - Green (AUYG41)
- AIMS LTMP — NO NAME REEF site 3 (2008): 41% hard coral cover, 2.65 km from N. GBR - Green (AUYG41)
- AIMS LTMP — NO NAME REEF site 3 (2010): 41% hard coral cover, 2.65 km from N. GBR - Green (AUYG41)
- AIMS LTMP — NO NAME REEF site 3 (2012): 24% hard coral cover, 2.65 km from N. GBR - Green (AUYG41)
- AIMS LTMP — NO NAME REEF site 3 (2014): 26% hard coral cover, 2.65 km from N. GBR - Green (AUYG41)
- AIMS LTMP — NO NAME REEF site 3 (2016): 9.2% hard coral cover, 2.65 km from N. GBR - Green (AUYG41)
- AIMS LTMP — NO NAME REEF site 3 (2018): 14% hard coral cover, 2.65 km from N. GBR - Green (AUYG41)
- AIMS LTMP — NO NAME REEF site 3 (2020): 25% hard coral cover, 2.65 km from N. GBR - Green (AUYG41)
- AIMS LTMP — NO NAME REEF site 3 (2021): 29% hard coral cover, 2.65 km from N. GBR - Green (AUYG41)
- AIMS LTMP — NO NAME REEF site 3 (2022): 32% hard coral cover, 2.65 km from N. GBR - Green (AUYG41)
- AIMS LTMP — YONGE REEF site 1 (1993): 15% hard coral cover, 1.03 km from N. GBR - Pink (AUCT50)
- AIMS LTMP — YONGE REEF site 1 (1994): 23% hard coral cover, 1.03 km from N. GBR - Pink (AUCT50)
- AIMS LTMP — YONGE REEF site 1 (1995): 28% hard coral cover, 1.03 km from N. GBR - Pink (AUCT50)
- AIMS LTMP — YONGE REEF site 1 (1996): 36% hard coral cover, 1.03 km from N. GBR - Pink (AUCT50)
- AIMS LTMP — YONGE REEF site 1 (1997): 47% hard coral cover, 1.03 km from N. GBR - Pink (AUCT50)
- AIMS LTMP — YONGE REEF site 1 (1998): 59% hard coral cover, 1.03 km from N. GBR - Pink (AUCT50)
- AIMS LTMP — YONGE REEF site 1 (1999): 58% hard coral cover, 1.03 km from N. GBR - Pink (AUCT50)
- AIMS LTMP — YONGE REEF site 1 (2000): 64% hard coral cover, 1.03 km from N. GBR - Pink (AUCT50)
- AIMS LTMP — YONGE REEF site 1 (2001): 66% hard coral cover, 1.03 km from N. GBR - Pink (AUCT50)
- AIMS LTMP — YONGE REEF site 1 (2002): 58% hard coral cover, 1.03 km from N. GBR - Pink (AUCT50)
- AIMS LTMP — YONGE REEF site 1 (2003): 62% hard coral cover, 1.03 km from N. GBR - Pink (AUCT50)
- AIMS LTMP — YONGE REEF site 1 (2004): 51% hard coral cover, 1.03 km from N. GBR - Pink (AUCT50)
- AIMS LTMP — YONGE REEF site 1 (2006): 23% hard coral cover, 1.03 km from N. GBR - Pink (AUCT50)
- AIMS LTMP — YONGE REEF site 1 (2008): 31% hard coral cover, 1.03 km from N. GBR - Pink (AUCT50)
- AIMS LTMP — YONGE REEF site 1 (2010): 44% hard coral cover, 1.03 km from N. GBR - Pink (AUCT50)
- AIMS LTMP — YONGE REEF site 1 (2012): 24% hard coral cover, 1.03 km from N. GBR - Pink (AUCT50)
- AIMS LTMP — YONGE REEF site 1 (2014): 23% hard coral cover, 1.03 km from N. GBR - Pink (AUCT50)
- AIMS LTMP — YONGE REEF site 1 (2016): 9.6% hard coral cover, 1.03 km from N. GBR - Pink (AUCT50)
- AIMS LTMP — YONGE REEF site 1 (2018): 18% hard coral cover, 1.03 km from N. GBR - Pink (AUCT50)
- AIMS LTMP — YONGE REEF site 1 (2020): 25% hard coral cover, 1.03 km from N. GBR - Pink (AUCT50)
- AIMS LTMP — YONGE REEF site 1 (2021): 29% hard coral cover, 1.03 km from N. GBR - Pink (AUCT50)
- AIMS LTMP — YONGE REEF site 1 (2022): 34% hard coral cover, 1.03 km from N. GBR - Pink (AUCT50)
- AIMS LTMP — YONGE REEF site 1 (2022): 37% hard coral cover, 1.03 km from N. GBR - Pink (AUCT50)
- AIMS LTMP — YONGE REEF site 2 (1993): 7.6% hard coral cover, 1.38 km from N. GBR - Pink (AUCT50)
- AIMS LTMP — YONGE REEF site 2 (1994): 16% hard coral cover, 1.38 km from N. GBR - Pink (AUCT50)
- AIMS LTMP — YONGE REEF site 2 (1995): 25% hard coral cover, 1.38 km from N. GBR - Pink (AUCT50)
- AIMS LTMP — YONGE REEF site 2 (1996): 34% hard coral cover, 1.38 km from N. GBR - Pink (AUCT50)
- AIMS LTMP — YONGE REEF site 2 (1997): 45% hard coral cover, 1.38 km from N. GBR - Pink (AUCT50)
- AIMS LTMP — YONGE REEF site 2 (1998): 60% hard coral cover, 1.38 km from N. GBR - Pink (AUCT50)
- AIMS LTMP — YONGE REEF site 2 (1999): 58% hard coral cover, 1.38 km from N. GBR - Pink (AUCT50)
- AIMS LTMP — YONGE REEF site 2 (2000): 58% hard coral cover, 1.38 km from N. GBR - Pink (AUCT50)
- AIMS LTMP — YONGE REEF site 2 (2001): 63% hard coral cover, 1.38 km from N. GBR - Pink (AUCT50)
- AIMS LTMP — YONGE REEF site 2 (2002): 62% hard coral cover, 1.38 km from N. GBR - Pink (AUCT50)
- AIMS LTMP — YONGE REEF site 2 (2003): 64% hard coral cover, 1.38 km from N. GBR - Pink (AUCT50)
- AIMS LTMP — YONGE REEF site 2 (2004): 50% hard coral cover, 1.38 km from N. GBR - Pink (AUCT50)
- AIMS LTMP — YONGE REEF site 2 (2006): 23% hard coral cover, 1.38 km from N. GBR - Pink (AUCT50)
- AIMS LTMP — YONGE REEF site 2 (2008): 31% hard coral cover, 1.38 km from N. GBR - Pink (AUCT50)
- AIMS LTMP — YONGE REEF site 2 (2010): 36% hard coral cover, 1.38 km from N. GBR - Pink (AUCT50)
- AIMS LTMP — YONGE REEF site 2 (2012): 17% hard coral cover, 1.38 km from N. GBR - Pink (AUCT50)
- AIMS LTMP — YONGE REEF site 2 (2014): 18% hard coral cover, 1.38 km from N. GBR - Pink (AUCT50)
- AIMS LTMP — YONGE REEF site 2 (2016): 8.2% hard coral cover, 1.38 km from N. GBR - Pink (AUCT50)
- AIMS LTMP — YONGE REEF site 2 (2018): 13% hard coral cover, 1.38 km from N. GBR - Pink (AUCT50)
- AIMS LTMP — YONGE REEF site 2 (2020): 22% hard coral cover, 1.38 km from N. GBR - Pink (AUCT50)
- AIMS LTMP — YONGE REEF site 2 (2021): 30% hard coral cover, 1.38 km from N. GBR - Pink (AUCT50)
- AIMS LTMP — YONGE REEF site 2 (2022): 31% hard coral cover, 1.38 km from N. GBR - Pink (AUCT50)
- AIMS LTMP — YONGE REEF site 2 (2022): 34% hard coral cover, 1.38 km from N. GBR - Pink (AUCT50)
- AIMS LTMP — YONGE REEF site 3 (1993): 12% hard coral cover, 0.84 km from N. GBR - Green (AUYG38)
- AIMS LTMP — YONGE REEF site 3 (1994): 20% hard coral cover, 0.84 km from N. GBR - Green (AUYG38)
- AIMS LTMP — YONGE REEF site 3 (1995): 28% hard coral cover, 0.84 km from N. GBR - Green (AUYG38)
- AIMS LTMP — YONGE REEF site 3 (1996): 29% hard coral cover, 0.84 km from N. GBR - Green (AUYG38)
- AIMS LTMP — YONGE REEF site 3 (1997): 38% hard coral cover, 0.84 km from N. GBR - Green (AUYG38)
- AIMS LTMP — YONGE REEF site 3 (1998): 44% hard coral cover, 0.84 km from N. GBR - Green (AUYG38)
- AIMS LTMP — YONGE REEF site 3 (1999): 47% hard coral cover, 0.84 km from N. GBR - Green (AUYG38)
- AIMS LTMP — YONGE REEF site 3 (2000): 51% hard coral cover, 0.84 km from N. GBR - Green (AUYG38)
- AIMS LTMP — YONGE REEF site 3 (2001): 55% hard coral cover, 0.84 km from N. GBR - Green (AUYG38)
- AIMS LTMP — YONGE REEF site 3 (2002): 51% hard coral cover, 0.84 km from N. GBR - Green (AUYG38)
- AIMS LTMP — YONGE REEF site 3 (2003): 51% hard coral cover, 0.84 km from N. GBR - Green (AUYG38)
- AIMS LTMP — YONGE REEF site 3 (2004): 44% hard coral cover, 0.84 km from N. GBR - Green (AUYG38)
- AIMS LTMP — YONGE REEF site 3 (2006): 27% hard coral cover, 0.84 km from N. GBR - Green (AUYG38)
- AIMS LTMP — YONGE REEF site 3 (2008): 38% hard coral cover, 0.84 km from N. GBR - Green (AUYG38)
- AIMS LTMP — YONGE REEF site 3 (2010): 43% hard coral cover, 0.84 km from N. GBR - Green (AUYG38)
- AIMS LTMP — YONGE REEF site 3 (2012): 25% hard coral cover, 0.84 km from N. GBR - Green (AUYG38)
- AIMS LTMP — YONGE REEF site 3 (2014): 13% hard coral cover, 0.84 km from N. GBR - Green (AUYG38)
- AIMS LTMP — YONGE REEF site 3 (2016): 3.9% hard coral cover, 0.84 km from N. GBR - Green (AUYG38)
- AIMS LTMP — YONGE REEF site 3 (2018): 7.2% hard coral cover, 0.84 km from N. GBR - Green (AUYG38)
- AIMS LTMP — YONGE REEF site 3 (2020): 17% hard coral cover, 0.84 km from N. GBR - Green (AUYG38)
- AIMS LTMP — YONGE REEF site 3 (2021): 31% hard coral cover, 0.84 km from N. GBR - Green (AUYG38)
- AIMS LTMP — YONGE REEF site 3 (2022): 29% hard coral cover, 0.84 km from N. GBR - Green (AUYG38)
- AIMS LTMP — YONGE REEF site 3 (2022): 31% hard coral cover, 0.84 km from N. GBR - Green (AUYG38)
- AIMS MMP — Border (5 m) (1994): 25% hard coral cover, 1.14 km from Whitsundays - Cateran Bay (Border Island)
- AIMS MMP — Border (5 m) (1995): 26% hard coral cover, 1.14 km from Whitsundays - Cateran Bay (Border Island)
- AIMS MMP — Border (5 m) (1996): 27% hard coral cover, 1.14 km from Whitsundays - Cateran Bay (Border Island)
- AIMS MMP — Border (5 m) (1997): 27% hard coral cover, 1.14 km from Whitsundays - Cateran Bay (Border Island)
- AIMS MMP — Border (5 m) (1998): 28% hard coral cover, 1.14 km from Whitsundays - Cateran Bay (Border Island)
- AIMS MMP — Border (5 m) (1999): 30% hard coral cover, 1.14 km from Whitsundays - Cateran Bay (Border Island)
- AIMS MMP — Border (5 m) (2000): 28% hard coral cover, 1.14 km from Whitsundays - Cateran Bay (Border Island)
- AIMS MMP — Border (5 m) (2001): 25% hard coral cover, 1.14 km from Whitsundays - Cateran Bay (Border Island)
- AIMS MMP — Border (5 m) (2002): 31% hard coral cover, 1.14 km from Whitsundays - Cateran Bay (Border Island)
- AIMS MMP — Border (5 m) (2003): 28% hard coral cover, 1.14 km from Whitsundays - Cateran Bay (Border Island)
- AIMS MMP — Border (5 m) (2004): 29% hard coral cover, 1.14 km from Whitsundays - Cateran Bay (Border Island)
- AIMS MMP — Border (5 m) (2005): 27% hard coral cover, 1.14 km from Whitsundays - Cateran Bay (Border Island)
- AIMS MMP — Border (5 m) (2007): 26% hard coral cover, 1.14 km from Whitsundays - Cateran Bay (Border Island)
- AIMS MMP — Border (5 m) (2009): 27% hard coral cover, 1.14 km from Whitsundays - Cateran Bay (Border Island)
- AIMS MMP — Border (5 m) (2011): 31% hard coral cover, 1.14 km from Whitsundays - Cateran Bay (Border Island)
- AIMS MMP — Border (5 m) (2013): 31% hard coral cover, 1.14 km from Whitsundays - Cateran Bay (Border Island)
- AIMS MMP — Border (5 m) (2015): 33% hard coral cover, 1.14 km from Whitsundays - Cateran Bay (Border Island)
- AIMS MMP — Border (5 m) (2017): 35% hard coral cover, 1.14 km from Whitsundays - Cateran Bay (Border Island)
- AIMS MMP — Border (5 m) (2019): 20% hard coral cover, 1.14 km from Whitsundays - Cateran Bay (Border Island)
- AIMS MMP — Border (5 m) (2021): 20% hard coral cover, 1.14 km from Whitsundays - Cateran Bay (Border Island)
- AIMS MMP — Border (5 m) (2022): 17% hard coral cover, 1.14 km from Whitsundays - Cateran Bay (Border Island)
- AIMS MMP — Border (5 m) (2023): 19% hard coral cover, 1.14 km from Whitsundays - Cateran Bay (Border Island)
- AIMS MMP — Hayman (5 m) (1993): 43% hard coral cover, 2.38 km from Whitsundays - Blue Pearl Bay (Hayman Island)
- AIMS MMP — Hayman (5 m) (1994): 40% hard coral cover, 2.38 km from Whitsundays - Blue Pearl Bay (Hayman Island)
- AIMS MMP — Hayman (5 m) (1995): 44% hard coral cover, 2.38 km from Whitsundays - Blue Pearl Bay (Hayman Island)
- AIMS MMP — Hayman (5 m) (1996): 43% hard coral cover, 2.38 km from Whitsundays - Blue Pearl Bay (Hayman Island)
- AIMS MMP — Hayman (5 m) (1997): 39% hard coral cover, 2.38 km from Whitsundays - Blue Pearl Bay (Hayman Island)
- AIMS MMP — Hayman (5 m) (1998): 38% hard coral cover, 2.38 km from Whitsundays - Blue Pearl Bay (Hayman Island)
- AIMS MMP — Hayman (5 m) (1999): 41% hard coral cover, 2.38 km from Whitsundays - Blue Pearl Bay (Hayman Island)
- AIMS MMP — Hayman (5 m) (2000): 42% hard coral cover, 2.38 km from Whitsundays - Blue Pearl Bay (Hayman Island)
- AIMS MMP — Hayman (5 m) (2001): 44% hard coral cover, 2.38 km from Whitsundays - Blue Pearl Bay (Hayman Island)
- AIMS MMP — Hayman (5 m) (2002): 46% hard coral cover, 2.38 km from Whitsundays - Blue Pearl Bay (Hayman Island)
- AIMS MMP — Hayman (5 m) (2003): 44% hard coral cover, 2.38 km from Whitsundays - Blue Pearl Bay (Hayman Island)
- AIMS MMP — Hayman (5 m) (2004): 45% hard coral cover, 2.38 km from Whitsundays - Blue Pearl Bay (Hayman Island)
- AIMS MMP — Hayman (5 m) (2005): 46% hard coral cover, 2.38 km from Whitsundays - Blue Pearl Bay (Hayman Island)
- AIMS MMP — Hayman (5 m) (2007): 51% hard coral cover, 2.38 km from Whitsundays - Blue Pearl Bay (Hayman Island)
- AIMS MMP — Hayman (5 m) (2009): 46% hard coral cover, 2.38 km from Whitsundays - Blue Pearl Bay (Hayman Island)
- AIMS MMP — Hayman (5 m) (2011): 31% hard coral cover, 2.38 km from Whitsundays - Blue Pearl Bay (Hayman Island)
- AIMS MMP — Hayman (5 m) (2013): 33% hard coral cover, 2.38 km from Whitsundays - Blue Pearl Bay (Hayman Island)
- AIMS MMP — Hayman (5 m) (2015): 35% hard coral cover, 2.38 km from Whitsundays - Blue Pearl Bay (Hayman Island)
- AIMS MMP — Hayman (5 m) (2017): 38% hard coral cover, 2.38 km from Whitsundays - Blue Pearl Bay (Hayman Island)
- AIMS MMP — Hayman (5 m) (2019): 5.6% hard coral cover, 2.38 km from Whitsundays - Blue Pearl Bay (Hayman Island)
- AIMS MMP — Hayman (5 m) (2021): 7.6% hard coral cover, 2.38 km from Whitsundays - Blue Pearl Bay (Hayman Island)
- AIMS MMP — Hayman (5 m) (2022): 9.7% hard coral cover, 2.38 km from Whitsundays - Blue Pearl Bay (Hayman Island)
- AIMS MMP — Hayman (5 m) (2023): 14% hard coral cover, 2.38 km from Whitsundays - Blue Pearl Bay (Hayman Island)
- AIMS MMP — Hayman (5 m) (2024): 17% hard coral cover, 2.38 km from Whitsundays - Blue Pearl Bay (Hayman Island)
- AIMS MMP — Langford (5 m) (1993): 17% hard coral cover, 3.58 km from Whitsundays - Blue Pearl Bay (Hayman Island)
- AIMS MMP — Langford (5 m) (1995): 18% hard coral cover, 3.58 km from Whitsundays - Blue Pearl Bay (Hayman Island)
- AIMS MMP — Langford (5 m) (1996): 19% hard coral cover, 3.58 km from Whitsundays - Blue Pearl Bay (Hayman Island)
- AIMS MMP — Langford (5 m) (1997): 17% hard coral cover, 3.58 km from Whitsundays - Blue Pearl Bay (Hayman Island)
- AIMS MMP — Langford (5 m) (1998): 18% hard coral cover, 3.58 km from Whitsundays - Blue Pearl Bay (Hayman Island)
- AIMS MMP — Langford (5 m) (1999): 18% hard coral cover, 3.58 km from Whitsundays - Blue Pearl Bay (Hayman Island)
- AIMS MMP — Langford (5 m) (2000): 17% hard coral cover, 3.58 km from Whitsundays - Blue Pearl Bay (Hayman Island)
- AIMS MMP — Langford (5 m) (2001): 21% hard coral cover, 3.58 km from Whitsundays - Blue Pearl Bay (Hayman Island)
- AIMS MMP — Langford (5 m) (2002): 23% hard coral cover, 3.58 km from Whitsundays - Blue Pearl Bay (Hayman Island)
- AIMS MMP — Langford (5 m) (2003): 22% hard coral cover, 3.58 km from Whitsundays - Blue Pearl Bay (Hayman Island)
- AIMS MMP — Langford (5 m) (2004): 23% hard coral cover, 3.58 km from Whitsundays - Blue Pearl Bay (Hayman Island)
- AIMS MMP — Langford (5 m) (2005): 22% hard coral cover, 3.58 km from Whitsundays - Blue Pearl Bay (Hayman Island)
- AIMS MMP — Langford (5 m) (2007): 27% hard coral cover, 3.58 km from Whitsundays - Blue Pearl Bay (Hayman Island)
- AIMS MMP — Langford (5 m) (2009): 24% hard coral cover, 3.58 km from Whitsundays - Blue Pearl Bay (Hayman Island)
- AIMS MMP — Langford (5 m) (2011): 29% hard coral cover, 3.58 km from Whitsundays - Blue Pearl Bay (Hayman Island)
- AIMS MMP — Langford (5 m) (2013): 25% hard coral cover, 3.58 km from Whitsundays - Blue Pearl Bay (Hayman Island)
- AIMS MMP — Langford (5 m) (2015): 25% hard coral cover, 3.58 km from Whitsundays - Blue Pearl Bay (Hayman Island)
- AIMS MMP — Langford (5 m) (2017): 23% hard coral cover, 3.58 km from Whitsundays - Blue Pearl Bay (Hayman Island)
- AIMS MMP — Langford (5 m) (2019): 10% hard coral cover, 3.58 km from Whitsundays - Blue Pearl Bay (Hayman Island)
- AIMS MMP — Langford (5 m) (2021): 10% hard coral cover, 3.58 km from Whitsundays - Blue Pearl Bay (Hayman Island)
- AIMS manta tow — 15034S (1996): 26% hard coral cover, 2.00 km from N. GBR - Blue (AUR516)
- AIMS manta tow — 15034S (1999): 36% hard coral cover, 2.00 km from N. GBR - Blue (AUR516)
- AIMS manta tow — 15034S (2002): 25% hard coral cover, 2.00 km from N. GBR - Blue (AUR516)
- AIMS manta tow — 15034S (2005): 26% hard coral cover, 2.00 km from N. GBR - Blue (AUR516)
- AIMS manta tow — 15034S (2010): 22% hard coral cover, 2.00 km from N. GBR - Blue (AUR516)
- AIMS manta tow — 15034S (2013): 24% hard coral cover, 2.00 km from N. GBR - Blue (AUR516)
- AIMS manta tow — 15034S (2017): 14% hard coral cover, 2.00 km from N. GBR - Blue (AUR516)
- AIMS manta tow — 15034S (2021): 35% hard coral cover, 2.00 km from N. GBR - Blue (AUR516)
- AIMS manta tow — 15037S (2009): 26% hard coral cover, 3.10 km from N. GBR - Blue (AUR516)
- AIMS manta tow — BORDER ISLAND REEF (NO 1) (1995): 18% hard coral cover, 1.29 km from Whitsundays - Cateran Bay (Border Island)
- AIMS manta tow — BORDER ISLAND REEF (NO 1) (1996): 17% hard coral cover, 1.29 km from Whitsundays - Cateran Bay (Border Island)
- AIMS manta tow — BORDER ISLAND REEF (NO 1) (1997): 15% hard coral cover, 1.29 km from Whitsundays - Cateran Bay (Border Island)
- AIMS manta tow — BORDER ISLAND REEF (NO 1) (1998): 15% hard coral cover, 1.29 km from Whitsundays - Cateran Bay (Border Island)
- AIMS manta tow — BORDER ISLAND REEF (NO 1) (2000): 23% hard coral cover, 1.29 km from Whitsundays - Cateran Bay (Border Island)
- AIMS manta tow — BORDER ISLAND REEF (NO 1) (2001): 20% hard coral cover, 1.29 km from Whitsundays - Cateran Bay (Border Island)
- AIMS manta tow — BORDER ISLAND REEF (NO 1) (2003): 19% hard coral cover, 1.29 km from Whitsundays - Cateran Bay (Border Island)
- AIMS manta tow — BORDER ISLAND REEF (NO 1) (2004): 17% hard coral cover, 1.29 km from Whitsundays - Cateran Bay (Border Island)
- AIMS manta tow — BORDER ISLAND REEF (NO 1) (2013): 14% hard coral cover, 1.29 km from Whitsundays - Cateran Bay (Border Island)
- AIMS manta tow — BORDER ISLAND REEF (NO 1) (2017): 18% hard coral cover, 1.29 km from Whitsundays - Cateran Bay (Border Island)
- AIMS manta tow — BORDER ISLAND REEF (NO 1) (2021): 6.5% hard coral cover, 1.29 km from Whitsundays - Cateran Bay (Border Island)
- AIMS manta tow — BORDER ISLAND REEF (NO 1) (2022): 11% hard coral cover, 1.29 km from Whitsundays - Cateran Bay (Border Island)
- AIMS manta tow — BORDER ISLAND REEF (NO 1) (2023): 10% hard coral cover, 1.29 km from Whitsundays - Cateran Bay (Border Island)
- AIMS manta tow — BORDER ISLAND REEF (NO 1) (2023): 16% hard coral cover, 1.29 km from Whitsundays - Cateran Bay (Border Island)
- AIMS manta tow — CARTER REEF (1993): 16% hard coral cover, 0.90 km from N. GBR - Pink (AUCT49)
- AIMS manta tow — CARTER REEF (1995): 18% hard coral cover, 0.90 km from N. GBR - Pink (AUCT49)
- AIMS manta tow — CARTER REEF (1996): 17% hard coral cover, 0.90 km from N. GBR - Pink (AUCT49)
- AIMS manta tow — CARTER REEF (1998): 18% hard coral cover, 0.90 km from N. GBR - Pink (AUCT49)
- AIMS manta tow — CARTER REEF (1999): 30% hard coral cover, 0.90 km from N. GBR - Pink (AUCT49)
- AIMS manta tow — CARTER REEF (2000): 30% hard coral cover, 0.90 km from N. GBR - Pink (AUCT49)
- AIMS manta tow — CARTER REEF (2001): 31% hard coral cover, 0.90 km from N. GBR - Pink (AUCT49)
- AIMS manta tow — CARTER REEF (2002): 35% hard coral cover, 0.90 km from N. GBR - Pink (AUCT49)
- AIMS manta tow — CARTER REEF (2003): 33% hard coral cover, 0.90 km from N. GBR - Pink (AUCT49)
- AIMS manta tow — CARTER REEF (2004): 21% hard coral cover, 0.90 km from N. GBR - Pink (AUCT49)
- AIMS manta tow — CARTER REEF (2005): 29% hard coral cover, 0.90 km from N. GBR - Pink (AUCT49)
- AIMS manta tow — CARTER REEF (2006): 14% hard coral cover, 0.90 km from N. GBR - Pink (AUCT49)
- AIMS manta tow — CARTER REEF (2007): 14% hard coral cover, 0.90 km from N. GBR - Pink (AUCT49)
- AIMS manta tow — CARTER REEF (2008): 14% hard coral cover, 0.90 km from N. GBR - Pink (AUCT49)
- AIMS manta tow — CARTER REEF (2009): 15% hard coral cover, 0.90 km from N. GBR - Pink (AUCT49)
- AIMS manta tow — CARTER REEF (2011): 21% hard coral cover, 0.90 km from N. GBR - Pink (AUCT49)
- AIMS manta tow — CARTER REEF (2013): 13% hard coral cover, 0.90 km from N. GBR - Pink (AUCT49)
- AIMS manta tow — CARTER REEF (2015): 9.7% hard coral cover, 0.90 km from N. GBR - Pink (AUCT49)
- AIMS manta tow — CARTER REEF (2017): 3.9% hard coral cover, 0.90 km from N. GBR - Pink (AUCT49)
- AIMS manta tow — CARTER REEF (2019): 6.7% hard coral cover, 0.90 km from N. GBR - Pink (AUCT49)
- AIMS manta tow — CARTER REEF (2021): 18% hard coral cover, 0.90 km from N. GBR - Pink (AUCT49)
- AIMS manta tow — CARTER REEF (2022): 29% hard coral cover, 0.90 km from N. GBR - Pink (AUCT49)
- AIMS manta tow — CARTER REEF (2022): 20% hard coral cover, 0.90 km from N. GBR - Pink (AUCT49)
- AIMS manta tow — CARTER REEF (2023): 33% hard coral cover, 0.90 km from N. GBR - Pink (AUCT49)
- AIMS manta tow — DAVIES REEF (1993): 22% hard coral cover, 1.52 km from Great Barrier Reef - Townsville / Davies Reef
- AIMS manta tow — DAVIES REEF (1994): 26% hard coral cover, 1.52 km from Great Barrier Reef - Townsville / Davies Reef
- AIMS manta tow — DAVIES REEF (1995): 29% hard coral cover, 1.52 km from Great Barrier Reef - Townsville / Davies Reef
- AIMS manta tow — DAVIES REEF (1996): 30% hard coral cover, 1.52 km from Great Barrier Reef - Townsville / Davies Reef
- AIMS manta tow — DAVIES REEF (1997): 24% hard coral cover, 1.52 km from Great Barrier Reef - Townsville / Davies Reef
- AIMS manta tow — DAVIES REEF (1998): 33% hard coral cover, 1.52 km from Great Barrier Reef - Townsville / Davies Reef
- AIMS manta tow — DAVIES REEF (1999): 31% hard coral cover, 1.52 km from Great Barrier Reef - Townsville / Davies Reef
- AIMS manta tow — DAVIES REEF (2000): 29% hard coral cover, 1.52 km from Great Barrier Reef - Townsville / Davies Reef
- AIMS manta tow — DAVIES REEF (2001): 17% hard coral cover, 1.52 km from Great Barrier Reef - Townsville / Davies Reef
- AIMS manta tow — DAVIES REEF (2002): 24% hard coral cover, 1.52 km from Great Barrier Reef - Townsville / Davies Reef
- AIMS manta tow — DAVIES REEF (2003): 23% hard coral cover, 1.52 km from Great Barrier Reef - Townsville / Davies Reef
- AIMS manta tow — DAVIES REEF (2004): 23% hard coral cover, 1.52 km from Great Barrier Reef - Townsville / Davies Reef
- AIMS manta tow — DAVIES REEF (2005): 23% hard coral cover, 1.52 km from Great Barrier Reef - Townsville / Davies Reef
- AIMS manta tow — DAVIES REEF (2007): 18% hard coral cover, 1.52 km from Great Barrier Reef - Townsville / Davies Reef
- AIMS manta tow — DAVIES REEF (2009): 21% hard coral cover, 1.52 km from Great Barrier Reef - Townsville / Davies Reef
- AIMS manta tow — DAVIES REEF (2011): 12% hard coral cover, 1.52 km from Great Barrier Reef - Townsville / Davies Reef
- AIMS manta tow — DAVIES REEF (2013): 10% hard coral cover, 1.52 km from Great Barrier Reef - Townsville / Davies Reef
- AIMS manta tow — DAVIES REEF (2015): 19% hard coral cover, 1.52 km from Great Barrier Reef - Townsville / Davies Reef
- AIMS manta tow — DAVIES REEF (2017): 25% hard coral cover, 1.52 km from Great Barrier Reef - Townsville / Davies Reef
- AIMS manta tow — DAVIES REEF (2019): 31% hard coral cover, 1.52 km from Great Barrier Reef - Townsville / Davies Reef
- AIMS manta tow — DAVIES REEF (2021): 42% hard coral cover, 1.52 km from Great Barrier Reef - Townsville / Davies Reef
- AIMS manta tow — DAVIES REEF (2022): 53% hard coral cover, 1.52 km from Great Barrier Reef - Townsville / Davies Reef
- AIMS manta tow — DAVIES REEF (2023): 49% hard coral cover, 1.52 km from Great Barrier Reef - Townsville / Davies Reef
- AIMS manta tow — DAVIES REEF (2023): 27% hard coral cover, 1.52 km from Great Barrier Reef - Townsville / Davies Reef
- AIMS manta tow — EYRIE REEF (1995): 16% hard coral cover, 3.58 km from N. GBR - Green (AUEY164)
- AIMS manta tow — EYRIE REEF (1998): 15% hard coral cover, 3.58 km from N. GBR - Green (AUEY164)
- AIMS manta tow — EYRIE REEF (2001): 20% hard coral cover, 3.58 km from N. GBR - Green (AUEY164)
- AIMS manta tow — EYRIE REEF (2004): 14% hard coral cover, 3.58 km from N. GBR - Green (AUEY164)
- AIMS manta tow — EYRIE REEF (2007): 23% hard coral cover, 3.58 km from N. GBR - Green (AUEY164)
- AIMS manta tow — EYRIE REEF (2013): 27% hard coral cover, 3.58 km from N. GBR - Green (AUEY164)
- AIMS manta tow — EYRIE REEF (2015): 5.5% hard coral cover, 3.58 km from N. GBR - Green (AUEY164)
- AIMS manta tow — EYRIE REEF (2021): 30% hard coral cover, 3.58 km from N. GBR - Green (AUEY164)
- AIMS manta tow — HAYMAN ISLAND REEF (1993): 26% hard coral cover, 2.59 km from Whitsundays - Blue Pearl Bay (Hayman Island)
- AIMS manta tow — HAYMAN ISLAND REEF (1994): 16% hard coral cover, 2.59 km from Whitsundays - Blue Pearl Bay (Hayman Island)
- AIMS manta tow — HAYMAN ISLAND REEF (1995): 12% hard coral cover, 2.59 km from Whitsundays - Blue Pearl Bay (Hayman Island)
- AIMS manta tow — HAYMAN ISLAND REEF (1996): 18% hard coral cover, 2.59 km from Whitsundays - Blue Pearl Bay (Hayman Island)
- AIMS manta tow — HAYMAN ISLAND REEF (1997): 16% hard coral cover, 2.59 km from Whitsundays - Blue Pearl Bay (Hayman Island)
- AIMS manta tow — HAYMAN ISLAND REEF (1998): 17% hard coral cover, 2.59 km from Whitsundays - Blue Pearl Bay (Hayman Island)
- AIMS manta tow — HAYMAN ISLAND REEF (1999): 18% hard coral cover, 2.59 km from Whitsundays - Blue Pearl Bay (Hayman Island)
- AIMS manta tow — HAYMAN ISLAND REEF (2000): 23% hard coral cover, 2.59 km from Whitsundays - Blue Pearl Bay (Hayman Island)
- AIMS manta tow — HAYMAN ISLAND REEF (2001): 21% hard coral cover, 2.59 km from Whitsundays - Blue Pearl Bay (Hayman Island)
- AIMS manta tow — HAYMAN ISLAND REEF (2003): 23% hard coral cover, 2.59 km from Whitsundays - Blue Pearl Bay (Hayman Island)
- AIMS manta tow — HAYMAN ISLAND REEF (2004): 32% hard coral cover, 2.59 km from Whitsundays - Blue Pearl Bay (Hayman Island)
- AIMS manta tow — HAYMAN ISLAND REEF (2013): 20% hard coral cover, 2.59 km from Whitsundays - Blue Pearl Bay (Hayman Island)
- AIMS manta tow — HAYMAN ISLAND REEF (2017): 32% hard coral cover, 2.59 km from Whitsundays - Blue Pearl Bay (Hayman Island)
- AIMS manta tow — HAYMAN ISLAND REEF (2021): 9.6% hard coral cover, 2.59 km from Whitsundays - Blue Pearl Bay (Hayman Island)
- AIMS manta tow — HAYMAN ISLAND REEF (2022): 21% hard coral cover, 2.59 km from Whitsundays - Blue Pearl Bay (Hayman Island)
- AIMS manta tow — HAYMAN ISLAND REEF (2023): 15% hard coral cover, 2.59 km from Whitsundays - Blue Pearl Bay (Hayman Island)
- AIMS manta tow — HILDER REEF (1994): 39% hard coral cover, 1.41 km from N. GBR - Pink (AUHI161)
- AIMS manta tow — HILDER REEF (2000): 40% hard coral cover, 1.41 km from N. GBR - Pink (AUHI161)
- AIMS manta tow — HILDER REEF (2006): 5.5% hard coral cover, 1.41 km from N. GBR - Pink (AUHI161)
- AIMS manta tow — HILDER REEF (2022): 31% hard coral cover, 1.41 km from N. GBR - Pink (AUHI161)
- AIMS manta tow — HILDER REEF (2023): 39% hard coral cover, 1.41 km from N. GBR - Pink (AUHI161)
- AIMS manta tow — NO NAME REEF (1994): 29% hard coral cover, 4.21 km from N. GBR - Green (AUYG41)
- AIMS manta tow — NO NAME REEF (1995): 32% hard coral cover, 4.21 km from N. GBR - Green (AUYG41)
- AIMS manta tow — NO NAME REEF (1996): 29% hard coral cover, 4.21 km from N. GBR - Green (AUYG41)
- AIMS manta tow — NO NAME REEF (1997): 26% hard coral cover, 4.21 km from N. GBR - Green (AUYG41)
- AIMS manta tow — NO NAME REEF (1998): 27% hard coral cover, 4.21 km from N. GBR - Green (AUYG41)
- AIMS manta tow — NO NAME REEF (1999): 40% hard coral cover, 4.21 km from N. GBR - Green (AUYG41)
- AIMS manta tow — NO NAME REEF (2000): 28% hard coral cover, 4.21 km from N. GBR - Green (AUYG41)
- AIMS manta tow — NO NAME REEF (2001): 24% hard coral cover, 4.21 km from N. GBR - Green (AUYG41)
- AIMS manta tow — NO NAME REEF (2002): 23% hard coral cover, 4.21 km from N. GBR - Green (AUYG41)
- AIMS manta tow — NO NAME REEF (2003): 31% hard coral cover, 4.21 km from N. GBR - Green (AUYG41)
- AIMS manta tow — NO NAME REEF (2004): 22% hard coral cover, 4.21 km from N. GBR - Green (AUYG41)
- AIMS manta tow — NO NAME REEF (2005): 24% hard coral cover, 4.21 km from N. GBR - Green (AUYG41)
- AIMS manta tow — NO NAME REEF (2006): 17% hard coral cover, 4.21 km from N. GBR - Green (AUYG41)
- AIMS manta tow — NO NAME REEF (2007): 11% hard coral cover, 4.21 km from N. GBR - Green (AUYG41)
- AIMS manta tow — NO NAME REEF (2008): 17% hard coral cover, 4.21 km from N. GBR - Green (AUYG41)
- AIMS manta tow — NO NAME REEF (2009): 17% hard coral cover, 4.21 km from N. GBR - Green (AUYG41)
- AIMS manta tow — NO NAME REEF (2010): 20% hard coral cover, 4.21 km from N. GBR - Green (AUYG41)
- AIMS manta tow — NO NAME REEF (2011): 16% hard coral cover, 4.21 km from N. GBR - Green (AUYG41)
- AIMS manta tow — NO NAME REEF (2013): 15% hard coral cover, 4.21 km from N. GBR - Green (AUYG41)
- AIMS manta tow — NO NAME REEF (2015): 12% hard coral cover, 4.21 km from N. GBR - Green (AUYG41)
- AIMS manta tow — NO NAME REEF (2017): 4.3% hard coral cover, 4.21 km from N. GBR - Green (AUYG41)
- AIMS manta tow — NO NAME REEF (2019): 8.4% hard coral cover, 4.21 km from N. GBR - Green (AUYG41)
- AIMS manta tow — NO NAME REEF (2020): 13% hard coral cover, 4.21 km from N. GBR - Green (AUYG41)
- AIMS manta tow — NO NAME REEF (2021): 22% hard coral cover, 4.21 km from N. GBR - Green (AUYG41)
- AIMS manta tow — NO NAME REEF (2022): 30% hard coral cover, 4.21 km from N. GBR - Green (AUYG41)
- AIMS manta tow — NO NAME REEF (2023): 25% hard coral cover, 4.21 km from N. GBR - Green (AUYG41)
- AIMS manta tow — PEARSON REEF (1995): 26% hard coral cover, 0.75 km from N. GBR - Pink (AUPE125)
- AIMS manta tow — PEARSON REEF (1998): 25% hard coral cover, 0.75 km from N. GBR - Pink (AUPE125)
- AIMS manta tow — PEARSON REEF (2004): 25% hard coral cover, 0.75 km from N. GBR - Pink (AUPE125)
- AIMS manta tow — PEARSON REEF (2013): 28% hard coral cover, 0.75 km from N. GBR - Pink (AUPE125)
- AIMS manta tow — PEARSON REEF (2017): 12% hard coral cover, 0.75 km from N. GBR - Pink (AUPE125)
- AIMS manta tow — PEARSON REEF (2020): 10% hard coral cover, 0.75 km from N. GBR - Pink (AUPE125)
- AIMS manta tow — PEARSON REEF (2021): 19% hard coral cover, 0.75 km from N. GBR - Pink (AUPE125)
- AIMS manta tow — PEARSON REEF (2022): 32% hard coral cover, 0.75 km from N. GBR - Pink (AUPE125)
- AIMS manta tow — PEARSON REEF (2022): 22% hard coral cover, 0.75 km from N. GBR - Pink (AUPE125)
- AIMS manta tow — PEARSON REEF (2023): 20% hard coral cover, 0.75 km from N. GBR - Pink (AUPE125)
- AIMS manta tow — RIBBON NO 6 REEF (1994): 35% hard coral cover, 0.86 km from N. GBR - Pink (AUR611)
- AIMS manta tow — RIBBON NO 6 REEF (2000): 35% hard coral cover, 0.86 km from N. GBR - Pink (AUR611)
- AIMS manta tow — RIBBON NO 6 REEF (2003): 23% hard coral cover, 0.86 km from N. GBR - Pink (AUR611)
- AIMS manta tow — RIBBON NO 6 REEF (2013): 16% hard coral cover, 0.86 km from N. GBR - Pink (AUR611)
- AIMS manta tow — RIBBON NO 6 REEF (2015): 22% hard coral cover, 0.86 km from N. GBR - Pink (AUR611)
- AIMS manta tow — RIBBON NO 6 REEF (2016): 24% hard coral cover, 0.86 km from N. GBR - Pink (AUR611)
- AIMS manta tow — RIBBON NO 6 REEF (2017): 11% hard coral cover, 0.86 km from N. GBR - Pink (AUR611)
- AIMS manta tow — SAND BANK NO 8 REEF (1993): 35% hard coral cover, 2.91 km from N. GBR - Pink (AU61A63)
- AIMS manta tow — SAND BANK NO 8 REEF (1996): 34% hard coral cover, 2.91 km from N. GBR - Pink (AU61A63)
- AIMS manta tow — SAND BANK NO 8 REEF (1999): 27% hard coral cover, 2.91 km from N. GBR - Pink (AU61A63)
- AIMS manta tow — SAND BANK NO 8 REEF (2019): 19% hard coral cover, 2.91 km from N. GBR - Pink (AU61A63)
- AIMS manta tow — SAND BANK NO 8 REEF (2021): 25% hard coral cover, 2.91 km from N. GBR - Pink (AU61A63)
- AIMS manta tow — SAND BANK NO 8 REEF (2023): 43% hard coral cover, 2.91 km from N. GBR - Pink (AU61A63)
- AIMS manta tow — SWINGER REEF (1995): 20% hard coral cover, 3.77 km from N. GBR - Green (AULK29)
- AIMS manta tow — SWINGER REEF (1998): 17% hard coral cover, 3.77 km from N. GBR - Green (AULK29)
- AIMS manta tow — SWINGER REEF (2001): 16% hard coral cover, 3.77 km from N. GBR - Green (AULK29)
- AIMS manta tow — SWINGER REEF (2004): 14% hard coral cover, 3.77 km from N. GBR - Green (AULK29)
- AIMS manta tow — SWINGER REEF (2007): 25% hard coral cover, 3.77 km from N. GBR - Green (AULK29)
- AIMS manta tow — SWINGER REEF (2009): 30% hard coral cover, 3.77 km from N. GBR - Green (AULK29)
- AIMS manta tow — SWINGER REEF (2010): 24% hard coral cover, 3.77 km from N. GBR - Green (AULK29)
- AIMS manta tow — SWINGER REEF (2015): 11% hard coral cover, 3.77 km from N. GBR - Green (AULK29)
- AIMS manta tow — SWINGER REEF (2021): 26% hard coral cover, 3.77 km from N. GBR - Green (AULK29)
- AIMS manta tow — SWINGER REEF (2023): 39% hard coral cover, 3.77 km from N. GBR - Green (AULK29)
- AIMS manta tow — YONGE REEF (1993): 14% hard coral cover, 0.22 km from N. GBR - Green (AUYG42)
- AIMS manta tow — YONGE REEF (1994): 17% hard coral cover, 0.22 km from N. GBR - Green (AUYG42)
- AIMS manta tow — YONGE REEF (1995): 23% hard coral cover, 0.22 km from N. GBR - Green (AUYG42)
- AIMS manta tow — YONGE REEF (1996): 18% hard coral cover, 0.22 km from N. GBR - Green (AUYG42)
- AIMS manta tow — YONGE REEF (1997): 25% hard coral cover, 0.22 km from N. GBR - Green (AUYG42)
- AIMS manta tow — YONGE REEF (1998): 30% hard coral cover, 0.22 km from N. GBR - Green (AUYG42)
- AIMS manta tow — YONGE REEF (1999): 30% hard coral cover, 0.22 km from N. GBR - Green (AUYG42)
- AIMS manta tow — YONGE REEF (2000): 29% hard coral cover, 0.22 km from N. GBR - Green (AUYG42)
- AIMS manta tow — YONGE REEF (2001): 30% hard coral cover, 0.22 km from N. GBR - Green (AUYG42)
- AIMS manta tow — YONGE REEF (2002): 27% hard coral cover, 0.22 km from N. GBR - Green (AUYG42)
- AIMS manta tow — YONGE REEF (2003): 26% hard coral cover, 0.22 km from N. GBR - Green (AUYG42)
- AIMS manta tow — YONGE REEF (2004): 24% hard coral cover, 0.22 km from N. GBR - Green (AUYG42)
- AIMS manta tow — YONGE REEF (2005): 34% hard coral cover, 0.22 km from N. GBR - Green (AUYG42)
- AIMS manta tow — YONGE REEF (2006): 18% hard coral cover, 0.22 km from N. GBR - Green (AUYG42)
- AIMS manta tow — YONGE REEF (2007): 15% hard coral cover, 0.22 km from N. GBR - Green (AUYG42)
- AIMS manta tow — YONGE REEF (2008): 18% hard coral cover, 0.22 km from N. GBR - Green (AUYG42)
- AIMS manta tow — YONGE REEF (2009): 17% hard coral cover, 0.22 km from N. GBR - Green (AUYG42)
- AIMS manta tow — YONGE REEF (2011): 15% hard coral cover, 0.22 km from N. GBR - Green (AUYG42)
- AIMS manta tow — YONGE REEF (2013): 13% hard coral cover, 0.22 km from N. GBR - Green (AUYG42)
- AIMS manta tow — YONGE REEF (2015): 9.2% hard coral cover, 0.22 km from N. GBR - Green (AUYG42)
- AIMS manta tow — YONGE REEF (2017): 5.5% hard coral cover, 0.22 km from N. GBR - Green (AUYG42)
- AIMS manta tow — YONGE REEF (2019): 12% hard coral cover, 0.22 km from N. GBR - Green (AUYG42)
- AIMS manta tow — YONGE REEF (2021): 19% hard coral cover, 0.22 km from N. GBR - Green (AUYG42)
- AIMS manta tow — YONGE REEF (2022): 29% hard coral cover, 0.22 km from N. GBR - Green (AUYG42)
- AIMS manta tow — YONGE REEF (2022): 21% hard coral cover, 0.22 km from N. GBR - Green (AUYG42)
- AIMS manta tow — YONGE REEF (2023): 35% hard coral cover, 0.22 km from N. GBR - Green (AUYG42)
- Reef Check — Black Island - Black Island West Site 1 (2021): 16% hard coral cover, 3.61 km from Whitsundays - Butterfly Bay (Hook Island)
- Reef Check — Black Island - Black Island West Site 1 (2022): 11% hard coral cover, 3.61 km from Whitsundays - Butterfly Bay (Hook Island)
- Reef Check — Black Island - Black Island West Site 1 (2023): 11% hard coral cover, 3.61 km from Whitsundays - Butterfly Bay (Hook Island)
- Reef Check — Blue Pearl Bay Site 2 (2005): 52% hard coral cover, 0.95 km from Whitsundays - Blue Pearl Bay (Hayman Island)
- Reef Check — Blue Pearl Bay Site 2 (2006): 57% hard coral cover, 0.95 km from Whitsundays - Blue Pearl Bay (Hayman Island)
- Reef Check — Blue Pearl Bay rocks (2003): 53% hard coral cover, 0.12 km from Whitsundays - Blue Pearl Bay (Hayman Island)
- Reef Check — Blue Pearl Bay rocks (2007): 58% hard coral cover, 0.12 km from Whitsundays - Blue Pearl Bay (Hayman Island)
- Reef Check — Davies Reef (2003): 26% hard coral cover, 0.00 km from Great Barrier Reef - Townsville / Davies Reef
- Reef Check — Davies Reef (2004): 41% hard coral cover, 0.00 km from Great Barrier Reef - Townsville / Davies Reef
- Reef Check — Davies Reef (2005): 40% hard coral cover, 0.00 km from Great Barrier Reef - Townsville / Davies Reef
- Reef Check — Davies Reef - The Lost World (Back reef wall) Site 1 (2006): 35% hard coral cover, 3.57 km from Great Barrier Reef - Townsville / Davies Reef
- Reef Check — Davies Reef - The Lost World (Back reef wall) Site 1 (2007): 29% hard coral cover, 3.57 km from Great Barrier Reef - Townsville / Davies Reef
- Reef Check — Davies Reef - The Lost World (Back reef wall) Site 1 (2008): 52% hard coral cover, 3.57 km from Great Barrier Reef - Townsville / Davies Reef
- Reef Check — Hayman Island Reefs - Blue Pearl Bay (Fringing reef leeward) Site 1 (2008): 56% hard coral cover, 0.90 km from Whitsundays - Blue Pearl Bay (Hayman Island)
- Reef Check — Hayman Island Reefs - Blue Pearl Bay (Fringing reef leeward) Site 1 (2009): 69% hard coral cover, 0.90 km from Whitsundays - Blue Pearl Bay (Hayman Island)
- Reef Check — Hayman Island Reefs - Blue Pearl Bay (Fringing reef leeward) Site 1 (2010): 46% hard coral cover, 0.90 km from Whitsundays - Blue Pearl Bay (Hayman Island)
- Reef Check — Hayman Island Reefs - Blue Pearl Bay (Fringing reef leeward) Site 1 (2014): 50% hard coral cover, 0.90 km from Whitsundays - Blue Pearl Bay (Hayman Island)
- Reef Check — Hayman Island Reefs - Blue Pearl Bay (Fringing reef leeward) Site 1 (2015): 48% hard coral cover, 0.90 km from Whitsundays - Blue Pearl Bay (Hayman Island)
- Reef Check — Hayman Island Reefs - Blue Pearl Bay (Fringing reef leeward) Site 1 (2016): 60% hard coral cover, 0.90 km from Whitsundays - Blue Pearl Bay (Hayman Island)
- Reef Check — Hayman Island Reefs - Blue Pearl Bay (Fringing reef leeward) Site 1 (2018): 11% hard coral cover, 0.90 km from Whitsundays - Blue Pearl Bay (Hayman Island)
- Reef Check — Hayman Island Reefs - Blue Pearl Bay (Fringing reef leeward) Site 1 (2019): 23% hard coral cover, 0.90 km from Whitsundays - Blue Pearl Bay (Hayman Island)
- Reef Check — Hayman Island Reefs - Blue Pearl Bay (Fringing reef leeward) Site 1 (2020): 23% hard coral cover, 0.90 km from Whitsundays - Blue Pearl Bay (Hayman Island)
- Reef Check — Hayman Island Reefs - Blue Pearl Bay (Fringing reef leeward) Site 1 (2021): 25% hard coral cover, 0.90 km from Whitsundays - Blue Pearl Bay (Hayman Island)
- Reef Check — Hayman Island Reefs - Blue Pearl Bay (Fringing reef leeward) Site 1 (2022): 28% hard coral cover, 0.90 km from Whitsundays - Blue Pearl Bay (Hayman Island)
- Reef Check — Hayman Island Reefs - Blue Pearl Bay (Fringing reef leeward) Site 1 (2023): 23% hard coral cover, 0.90 km from Whitsundays - Blue Pearl Bay (Hayman Island)
- Reef Check — Hayman Island Reefs - Blue Pearl Bay (Fringing reef leeward) Site 2 (2014): 43% hard coral cover, 0.90 km from Whitsundays - Blue Pearl Bay (Hayman Island)
- Reef Check — Hayman Island Reefs - Blue Pearl Bay (Fringing reef leeward) Site 2 (2015): 30% hard coral cover, 0.90 km from Whitsundays - Blue Pearl Bay (Hayman Island)
- Reef Check — Hayman Island Reefs - Blue Pearl Bay (Fringing reef leeward) Site 3 (2006): 78% hard coral cover best patch, 0.95 km from Whitsundays - Blue Pearl Bay (Hayman Island)
- Reef Check — Hayman Island Reefs - Blue Pearl Bay (Fringing reef leeward) Site 3 (2010): 37% hard coral cover, 0.95 km from Whitsundays - Blue Pearl Bay (Hayman Island)
- Reef Check — Hayman Island Reefs - Blue Pearl Bay (Fringing reef leeward) Site 3 (2015): 46% hard coral cover, 0.90 km from Whitsundays - Blue Pearl Bay (Hayman Island)
- Reef Check — Hayman Island Reefs - Blue Pearl Bay (Fringing reef leeward) Site 3 (2016): 41% hard coral cover, 0.90 km from Whitsundays - Blue Pearl Bay (Hayman Island)
- Reef Check — Hayman Island Reefs - Blue Pearl Bay (Fringing reef leeward) Site 3 (2018): 13% hard coral cover, 0.90 km from Whitsundays - Blue Pearl Bay (Hayman Island)
- Reef Check — Hayman Island Reefs - Blue Pearl Bay (Fringing reef leeward) Site 3 (2022): 1.9% hard coral cover, 0.90 km from Whitsundays - Blue Pearl Bay (Hayman Island)
- Reef Check — Hayman Island Reefs - Blue Pearl Bay (Fringing reef leeward) Site 3 (2023): 10% hard coral cover, 0.90 km from Whitsundays - Blue Pearl Bay (Hayman Island)
- Reef Check — Hayman Islands Reefs - Blue Pearl Bay - Fringing reef leeward - Site 1 (2001): 53% hard coral cover, 0.38 km from Whitsundays - Blue Pearl Bay (Hayman Island)
- Reef Check — Heron Island (1997): 62% hard coral cover, 0.00 km from Great Barrier Reef - Heron Island (southern)
- Reef Check — Heron Reef - Libby's Lair Site 1 (2018): 63% hard coral cover, 2.37 km from Great Barrier Reef - Heron Island (southern)
- Reef Check — Heron Reef - Libby's Lair Site 1 (2019): 78% hard coral cover best patch, 2.37 km from Great Barrier Reef - Heron Island (southern)
- Reef Check — Heron Reef - Libby's Lair Site 1 (2020): 72% hard coral cover best patch, 2.37 km from Great Barrier Reef - Heron Island (southern)
- Reef Check — Heron Reef - Libby's Lair Site 1 (2021): 76% hard coral cover best patch, 2.37 km from Great Barrier Reef - Heron Island (southern)
- Reef Check — Heron Reef - Libby's Lair Site 1 (2022): 69% hard coral cover, 2.37 km from Great Barrier Reef - Heron Island (southern)
- Reef Check — Heron Reef - Libby's Lair Site 1 (2023): 74% hard coral cover best patch, 2.37 km from Great Barrier Reef - Heron Island (southern)
- Reef Check — Heron Reef - Blue Pools (Back reef slope) Site 1 (2014): 40% hard coral cover, 0.95 km from Great Barrier Reef - Heron Island (southern)
- Reef Check — Heron Reef - Blue Pools (Back reef slope) Site 1 (2017): 52% hard coral cover, 0.95 km from Great Barrier Reef - Heron Island (southern)
- Reef Check — Heron Reef - Blue Pools (Back reef slope) Site 1 (2020): 79% hard coral cover best patch, 0.95 km from Great Barrier Reef - Heron Island (southern)
- Reef Check — Heron Reef - Blue Pools (Back reef slope) Site 1 (2022): 71% hard coral cover best patch, 0.95 km from Great Barrier Reef - Heron Island (southern)
- Reef Check — Heron Reef - Canyons (Back reef slope) Site 1 (2013): 70% hard coral cover, 2.28 km from Great Barrier Reef - Heron Island (southern)
- Reef Check — Heron Reef - Canyons (Back reef slope) Site 1 (2014): 63% hard coral cover, 2.28 km from Great Barrier Reef - Heron Island (southern)
- Reef Check — Heron Reef - Canyons (Back reef slope) Site 1 (2015): 63% hard coral cover, 2.28 km from Great Barrier Reef - Heron Island (southern)
- Reef Check — Heron Reef - Canyons (Back reef slope) Site 1 (2016): 83% hard coral cover best patch, 2.28 km from Great Barrier Reef - Heron Island (southern)
- Reef Check — Heron Reef - Canyons (Back reef slope) Site 1 (2017): 61% hard coral cover, 2.28 km from Great Barrier Reef - Heron Island (southern)
- Reef Check — Heron Reef - Canyons (Back reef slope) Site 1 (2018): 69% hard coral cover, 2.28 km from Great Barrier Reef - Heron Island (southern)
- Reef Check — Heron Reef - Canyons (Back reef slope) Site 1 (2019): 68% hard coral cover, 2.28 km from Great Barrier Reef - Heron Island (southern)
- Reef Check — Heron Reef - Canyons (Back reef slope) Site 1 (2020): 76% hard coral cover best patch, 2.28 km from Great Barrier Reef - Heron Island (southern)
- Reef Check — Heron Reef - Canyons (Back reef slope) Site 1 (2021): 73% hard coral cover best patch, 2.28 km from Great Barrier Reef - Heron Island (southern)
- Reef Check — Heron Reef - Canyons (Back reef slope) Site 1 (2022): 72% hard coral cover best patch, 2.28 km from Great Barrier Reef - Heron Island (southern)
- Reef Check — Heron Reef - Canyons (Back reef slope) Site 1 (2023): 64% hard coral cover, 2.28 km from Great Barrier Reef - Heron Island (southern)
- Reef Check — Heron Reef - Cappuccino Express (Reef flat) Site 1 (2013): 19% hard coral cover, 0.57 km from Great Barrier Reef - Heron Island (southern)
- Reef Check — Heron Reef - Cappuccino Express (Reef flat) Site 1 (2014): 28% hard coral cover, 0.57 km from Great Barrier Reef - Heron Island (southern)
- Reef Check — Heron Reef - Cappuccino Express (Reef flat) Site 1 (2015): 29% hard coral cover, 0.57 km from Great Barrier Reef - Heron Island (southern)
- Reef Check — Heron Reef - Cappuccino Express (Reef flat) Site 1 (2016): 31% hard coral cover, 0.57 km from Great Barrier Reef - Heron Island (southern)
- Reef Check — Heron Reef - Cappuccino Express (Reef flat) Site 1 (2017): 17% hard coral cover, 0.57 km from Great Barrier Reef - Heron Island (southern)
- Reef Check — Heron Reef - Cappuccino Express (Reef flat) Site 1 (2018): 29% hard coral cover, 0.57 km from Great Barrier Reef - Heron Island (southern)
- Reef Check — Heron Reef - Cappuccino Express (Reef flat) Site 1 (2019): 22% hard coral cover, 0.57 km from Great Barrier Reef - Heron Island (southern)
- Reef Check — Heron Reef - Cappuccino Express (Reef flat) Site 1 (2020): 19% hard coral cover, 0.57 km from Great Barrier Reef - Heron Island (southern)
- Reef Check — Heron Reef - Cappuccino Express (Reef flat) Site 1 (2021): 15% hard coral cover, 0.57 km from Great Barrier Reef - Heron Island (southern)
- Reef Check — Heron Reef - Cappuccino Express (Reef flat) Site 1 (2022): 16% hard coral cover, 0.57 km from Great Barrier Reef - Heron Island (southern)
- Reef Check — Heron Reef - Cappuccino Express (Reef flat) Site 1 (2023): 36% hard coral cover, 0.57 km from Great Barrier Reef - Heron Island (southern)
- Reef Check — Heron Reef - Coral Cascade (Back reef slope) Site 1 (2014): 49% hard coral cover, 1.23 km from Great Barrier Reef - Heron Island (southern)
- Reef Check — Heron Reef - Coral Cascade (Back reef slope) Site 1 (2015): 57% hard coral cover, 1.23 km from Great Barrier Reef - Heron Island (southern)
- Reef Check — Heron Reef - Coral Cascade (Back reef slope) Site 1 (2016): 63% hard coral cover, 1.23 km from Great Barrier Reef - Heron Island (southern)
- Reef Check — Heron Reef - Coral Cascade (Back reef slope) Site 1 (2017): 55% hard coral cover, 1.23 km from Great Barrier Reef - Heron Island (southern)
- Reef Check — Heron Reef - Coral Cascade (Back reef slope) Site 1 (2018): 54% hard coral cover, 1.23 km from Great Barrier Reef - Heron Island (southern)
- Reef Check — Heron Reef - Coral Cascade (Back reef slope) Site 1 (2019): 54% hard coral cover, 1.23 km from Great Barrier Reef - Heron Island (southern)
- Reef Check — Heron Reef - Coral Cascade (Back reef slope) Site 1 (2020): 60% hard coral cover, 1.23 km from Great Barrier Reef - Heron Island (southern)
- Reef Check — Heron Reef - Coral Cascade (Back reef slope) Site 1 (2021): 67% hard coral cover, 1.23 km from Great Barrier Reef - Heron Island (southern)
- Reef Check — Heron Reef - Coral Cascade (Back reef slope) Site 1 (2022): 56% hard coral cover, 1.23 km from Great Barrier Reef - Heron Island (southern)
- Reef Check — Heron Reef - Coral Cascade (Back reef slope) Site 1 (2023): 79% hard coral cover best patch, 1.23 km from Great Barrier Reef - Heron Island (southern)
- Reef Check — Heron Reef - Coral Garden (Fringing reef seaward) Site 1 (2011): 66% hard coral cover, 1.18 km from Great Barrier Reef - Heron Island (southern)
- Reef Check — Heron Reef - Coral Garden (Fringing reef seaward) Site 1 (2013): 69% hard coral cover, 1.18 km from Great Barrier Reef - Heron Island (southern)
- Reef Check — Heron Reef - Coral Garden (Fringing reef seaward) Site 1 (2014): 49% hard coral cover, 1.18 km from Great Barrier Reef - Heron Island (southern)
- Reef Check — Heron Reef - Coral Garden (Fringing reef seaward) Site 1 (2015): 66% hard coral cover, 1.18 km from Great Barrier Reef - Heron Island (southern)
- Reef Check — Heron Reef - Coral Garden (Fringing reef seaward) Site 1 (2016): 72% hard coral cover best patch, 1.18 km from Great Barrier Reef - Heron Island (southern)
- Reef Check — Heron Reef - Coral Garden (Fringing reef seaward) Site 1 (2017): 54% hard coral cover, 1.18 km from Great Barrier Reef - Heron Island (southern)
- Reef Check — Heron Reef - Coral Garden (Fringing reef seaward) Site 1 (2018): 73% hard coral cover best patch, 1.18 km from Great Barrier Reef - Heron Island (southern)
- Reef Check — Heron Reef - Coral Garden (Fringing reef seaward) Site 1 (2019): 70% hard coral cover, 1.18 km from Great Barrier Reef - Heron Island (southern)
- Reef Check — Heron Reef - Coral Garden (Fringing reef seaward) Site 1 (2020): 70% hard coral cover, 1.18 km from Great Barrier Reef - Heron Island (southern)
- Reef Check — Heron Reef - Coral Garden (Fringing reef seaward) Site 1 (2021): 63% hard coral cover, 1.18 km from Great Barrier Reef - Heron Island (southern)
- Reef Check — Heron Reef - Coral Garden (Fringing reef seaward) Site 1 (2022): 62% hard coral cover, 1.18 km from Great Barrier Reef - Heron Island (southern)
- Reef Check — Heron Reef - Coral Garden (Fringing reef seaward) Site 1 (2023): 61% hard coral cover, 1.18 km from Great Barrier Reef - Heron Island (southern)
- Reef Check — Heron Reef - Coral Grotto (Back reef slope) Site 1 (2011): 30% hard coral cover, 0.53 km from Great Barrier Reef - Heron Island (southern)
- Reef Check — Heron Reef - Coral Grotto (Back reef slope) Site 1 (2013): 29% hard coral cover, 0.53 km from Great Barrier Reef - Heron Island (southern)
- Reef Check — Heron Reef - Coral Grotto (Back reef slope) Site 1 (2014): 34% hard coral cover, 0.53 km from Great Barrier Reef - Heron Island (southern)
- Reef Check — Heron Reef - Coral Grotto (Back reef slope) Site 1 (2015): 43% hard coral cover, 0.53 km from Great Barrier Reef - Heron Island (southern)
- Reef Check — Heron Reef - Coral Grotto (Back reef slope) Site 1 (2016): 60% hard coral cover, 0.53 km from Great Barrier Reef - Heron Island (southern)
- Reef Check — Heron Reef - Coral Grotto (Back reef slope) Site 1 (2017): 47% hard coral cover, 0.53 km from Great Barrier Reef - Heron Island (southern)
- Reef Check — Heron Reef - Coral Grotto (Back reef slope) Site 1 (2018): 59% hard coral cover, 0.53 km from Great Barrier Reef - Heron Island (southern)
- Reef Check — Heron Reef - Coral Grotto (Back reef slope) Site 1 (2020): 61% hard coral cover, 0.53 km from Great Barrier Reef - Heron Island (southern)
- Reef Check — Heron Reef - Coral Grotto (Back reef slope) Site 1 (2021): 69% hard coral cover, 0.53 km from Great Barrier Reef - Heron Island (southern)
- Reef Check — Heron Reef - Coral Grotto (Back reef slope) Site 1 (2022): 67% hard coral cover, 0.53 km from Great Barrier Reef - Heron Island (southern)
- Reef Check — Heron Reef - Coral Grotto (Back reef slope) Site 1 (2023): 63% hard coral cover, 0.53 km from Great Barrier Reef - Heron Island (southern)
- Reef Check — Heron Reef - Gorgonian Hole (Back reef slope) Site 1 (2017): 64% hard coral cover, 0.31 km from Great Barrier Reef - Heron Island (southern)
- Reef Check — Heron Reef - Gorgonian Hole (Back reef slope) Site 1 (2018): 71% hard coral cover best patch, 0.31 km from Great Barrier Reef - Heron Island (southern)
- Reef Check — Heron Reef - Gorgonian Hole (Back reef slope) Site 1 (2019): 62% hard coral cover, 0.31 km from Great Barrier Reef - Heron Island (southern)
- Reef Check — Heron Reef - Gorgonian Hole (Back reef slope) Site 1 (2020): 69% hard coral cover, 0.31 km from Great Barrier Reef - Heron Island (southern)
- Reef Check — Heron Reef - Gorgonian Hole (Back reef slope) Site 1 (2021): 76% hard coral cover best patch, 0.31 km from Great Barrier Reef - Heron Island (southern)
- Reef Check — Heron Reef - Gorgonian Hole (Back reef slope) Site 1 (2022): 74% hard coral cover best patch, 0.31 km from Great Barrier Reef - Heron Island (southern)
- Reef Check — Heron Reef - Gorgonian Hole (Back reef slope) Site 1 (2023): 83% hard coral cover best patch, 0.31 km from Great Barrier Reef - Heron Island (southern)
- Reef Check — Heron Reef - Half Way (Doug's Place) (Fringing reef seaward) Site 1 (2014): 33% hard coral cover, 1.68 km from Great Barrier Reef - Heron Island (southern)
- Reef Check — Heron Reef - Half Way (Doug's Place) (Fringing reef seaward) Site 1 (2015): 31% hard coral cover, 1.68 km from Great Barrier Reef - Heron Island (southern)
- Reef Check — Heron Reef - Half Way (Doug's Place) (Fringing reef seaward) Site 1 (2016): 18% hard coral cover, 1.68 km from Great Barrier Reef - Heron Island (southern)
- Reef Check — Heron Reef - Half Way (Doug's Place) (Fringing reef seaward) Site 1 (2017): 20% hard coral cover, 1.68 km from Great Barrier Reef - Heron Island (southern)
- Reef Check — Heron Reef - Half Way (Doug's Place) (Fringing reef seaward) Site 1 (2020): 26% hard coral cover, 1.68 km from Great Barrier Reef - Heron Island (southern)
- Reef Check — Heron Reef - Half Way (Doug's Place) (Fringing reef seaward) Site 1 (2021): 30% hard coral cover, 1.68 km from Great Barrier Reef - Heron Island (southern)
- Reef Check — Heron Reef - Half Way (Doug's Place) (Fringing reef seaward) Site 1 (2022): 24% hard coral cover, 1.68 km from Great Barrier Reef - Heron Island (southern)
- Reef Check — Heron Reef - Half Way (Doug's Place) (Fringing reef seaward) Site 1 (2023): 46% hard coral cover, 1.68 km from Great Barrier Reef - Heron Island (southern)
- Reef Check — Heron Reef - Harry's Bommie (Fringing reef seaward) Site 1 (2011): 53% hard coral cover, 3.09 km from Great Barrier Reef - Heron Island (southern)
- Reef Check — Heron Reef - Harry's Bommie (Fringing reef seaward) Site 1 (2013): 63% hard coral cover, 3.09 km from Great Barrier Reef - Heron Island (southern)
- Reef Check — Heron Reef - Harry's Bommie (Fringing reef seaward) Site 1 (2014): 74% hard coral cover best patch, 3.09 km from Great Barrier Reef - Heron Island (southern)
- Reef Check — Heron Reef - Harry's Bommie (Fringing reef seaward) Site 1 (2015): 63% hard coral cover, 3.09 km from Great Barrier Reef - Heron Island (southern)
- Reef Check — Heron Reef - Harry's Bommie (Fringing reef seaward) Site 1 (2016): 86% hard coral cover best patch, 3.09 km from Great Barrier Reef - Heron Island (southern)
- Reef Check — Heron Reef - Harry's Bommie (Fringing reef seaward) Site 1 (2017): 54% hard coral cover, 3.09 km from Great Barrier Reef - Heron Island (southern)
- Reef Check — Heron Reef - Harry's Bommie (Fringing reef seaward) Site 1 (2018): 75% hard coral cover best patch, 3.09 km from Great Barrier Reef - Heron Island (southern)
- Reef Check — Heron Reef - Harry's Bommie (Fringing reef seaward) Site 1 (2019): 69% hard coral cover, 3.09 km from Great Barrier Reef - Heron Island (southern)
- Reef Check — Heron Reef - Harry's Bommie (Fringing reef seaward) Site 1 (2020): 66% hard coral cover, 3.09 km from Great Barrier Reef - Heron Island (southern)
- Reef Check — Heron Reef - Harry's Bommie (Fringing reef seaward) Site 1 (2021): 63% hard coral cover, 3.09 km from Great Barrier Reef - Heron Island (southern)
- Reef Check — Heron Reef - Harry's Bommie (Fringing reef seaward) Site 1 (2022): 74% hard coral cover best patch, 3.09 km from Great Barrier Reef - Heron Island (southern)
- Reef Check — Heron Reef - Harry's Bommie (Fringing reef seaward) Site 1 (2023): 68% hard coral cover, 3.09 km from Great Barrier Reef - Heron Island (southern)
- Reef Check — Heron Reef - Last Resort (Reef flat) Site 1 (2013): 9.4% hard coral cover, 0.95 km from Great Barrier Reef - Heron Island (southern)
- Reef Check — Heron Reef - Last Resort (Reef flat) Site 1 (2014): 4.4% hard coral cover, 0.95 km from Great Barrier Reef - Heron Island (southern)
- Reef Check — Heron Reef - Last Resort (Reef flat) Site 1 (2015): 7.5% hard coral cover, 0.95 km from Great Barrier Reef - Heron Island (southern)
- Reef Check — Heron Reef - Last Resort (Reef flat) Site 1 (2016): 21% hard coral cover, 0.95 km from Great Barrier Reef - Heron Island (southern)
- Reef Check — Heron Reef - Last Resort (Reef flat) Site 1 (2017): 3.8% hard coral cover, 0.95 km from Great Barrier Reef - Heron Island (southern)
- Reef Check — Heron Reef - Last Resort (Reef flat) Site 1 (2018): 11% hard coral cover, 0.95 km from Great Barrier Reef - Heron Island (southern)
- Reef Check — Heron Reef - Last Resort (Reef flat) Site 1 (2019): 6.9% hard coral cover, 0.95 km from Great Barrier Reef - Heron Island (southern)
- Reef Check — Heron Reef - Last Resort (Reef flat) Site 1 (2020): 3.1% hard coral cover, 0.95 km from Great Barrier Reef - Heron Island (southern)
- Reef Check — Heron Reef - Last Resort (Reef flat) Site 1 (2021): 5.6% hard coral cover, 0.95 km from Great Barrier Reef - Heron Island (southern)
- Reef Check — Heron Reef - Last Resort (Reef flat) Site 1 (2022): 3.8% hard coral cover, 0.95 km from Great Barrier Reef - Heron Island (southern)
- Reef Check — Heron Reef - Last Resort (Reef flat) Site 1 (2023): 11% hard coral cover, 0.95 km from Great Barrier Reef - Heron Island (southern)
- Reef Check — Heron Reef - Stevos Carbonara (Reef flat) Site 1 (2016): 1.3% hard coral cover, 0.55 km from Great Barrier Reef - Heron Island (southern)
- Reef Check — Heron Reef - Stevos Carbonara (Reef flat) Site 1 (2017): 3.1% hard coral cover, 0.55 km from Great Barrier Reef - Heron Island (southern)
- Reef Check — Heron Reef - Stevos Carbonara (Reef flat) Site 1 (2018): 0.0% hard coral cover, 0.55 km from Great Barrier Reef - Heron Island (southern)
- Reef Check — Heron Reef - Stevos Carbonara (Reef flat) Site 1 (2019): 1.3% hard coral cover, 0.55 km from Great Barrier Reef - Heron Island (southern)
- Reef Check — Heron Reef - Stevos Carbonara (Reef flat) Site 1 (2019): 1.0% hard coral cover, 0.55 km from Great Barrier Reef - Heron Island (southern)
- Reef Check — Heron Reef - Stevos Carbonara (Reef flat) Site 1 (2020): 0.0% hard coral cover, 0.55 km from Great Barrier Reef - Heron Island (southern)
- Reef Check — Heron Reef - Stevos Carbonara (Reef flat) Site 1 (2021): 0.0% hard coral cover, 0.55 km from Great Barrier Reef - Heron Island (southern)
- Reef Check — Heron Reef - Stevos Carbonara (Reef flat) Site 1 (2022): 1.3% hard coral cover, 0.55 km from Great Barrier Reef - Heron Island (southern)
- Reef Check — Heron Reef - White Wedding (Reef flat) Site 1 (2014): 10% hard coral cover, 0.24 km from Great Barrier Reef - Heron Island (southern)
- Reef Check — Heron Reef - White Wedding (Reef flat) Site 1 (2014): 9.4% hard coral cover, 0.24 km from Great Barrier Reef - Heron Island (southern)
- Reef Check — Heron Reef - White Wedding (Reef flat) Site 1 (2015): 14% hard coral cover, 0.24 km from Great Barrier Reef - Heron Island (southern)
- Reef Check — Heron Reef - White Wedding (Reef flat) Site 1 (2016): 6.9% hard coral cover, 0.24 km from Great Barrier Reef - Heron Island (southern)
- Reef Check — Heron Reef - White Wedding (Reef flat) Site 1 (2017): 14% hard coral cover, 0.24 km from Great Barrier Reef - Heron Island (southern)
- Reef Check — Heron Reef - White Wedding (Reef flat) Site 1 (2018): 11% hard coral cover, 0.24 km from Great Barrier Reef - Heron Island (southern)
- Reef Check — Heron Reef - White Wedding (Reef flat) Site 1 (2019): 3.8% hard coral cover, 0.24 km from Great Barrier Reef - Heron Island (southern)
- Reef Check — Heron Reef - White Wedding (Reef flat) Site 1 (2020): 6.9% hard coral cover, 0.24 km from Great Barrier Reef - Heron Island (southern)
- Reef Check — Heron Reef - White Wedding (Reef flat) Site 1 (2021): 8.8% hard coral cover, 0.24 km from Great Barrier Reef - Heron Island (southern)
- Reef Check — Heron Reef - White Wedding (Reef flat) Site 1 (2022): 7.5% hard coral cover, 0.24 km from Great Barrier Reef - Heron Island (southern)
- Reef Check — Heron Reef - White Wedding (Reef flat) Site 1 (2023): 12% hard coral cover, 0.24 km from Great Barrier Reef - Heron Island (southern)
- Reef Check — Heron Reef- Heron Bommie (Fringing reef seaward) Site 1 (2011): 63% hard coral cover, 1.03 km from Great Barrier Reef - Heron Island (southern)
- Reef Check — Heron Reef- Heron Bommie (Fringing reef seaward) Site 1 (2013): 66% hard coral cover, 1.03 km from Great Barrier Reef - Heron Island (southern)
- Reef Check — Heron Reef- Heron Bommie (Fringing reef seaward) Site 1 (2014): 76% hard coral cover best patch, 1.03 km from Great Barrier Reef - Heron Island (southern)
- Reef Check — Heron Reef- Heron Bommie (Fringing reef seaward) Site 1 (2015): 74% hard coral cover best patch, 1.03 km from Great Barrier Reef - Heron Island (southern)
- Reef Check — Heron Reef- Heron Bommie (Fringing reef seaward) Site 1 (2016): 47% hard coral cover, 1.03 km from Great Barrier Reef - Heron Island (southern)
- Reef Check — Heron Reef- Heron Bommie (Fringing reef seaward) Site 1 (2017): 54% hard coral cover, 1.03 km from Great Barrier Reef - Heron Island (southern)
- Reef Check — Heron Reef- Heron Bommie (Fringing reef seaward) Site 1 (2018): 66% hard coral cover, 1.03 km from Great Barrier Reef - Heron Island (southern)
- Reef Check — Heron Reef- Heron Bommie (Fringing reef seaward) Site 1 (2019): 43% hard coral cover, 1.03 km from Great Barrier Reef - Heron Island (southern)
- Reef Check — Heron Reef- Heron Bommie (Fringing reef seaward) Site 1 (2020): 61% hard coral cover, 1.03 km from Great Barrier Reef - Heron Island (southern)
- Reef Check — Heron Reef- Heron Bommie (Fringing reef seaward) Site 1 (2021): 47% hard coral cover, 1.03 km from Great Barrier Reef - Heron Island (southern)
- Reef Check — Heron Reef- Heron Bommie (Fringing reef seaward) Site 1 (2022): 56% hard coral cover, 1.03 km from Great Barrier Reef - Heron Island (southern)
- Reef Check — Heron Reef- Heron Bommie (Fringing reef seaward) Site 1 (2023): 72% hard coral cover best patch, 1.03 km from Great Barrier Reef - Heron Island (southern)
- Reef Check — Heron Reef- Jetty Flat (Reef flat) Site 1 (2011): 29% hard coral cover, 0.82 km from Great Barrier Reef - Heron Island (southern)
- Reef Check — Heron Reef- Jetty Flat (Reef flat) Site 1 (2012): 38% hard coral cover, 0.82 km from Great Barrier Reef - Heron Island (southern)
- Reef Check — Heron Reef- Jetty Flat (Reef flat) Site 1 (2013): 35% hard coral cover, 0.82 km from Great Barrier Reef - Heron Island (southern)
- Reef Check — Heron Reef- Jetty Flat (Reef flat) Site 1 (2014): 33% hard coral cover, 0.82 km from Great Barrier Reef - Heron Island (southern)
- Reef Check — Heron Reef- Jetty Flat (Reef flat) Site 1 (2015): 36% hard coral cover, 0.82 km from Great Barrier Reef - Heron Island (southern)
- Reef Check — Heron Reef- Jetty Flat (Reef flat) Site 1 (2016): 47% hard coral cover, 0.82 km from Great Barrier Reef - Heron Island (southern)
- Reef Check — Heron Reef- Jetty Flat (Reef flat) Site 1 (2017): 31% hard coral cover, 0.82 km from Great Barrier Reef - Heron Island (southern)
- Reef Check — Heron Reef- Jetty Flat (Reef flat) Site 1 (2018): 31% hard coral cover, 0.82 km from Great Barrier Reef - Heron Island (southern)
- Reef Check — Heron Reef- Jetty Flat (Reef flat) Site 1 (2019): 24% hard coral cover, 0.82 km from Great Barrier Reef - Heron Island (southern)
- Reef Check — Heron Reef- Jetty Flat (Reef flat) Site 1 (2020): 31% hard coral cover, 0.82 km from Great Barrier Reef - Heron Island (southern)
- Reef Check — Heron Reef- Jetty Flat (Reef flat) Site 1 (2021): 36% hard coral cover, 0.82 km from Great Barrier Reef - Heron Island (southern)
- Reef Check — Heron Reef- Jetty Flat (Reef flat) Site 1 (2022): 29% hard coral cover, 0.82 km from Great Barrier Reef - Heron Island (southern)
- Reef Check — Heron Reef- Jetty Flat (Reef flat) Site 1 (2023): 43% hard coral cover, 0.82 km from Great Barrier Reef - Heron Island (southern)
- Reef Check — Heron Reef- Libby's Lair (Back reef slope) Site 1 (2011): 33% hard coral cover, 2.06 km from Great Barrier Reef - Heron Island (southern)
- Reef Check — Heron Reef- Libby's Lair (Back reef slope) Site 1 (2013): 49% hard coral cover, 2.06 km from Great Barrier Reef - Heron Island (southern)
- Reef Check — Heron Reef- Libby's Lair (Back reef slope) Site 1 (2014): 52% hard coral cover, 2.06 km from Great Barrier Reef - Heron Island (southern)
- Reef Check — Heron Reef- Libby's Lair (Back reef slope) Site 1 (2015): 53% hard coral cover, 2.06 km from Great Barrier Reef - Heron Island (southern)
- Reef Check — Heron Reef- Libby's Lair (Back reef slope) Site 1 (2016): 61% hard coral cover, 2.06 km from Great Barrier Reef - Heron Island (southern)
- Reef Check — Heron Reef- Libby's Lair (Back reef slope) Site 1 (2017): 64% hard coral cover, 2.06 km from Great Barrier Reef - Heron Island (southern)
- Reef Check — Heron Reef- North Bommie (Back reef slope) Site 1 (2011): 39% hard coral cover, 1.23 km from Great Barrier Reef - Heron Island (southern)
- Reef Check — Heron Reef- North Bommie (Back reef slope) Site 1 (2013): 43% hard coral cover, 1.23 km from Great Barrier Reef - Heron Island (southern)
- Reef Check — Heron Reef- Research Zone (Reef flat) Site 1 (2011): 15% hard coral cover, 0.79 km from Great Barrier Reef - Heron Island (southern)
- Reef Check — Heron Reef- Research Zone (Reef flat) Site 1 (2013): 5.6% hard coral cover, 0.79 km from Great Barrier Reef - Heron Island (southern)
- Reef Check — Heron Reef- Research Zone (Reef flat) Site 1 (2014): 8.8% hard coral cover, 0.79 km from Great Barrier Reef - Heron Island (southern)
- Reef Check — Heron Reef- Research Zone (Reef flat) Site 1 (2015): 9.4% hard coral cover, 0.79 km from Great Barrier Reef - Heron Island (southern)
- Reef Check — Heron Reef- Research Zone (Reef flat) Site 1 (2016): 6.9% hard coral cover, 0.79 km from Great Barrier Reef - Heron Island (southern)
- Reef Check — Heron Reef- Research Zone (Reef flat) Site 1 (2017): 8.8% hard coral cover, 0.79 km from Great Barrier Reef - Heron Island (southern)
- Reef Check — Heron Reef- Research Zone (Reef flat) Site 1 (2018): 6.9% hard coral cover, 0.79 km from Great Barrier Reef - Heron Island (southern)
- Reef Check — Heron Reef- Research Zone (Reef flat) Site 1 (2019): 20% hard coral cover, 0.79 km from Great Barrier Reef - Heron Island (southern)
- Reef Check — Heron Reef- Research Zone (Reef flat) Site 1 (2020): 8.8% hard coral cover, 0.79 km from Great Barrier Reef - Heron Island (southern)
- Reef Check — Heron Reef- Research Zone (Reef flat) Site 1 (2021): 7.5% hard coral cover, 0.79 km from Great Barrier Reef - Heron Island (southern)
- Reef Check — Heron Reef- Research Zone (Reef flat) Site 1 (2022): 11% hard coral cover, 0.79 km from Great Barrier Reef - Heron Island (southern)
- Reef Check — Heron Reef- Research Zone (Reef flat) Site 1 (2023): 10% hard coral cover, 0.79 km from Great Barrier Reef - Heron Island (southern)
- Reef Check — Heron Reef- Shark Bay (Reef flat) Site 1 (2011): 6.3% hard coral cover, 1.03 km from Great Barrier Reef - Heron Island (southern)
- Reef Check — Heron Reef- Shark Bay (Reef flat) Site 1 (2012): 2.5% hard coral cover, 1.03 km from Great Barrier Reef - Heron Island (southern)
- Reef Check — Heron Reef- Shark Bay (Reef flat) Site 1 (2013): 21% hard coral cover, 1.03 km from Great Barrier Reef - Heron Island (southern)
- Reef Check — Heron Reef- Shark Bay (Reef flat) Site 1 (2014): 6.3% hard coral cover, 1.03 km from Great Barrier Reef - Heron Island (southern)
- Reef Check — Heron Reef- Shark Bay (Reef flat) Site 1 (2015): 8.8% hard coral cover, 1.03 km from Great Barrier Reef - Heron Island (southern)
- Reef Check — Heron Reef- Shark Bay (Reef flat) Site 1 (2016): 6.9% hard coral cover, 1.03 km from Great Barrier Reef - Heron Island (southern)
- Reef Check — Heron Reef- Shark Bay (Reef flat) Site 1 (2017): 15% hard coral cover, 1.03 km from Great Barrier Reef - Heron Island (southern)
- Reef Check — Heron Reef- Shark Bay (Reef flat) Site 1 (2018): 17% hard coral cover, 1.03 km from Great Barrier Reef - Heron Island (southern)
- Reef Check — Heron Reef- Shark Bay (Reef flat) Site 1 (2019): 9.4% hard coral cover, 1.03 km from Great Barrier Reef - Heron Island (southern)
- Reef Check — Heron Reef- Shark Bay (Reef flat) Site 1 (2020): 11% hard coral cover, 1.03 km from Great Barrier Reef - Heron Island (southern)
- Reef Check — Heron Reef- Shark Bay (Reef flat) Site 1 (2021): 7.5% hard coral cover, 1.03 km from Great Barrier Reef - Heron Island (southern)
- Reef Check — Heron Reef- Shark Bay (Reef flat) Site 1 (2022): 12% hard coral cover, 1.03 km from Great Barrier Reef - Heron Island (southern)
- Reef Check — Heron Reef- Shark Bay (Reef flat) Site 1 (2023): 19% hard coral cover, 1.03 km from Great Barrier Reef - Heron Island (southern)
- Reef Check — Hook Island - Butterfly Bay Site 1 (2018): 21% hard coral cover, 0.64 km from Whitsundays - Butterfly Bay (Hook Island)
- Reef Check — Hook Island - Butterfly Bay Site 1 (2019): 33% hard coral cover, 0.64 km from Whitsundays - Butterfly Bay (Hook Island)
- Reef Check — Hook Island - Butterfly Bay Site 1 (2020): 18% hard coral cover, 0.64 km from Whitsundays - Butterfly Bay (Hook Island)
- Reef Check — Hook Island - Butterfly Bay Site 1 (2022): 13% hard coral cover, 0.64 km from Whitsundays - Butterfly Bay (Hook Island)
- Reef Check — Hook Island - Butterfly Bay Site 1 (2023): 29% hard coral cover, 0.64 km from Whitsundays - Butterfly Bay (Hook Island)
- Reef Check — Hook Island - Luncheon Bay (Fringing reef leeward) Site 1 (2013): 37% hard coral cover, 0.30 km from Whitsundays - Luncheon Bay (Hook Island)
- Reef Check — Hook Island - Luncheon Bay (Fringing reef leeward) Site 1 (2016): 38% hard coral cover, 0.30 km from Whitsundays - Luncheon Bay (Hook Island)
- Reef Check — Hook Island - Luncheon Bay (Fringing reef leeward) Site 1 (2019): 7.8% hard coral cover, 0.30 km from Whitsundays - Luncheon Bay (Hook Island)
- Reef Check — Hook Island - Luncheon Bay (Fringing reef leeward) Site 1 (2020): 5.0% hard coral cover, 0.30 km from Whitsundays - Luncheon Bay (Hook Island)
- Reef Check — Hook Island - Luncheon Bay (Fringing reef leeward) Site 1 (2021): 6.3% hard coral cover, 0.30 km from Whitsundays - Luncheon Bay (Hook Island)
- Reef Check — Hook Island - Luncheon Bay (Fringing reef leeward) Site 1 (2022): 6.3% hard coral cover, 0.30 km from Whitsundays - Luncheon Bay (Hook Island)
- Reef Check — Hook Island - Luncheon Bay (Fringing reef leeward) Site 1 (2023): 8.1% hard coral cover, 0.30 km from Whitsundays - Luncheon Bay (Hook Island)
- Reef Check — Lady Elliot Island - Coral Gardens (Fringing reef seaward) Site 1 (2013): 58% hard coral cover, 0.40 km from Great Barrier Reef - Lady Elliot Island (southern)
- Reef Check — Lady Elliot Island - Coral Gardens (Fringing reef seaward) Site 1 (2021): 68% hard coral cover, 0.40 km from Great Barrier Reef - Lady Elliot Island (southern)
- Reef Check — Lady Elliot Island - Lady Elliot Reef Lagoon 2 (Reef flat) Site 1 (2013): 22% hard coral cover, 0.40 km from Great Barrier Reef - Lady Elliot Island (southern)
- Reef Check — Lady Elliot Island - Lady Elliot Reef Lagoon 2 (Reef flat) Site 1 (2021): 21% hard coral cover, 0.40 km from Great Barrier Reef - Lady Elliot Island (southern) (2 records)
- Reef Check — Lady Elliot Island - Reefy Seconds (Fringing reef seaward) Site 1 (2013): 53% hard coral cover, 0.39 km from Great Barrier Reef - Lady Elliot Island (southern)
- Reef Check — Lady Elliot Island - Reefy Seconds (Fringing reef seaward) Site 1 (2021): 83% hard coral cover best patch, 0.39 km from Great Barrier Reef - Lady Elliot Island (southern)
- Reef Check — Lady Elliot Island - Sandy Seconds (Fringing reef seaward) Site 1 (2013): 43% hard coral cover, 0.38 km from Great Barrier Reef - Lady Elliot Island (southern)
- Reef Check — Lady Elliot Island - Sandy Seconds (Fringing reef seaward) Site 1 (2021): 63% hard coral cover, 0.38 km from Great Barrier Reef - Lady Elliot Island (southern)
- Reef Check — Lady Elliot Island- Lady Elliot Reef Lagoon (Lagoon) Site 1 (2011): 31% hard coral cover, 0.59 km from Great Barrier Reef - Lady Elliot Island (southern)
- Reef Check — Lady Elliot Island- Lady Elliot Reef Lagoon (Lagoon) Site 1 (2013): 24% hard coral cover, 0.59 km from Great Barrier Reef - Lady Elliot Island (southern)
- Reef Check — Lady Elliot Island- Lady Elliot Reef Lagoon (Lagoon) Site 1 (2021): 13% hard coral cover, 0.59 km from Great Barrier Reef - Lady Elliot Island (southern)
- Reef Check — Maureens Cove (1997): 44% hard coral cover, 2.61 km from Whitsundays - Blue Pearl Bay (Hayman Island)
- Reef Check — Pixie Reef Ribbon #3 (2003): 24% hard coral cover, 2.57 km from N. GBR - Green (AUYG38)
- Reef Check — Ribbon Reef #5 southern patch (1999): 53% hard coral cover, 1.46 km from N. GBR - Blue (AUR514)
- Reef Check — Ribbon Reef 10 - No Name Reef (Back reef slope) Site 1 (1998): 43% hard coral cover, 4.81 km from N. GBR - Green (AUYG41)
- Reef Check — Ribbon Reef 10 - No Name Reef (Back reef slope) Site 1 (1999): 60% hard coral cover, 4.81 km from N. GBR - Green (AUYG41)
- Reef Check — Ribbon Reef 10 - No Name Reef (Back reef slope) Site 1 (2002): 49% hard coral cover, 4.81 km from N. GBR - Green (AUYG41)
- Reef Check — Ribbon Reef 3 - Clam Beds (Back reef slope) Site 1 (2004): 43% hard coral cover, 1.87 km from N. GBR - Blue (AUR513)
- Reef Check — Ribbon Reef 3 - Clam Beds (Back reef slope) Site 1 (2005): 47% hard coral cover, 1.70 km from N. GBR - Blue (AUR513)
- Reef Check — Ribbon Reef 3 - Clam Beds (Back reef slope) Site 1 (2006): 44% hard coral cover, 1.70 km from N. GBR - Blue (AUR513)
- Reef Check — Ribbon Reef 3 - Clam Beds (Back reef slope) Site 1 (2007): 41% hard coral cover, 1.70 km from N. GBR - Blue (AUR513)
- Reef Check — Ribbon Reef 3 - Clam Beds (Back reef slope) Site 1 (2008): 49% hard coral cover, 1.70 km from N. GBR - Blue (AUR513)
- Roelfsema et al. (2021) — 1 (2002): 54% hard coral cover, 0.50 km from Great Barrier Reef - Heron Island (southern)
- Roelfsema et al. (2021) — 1 (2004): 58% hard coral cover, 0.50 km from Great Barrier Reef - Heron Island (southern)
- Roelfsema et al. (2021) — 1 (2005): 63% hard coral cover, 0.50 km from Great Barrier Reef - Heron Island (southern)
- Roelfsema et al. (2021) — 1 (2006): 49% hard coral cover, 0.50 km from Great Barrier Reef - Heron Island (southern)
- Roelfsema et al. (2021) — 1 (2007): 51% hard coral cover, 0.50 km from Great Barrier Reef - Heron Island (southern)
- Roelfsema et al. (2021) — 1 (2008): 33% hard coral cover, 0.50 km from Great Barrier Reef - Heron Island (southern)
- Roelfsema et al. (2021) — 1 (2009): 39% hard coral cover, 0.50 km from Great Barrier Reef - Heron Island (southern)
- Roelfsema et al. (2021) — 1 (2010): 18% hard coral cover, 0.50 km from Great Barrier Reef - Heron Island (southern)
- Roelfsema et al. (2021) — 1 (2013): 35% hard coral cover, 0.50 km from Great Barrier Reef - Heron Island (southern)
- Roelfsema et al. (2021) — 1 (2014): 44% hard coral cover, 0.50 km from Great Barrier Reef - Heron Island (southern)
- Roelfsema et al. (2021) — 1 (2015): 46% hard coral cover, 0.50 km from Great Barrier Reef - Heron Island (southern)
- Roelfsema et al. (2021) — 1 (2016): 58% hard coral cover, 0.50 km from Great Barrier Reef - Heron Island (southern)
- Roelfsema et al. (2021) — 1 (2017): 42% hard coral cover, 0.50 km from Great Barrier Reef - Heron Island (southern)
- Roelfsema et al. (2021) — 1 (2018): 50% hard coral cover, 0.50 km from Great Barrier Reef - Heron Island (southern)
- Roelfsema et al. (2021) — 11 (2002): 20% hard coral cover, 1.41 km from Great Barrier Reef - Heron Island (southern)
- Roelfsema et al. (2021) — 11 (2004): 52% hard coral cover, 1.41 km from Great Barrier Reef - Heron Island (southern)
- Roelfsema et al. (2021) — 11 (2005): 54% hard coral cover, 1.41 km from Great Barrier Reef - Heron Island (southern)
- Roelfsema et al. (2021) — 11 (2006): 45% hard coral cover, 1.41 km from Great Barrier Reef - Heron Island (southern)
- Roelfsema et al. (2021) — 11 (2007): 20% hard coral cover, 1.41 km from Great Barrier Reef - Heron Island (southern)
- Roelfsema et al. (2021) — 11 (2009): 44% hard coral cover, 1.41 km from Great Barrier Reef - Heron Island (southern)
- Roelfsema et al. (2021) — 11 (2010): 46% hard coral cover, 1.41 km from Great Barrier Reef - Heron Island (southern)
- Roelfsema et al. (2021) — 11 (2012): 51% hard coral cover, 1.41 km from Great Barrier Reef - Heron Island (southern)
- Roelfsema et al. (2021) — 11 (2013): 62% hard coral cover, 1.41 km from Great Barrier Reef - Heron Island (southern)
- Roelfsema et al. (2021) — 11 (2014): 65% hard coral cover, 1.41 km from Great Barrier Reef - Heron Island (southern)
- Roelfsema et al. (2021) — 11 (2015): 63% hard coral cover, 1.41 km from Great Barrier Reef - Heron Island (southern)
- Roelfsema et al. (2021) — 11 (2016): 56% hard coral cover, 1.41 km from Great Barrier Reef - Heron Island (southern)
- Roelfsema et al. (2021) — 11 (2017): 59% hard coral cover, 1.41 km from Great Barrier Reef - Heron Island (southern)
- Roelfsema et al. (2021) — 11 (2018): 69% hard coral cover, 1.41 km from Great Barrier Reef - Heron Island (southern)
- Roelfsema et al. (2021) — 12 (2004): 46% hard coral cover, 1.52 km from Great Barrier Reef - Heron Island (southern)
- Roelfsema et al. (2021) — 12 (2005): 37% hard coral cover, 1.52 km from Great Barrier Reef - Heron Island (southern)
- Roelfsema et al. (2021) — 12 (2006): 31% hard coral cover, 1.52 km from Great Barrier Reef - Heron Island (southern)
- Roelfsema et al. (2021) — 12 (2007): 28% hard coral cover, 1.52 km from Great Barrier Reef - Heron Island (southern)
- Roelfsema et al. (2021) — 12 (2009): 32% hard coral cover, 1.52 km from Great Barrier Reef - Heron Island (southern)
- Roelfsema et al. (2021) — 12 (2010): 38% hard coral cover, 1.52 km from Great Barrier Reef - Heron Island (southern)
- Roelfsema et al. (2021) — 12 (2011): 45% hard coral cover, 1.52 km from Great Barrier Reef - Heron Island (southern)
- Roelfsema et al. (2021) — 12 (2012): 51% hard coral cover, 1.52 km from Great Barrier Reef - Heron Island (southern)
- Roelfsema et al. (2021) — 12 (2013): 52% hard coral cover, 1.52 km from Great Barrier Reef - Heron Island (southern)
- Roelfsema et al. (2021) — 12 (2014): 49% hard coral cover, 1.52 km from Great Barrier Reef - Heron Island (southern)
- Roelfsema et al. (2021) — 12 (2015): 38% hard coral cover, 1.52 km from Great Barrier Reef - Heron Island (southern)
- Roelfsema et al. (2021) — 12 (2016): 51% hard coral cover, 1.52 km from Great Barrier Reef - Heron Island (southern)
- Roelfsema et al. (2021) — 12 (2017): 54% hard coral cover, 1.52 km from Great Barrier Reef - Heron Island (southern)
- Roelfsema et al. (2021) — 12 (2018): 51% hard coral cover, 1.52 km from Great Barrier Reef - Heron Island (southern)
- Roelfsema et al. (2021) — 13 (2004): 36% hard coral cover, 1.63 km from Great Barrier Reef - Heron Island (southern)
- Roelfsema et al. (2021) — 13 (2007): 22% hard coral cover, 1.63 km from Great Barrier Reef - Heron Island (southern)
- Roelfsema et al. (2021) — 13 (2009): 18% hard coral cover, 1.63 km from Great Barrier Reef - Heron Island (southern)
- Roelfsema et al. (2021) — 13 (2010): 21% hard coral cover, 1.63 km from Great Barrier Reef - Heron Island (southern)
- Roelfsema et al. (2021) — 13 (2011): 32% hard coral cover, 1.63 km from Great Barrier Reef - Heron Island (southern)
- Roelfsema et al. (2021) — 13 (2012): 28% hard coral cover, 1.63 km from Great Barrier Reef - Heron Island (southern)
- Roelfsema et al. (2021) — 13 (2013): 36% hard coral cover, 1.63 km from Great Barrier Reef - Heron Island (southern)
- Roelfsema et al. (2021) — 13 (2015): 36% hard coral cover, 1.63 km from Great Barrier Reef - Heron Island (southern)
- Roelfsema et al. (2021) — 13 (2016): 36% hard coral cover, 1.63 km from Great Barrier Reef - Heron Island (southern)
- Roelfsema et al. (2021) — 13 (2017): 31% hard coral cover, 1.63 km from Great Barrier Reef - Heron Island (southern)
- Roelfsema et al. (2021) — 13 (2018): 24% hard coral cover, 1.63 km from Great Barrier Reef - Heron Island (southern)
- Roelfsema et al. (2021) — 14 (2004): 43% hard coral cover, 3.10 km from Great Barrier Reef - Heron Island (southern)
- Roelfsema et al. (2021) — 14 (2006): 22% hard coral cover, 3.10 km from Great Barrier Reef - Heron Island (southern)
- Roelfsema et al. (2021) — 14 (2007): 24% hard coral cover, 3.10 km from Great Barrier Reef - Heron Island (southern)
- Roelfsema et al. (2021) — 14 (2009): 22% hard coral cover, 3.10 km from Great Barrier Reef - Heron Island (southern)
- Roelfsema et al. (2021) — 14 (2010): 20% hard coral cover, 3.10 km from Great Barrier Reef - Heron Island (southern)
- Roelfsema et al. (2021) — 14 (2011): 33% hard coral cover, 3.10 km from Great Barrier Reef - Heron Island (southern)
- Roelfsema et al. (2021) — 14 (2012): 42% hard coral cover, 3.10 km from Great Barrier Reef - Heron Island (southern)
- Roelfsema et al. (2021) — 14 (2013): 50% hard coral cover, 3.10 km from Great Barrier Reef - Heron Island (southern)
- Roelfsema et al. (2021) — 14 (2014): 54% hard coral cover, 3.10 km from Great Barrier Reef - Heron Island (southern)
- Roelfsema et al. (2021) — 14 (2015): 53% hard coral cover, 3.10 km from Great Barrier Reef - Heron Island (southern)
- Roelfsema et al. (2021) — 14 (2016): 53% hard coral cover, 3.10 km from Great Barrier Reef - Heron Island (southern)
- Roelfsema et al. (2021) — 14 (2017): 49% hard coral cover, 3.10 km from Great Barrier Reef - Heron Island (southern)
- Roelfsema et al. (2021) — 14 (2018): 53% hard coral cover, 3.10 km from Great Barrier Reef - Heron Island (southern)
- Roelfsema et al. (2021) — 15 (2004): 26% hard coral cover, 3.10 km from Great Barrier Reef - Heron Island (southern)
- Roelfsema et al. (2021) — 15 (2005): 28% hard coral cover, 3.10 km from Great Barrier Reef - Heron Island (southern)
- Roelfsema et al. (2021) — 15 (2006): 20% hard coral cover, 3.10 km from Great Barrier Reef - Heron Island (southern)
- Roelfsema et al. (2021) — 15 (2007): 26% hard coral cover, 3.10 km from Great Barrier Reef - Heron Island (southern)
- Roelfsema et al. (2021) — 15 (2009): 26% hard coral cover, 3.10 km from Great Barrier Reef - Heron Island (southern)
- Roelfsema et al. (2021) — 15 (2010): 33% hard coral cover, 3.10 km from Great Barrier Reef - Heron Island (southern)
- Roelfsema et al. (2021) — 15 (2011): 42% hard coral cover, 3.10 km from Great Barrier Reef - Heron Island (southern)
- Roelfsema et al. (2021) — 15 (2012): 46% hard coral cover, 3.10 km from Great Barrier Reef - Heron Island (southern)
- Roelfsema et al. (2021) — 15 (2013): 56% hard coral cover, 3.10 km from Great Barrier Reef - Heron Island (southern)
- Roelfsema et al. (2021) — 15 (2014): 58% hard coral cover, 3.10 km from Great Barrier Reef - Heron Island (southern)
- Roelfsema et al. (2021) — 15 (2015): 60% hard coral cover, 3.10 km from Great Barrier Reef - Heron Island (southern)
- Roelfsema et al. (2021) — 15 (2016): 69% hard coral cover, 3.10 km from Great Barrier Reef - Heron Island (southern)
- Roelfsema et al. (2021) — 15 (2017): 60% hard coral cover, 3.10 km from Great Barrier Reef - Heron Island (southern)
- Roelfsema et al. (2021) — 15 (2018): 56% hard coral cover, 3.10 km from Great Barrier Reef - Heron Island (southern)
- Roelfsema et al. (2021) — 16 (2002): 18% hard coral cover, 4.60 km from Great Barrier Reef - Heron Island (southern)
- Roelfsema et al. (2021) — 16 (2007): 13% hard coral cover, 4.60 km from Great Barrier Reef - Heron Island (southern)
- Roelfsema et al. (2021) — 16 (2016): 35% hard coral cover, 4.60 km from Great Barrier Reef - Heron Island (southern)
- Roelfsema et al. (2021) — 16 (2017): 31% hard coral cover, 4.60 km from Great Barrier Reef - Heron Island (southern)
- Roelfsema et al. (2021) — 16 (2018): 31% hard coral cover, 4.60 km from Great Barrier Reef - Heron Island (southern)
- Roelfsema et al. (2021) — 2 (2004): 54% hard coral cover, 0.50 km from Great Barrier Reef - Heron Island (southern)
- Roelfsema et al. (2021) — 2 (2005): 46% hard coral cover, 0.50 km from Great Barrier Reef - Heron Island (southern)
- Roelfsema et al. (2021) — 2 (2007): 42% hard coral cover, 0.50 km from Great Barrier Reef - Heron Island (southern)
- Roelfsema et al. (2021) — 2 (2008): 18% hard coral cover, 0.50 km from Great Barrier Reef - Heron Island (southern)
- Roelfsema et al. (2021) — 2 (2009): 18% hard coral cover, 0.50 km from Great Barrier Reef - Heron Island (southern)
- Roelfsema et al. (2021) — 2 (2010): 18% hard coral cover, 0.50 km from Great Barrier Reef - Heron Island (southern)
- Roelfsema et al. (2021) — 2 (2011): 21% hard coral cover, 0.50 km from Great Barrier Reef - Heron Island (southern)
- Roelfsema et al. (2021) — 2 (2012): 26% hard coral cover, 0.50 km from Great Barrier Reef - Heron Island (southern)
- Roelfsema et al. (2021) — 2 (2015): 46% hard coral cover, 0.50 km from Great Barrier Reef - Heron Island (southern)
- Roelfsema et al. (2021) — 2 (2016): 62% hard coral cover, 0.50 km from Great Barrier Reef - Heron Island (southern)
- Roelfsema et al. (2021) — 2 (2017): 46% hard coral cover, 0.50 km from Great Barrier Reef - Heron Island (southern)
- Roelfsema et al. (2021) — 2 (2018): 50% hard coral cover, 0.50 km from Great Barrier Reef - Heron Island (southern)
- Roelfsema et al. (2021) — 3 (2002): 38% hard coral cover, 1.01 km from Great Barrier Reef - Heron Island (southern)
- Roelfsema et al. (2021) — 3 (2004): 39% hard coral cover, 1.01 km from Great Barrier Reef - Heron Island (southern)
- Roelfsema et al. (2021) — 3 (2005): 60% hard coral cover, 1.01 km from Great Barrier Reef - Heron Island (southern)
- Roelfsema et al. (2021) — 3 (2006): 57% hard coral cover, 1.01 km from Great Barrier Reef - Heron Island (southern)
- Roelfsema et al. (2021) — 3 (2007): 31% hard coral cover, 1.01 km from Great Barrier Reef - Heron Island (southern)
- Roelfsema et al. (2021) — 3 (2008): 19% hard coral cover, 1.01 km from Great Barrier Reef - Heron Island (southern)
- Roelfsema et al. (2021) — 3 (2009): 15% hard coral cover, 1.01 km from Great Barrier Reef - Heron Island (southern)
- Roelfsema et al. (2021) — 3 (2010): 15% hard coral cover, 1.01 km from Great Barrier Reef - Heron Island (southern)
- Roelfsema et al. (2021) — 3 (2011): 13% hard coral cover, 1.01 km from Great Barrier Reef - Heron Island (southern)
- Roelfsema et al. (2021) — 3 (2012): 13% hard coral cover, 1.01 km from Great Barrier Reef - Heron Island (southern)
- Roelfsema et al. (2021) — 3 (2013): 22% hard coral cover, 1.01 km from Great Barrier Reef - Heron Island (southern)
- Roelfsema et al. (2021) — 3 (2014): 29% hard coral cover, 1.01 km from Great Barrier Reef - Heron Island (southern)
- Roelfsema et al. (2021) — 3 (2015): 36% hard coral cover, 1.01 km from Great Barrier Reef - Heron Island (southern)
- Roelfsema et al. (2021) — 3 (2016): 44% hard coral cover, 1.01 km from Great Barrier Reef - Heron Island (southern)
- Roelfsema et al. (2021) — 3 (2017): 39% hard coral cover, 1.01 km from Great Barrier Reef - Heron Island (southern)
- Roelfsema et al. (2021) — 3 (2018): 44% hard coral cover, 1.01 km from Great Barrier Reef - Heron Island (southern)
- Roelfsema et al. (2021) — 4 (2004): 39% hard coral cover, 1.86 km from Great Barrier Reef - Heron Island (southern)
- Roelfsema et al. (2021) — 4 (2005): 36% hard coral cover, 1.86 km from Great Barrier Reef - Heron Island (southern)
- Roelfsema et al. (2021) — 4 (2006): 28% hard coral cover, 1.86 km from Great Barrier Reef - Heron Island (southern)
- Roelfsema et al. (2021) — 4 (2008): 17% hard coral cover, 1.86 km from Great Barrier Reef - Heron Island (southern)
- Roelfsema et al. (2021) — 4 (2009): 22% hard coral cover, 1.86 km from Great Barrier Reef - Heron Island (southern)
- Roelfsema et al. (2021) — 4 (2010): 9.7% hard coral cover, 1.86 km from Great Barrier Reef - Heron Island (southern)
- Roelfsema et al. (2021) — 4 (2011): 15% hard coral cover, 1.86 km from Great Barrier Reef - Heron Island (southern)
- Roelfsema et al. (2021) — 4 (2012): 19% hard coral cover, 1.86 km from Great Barrier Reef - Heron Island (southern)
- Roelfsema et al. (2021) — 4 (2013): 25% hard coral cover, 1.86 km from Great Barrier Reef - Heron Island (southern)
- Roelfsema et al. (2021) — 4 (2014): 28% hard coral cover, 1.86 km from Great Barrier Reef - Heron Island (southern)
- Roelfsema et al. (2021) — 4 (2015): 33% hard coral cover, 1.86 km from Great Barrier Reef - Heron Island (southern)
- Roelfsema et al. (2021) — 4 (2016): 38% hard coral cover, 1.86 km from Great Barrier Reef - Heron Island (southern)
- Roelfsema et al. (2021) — 4 (2017): 36% hard coral cover, 1.86 km from Great Barrier Reef - Heron Island (southern)
- Roelfsema et al. (2021) — 4 (2018): 38% hard coral cover, 1.86 km from Great Barrier Reef - Heron Island (southern)
- Roelfsema et al. (2021) — 5 (2004): 39% hard coral cover, 1.86 km from Great Barrier Reef - Heron Island (southern)
- Roelfsema et al. (2021) — 5 (2005): 28% hard coral cover, 1.86 km from Great Barrier Reef - Heron Island (southern)
- Roelfsema et al. (2021) — 5 (2006): 21% hard coral cover, 1.86 km from Great Barrier Reef - Heron Island (southern)
- Roelfsema et al. (2021) — 5 (2009): 42% hard coral cover, 1.86 km from Great Barrier Reef - Heron Island (southern)
- Roelfsema et al. (2021) — 5 (2010): 8.3% hard coral cover, 1.86 km from Great Barrier Reef - Heron Island (southern)
- Roelfsema et al. (2021) — 5 (2011): 14% hard coral cover, 1.86 km from Great Barrier Reef - Heron Island (southern)
- Roelfsema et al. (2021) — 5 (2012): 18% hard coral cover, 1.86 km from Great Barrier Reef - Heron Island (southern)
- Roelfsema et al. (2021) — 5 (2013): 26% hard coral cover, 1.86 km from Great Barrier Reef - Heron Island (southern)
- Roelfsema et al. (2021) — 5 (2014): 38% hard coral cover, 1.86 km from Great Barrier Reef - Heron Island (southern)
- Roelfsema et al. (2021) — 5 (2018): 42% hard coral cover, 1.86 km from Great Barrier Reef - Heron Island (southern)
- Roelfsema et al. (2021) — 6 (2007): 22% hard coral cover, 2.75 km from Great Barrier Reef - Heron Island (southern)
- Roelfsema et al. (2021) — 6 (2008): 21% hard coral cover, 2.75 km from Great Barrier Reef - Heron Island (southern)
- Roelfsema et al. (2021) — 6 (2009): 11% hard coral cover, 2.75 km from Great Barrier Reef - Heron Island (southern)
- Roelfsema et al. (2021) — 6 (2010): 9.7% hard coral cover, 2.75 km from Great Barrier Reef - Heron Island (southern)
- Roelfsema et al. (2021) — 6 (2011): 19% hard coral cover, 2.75 km from Great Barrier Reef - Heron Island (southern)
- Roelfsema et al. (2021) — 6 (2012): 21% hard coral cover, 2.75 km from Great Barrier Reef - Heron Island (southern)
- Roelfsema et al. (2021) — 6 (2013): 28% hard coral cover, 2.75 km from Great Barrier Reef - Heron Island (southern)
- Roelfsema et al. (2021) — 6 (2014): 36% hard coral cover, 2.75 km from Great Barrier Reef - Heron Island (southern)
- Roelfsema et al. (2021) — 6 (2015): 45% hard coral cover, 2.75 km from Great Barrier Reef - Heron Island (southern)
- Roelfsema et al. (2021) — 6 (2016): 47% hard coral cover, 2.75 km from Great Barrier Reef - Heron Island (southern)
- Roelfsema et al. (2021) — 6 (2017): 47% hard coral cover, 2.75 km from Great Barrier Reef - Heron Island (southern)
- Roelfsema et al. (2021) — 6 (2018): 46% hard coral cover, 2.75 km from Great Barrier Reef - Heron Island (southern)
- Roelfsema et al. (2021) — 7 (2015): 44% hard coral cover, 3.81 km from Great Barrier Reef - Heron Island (southern)
- Roelfsema et al. (2021) — 7 (2016): 40% hard coral cover, 3.81 km from Great Barrier Reef - Heron Island (southern)
- Roelfsema et al. (2021) — 7 (2017): 33% hard coral cover, 3.81 km from Great Barrier Reef - Heron Island (southern)
- Roelfsema et al. (2021) — 7 (2018): 31% hard coral cover, 3.81 km from Great Barrier Reef - Heron Island (southern)
- Roelfsema et al. (2021) — 8 (2008): 13% hard coral cover, 4.82 km from Great Barrier Reef - Heron Island (southern)
- Roelfsema et al. (2021) — 8 (2015): 31% hard coral cover, 4.82 km from Great Barrier Reef - Heron Island (southern)
- Roelfsema et al. (2021) — 8 (2016): 39% hard coral cover, 4.82 km from Great Barrier Reef - Heron Island (southern)
- Roelfsema et al. (2021) — 8 (2017): 28% hard coral cover, 4.82 km from Great Barrier Reef - Heron Island (southern)
- Roelfsema et al. (2021) — 8 (2018): 22% hard coral cover, 4.82 km from Great Barrier Reef - Heron Island (southern)
- Roelfsema et al. (2021) — A (2002): 25% hard coral cover, 1.41 km from Great Barrier Reef - Heron Island (southern)
- Roelfsema et al. (2021) — A (2005): 0.6% hard coral cover, 1.41 km from Great Barrier Reef - Heron Island (southern)
- Roelfsema et al. (2021) — A (2006): 6.3% hard coral cover, 1.41 km from Great Barrier Reef - Heron Island (southern)
- Roelfsema et al. (2021) — A (2007): 11% hard coral cover, 1.41 km from Great Barrier Reef - Heron Island (southern)
- Roelfsema et al. (2021) — A (2008): 18% hard coral cover, 1.41 km from Great Barrier Reef - Heron Island (southern)
- Roelfsema et al. (2021) — A (2010): 13% hard coral cover, 1.41 km from Great Barrier Reef - Heron Island (southern)
- Roelfsema et al. (2021) — A (2011): 16% hard coral cover, 1.41 km from Great Barrier Reef - Heron Island (southern)
- Roelfsema et al. (2021) — A (2012): 8.8% hard coral cover, 1.41 km from Great Barrier Reef - Heron Island (southern)
- Roelfsema et al. (2021) — A (2013): 12% hard coral cover, 1.41 km from Great Barrier Reef - Heron Island (southern)
- Roelfsema et al. (2021) — A (2014): 5.0% hard coral cover, 1.41 km from Great Barrier Reef - Heron Island (southern)
- Roelfsema et al. (2021) — A (2015): 5.0% hard coral cover, 1.41 km from Great Barrier Reef - Heron Island (southern)
- Roelfsema et al. (2021) — A (2016): 14% hard coral cover, 1.41 km from Great Barrier Reef - Heron Island (southern)
- Roelfsema et al. (2021) — A (2017): 11% hard coral cover, 1.41 km from Great Barrier Reef - Heron Island (southern)
- Roelfsema et al. (2021) — A (2018): 7.5% hard coral cover, 1.41 km from Great Barrier Reef - Heron Island (southern)
- Roelfsema et al. (2021) — B (2002): 14% hard coral cover, 0.50 km from Great Barrier Reef - Heron Island (southern)
- Roelfsema et al. (2021) — B (2005): 38% hard coral cover, 0.50 km from Great Barrier Reef - Heron Island (southern)
- Roelfsema et al. (2021) — B (2006): 18% hard coral cover, 0.50 km from Great Barrier Reef - Heron Island (southern)
- Roelfsema et al. (2021) — B (2007): 18% hard coral cover, 0.50 km from Great Barrier Reef - Heron Island (southern)
- Roelfsema et al. (2021) — B (2008): 18% hard coral cover, 0.50 km from Great Barrier Reef - Heron Island (southern)
- Roelfsema et al. (2021) — B (2009): 19% hard coral cover, 0.50 km from Great Barrier Reef - Heron Island (southern)
- Roelfsema et al. (2021) — B (2010): 16% hard coral cover, 0.50 km from Great Barrier Reef - Heron Island (southern)
- Roelfsema et al. (2021) — B (2011): 18% hard coral cover, 0.50 km from Great Barrier Reef - Heron Island (southern)
- Roelfsema et al. (2021) — B (2012): 20% hard coral cover, 0.50 km from Great Barrier Reef - Heron Island (southern)
- Roelfsema et al. (2021) — B (2013): 24% hard coral cover, 0.50 km from Great Barrier Reef - Heron Island (southern)
- Roelfsema et al. (2021) — B (2014): 19% hard coral cover, 0.50 km from Great Barrier Reef - Heron Island (southern)
- Roelfsema et al. (2021) — B (2015): 24% hard coral cover, 0.50 km from Great Barrier Reef - Heron Island (southern)
- Roelfsema et al. (2021) — B (2016): 24% hard coral cover, 0.50 km from Great Barrier Reef - Heron Island (southern)
- Roelfsema et al. (2021) — B (2017): 11% hard coral cover, 0.50 km from Great Barrier Reef - Heron Island (southern)
- Roelfsema et al. (2021) — B (2018): 11% hard coral cover, 0.50 km from Great Barrier Reef - Heron Island (southern)
- Roelfsema et al. (2021) — C (2006): 14% hard coral cover, 0.50 km from Great Barrier Reef - Heron Island (southern)
- Roelfsema et al. (2021) — C (2007): 14% hard coral cover, 0.50 km from Great Barrier Reef - Heron Island (southern)
- Roelfsema et al. (2021) — C (2008): 14% hard coral cover, 0.50 km from Great Barrier Reef - Heron Island (southern)
- Roelfsema et al. (2021) — C (2009): 13% hard coral cover, 0.50 km from Great Barrier Reef - Heron Island (southern)
- Roelfsema et al. (2021) — C (2010): 14% hard coral cover, 0.50 km from Great Barrier Reef - Heron Island (southern)
- Roelfsema et al. (2021) — C (2011): 12% hard coral cover, 0.50 km from Great Barrier Reef - Heron Island (southern)
- Roelfsema et al. (2021) — C (2012): 13% hard coral cover, 0.50 km from Great Barrier Reef - Heron Island (southern)
- Roelfsema et al. (2021) — C (2013): 18% hard coral cover, 0.50 km from Great Barrier Reef - Heron Island (southern)
- Roelfsema et al. (2021) — C (2014): 15% hard coral cover, 0.50 km from Great Barrier Reef - Heron Island (southern)
- Roelfsema et al. (2021) — C (2015): 22% hard coral cover, 0.50 km from Great Barrier Reef - Heron Island (southern)
- Roelfsema et al. (2021) — C (2016): 24% hard coral cover, 0.50 km from Great Barrier Reef - Heron Island (southern)
- Roelfsema et al. (2021) — C (2017): 12% hard coral cover, 0.50 km from Great Barrier Reef - Heron Island (southern)
- Roelfsema et al. (2021) — C (2018): 18% hard coral cover, 0.50 km from Great Barrier Reef - Heron Island (southern)
- Roelfsema et al. (2021) — D (2004): 29% hard coral cover, 0.77 km from Great Barrier Reef - Heron Island (southern)
- Roelfsema et al. (2021) — D (2005): 14% hard coral cover, 0.77 km from Great Barrier Reef - Heron Island (southern)
- Roelfsema et al. (2021) — D (2006): 8.8% hard coral cover, 0.77 km from Great Barrier Reef - Heron Island (southern)
- Roelfsema et al. (2021) — D (2007): 28% hard coral cover, 0.77 km from Great Barrier Reef - Heron Island (southern)
- Roelfsema et al. (2021) — D (2009): 11% hard coral cover, 0.77 km from Great Barrier Reef - Heron Island (southern)
- Roelfsema et al. (2021) — D (2010): 8.8% hard coral cover, 0.77 km from Great Barrier Reef - Heron Island (southern)
- Roelfsema et al. (2021) — D (2011): 11% hard coral cover, 0.77 km from Great Barrier Reef - Heron Island (southern)
- Roelfsema et al. (2021) — D (2012): 11% hard coral cover, 0.77 km from Great Barrier Reef - Heron Island (southern)
- Roelfsema et al. (2021) — D (2014): 16% hard coral cover, 0.77 km from Great Barrier Reef - Heron Island (southern)
- Roelfsema et al. (2021) — D (2015): 19% hard coral cover, 0.77 km from Great Barrier Reef - Heron Island (southern)
- Roelfsema et al. (2021) — D (2016): 16% hard coral cover, 0.77 km from Great Barrier Reef - Heron Island (southern)
- Roelfsema et al. (2021) — D (2018): 14% hard coral cover, 0.77 km from Great Barrier Reef - Heron Island (southern)
- Roelfsema et al. (2021) — E (2004): 47% hard coral cover, 1.52 km from Great Barrier Reef - Heron Island (southern)
- Roelfsema et al. (2021) — E (2005): 55% hard coral cover, 1.52 km from Great Barrier Reef - Heron Island (southern)
- Roelfsema et al. (2021) — E (2007): 23% hard coral cover, 1.52 km from Great Barrier Reef - Heron Island (southern)
- Roelfsema et al. (2021) — E (2008): 21% hard coral cover, 1.52 km from Great Barrier Reef - Heron Island (southern)
- Roelfsema et al. (2021) — E (2009): 18% hard coral cover, 1.52 km from Great Barrier Reef - Heron Island (southern)
- Roelfsema et al. (2021) — E (2010): 23% hard coral cover, 1.52 km from Great Barrier Reef - Heron Island (southern)
- Roelfsema et al. (2021) — E (2012): 24% hard coral cover, 1.52 km from Great Barrier Reef - Heron Island (southern)
- Roelfsema et al. (2021) — E (2013): 21% hard coral cover, 1.52 km from Great Barrier Reef - Heron Island (southern)
- Roelfsema et al. (2021) — E (2014): 28% hard coral cover, 1.52 km from Great Barrier Reef - Heron Island (southern)
- Roelfsema et al. (2021) — E (2015): 25% hard coral cover, 1.52 km from Great Barrier Reef - Heron Island (southern)
- Roelfsema et al. (2021) — E (2016): 27% hard coral cover, 1.52 km from Great Barrier Reef - Heron Island (southern)
- Roelfsema et al. (2021) — E (2017): 14% hard coral cover, 1.52 km from Great Barrier Reef - Heron Island (southern)
- Roelfsema et al. (2021) — E (2018): 21% hard coral cover, 1.52 km from Great Barrier Reef - Heron Island (southern)
- Roelfsema et al. (2021) — F (2004): 57% hard coral cover, 1.52 km from Great Barrier Reef - Heron Island (southern)
- Roelfsema et al. (2021) — F (2005): 6.9% hard coral cover, 1.52 km from Great Barrier Reef - Heron Island (southern)
- Roelfsema et al. (2021) — F (2006): 2.8% hard coral cover, 1.52 km from Great Barrier Reef - Heron Island (southern)
- Roelfsema et al. (2021) — F (2009): 16% hard coral cover, 1.52 km from Great Barrier Reef - Heron Island (southern)
- Roelfsema et al. (2021) — F (2010): 20% hard coral cover, 1.52 km from Great Barrier Reef - Heron Island (southern)
- Roelfsema et al. (2021) — F (2011): 16% hard coral cover, 1.52 km from Great Barrier Reef - Heron Island (southern)
- Roelfsema et al. (2021) — F (2012): 11% hard coral cover, 1.52 km from Great Barrier Reef - Heron Island (southern)
- Roelfsema et al. (2021) — F (2013): 21% hard coral cover, 1.52 km from Great Barrier Reef - Heron Island (southern)
- Roelfsema et al. (2021) — F (2014): 22% hard coral cover, 1.52 km from Great Barrier Reef - Heron Island (southern)
- Roelfsema et al. (2021) — F (2015): 18% hard coral cover, 1.52 km from Great Barrier Reef - Heron Island (southern)
- Roelfsema et al. (2021) — F (2016): 20% hard coral cover, 1.52 km from Great Barrier Reef - Heron Island (southern)
- Roelfsema et al. (2021) — F (2018): 10% hard coral cover, 1.52 km from Great Barrier Reef - Heron Island (southern)
- Roelfsema et al. (2021) — G (2006): 14% hard coral cover, 0.50 km from Great Barrier Reef - Heron Island (southern)
- Roelfsema et al. (2021) — G (2007): 2.5% hard coral cover, 0.50 km from Great Barrier Reef - Heron Island (southern)
- Roelfsema et al. (2021) — G (2009): 8.1% hard coral cover, 0.50 km from Great Barrier Reef - Heron Island (southern)
- Roelfsema et al. (2021) — G (2010): 1.3% hard coral cover, 0.50 km from Great Barrier Reef - Heron Island (southern)
- Roelfsema et al. (2021) — G (2011): 3.8% hard coral cover, 0.50 km from Great Barrier Reef - Heron Island (southern)
- Roelfsema et al. (2021) — G (2012): 3.8% hard coral cover, 0.50 km from Great Barrier Reef - Heron Island (southern)
- Roelfsema et al. (2021) — G (2013): 5.0% hard coral cover, 0.50 km from Great Barrier Reef - Heron Island (southern)
- Roelfsema et al. (2021) — G (2014): 5.0% hard coral cover, 0.50 km from Great Barrier Reef - Heron Island (southern)
- Roelfsema et al. (2021) — G (2015): 11% hard coral cover, 0.50 km from Great Barrier Reef - Heron Island (southern)
- Roelfsema et al. (2021) — G (2016): 20% hard coral cover, 0.50 km from Great Barrier Reef - Heron Island (southern)
- Roelfsema et al. (2021) — G (2017): 4.4% hard coral cover, 0.50 km from Great Barrier Reef - Heron Island (southern)
- Roelfsema et al. (2021) — H (2006): 2.5% hard coral cover, 0.77 km from Great Barrier Reef - Heron Island (southern)
- Roelfsema et al. (2021) — H (2007): 2.5% hard coral cover, 0.77 km from Great Barrier Reef - Heron Island (southern)
- Roelfsema et al. (2021) — H (2008): 1.9% hard coral cover, 0.77 km from Great Barrier Reef - Heron Island (southern)
- Roelfsema et al. (2021) — H (2009): 3.8% hard coral cover, 0.77 km from Great Barrier Reef - Heron Island (southern)
- Roelfsema et al. (2021) — H (2010): 1.9% hard coral cover, 0.77 km from Great Barrier Reef - Heron Island (southern)
- Roelfsema et al. (2021) — H (2011): 5.6% hard coral cover, 0.77 km from Great Barrier Reef - Heron Island (southern)
- Roelfsema et al. (2021) — H (2012): 1.9% hard coral cover, 0.77 km from Great Barrier Reef - Heron Island (southern)
- Roelfsema et al. (2021) — H (2013): 3.8% hard coral cover, 0.77 km from Great Barrier Reef - Heron Island (southern)
- Roelfsema et al. (2021) — H (2015): 4.4% hard coral cover, 0.77 km from Great Barrier Reef - Heron Island (southern)
- Roelfsema et al. (2021) — H (2016): 4.4% hard coral cover, 0.77 km from Great Barrier Reef - Heron Island (southern)
- Roelfsema et al. (2021) — H (2017): 2.5% hard coral cover, 0.77 km from Great Barrier Reef - Heron Island (southern)
- Roelfsema et al. (2021) — H (2018): 3.8% hard coral cover, 0.77 km from Great Barrier Reef - Heron Island (southern)
- Roelfsema et al. (2021) — I (2004): 44% hard coral cover, 0.50 km from Great Barrier Reef - Heron Island (southern)
- Roelfsema et al. (2021) — I (2005): 16% hard coral cover, 0.50 km from Great Barrier Reef - Heron Island (southern)
- Roelfsema et al. (2021) — I (2006): 2.5% hard coral cover, 0.50 km from Great Barrier Reef - Heron Island (southern)
- Roelfsema et al. (2021) — I (2007): 8.8% hard coral cover, 0.50 km from Great Barrier Reef - Heron Island (southern)
- Roelfsema et al. (2021) — I (2008): 5.6% hard coral cover, 0.50 km from Great Barrier Reef - Heron Island (southern)
- Roelfsema et al. (2021) — I (2009): 10% hard coral cover, 0.50 km from Great Barrier Reef - Heron Island (southern)
- Roelfsema et al. (2021) — I (2010): 9.4% hard coral cover, 0.50 km from Great Barrier Reef - Heron Island (southern)
- Roelfsema et al. (2021) — I (2012): 8.8% hard coral cover, 0.50 km from Great Barrier Reef - Heron Island (southern)
- Roelfsema et al. (2021) — I (2014): 11% hard coral cover, 0.50 km from Great Barrier Reef - Heron Island (southern)
- Roelfsema et al. (2021) — I (2015): 12% hard coral cover, 0.50 km from Great Barrier Reef - Heron Island (southern)
- Roelfsema et al. (2021) — I (2016): 12% hard coral cover, 0.50 km from Great Barrier Reef - Heron Island (southern)
- Roelfsema et al. (2021) — I (2017): 6.3% hard coral cover, 0.50 km from Great Barrier Reef - Heron Island (southern)
- Roelfsema et al. (2021) — I (2018): 10% hard coral cover, 0.50 km from Great Barrier Reef - Heron Island (southern)
- Roelfsema et al. (2021) — J (2006): 3.8% hard coral cover, 1.63 km from Great Barrier Reef - Heron Island (southern)
- Roelfsema et al. (2021) — J (2009): 3.1% hard coral cover, 1.63 km from Great Barrier Reef - Heron Island (southern)
- Roelfsema et al. (2021) — J (2010): 3.1% hard coral cover, 1.63 km from Great Barrier Reef - Heron Island (southern)
- Roelfsema et al. (2021) — J (2011): 3.8% hard coral cover, 1.63 km from Great Barrier Reef - Heron Island (southern)
- Roelfsema et al. (2021) — J (2012): 1.3% hard coral cover, 1.63 km from Great Barrier Reef - Heron Island (southern)
- Roelfsema et al. (2021) — J (2014): 4.1% hard coral cover, 1.63 km from Great Barrier Reef - Heron Island (southern)
- Roelfsema et al. (2021) — J (2015): 2.5% hard coral cover, 1.63 km from Great Barrier Reef - Heron Island (southern)
- Roelfsema et al. (2021) — J (2016): 2.5% hard coral cover, 1.63 km from Great Barrier Reef - Heron Island (southern)
- Roelfsema et al. (2021) — J (2017): 3.1% hard coral cover, 1.63 km from Great Barrier Reef - Heron Island (southern)
- Roelfsema et al. (2021) — J (2018): 1.9% hard coral cover, 1.63 km from Great Barrier Reef - Heron Island (southern)
- Roelfsema et al. (2021) — K (2002): 2.2% hard coral cover, 0.77 km from Great Barrier Reef - Heron Island (southern)
- Roelfsema et al. (2021) — K (2005): 1.9% hard coral cover, 0.77 km from Great Barrier Reef - Heron Island (southern)
- Roelfsema et al. (2021) — K (2006): 1.9% hard coral cover, 0.77 km from Great Barrier Reef - Heron Island (southern)
- Roelfsema et al. (2021) — K (2007): 5.0% hard coral cover, 0.77 km from Great Barrier Reef - Heron Island (southern)
- Roelfsema et al. (2021) — K (2008): 6.3% hard coral cover, 0.77 km from Great Barrier Reef - Heron Island (southern)
- Roelfsema et al. (2021) — K (2009): 6.9% hard coral cover, 0.77 km from Great Barrier Reef - Heron Island (southern)
- Roelfsema et al. (2021) — K (2010): 4.4% hard coral cover, 0.77 km from Great Barrier Reef - Heron Island (southern)
- Roelfsema et al. (2021) — K (2011): 8.1% hard coral cover, 0.77 km from Great Barrier Reef - Heron Island (southern)
- Roelfsema et al. (2021) — K (2012): 8.1% hard coral cover, 0.77 km from Great Barrier Reef - Heron Island (southern)
- Roelfsema et al. (2021) — K (2013): 10% hard coral cover, 0.77 km from Great Barrier Reef - Heron Island (southern)
- Roelfsema et al. (2021) — K (2014): 9.4% hard coral cover, 0.77 km from Great Barrier Reef - Heron Island (southern)
- Roelfsema et al. (2021) — K (2015): 14% hard coral cover, 0.77 km from Great Barrier Reef - Heron Island (southern)
- Roelfsema et al. (2021) — K (2016): 9.4% hard coral cover, 0.77 km from Great Barrier Reef - Heron Island (southern)
- Roelfsema et al. (2021) — K (2018): 8.8% hard coral cover, 0.77 km from Great Barrier Reef - Heron Island (southern)
- XL Catlin Seaview Survey — transect 11001 (2012): 11% hard coral cover, 4.93 km from Great Barrier Reef - Townsville / Davies Reef
- XL Catlin Seaview Survey — transect 11002 (2012): 16% hard coral cover, 2.68 km from Great Barrier Reef - Townsville / Davies Reef
- XL Catlin Seaview Survey — transect 12003 (2012): 38% hard coral cover, 1.72 km from N. GBR - Blue (AUR513)
- XL Catlin Seaview Survey — transect 12004 (2014): 7.7% hard coral cover, 1.41 km from N. GBR - Green (AUYG41)
- XL Catlin Seaview Survey — transect 12004 (2016): 5.1% hard coral cover, 0.65 km from N. GBR - Green (AUYG37)
- XL Catlin Seaview Survey — transect 12004 (2017): 4.3% hard coral cover, 1.23 km from N. GBR - Green (AUYG41)
- XL Catlin Seaview Survey — transect 12005 (2012): 17% hard coral cover, 0.78 km from N. GBR - Pink (AUCT50)
- XL Catlin Seaview Survey — transect 12005 (2014): 8.7% hard coral cover, 0.91 km from N. GBR - Green (AUYG39)
- XL Catlin Seaview Survey — transect 12005 (2016): 6.4% hard coral cover, 0.90 km from N. GBR - Green (AUYG39)
- XL Catlin Seaview Survey — transect 12005 (2017): 5.9% hard coral cover, 0.80 km from N. GBR - Pink (AUCT50)
- XL Catlin Seaview Survey — transect 12007 (2012): 18% hard coral cover, 2.22 km from N. GBR - Blue (AUHK44)
- XL Catlin Seaview Survey — transect 12025 (2012): 19% hard coral cover, 2.47 km from N. GBR - Pink (AUCT51)
- XL Catlin Seaview Survey — transect 12025 (2014): 15% hard coral cover, 2.47 km from N. GBR - Pink (AUCT51)
- XL Catlin Seaview Survey — transect 12025 (2016): 13% hard coral cover, 2.41 km from N. GBR - Pink (AUCT51)
- XL Catlin Seaview Survey — transect 12025 (2017): 17% hard coral cover, 2.34 km from N. GBR - Pink (AUCT51)
- XL Catlin Seaview Survey — transect 12026 (2012): 19% hard coral cover, 4.68 km from N. GBR - Blue (AUHK47)
- XL Catlin Seaview Survey — transect 12026 (2014): 11% hard coral cover, 4.88 km from N. GBR - Blue (AUHK47)
- XL Catlin Seaview Survey — transect 12026 (2016): 7.3% hard coral cover, 4.89 km from N. GBR - Blue (AUHK47)
- XL Catlin Seaview Survey — transect 12026 (2017): 7.5% hard coral cover, 3.10 km from N. GBR - Blue (AUHK47)
- XL Catlin Seaview Survey — transect 12027 (2012): 24% hard coral cover, 2.54 km from N. GBR - Blue (AUHK47)
- XL Catlin Seaview Survey — transect 12027 (2014): 14% hard coral cover, 2.57 km from N. GBR - Blue (AUHK47)
- XL Catlin Seaview Survey — transect 12027 (2016): 7.8% hard coral cover, 2.54 km from N. GBR - Blue (AUHK47)
- XL Catlin Seaview Survey — transect 12027 (2017): 7.3% hard coral cover, 1.65 km from N. GBR - Blue (AUHK44)
- XL Catlin Seaview Survey — transect 12028 (2012): 24% hard coral cover, 0.87 km from N. GBR - Green (AUYG38)
- XL Catlin Seaview Survey — transect 12028 (2014): 16% hard coral cover, 0.71 km from N. GBR - Green (AUYG38)
- XL Catlin Seaview Survey — transect 12028 (2016): 11% hard coral cover, 0.77 km from N. GBR - Green (AUYG38)
- XL Catlin Seaview Survey — transect 12028 (2017): 8.6% hard coral cover, 0.68 km from N. GBR - Green (AUYG38)
- XL Catlin Seaview Survey — transect 12036 (2012): 15% hard coral cover, 0.68 km from N. GBR - Blue (AUR518)
- XL Catlin Seaview Survey — transect 12036 (2014): 17% hard coral cover, 0.77 km from N. GBR - Blue (AUR518)
- XL Catlin Seaview Survey — transect 12036 (2016): 12% hard coral cover, 0.21 km from N. GBR - Blue (AUR514)
- XL Catlin Seaview Survey — transect 12036 (2017): 11% hard coral cover, 0.05 km from N. GBR - Blue (AUR514)
- XL Catlin Seaview Survey — transect 12037 (2012): 18% hard coral cover, 2.15 km from N. GBR - Blue (AUR514)
- XL Catlin Seaview Survey — transect 12037 (2016): 7.0% hard coral cover, 1.63 km from N. GBR - Blue (AUR513)
- XL Catlin Seaview Survey — transect 12037 (2017): 9.5% hard coral cover, 1.62 km from N. GBR - Blue (AUR513)
- XL Catlin Seaview Survey — transect 12038 (2012): 14% hard coral cover, 1.42 km from N. GBR - Blue (AUR516)
- XL Catlin Seaview Survey — transect 12038 (2014): 27% hard coral cover, 1.24 km from N. GBR - Blue (AUR515)
- XL Catlin Seaview Survey — transect 12038 (2016): 8.0% hard coral cover, 1.27 km from N. GBR - Blue (AUR515)
- XL Catlin Seaview Survey — transect 12038 (2017): 10% hard coral cover, 1.24 km from N. GBR - Blue (AUR515)
- XL Catlin Seaview Survey — transect 13002 (2016): 14% hard coral cover, 5.00 km from Great Barrier Reef - Heron Island (southern)
- XL Catlin Seaview Survey — transect 15001 (2014): 22% hard coral cover, 4.74 km from N. GBR - Green (AUWO105)
- XL Catlin Seaview Survey — transect 15001 (2017): 20% hard coral cover, 4.76 km from N. GBR - Green (AUWO105)
- XL Catlin Seaview Survey — transect 15002 (2012): 25% hard coral cover, 1.72 km from N. GBR - Green (AUWO103)
- XL Catlin Seaview Survey — transect 15005 (2012): 34% hard coral cover, 4.26 km from N. GBR - Green (AUWO103)
- XL Catlin Seaview Survey — transect 15022 (2012): 32% hard coral cover, 1.78 km from N. GBR - Green (AU74148)
- XL Catlin Seaview Survey — transect 15022 (2016): 17% hard coral cover, 2.33 km from N. GBR - Green (AU74148)
- XL Catlin Seaview Survey — transect 15023 (2012): 32% hard coral cover, 0.54 km from N. GBR - Blue (AU116155)
- XL Catlin Seaview Survey — transect 15023 (2016): 26% hard coral cover, 0.53 km from N. GBR - Blue (AU116155)
- XL Catlin Seaview Survey — transect 15024 (2012): 16% hard coral cover, 0.22 km from N. GBR - Green (AU74148)
- XL Catlin Seaview Survey — transect 15024 (2016): 16% hard coral cover, 0.19 km from N. GBR - Green (AU74148)
- XL Catlin Seaview Survey — transect 40001 (2014): 39% hard coral cover, 1.16 km from Great Barrier Reef - Heron Island (southern)
- XL Catlin Seaview Survey — transect 40001 (2016): 38% hard coral cover, 1.20 km from Great Barrier Reef - Heron Island (southern)
- XL Catlin Seaview Survey — transect 40002 (2014): 40% hard coral cover, 1.14 km from Great Barrier Reef - Heron Island (southern)
- XL Catlin Seaview Survey — transect 41001 (2016): 38% hard coral cover, 1.17 km from Great Barrier Reef - Heron Island (southern)
- XL Catlin Seaview Survey — transect 41003 (2016): 25% hard coral cover, 1.67 km from Great Barrier Reef - Heron Island (southern)
- submitted to MERMAID by Sobczak P.* — Lady Elliot Island Dive Site (2025): 73% hard coral cover best patch, 0.43 km from Great Barrier Reef - Lady Elliot Island (southern)
All images from Coral Reef Diagnostics. Data are from the Khaled bin Sultan Living Oceans Foundation Global Reef Expedition, Coral Reef Diagnostics, Reef Check Foundation, Australian Institute of Marine Science, Global Coral Reef Monitoring Network, XL Catlin Seaview Survey (University of Queensland), and Roelfsema et al. (2021).
© Coral Reef Diagnostics.