
Part of the regional summaries: Australia (GBR) - Far North: Blue stations (Habitat Protection Zone reefs) and Australia (GBR)
More info
Far Northern GBR (NOAA CRW virtual station)A bommie field (dived to 16.1 m) on Unnamed Reef 116 in the far northern Great Barrier Reef with 57% cover, where bommie flanks are packed with yellow fire coral, blue-gray Porites, and pink and lavender Acropora, and a 4-6 m coral spire is crowned with table and staghorn corals. Dying needle coral (Seriatopora hystrix) turned up on most transects in September 2014, 18 months before the back-to-back mass bleaching events. Surveyed on the Living Oceans Foundation's Global Reef Expedition.
Two independent survey stations shown with the program’s logo — click one to see how far it is from this site.
Eight other CRD dive sites within 5 km shown in orange — click a marker to open its page.
5 of the 6 photographs on this page are shown beside the text that discusses them under "Site description" below.
Site description
Setting
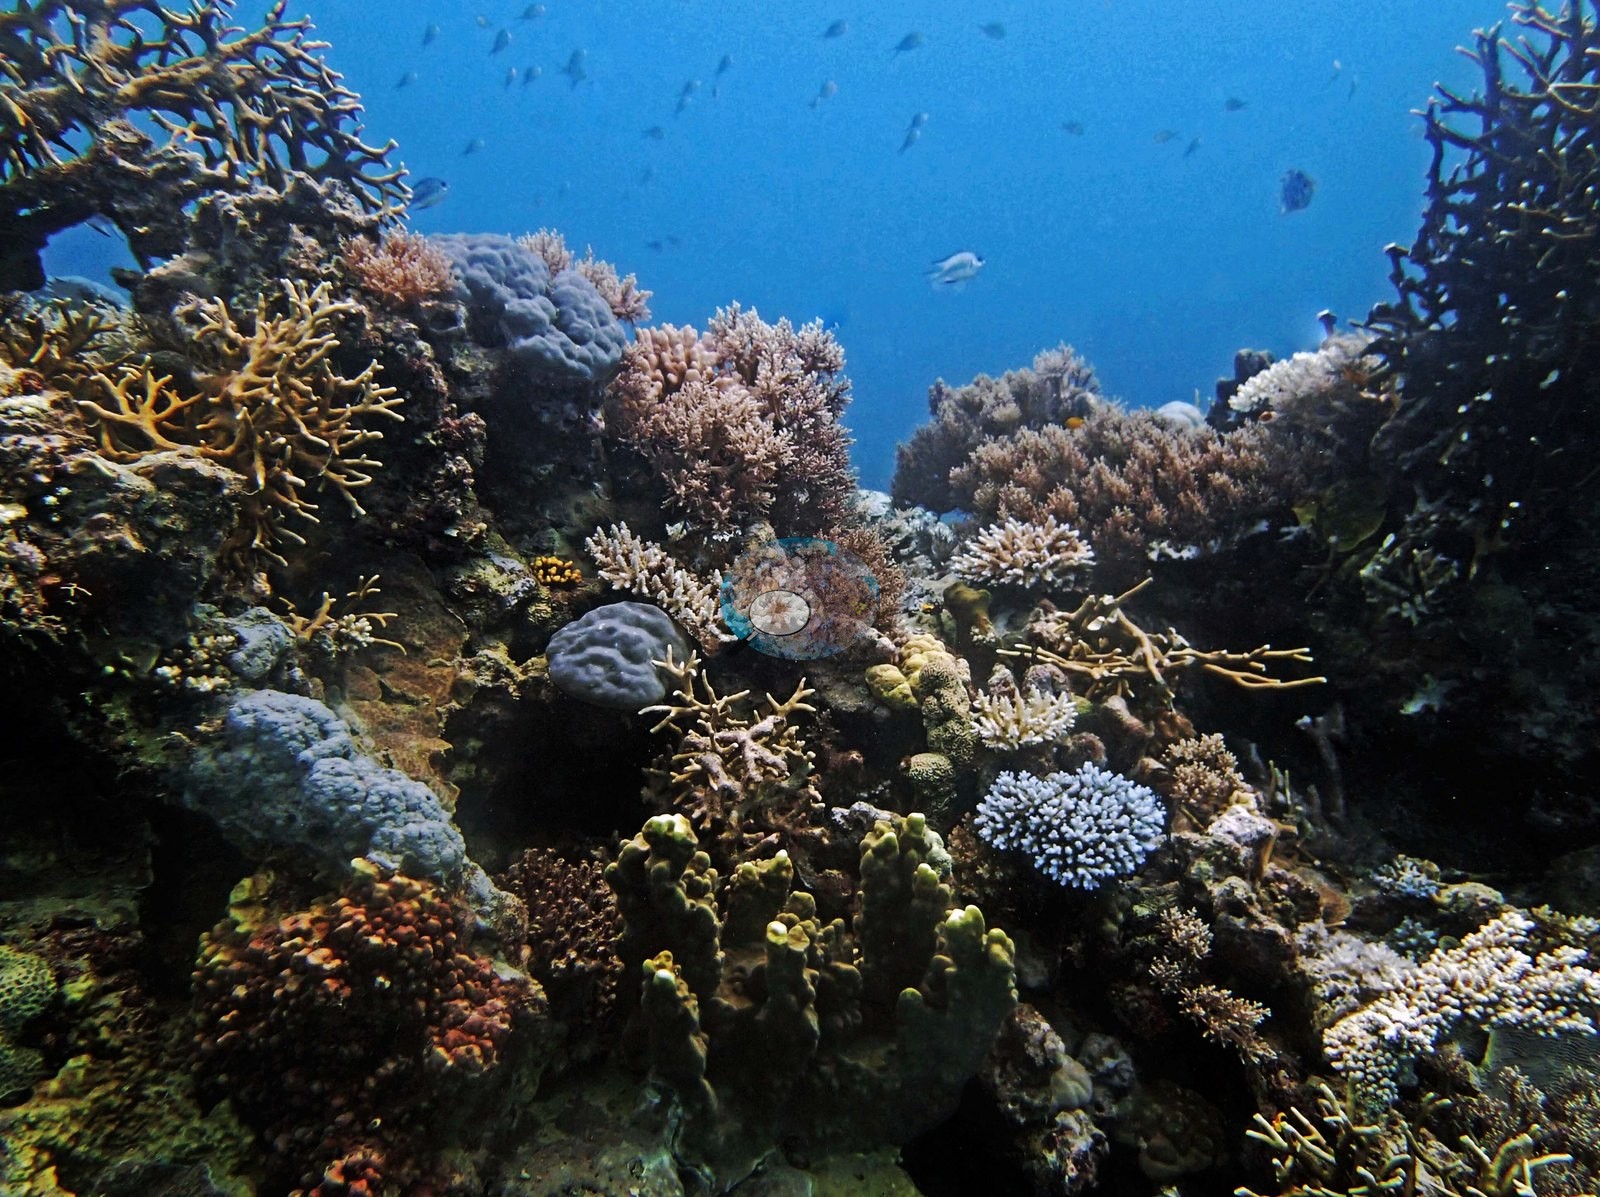
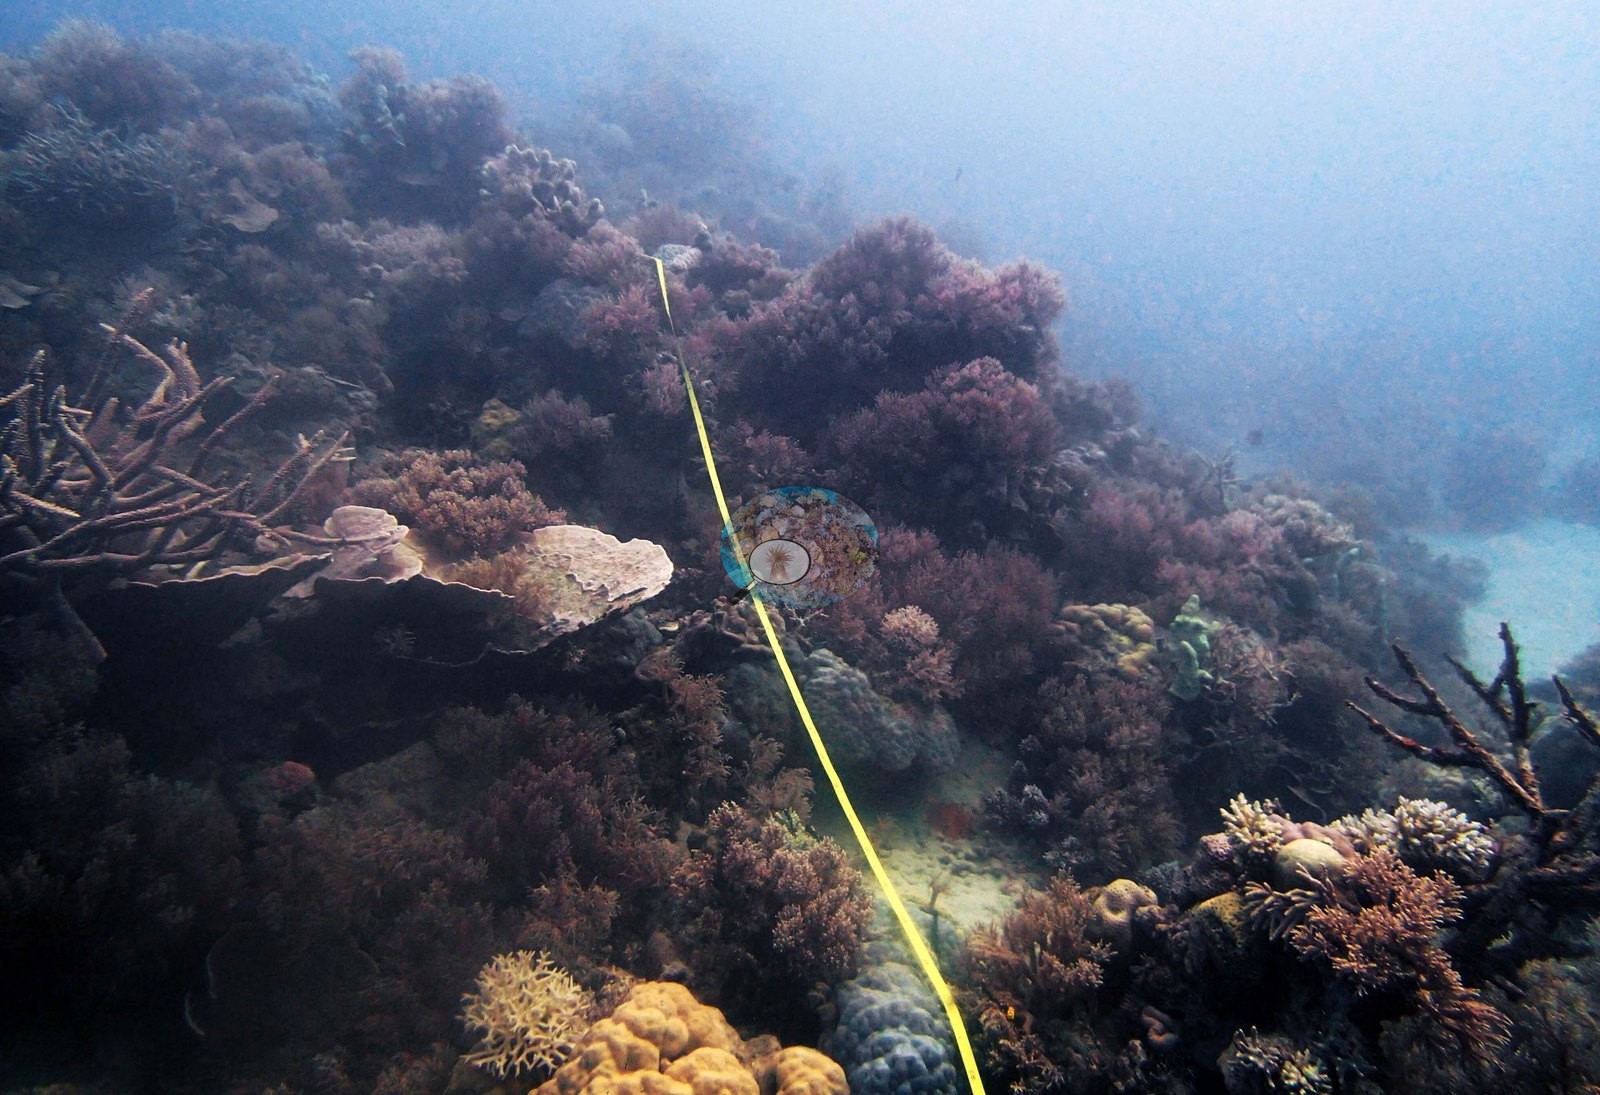
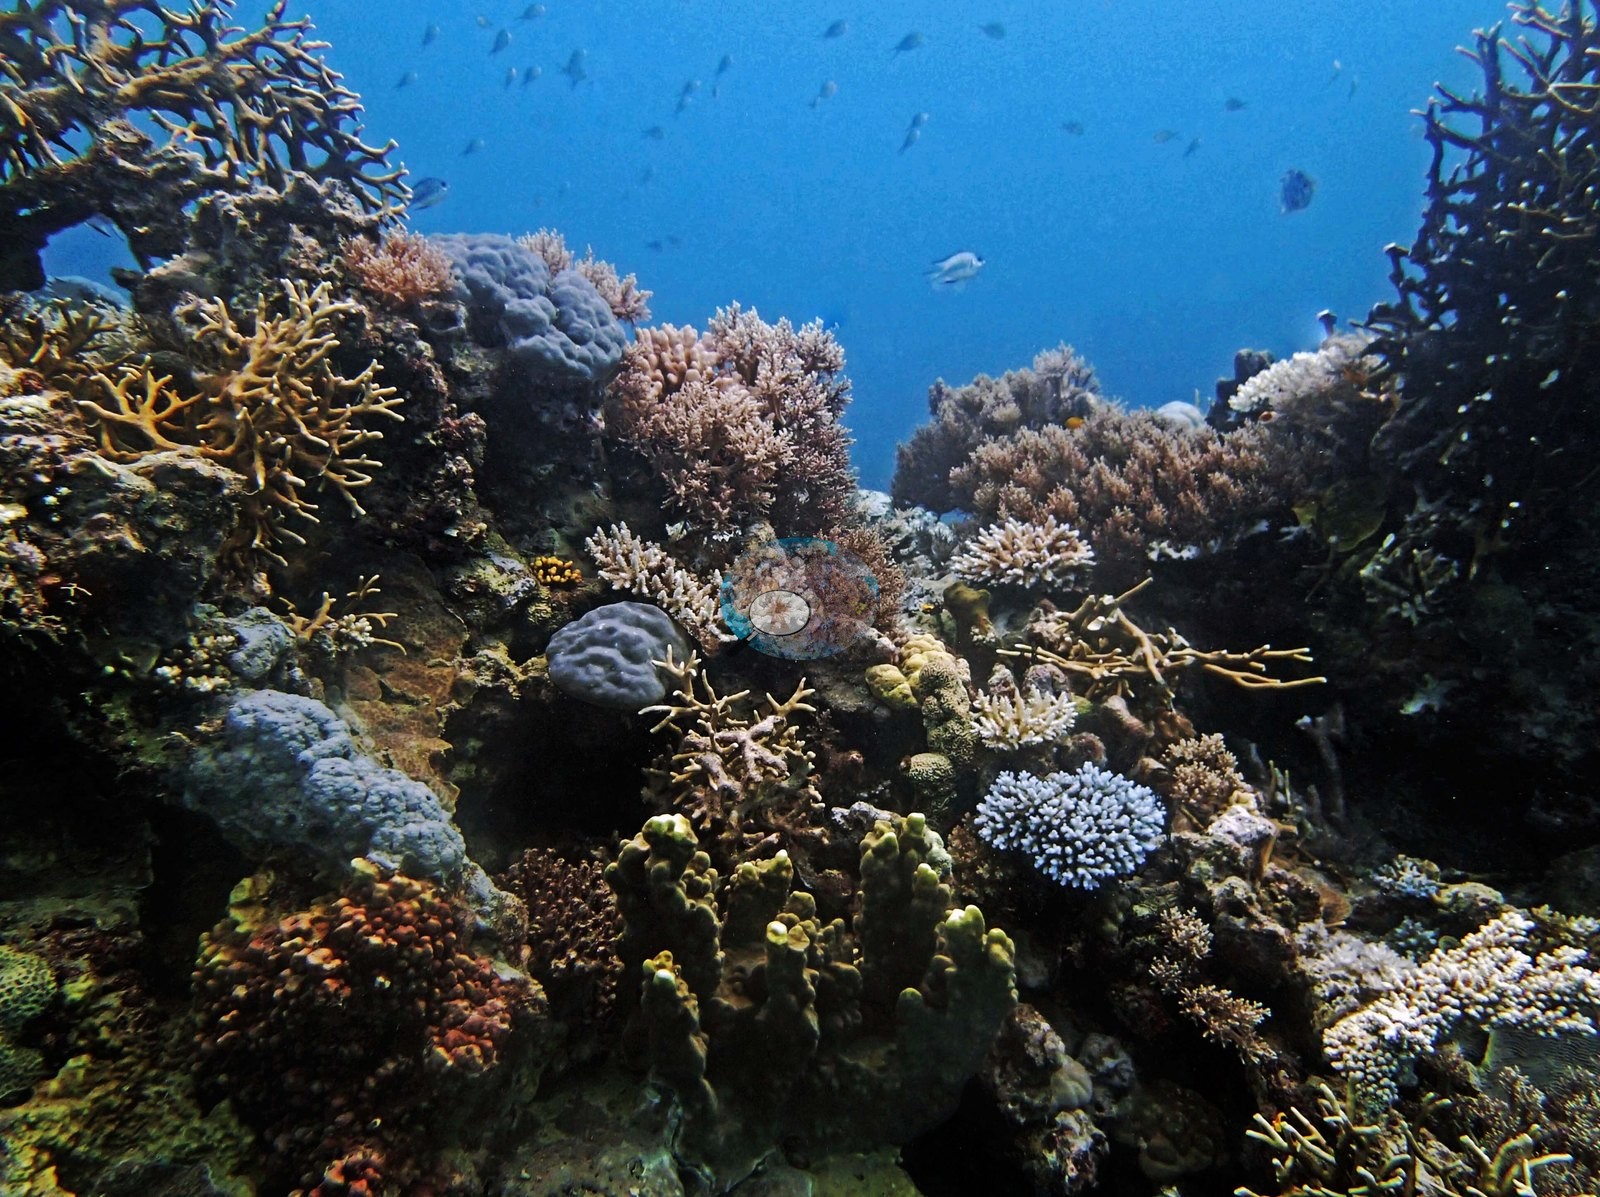
This bommie-field dive at Unnamed Reef 116 unfolded in good 20 m visibility, with Anderson mapping a landscape of bommies averaging nearly 2 m tall and covering roughly two-thirds of the seafloor at 15 m. Small fusiliers and anthias hung over the reef in every wide shot (e.g., Image 1, Image 2).
General benthic features
One wide frame shows a bommie flank packed edge to edge: yellow branching fire coral (Millepora), blue-gray mounding Porites, pink and lavender branching Acropora, and blue-tipped corymbose colonies with almost no bare rock between them (e.g., Image 4).
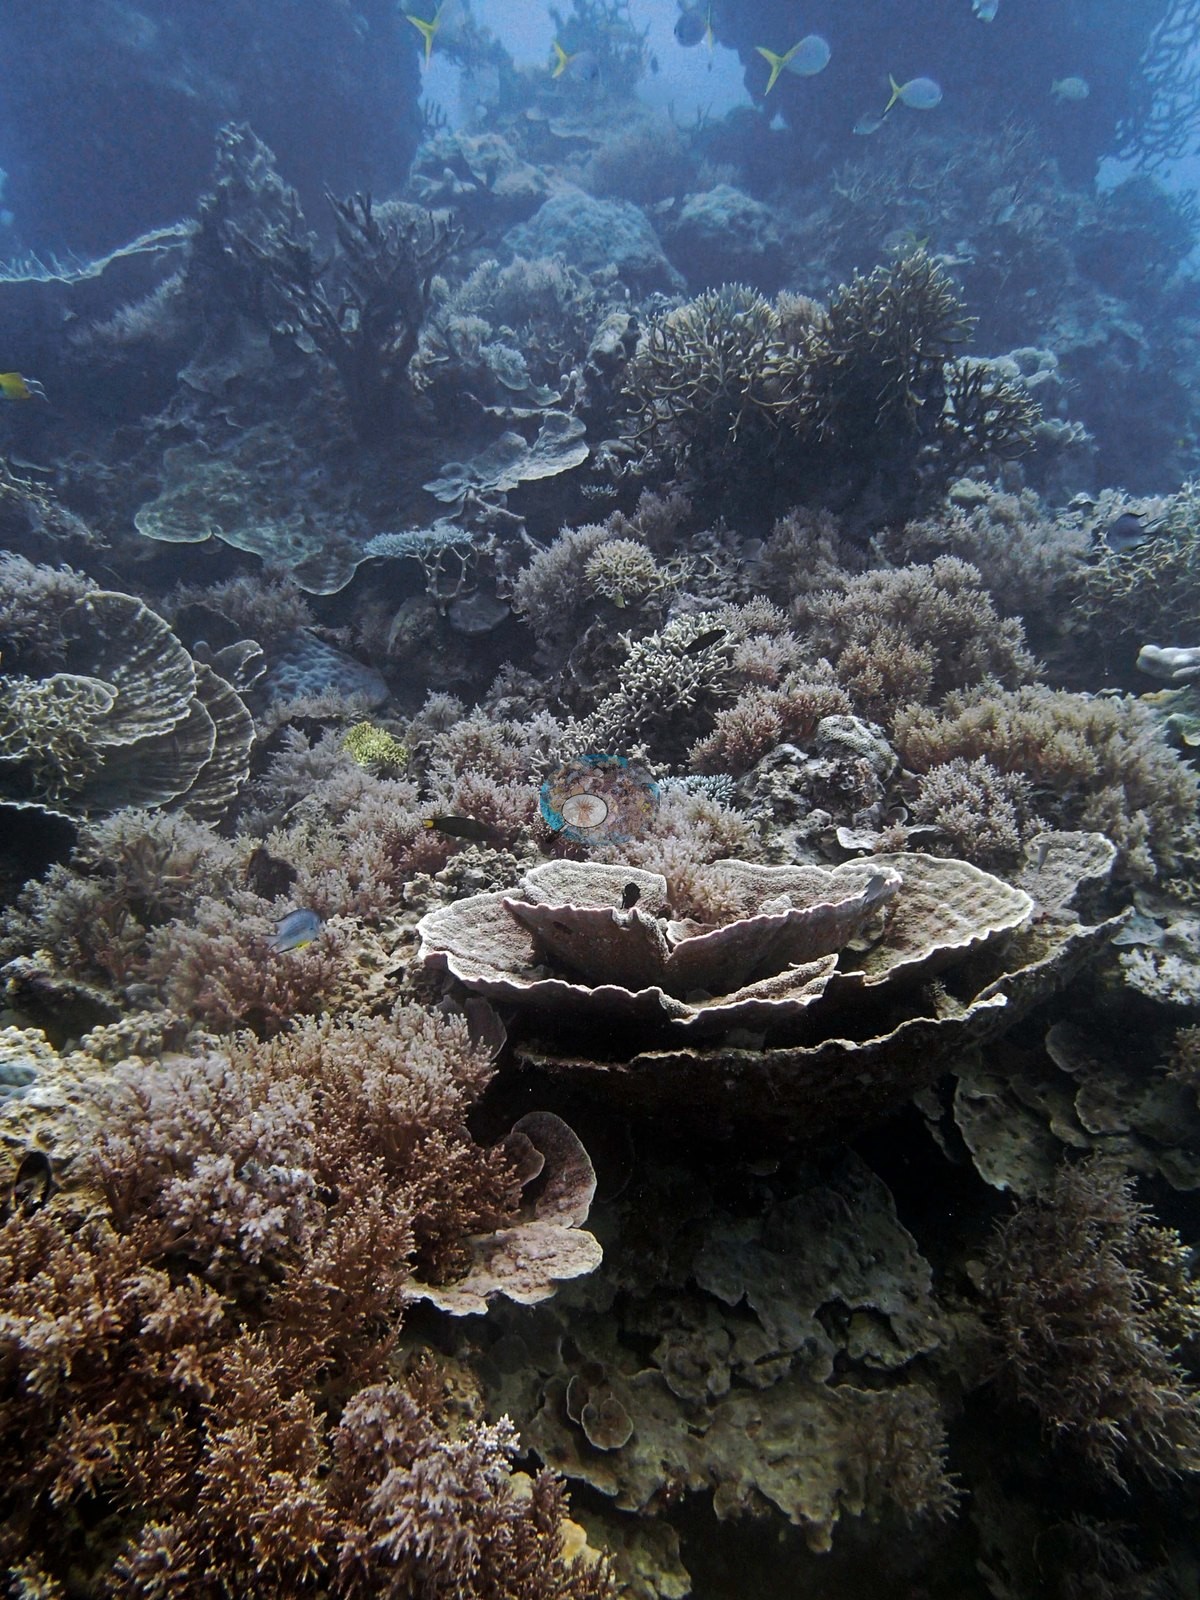
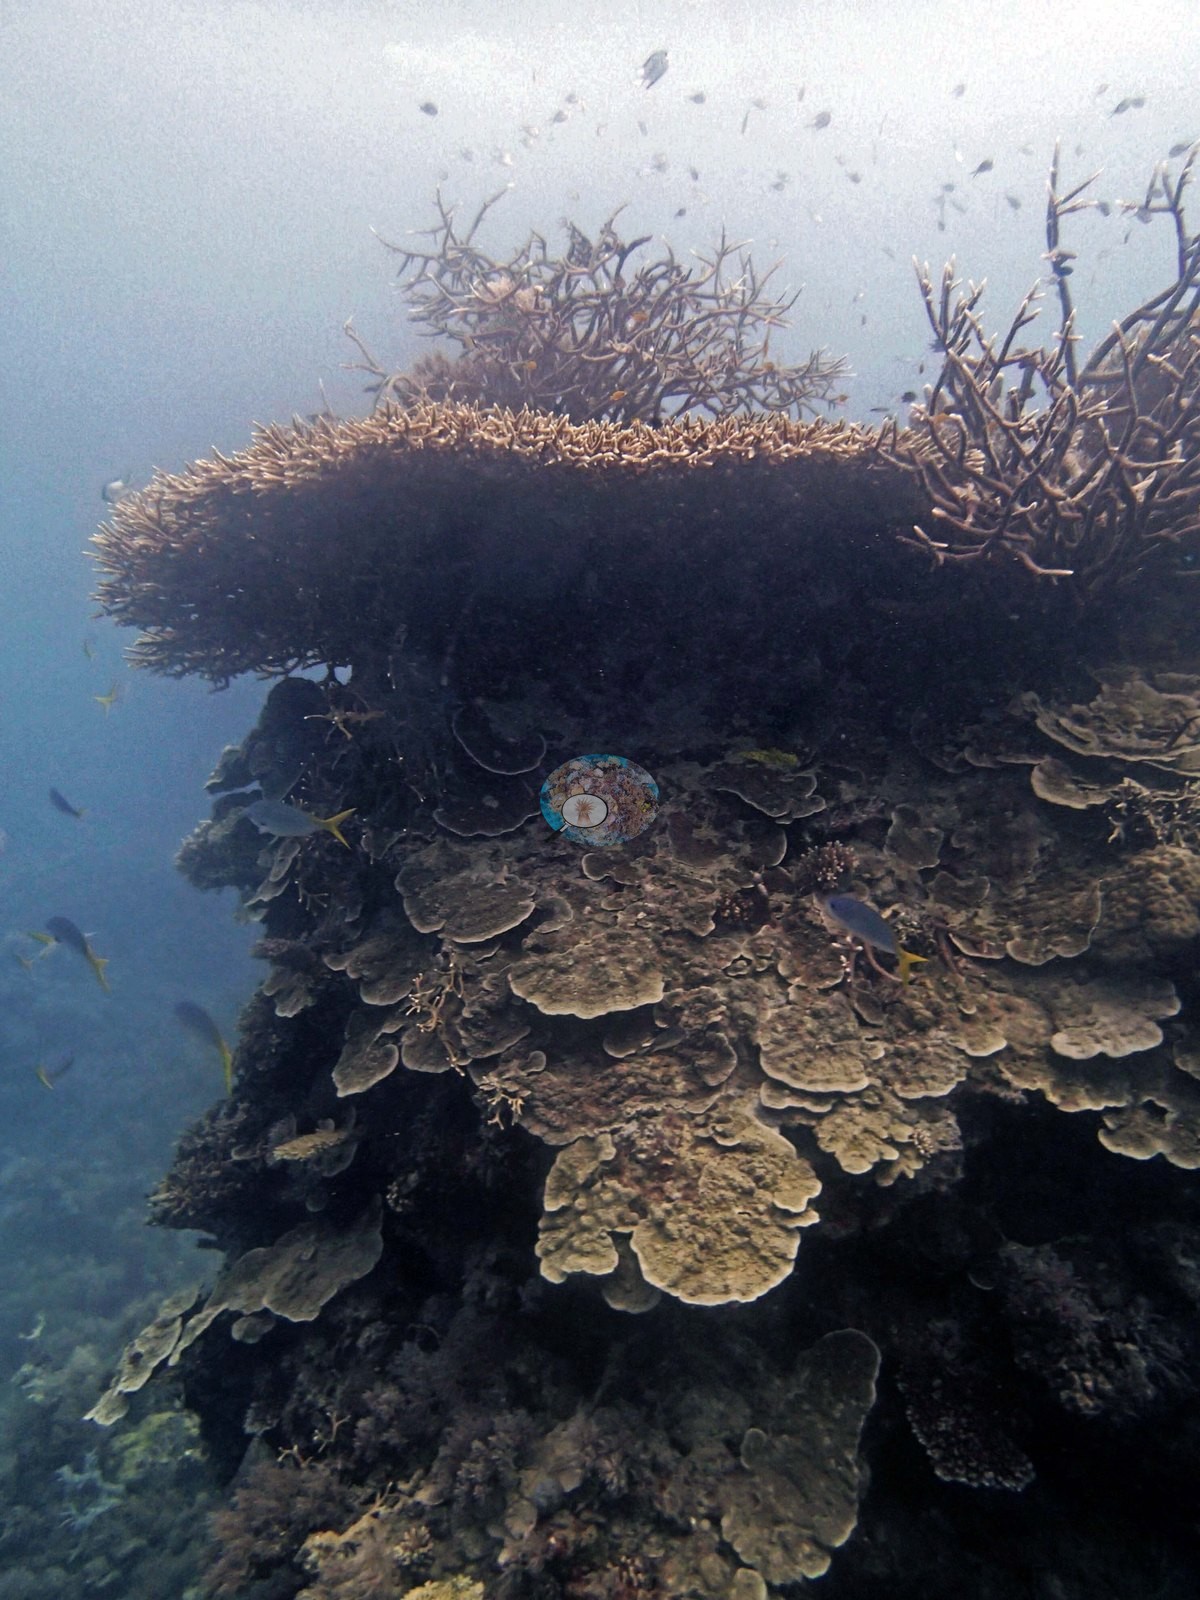
Another looks up a coral spire crowned with tabulate and staghorn Acropora over a cascade of plating and foliose colonies, matching the 4-6 m coral spire whose summit Anderson surveyed at 9.5 m (50-60% live coral on that transect) (e.g., Image 5).
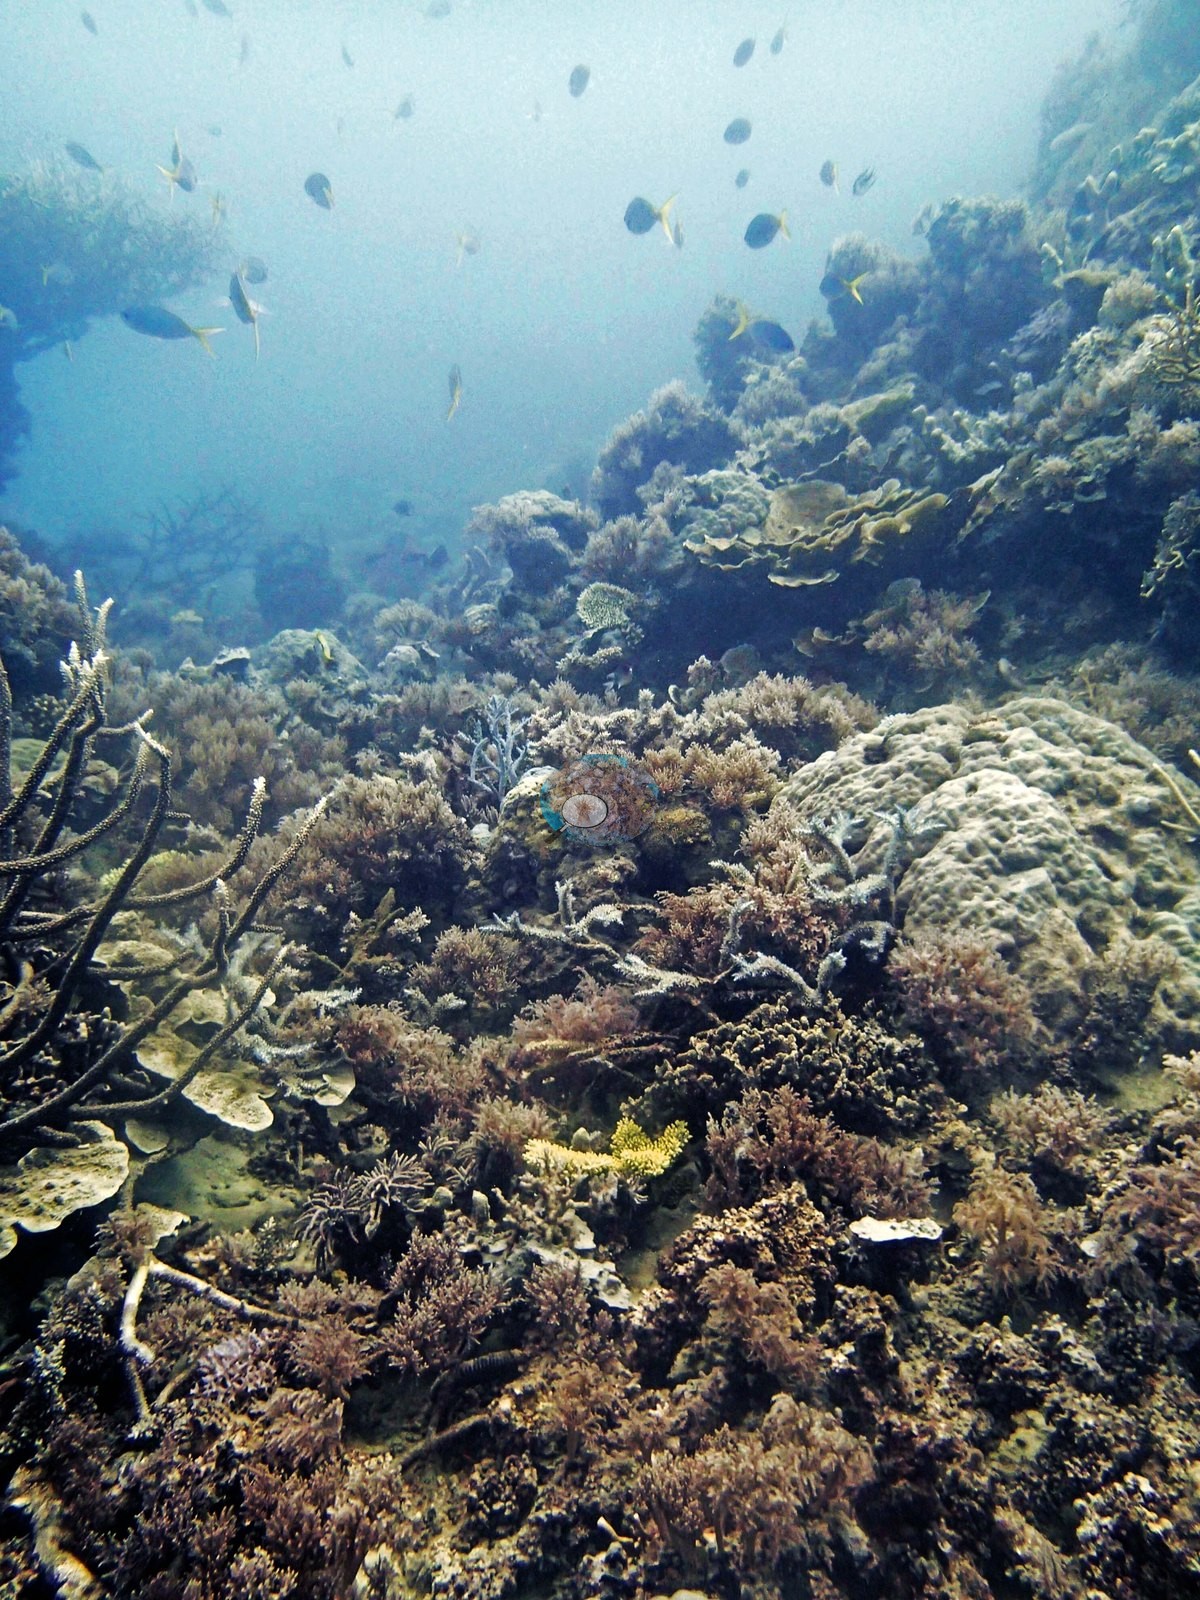
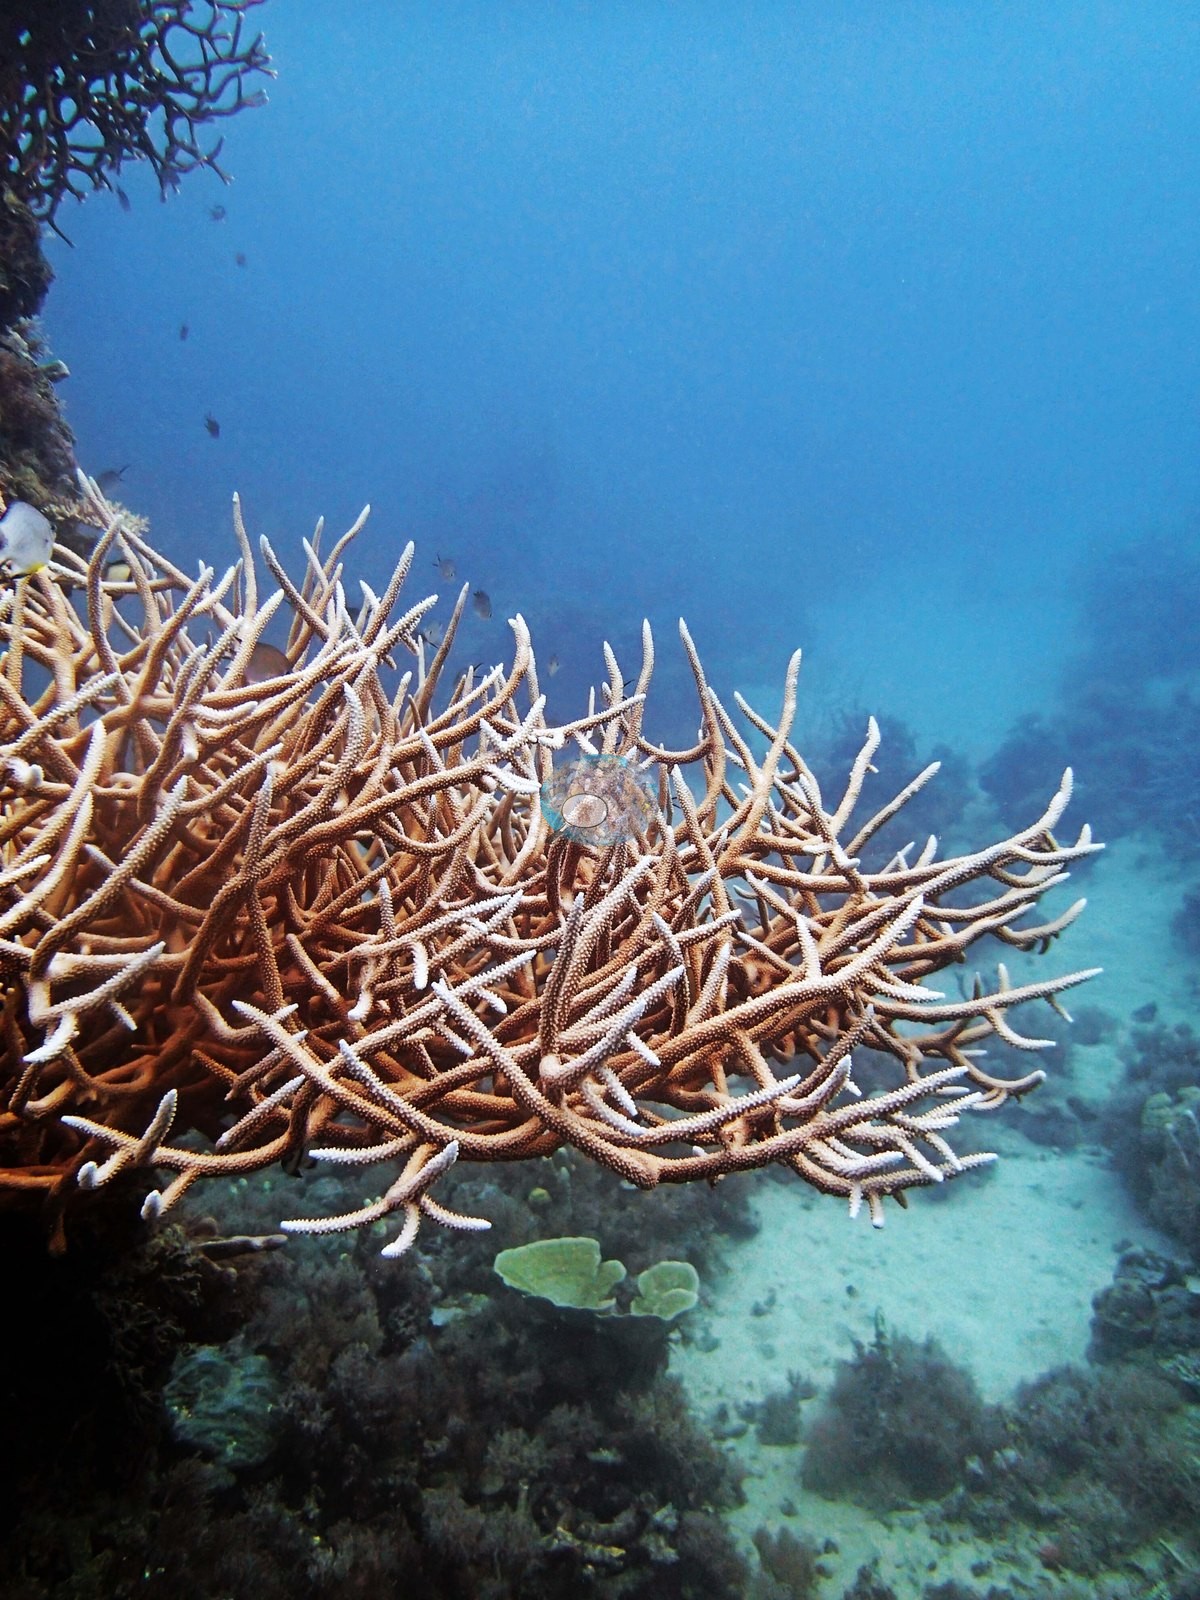
A third frame is a single staghorn thicket arching over clean sand (e.g., Image 3).
Porites was the most common coral genus on this station's transects (23% of the benthos), followed by Acropora (18%), Montipora (3.6%), Turbinaria (2.0%), Pachyseris (1.9%), and Pocillopora (1.4%); bare substrate covered 5.9%, behind crustose coralline algae (16%), the largest non-coral class. Among the algal classes on this station's transects, crustose coralline algae (16%) led, followed by turf (9.6%) and macroalgae (1.1%).
Coral cover
- Reference: Khaled bin Sultan Living Oceans Foundation, Global Reef Expedition (in situ transect)
- On a dive to 16.1 meters on Unnamed Reef 116, a bommie field in the far northern Great Barrier Reef, the GRE team recorded 57% live coral by point-count survey.
- Transect mean 57 ± 8.5% SE (n = 8 transects; Living Oceans Foundation per-transect benthic data); the headline above is the expedition's station value.
Stressors
The clearest condition note from the dive concerned needle coral: dying Seriatopora hystrix turned up on most transects, including atop that same spire, where a few healthy colonies persisted beside the dying ones. The survey was in September 2014, eighteen months before the back-to-back bleaching events that reshaped this stretch of reef. No crown-of-thorns starfish (COTS) or other corallivores evident.
Comparisons with other data
No other surveys have been conducted at this site to date. Within 5 km, two XL Catlin Seaview Survey stations recorded 17–32% hard coral cover between 2012 and 2016; the nearest, XL Catlin Seaview Survey at transect 15023, 1.91 km away, read 26–32% between 2012 and 2016.
Nearby citizen-science imagery within 2 km (not a survey of this site, and not total coral cover):
- Great Reef Census (citizen science, AI + volunteer image analysis): branching Acropora 8.0%, plating Acropora 24%, massive corals 18% of colonizable substrate, 22 images, 2024-11-20, 0.80 km.
The Great Reef Census scores three coral shapes only, so every other coral is left out, and its denominator is colonizable substrate (sand, water, and shadow excluded): these values are not hard coral cover and should not be added together or compared with the cover figures on this page. The photographs are taken by volunteer snorkelers 3–5 m above the reef. In the program's own validation (Lawson et al. 2025, Environmental Monitoring and Assessment 197:814, doi:10.1007/s10661-025-14261-6, open access), each analysis method on its own differed from expert estimates by up to about 9.5 percentage points on average for these coral types (AI alone: plating Acropora −9.1 points; AI plus volunteers: branching Acropora +9.5 points); the program's “~99% accurate” figure is the average over about 8,000 images after choosing the better method for each coral type, and site values from fewer images carry more error. Sites with fewer than 40 images have fewer images than the 40–80 the method needs to estimate site-level values to within 5 percentage points. Source: Great Reef Census / Citizens of the Great Barrier Reef; Lawson et al. 2026, Limnology & Oceanography Letters, doi:10.1002/lol2.70168 (data CC BY-NC 4.0, doi:10.7910/DVN/KCULSD).
Independent surveys nearby
 LOF Global Reef ExpeditionYear-average (illustrative only, programs differ)
Within 5 km, 2 independent survey stations recorded hard coral cover in 4 surveys between 2012 and 2016. Of the 2 stations surveyed in more than one year, 1 declined by more than 7 points between their first and latest surveys; 1 changed by 7 points or less, inside the 7-point method-noise floor (inconclusive). Two stations share the longest span (2012–2016); one, transect 15023 (XL Catlin Seaview Survey, 1.91 km away), went from 32% in 2012 to 26% in 2016. The most recent nearby survey is from 2016, so these values predate recent heat stress. This site's own estimate (57%) sits 25 points above the range of these surveys up to 2 km away (26–32%); the methods differ, so the comparison is context, not a like-for-like test.
Collected by other programs using different methods (the XL Catlin Seaview Survey uses photo-transects with automated image annotation), so these are context for the figures above, not a like-for-like comparison. Where a station was surveyed more than once, the cell shows either the range of its values or, as a single value, the mean of surveys made in one year. Station names are not dive-site names.
| Agency | Site / location | Date | Hard coral cover (%) | Distance | Link |
|---|---|---|---|---|---|
| XL Catlin Seaview Survey | transect 15023 | 2012–2016 | 26–32% (2 surveys) | 1.91 km | doi:10.14264/uql.2019.930 |
| XL Catlin Seaview Survey | transect 15022 | 2012–2016 | 17–32% (2 surveys) | 2.77 km | doi:10.14264/uql.2019.930 |
Data & links
- Download benthic survey data (CSV) ↗
- Download all LOF-GRE data (933 sites) ↗
- Photo portfolio ↗
- Coral Reef Diagnostics country page ↗
All images from Coral Reef Diagnostics. Data are from the Khaled bin Sultan Living Oceans Foundation Global Reef Expedition, Coral Reef Diagnostics, and the organizations named in the data sources above.
 © Coral Reef Diagnostics.