

Part of the regional summaries: Australia (GBR) - Far North: Green stations (no-take reefs) and Australia (GBR)
More info
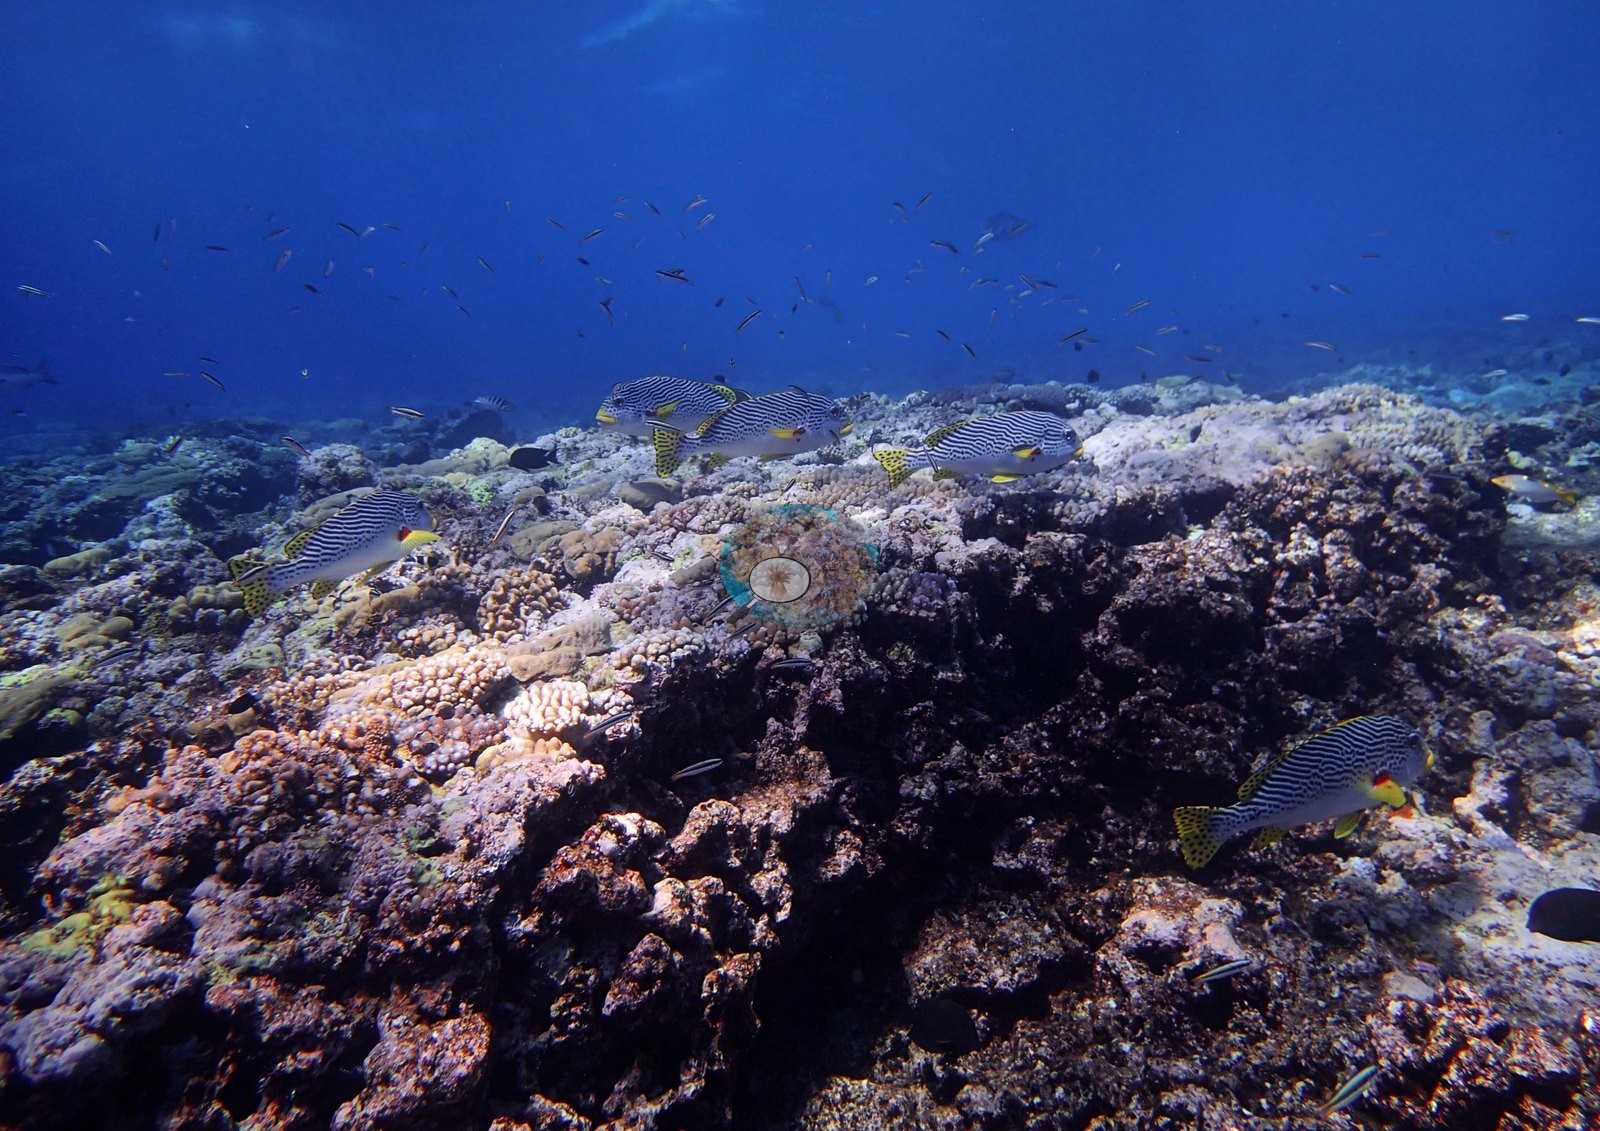
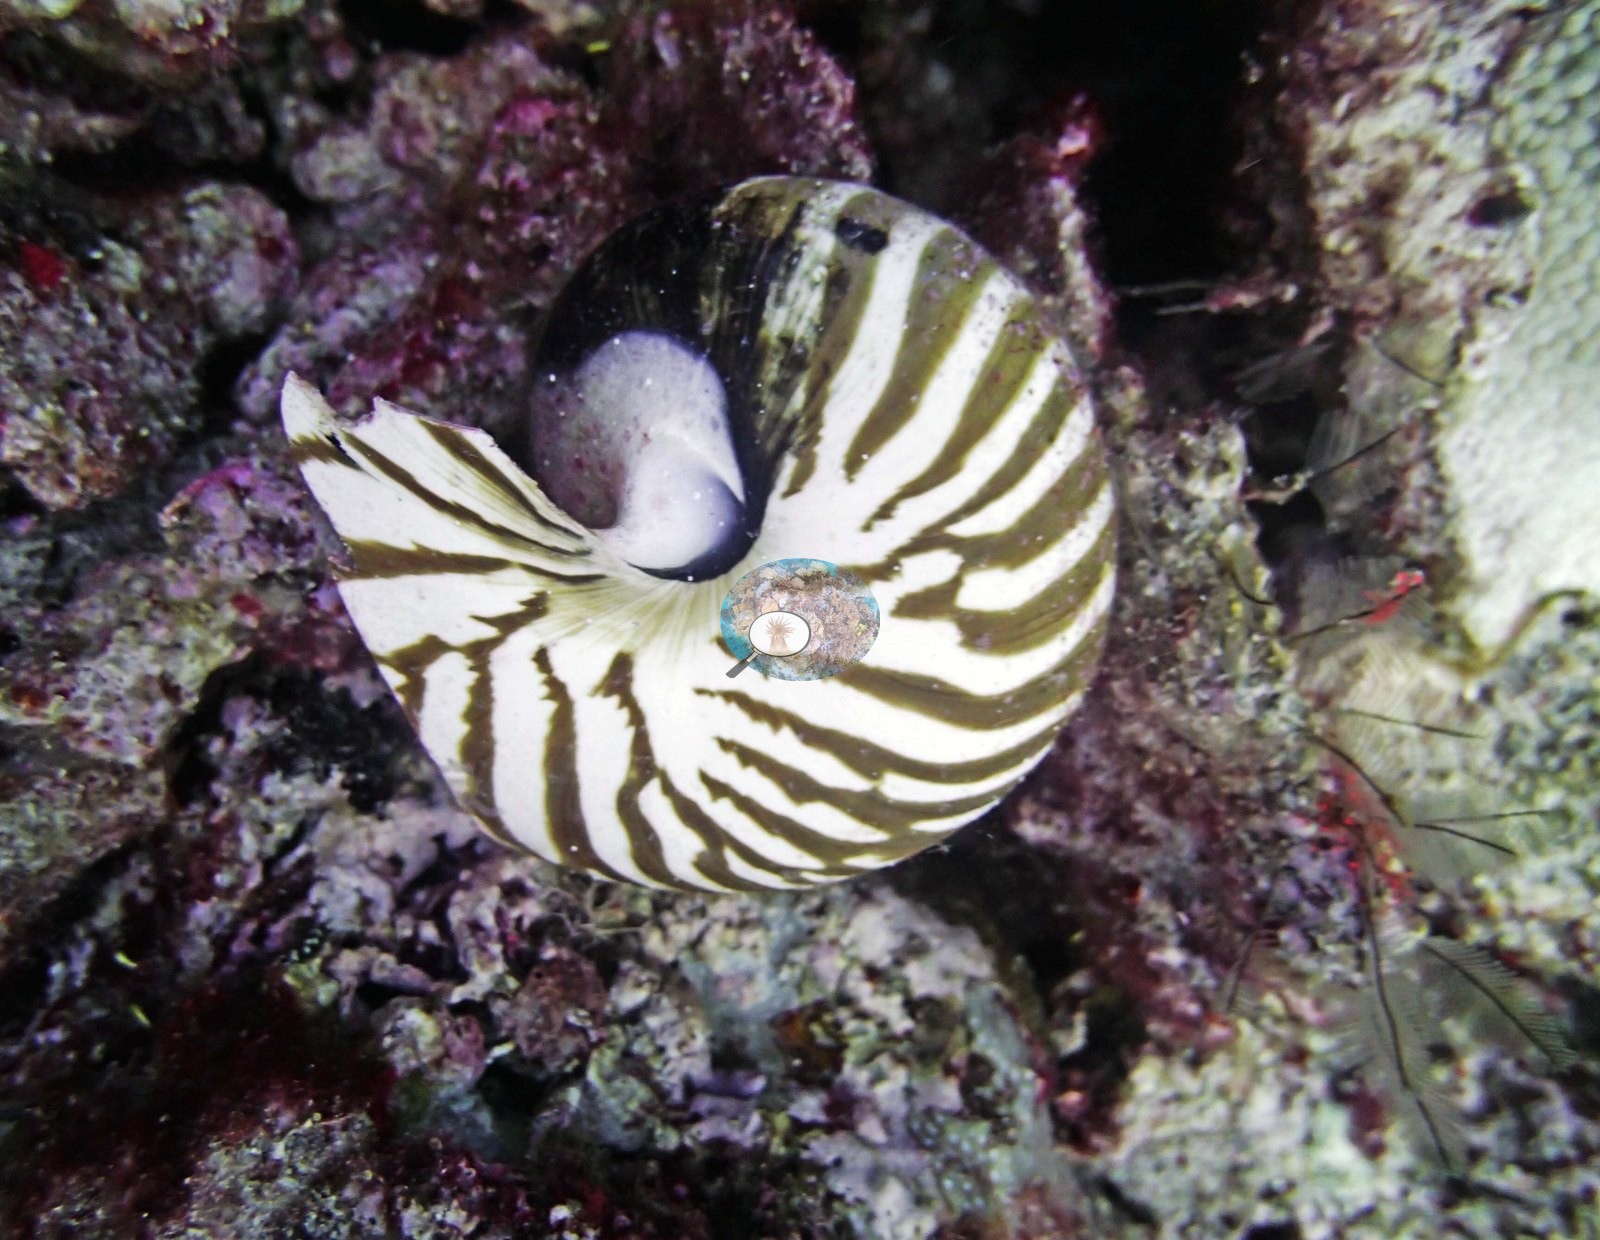
Northern GBR (NOAA CRW virtual station)A shallow, high-energy crest on Yonge Reef where coral cover is built from a confetti of many small colonies, branching, encrusting, and massive, set into pink coralline pavement above a steep drop into deep blue. Fusiliers and sweetlips worked the crest and an empty nautilus shell was an odd find; most coral in the photographs is normally colored, though Anderson noted that needle coral (Seriatopora hystrix) on the 20.5 m transect looked bleached and unhealthy. Surveyed on the Living Oceans Foundation's Global Reef Expedition.
Ten independent survey stations shown with the program’s logo — click one to see how far it is from this site.
Five other CRD dive sites within 5 km shown in orange — click a marker to open its page.
🗺 Detailed map of the Global Reef Expedition dive sites, Yonge, Hicks, and Carter Reefs, northern Great Barrier Reef (Khaled bin Sultan Living Oceans Foundation; opens in a new window)
Site description
Setting
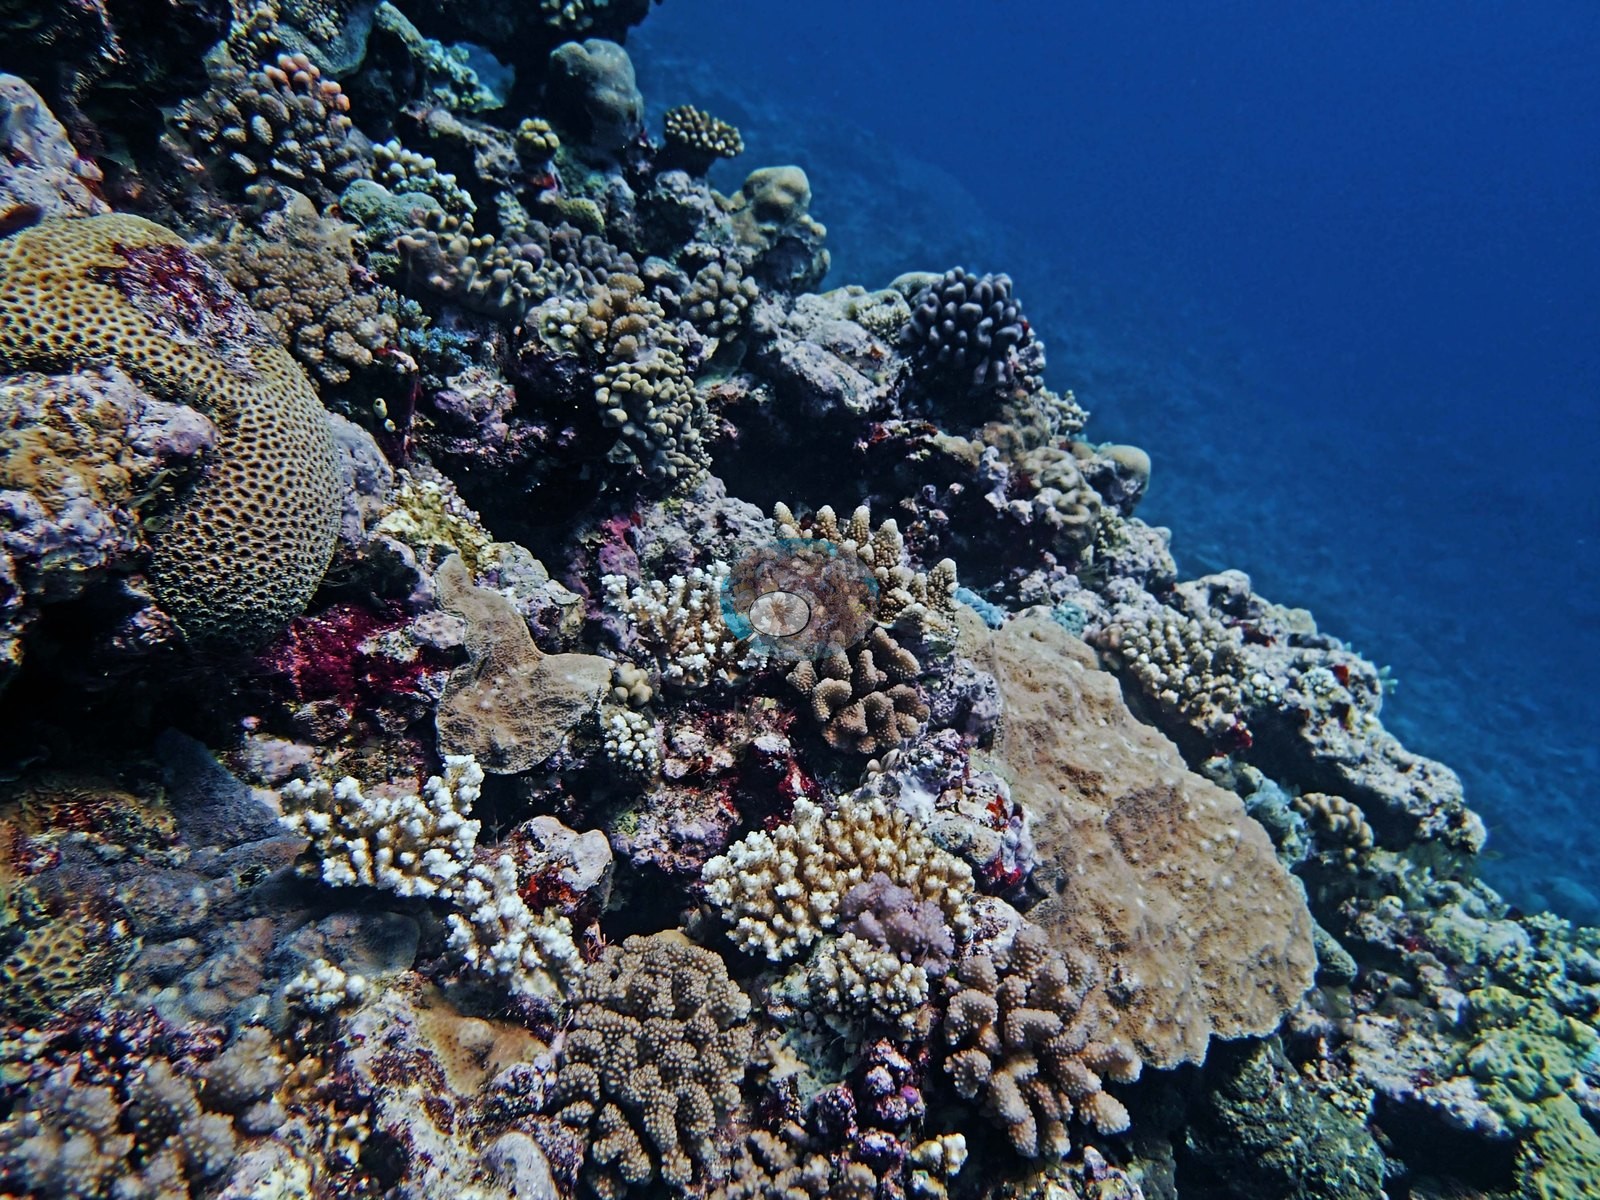
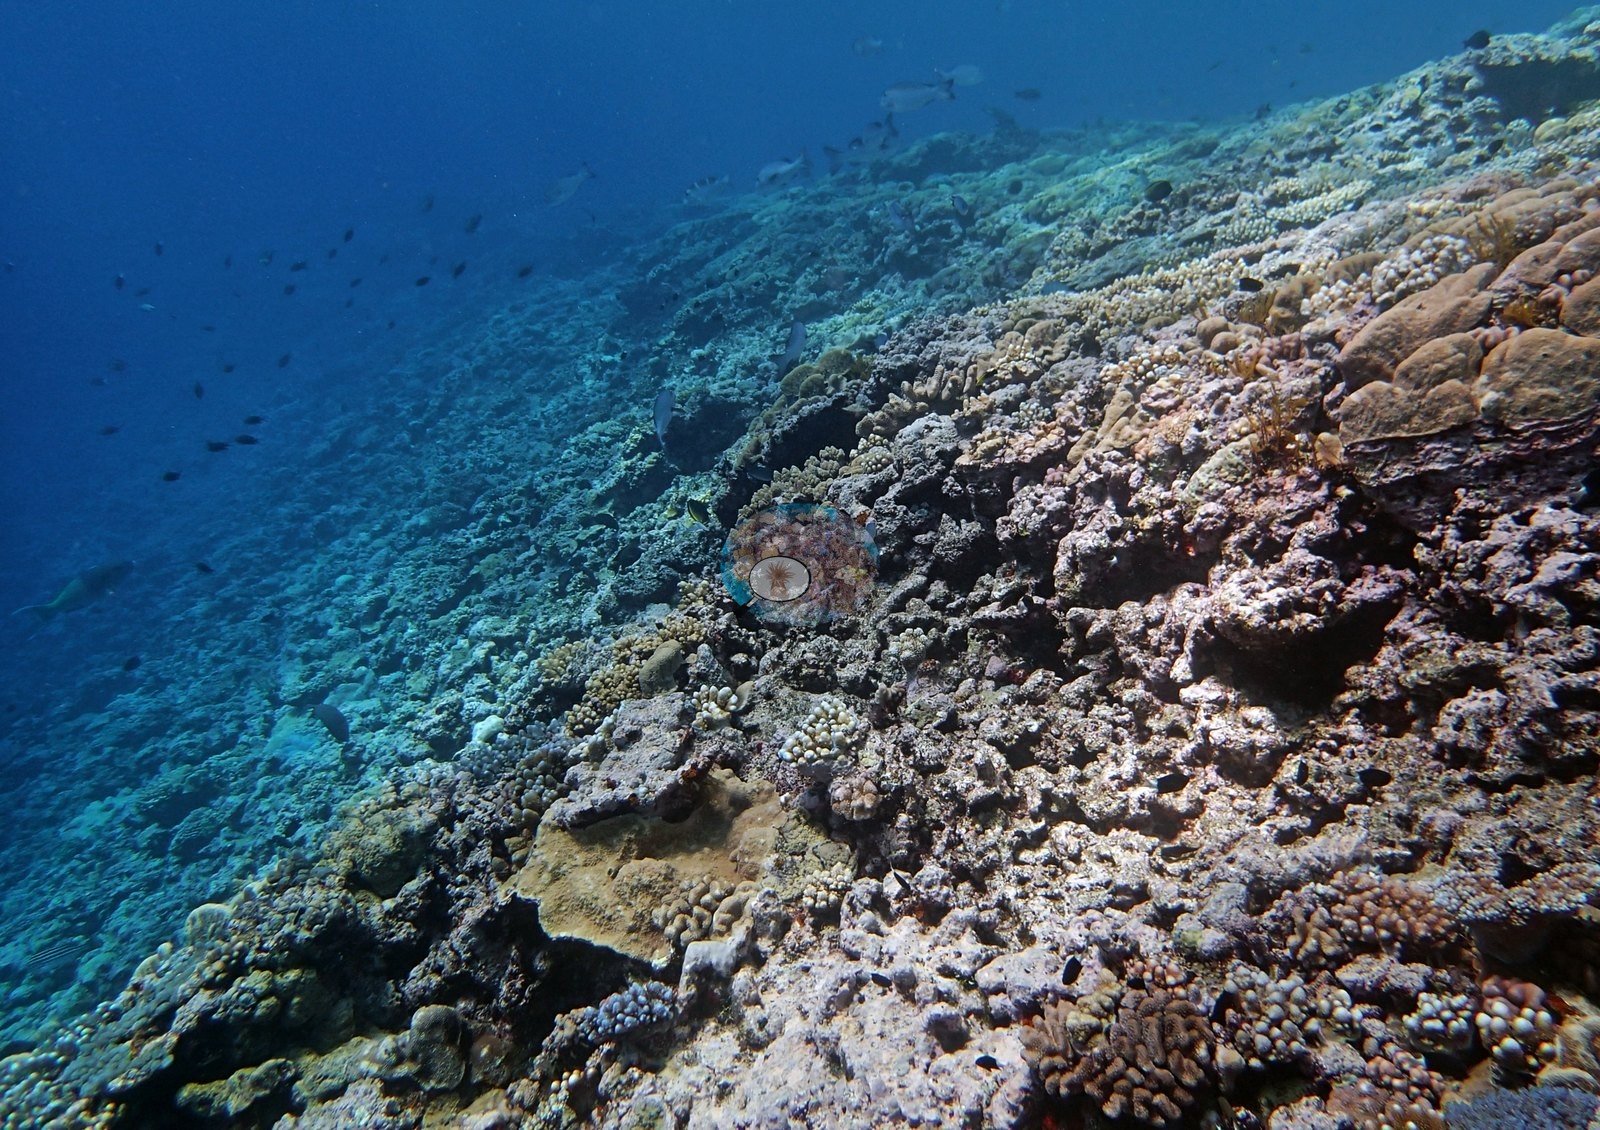
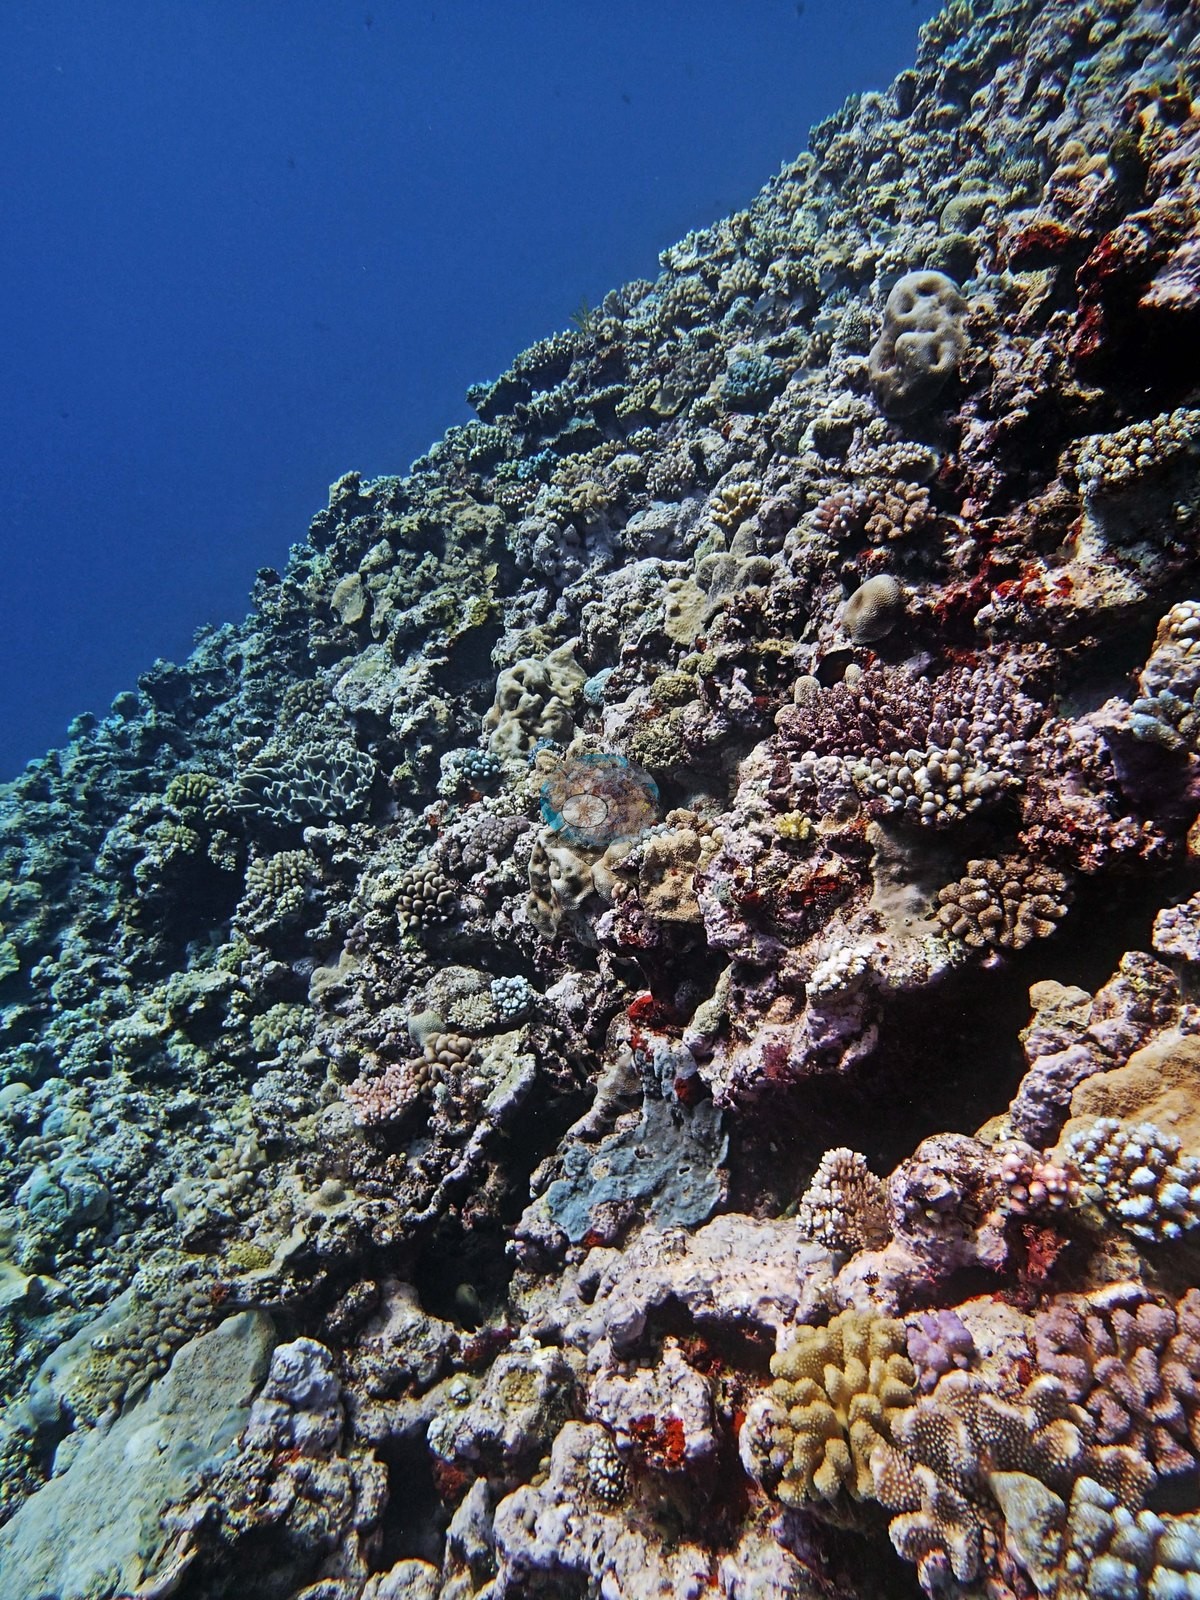
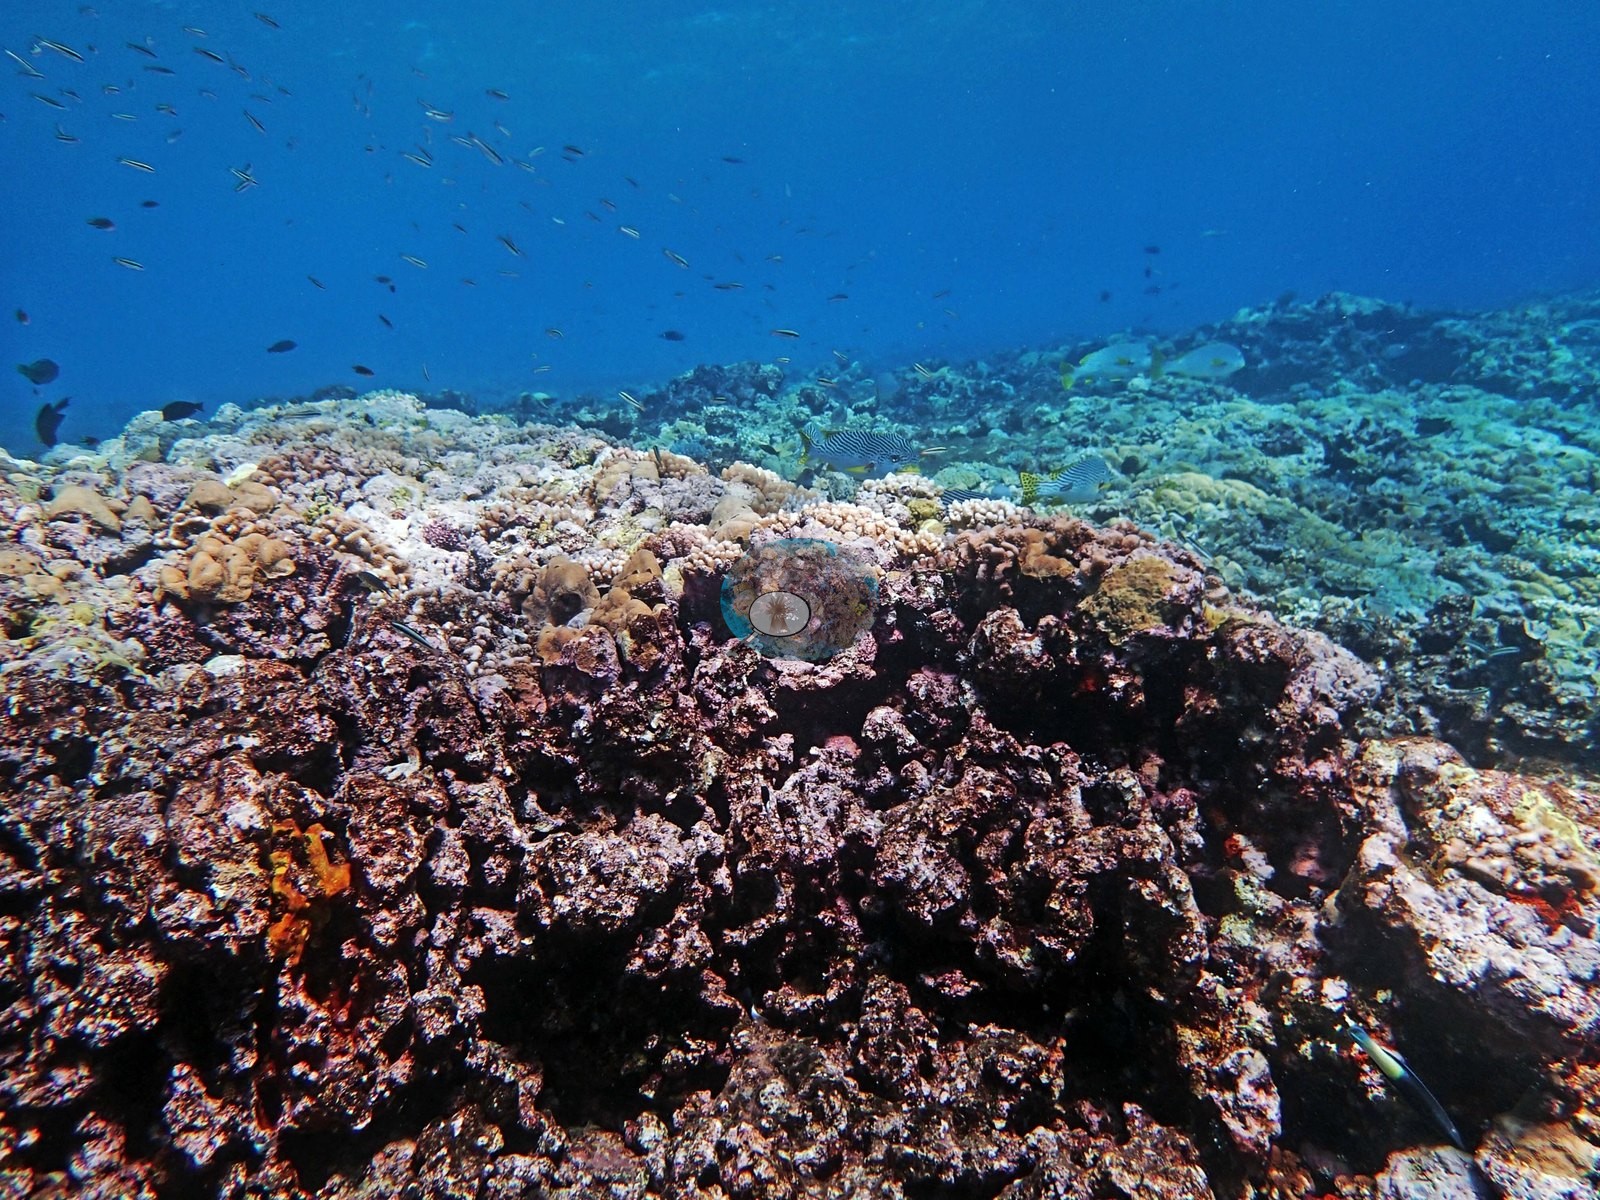
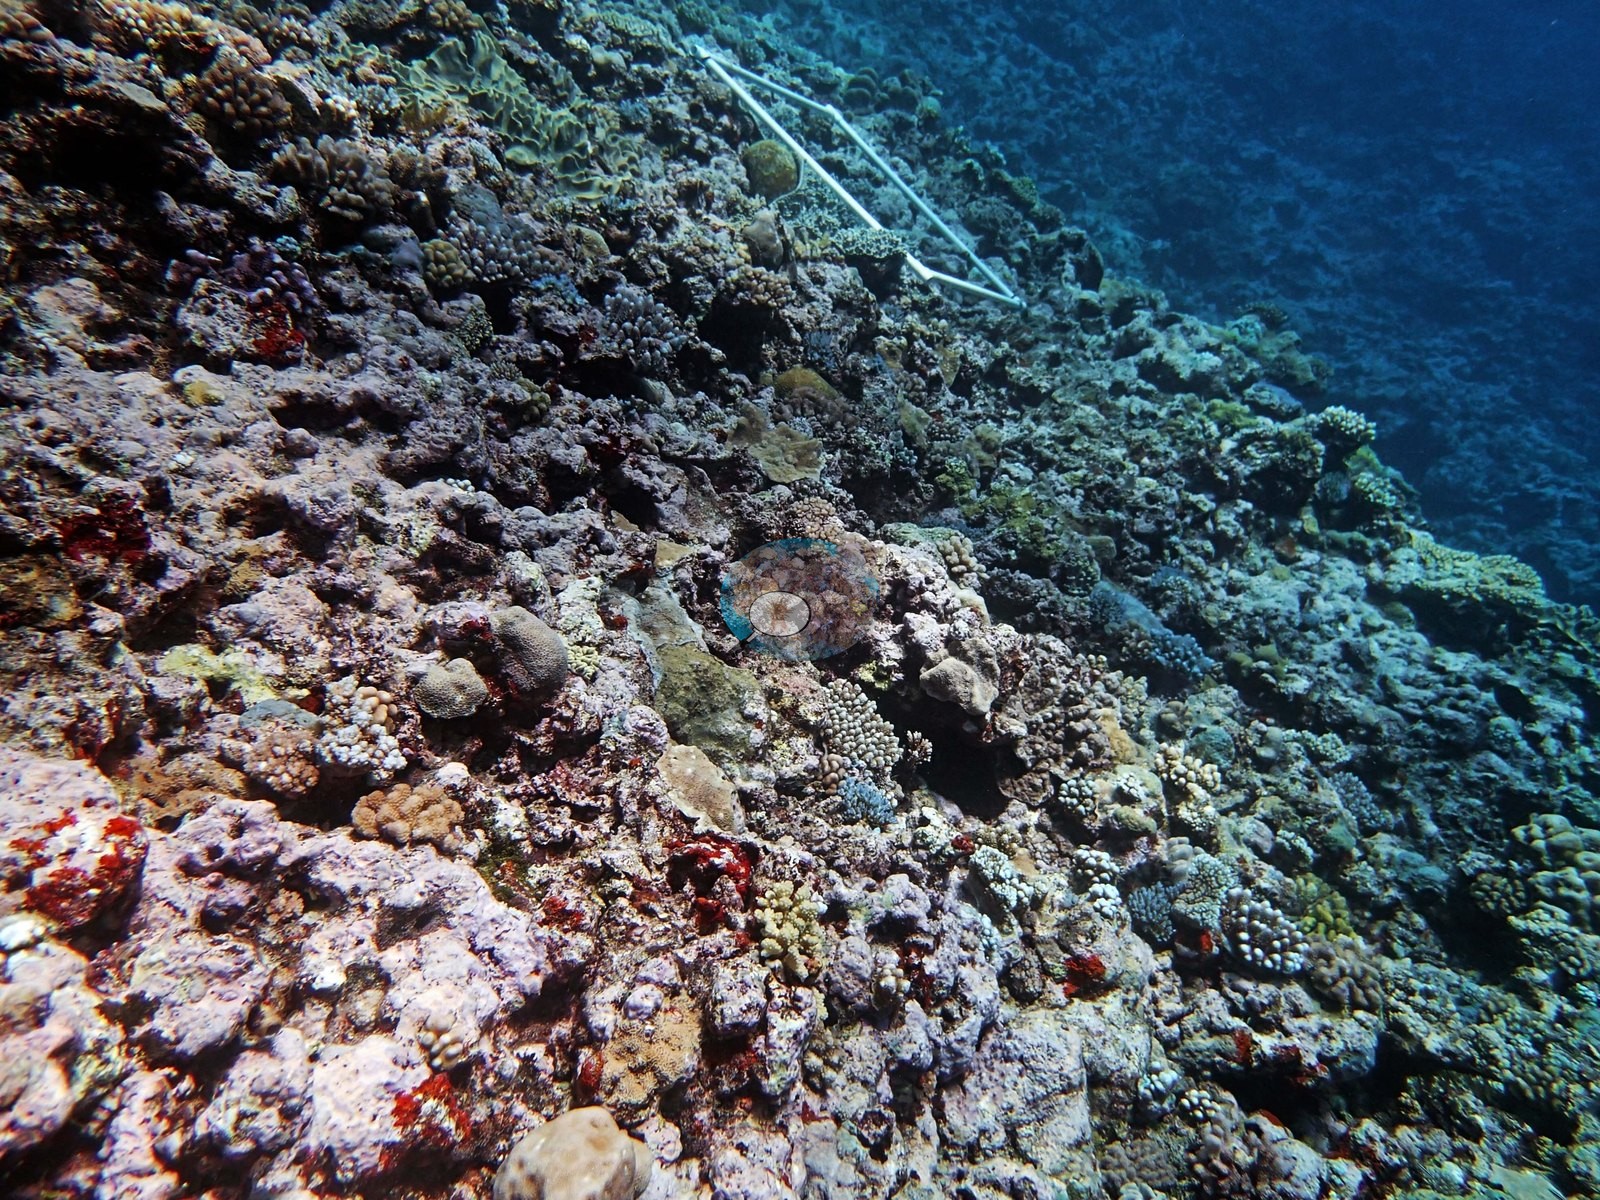
Structure reads clearly in the wide frames. Several look along or down a convex crest that falls away steeply into deep blue (e.g., Image 6, Image 10, Image 14, Image 25, Image 26, Image 30), with the shallow band carrying the densest coral and the visible slope thinning as it drops.
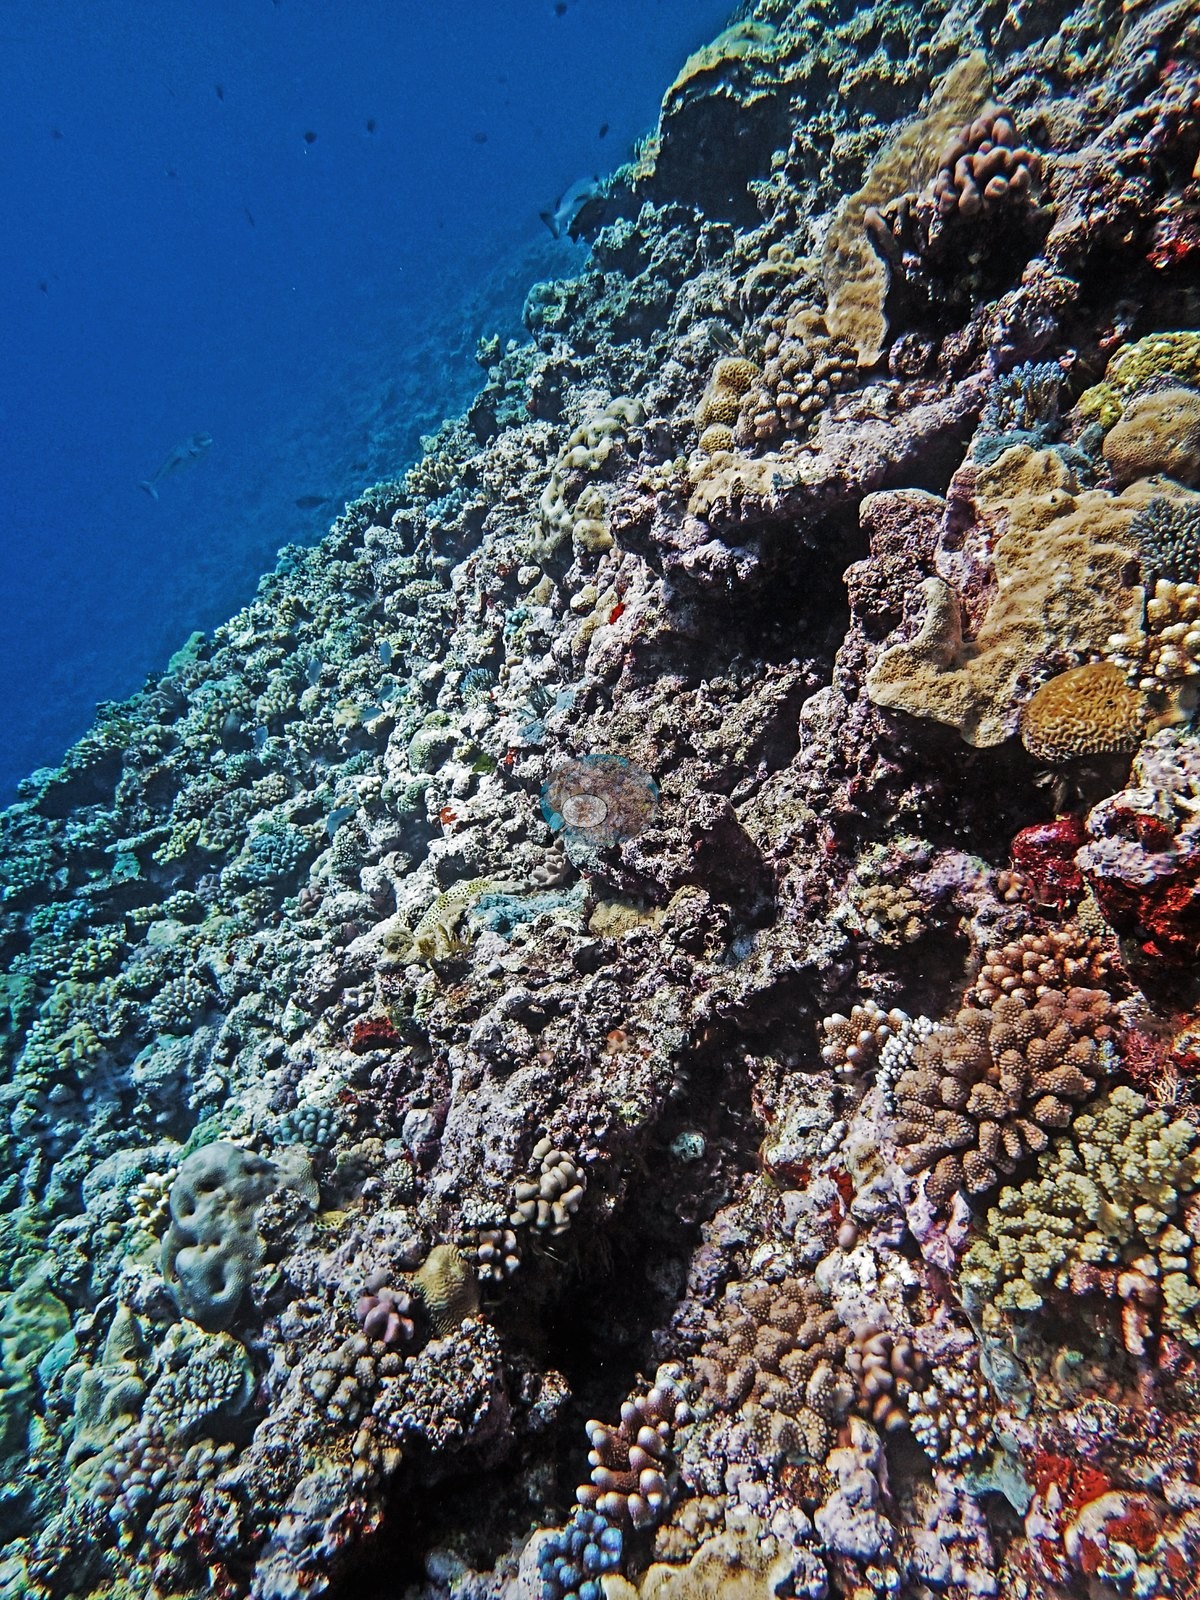
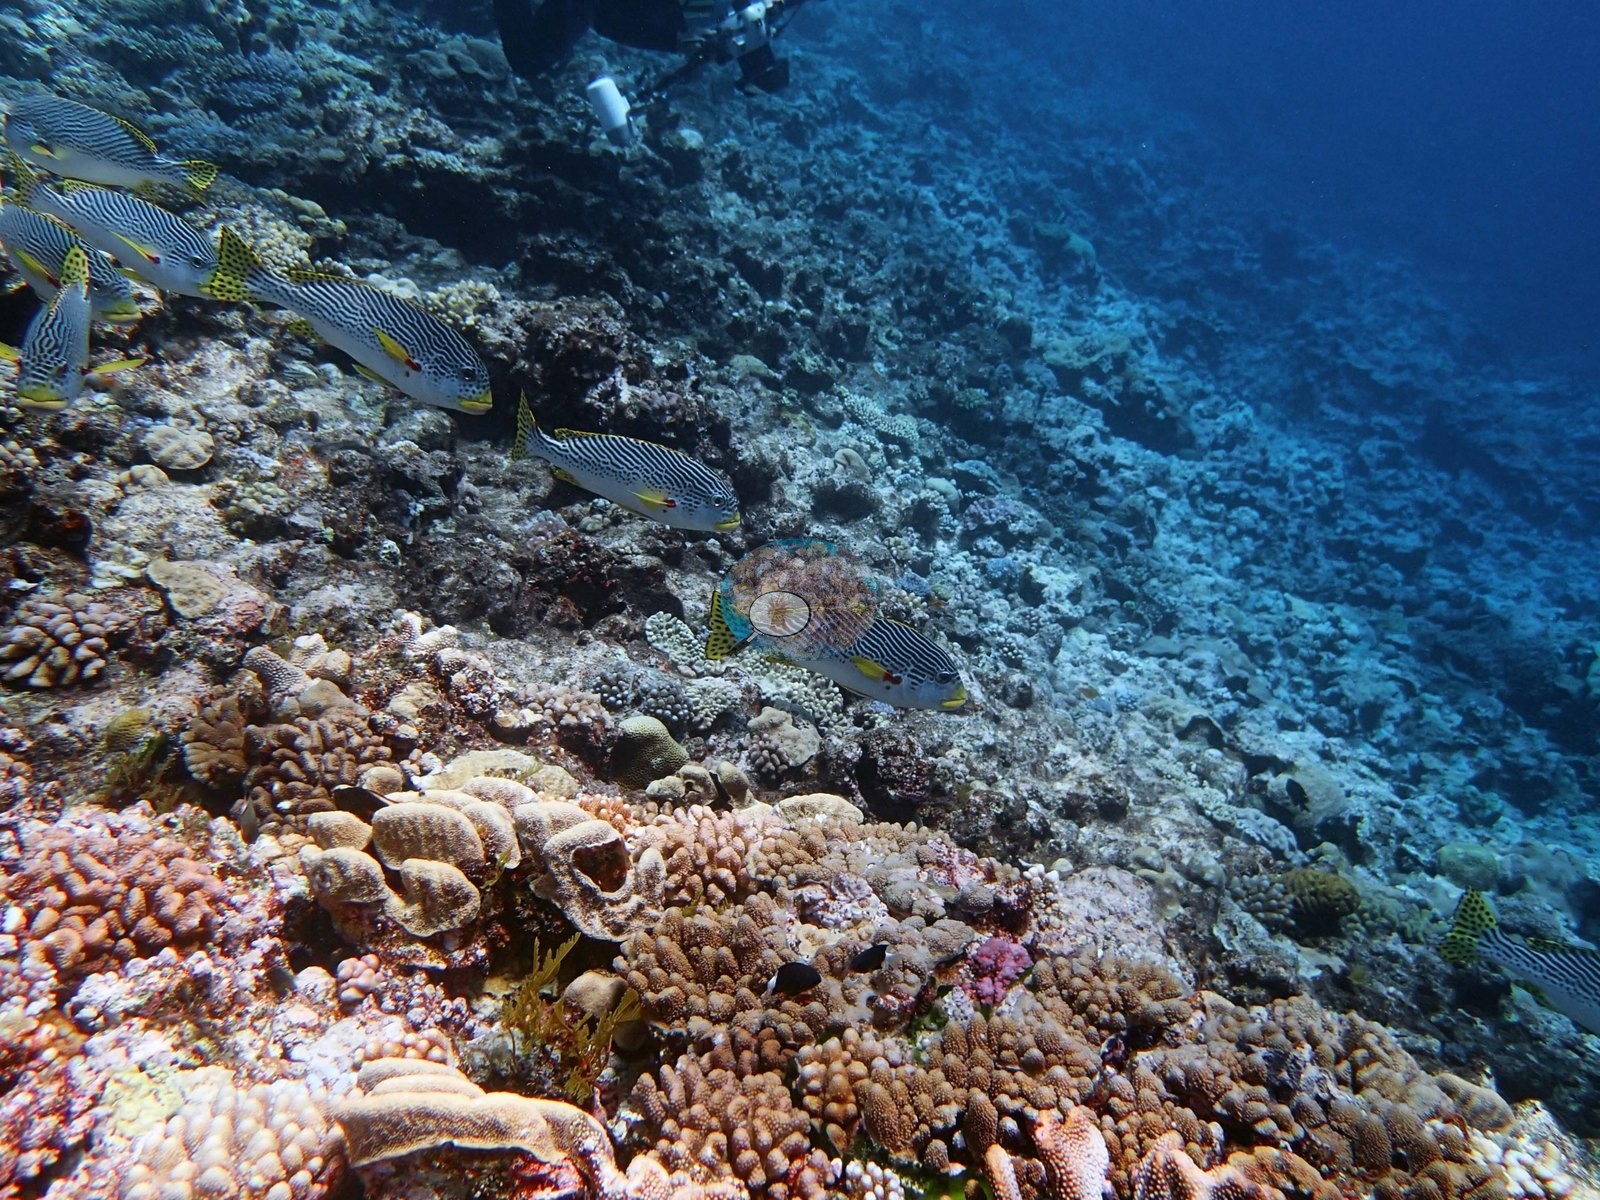
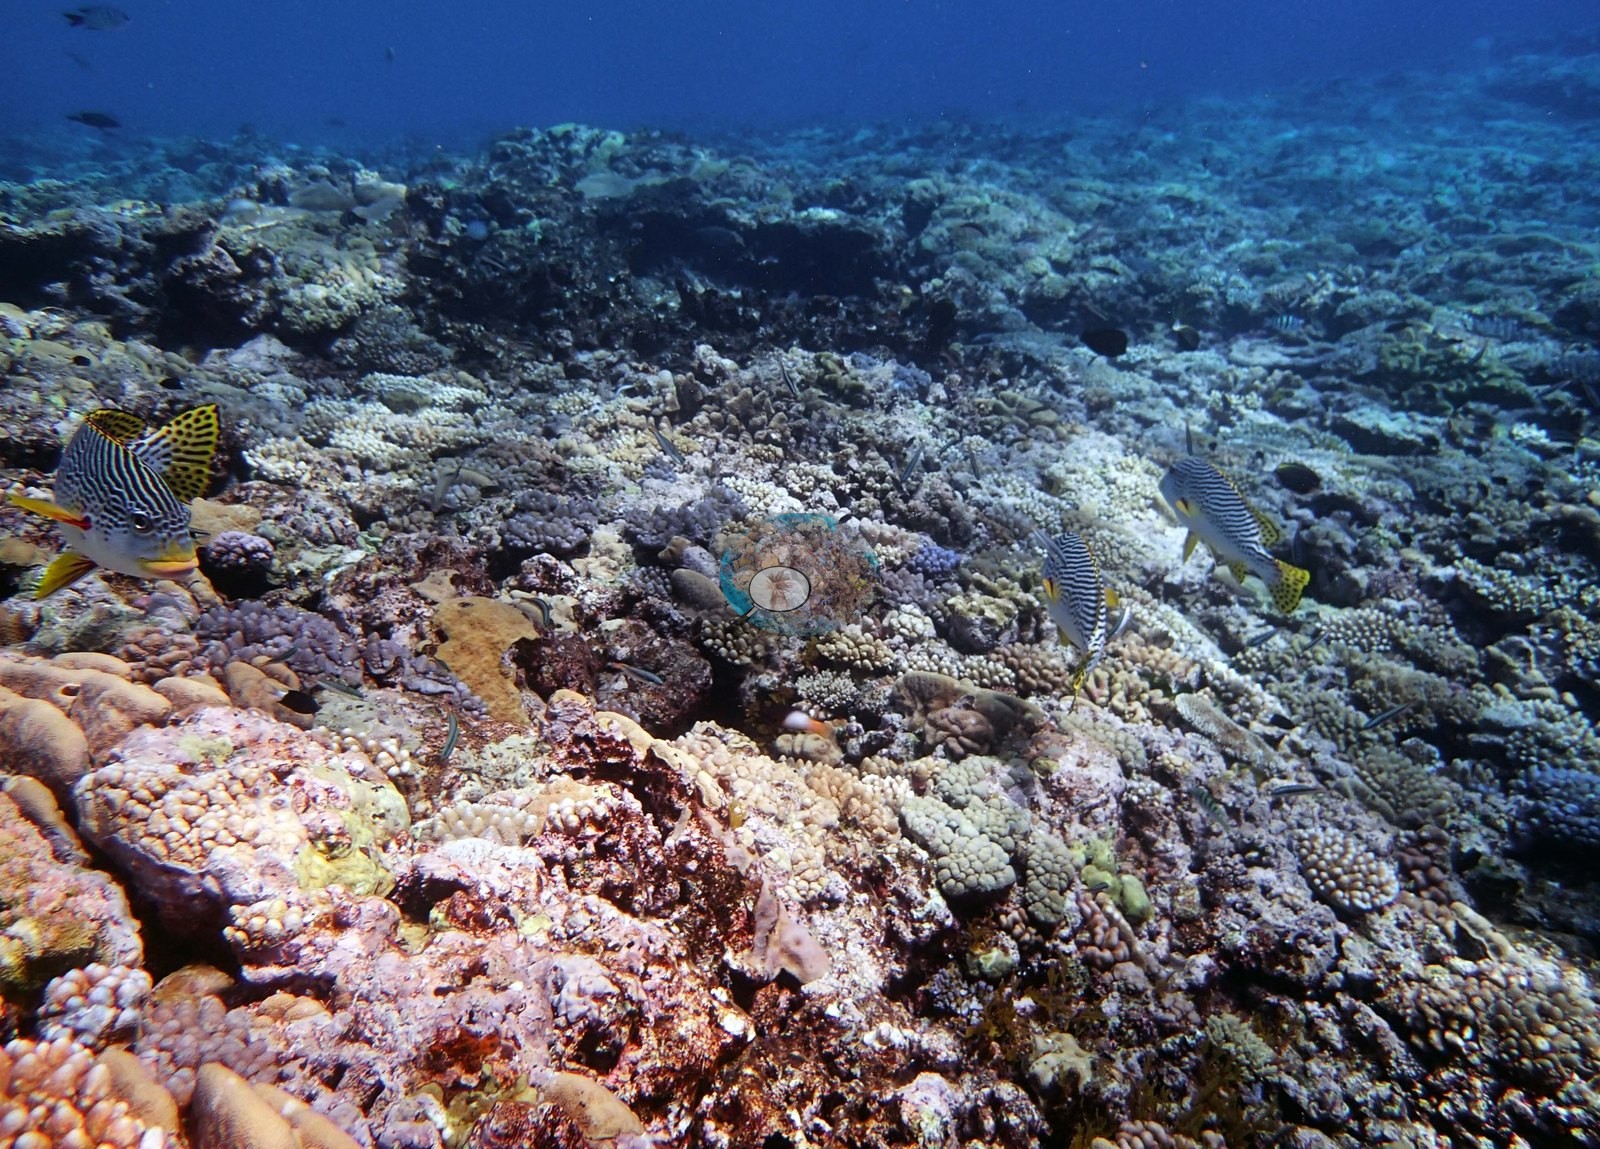
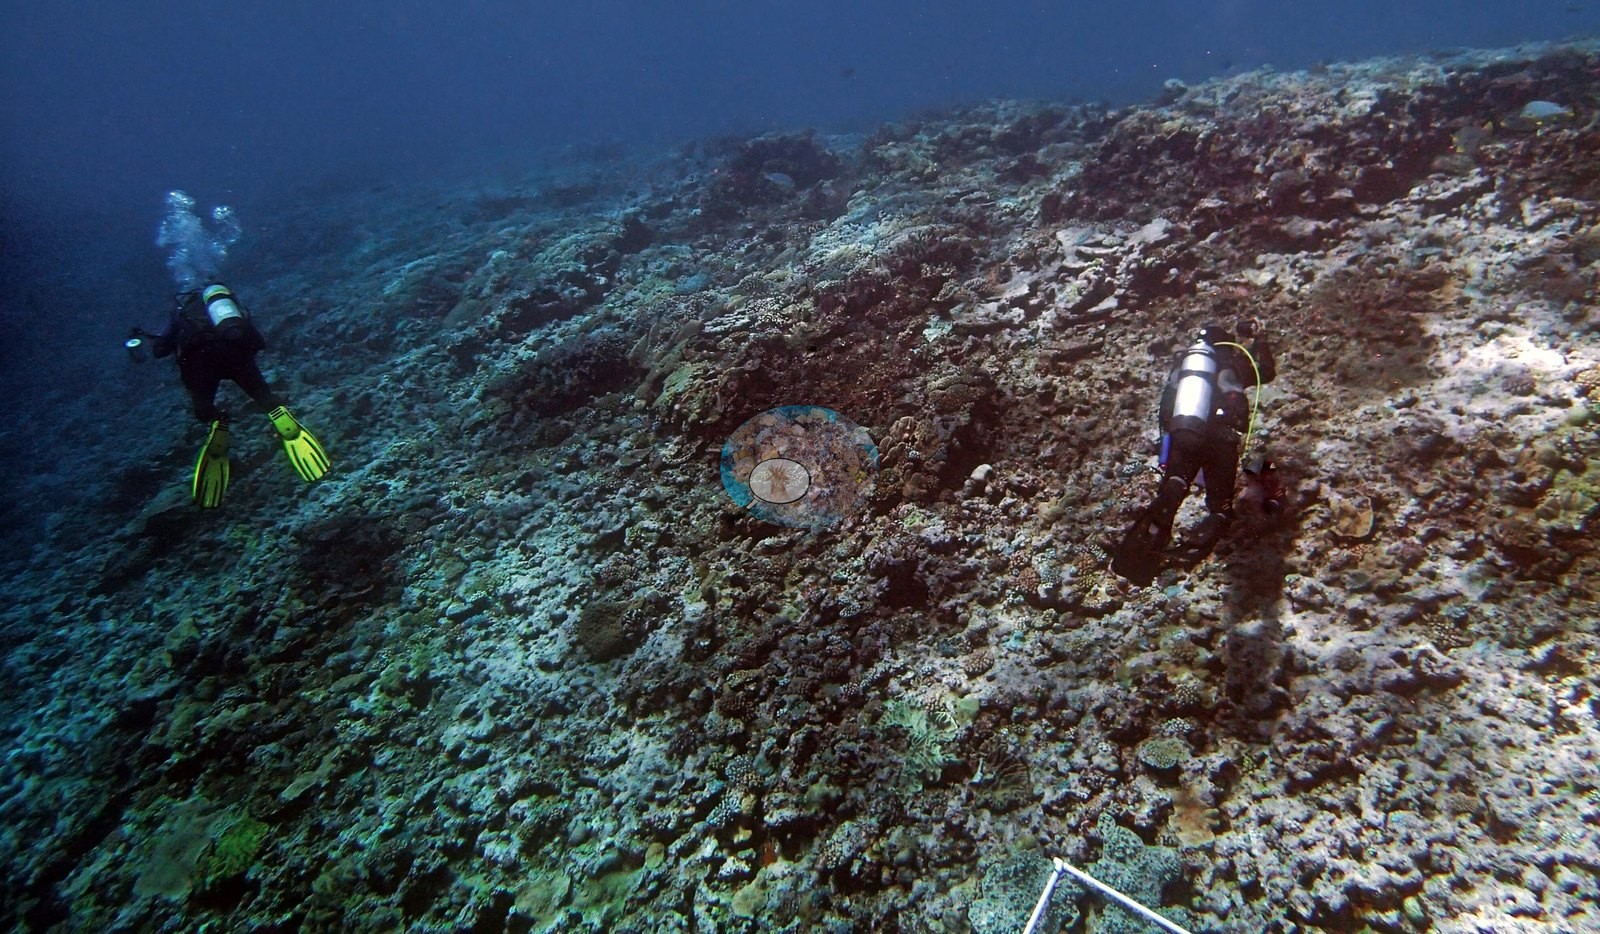
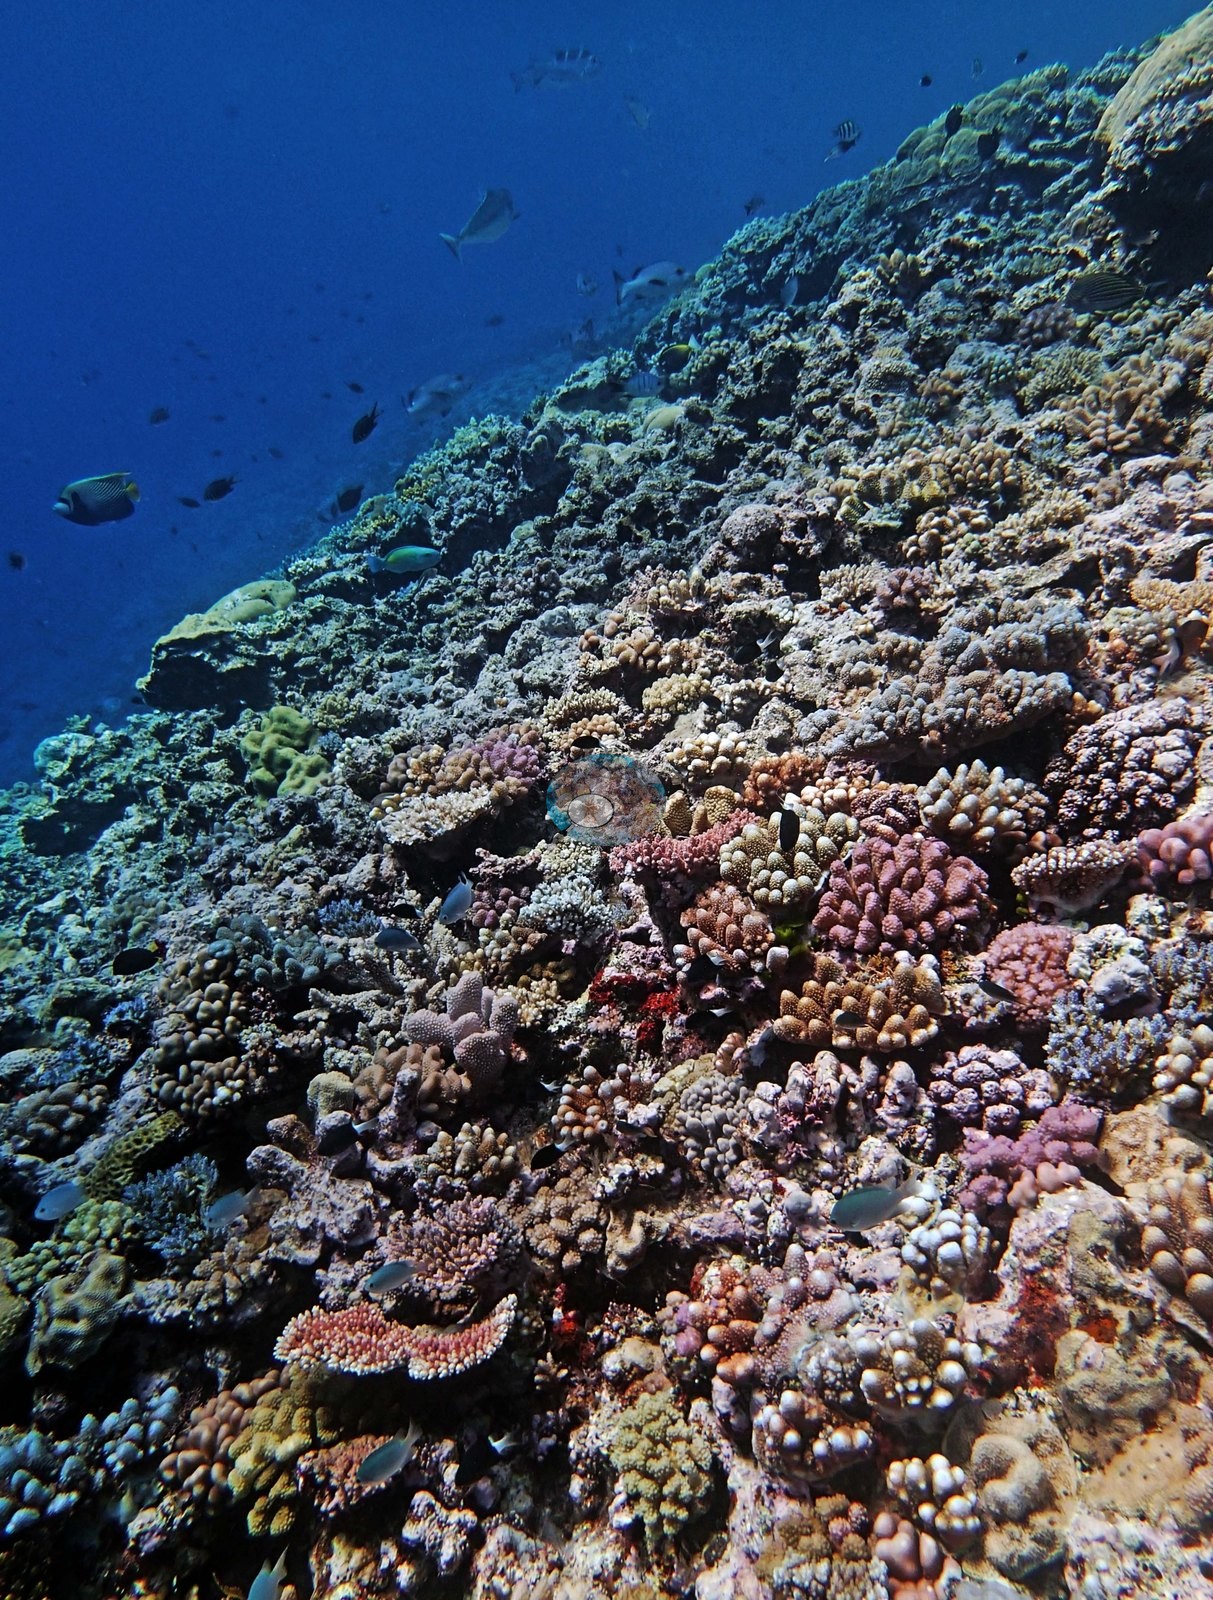
Two more frames run straight down the slope face, an unbroken mosaic of small colonies falling away into deep blue, one with a diver for scale (e.g., Image 5, Image 9).
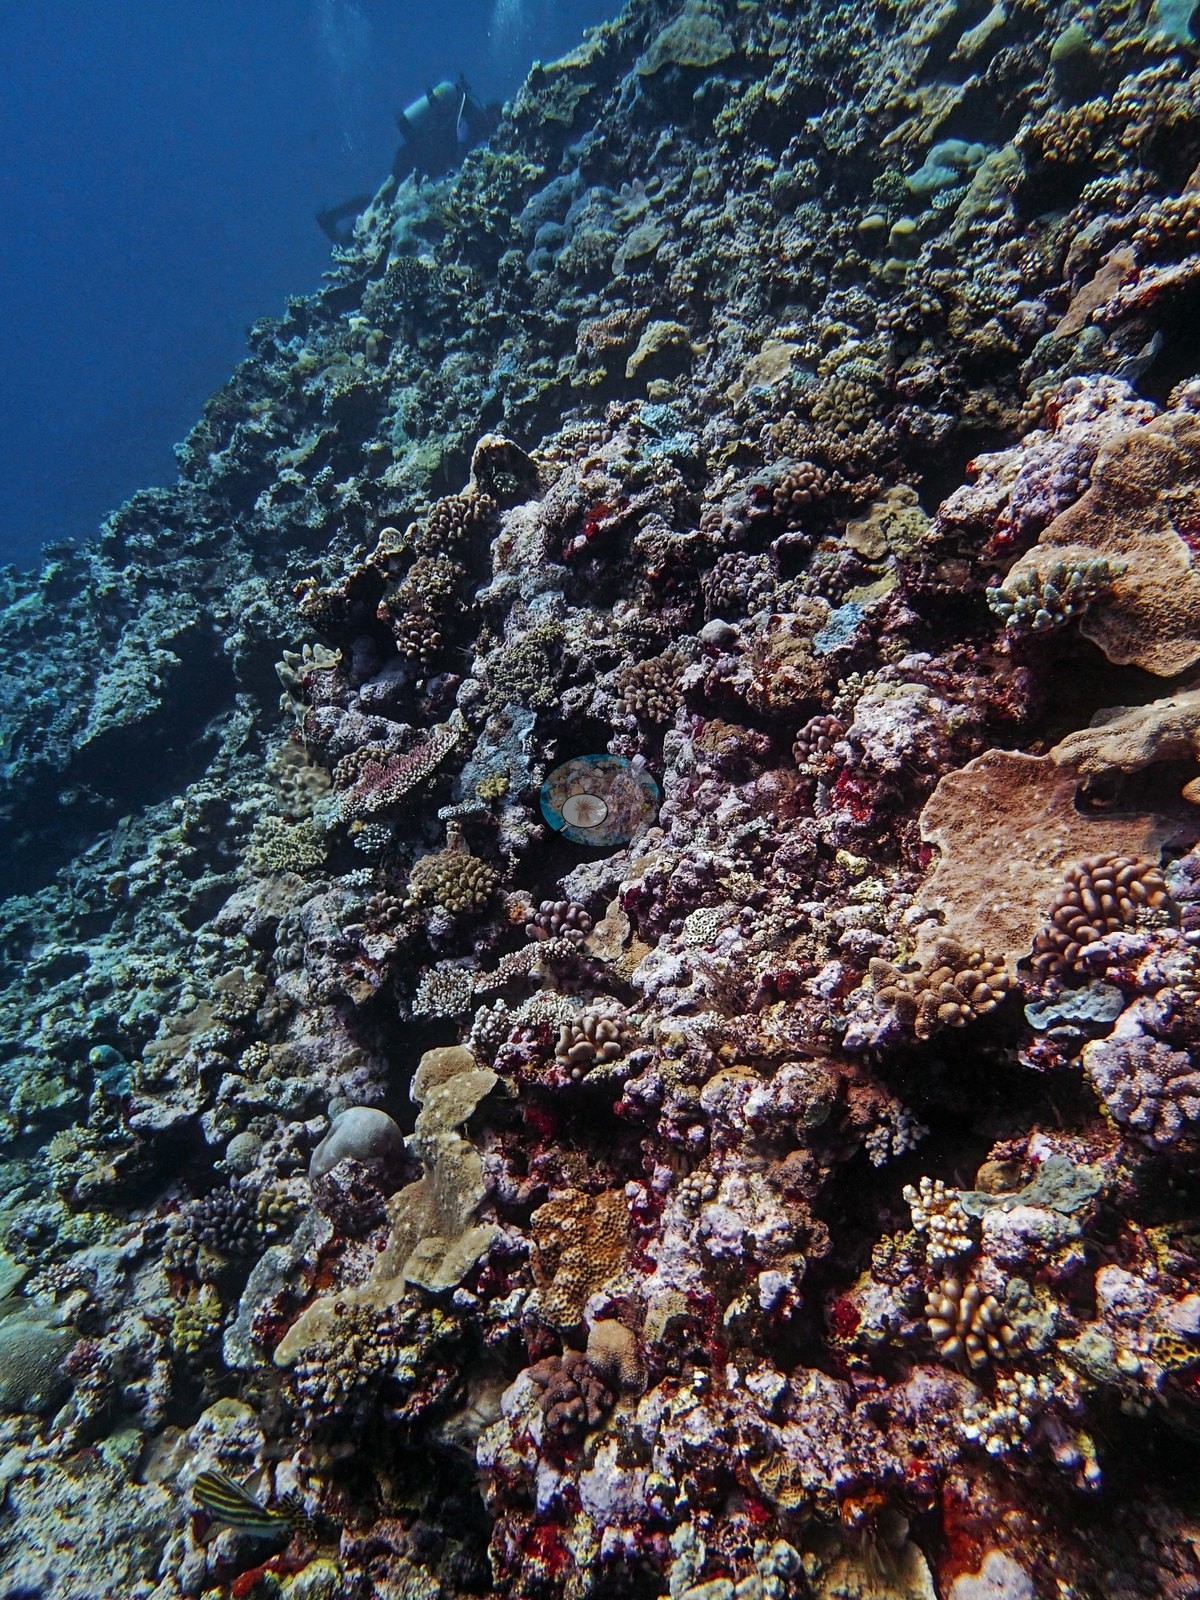
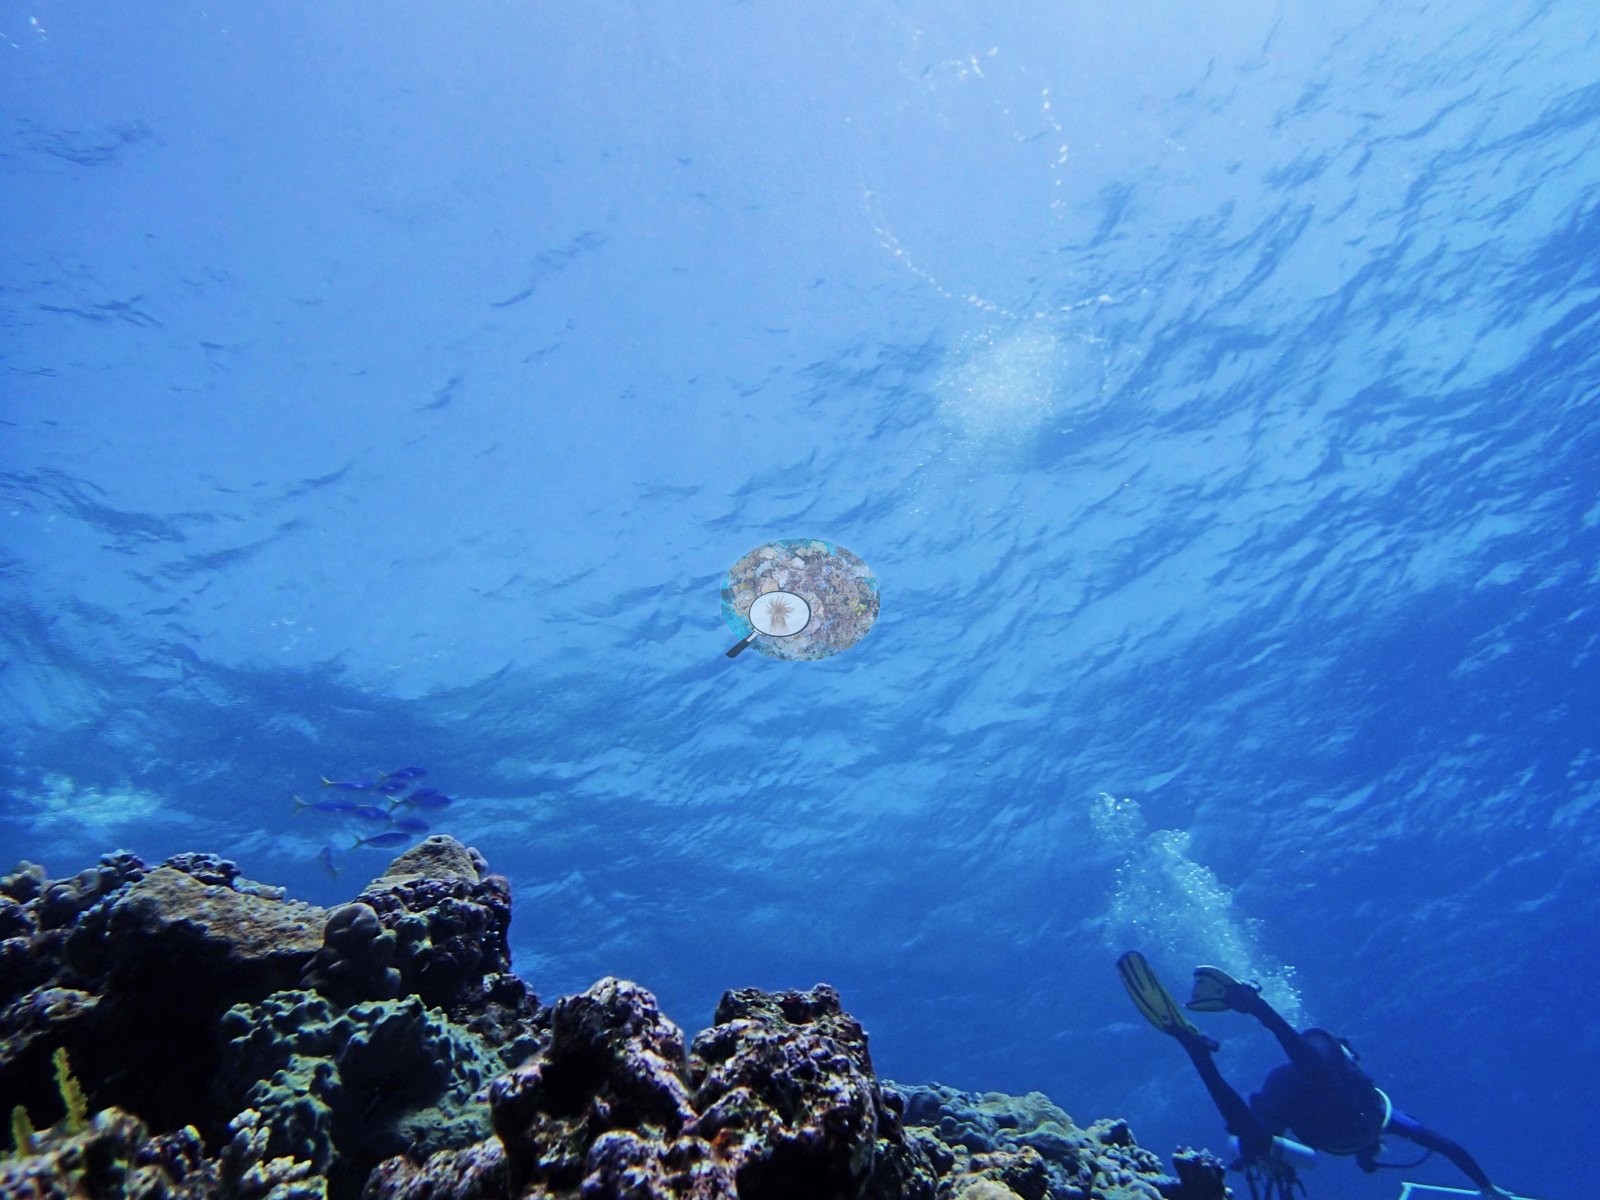
Frames looking upward (Image 7) show surface light and open water above the drop.
The expedition surveyed Yonge Reef as one of its Green (no-take) reefs; under the GBRMPA Zoning Plan the reef is a Scientific Research Zone (no-take, research by permit) with a Conservation Park Zone on its lee side, and the recorded position lies inside the Scientific Research Zone.
General benthic features
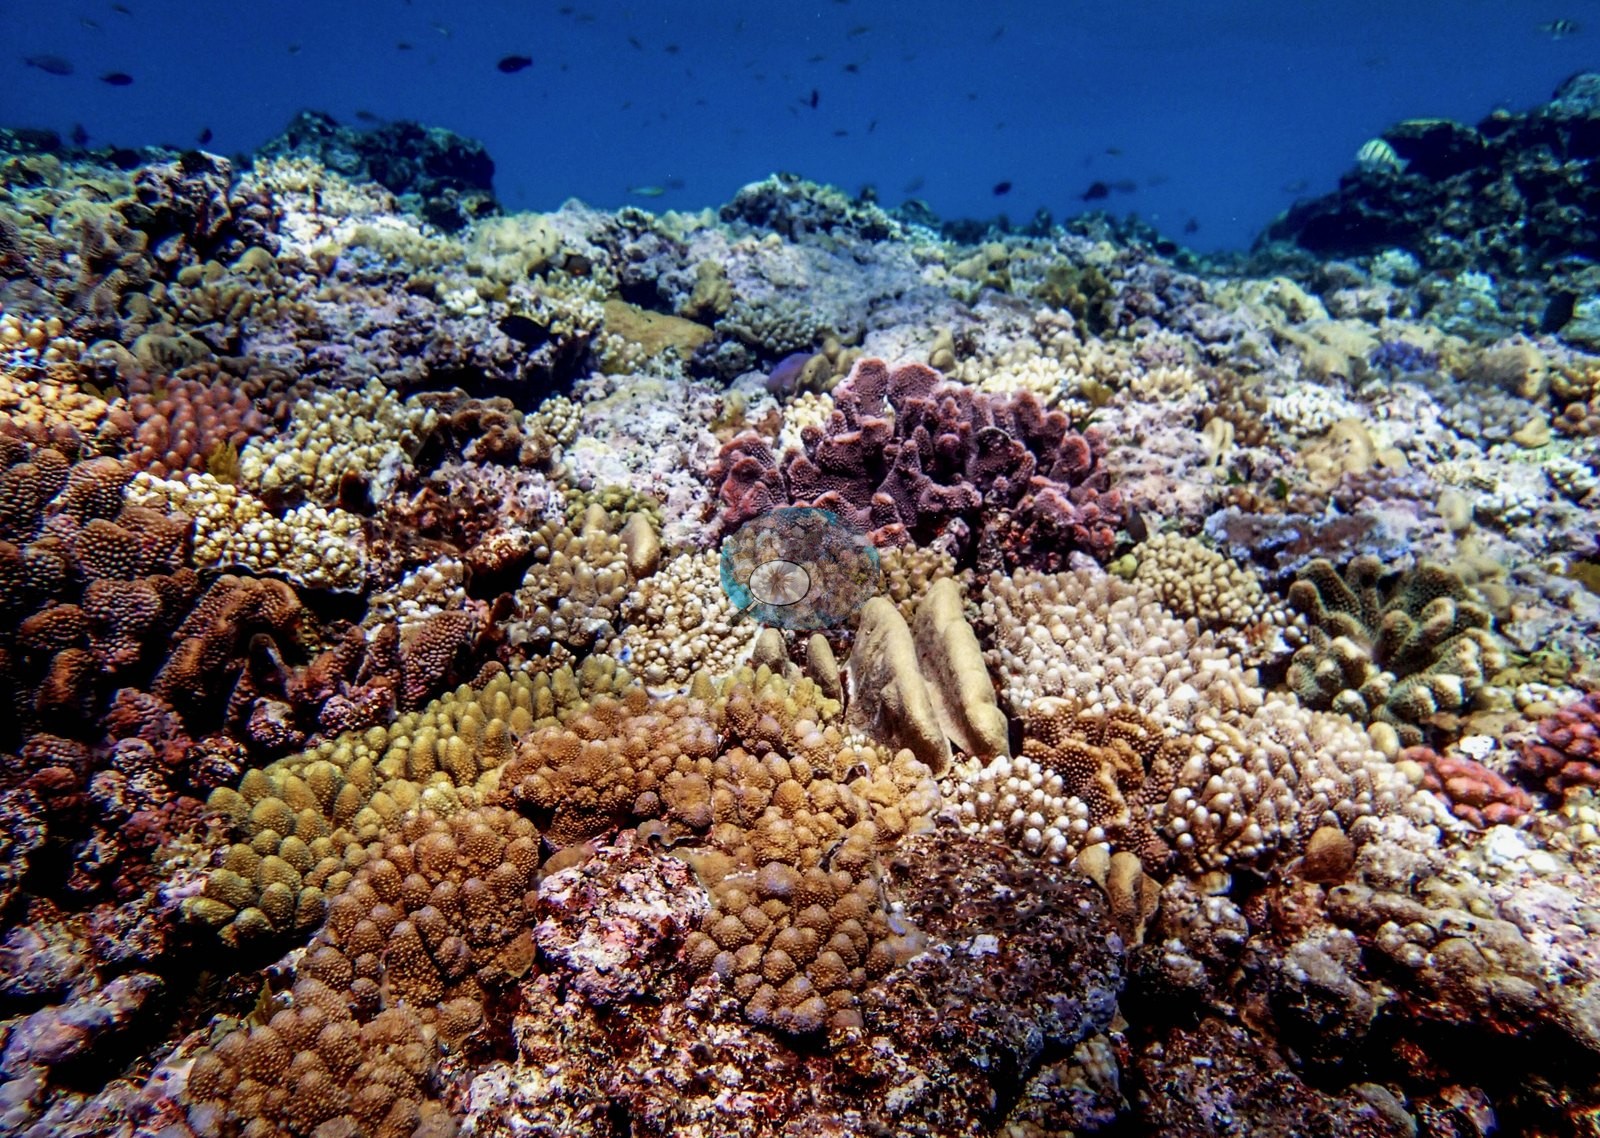
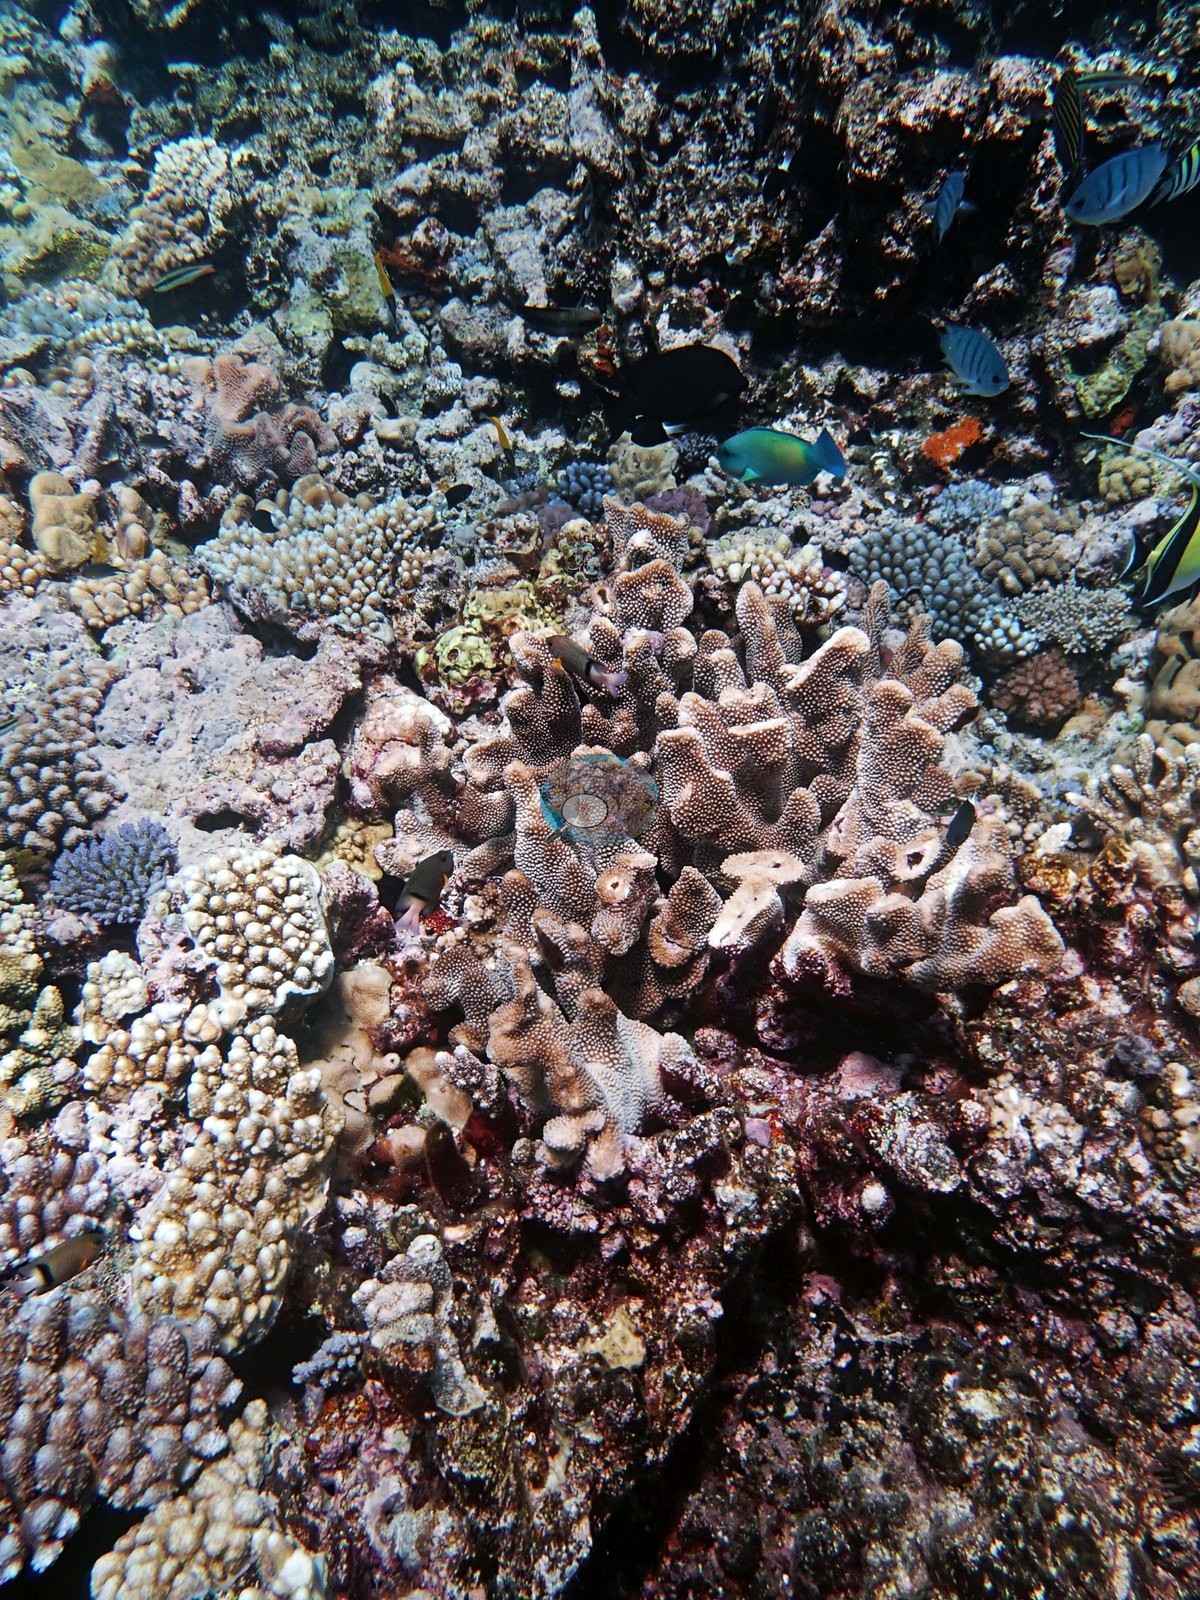
Thirty-three frames from Yonge Reef make the point: this is a shallow, high-energy reef whose coral is built from very many small colonies rather than a few big ones, and the photographs show that texture over and over. The downward and oblique frames (e.g., Image 4, Image 8, Image 13, Image 15, Image 16, Image 17, Image 20, Image 23, Image 24, Image 26, Image 27, Image 29, Image 31) are a dense confetti of corymbose and digitate Acropora, small Pocillopora, low massive faviids, encrusting Montipora-type sheets in blue, green, and rust, and scattered small tables, all set into pink and lilac crustose-coralline pavement with rubble in the interstices.
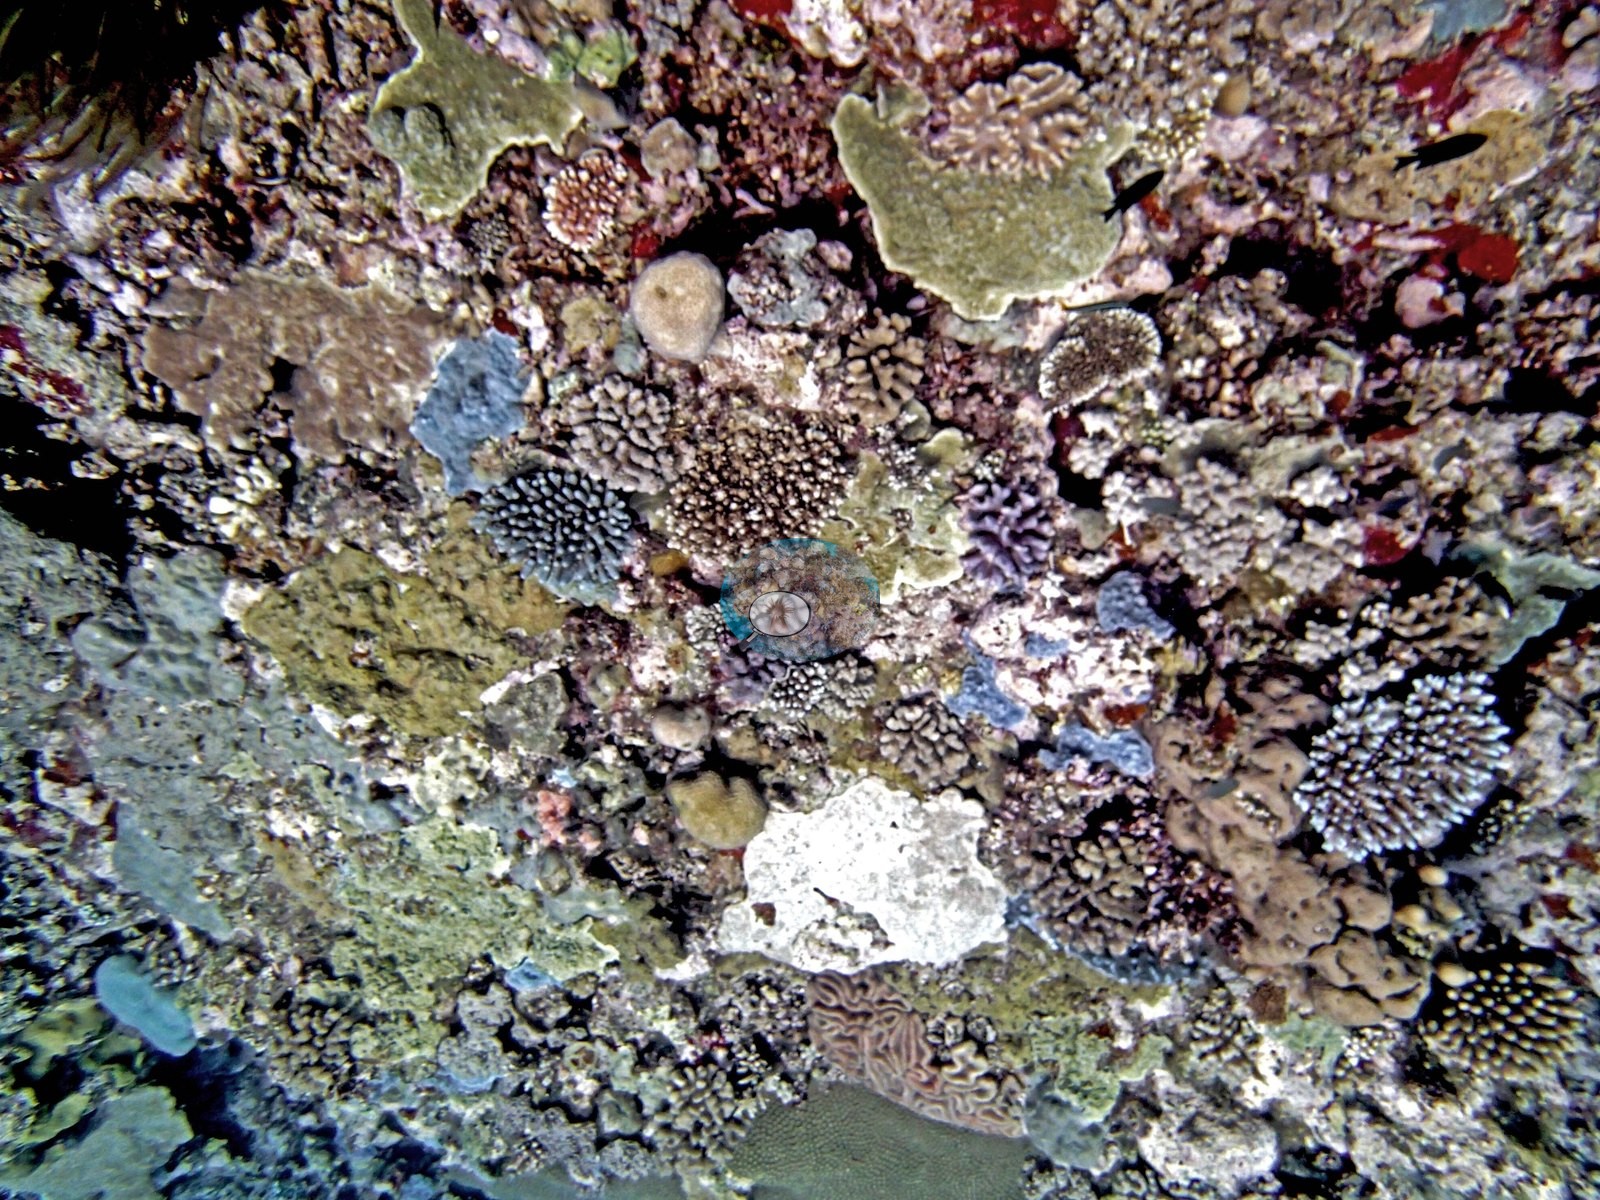
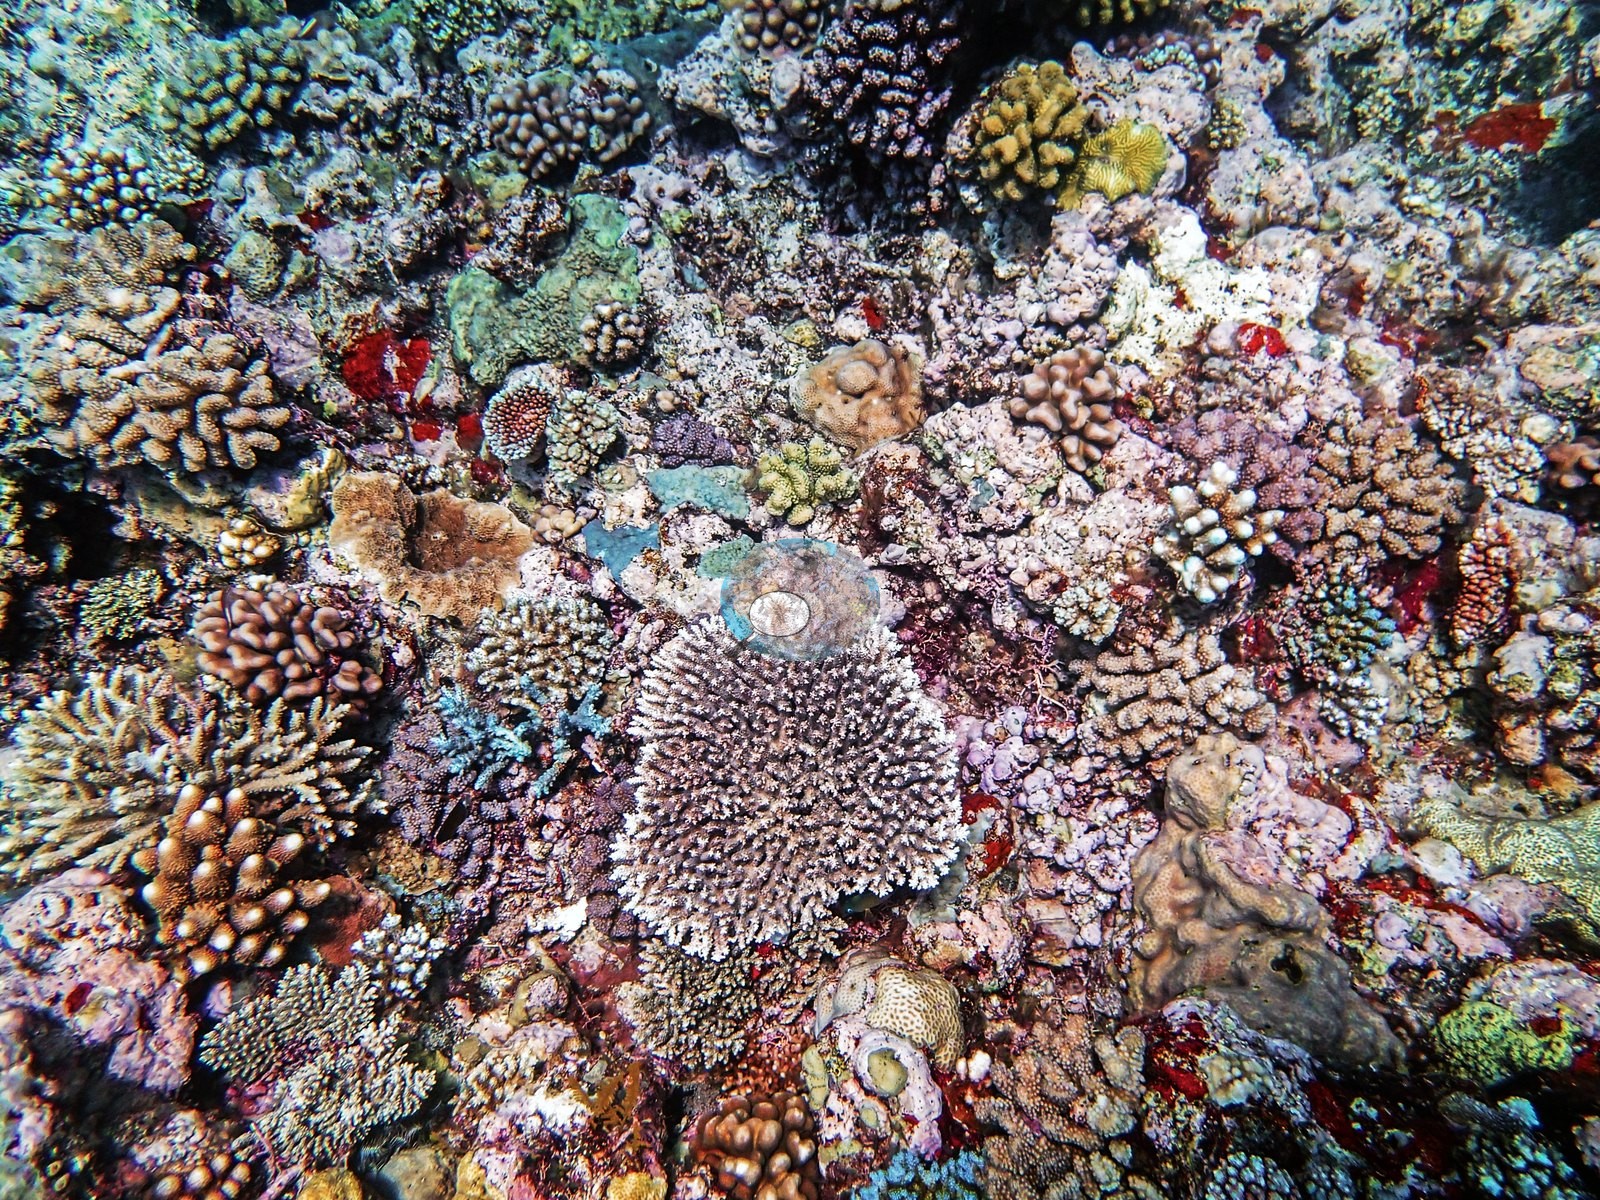
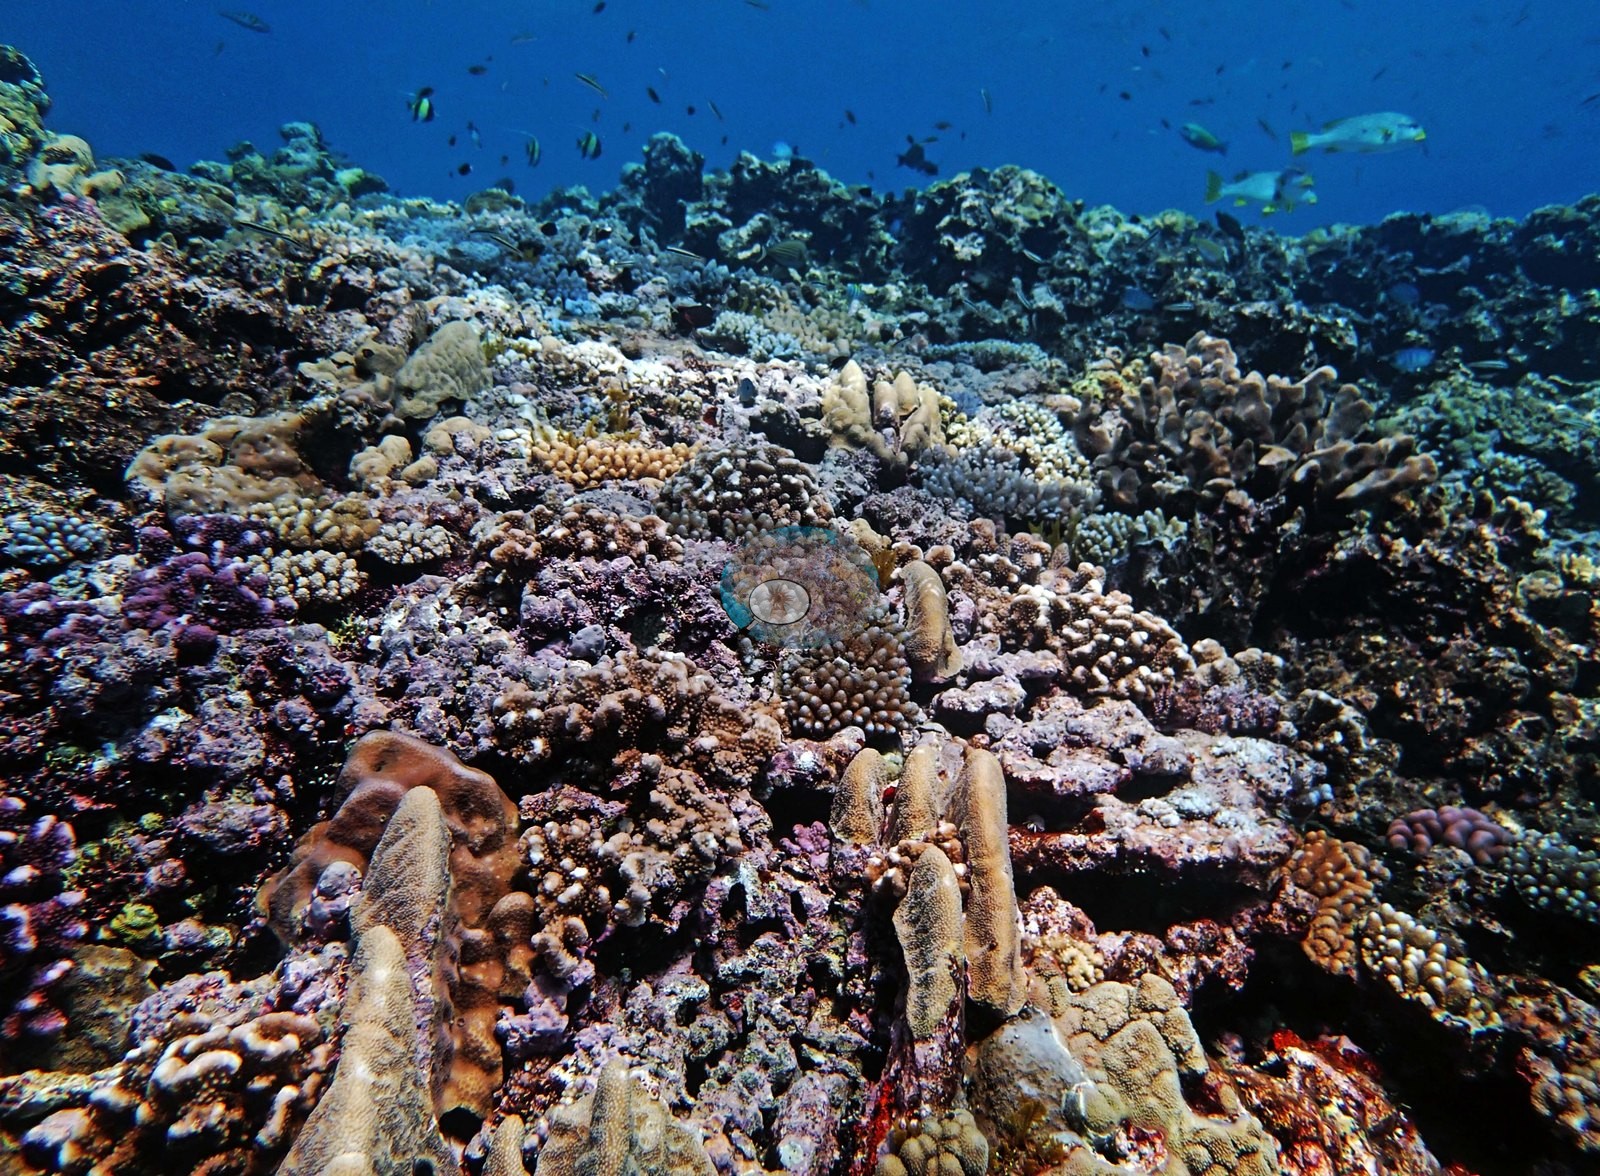
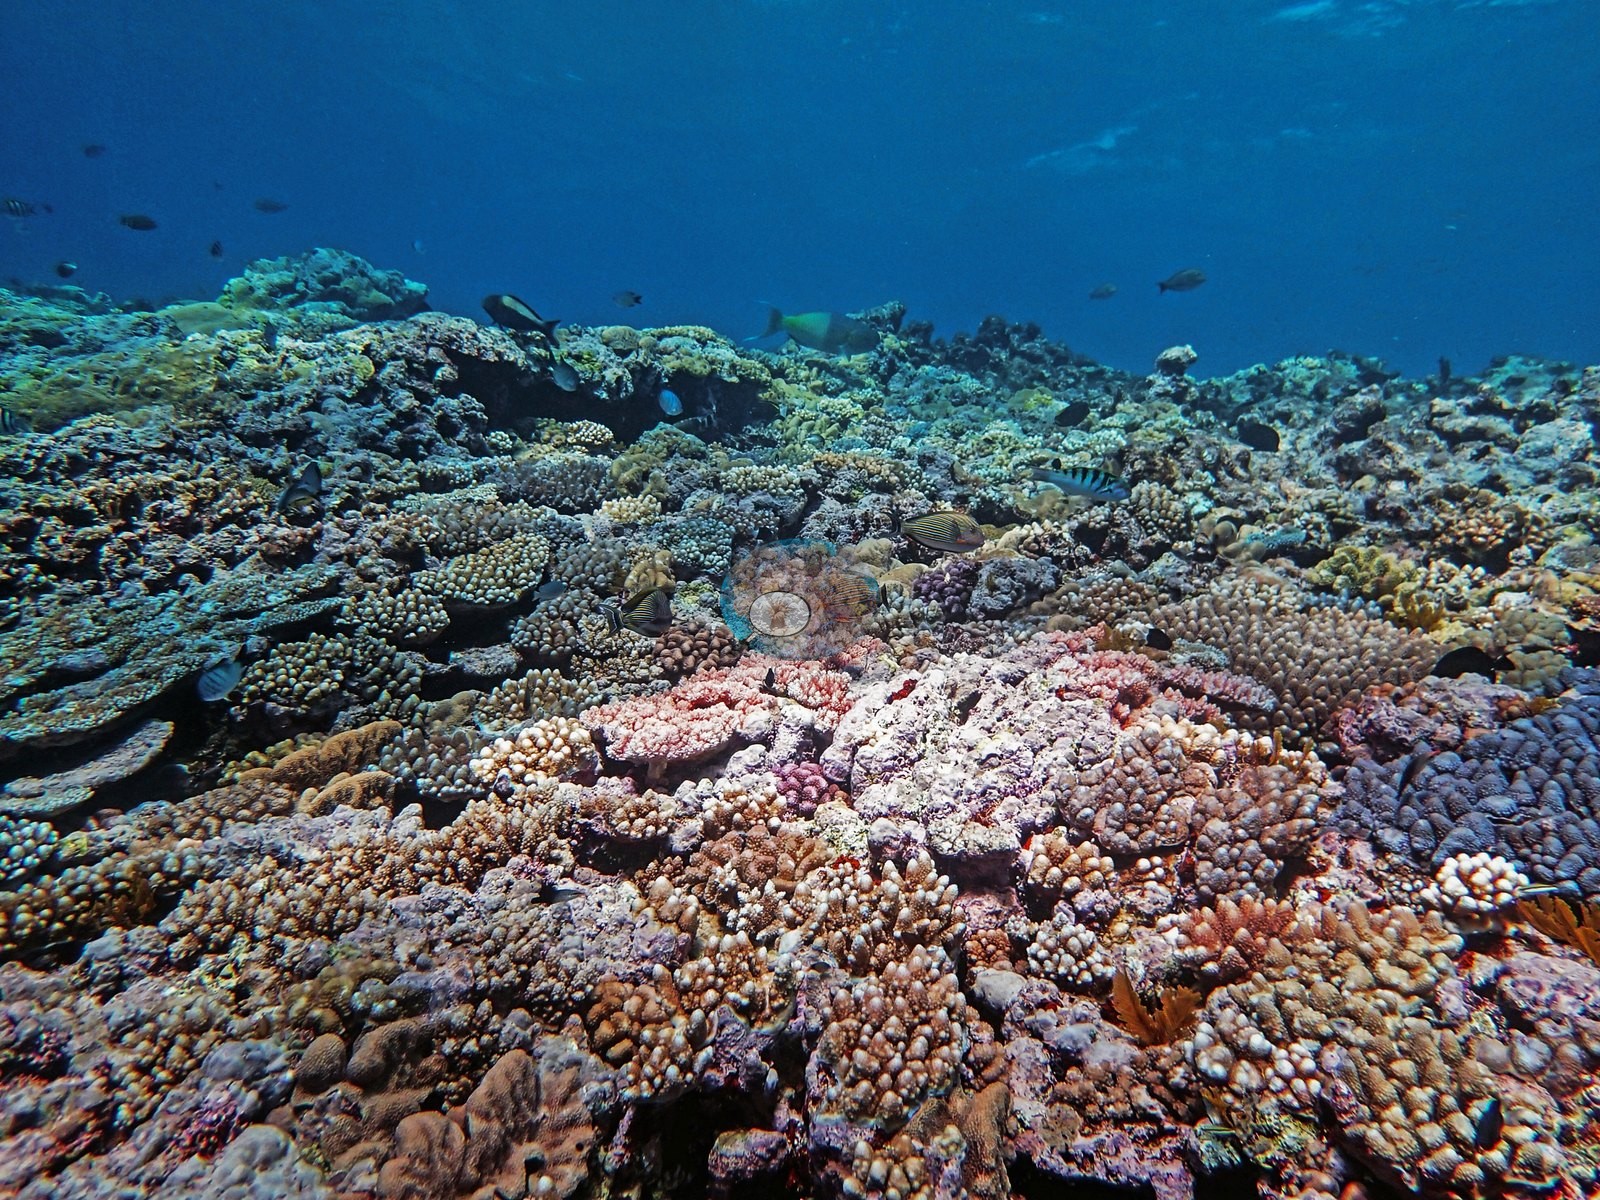
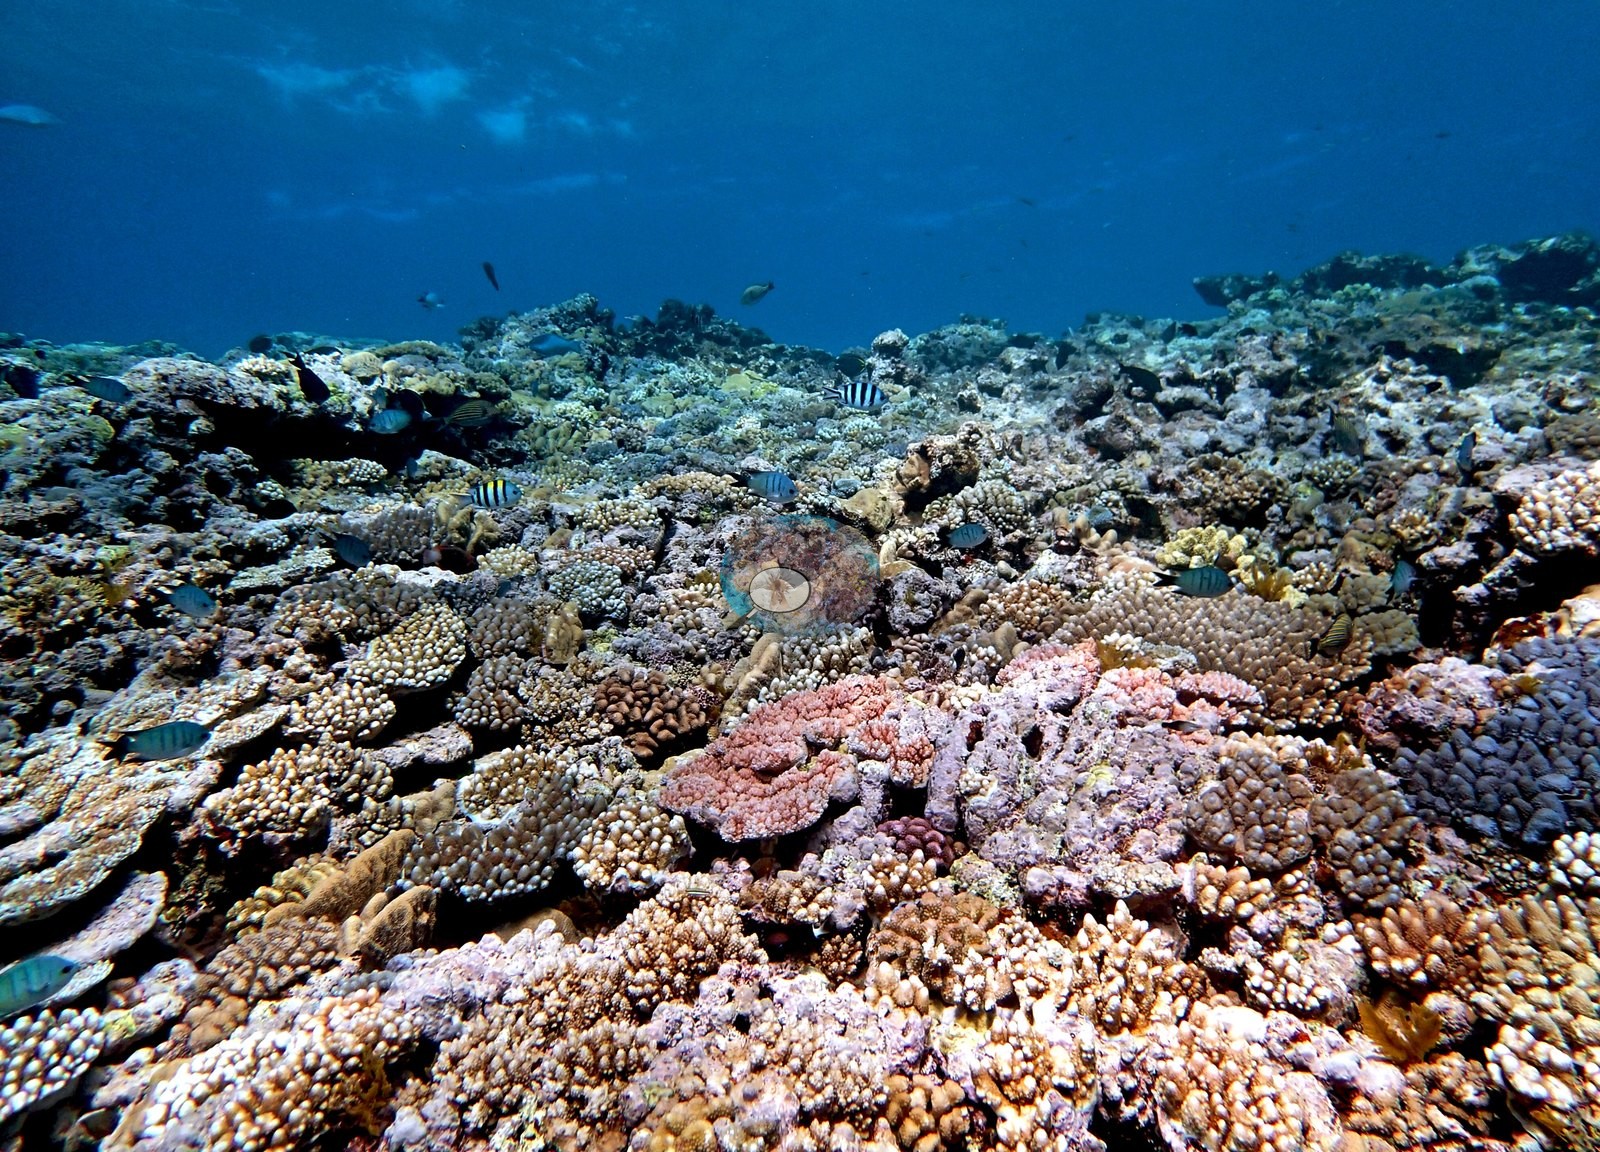
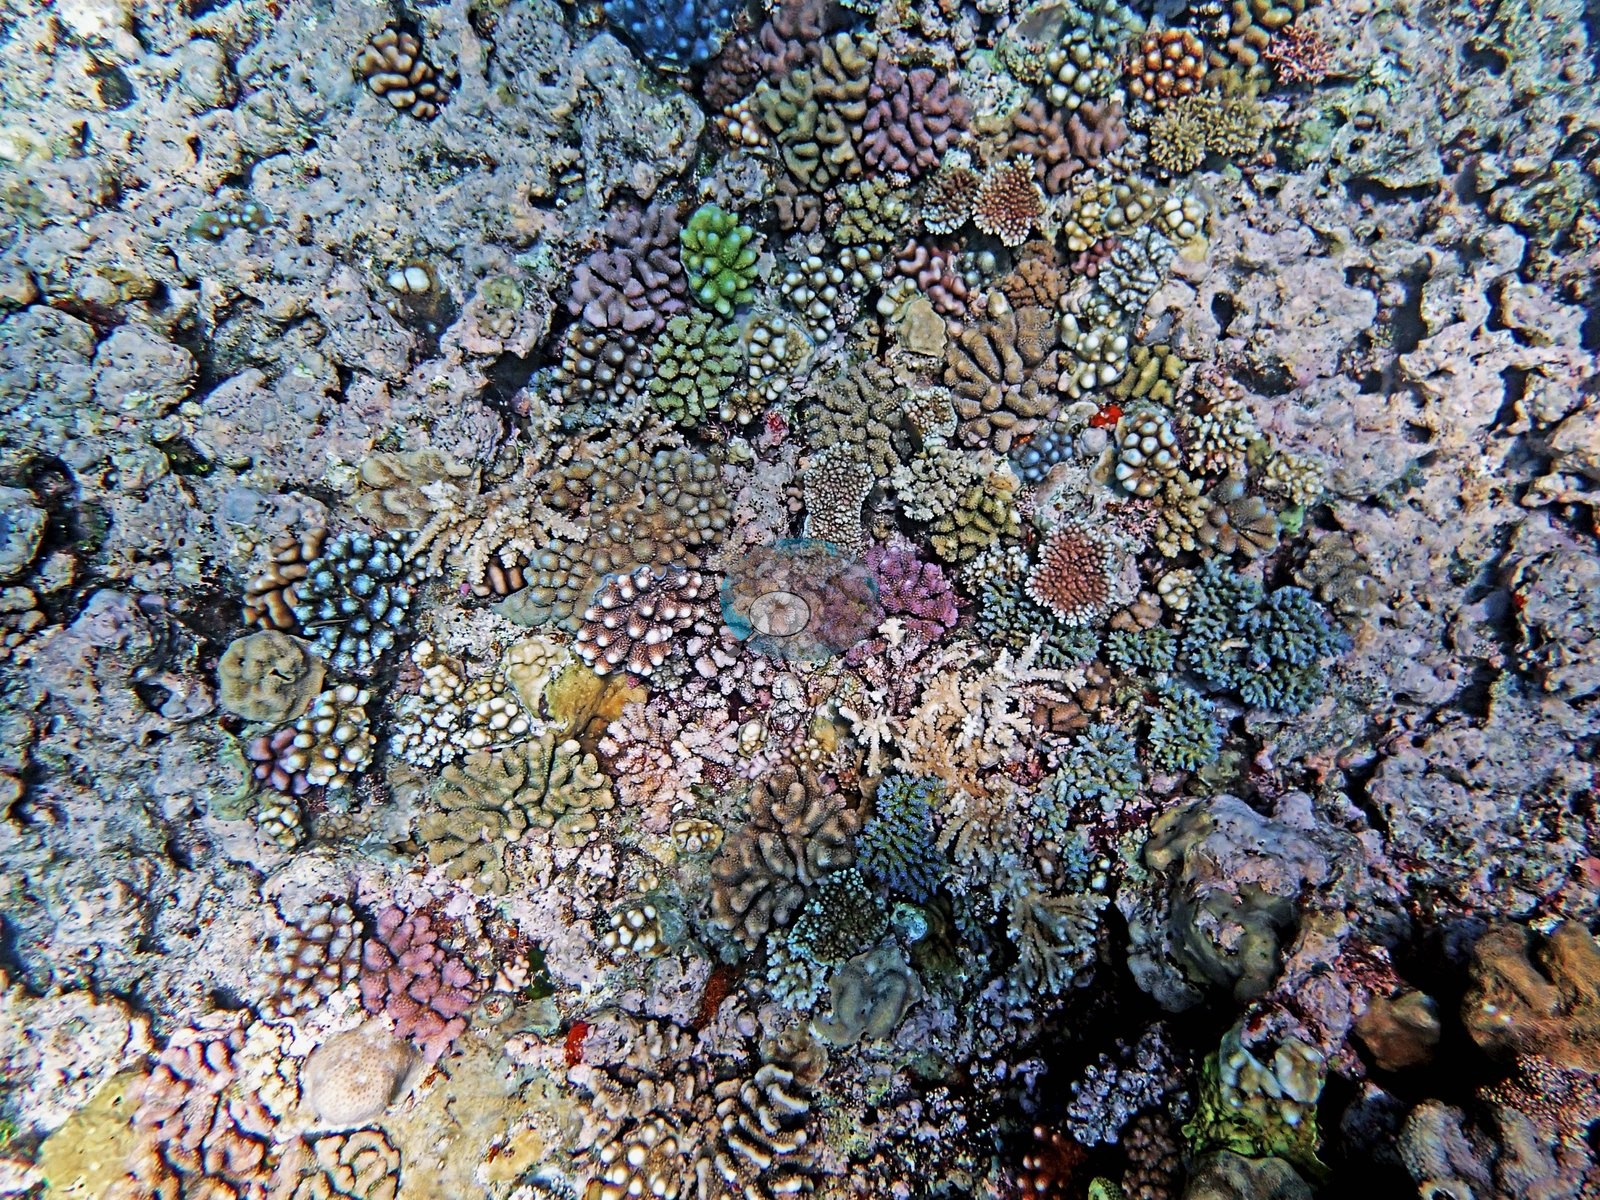
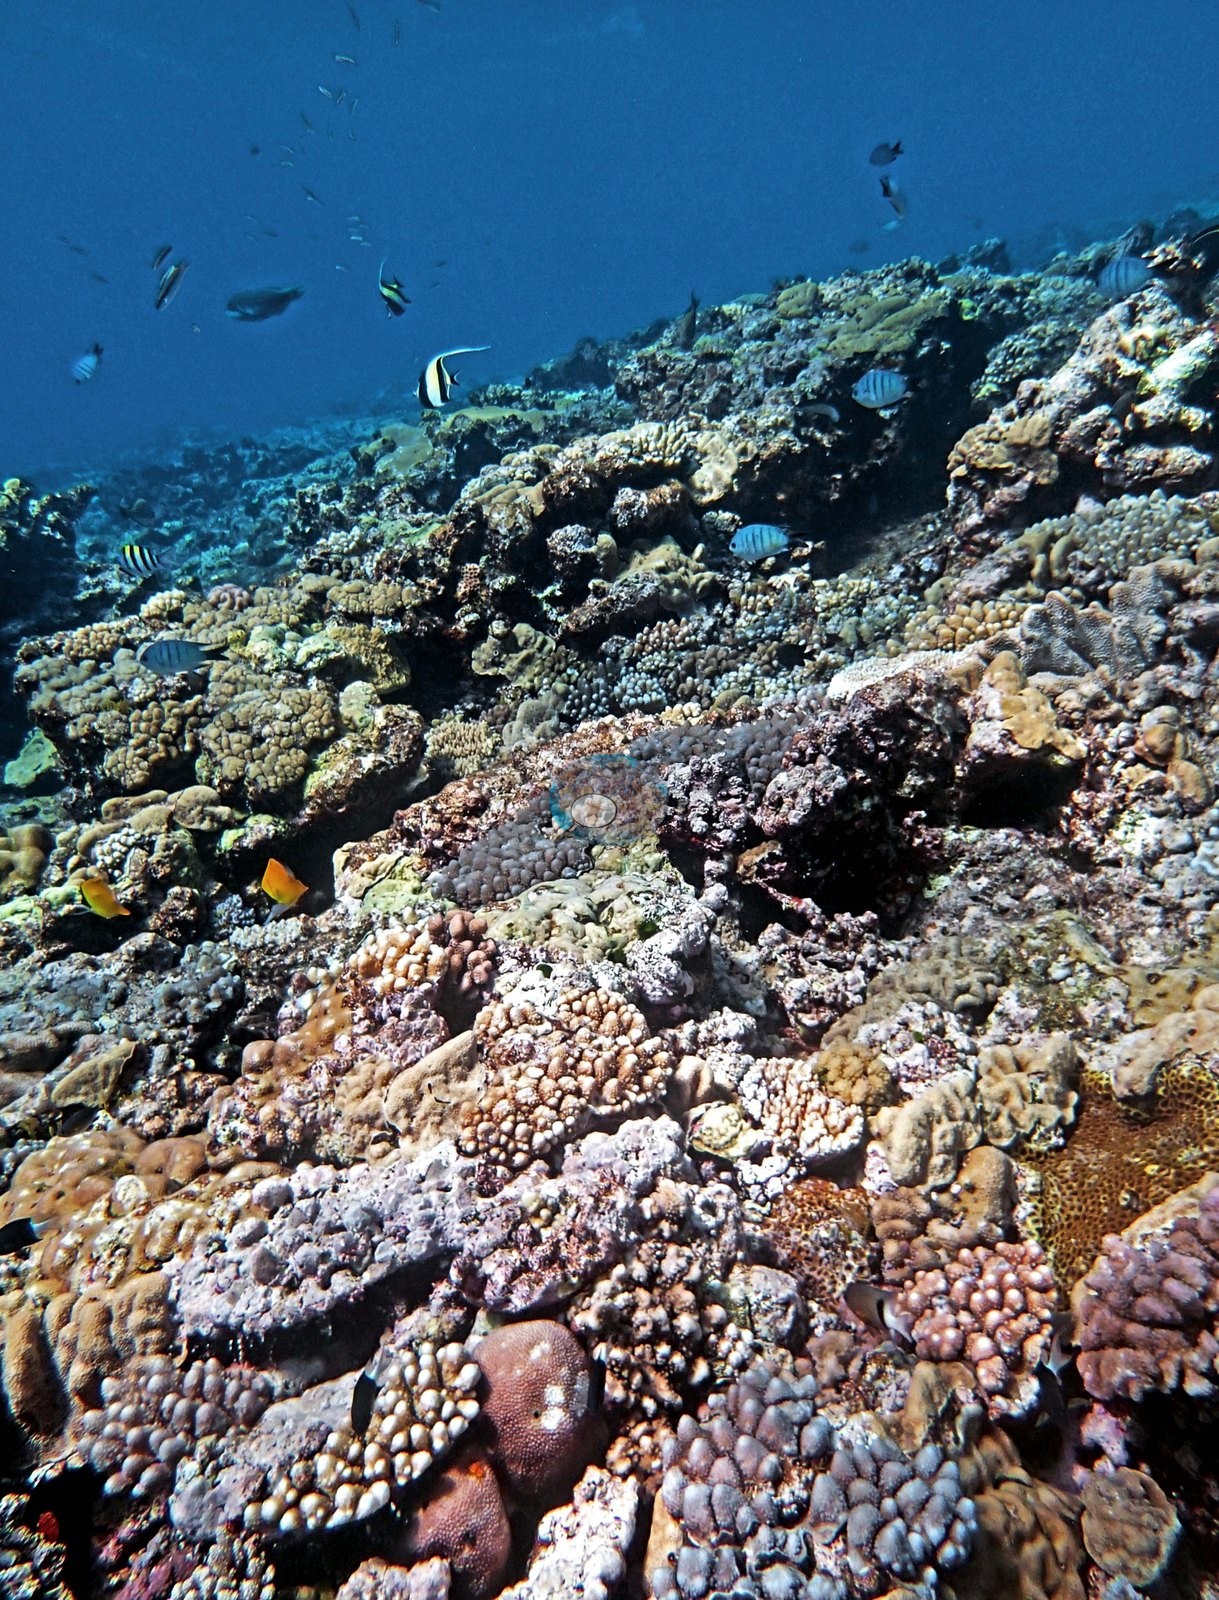
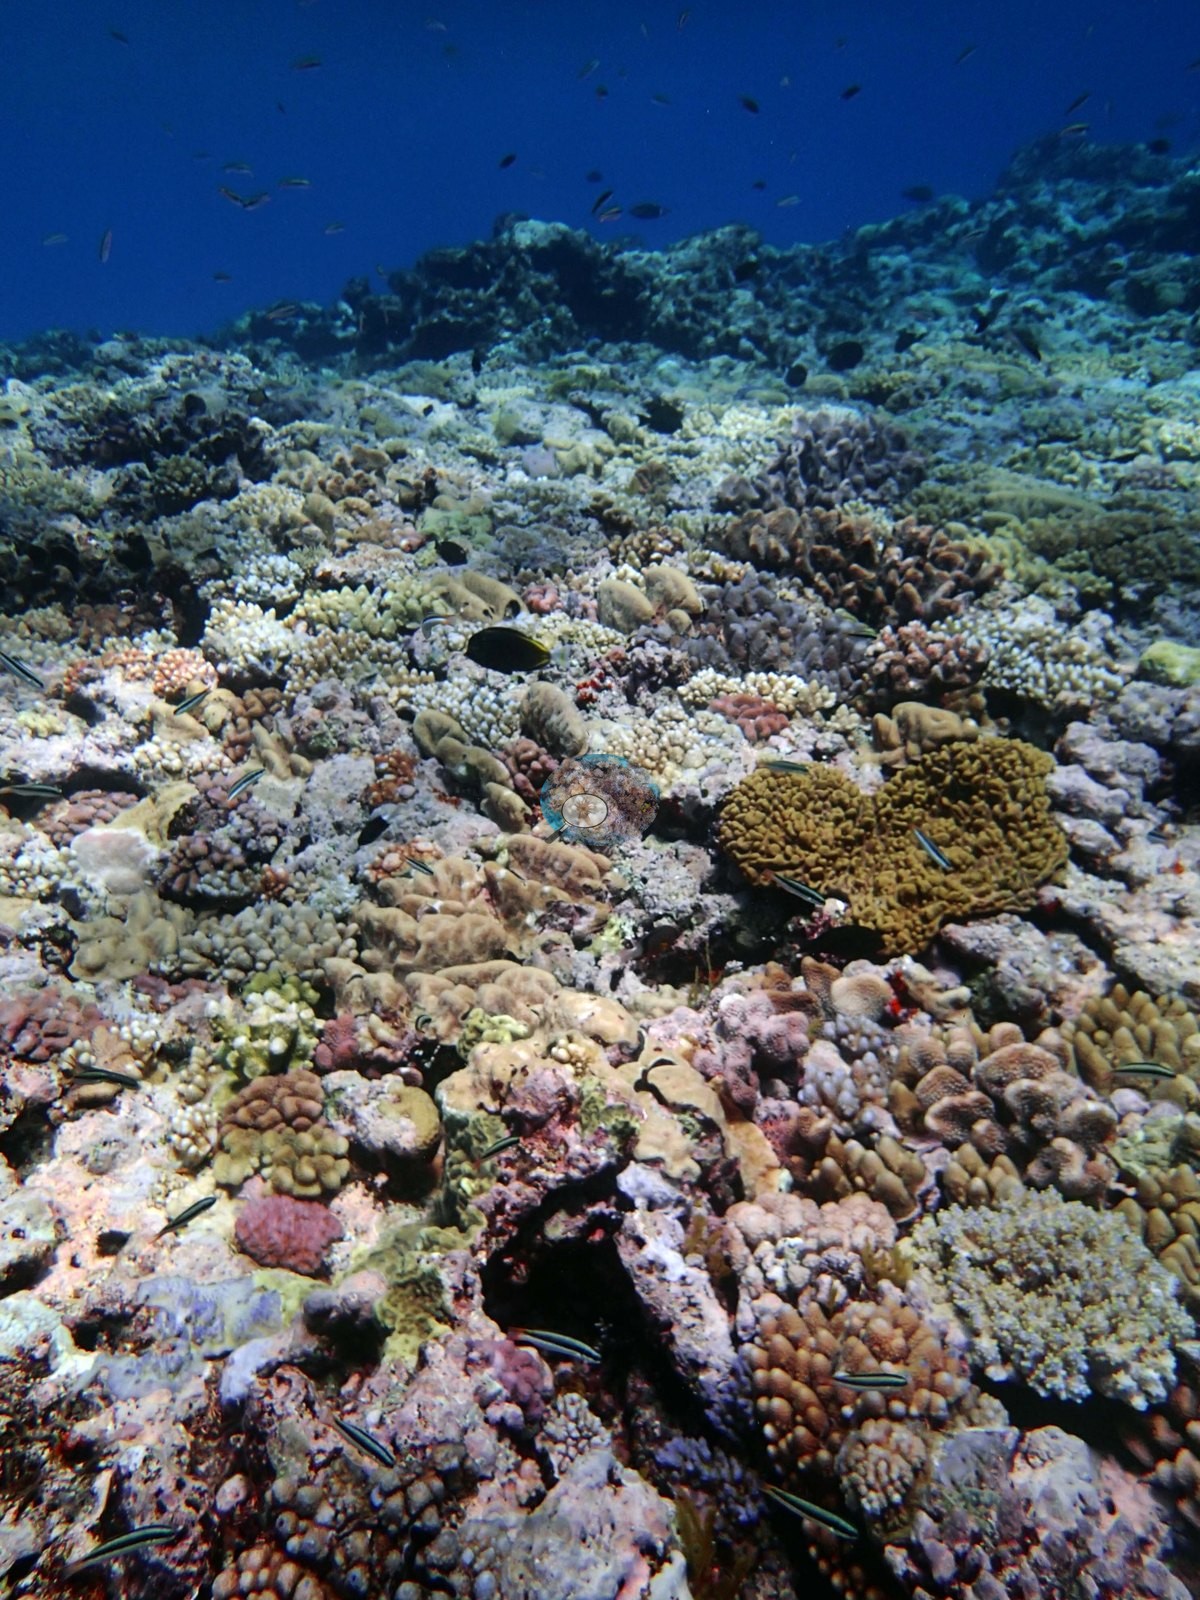
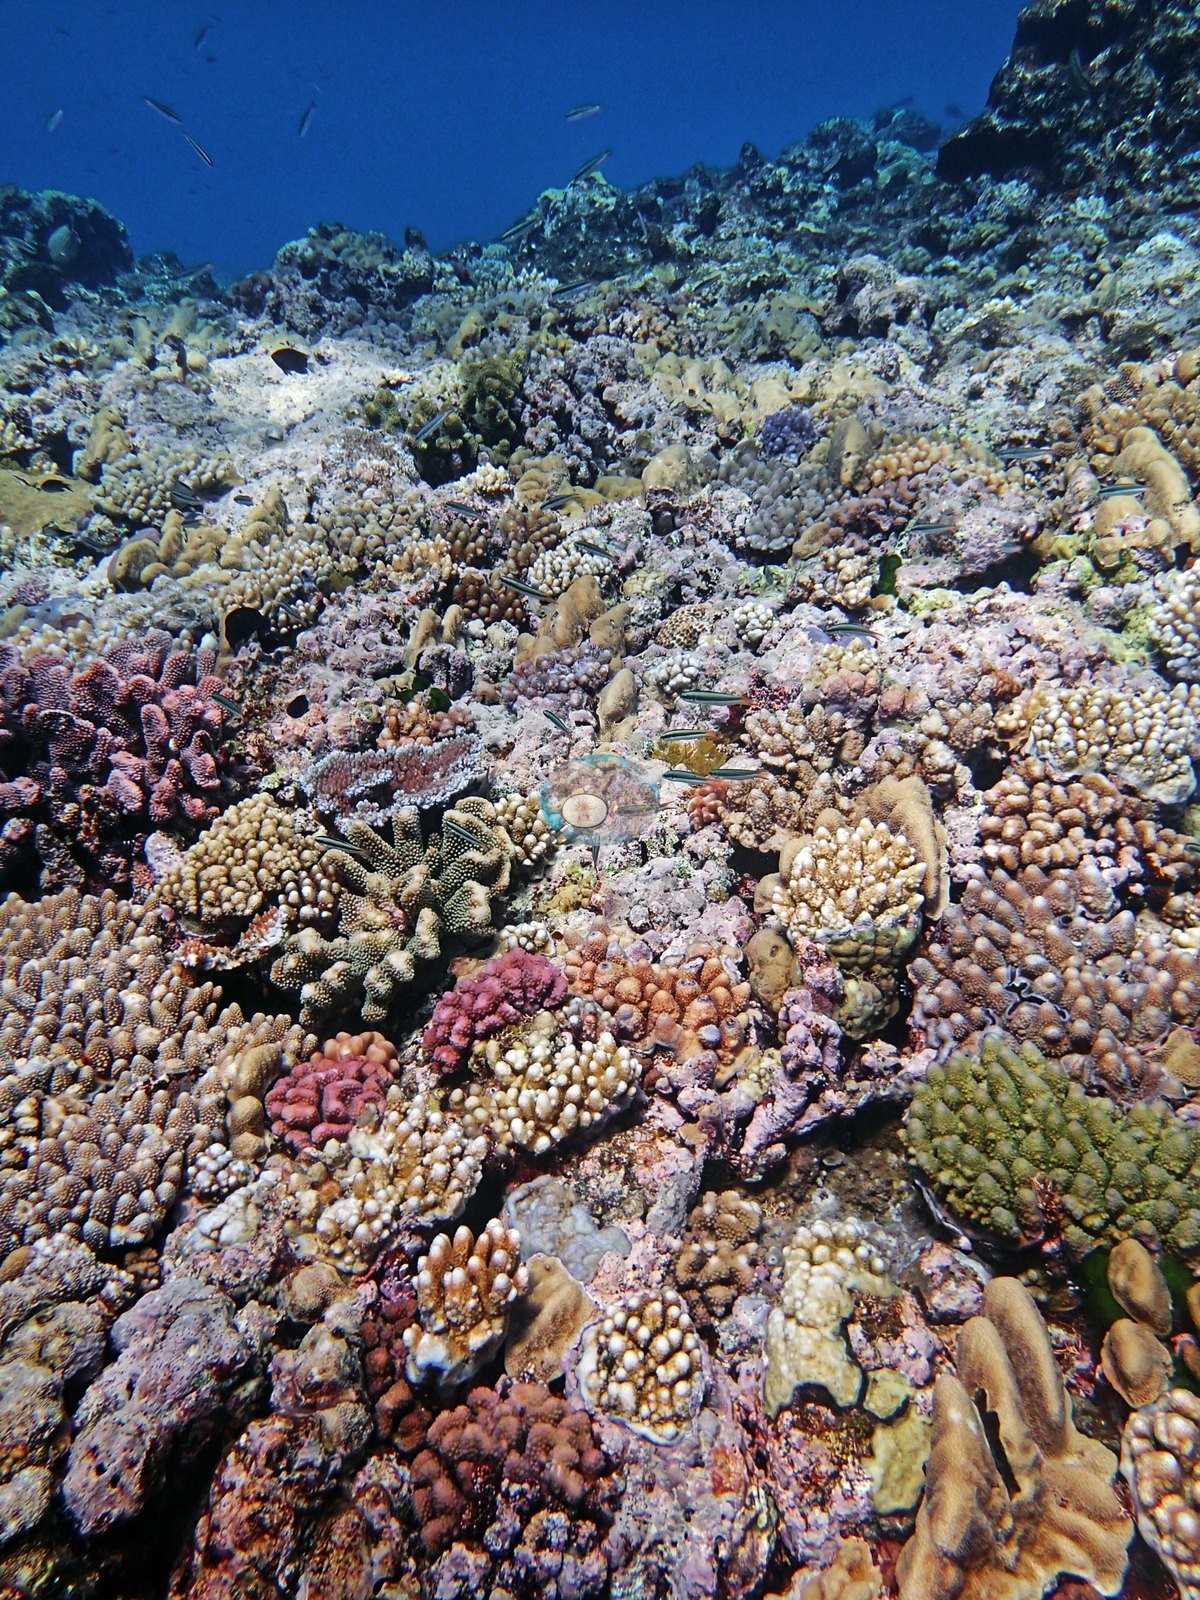
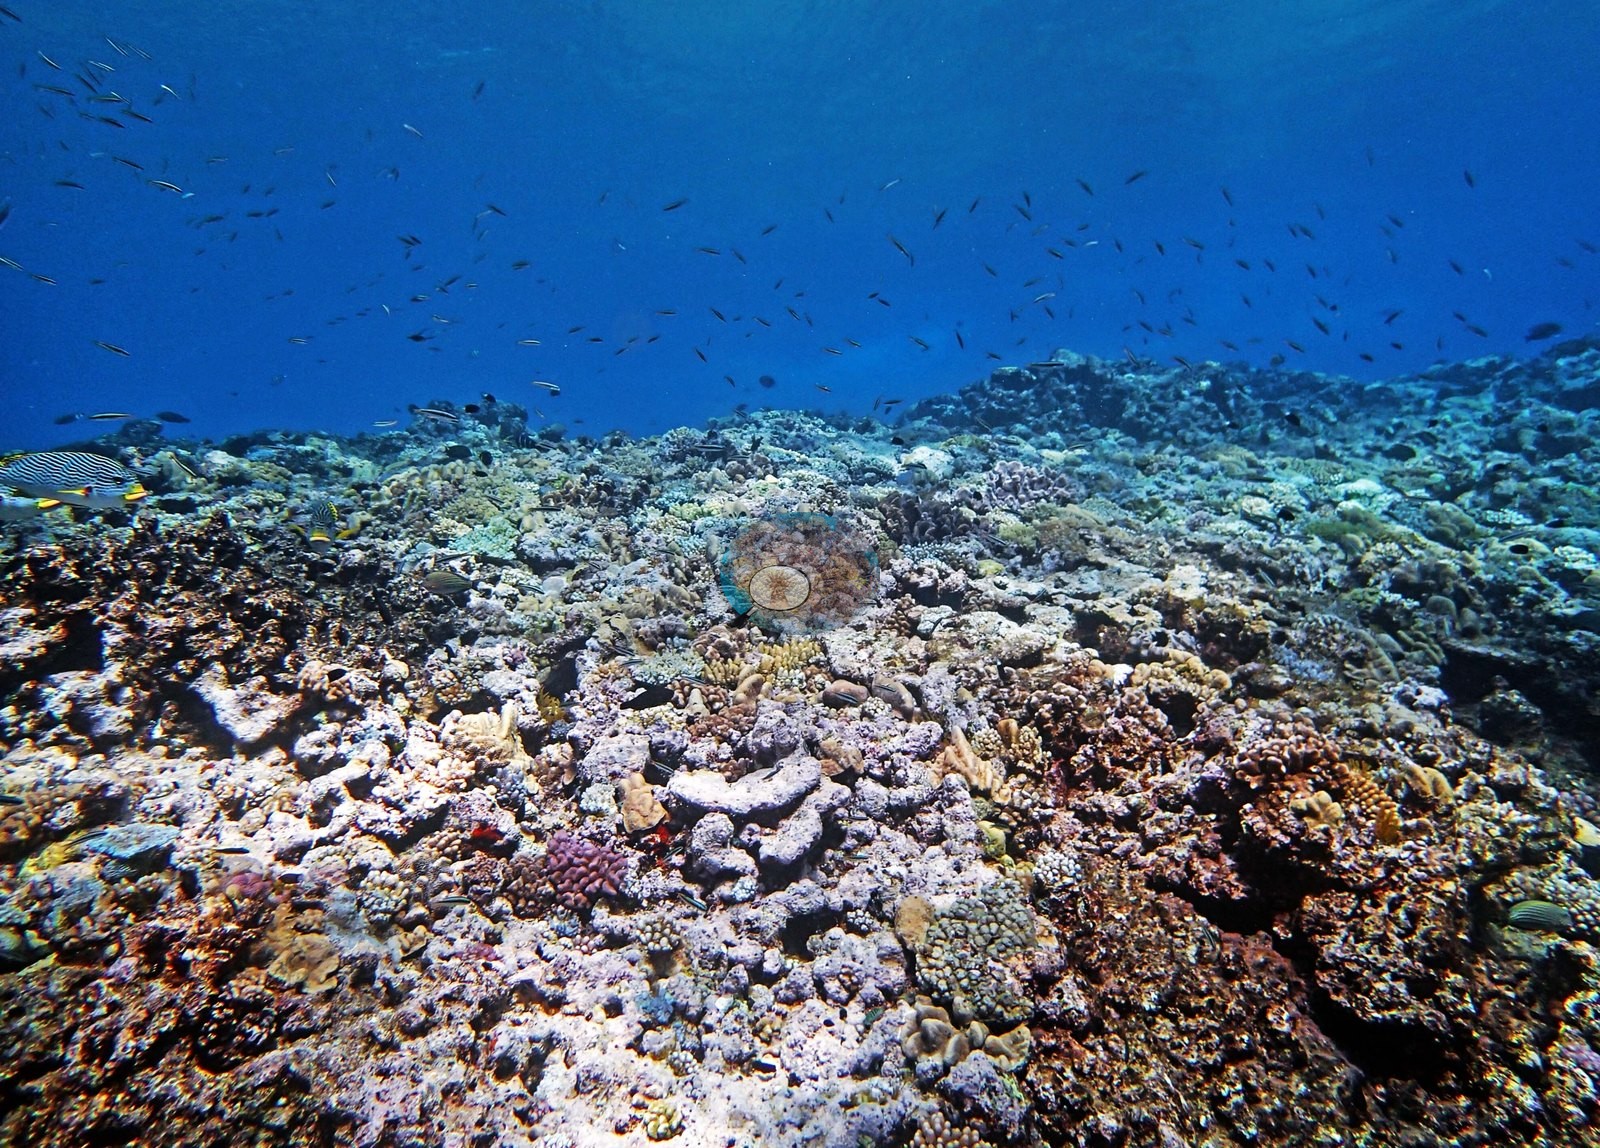
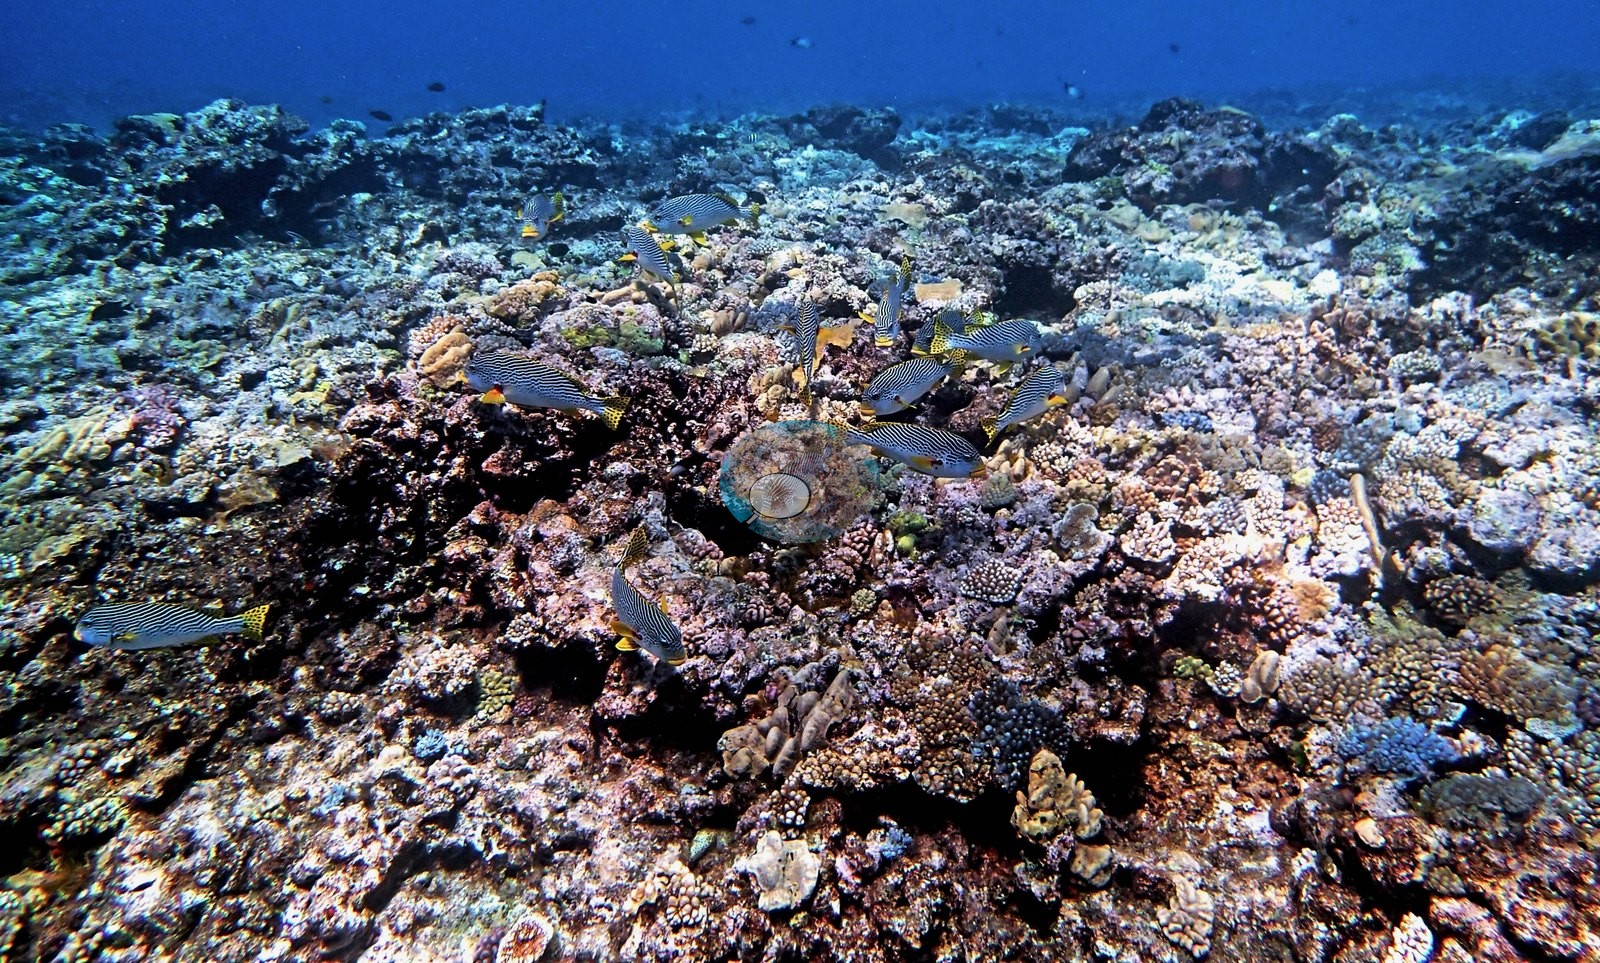
Image 27 is the densest single frame — a run of tan and orange knobby and digitate colonies with a deep maroon-pink colony at its center — and Image 8 and Image 17 the most instructive, showing how much of the surface between colonies is coralline crust and turf rather than living coral. There is no single dominant growth form: branching, digitate, corymbose, encrusting, and small massive colonies are all present in most frames, along with occasional broader plates (e.g., Image 8, Image 14, Image 19), and the tall finger-like colonies in Image 13 and Image 27 stand out against an otherwise low-relief surface.
On the upper slope, pink, lilac, and cream knobby colonies crowd shoulder to shoulder, with a small pink plate colony among them (e.g., Image 12), and one frame centers on a large tan colony of thick, flattened upright lobes surrounded by smaller branching and massive colonies (e.g., Image 18).
Montiporids and Stylophora held their own at mid-depths, and a patch of Sinularia and stinging hydroids carpeted parts of the reef.
Coral cover
- Reference: Khaled bin Sultan Living Oceans Foundation, Global Reef Expedition (in situ transect)
- The transect counts what lies under each survey point, coralline crust and turf included, not any judgment of the frames.
- Coral cover 24%, from LOF-GRE in situ diver point-count transects (Global Reef Expedition site data, 933 sites); it is not derived from these photographs.
- Algal cover 65% from the same transect.
- Transect mean 24 ± 6.4% SE (n = 4 transects; Living Oceans Foundation per-transect benthic data); the headline above is the expedition's station value.
Stressors
Condition, stated qualitatively: the great majority of coral in these frames is normally pigmented. A small number of individual colonies read pale or white — most visibly one plate-like colony (e.g., Image 4) — but a photograph cannot separate bleaching from recent tissue loss or predation, and no extent is estimated here. No crown-of-thorns seastars and no unambiguous disease lesions appear in the set. Anderson's notes record that needle coral (Seriatopora hystrix) on the 20.5 m transect looked bleached and unhealthy; the frames carry no depth, so they neither confirm nor contradict it.
Fish and other fauna
Fish are steady but not dense — schools of blue-and-yellow fusiliers (e.g., Image 2, Image 3), sweetlips and drummer along the crest (e.g., Image 21, Image 22, Image 25, Image 28, Image 31), damsels and small wrasse working the framework.
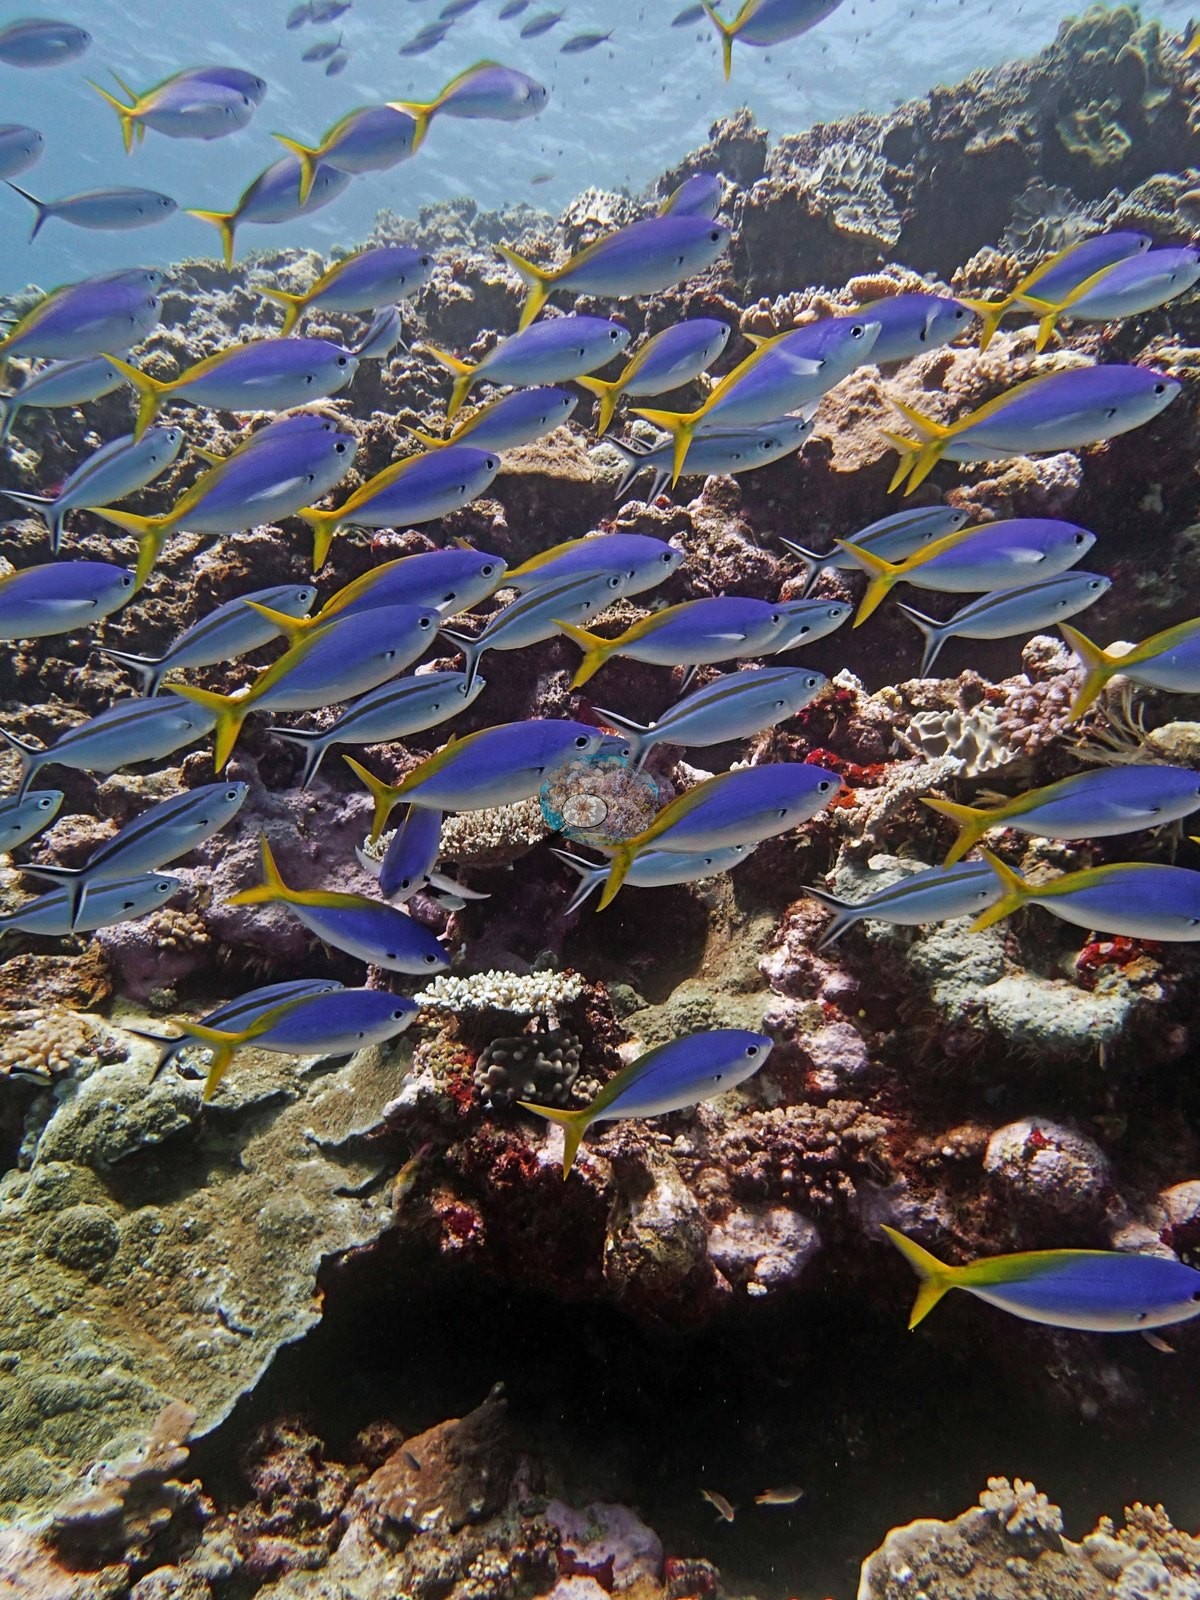
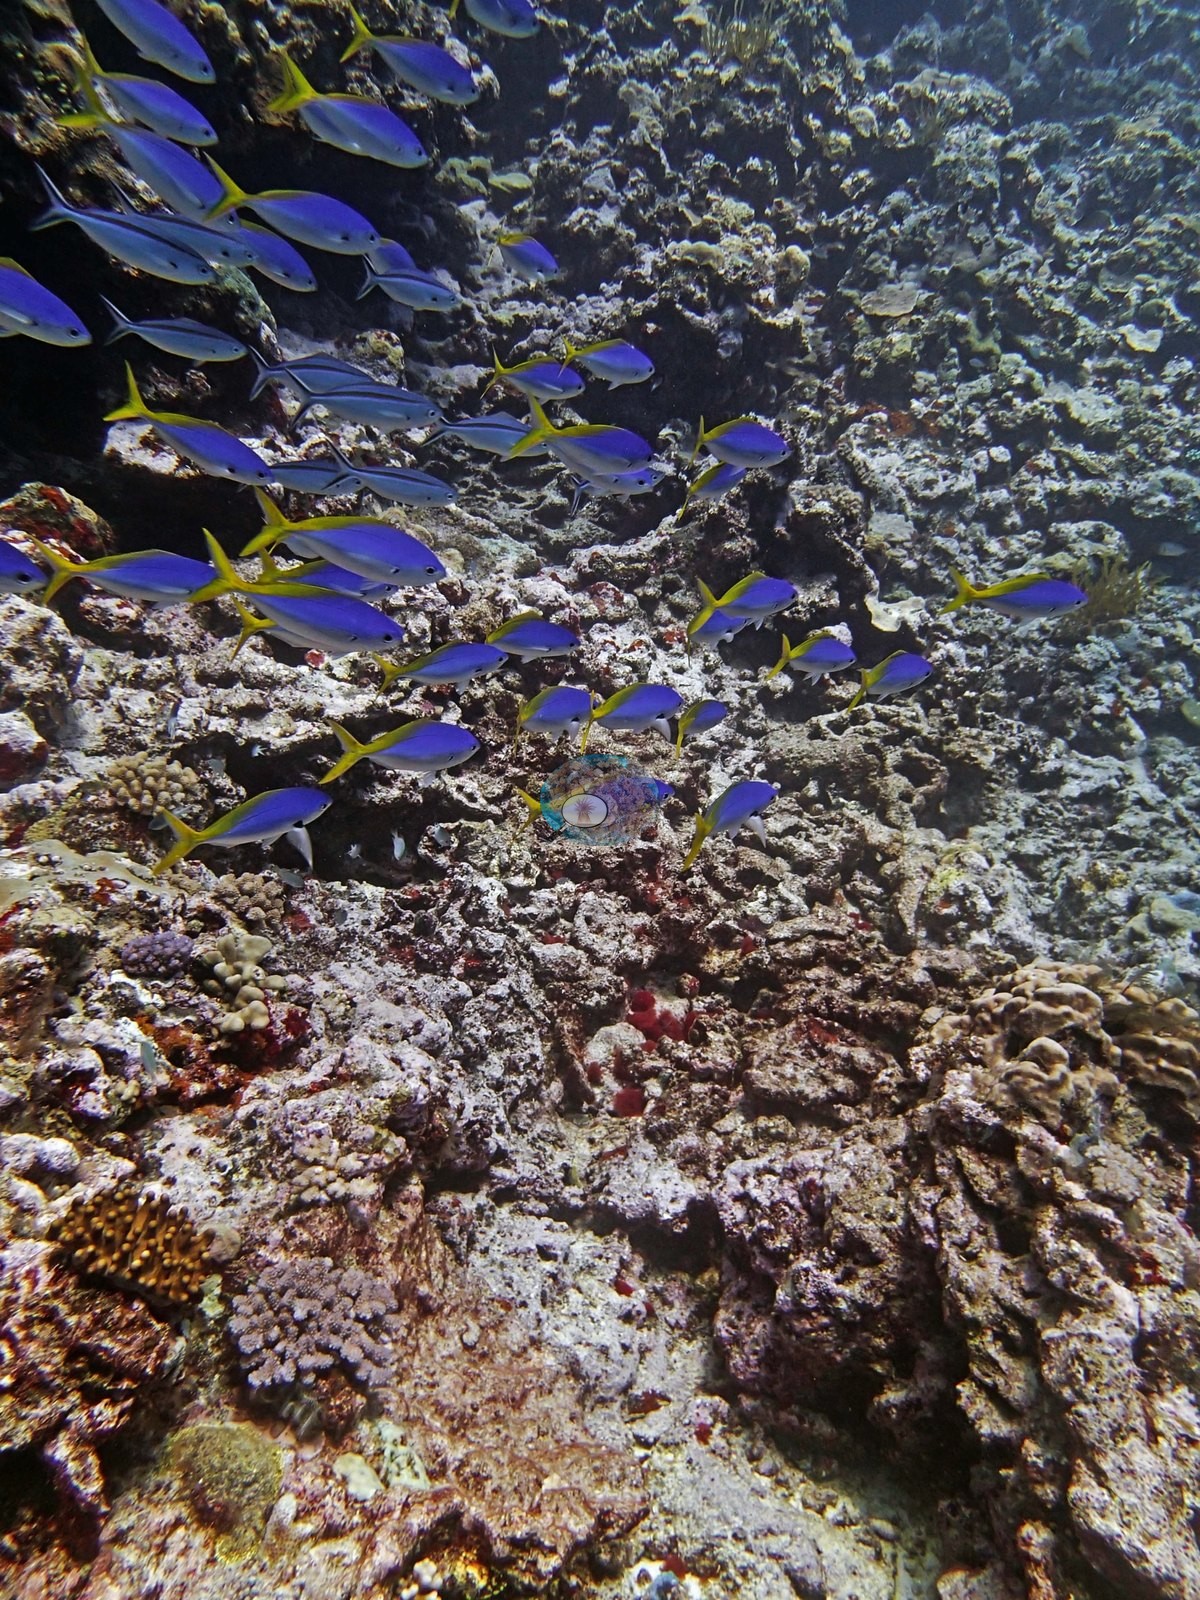
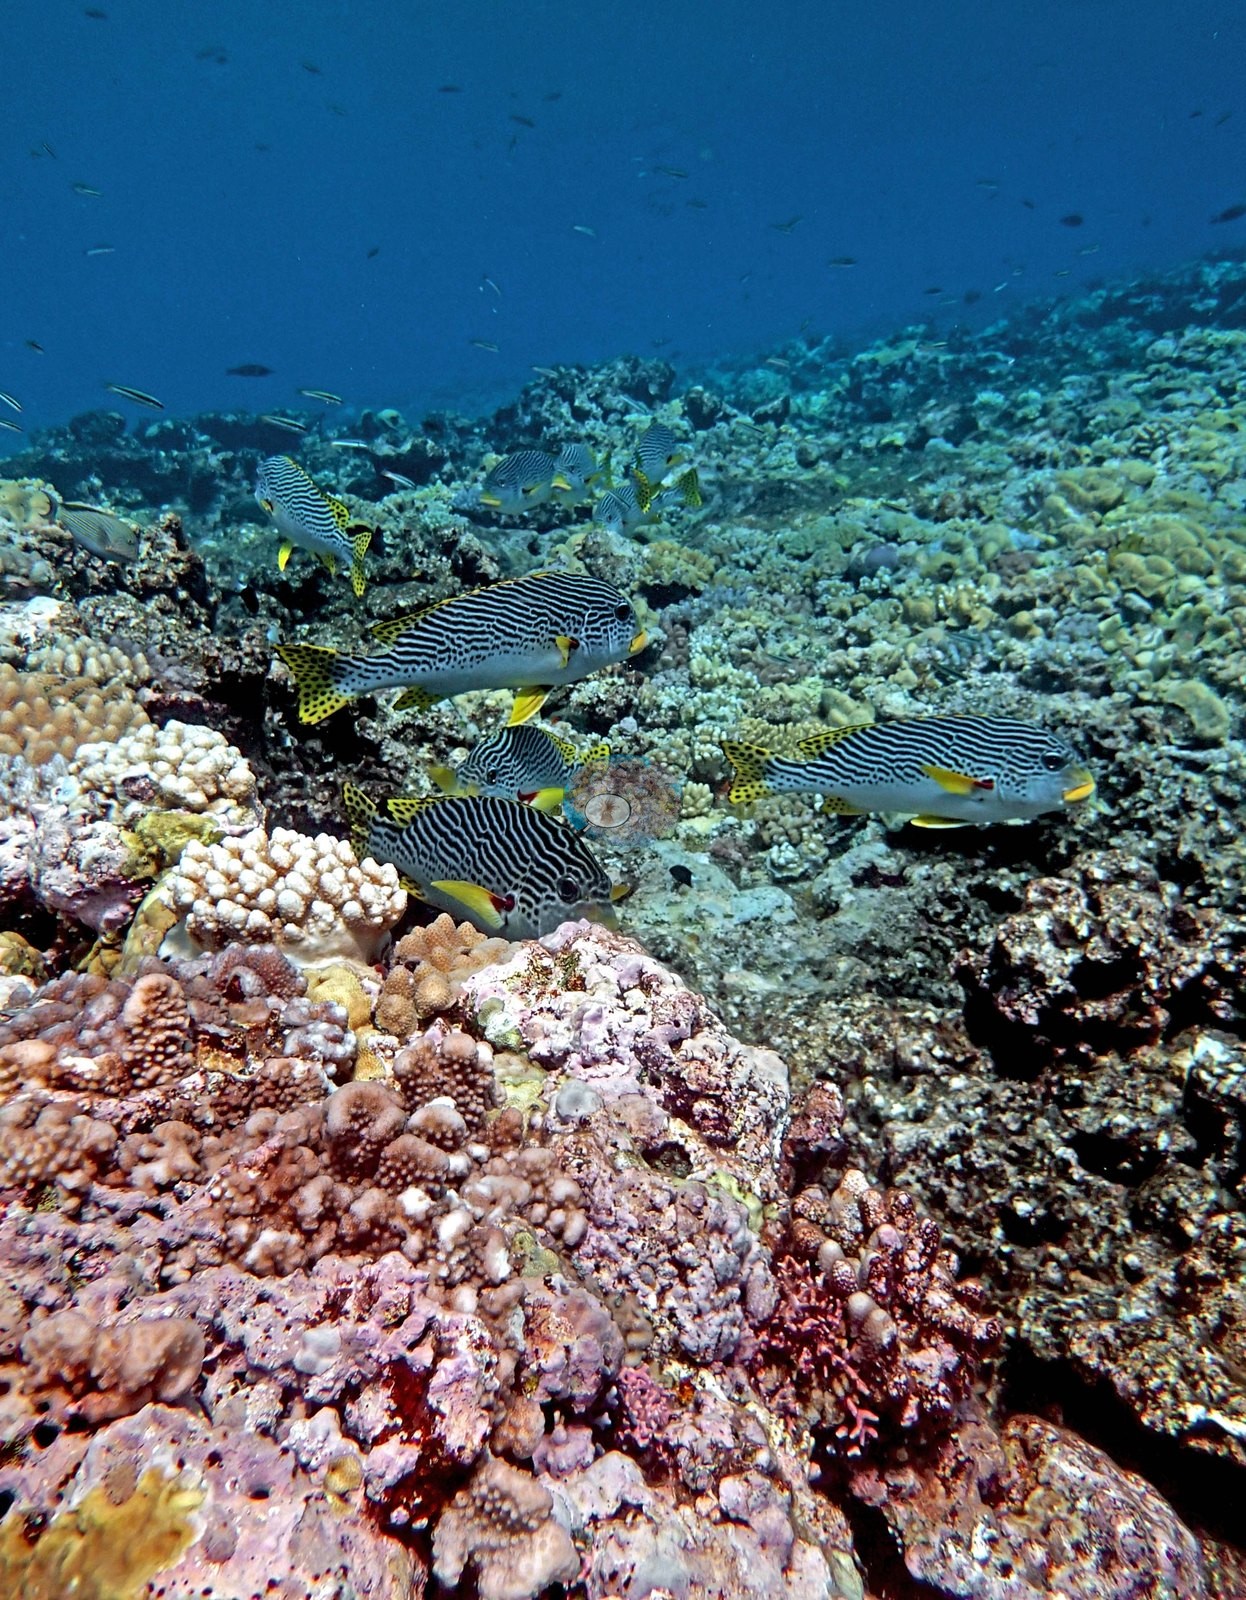
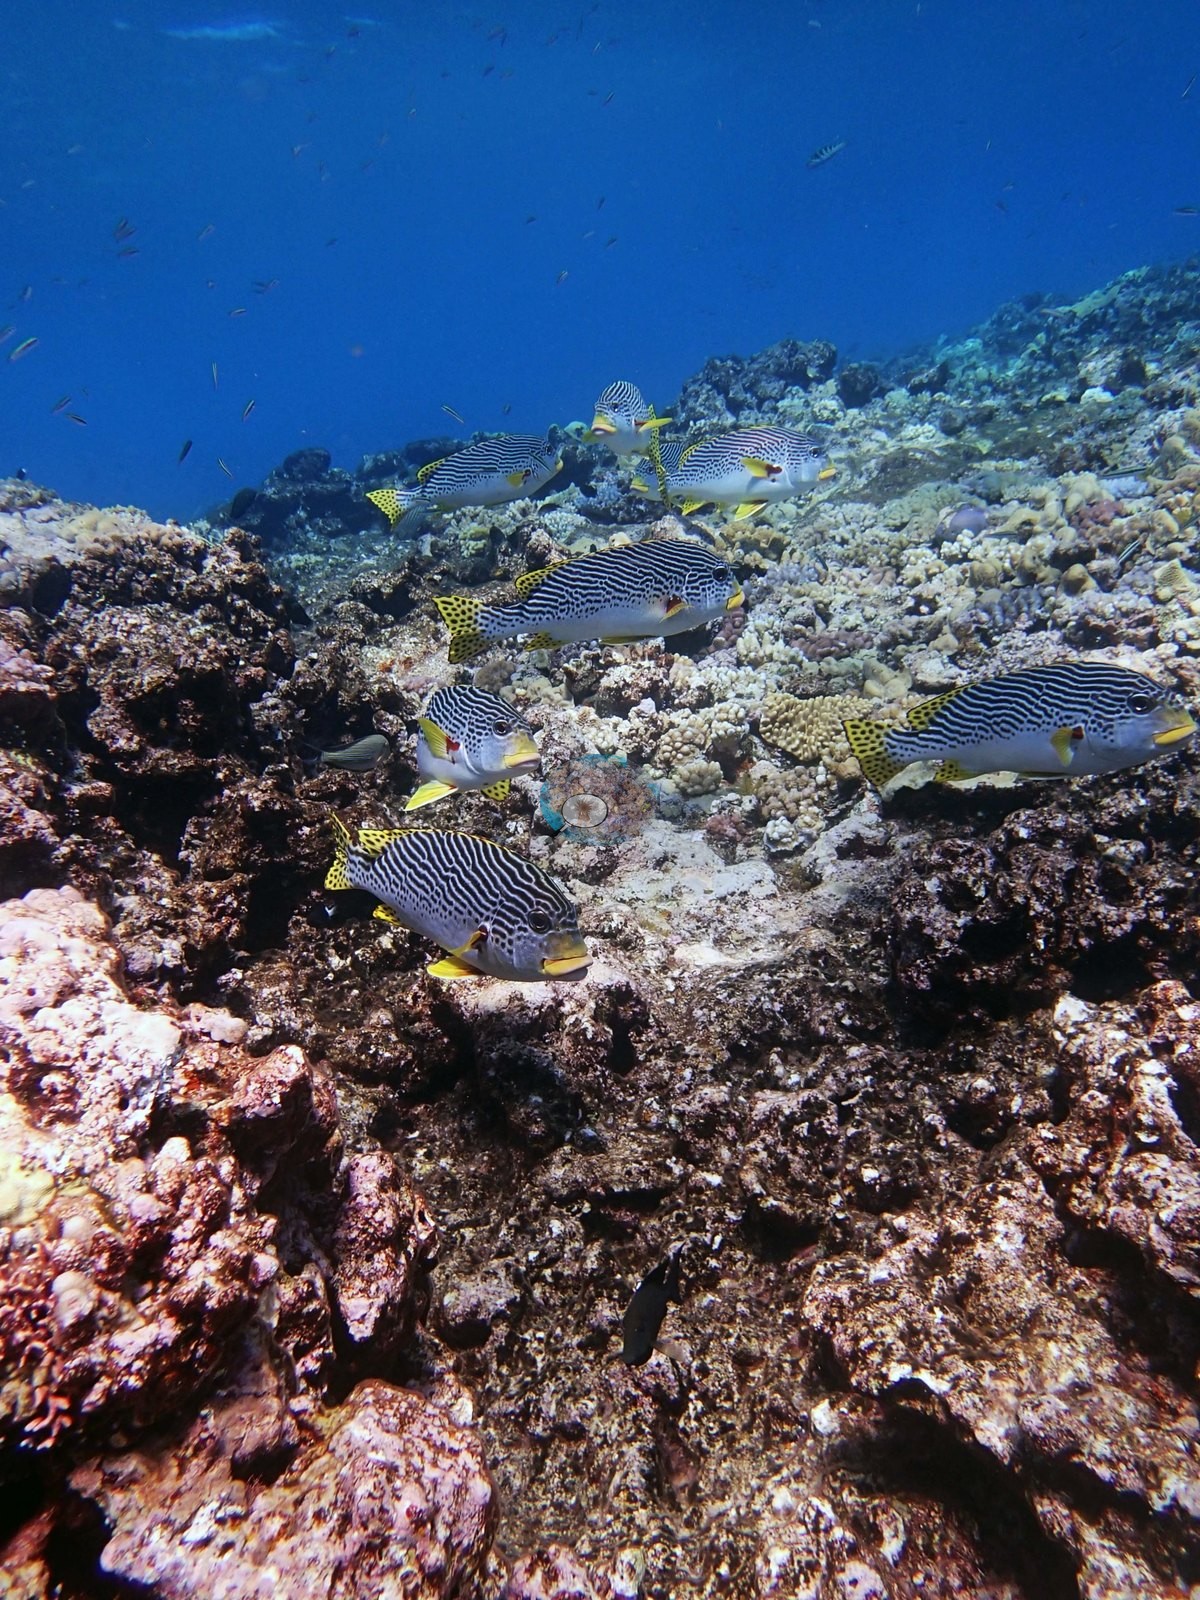
One frame is a striking exception: an empty chambered nautilus shell lying on the reef (e.g., Image 1).
Comparisons with other data
No other surveys have been conducted at this site to date. Within 5 km, ten independent stations recorded 3.9–66% hard coral cover between 1993 and 2023; the nearest, XL Catlin Seaview Survey at transect 12004, 0.65 km away, read 4.3–7.7% between 2014 and 2017.
Other notes
The survey itself is visible in three frames, which is useful and must not be read as reef structure: two show the PVC quadrat frame laid on the pavement (e.g., Image 11, Image 32), and one shows two divers working a transect line down the slope (e.g., Image 30).
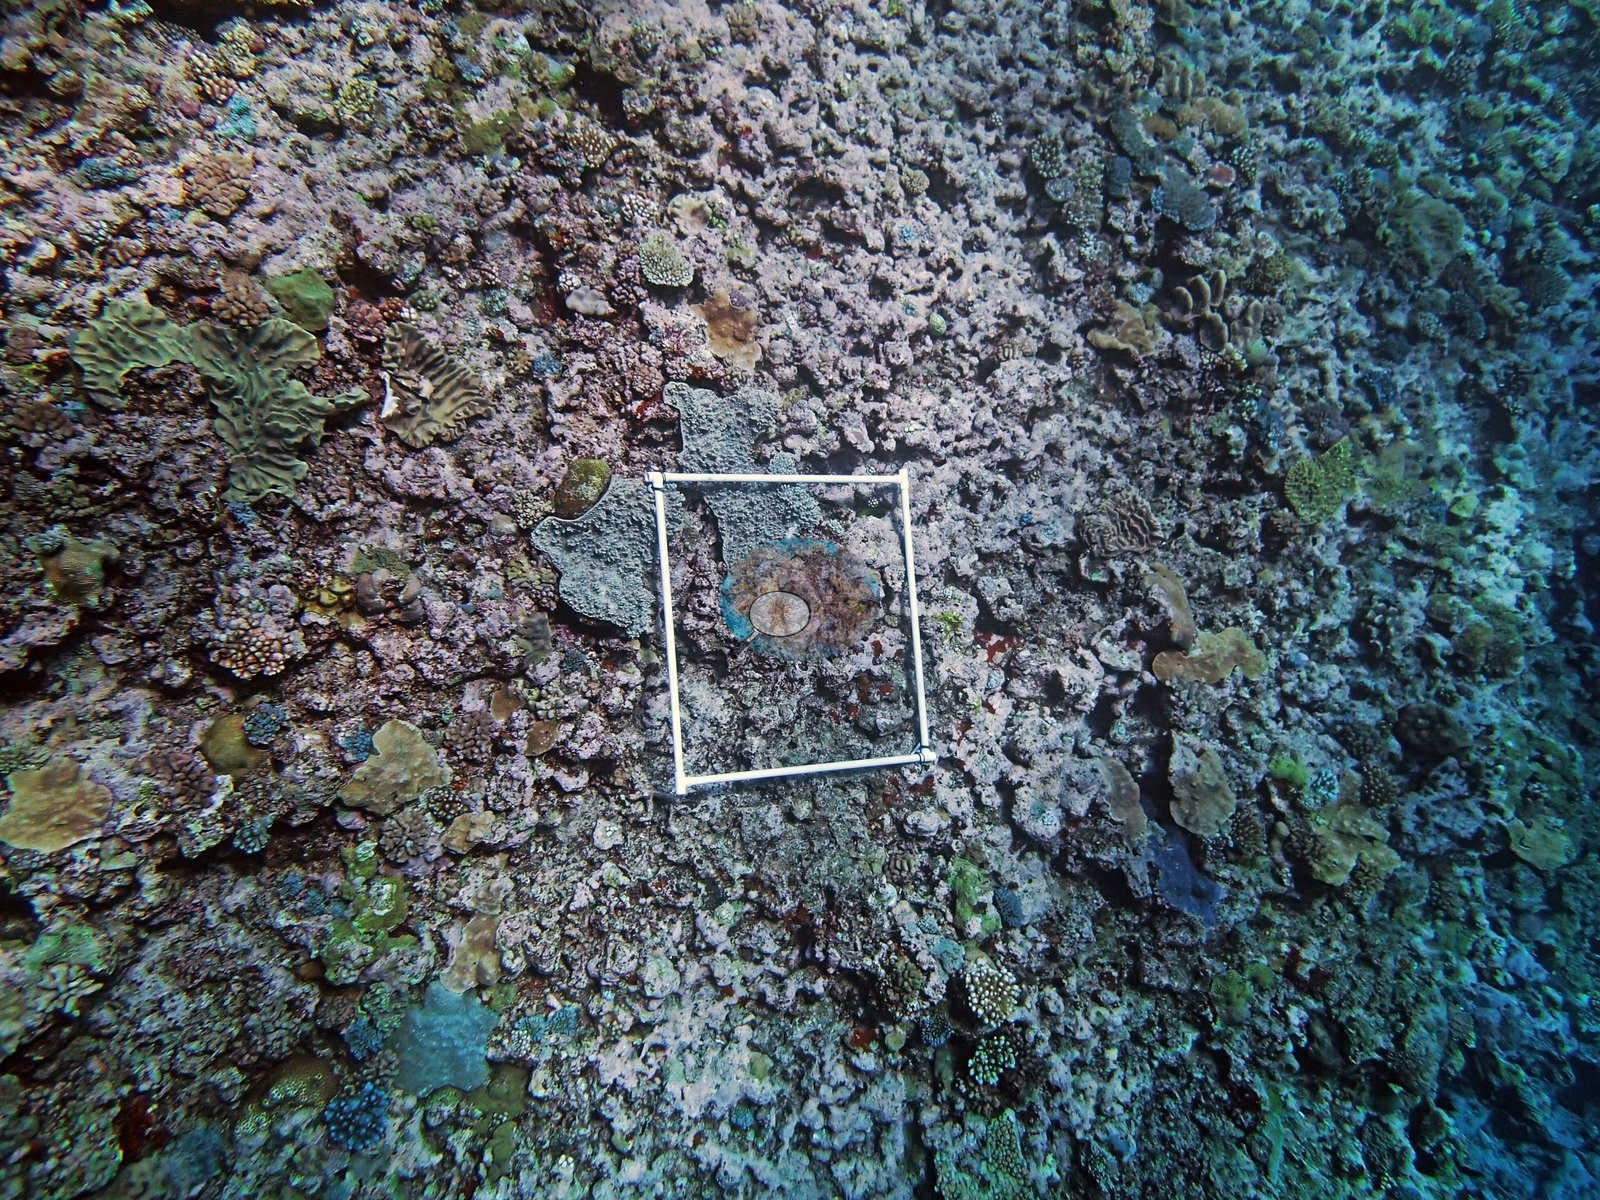
What the frames cannot settle: depth. Nothing in the set carries a readable gauge, so the shallow crest frames cannot be separated from the 9.5-21 m transect band by photograph alone, and the frames should not be treated as a picture of the surveyed depth specifically.
CV model comparison
More info
The photo row below is a methods comparison only: it is never averaged with the transect and never used as the headline. It compares site means only: the photos come from the same survey dive as the transect but not from the same points.| Method | Hard-coral cover (%) | Photos (n) ± SE |
|---|---|---|
| Transect (published) | 24.3 | |
| CoralSCOP edited | 24.2 | n = 29 · SE 2.5 |
| Claude (edited photos) | 25.5 | n = 29 · SE 2.6 |
The two computer-vision methods agree within 1.3 pp (24–26%) and read within 1.3 pp of the in-water transect (24%).
Independent surveys nearby
| Agency / program | Year(s) | Stations / distance | Link |
|---|---|---|---|
| AIMS LTMP | 1993–2022 | 4 stations, 3.07–4.49 km | Records ↓ |
| AIMS manta tow | 1993–2023 | 2 stations, 2.21–4.86 km | Records ↓ |
| Reef Check | 1998–2002 | 1 station, 4.99 km | Records ↓ |
| XL Catlin Seaview Survey | 2012–2017 | 3 stations, 0.65–4.14 km | Records ↓ |
 LOF Global Reef ExpeditionYear-average (illustrative only, programs differ)
Within 5 km, 10 independent survey stations recorded hard coral cover in 152 surveys between 1993 and 2023. Of the 10 stations surveyed in more than one year, 7 were scored by divers or by people annotating photographs: 1 declined (by 3.8 points) and 6 increased (by 4.9–21.2 points) between their first and latest surveys. The other 3 were scored by automated image analysis: 1 declined by more than 7 points; 2 changed by 7 points or less, inside the 7-point method-noise floor (inconclusive). The longest record, YONGE REEF (AIMS manta tow, 2.21 km away), went from 14% in 1993 to 35% in 2023. Since 2021, station-year means average 29% (range 19–35%; n = 14 station-years from 14 surveys). This site's own estimate (24%) sits 16.6 points above the range of these surveys up to 2 km away (4.3–7.7%); the methods differ, so the comparison is context, not a like-for-like test.
Collected by other programs using different methods (Reef Check uses point-intercept transects; AIMS manta tow is a towed visual estimate in categorical bins; AIMS LTMP uses fixed photo-transects; the XL Catlin Seaview Survey uses photo-transects with automated image annotation), so these are context for the figures above, not a like-for-like comparison. Where a station was surveyed more than once, the cell shows either the range of its values or, as a single value, the mean of surveys made in one year. Station names are not dive-site names.
| Agency | Site / location | Date | Hard coral cover (%) | Distance | Link |
|---|---|---|---|---|---|
| AIMS manta tow | YONGE REEF | 1993–2023 | 5.5–35% (25 surveys) | 2.21 km | doi:10.25845/5c09b0abf315a |
| AIMS LTMP | NO NAME REEF site 1 | 1993–2022 | 8.2–66% (22 surveys) | 3.07 km | doi:10.25845/5c09bc4ff315c |
| AIMS LTMP | NO NAME REEF site 2 | 1993–2022 | 13–56% (21 surveys) | 3.55 km | doi:10.25845/5c09bc4ff315c |
| AIMS LTMP | NO NAME REEF site 3 | 1993–2022 | 9.2–57% (22 surveys) | 3.96 km | doi:10.25845/5c09bc4ff315c |
| AIMS LTMP | YONGE REEF site 3 | 1993–2022 | 3.9–55% (range of yearly means; 23 surveys) | 4.49 km | doi:10.25845/5c09bc4ff315c |
| AIMS manta tow | NO NAME REEF | 1994–2023 | 4.3–40% (26 surveys) | 4.86 km | doi:10.25845/5c09b0abf315a |
| Reef Check | Ribbon Reef 10 - No Name Reef (Back reef slope) Site 1 | 1998–2002 | 43–60% (range of yearly means; 4 surveys) | 4.99 km | — |
| XL Catlin Seaview Survey | transect 12028 | 2012–2017 | 8.6–24% (4 surveys) | 3.54 km | doi:10.14264/uql.2019.930 |
| XL Catlin Seaview Survey | transect 12004 | 2014–2017 | 4.3–7.7% (3 surveys) | 0.65 km | doi:10.14264/uql.2019.930 |
| XL Catlin Seaview Survey | transect 12005 | 2014–2016 | 6.4–8.7% (2 surveys) | 4.14 km | doi:10.14264/uql.2019.930 |
Data & links
- Download benthic survey data (CSV) ↗
- Download all LOF-GRE data (933 sites) ↗
- Photo portfolio ↗
- Coral Reef Diagnostics country page ↗
All images from Coral Reef Diagnostics. Data are from the Khaled bin Sultan Living Oceans Foundation Global Reef Expedition, Coral Reef Diagnostics, and the organizations named in the data sources above.
 © Coral Reef Diagnostics.