
Part of the regional summaries: Australia (GBR) - Far North: Blue stations (Habitat Protection Zone reefs) and Australia (GBR)
More info
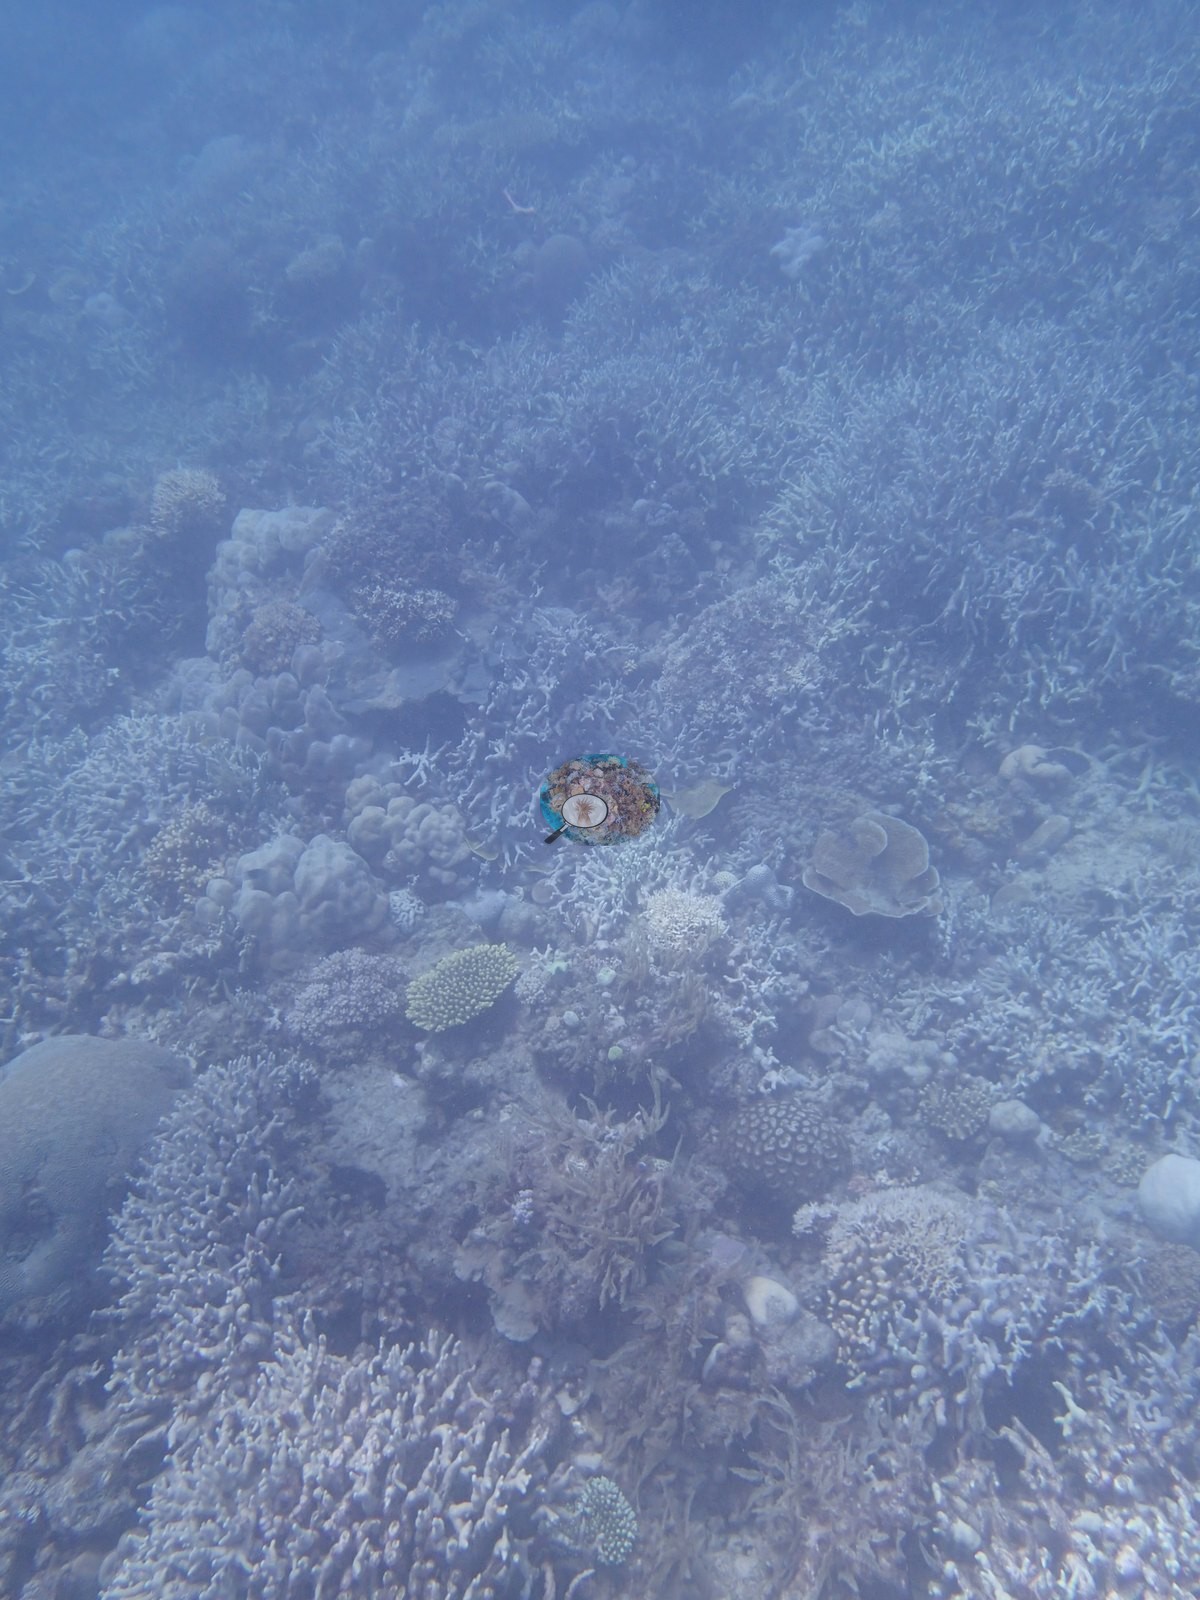
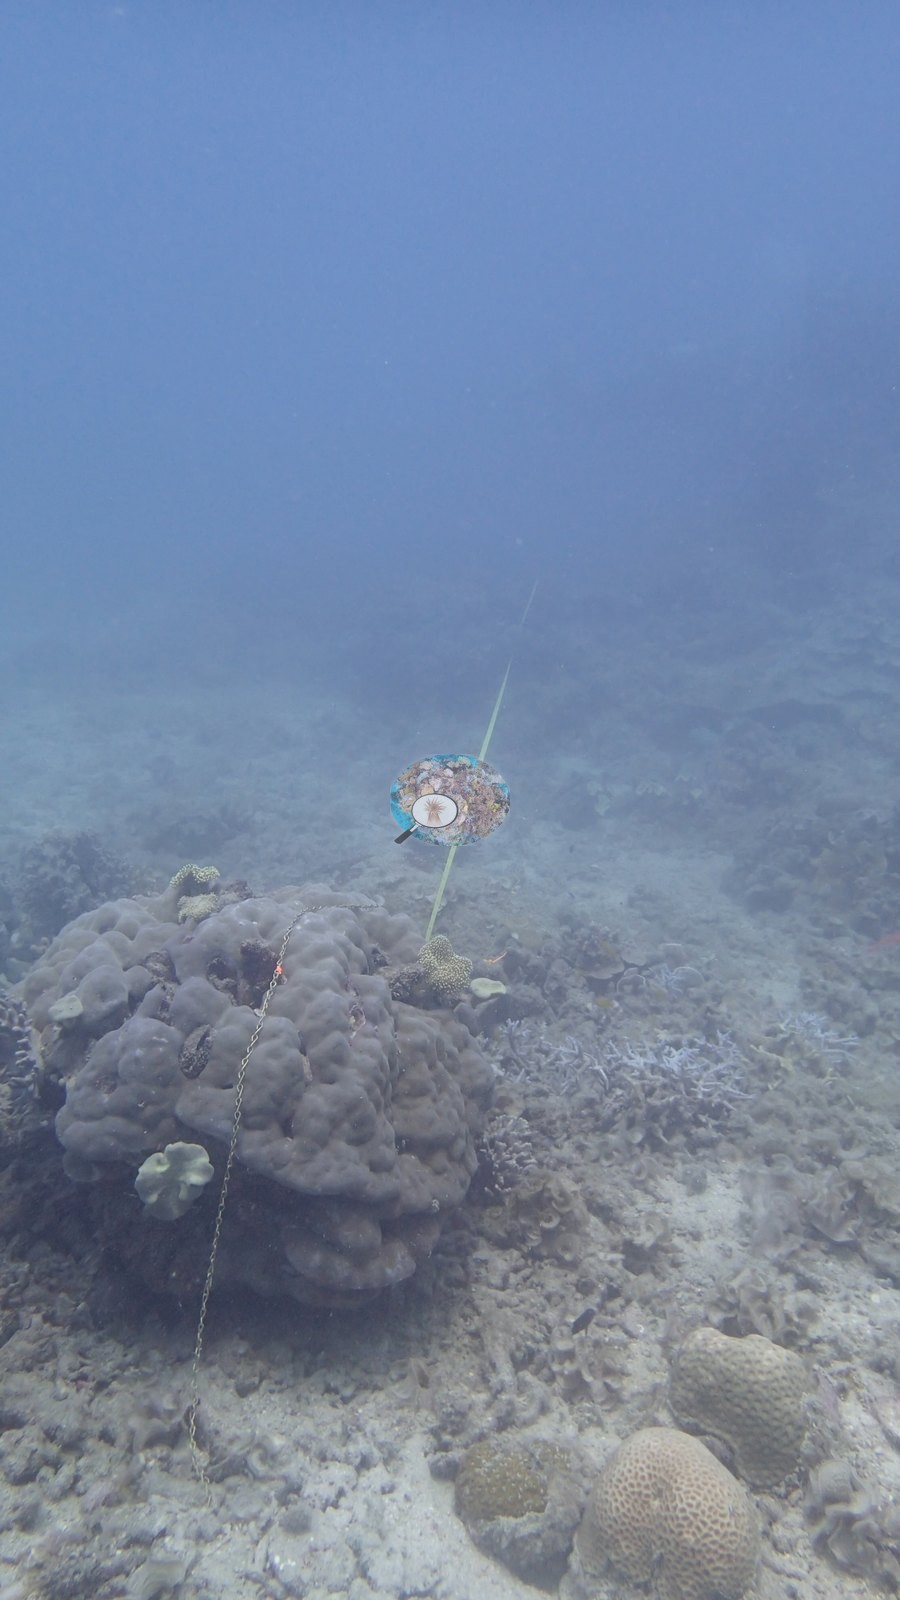
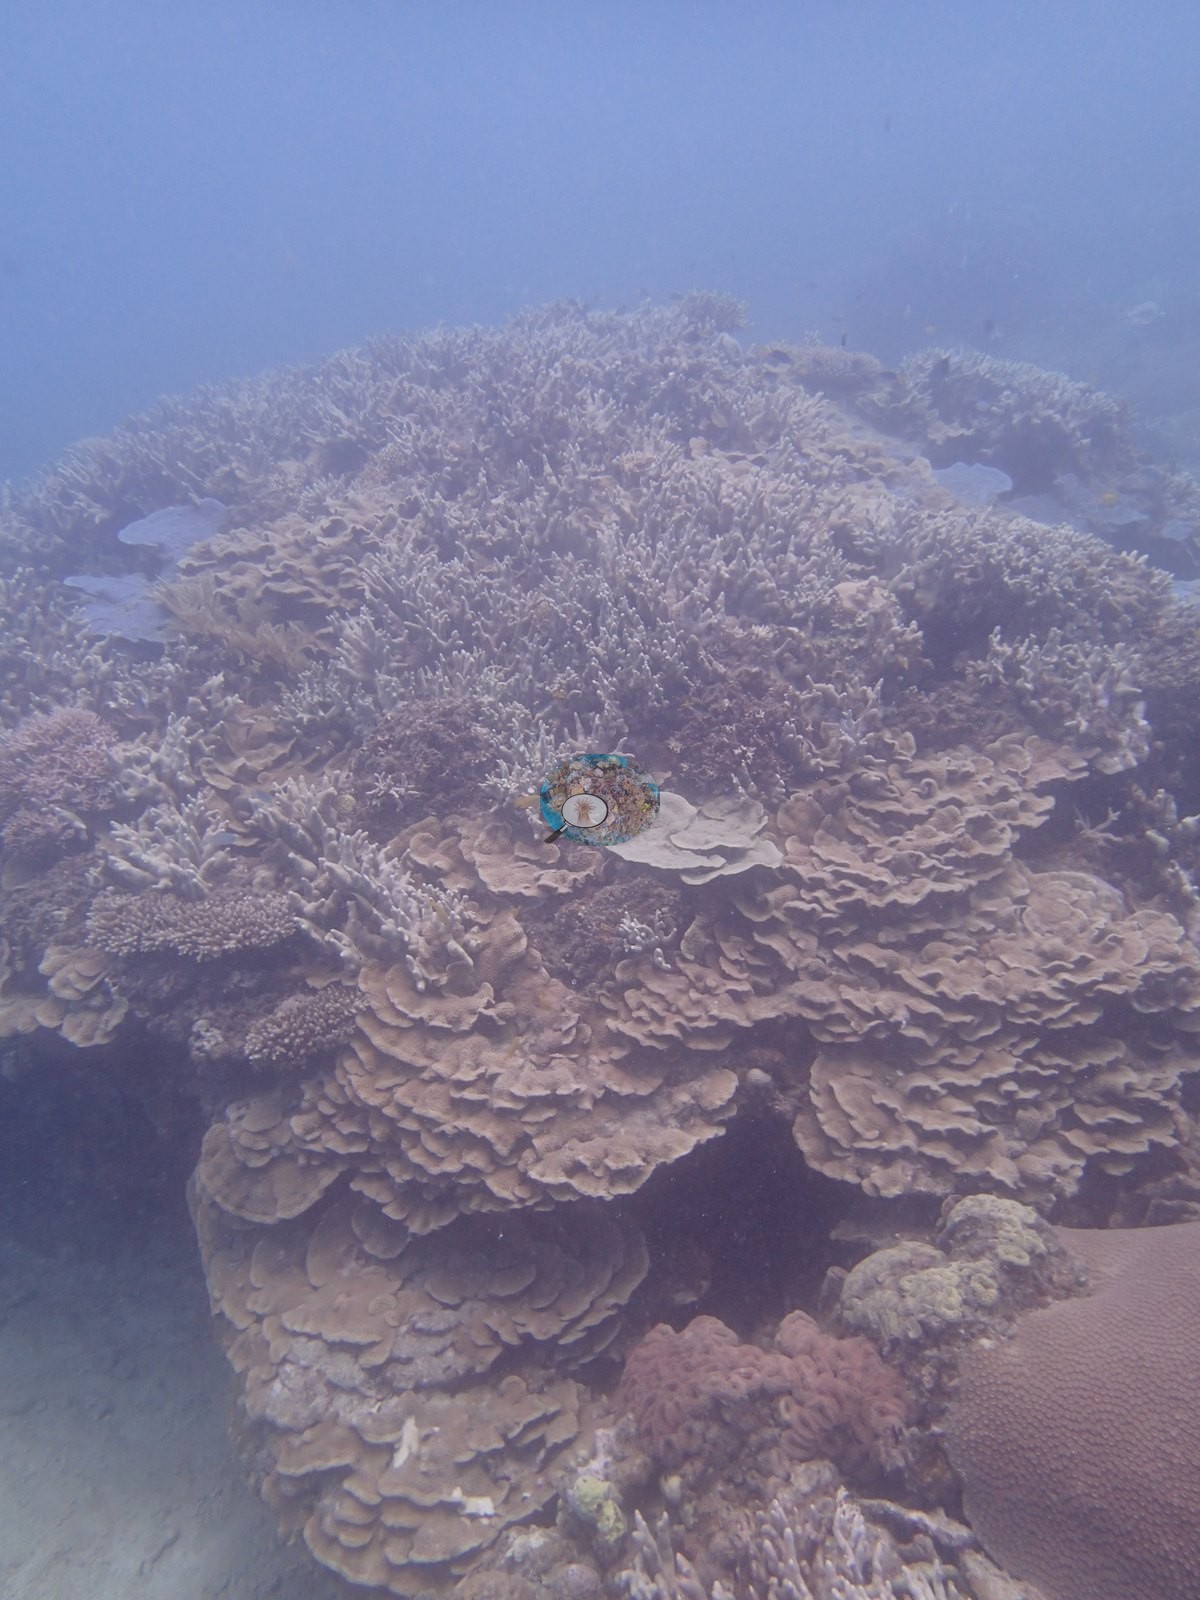
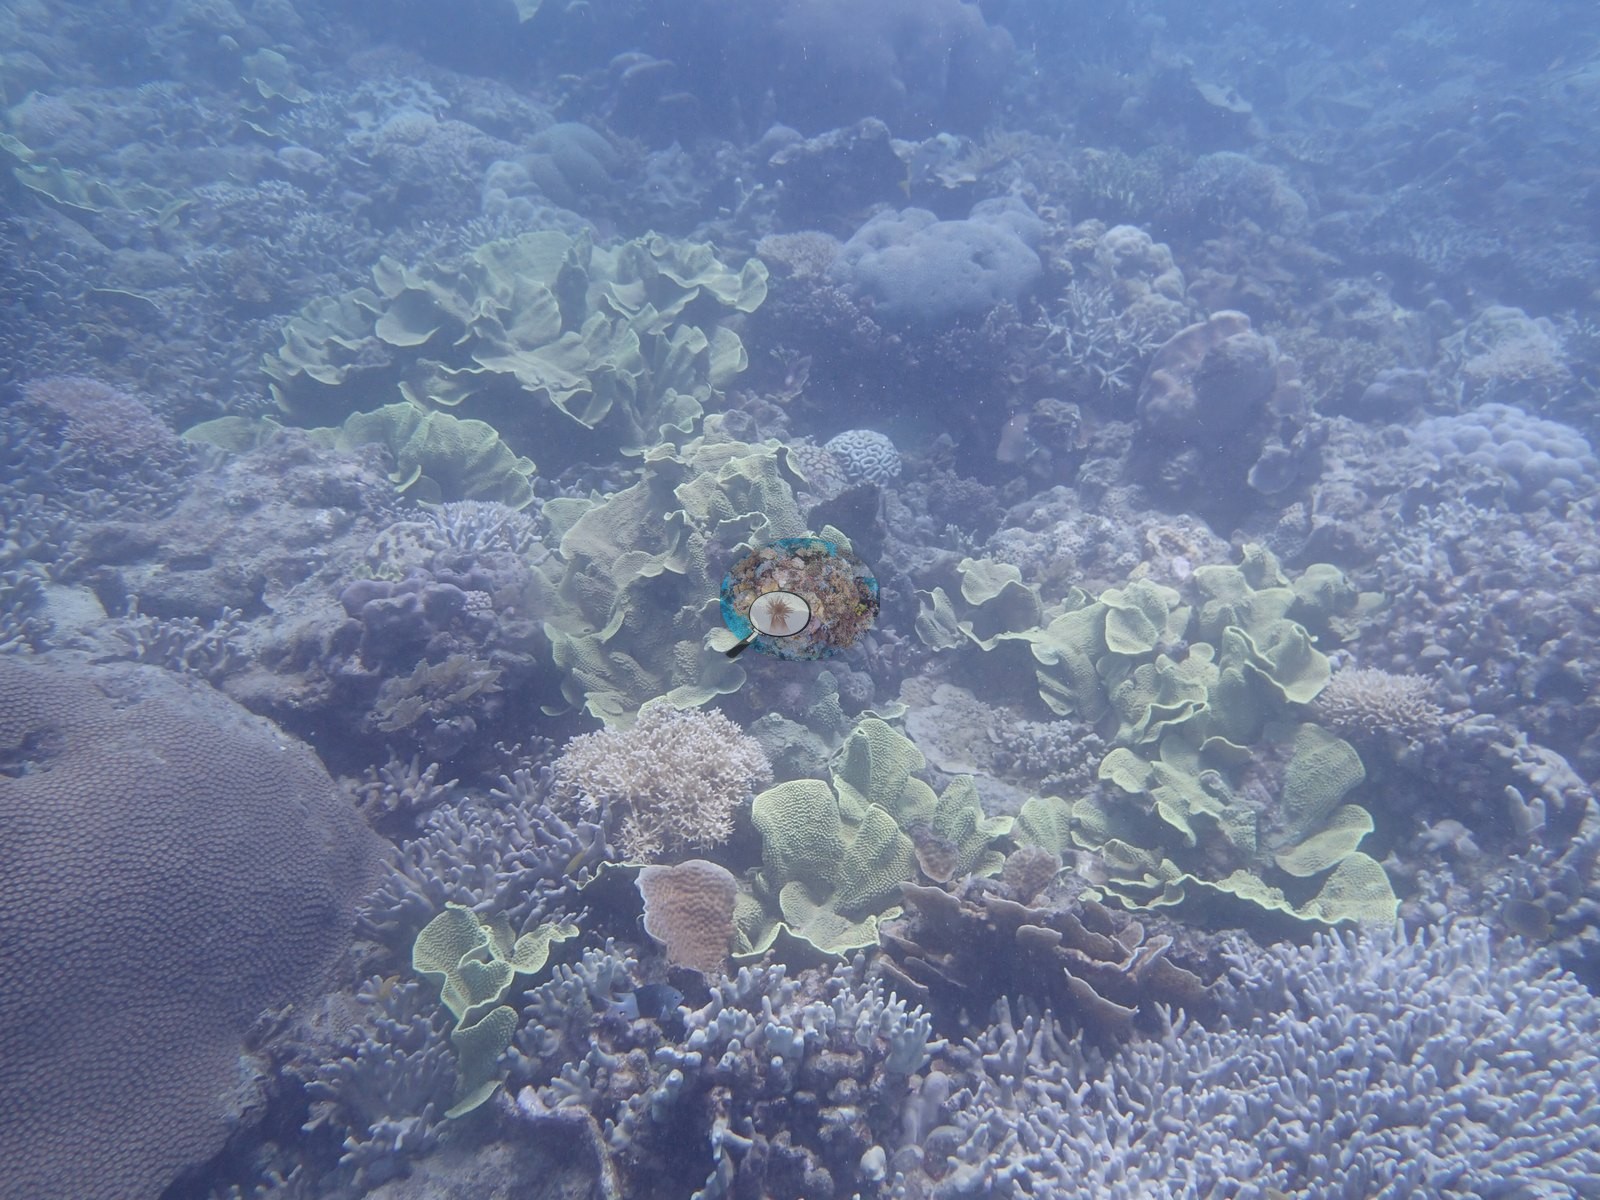
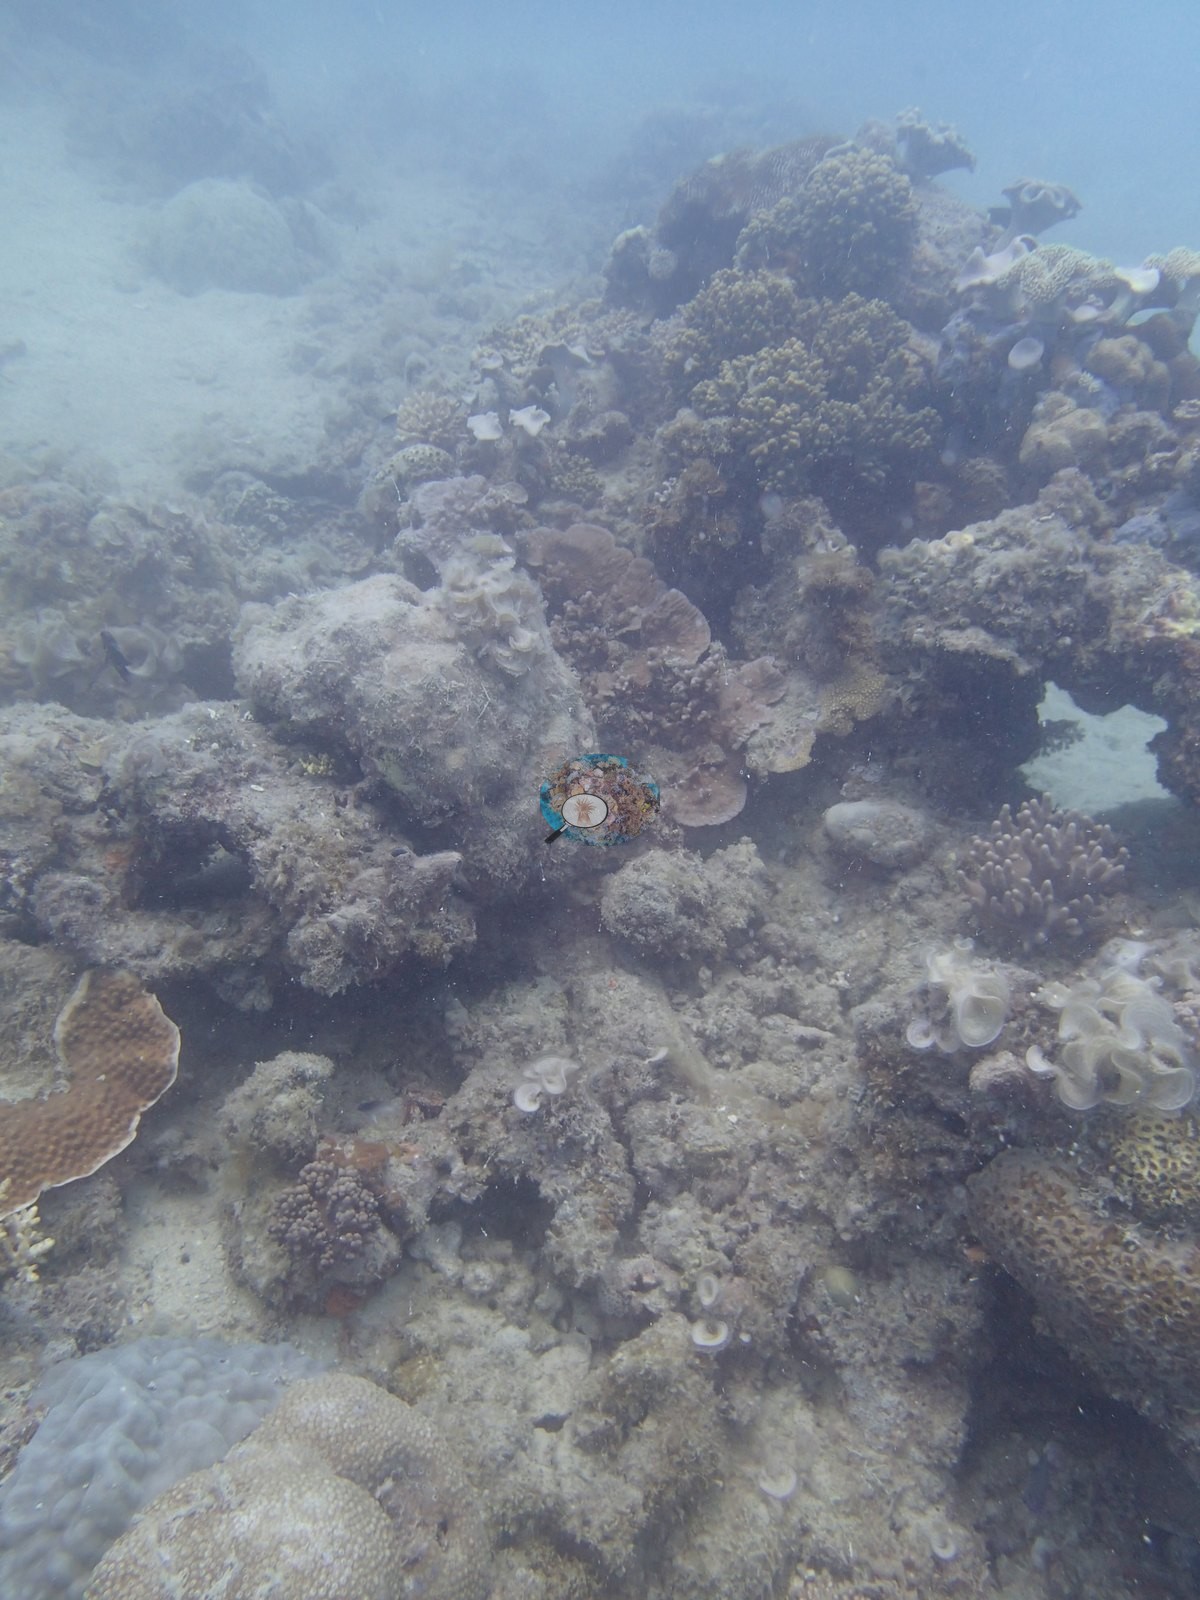
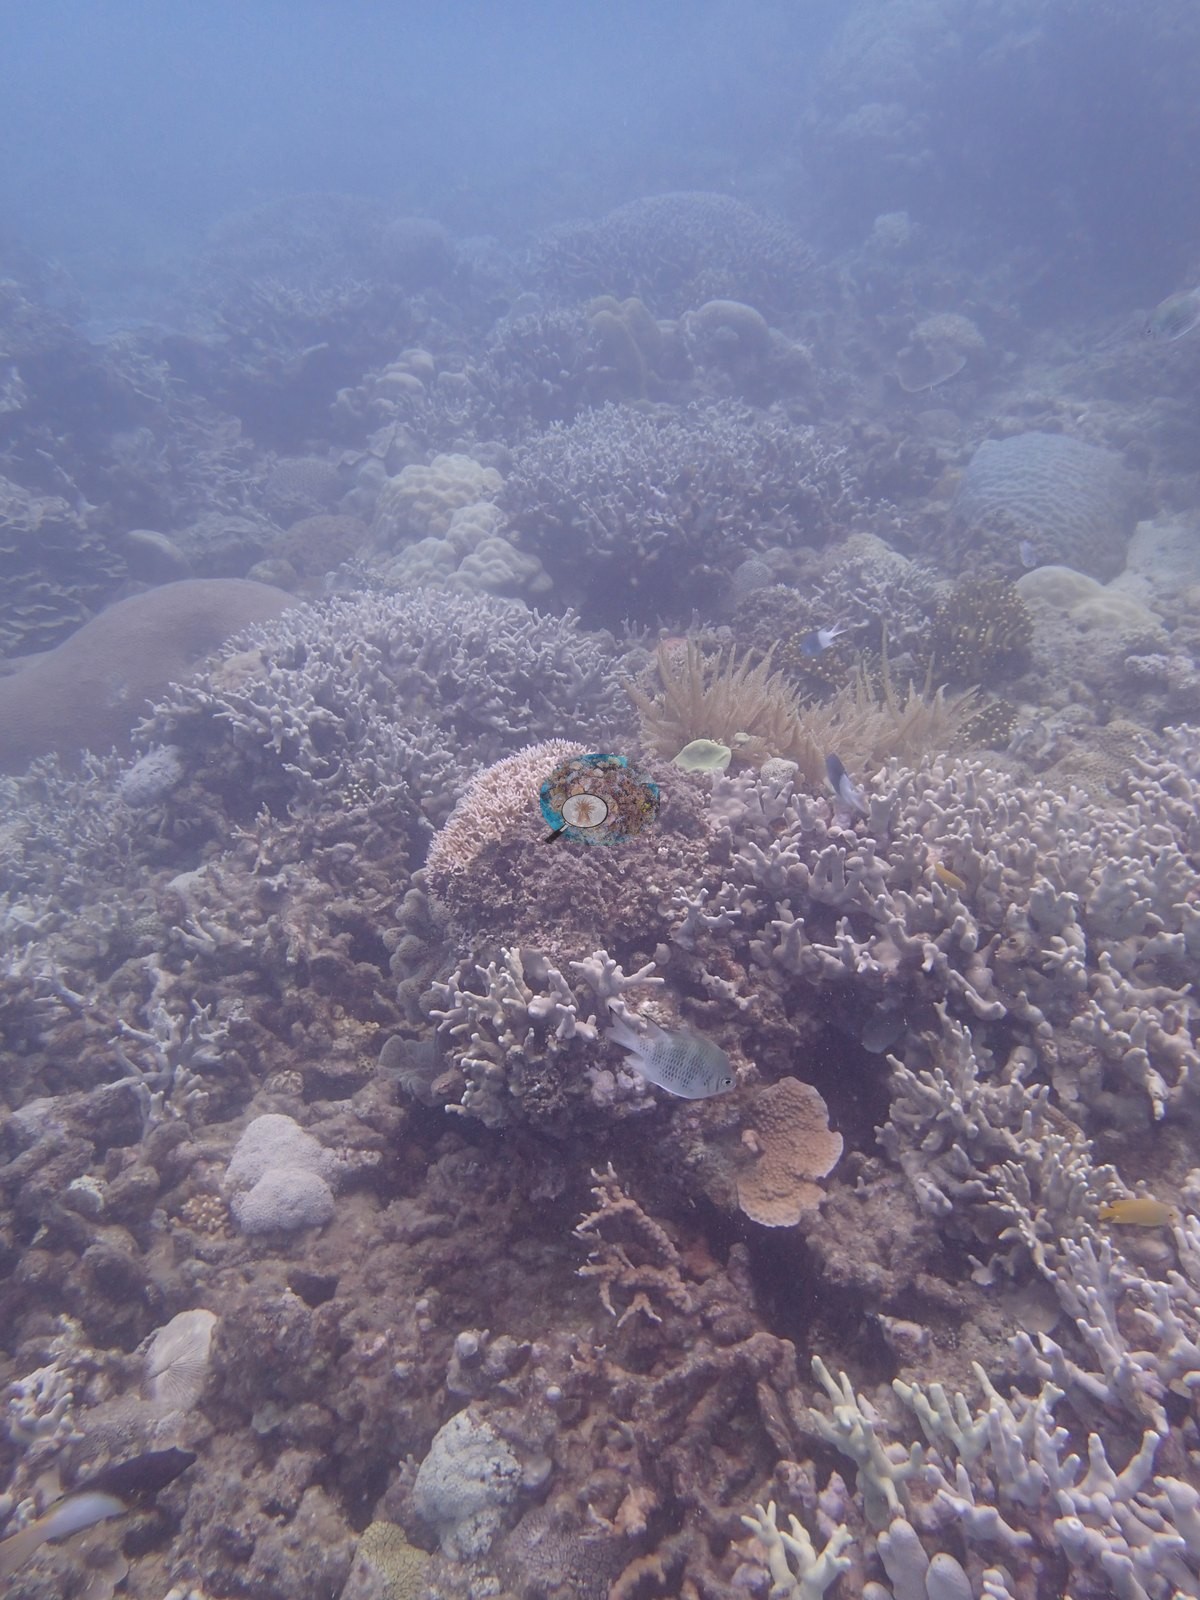
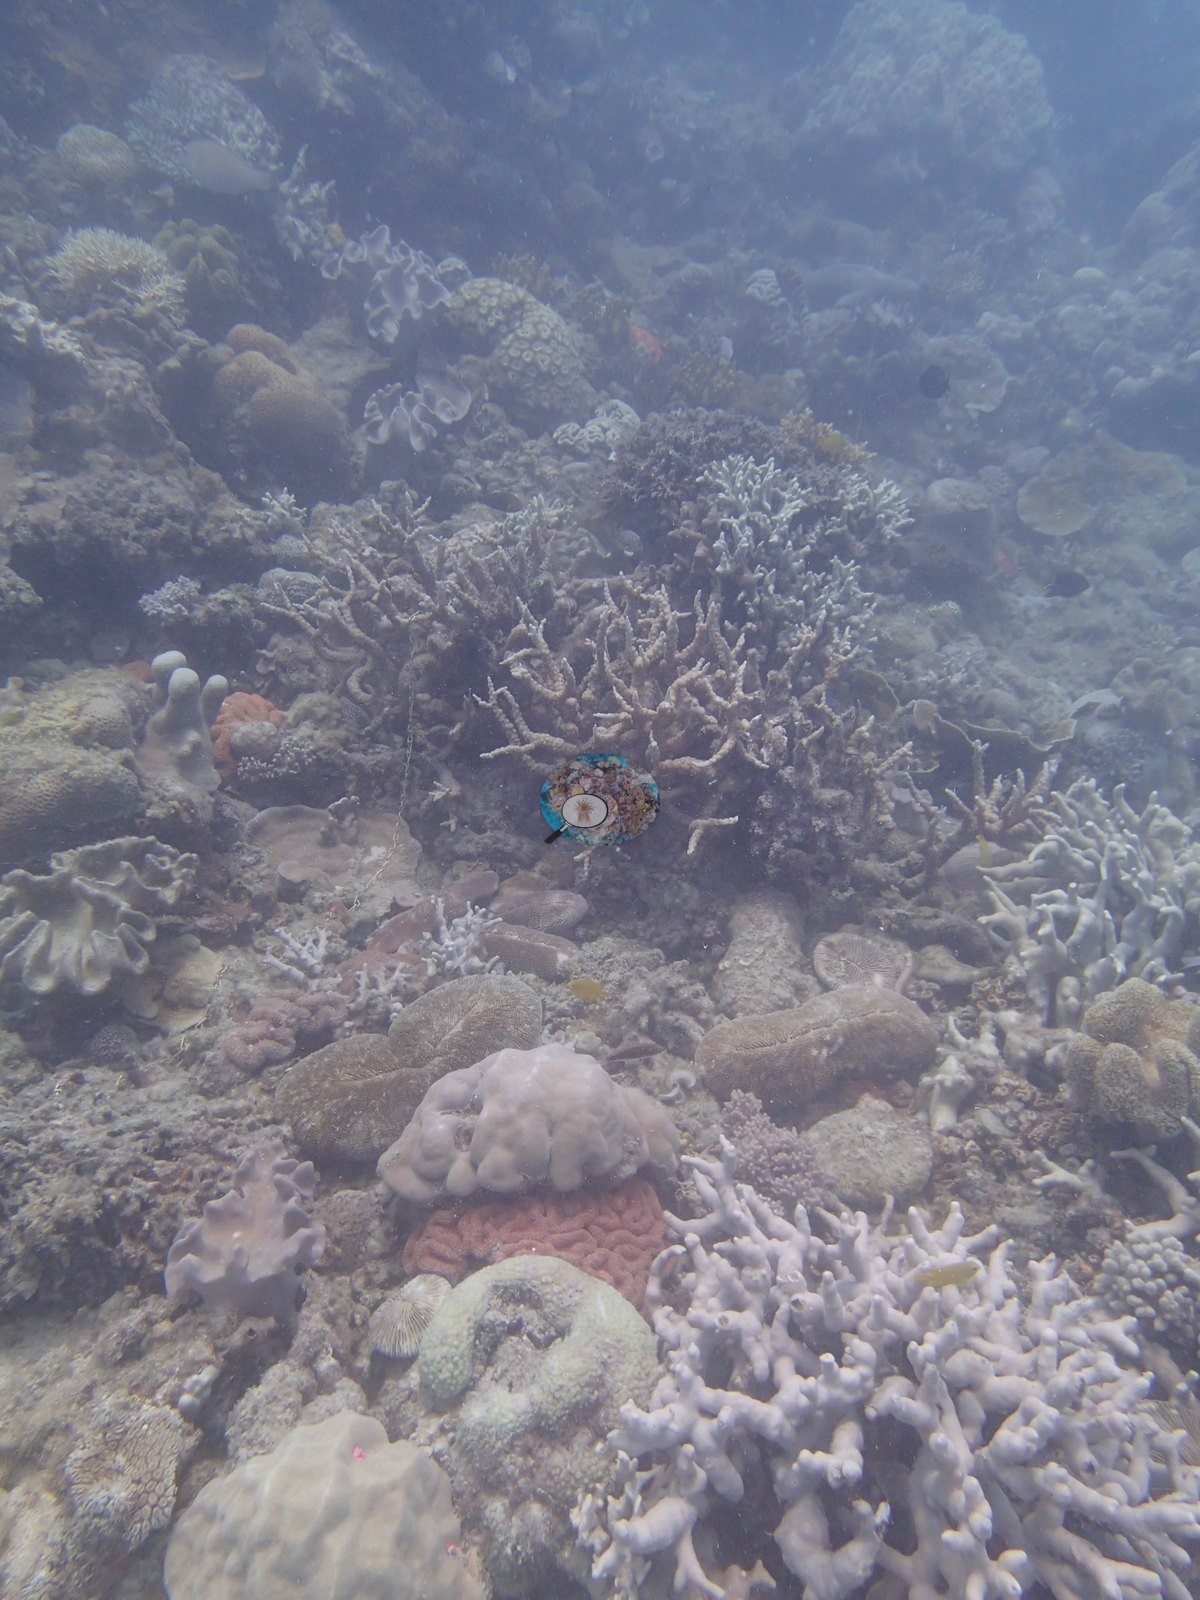
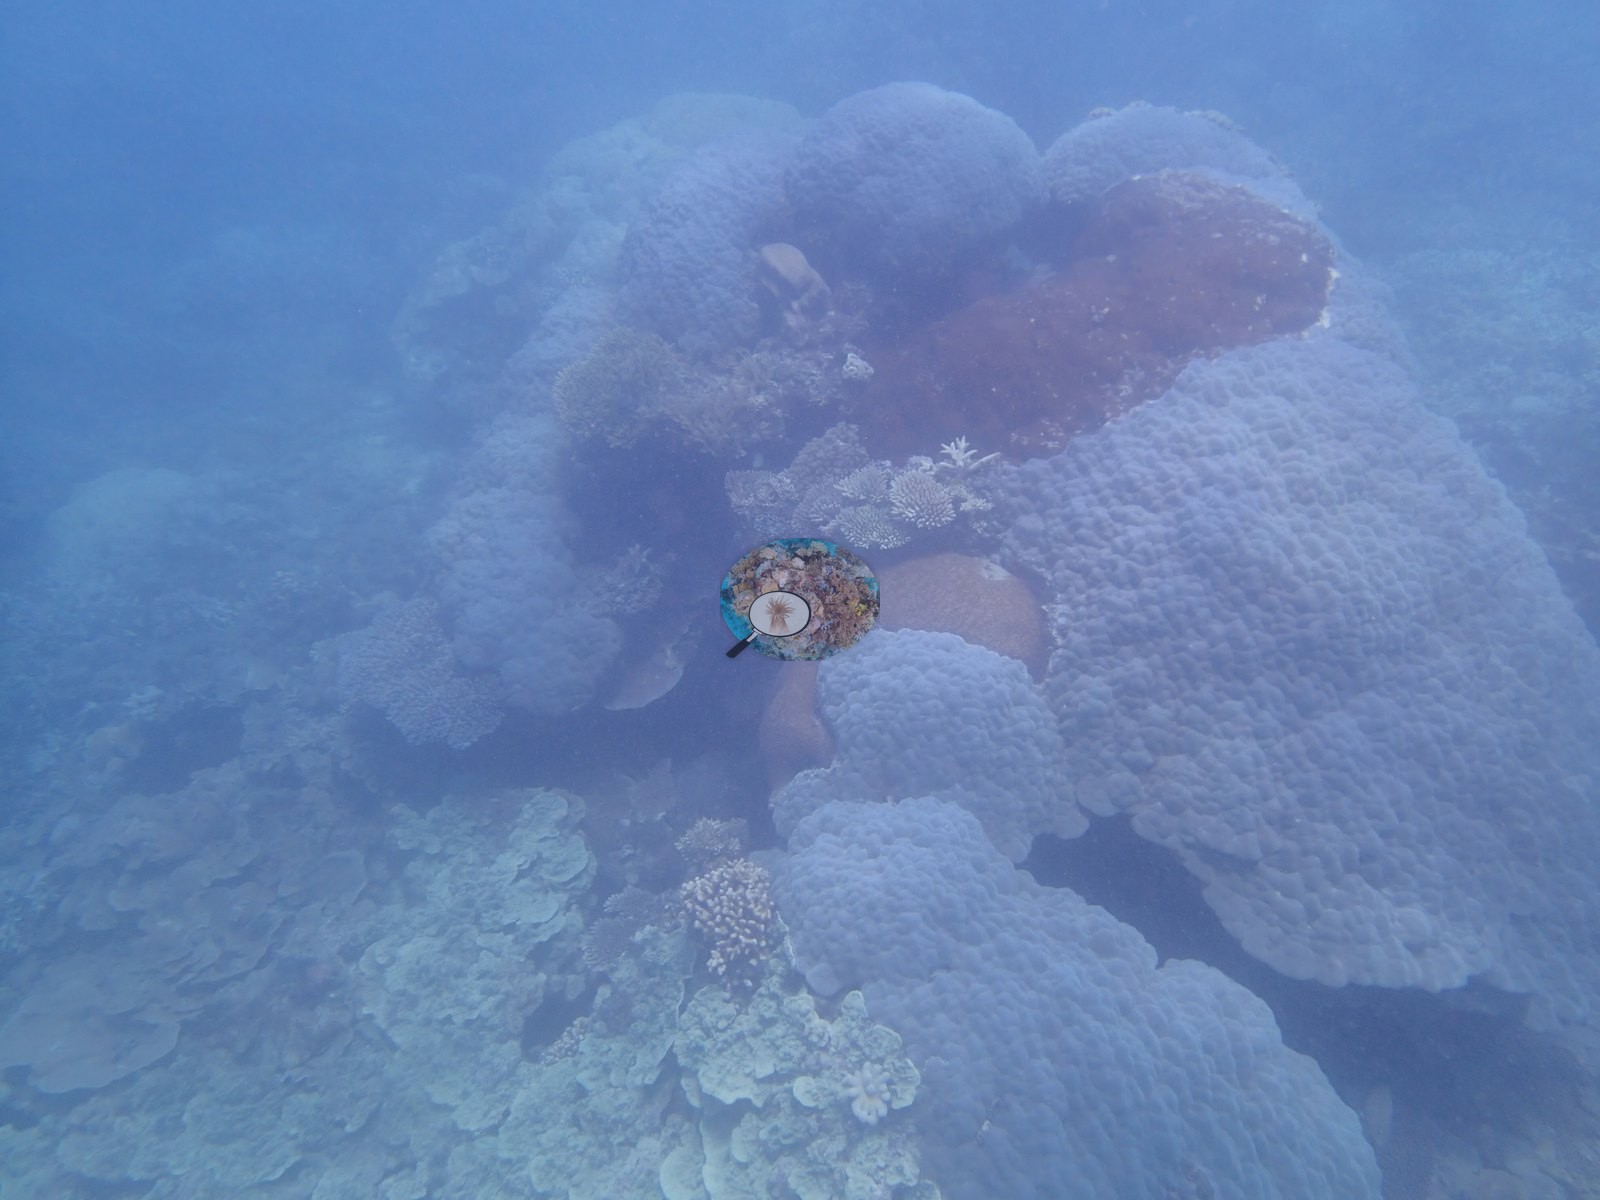
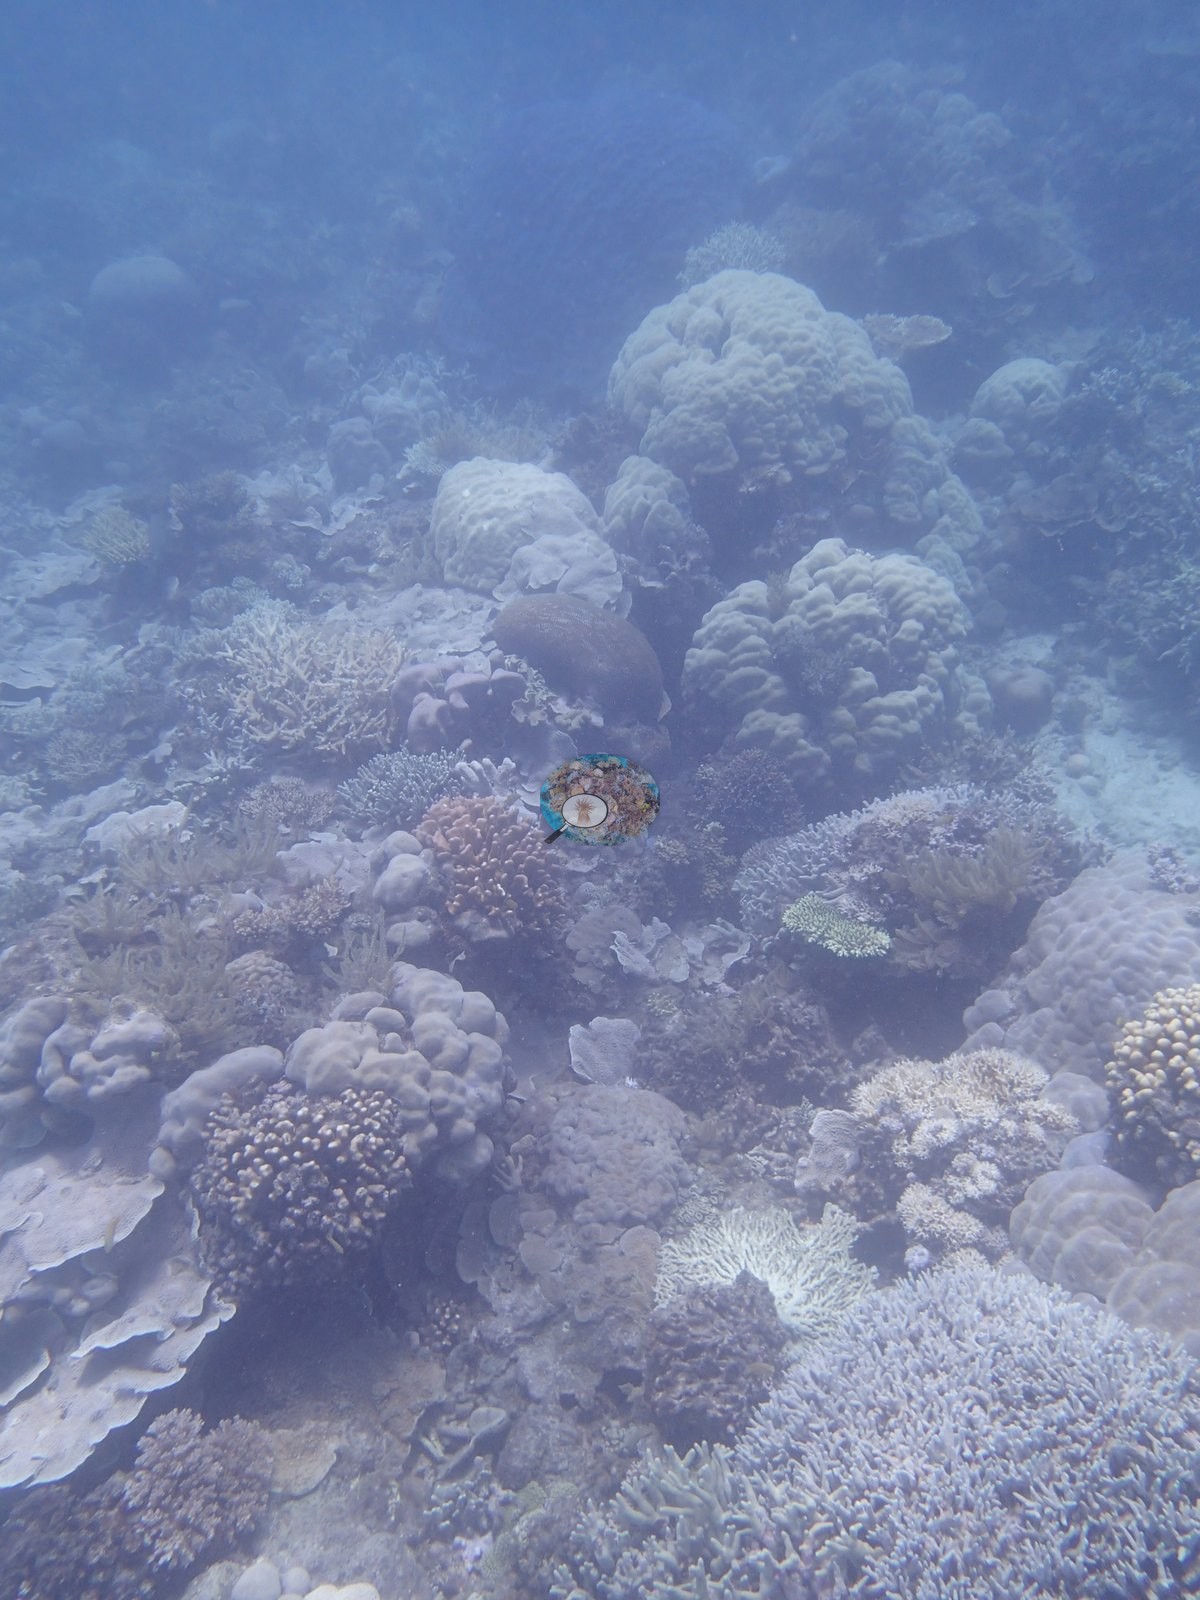
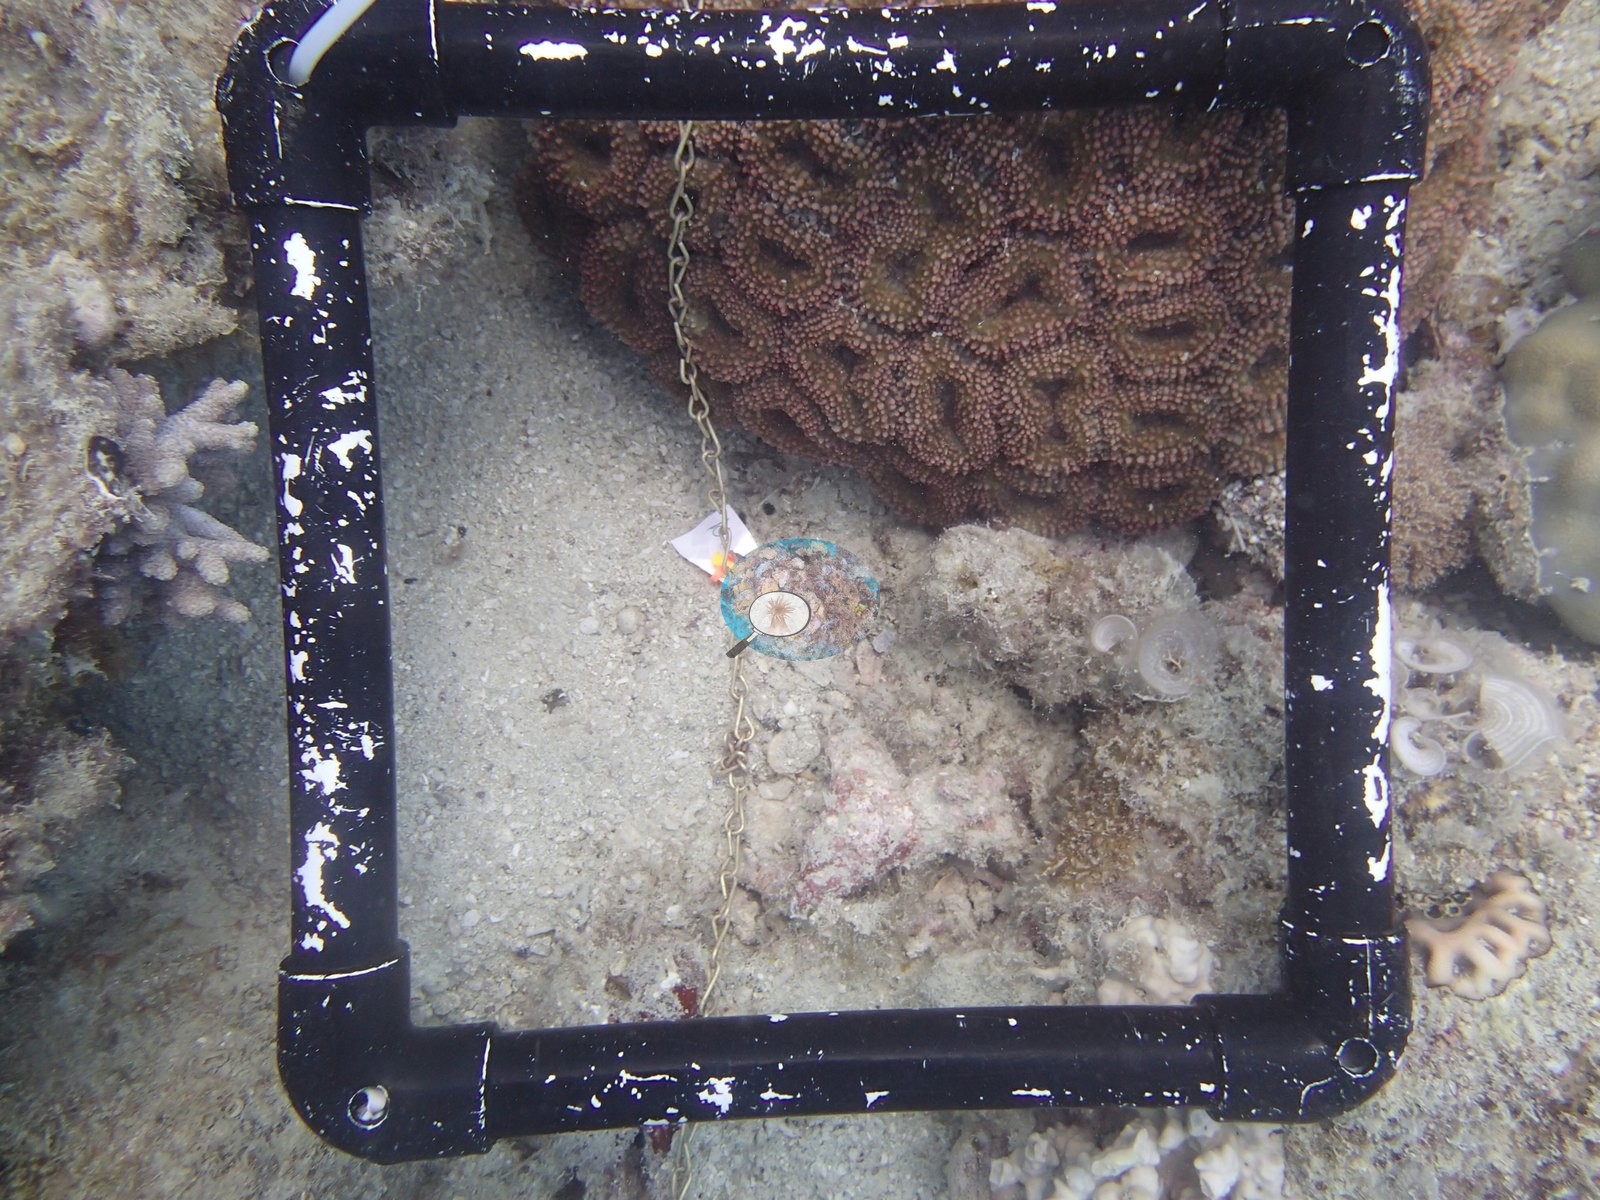
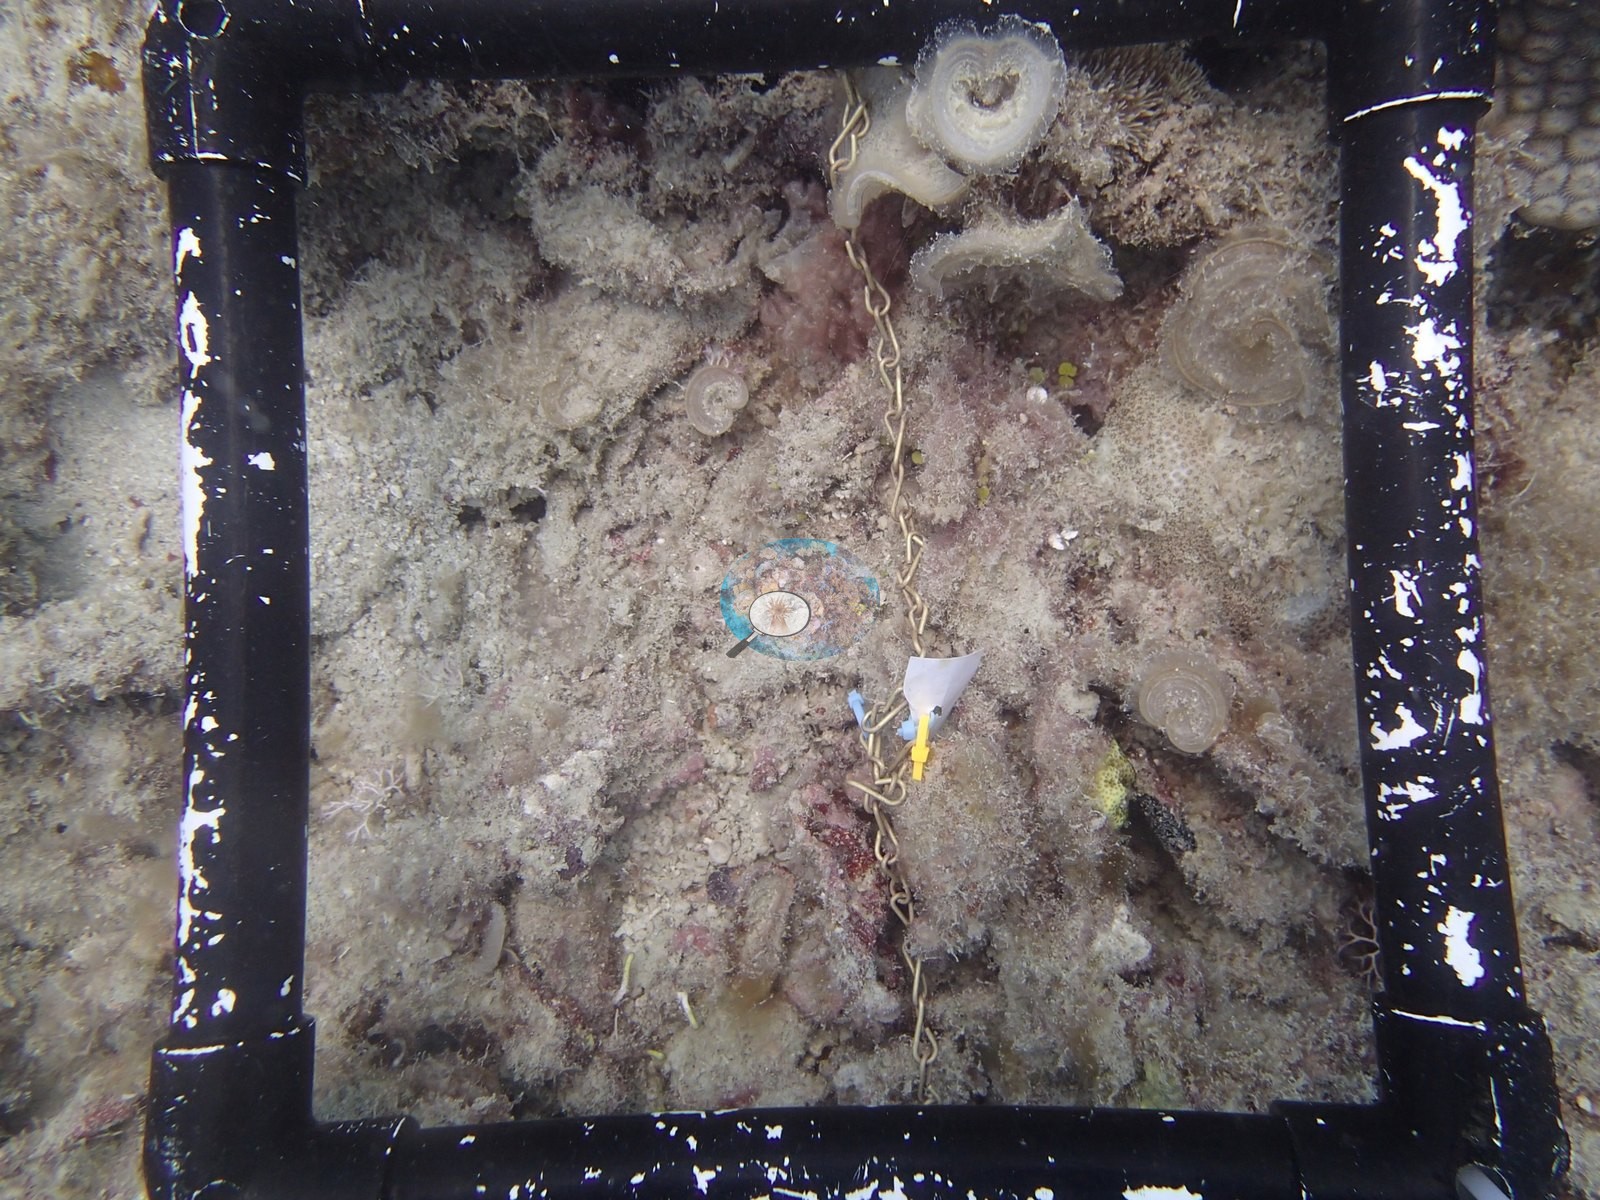
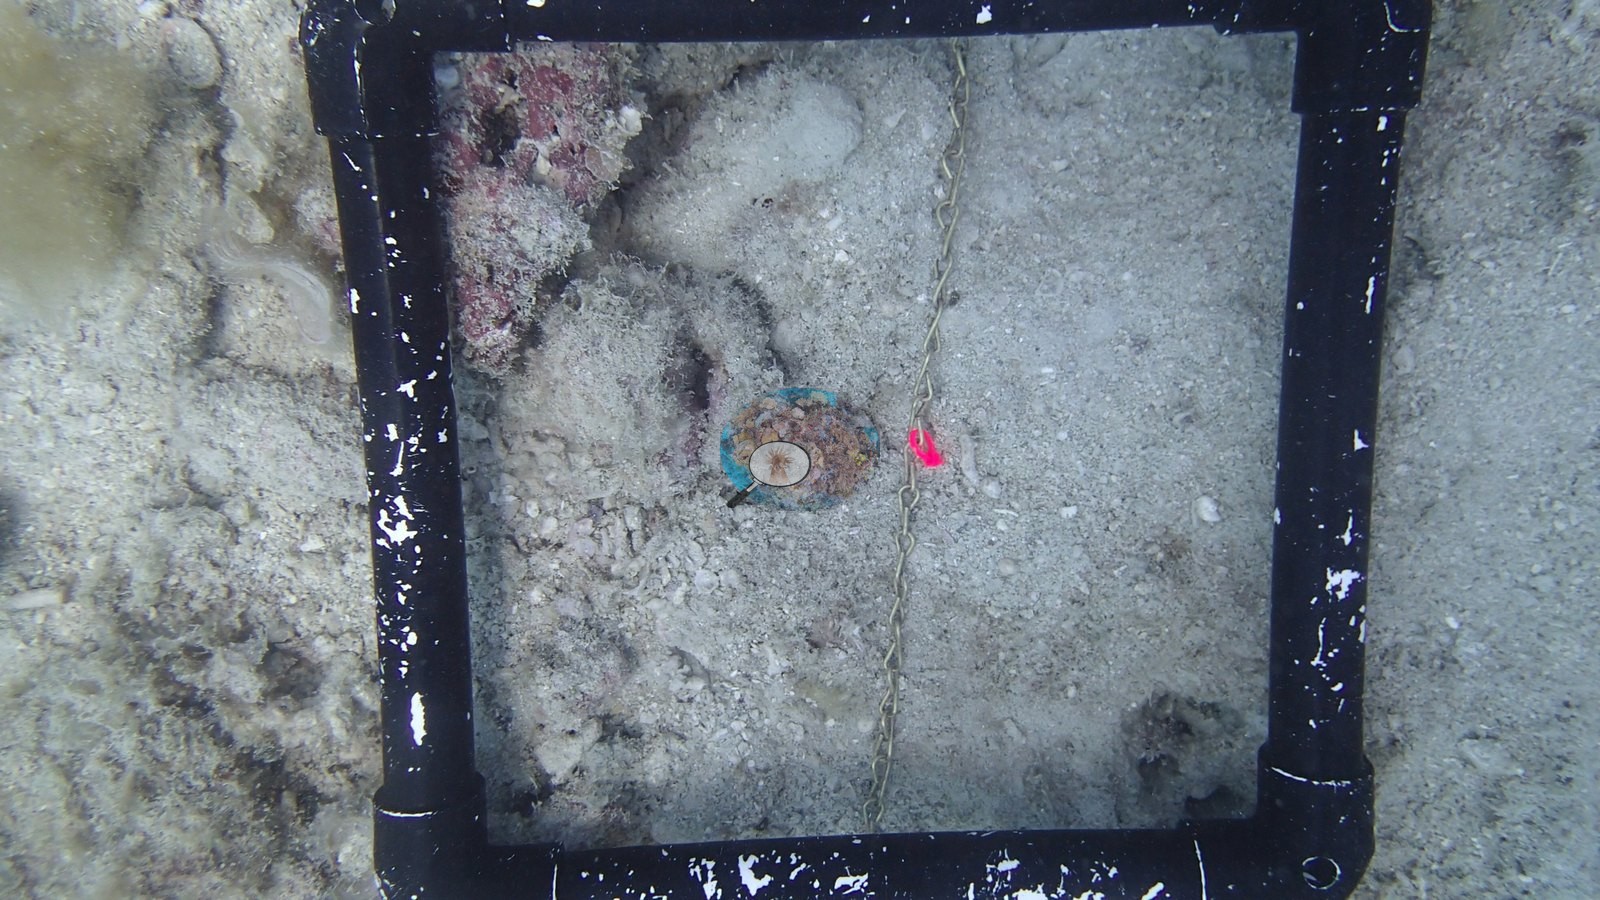
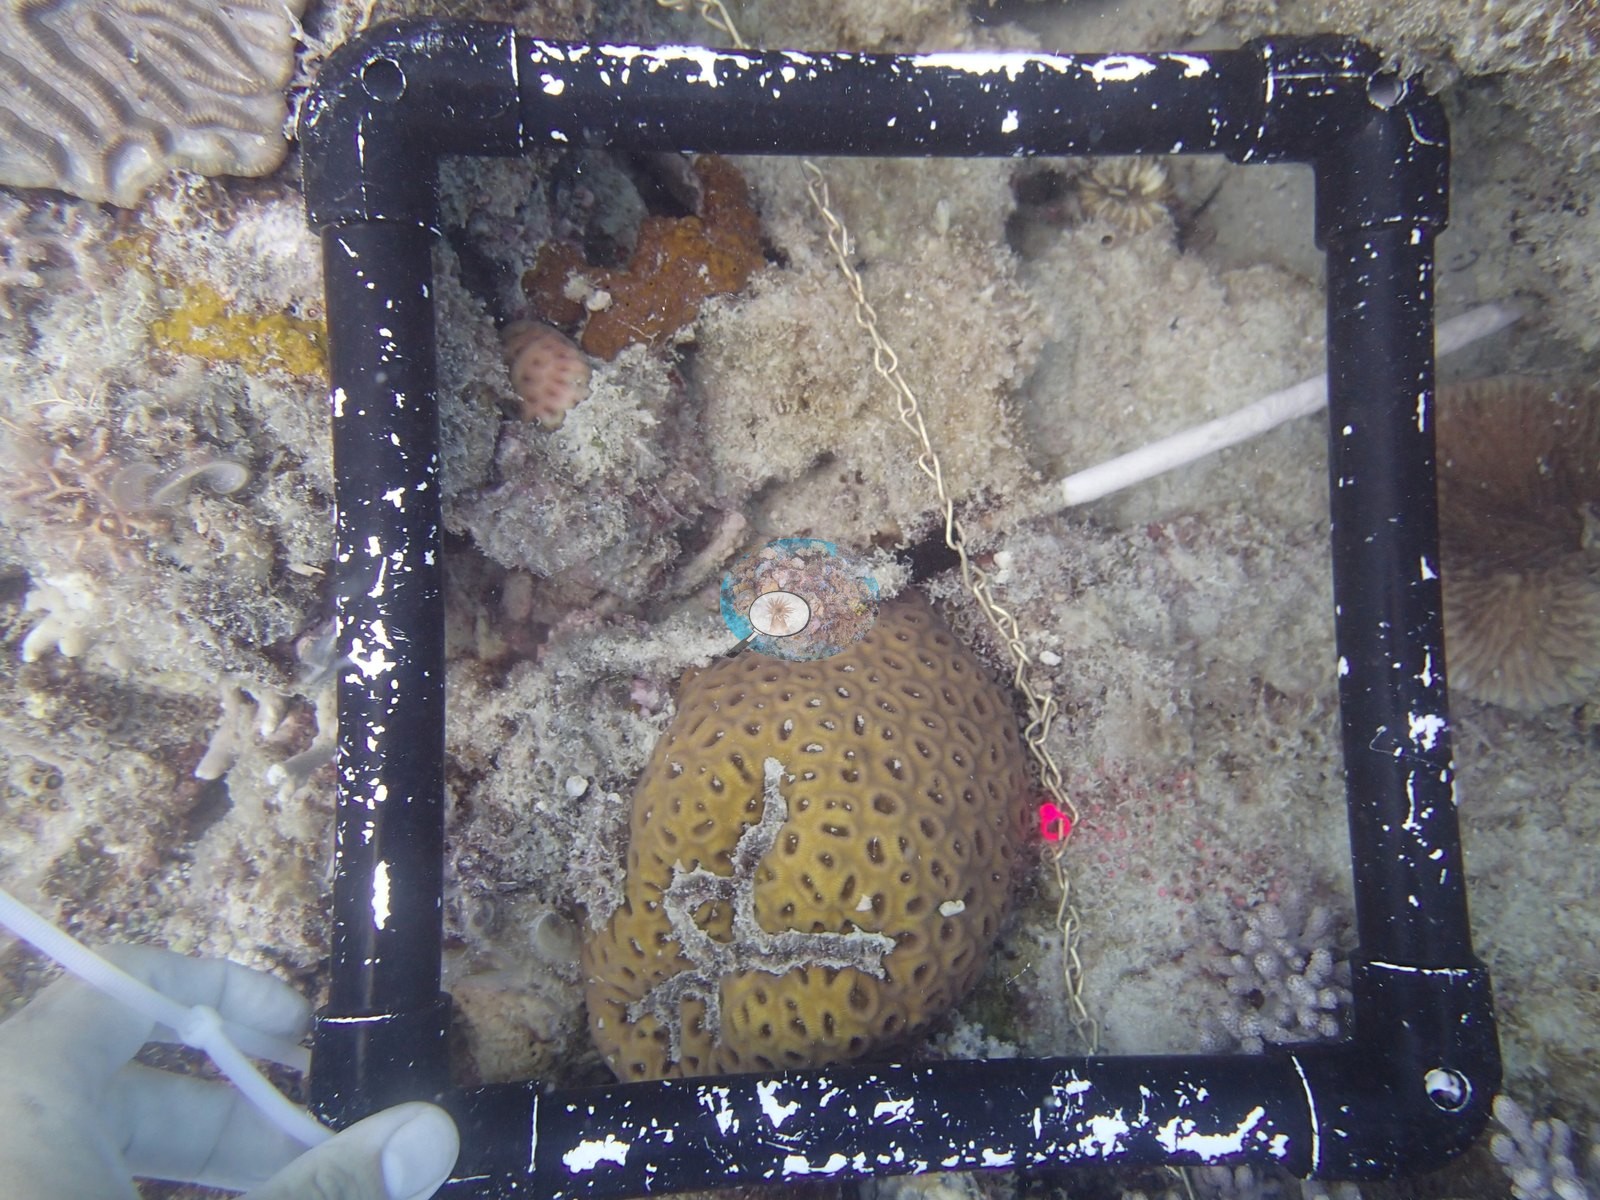
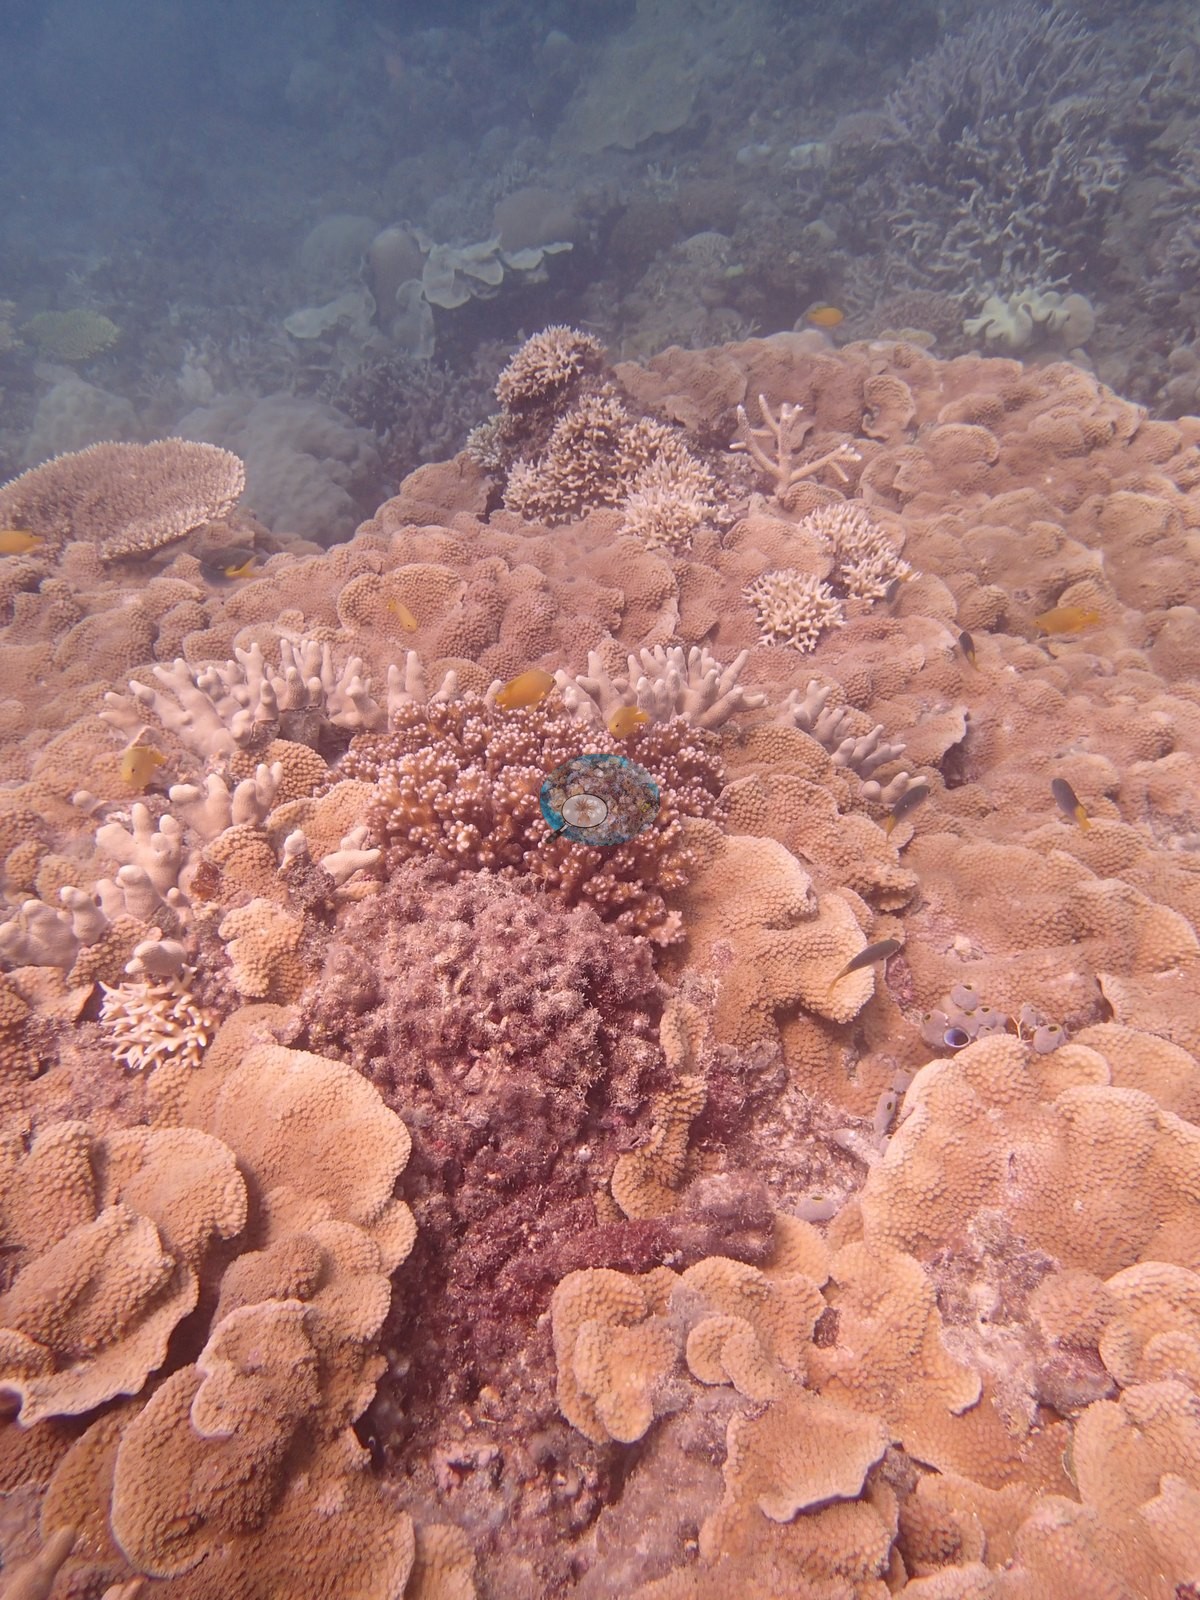
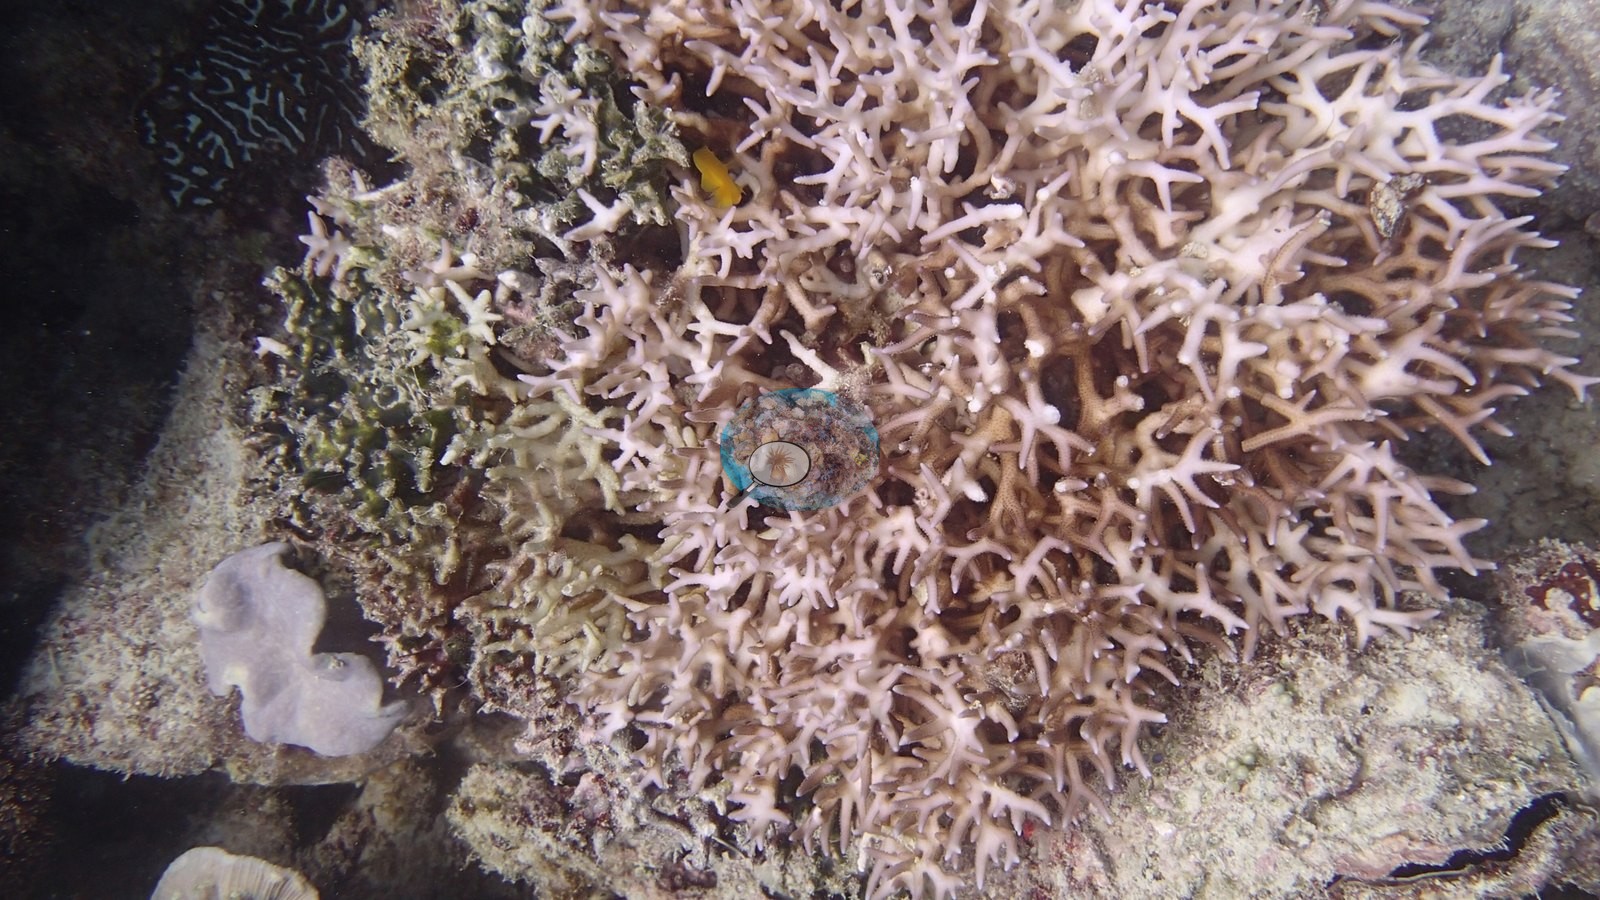
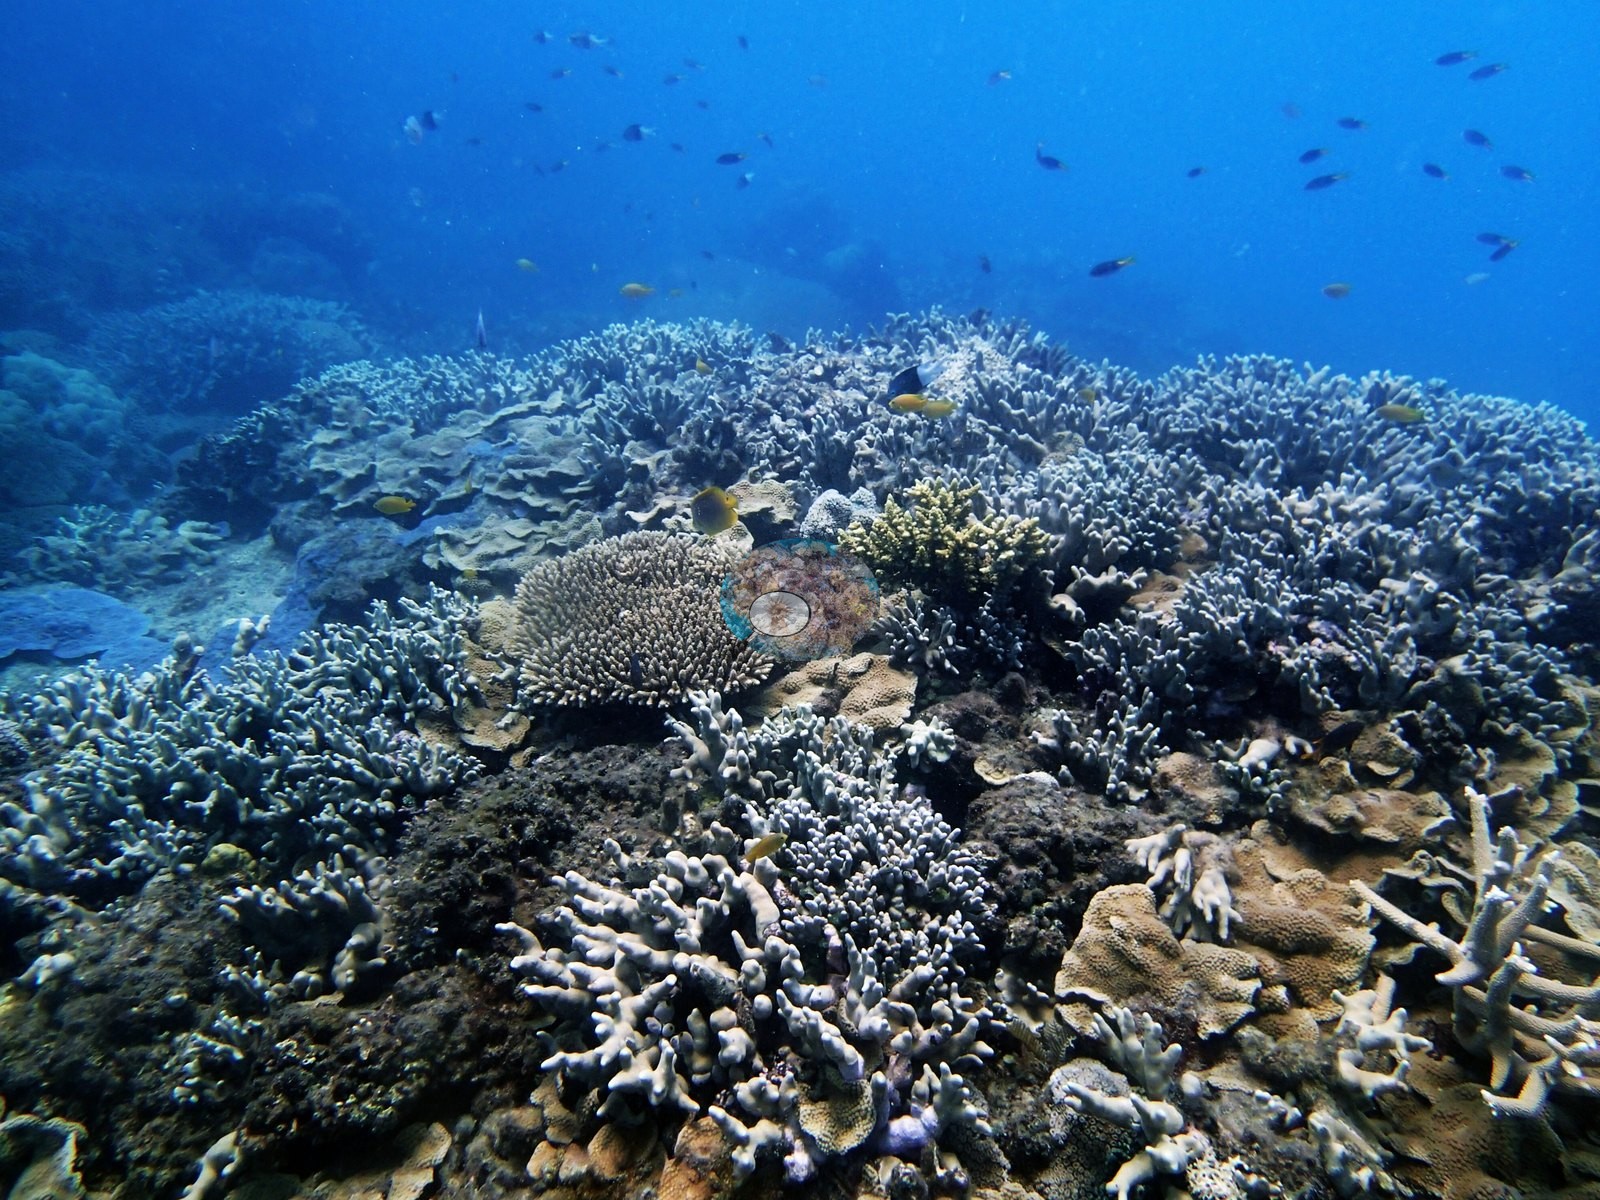
Far Northern GBR (NOAA CRW virtual station)A windward slope running down to a sandy, cyanobacteria-streaked bottom at 13 m, with most of the coral on the shallow crest: dense finger and massive Porites, Turbinaria, and needle coral. Two eel catfish and a stingray were logged, and no bleaching, disease, or crown-of-thorns were recorded. Surveyed on the Living Oceans Foundation's Global Reef Expedition.
Five other CRD dive sites within 5 km shown in orange — click a marker to open its page.
🗺 Detailed map of the Global Reef Expedition dive sites, Milman and Alpin Reefs, northern Great Barrier Reef (Khaled bin Sultan Living Oceans Foundation; opens in a new window)
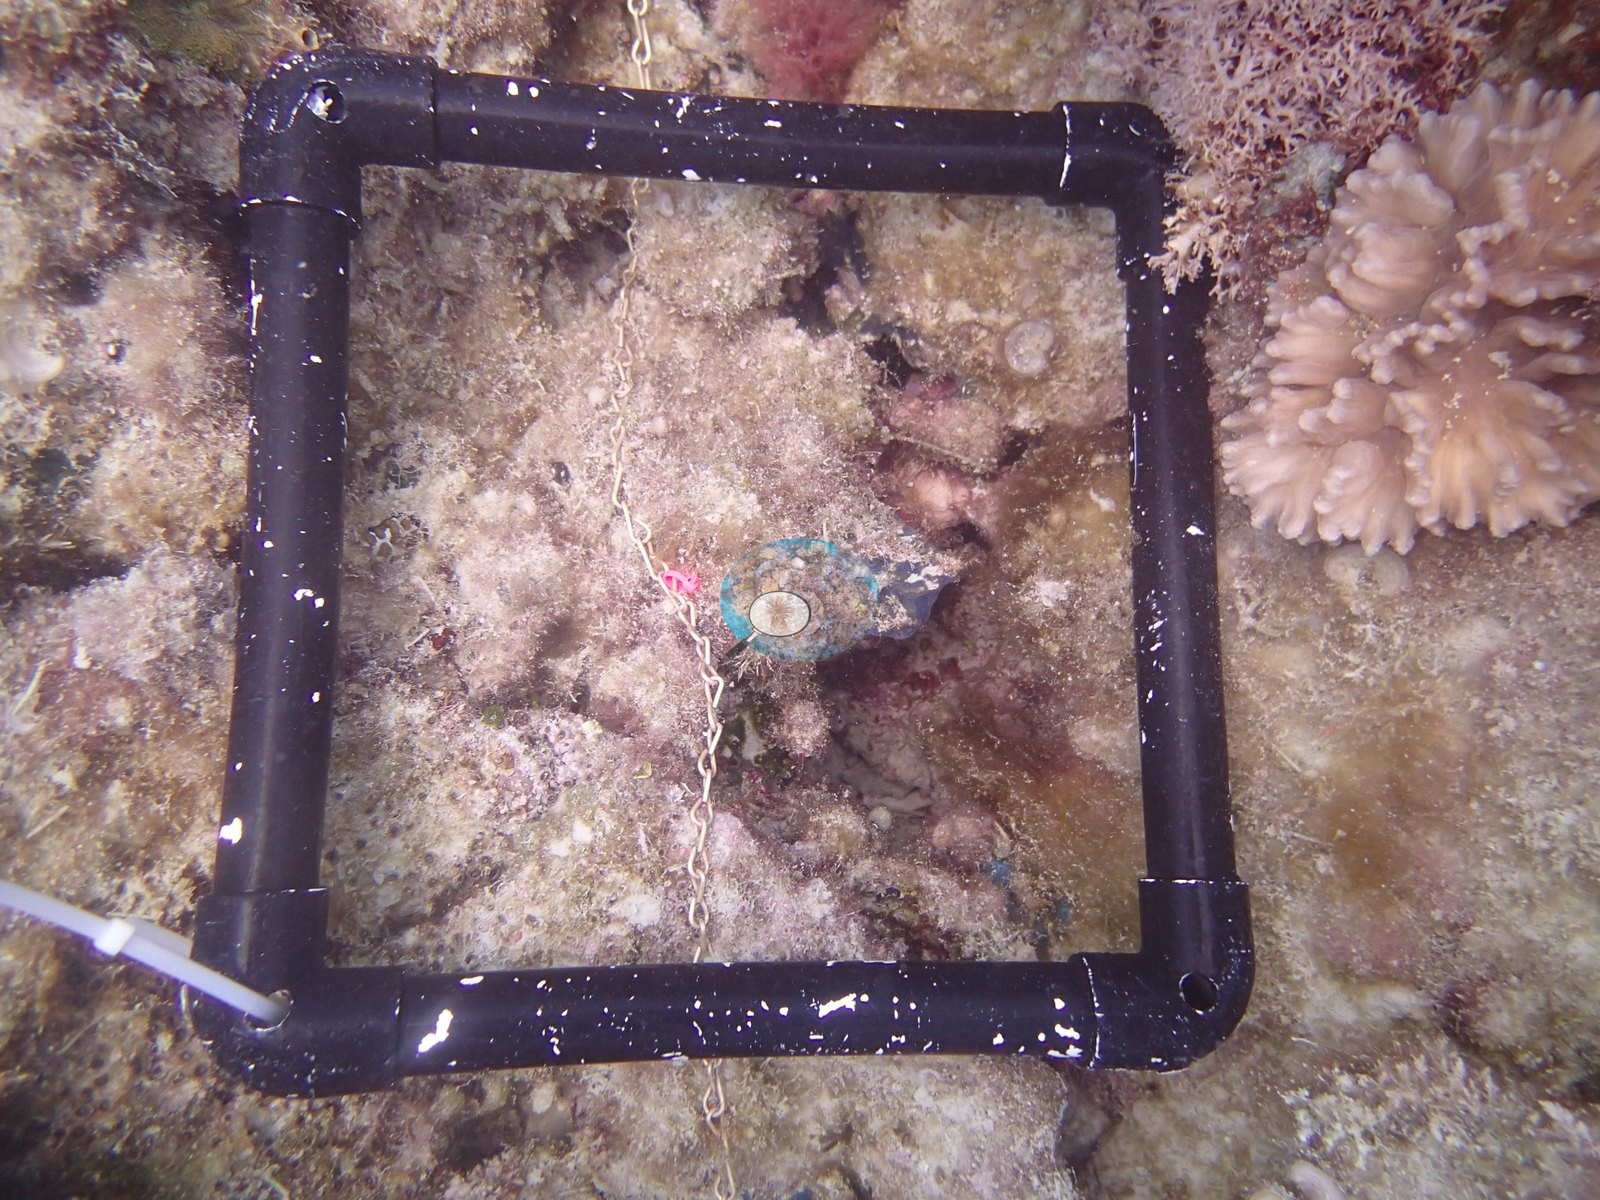
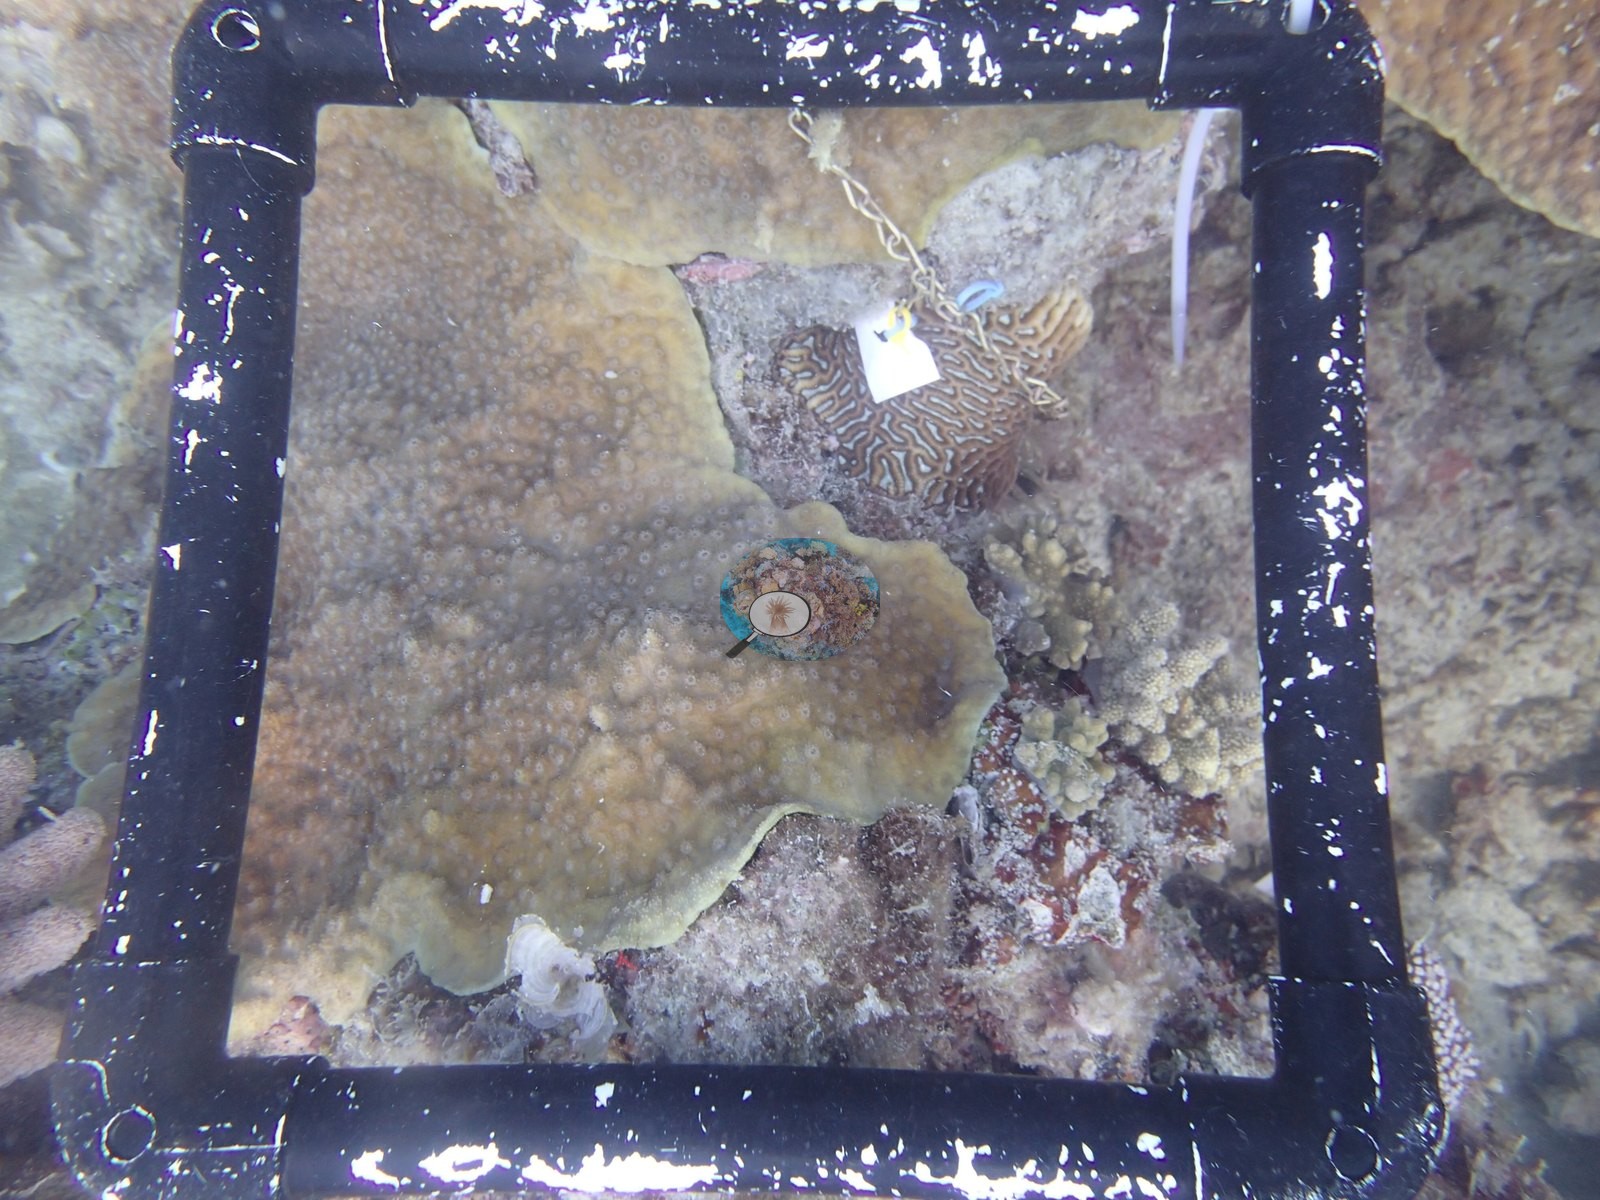
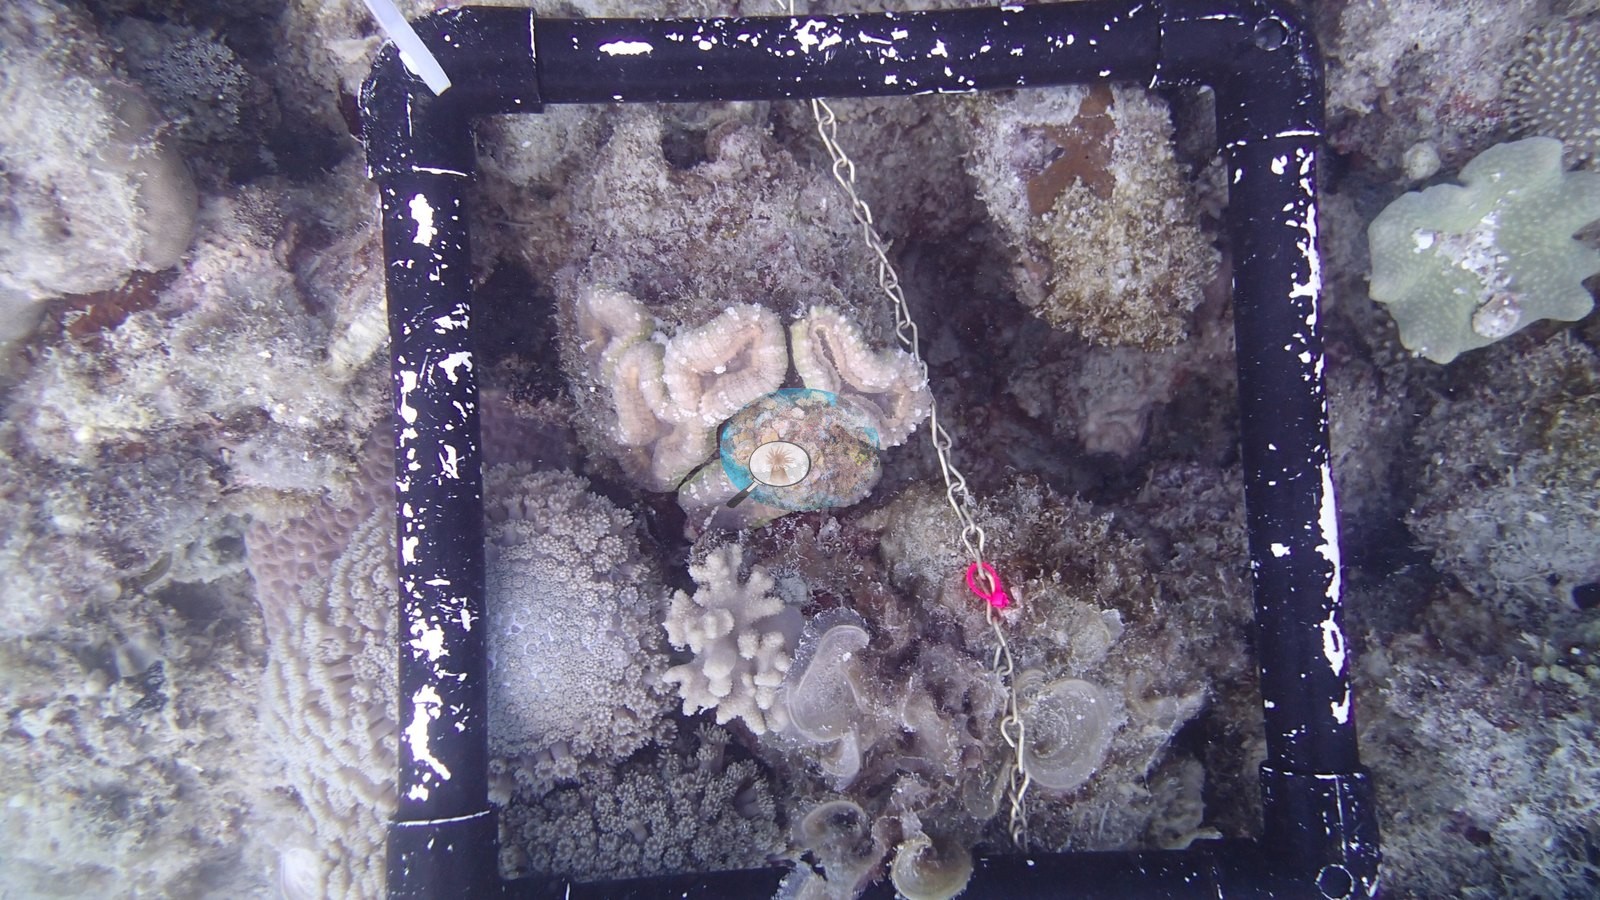
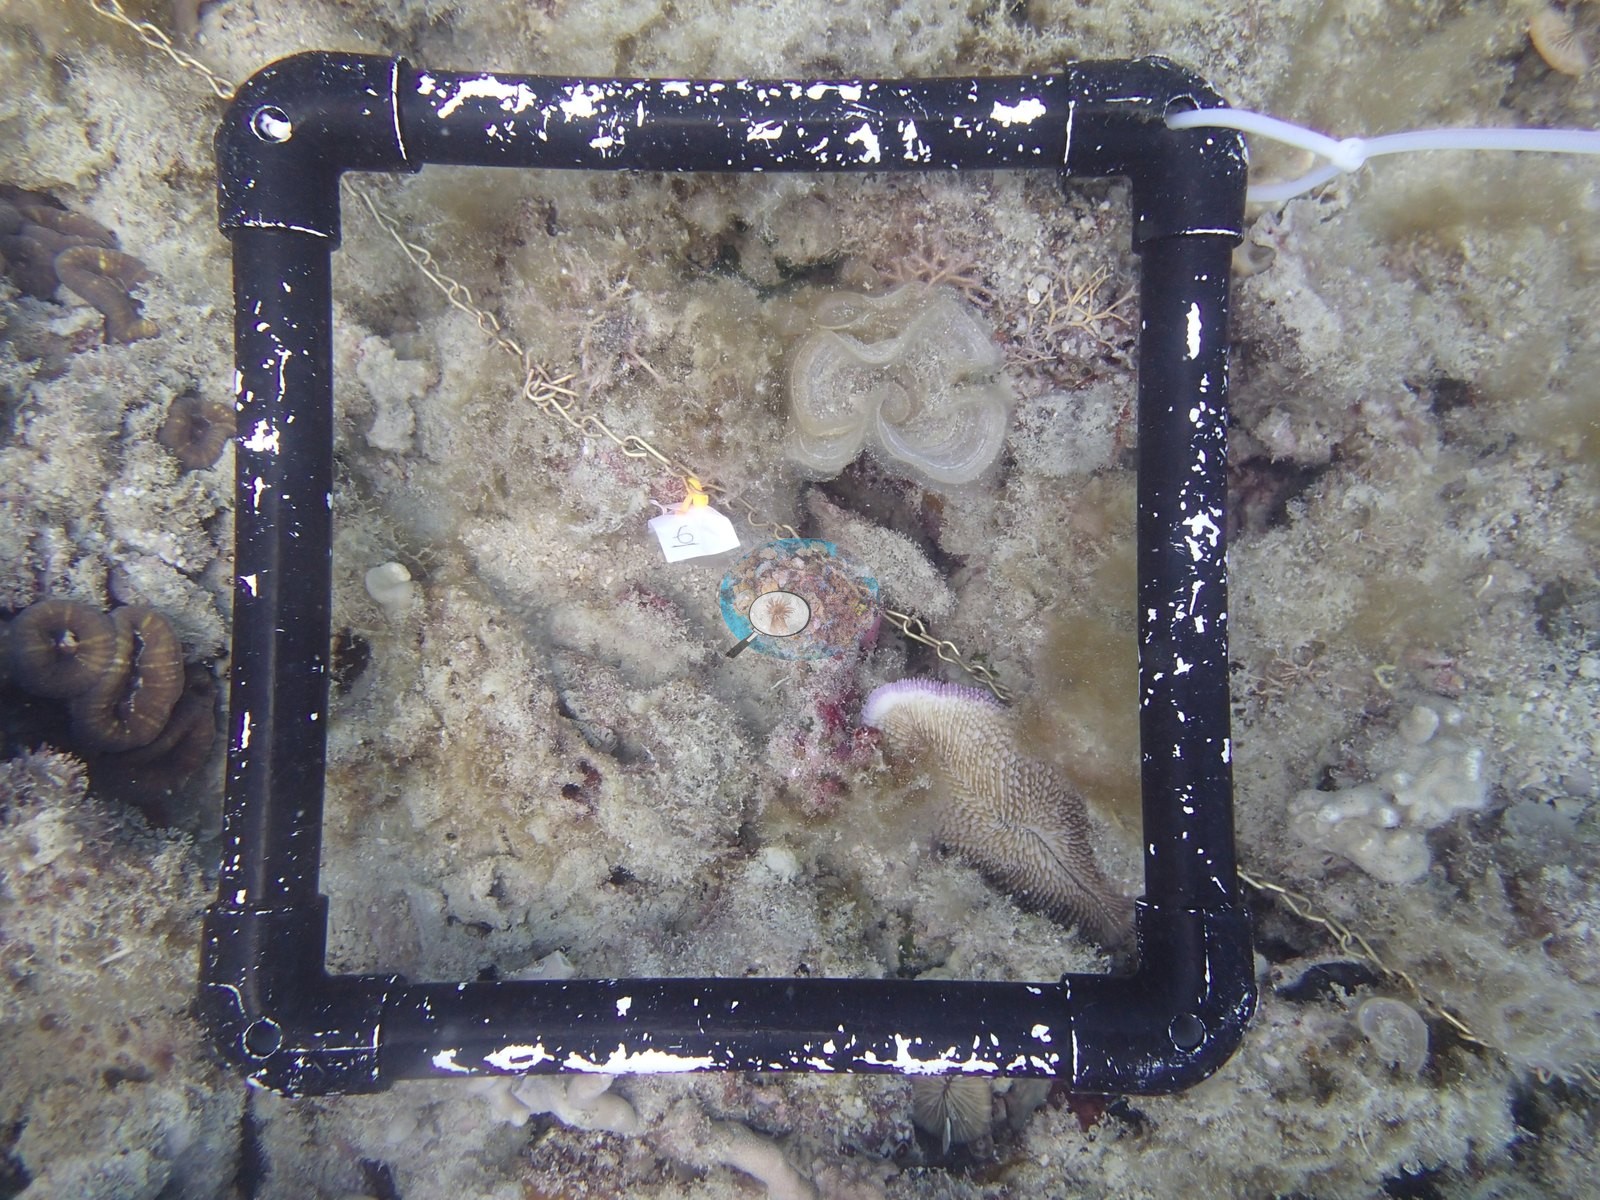
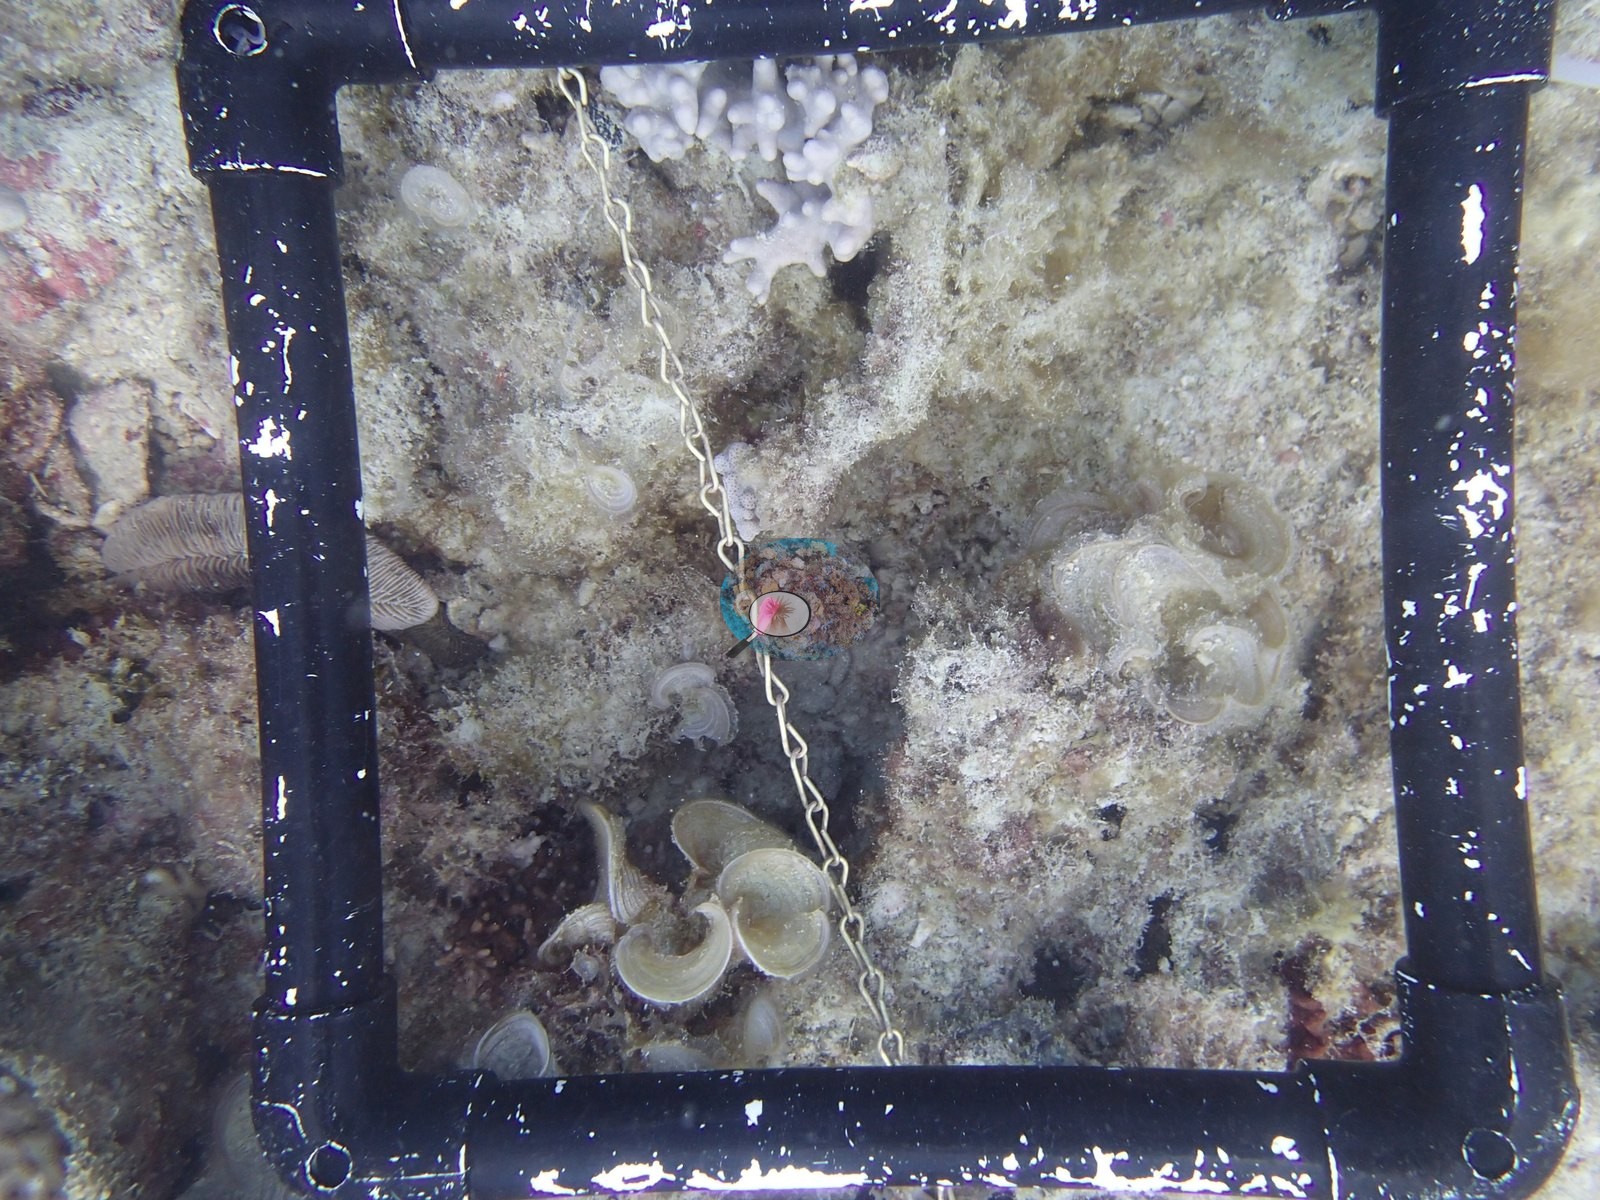
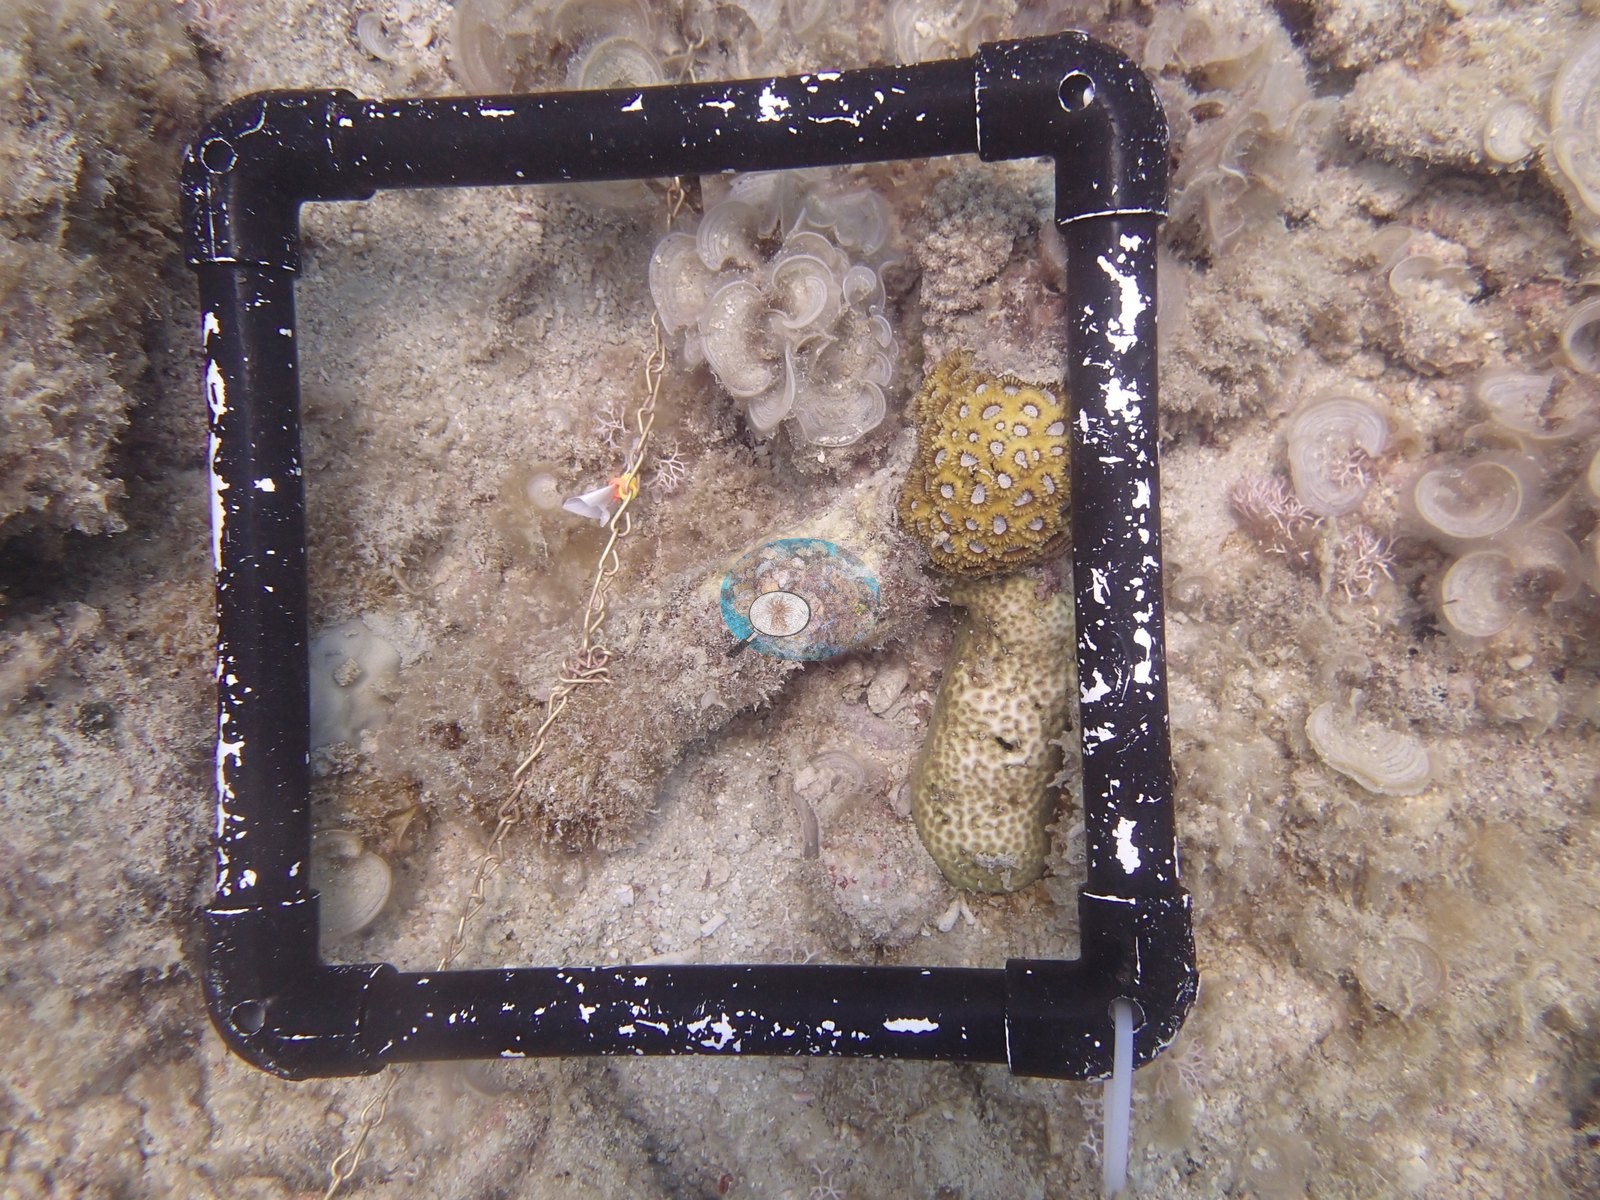
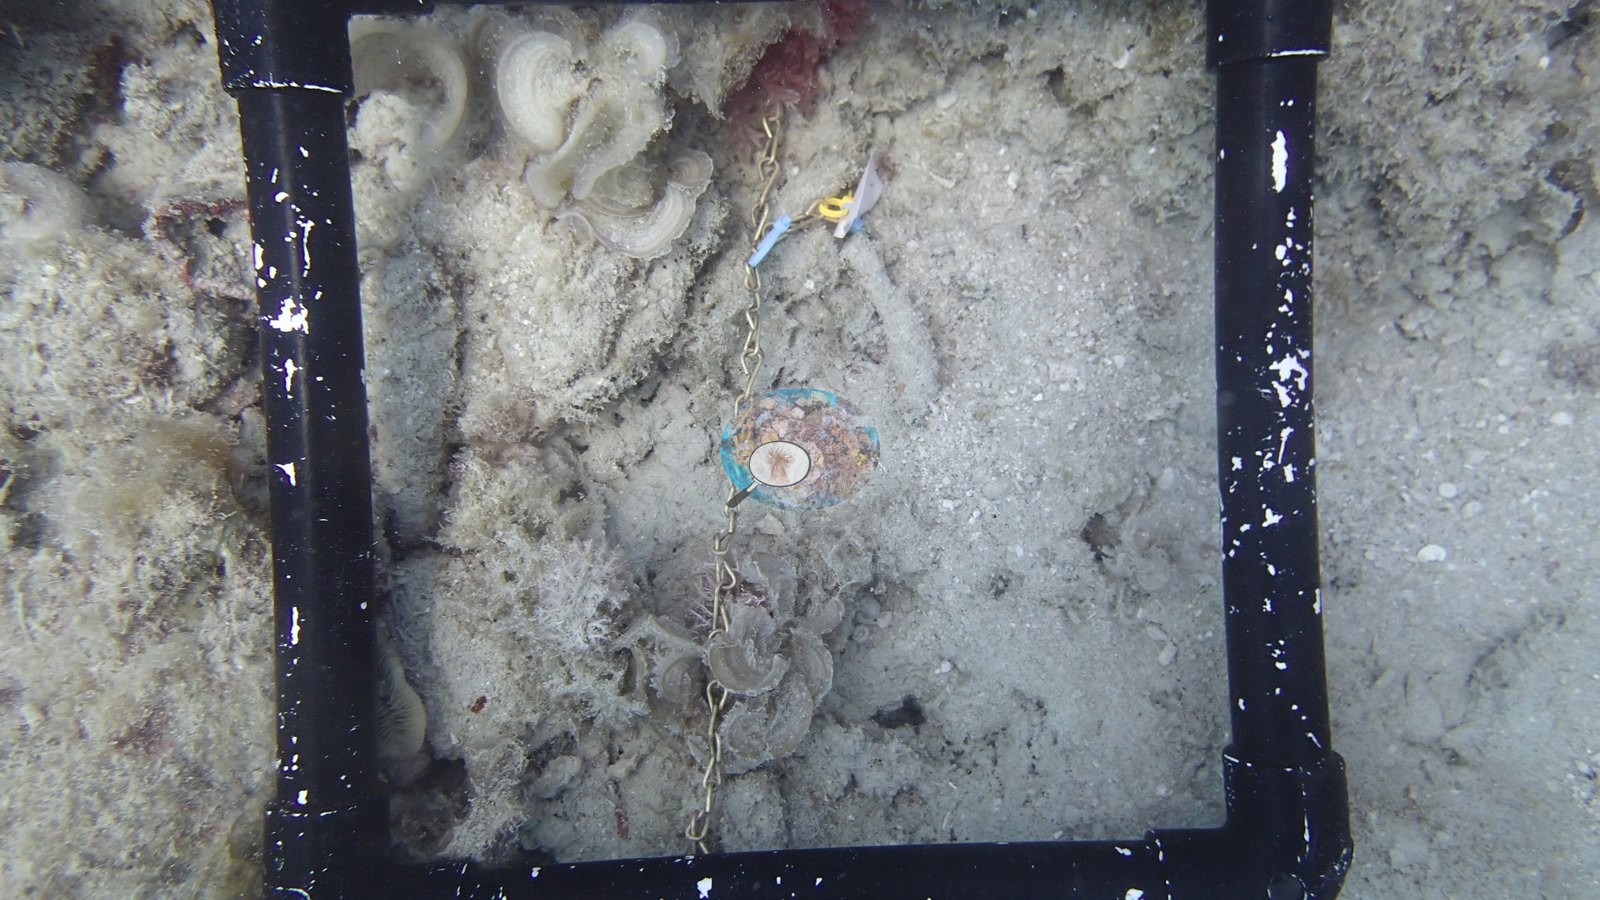
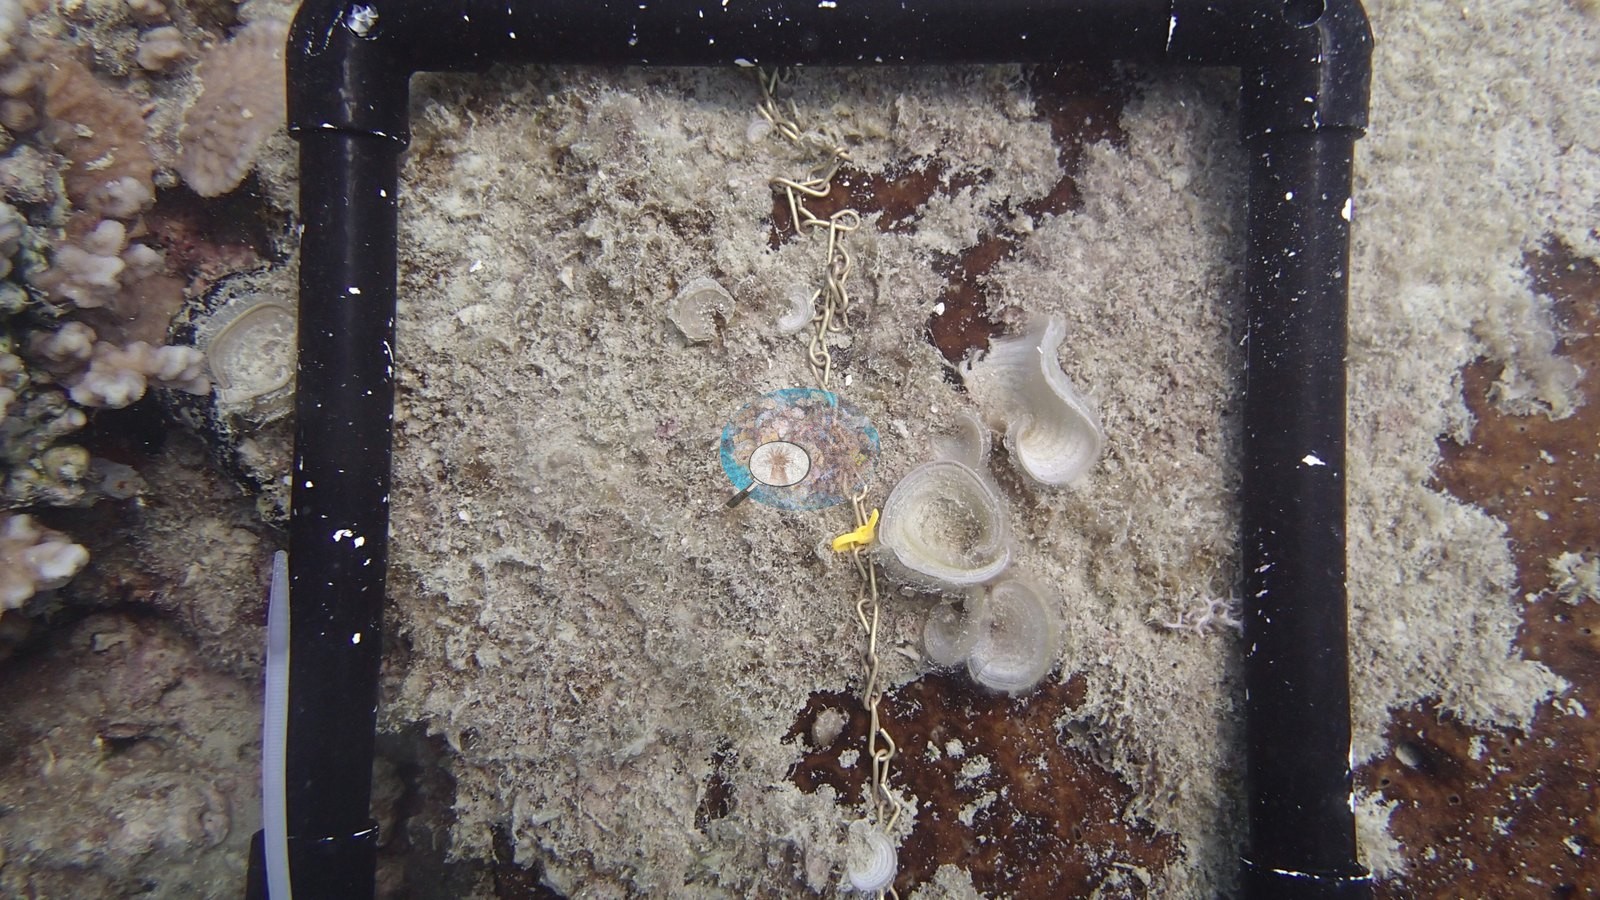
Site description
Setting
Global Reef Expedition station AU2593, far northern Great Barrier Reef (-11.0660, 143.0690), surveyed on 19 September 2014 on a windward reef, in a Habitat Protection (Blue) Zone, where line fishing is permitted.
General benthic features
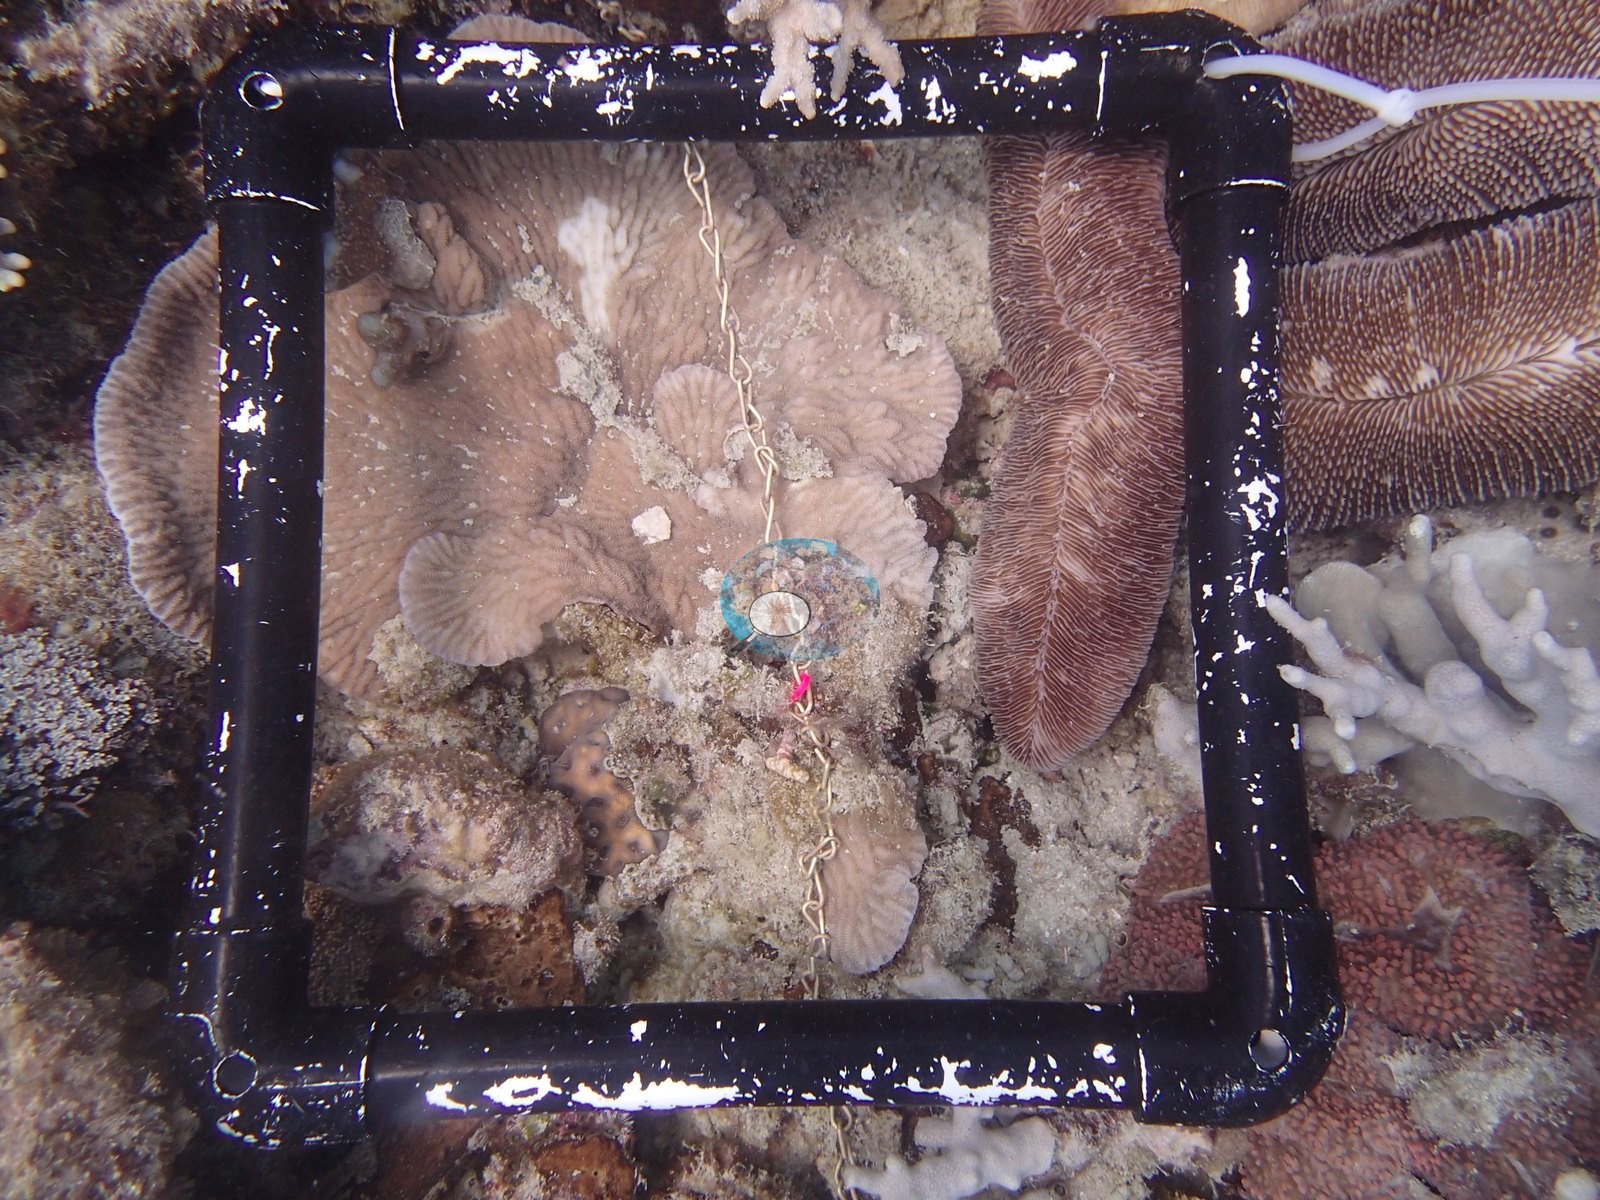
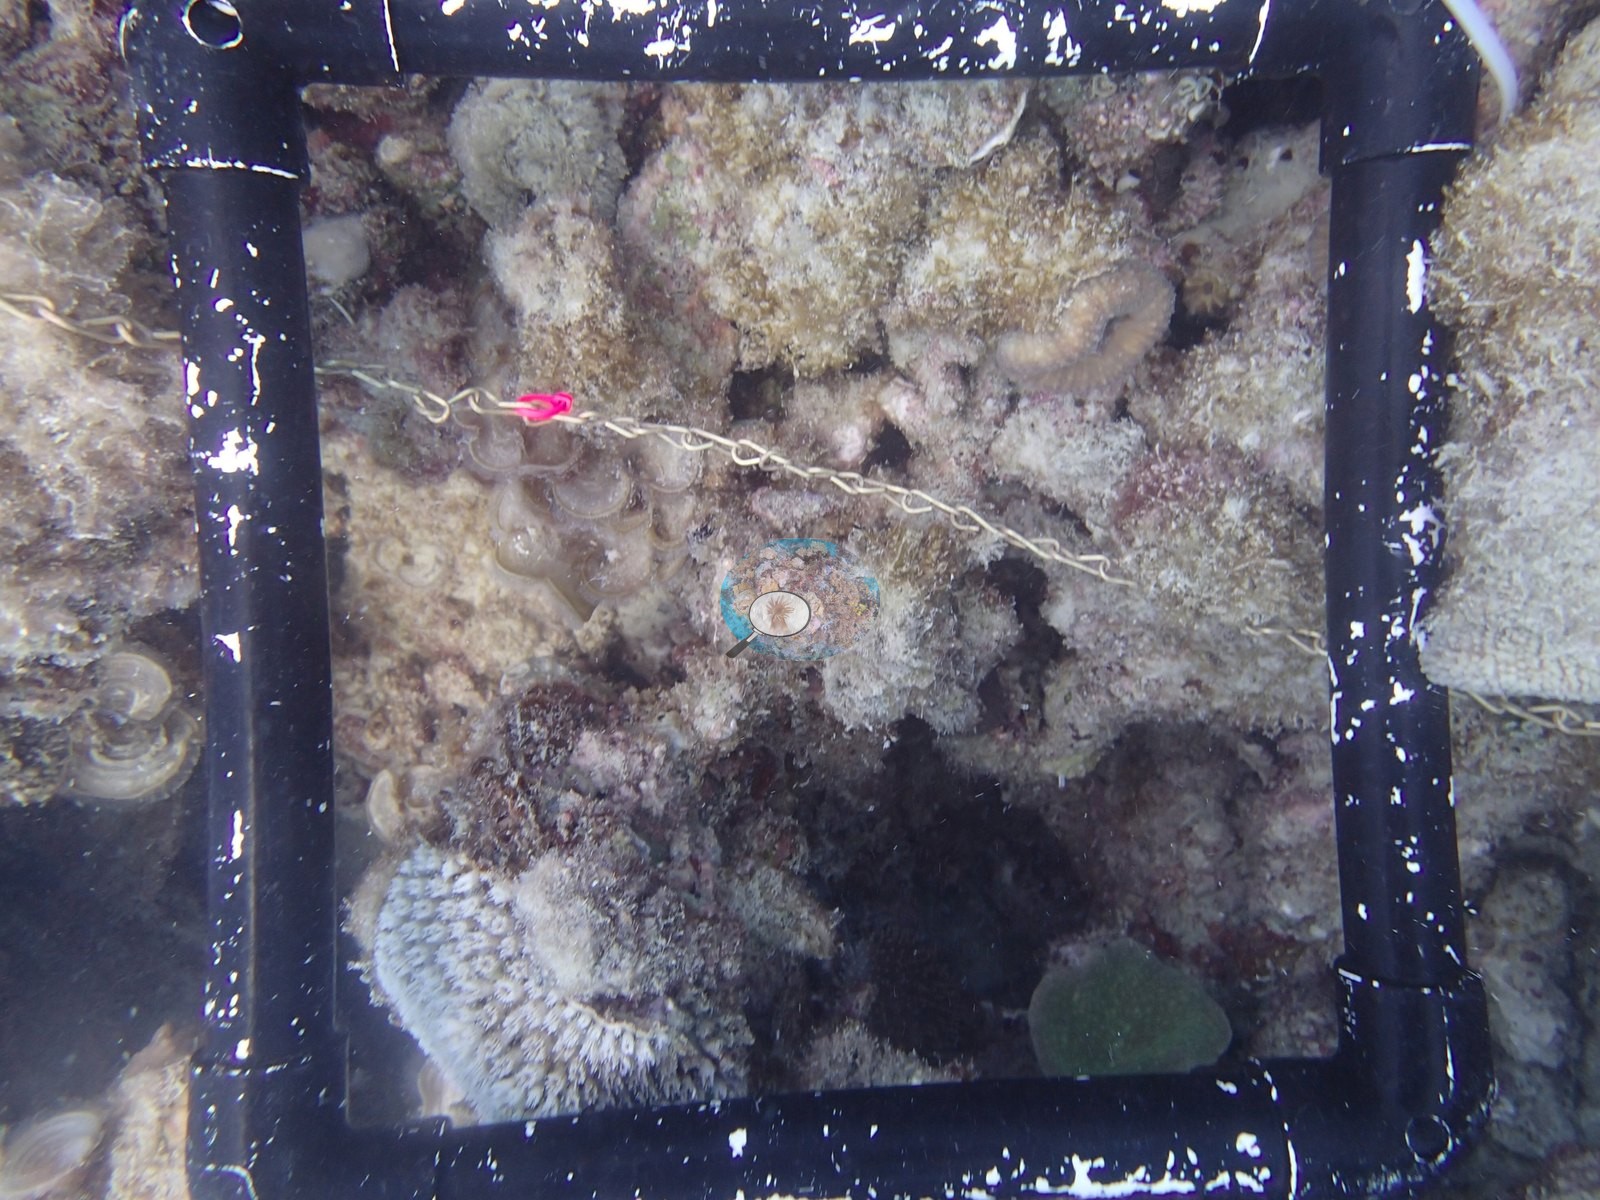
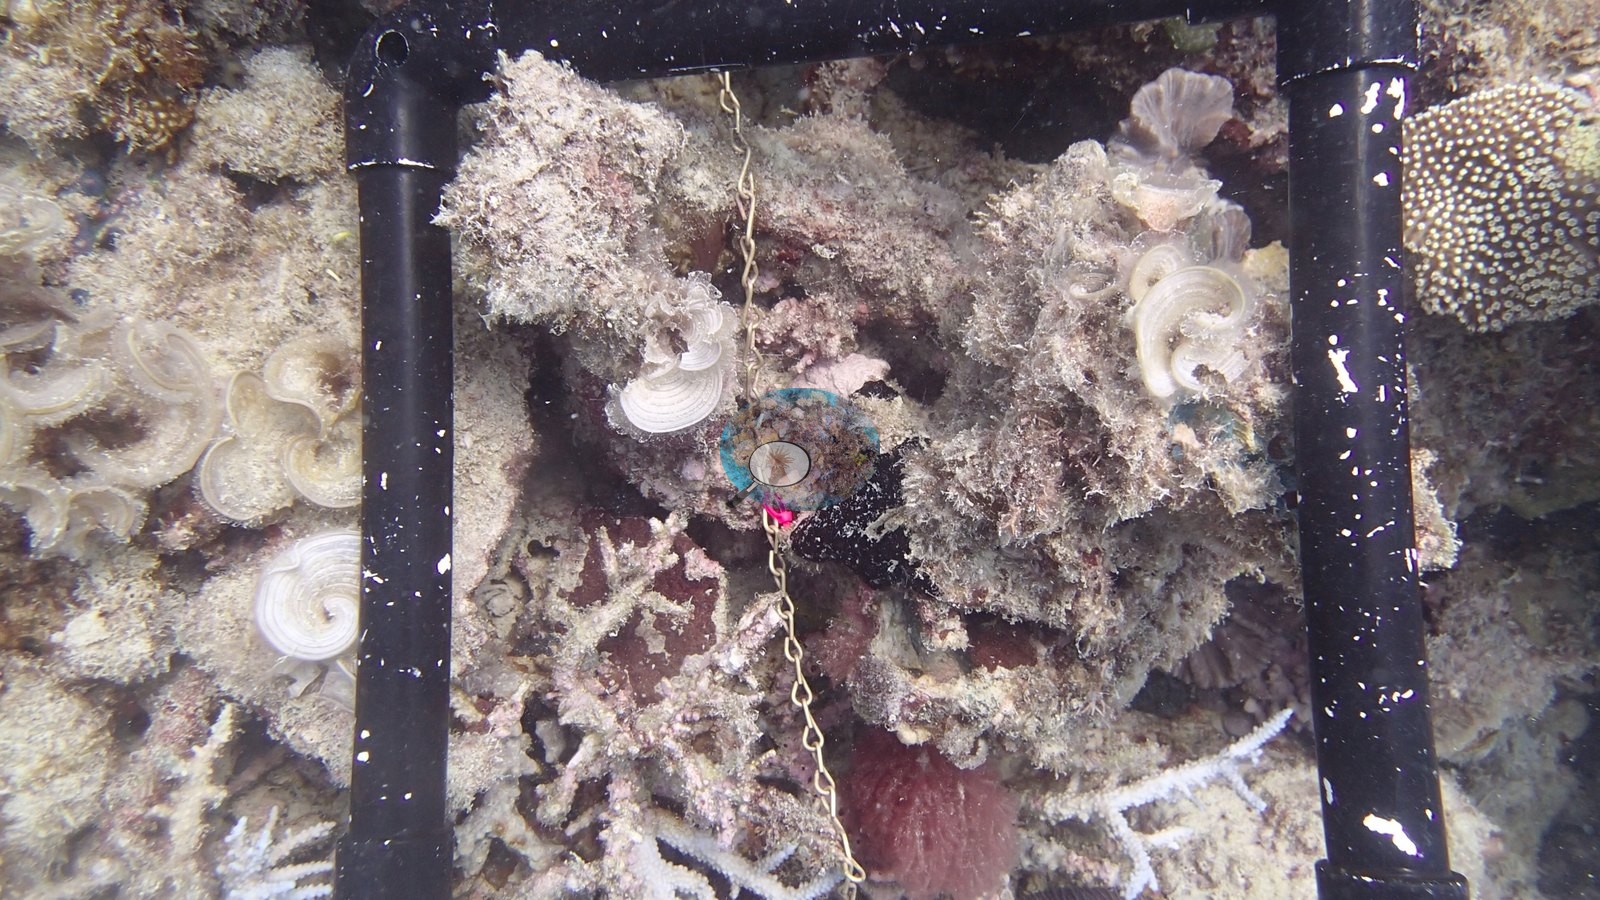
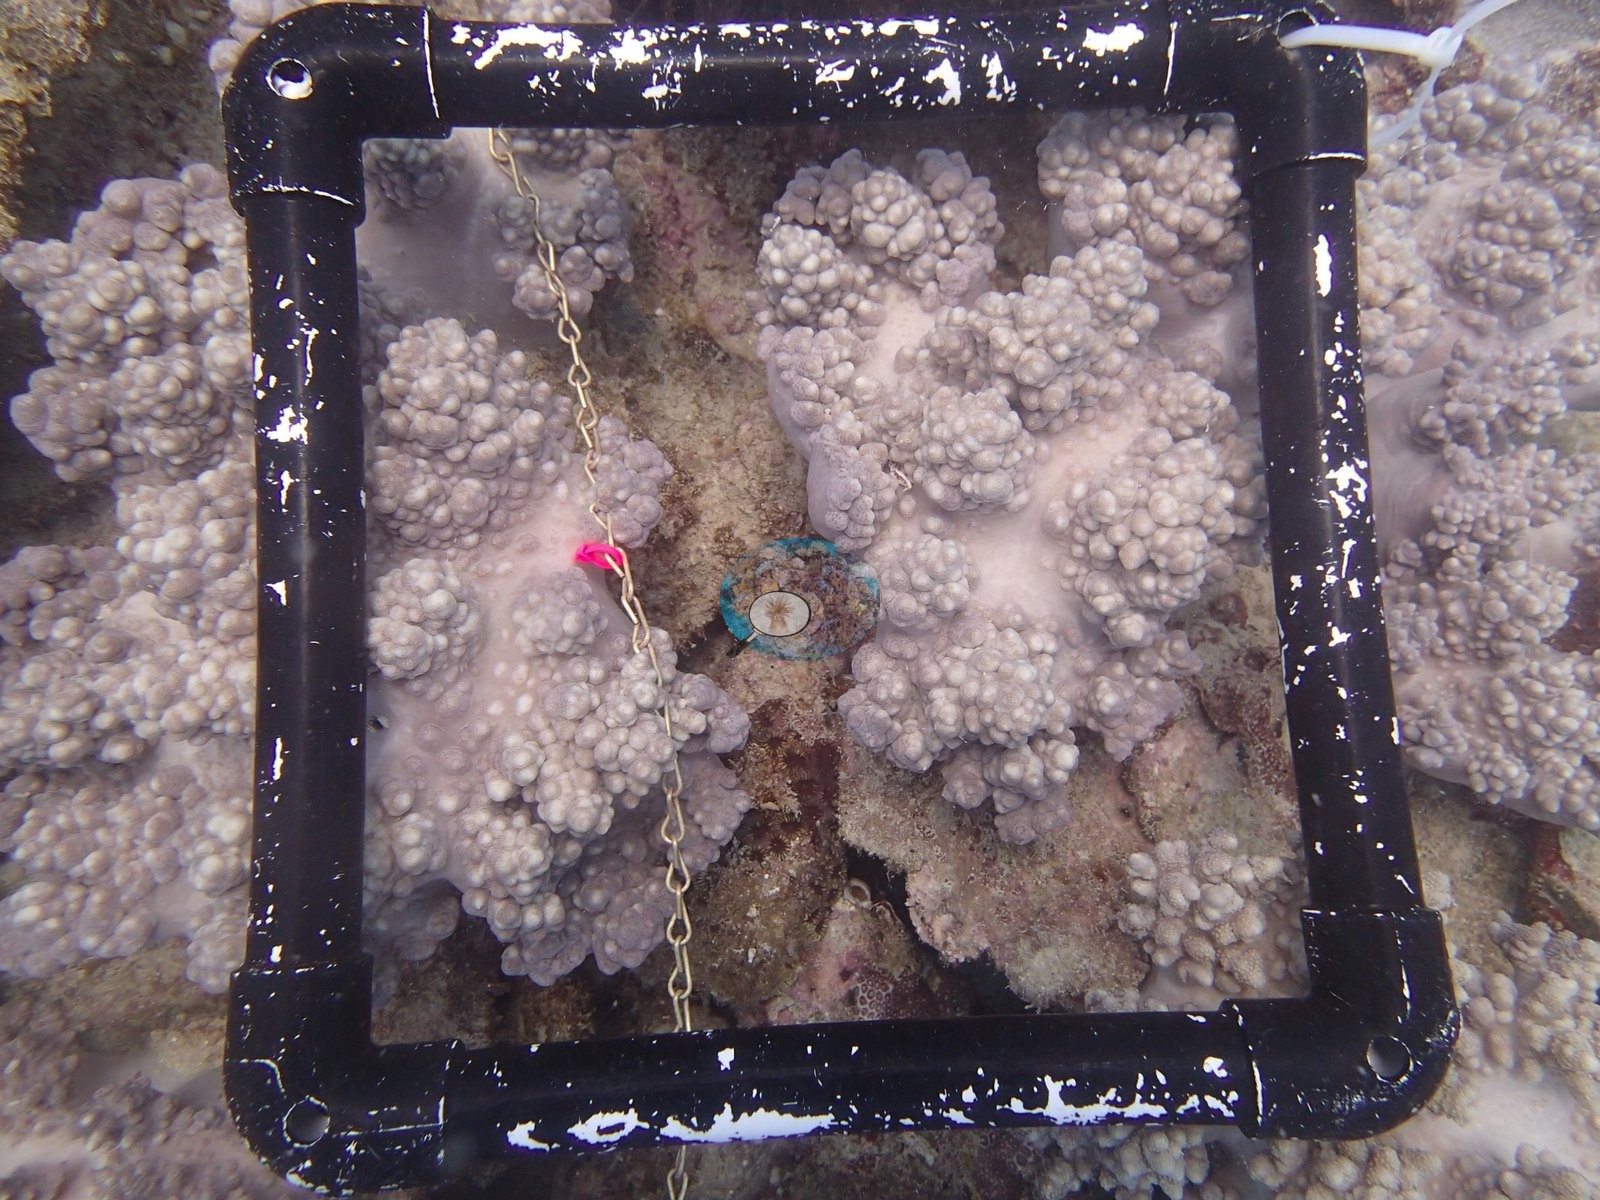
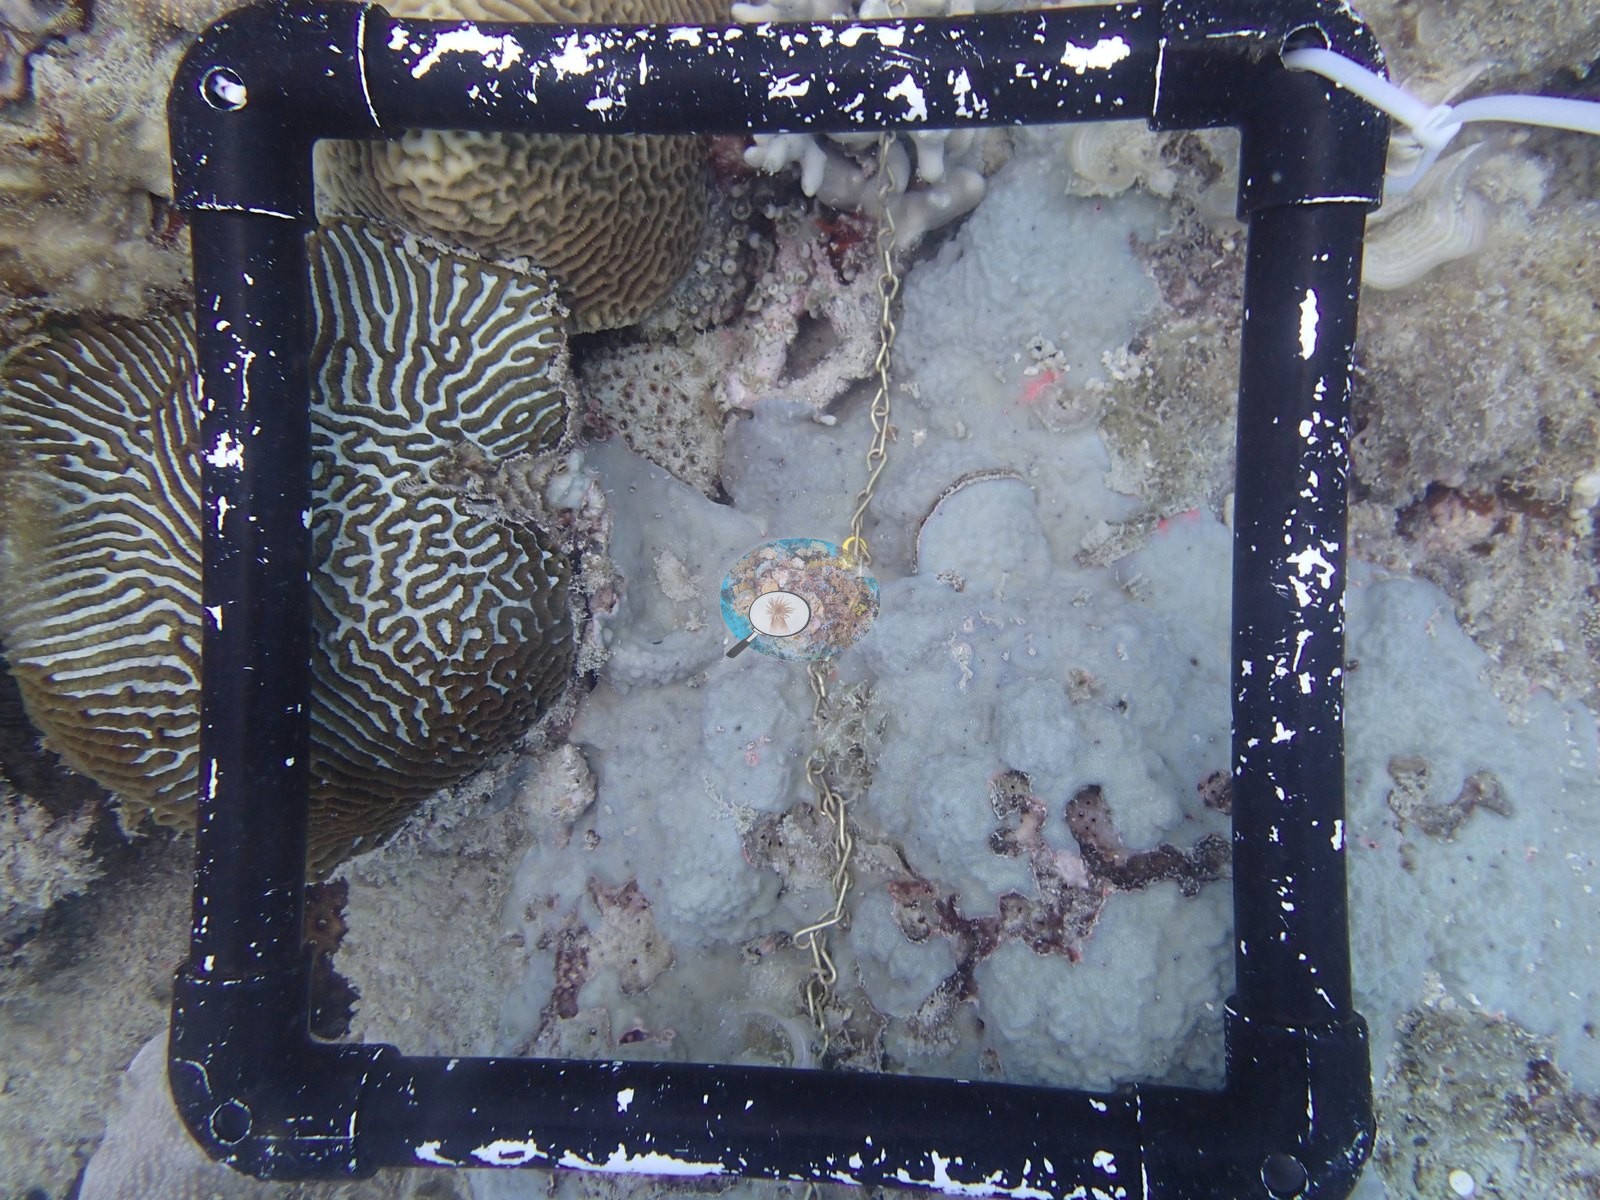
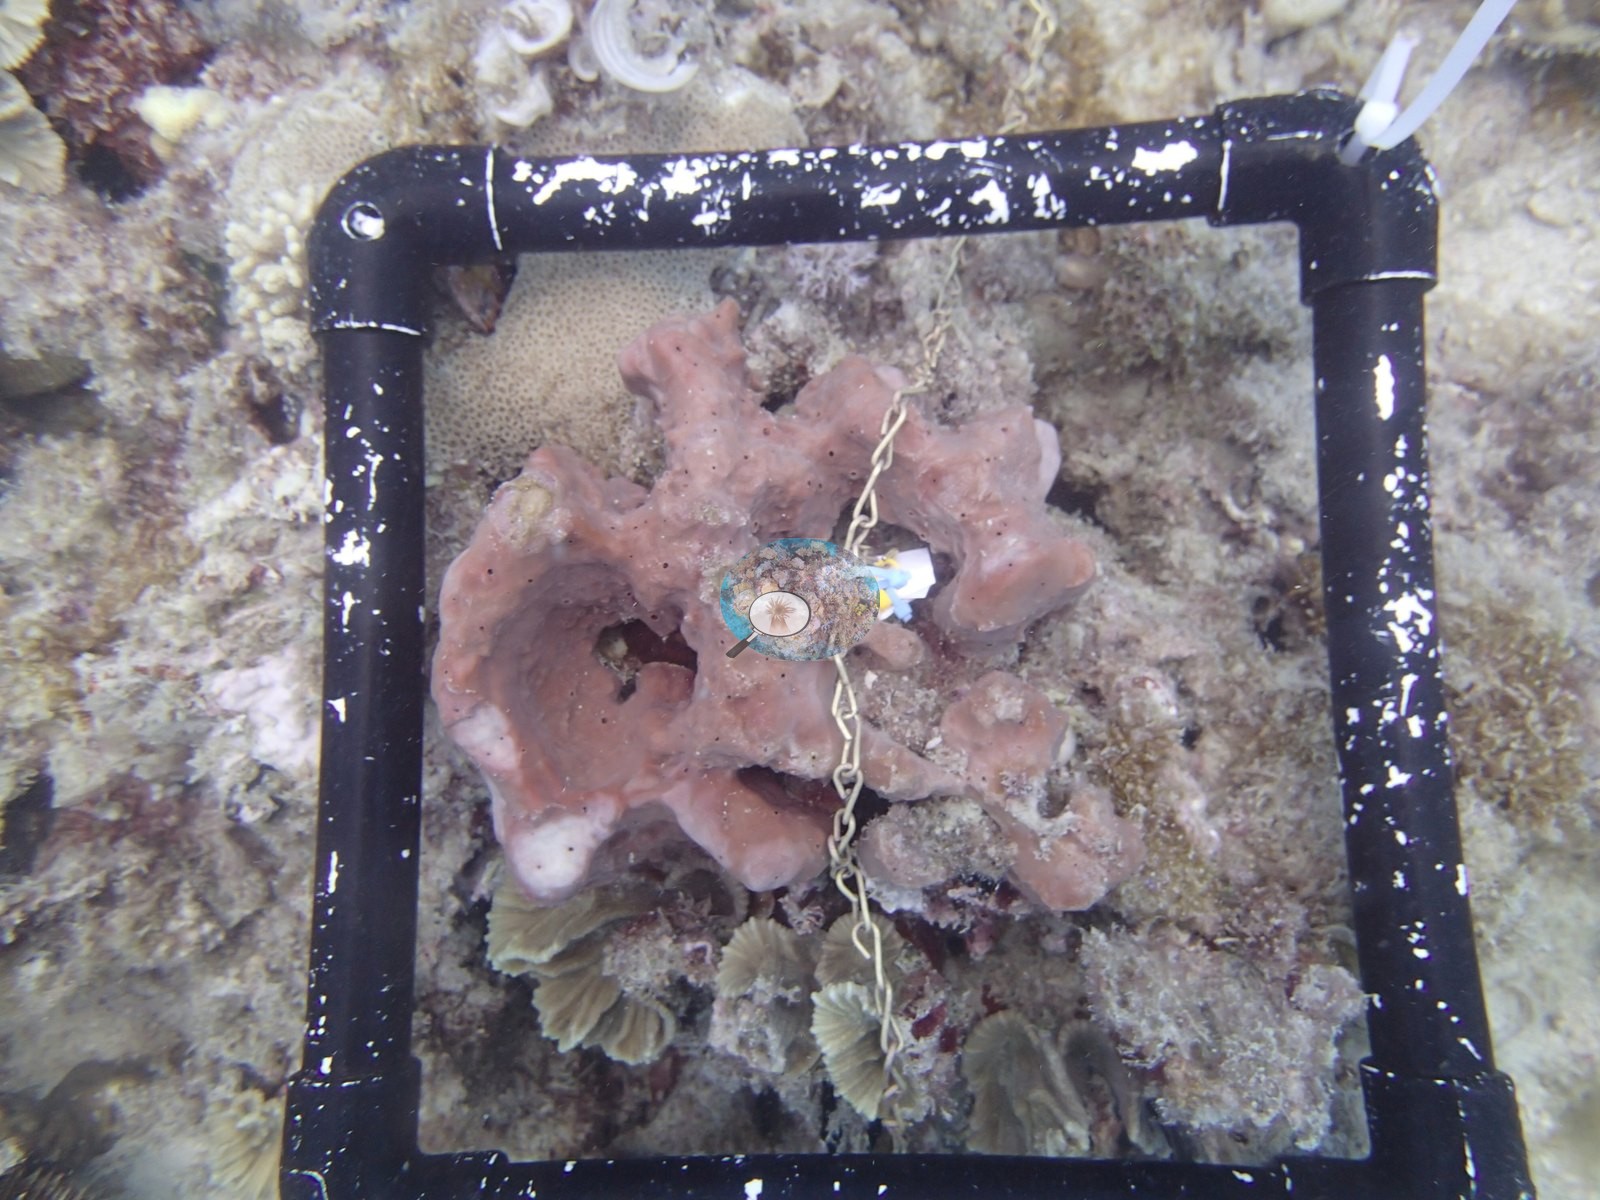
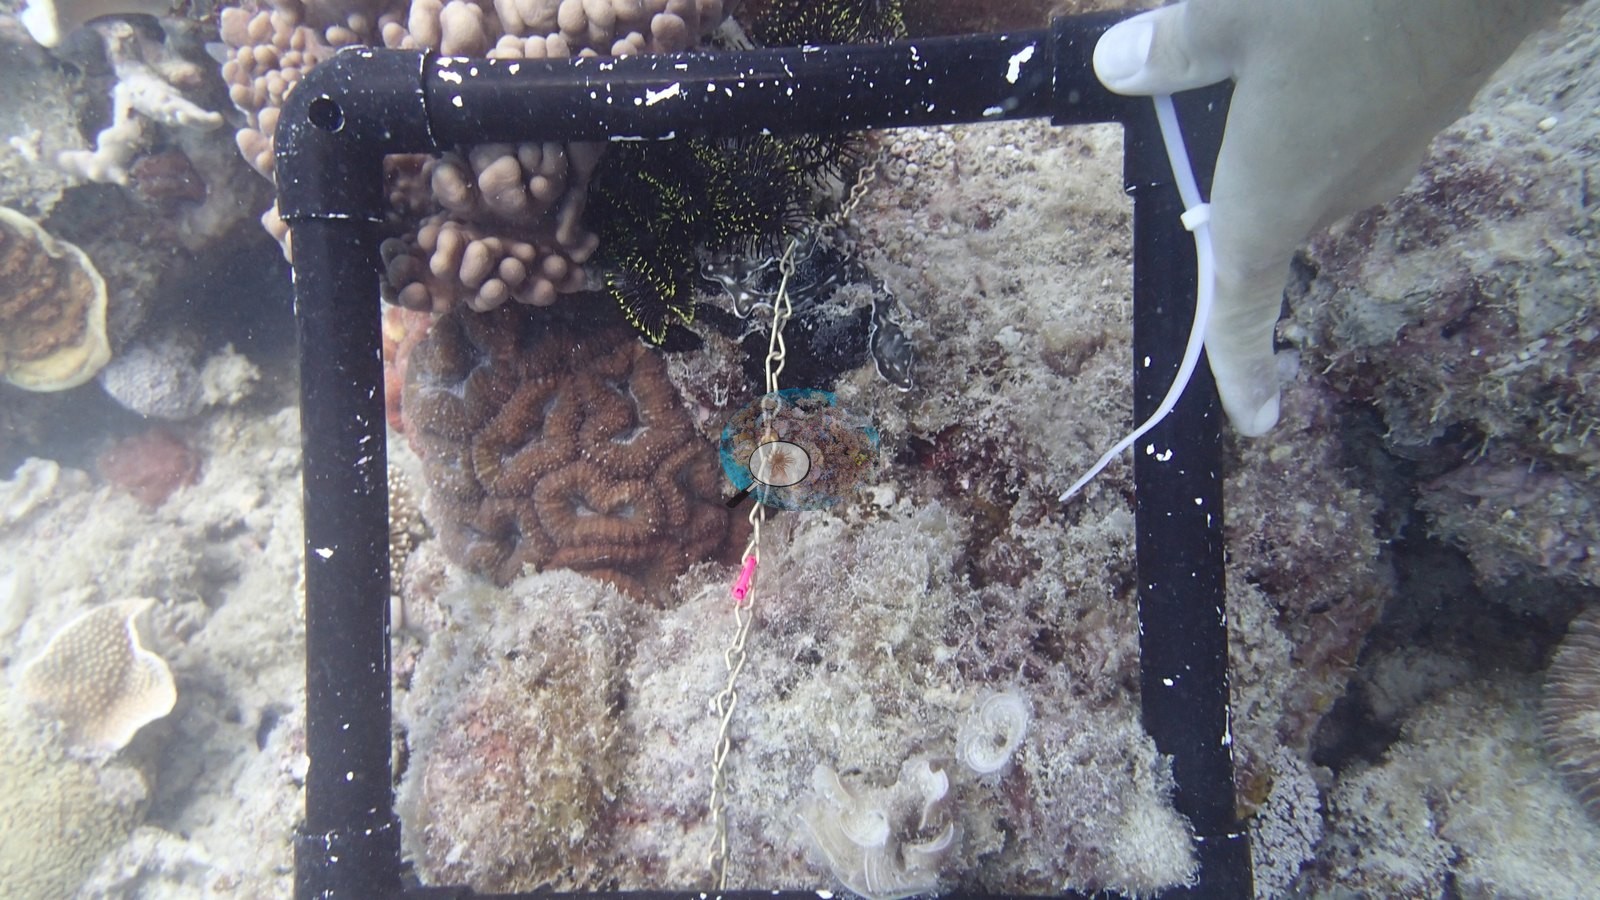
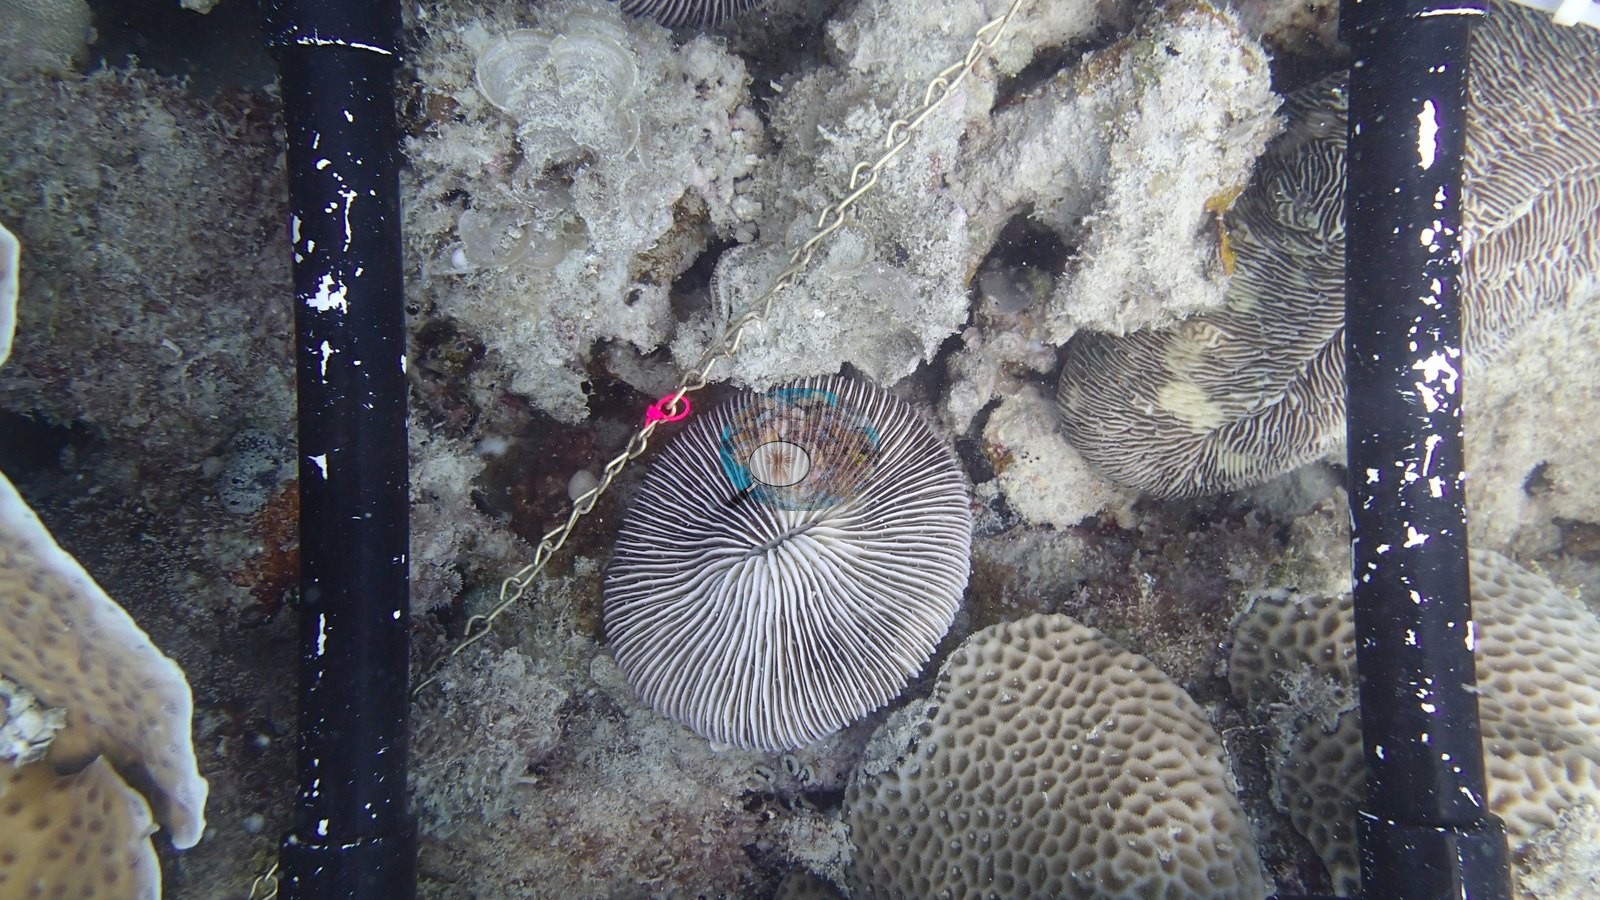
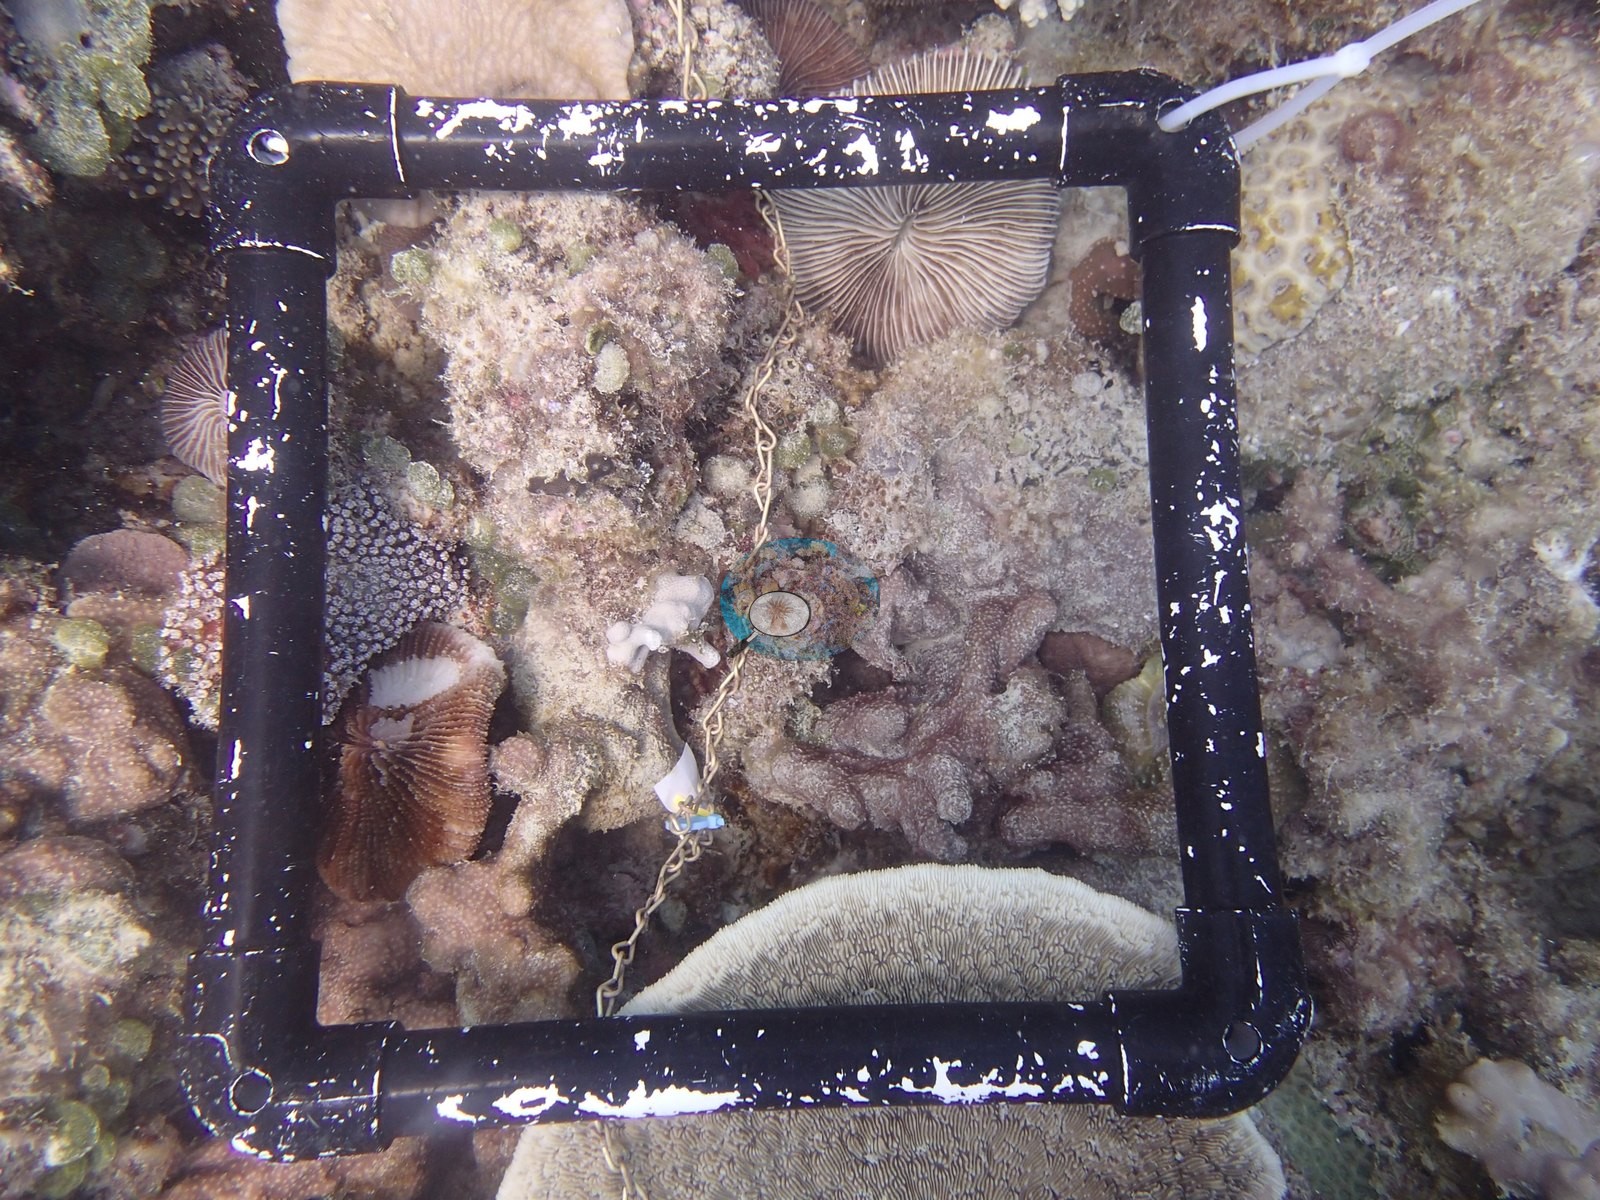
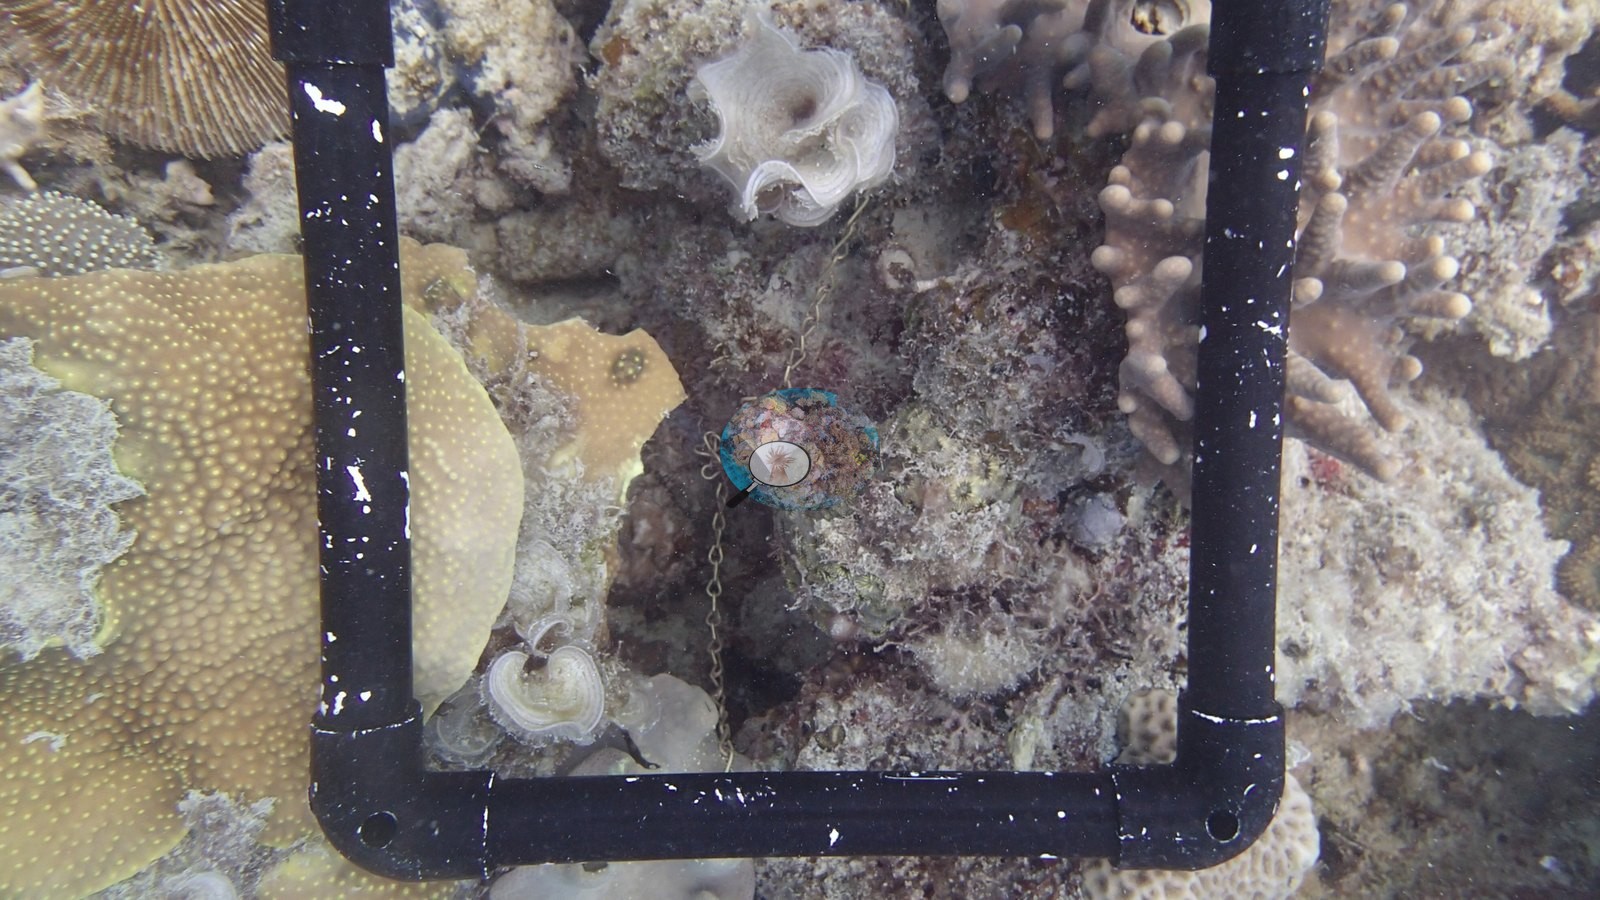
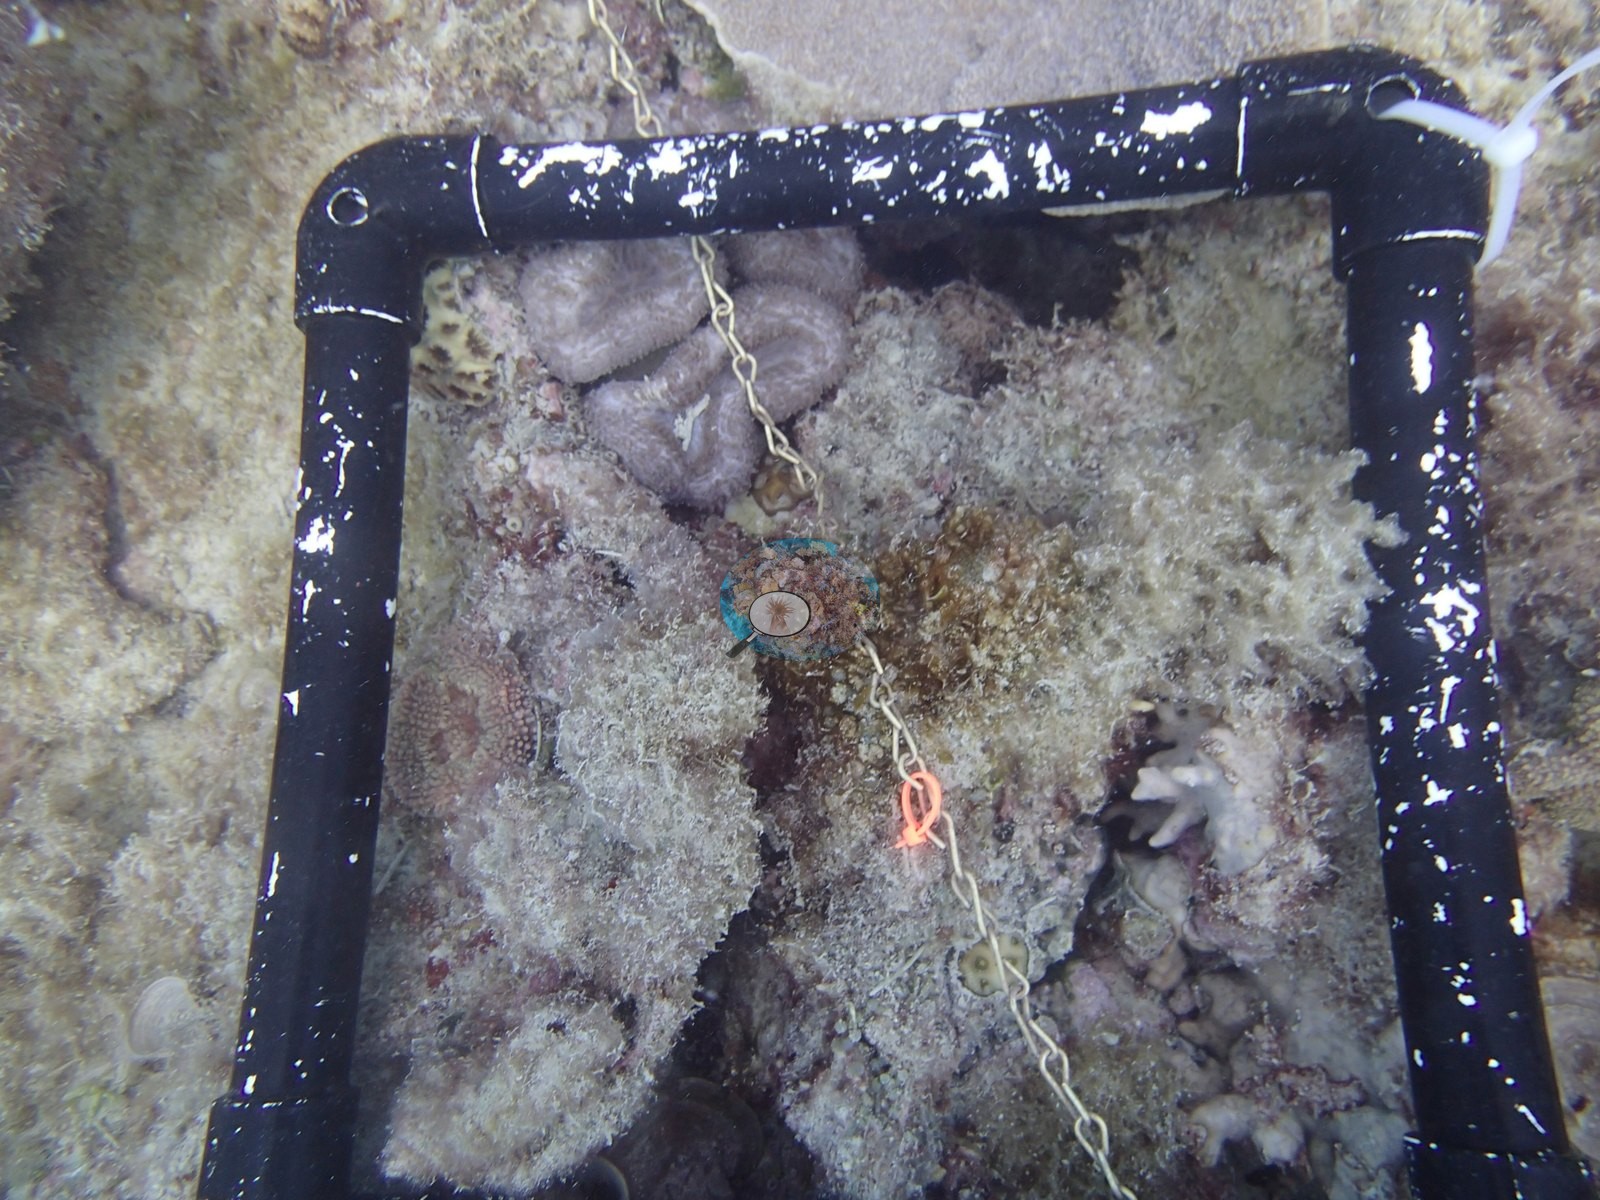
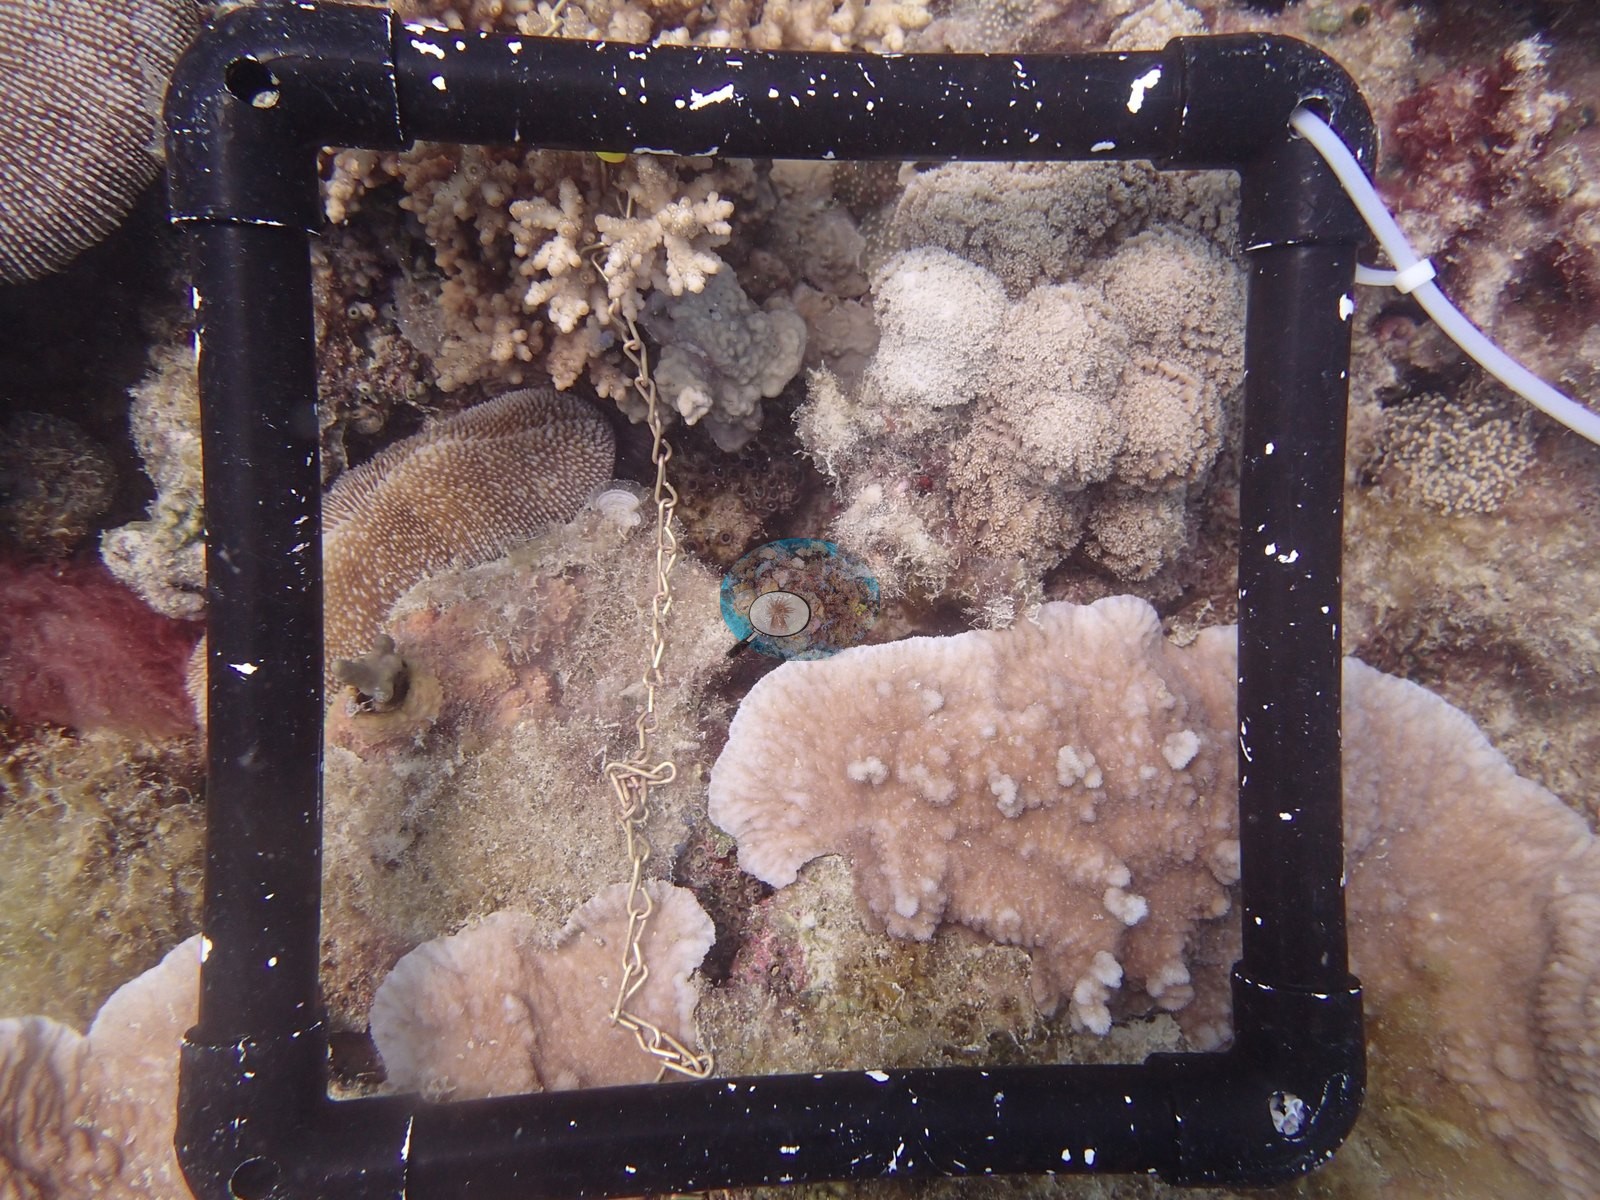
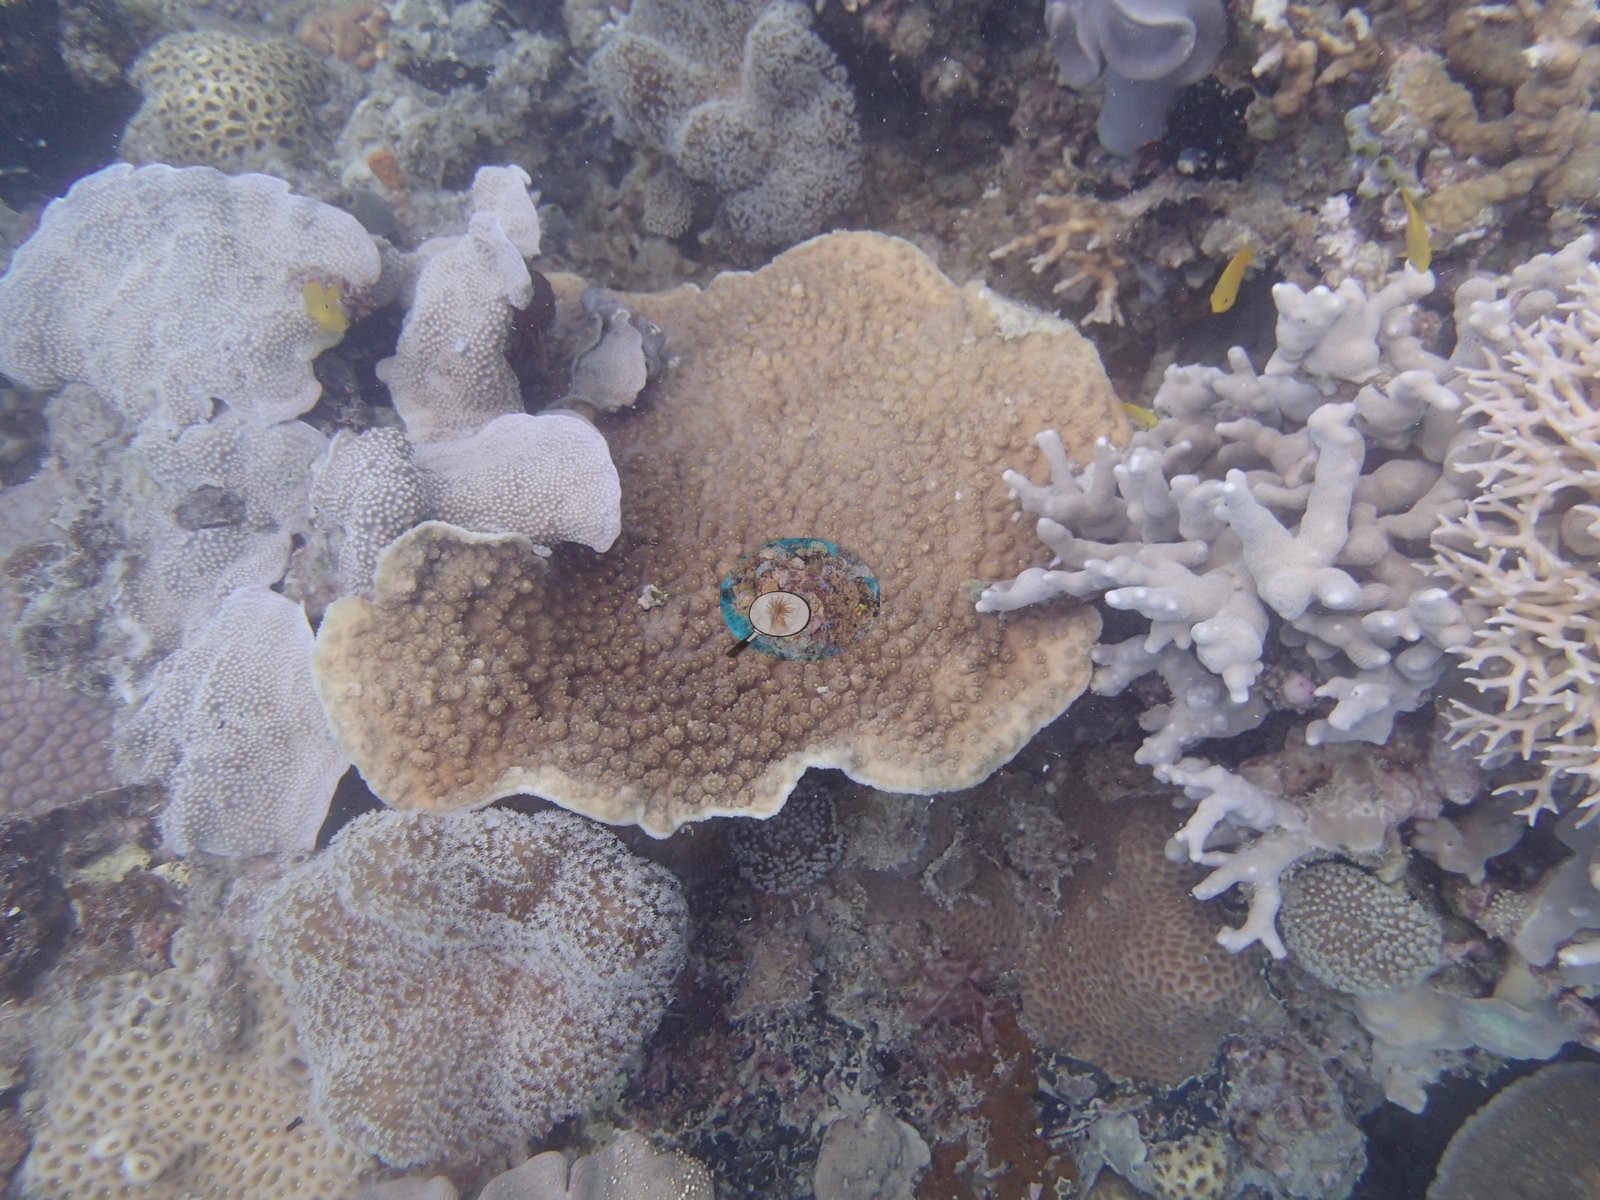
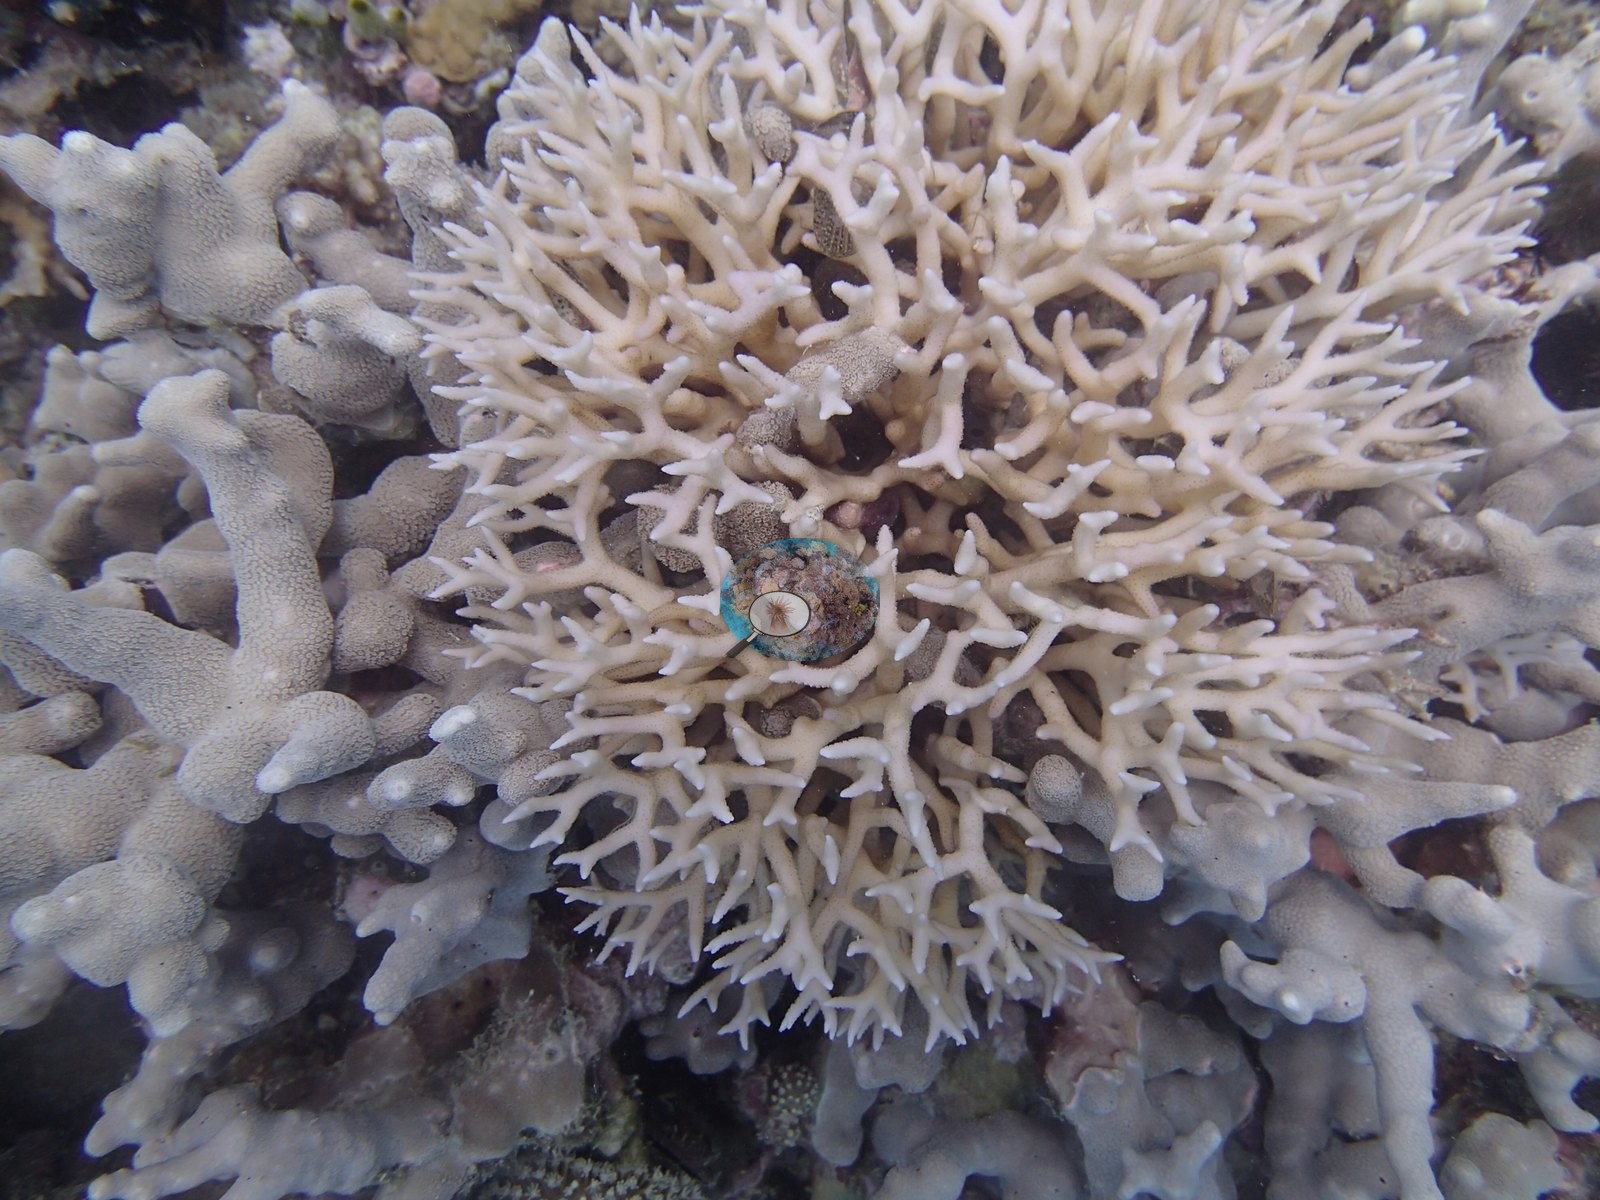
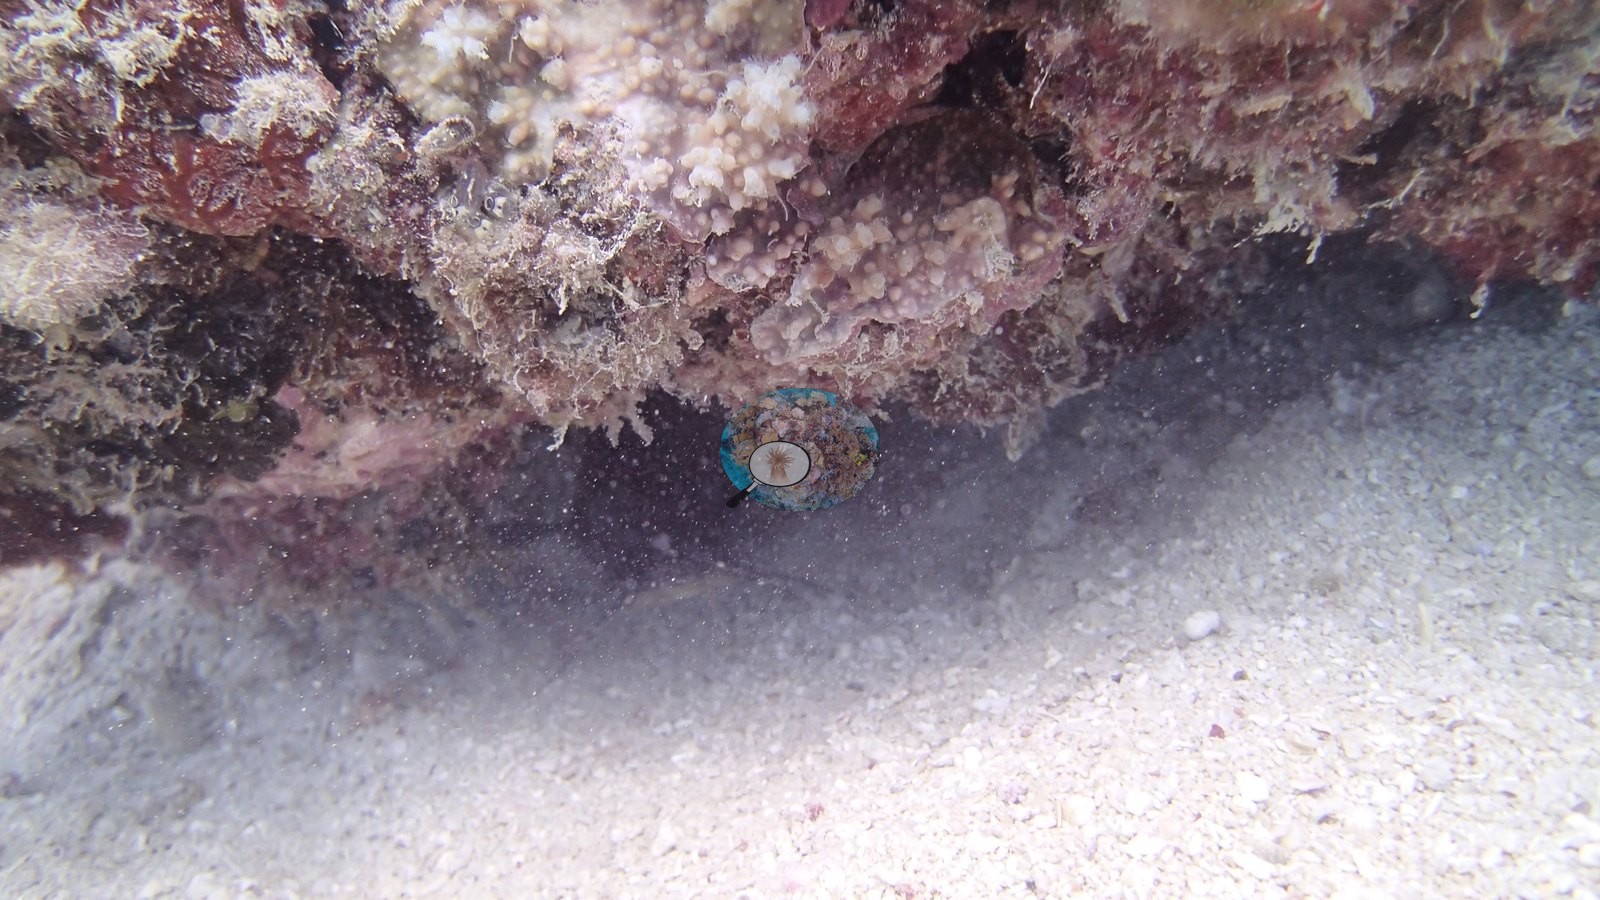
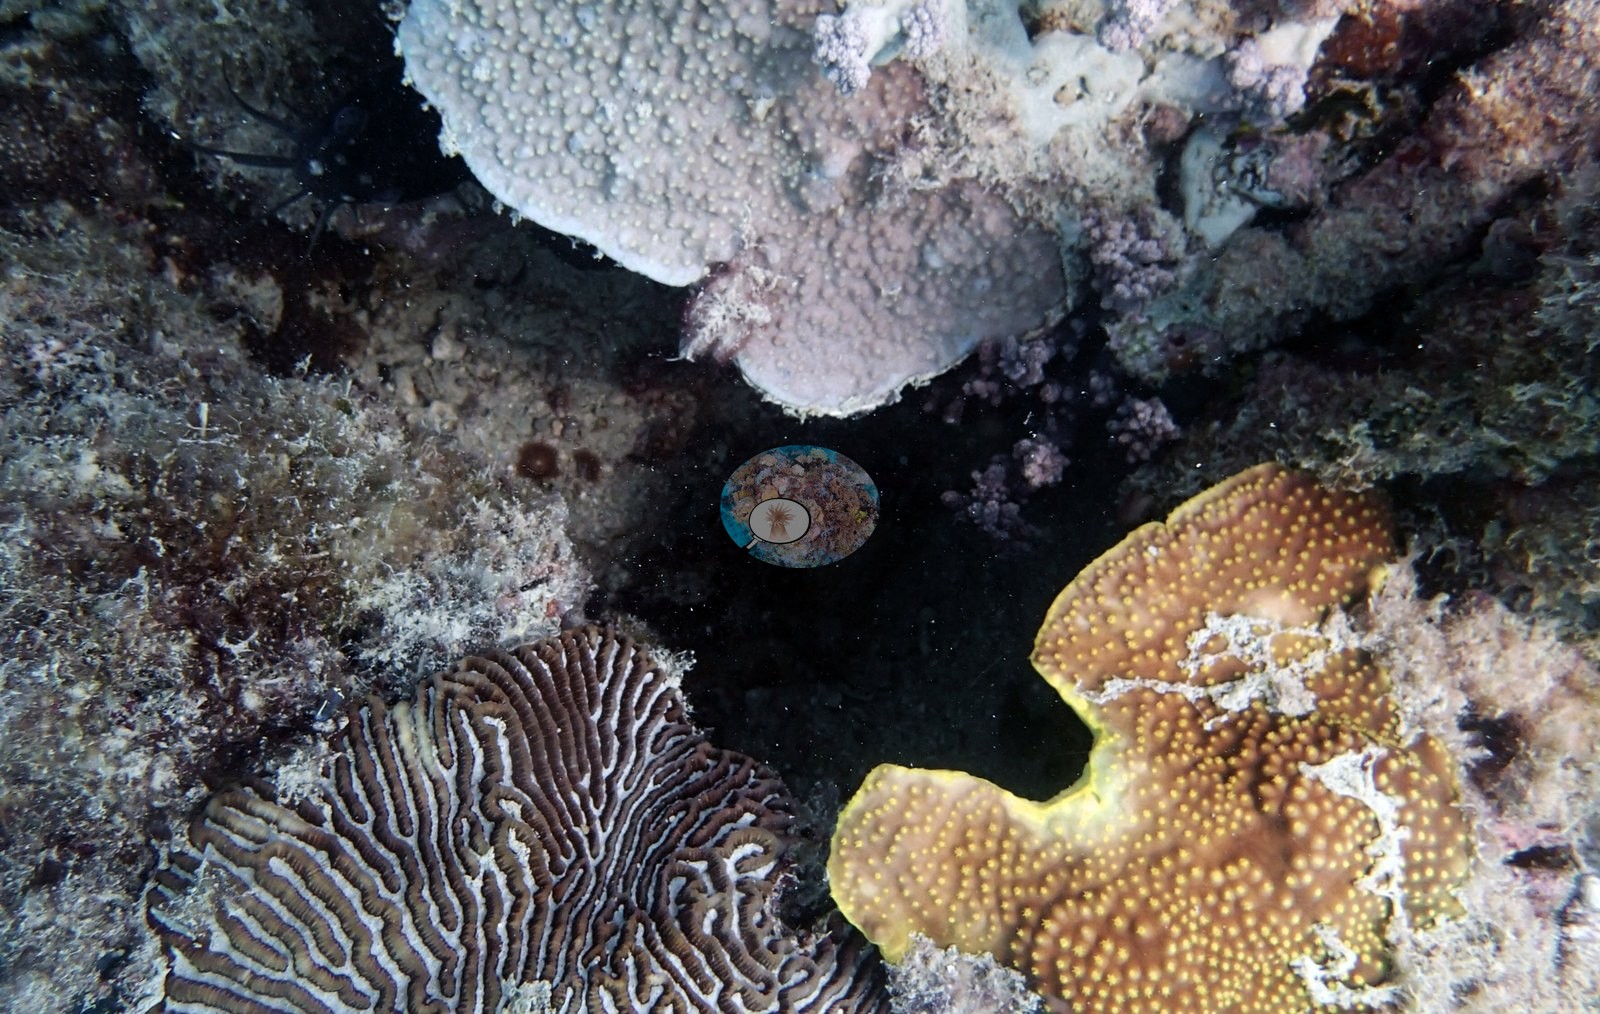
The notes describe a proper slope carrying down to a sandy, cyanobacteria-streaked bottom around 13 m, with the shallow 5-6 m crest holding most of the coral — dense Porites cylindrica and massive Porites, plus Turbinaria, Seriatopora hystrix, Lobophyllia, and Stylophora pistillata. Anderson's own transects at 9-11 m ranged by eye from bare hard bottom to about 40% live coral, with richer patches of fungids, Heliofungia, Galaxea, Echinopora, and plating Montipora and Paraclavarina. Millepora fire coral was the most common hard-coral genus on this station's transects (8.0% of the benthos), followed by Porites (7.0%), Pavona and Stylophora (3.0% each), and Diploastrea (2.0%); bare substrate covered 34%, the largest non-coral class. Among the algal classes on this station's transects, crustose coralline algae (22%) led, followed by turf (13%).
Coral cover
- Reference: Khaled bin Sultan Living Oceans Foundation, Global Reef Expedition (in situ transect)
- The expedition's in situ point-count transects at this station recorded 23% live coral cover against 35% total algal cover.
- One transect was scored at this station (23%; n = 1, so no SE; Living Oceans Foundation per-transect benthic data); it is the expedition's station value printed above.
Stressors
Below the coral slope, Anderson's notes record cyanobacterial overgrowth as mats across the 12-14 m sand. No bleaching, disease, or crown-of-thorns starfish were recorded. Regional context, not an observation here: surveyed about eighteen months before the 2016 mass bleaching, an event that severely bleached hundreds of reefs on the northern Great Barrier Reef (Hughes et al. 2017); 5-year mean annual maximum thermal stress at the Far Northern GBR virtual station is 11.1 degree heating weeks.
Fish and other fauna
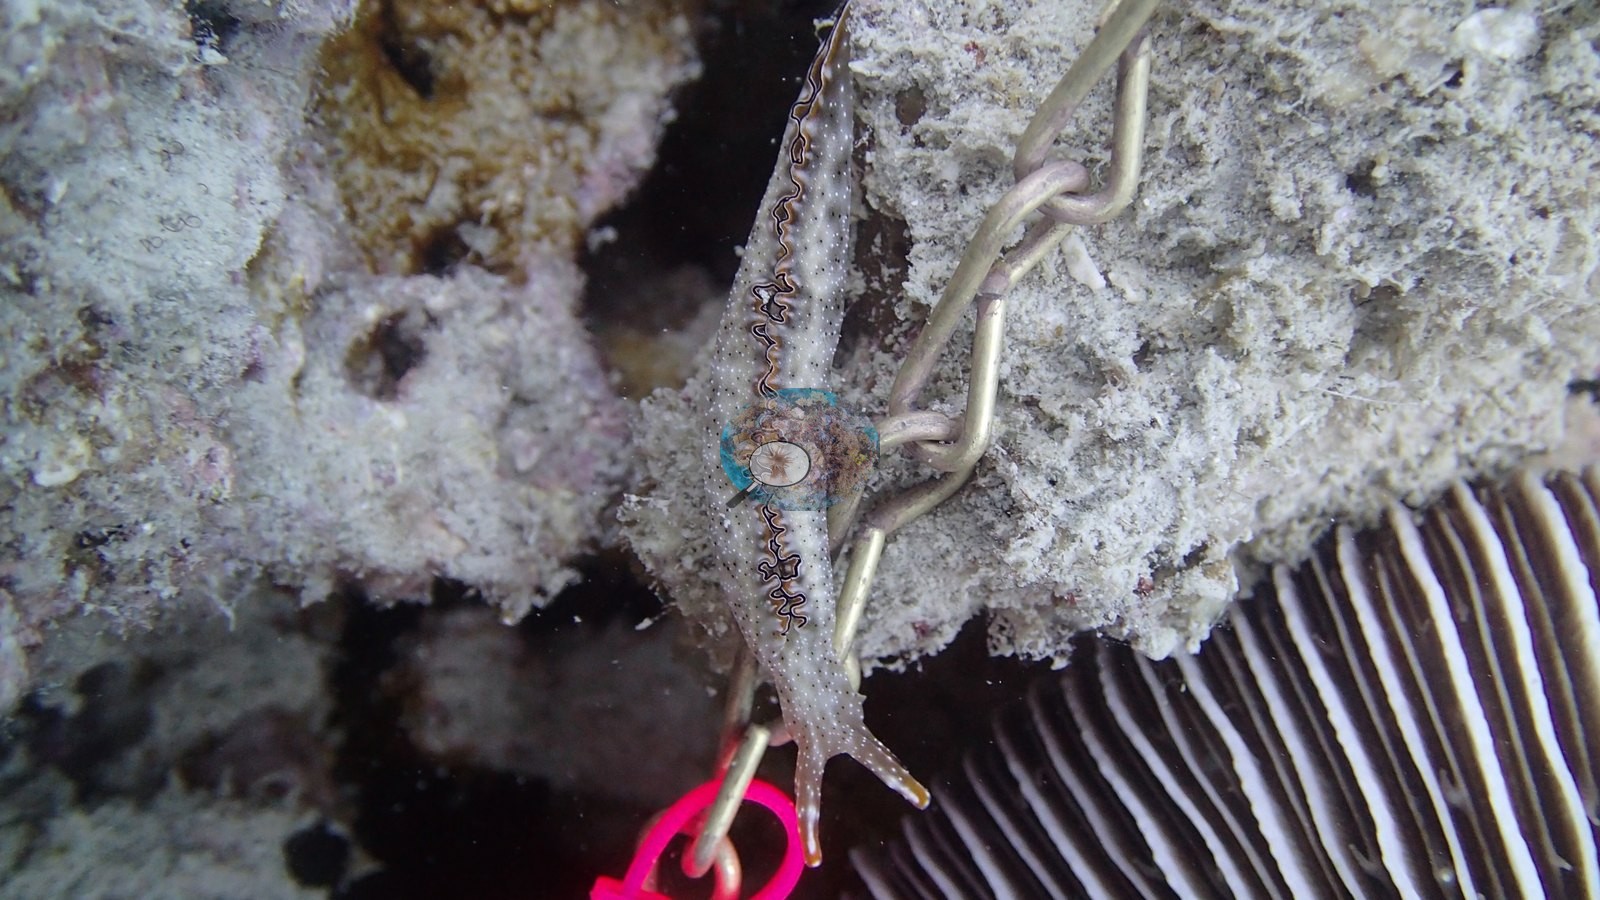
Two eel catfish and a stingray were logged.
Comparisons with other data
No prior survey data from this site. If you would like to share yours, please email us.
Nearby citizen-science imagery within 2 km (not a survey of this site, and not total coral cover):
- Great Reef Census (citizen science, AI + volunteer image analysis): branching Acropora 2.2%, plating Acropora 0.7%, massive corals 4.8% of colonizable substrate, 20 images, 2022-11-19, 1.40 km.
The Great Reef Census scores three coral shapes only, so every other coral is left out, and its denominator is colonizable substrate (sand, water, and shadow excluded): these values are not hard coral cover and should not be added together or compared with the cover figures on this page. The photographs are taken by volunteer snorkelers 3–5 m above the reef. In the program's own validation (Lawson et al. 2025, Environmental Monitoring and Assessment 197:814, doi:10.1007/s10661-025-14261-6, open access), each analysis method on its own differed from expert estimates by up to about 9.5 percentage points on average for these coral types (AI alone: plating Acropora −9.1 points; AI plus volunteers: branching Acropora +9.5 points); the program's “~99% accurate” figure is the average over about 8,000 images after choosing the better method for each coral type, and site values from fewer images carry more error. Sites with fewer than 40 images have fewer images than the 40–80 the method needs to estimate site-level values to within 5 percentage points. Source: Great Reef Census / Citizens of the Great Barrier Reef; Lawson et al. 2026, Limnology & Oceanography Letters, doi:10.1002/lol2.70168 (data CC BY-NC 4.0, doi:10.7910/DVN/KCULSD).
Data & links
- Download benthic survey data (CSV) ↗
- Download all LOF-GRE data (933 sites) ↗
- Photo portfolio ↗
- Coral Reef Diagnostics country page ↗
All images from Coral Reef Diagnostics. Data are from the Khaled bin Sultan Living Oceans Foundation Global Reef Expedition and Coral Reef Diagnostics.
 © Coral Reef Diagnostics.