

Part of the regional summaries: Australia (GBR) - Far North: Pink stations (Preservation Zone reefs) and Australia (GBR)
More info
Northern GBR (NOAA CRW virtual station)A bommie-studded sand apron on Carter Reef, where the 15 m transect at the base of the wall held dense plating Leptoseris, stacked into towers a meter or more high. At 20 m the reef breaks into a sand apron where bommies covered only about a quarter of a 50 m line, though recruitment was strong and no bleaching, disease, or crown-of-thorns were reported. Surveyed on the Living Oceans Foundation's Global Reef Expedition.
Five independent survey stations shown with the program’s logo — click one to see how far it is from this site.
Four other CRD dive sites within 5 km shown in orange — click a marker to open its page.
🗺 Detailed map of the Global Reef Expedition dive sites, Yonge, Hicks, and Carter Reefs, northern Great Barrier Reef (Khaled bin Sultan Living Oceans Foundation; opens in a new window)
24 of the 32 photographs on this page are shown beside the text that discusses them under "Site description" below.
Site description
Setting
Carter Reef falls within a Preservation (Pink) Zone, with entry restricted and no take permitted.
General benthic features
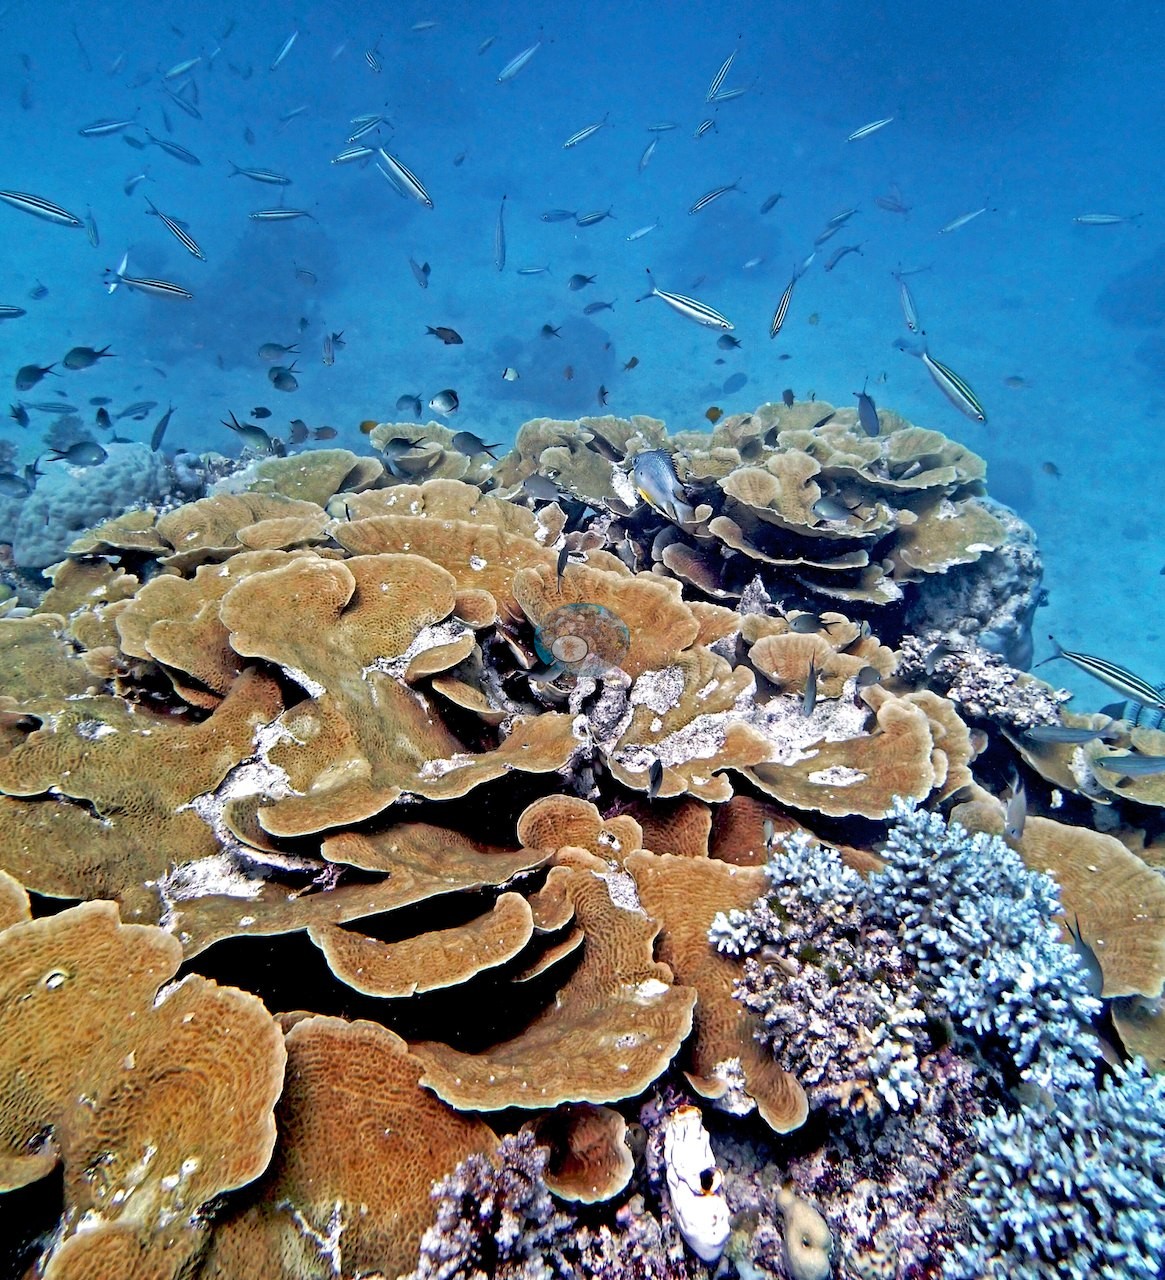
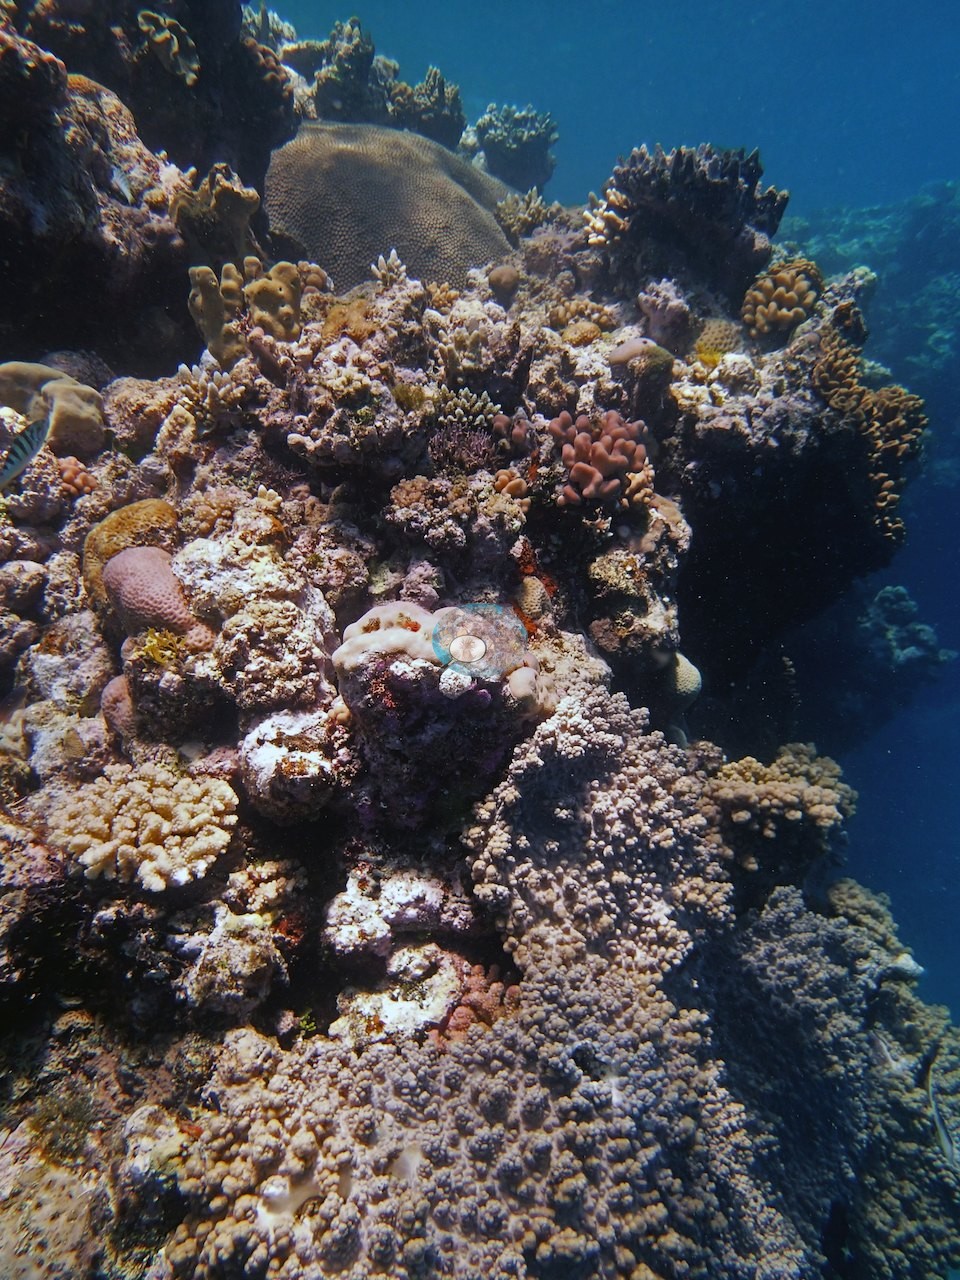
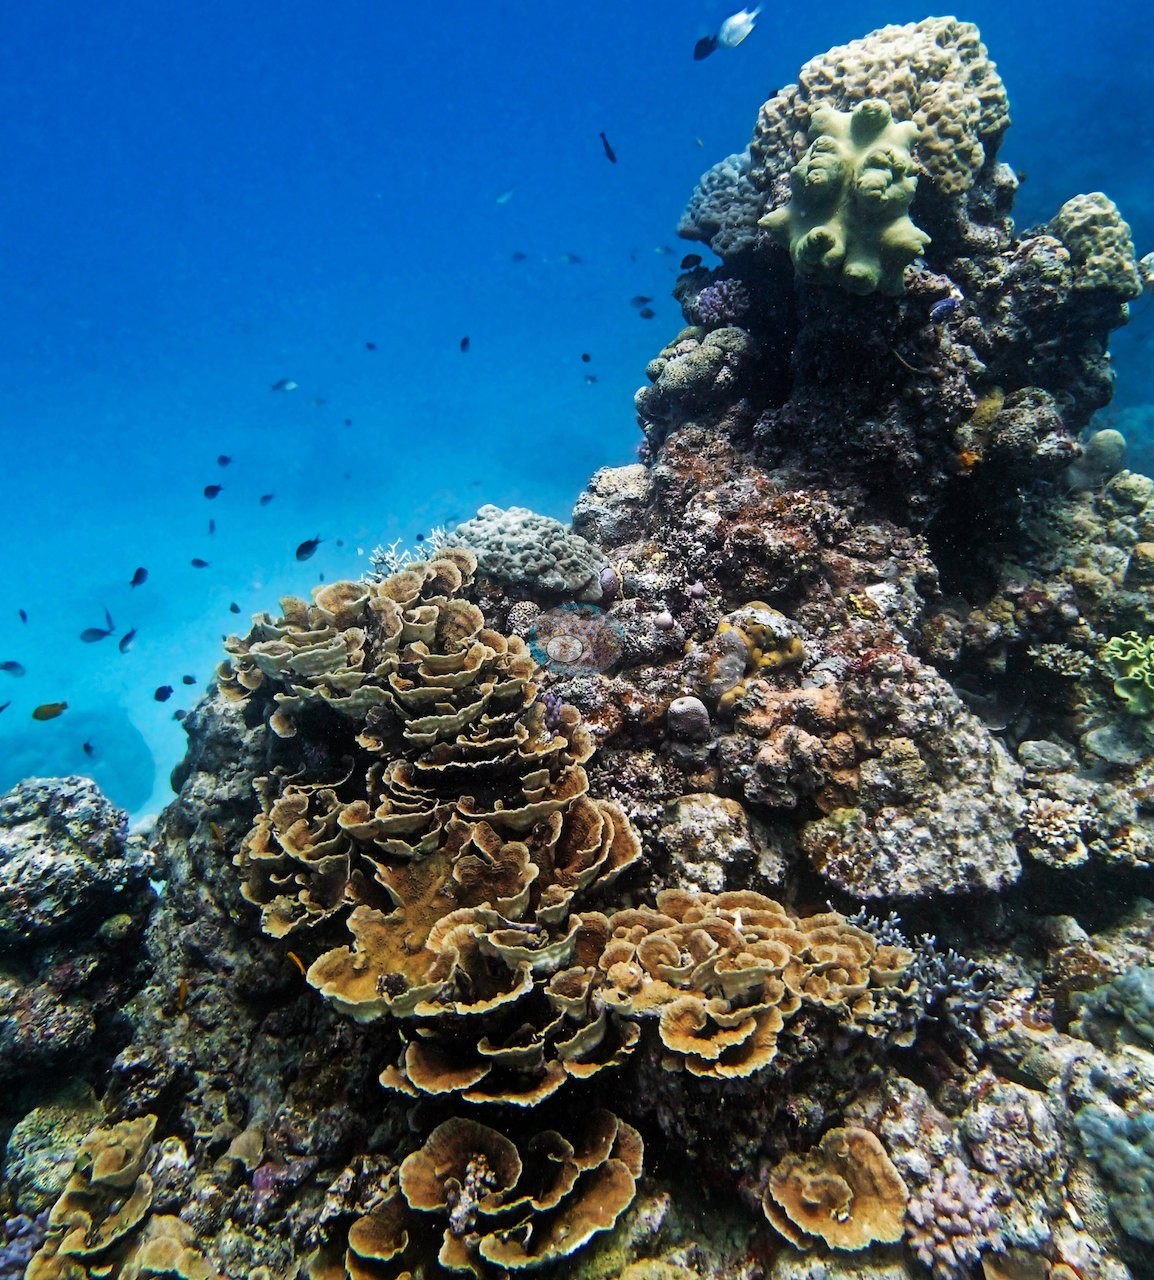
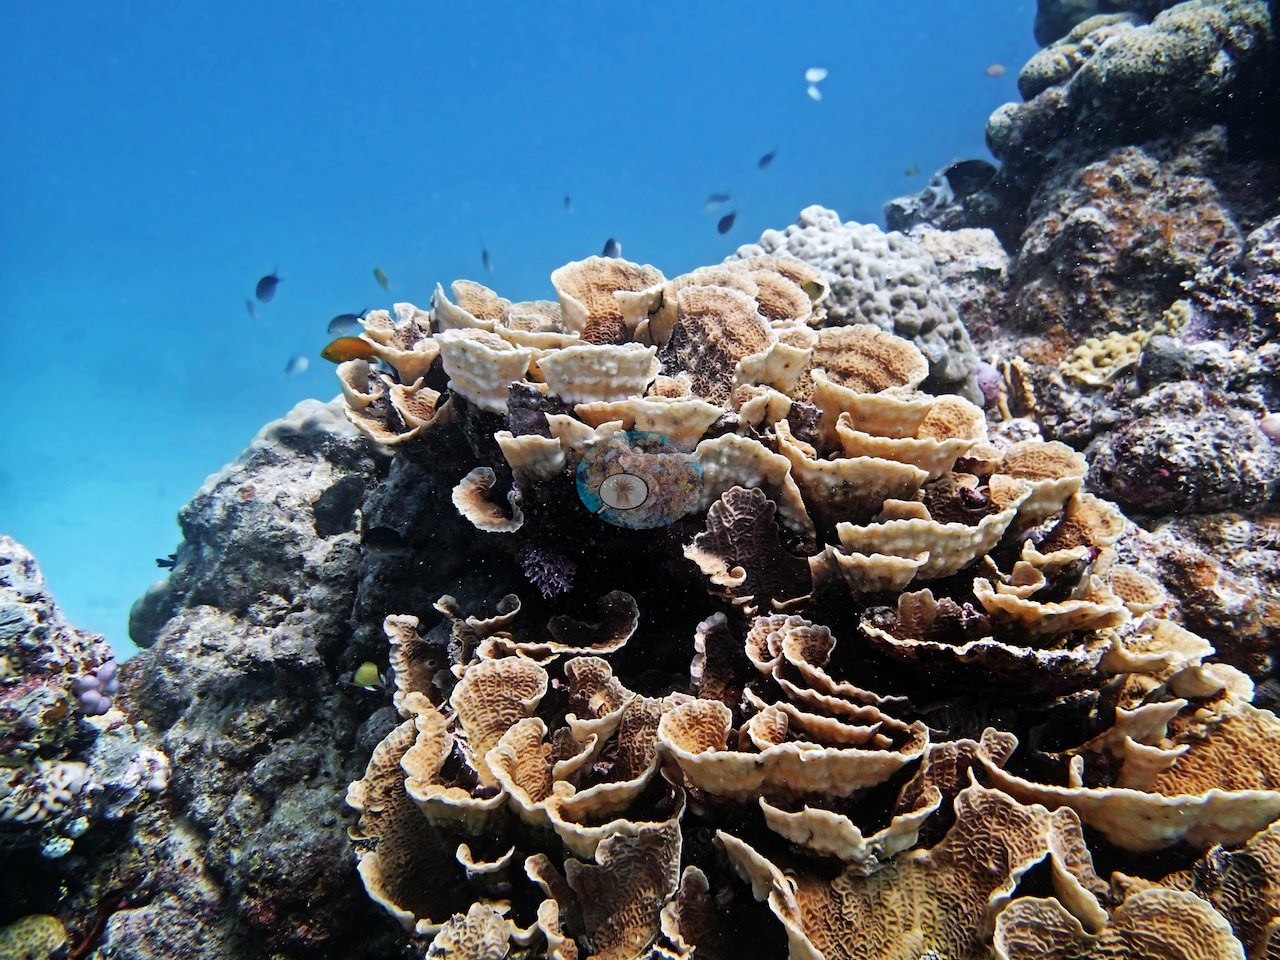
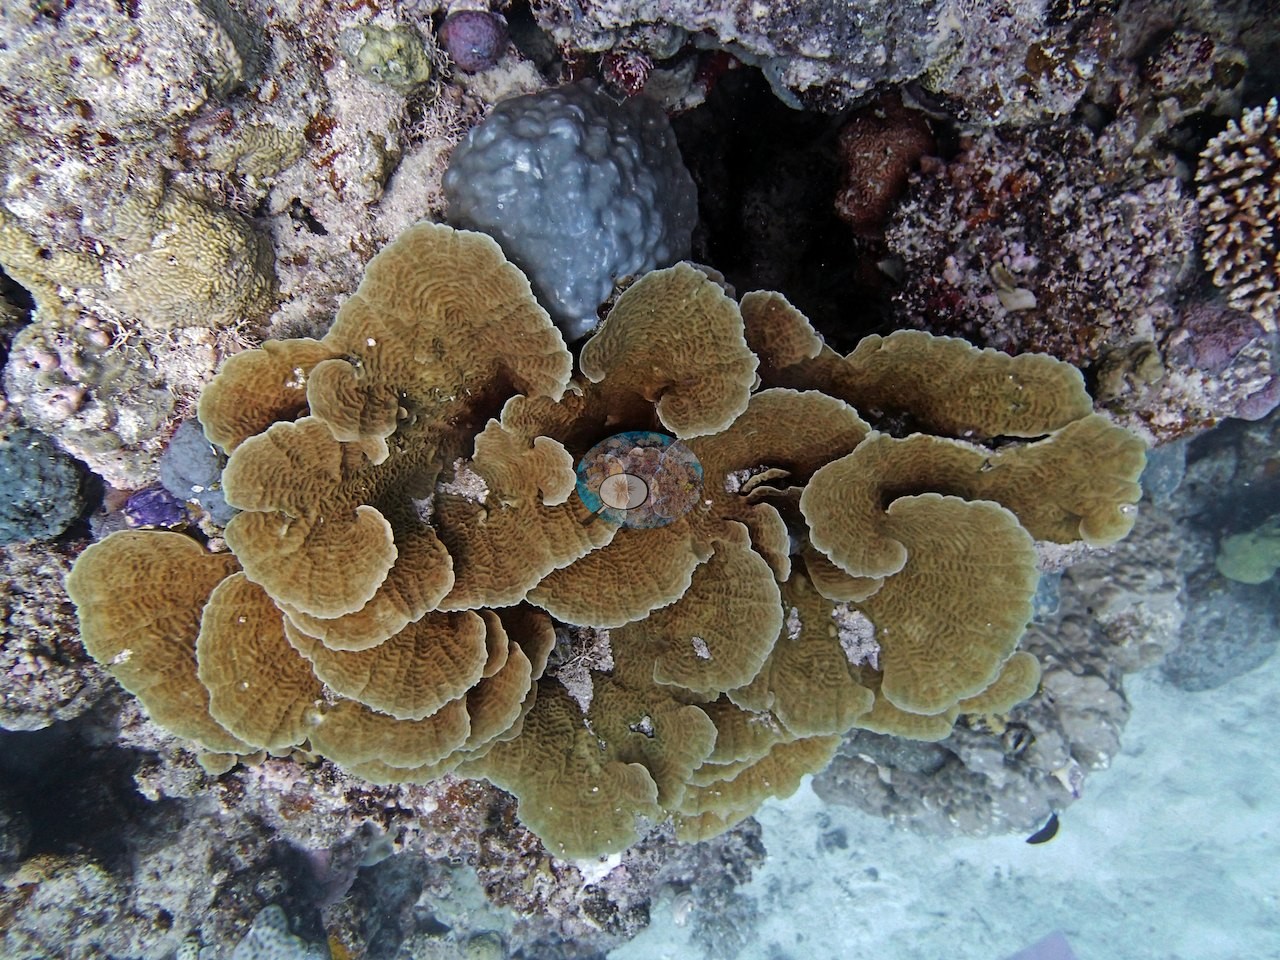
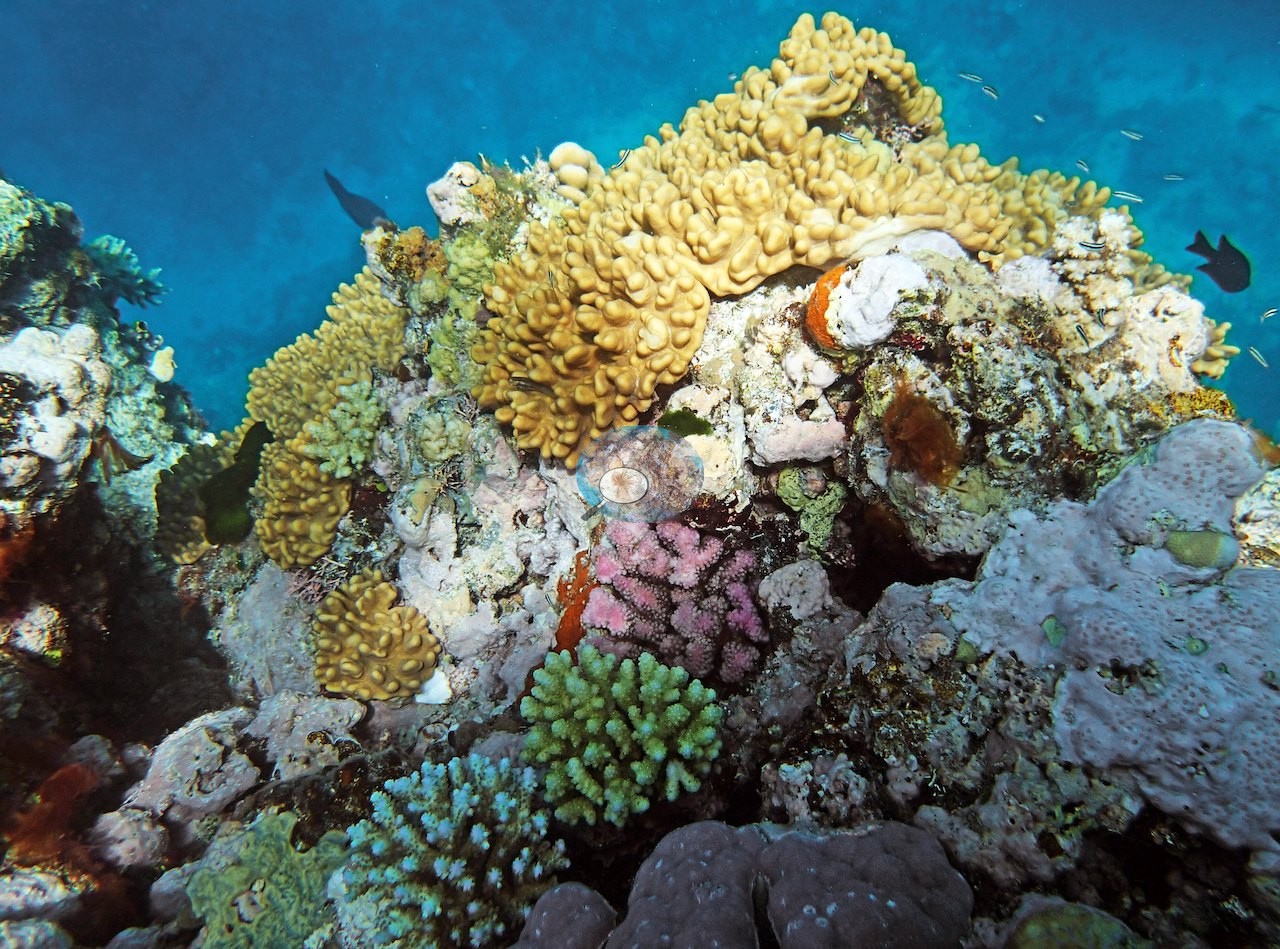
Anderson's second Carter Reef dive, on 11 September 2014, found the reef structured as a bommie-studded sand apron, with the main bommie, where the other divers surveyed, cresting to just 1-1.5 m below the surface and carrying at least 50% cover of dense acroporids, pocilloporids, and encrusting poritids, though soft coral cover was notably high there too. The photographs are strongest on the plating Leptoseris: on the 15 m transect at the base of the wall Anderson logged a high density of these colonies, and several frames show plating colonies of that kind: tier upon tier of overlapping olive and tan plates with cream growing margins, stacked into towers a meter or more high, one crowned by a pale fleshy colony and both hung about with fusiliers and chromis (e.g., Image 1, Image 2); more tiers of tan plates appear in Image 9, Image 26, Image 28.
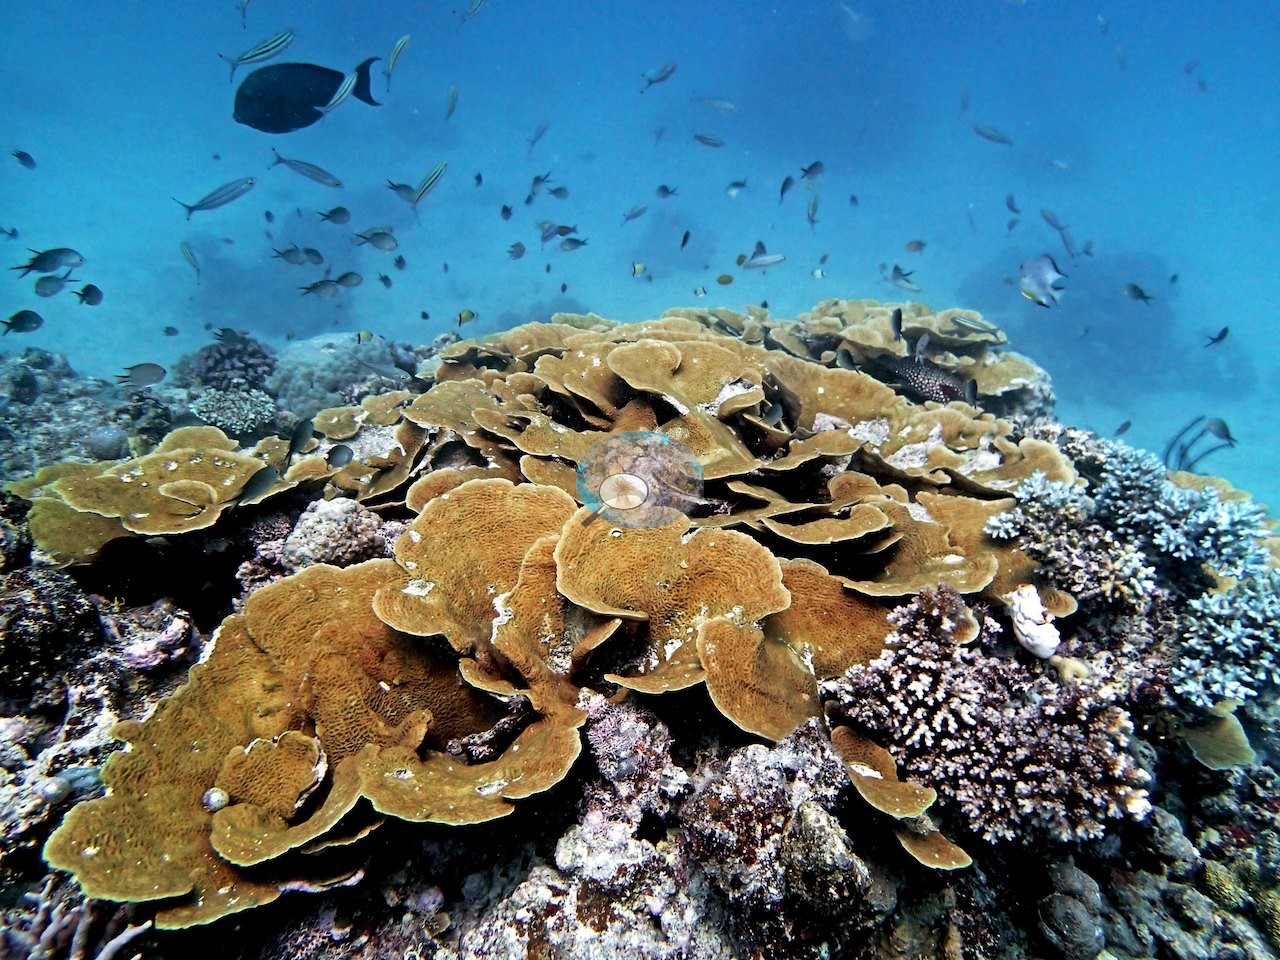
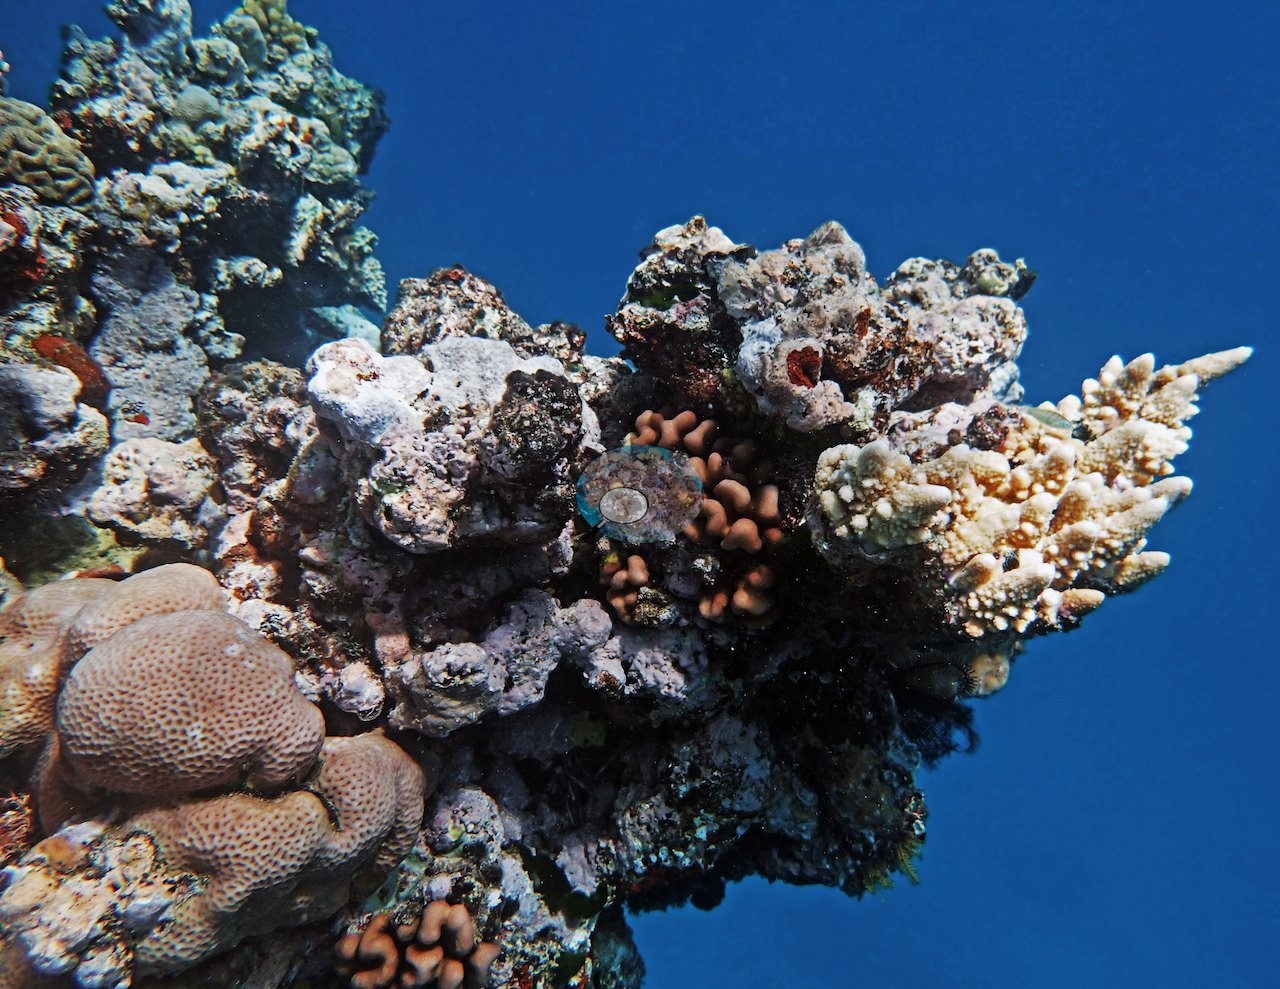
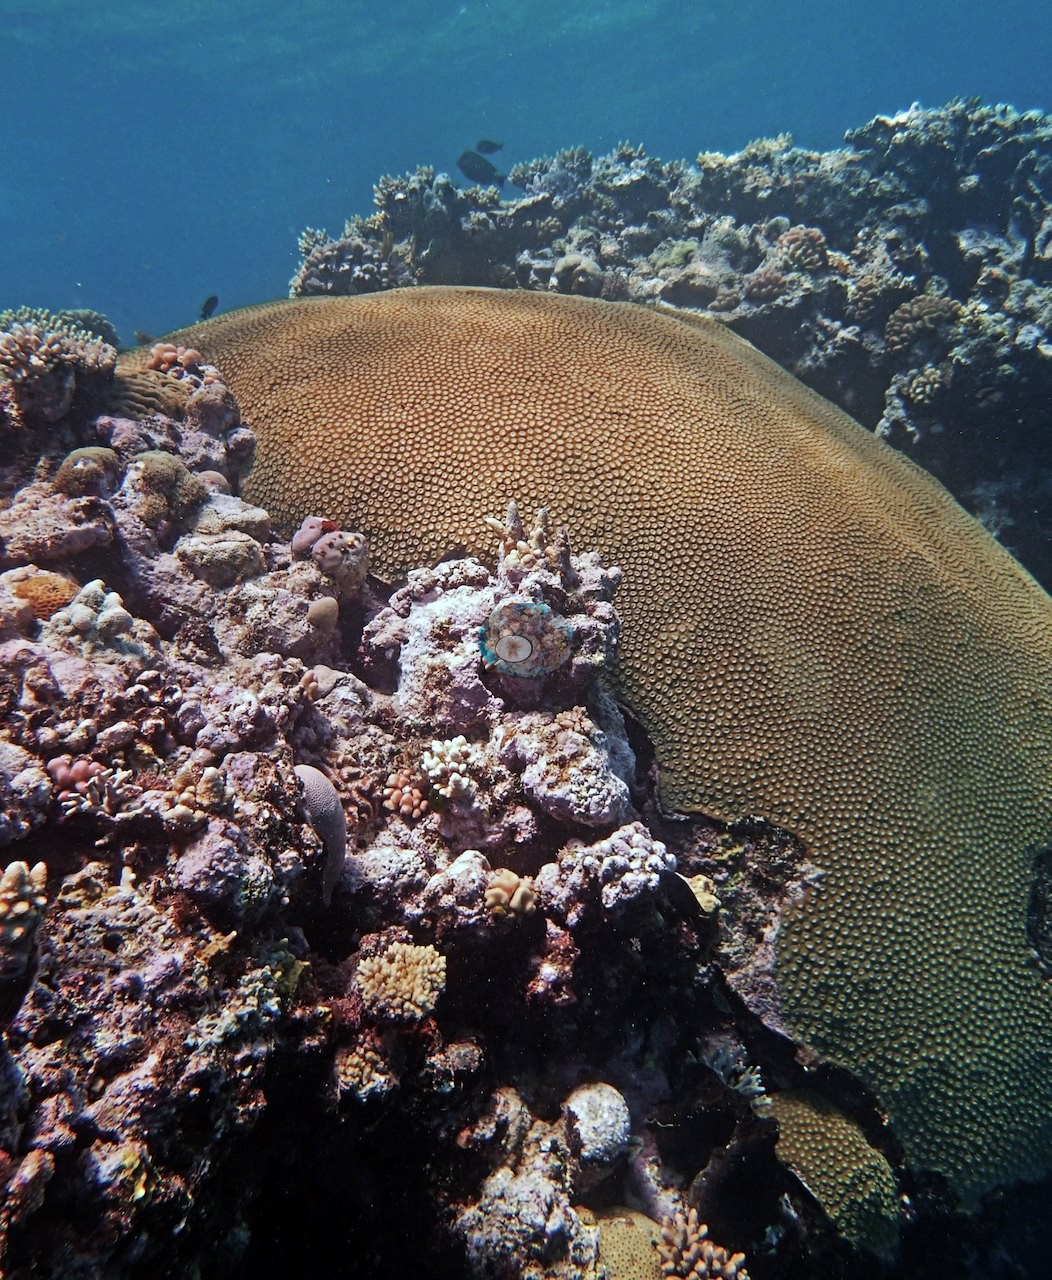
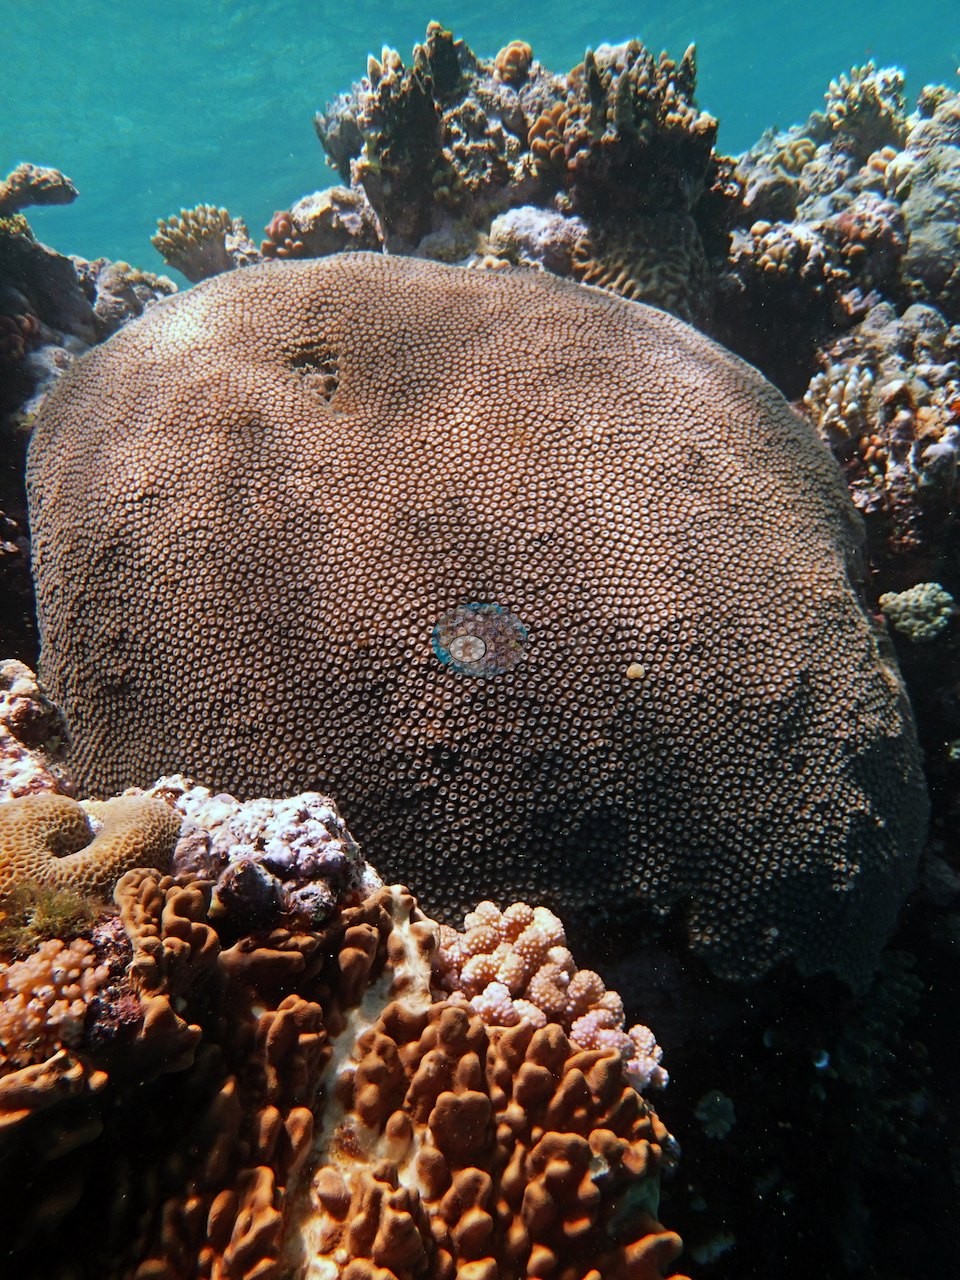
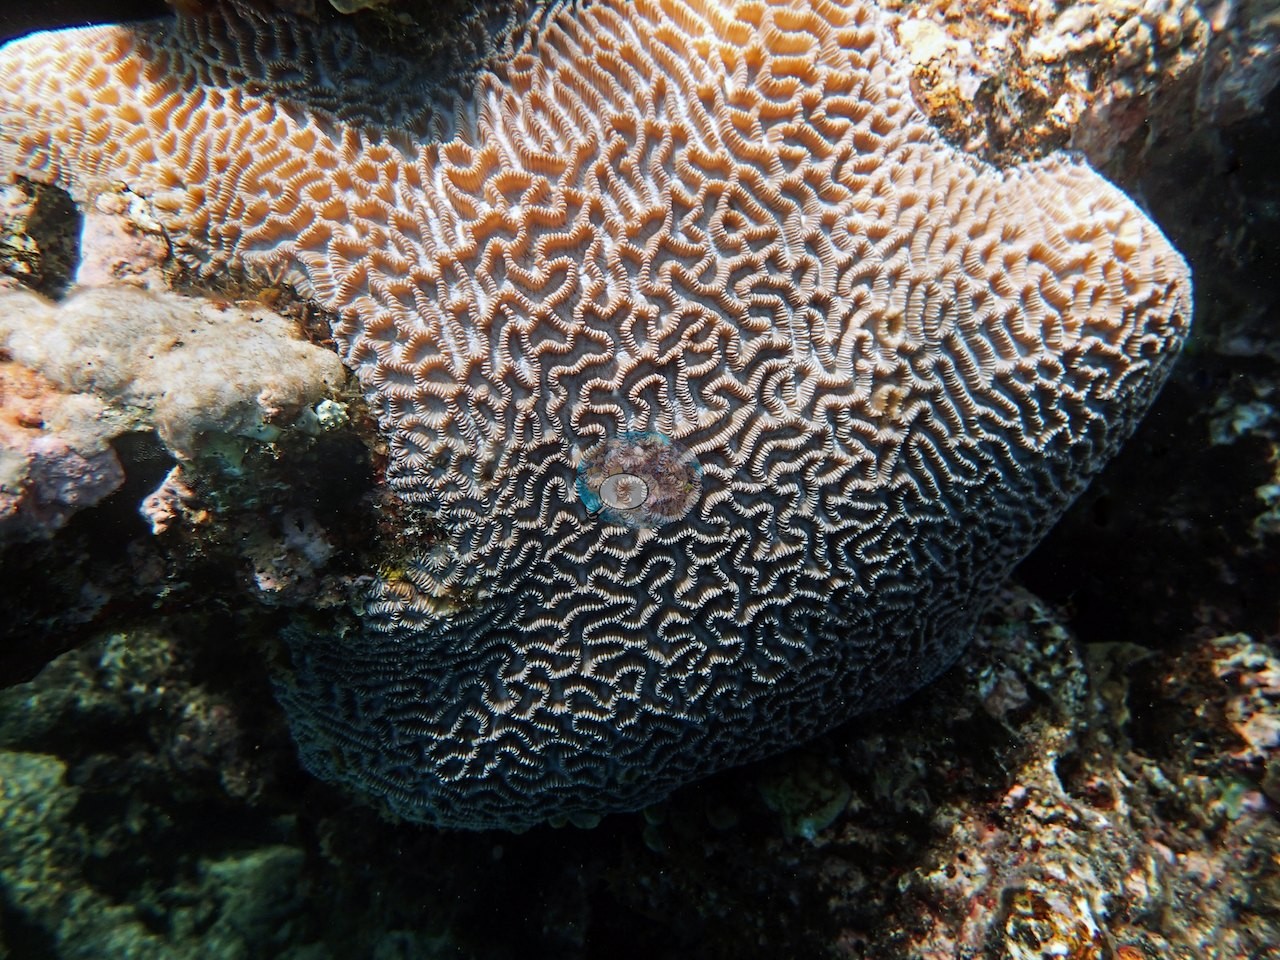
Another frame is a single massive dome, its fine corallites ruled out in even rows, rising from pink coralline rock (e.g., Image 3); a similar dome fills Image 6, and a large meandroid brain-type colony fills Image 25.
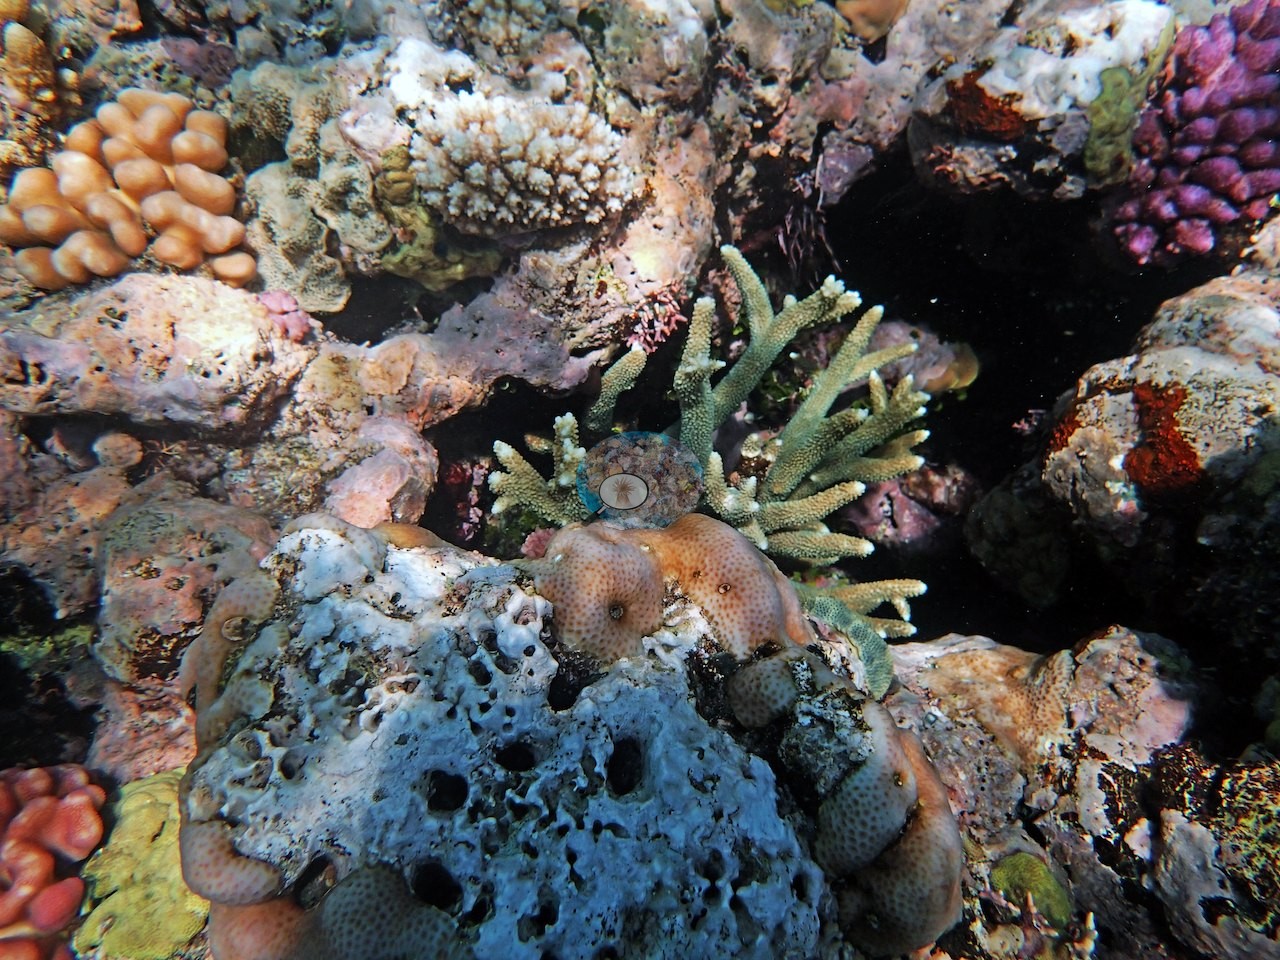
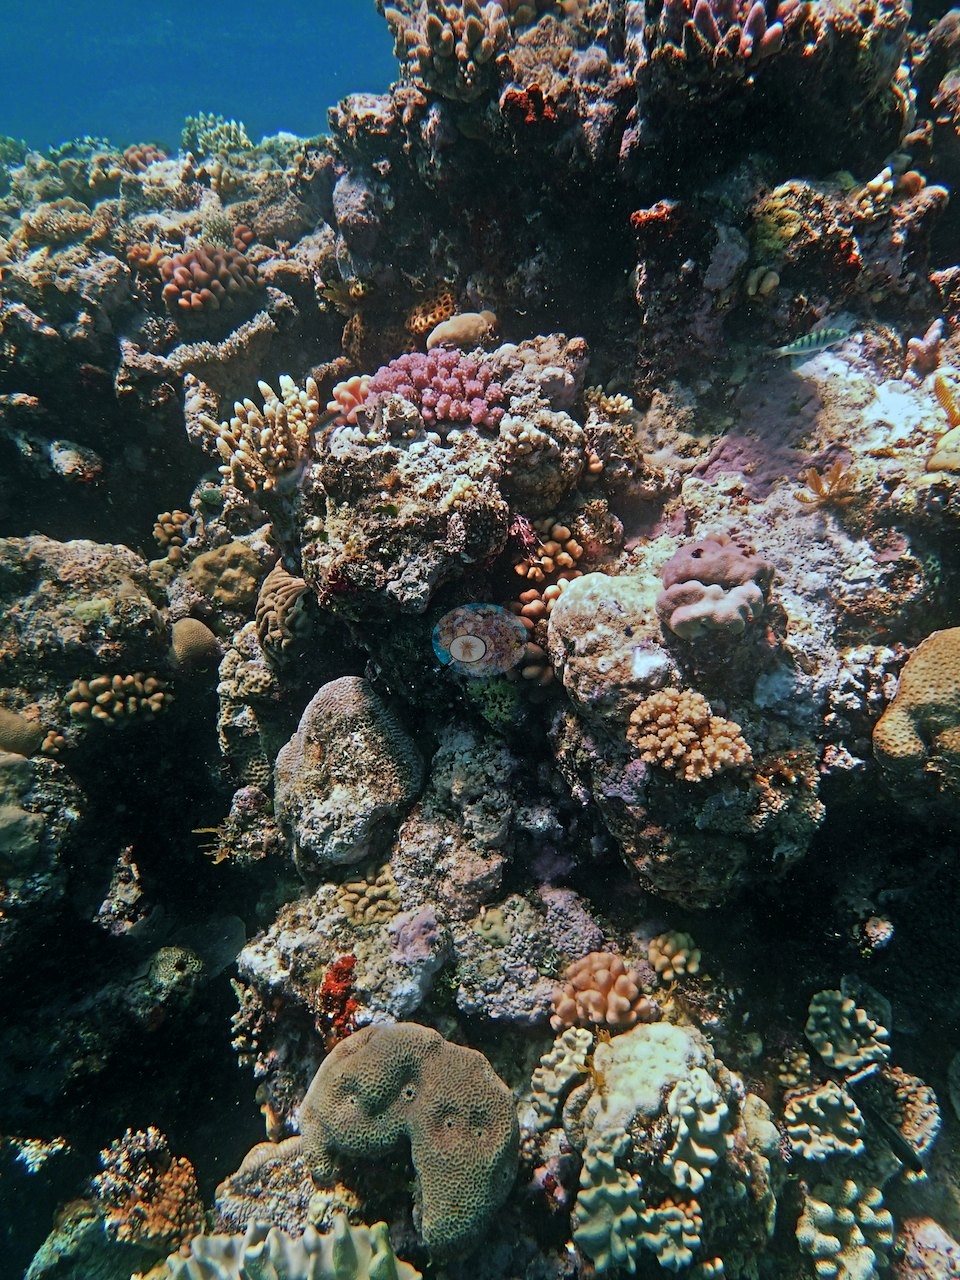
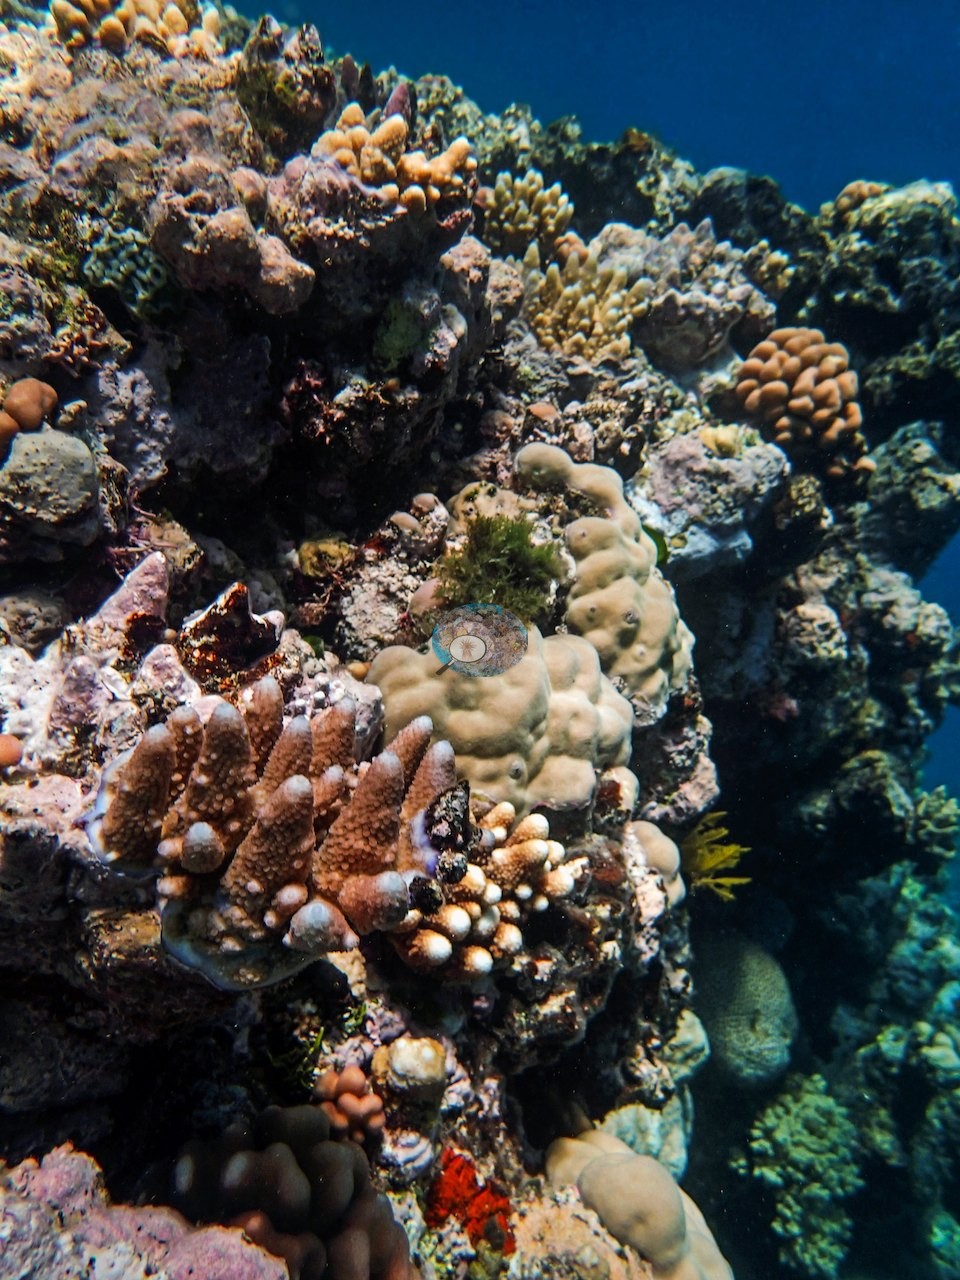
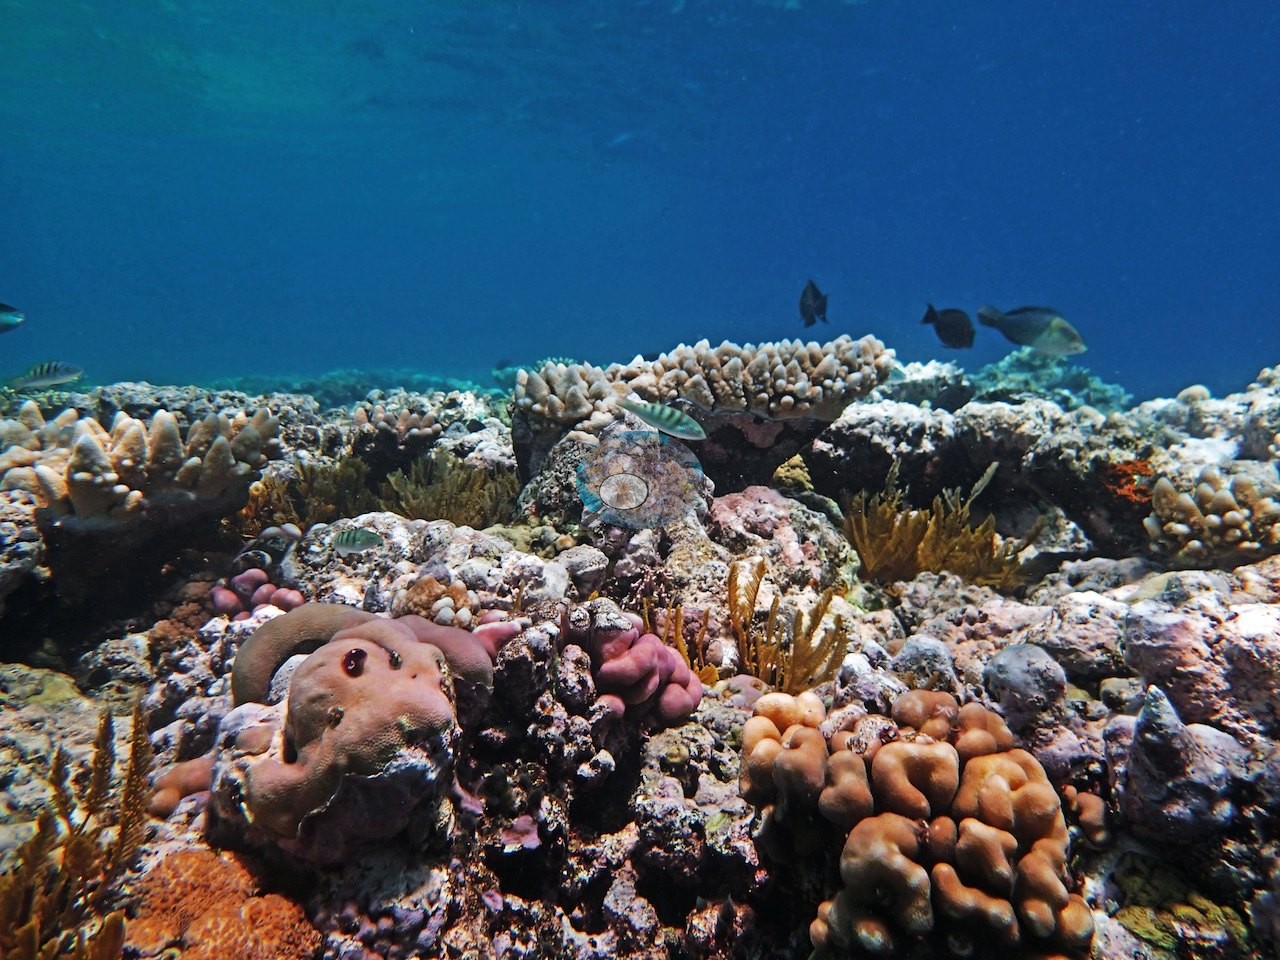
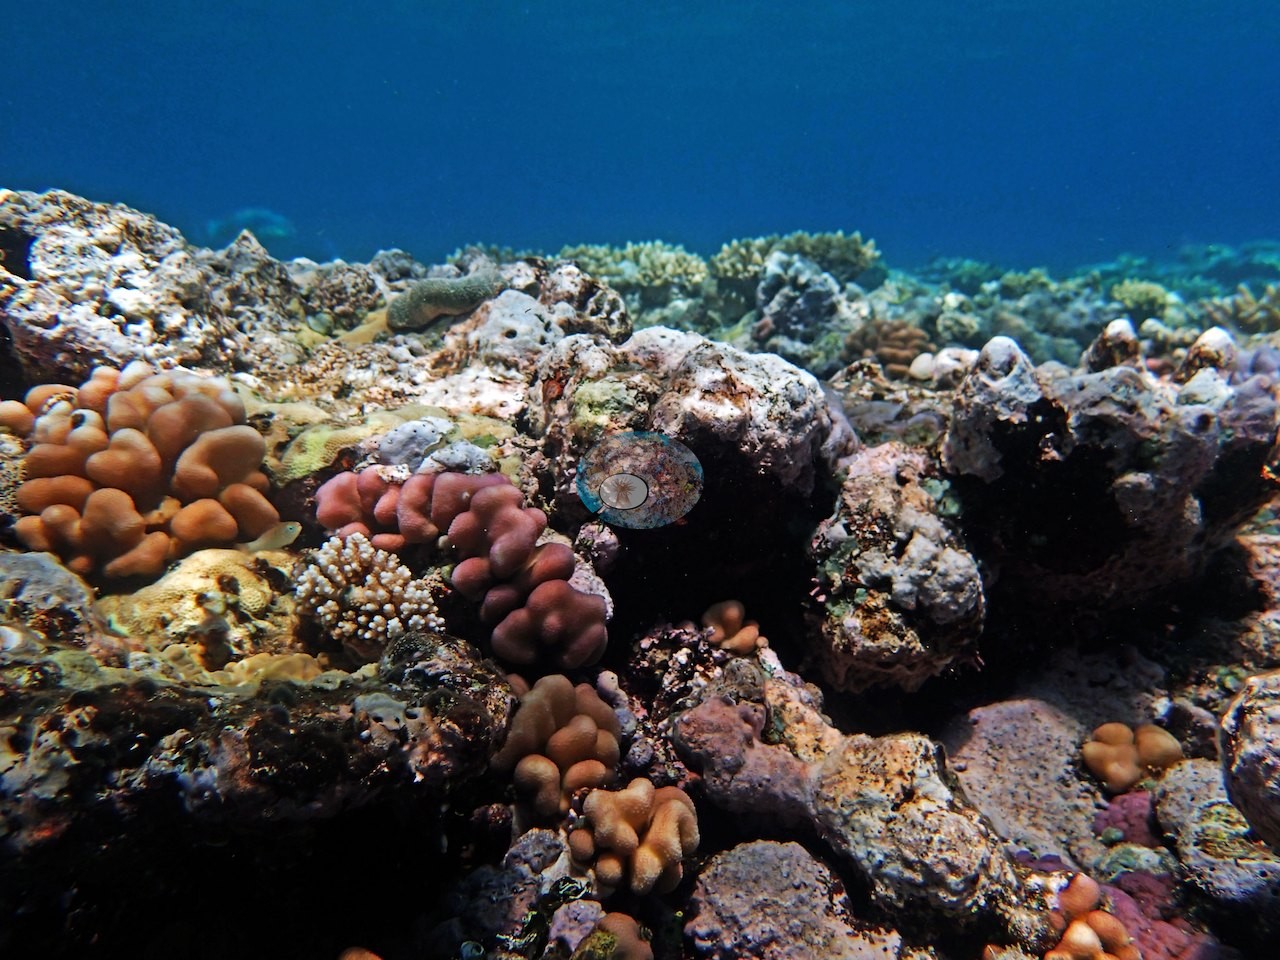
Many of the wide frames explain the low number: broad expanses of coralline-crusted pavement studded with small mounding and digitate colonies rather than continuous cover (e.g., Image 4, Image 5, Image 8, Image 13, Image 18, Image 19, Image 21, Image 29, Image 33), though recruitment was high on his 10.5 m transect.
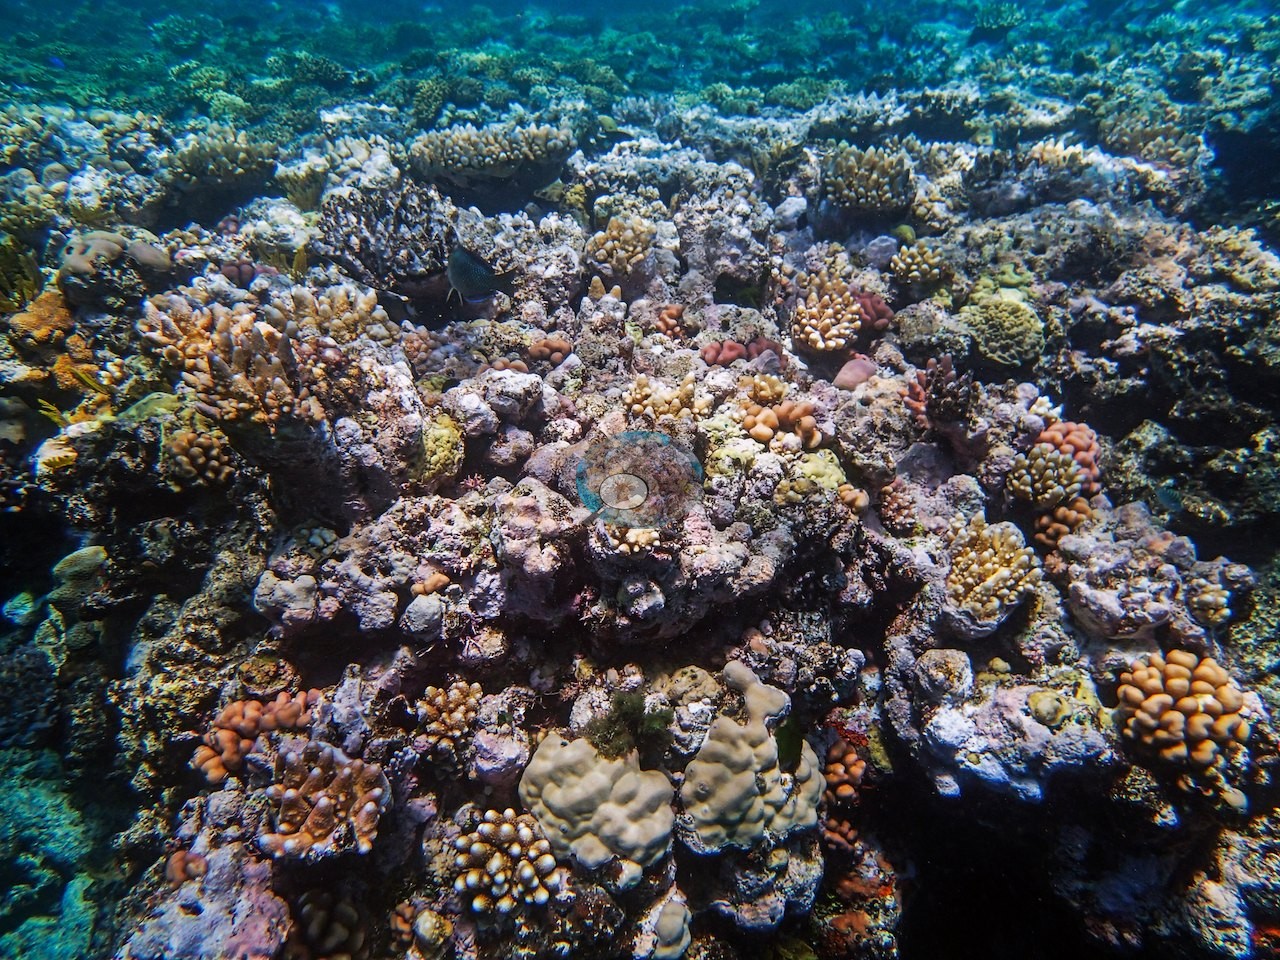
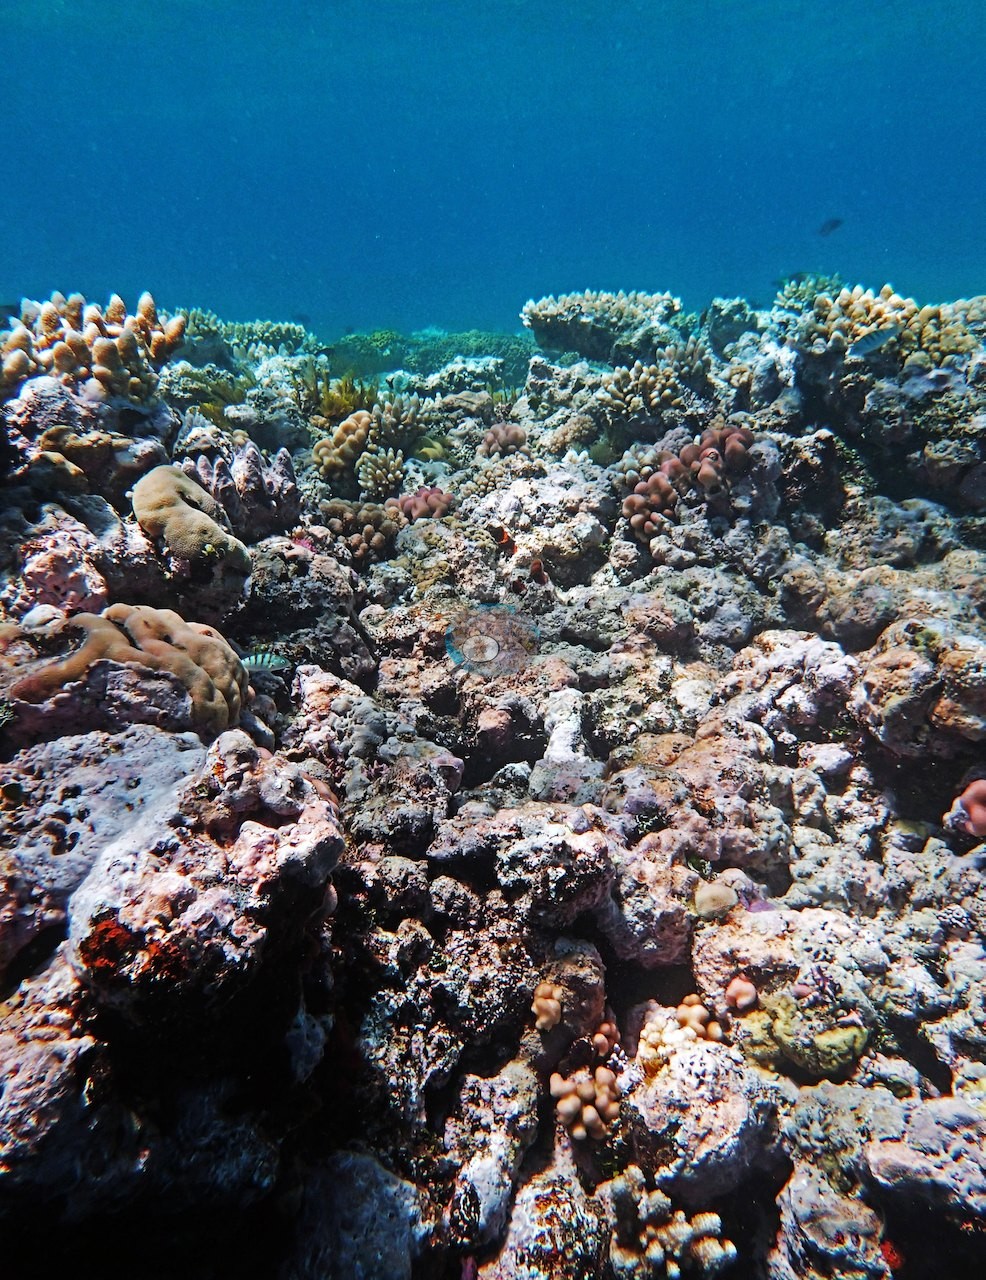
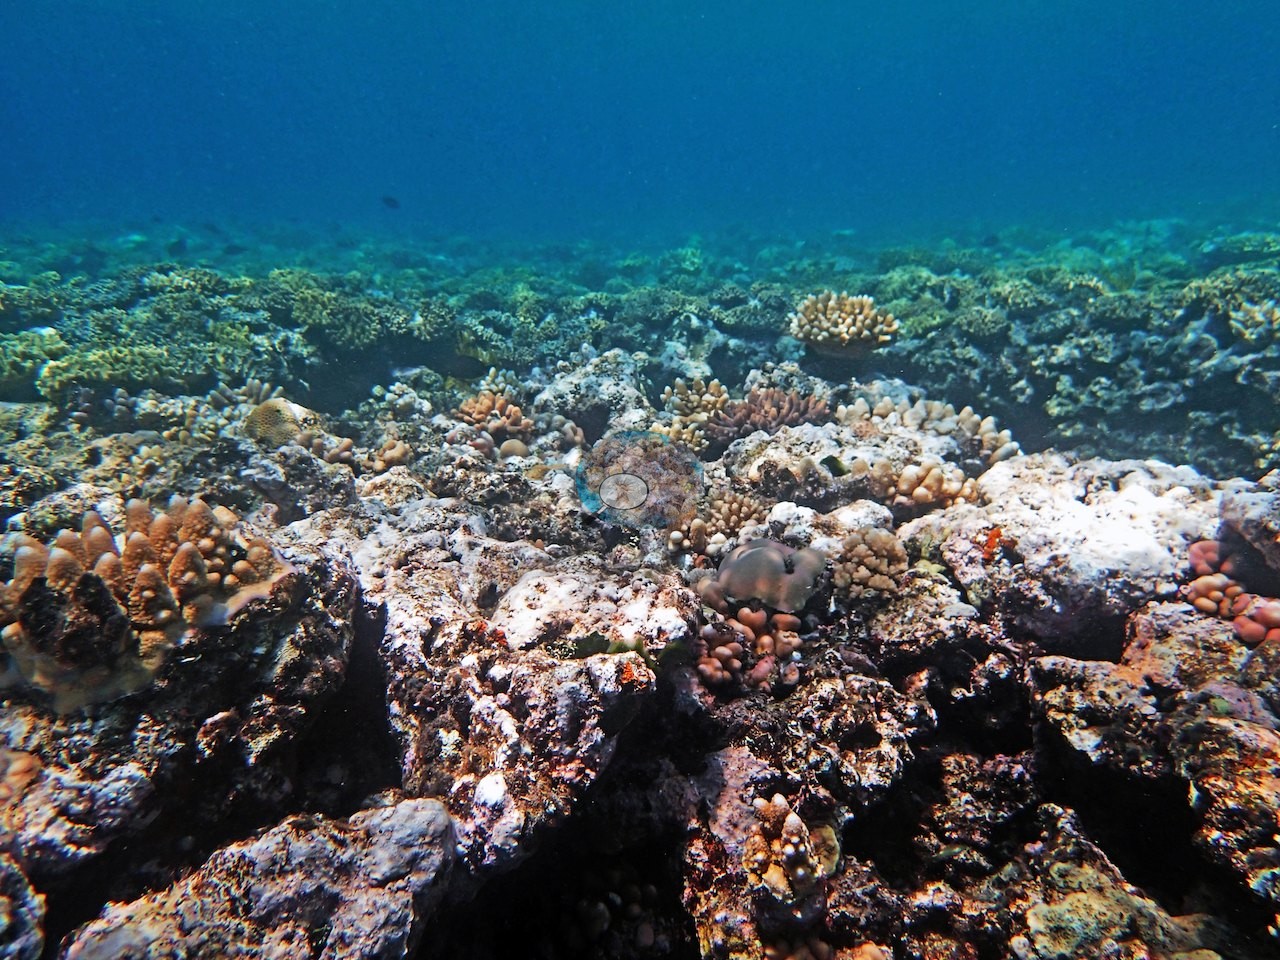
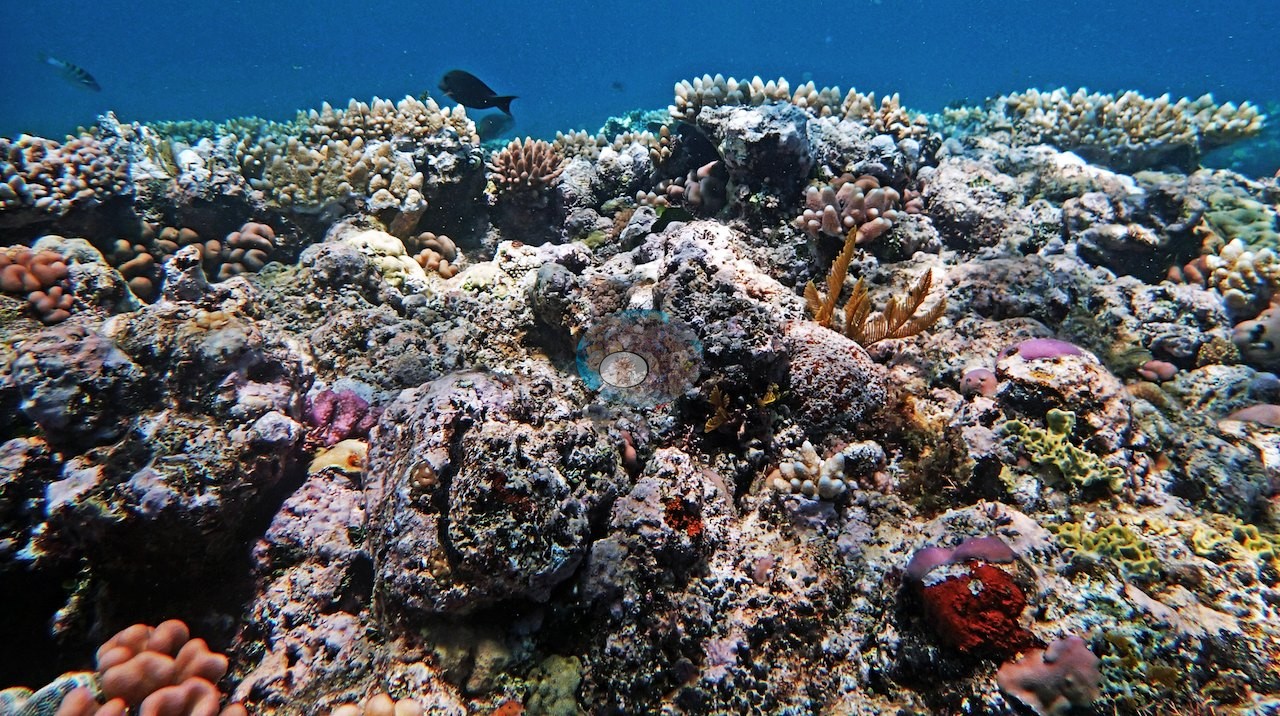
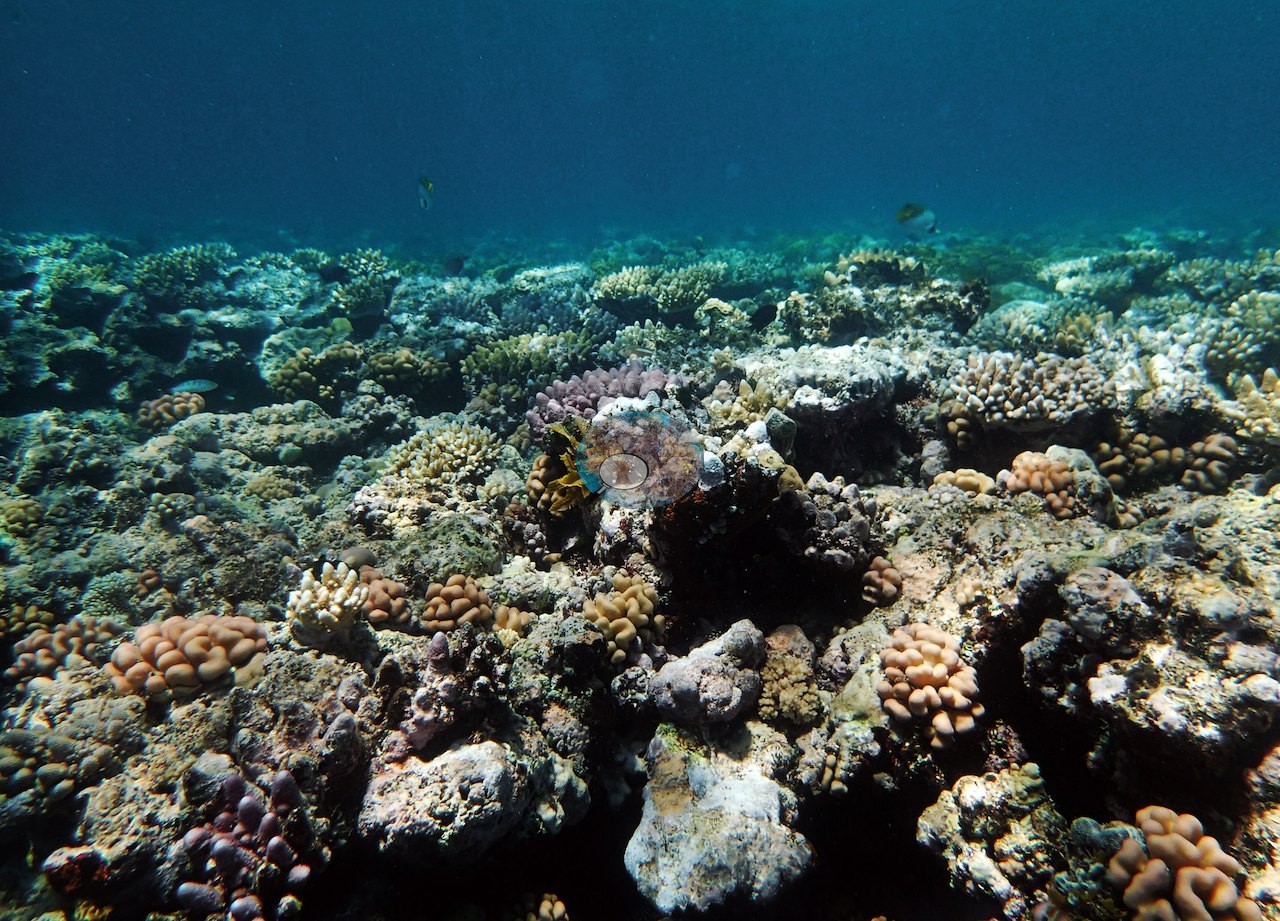
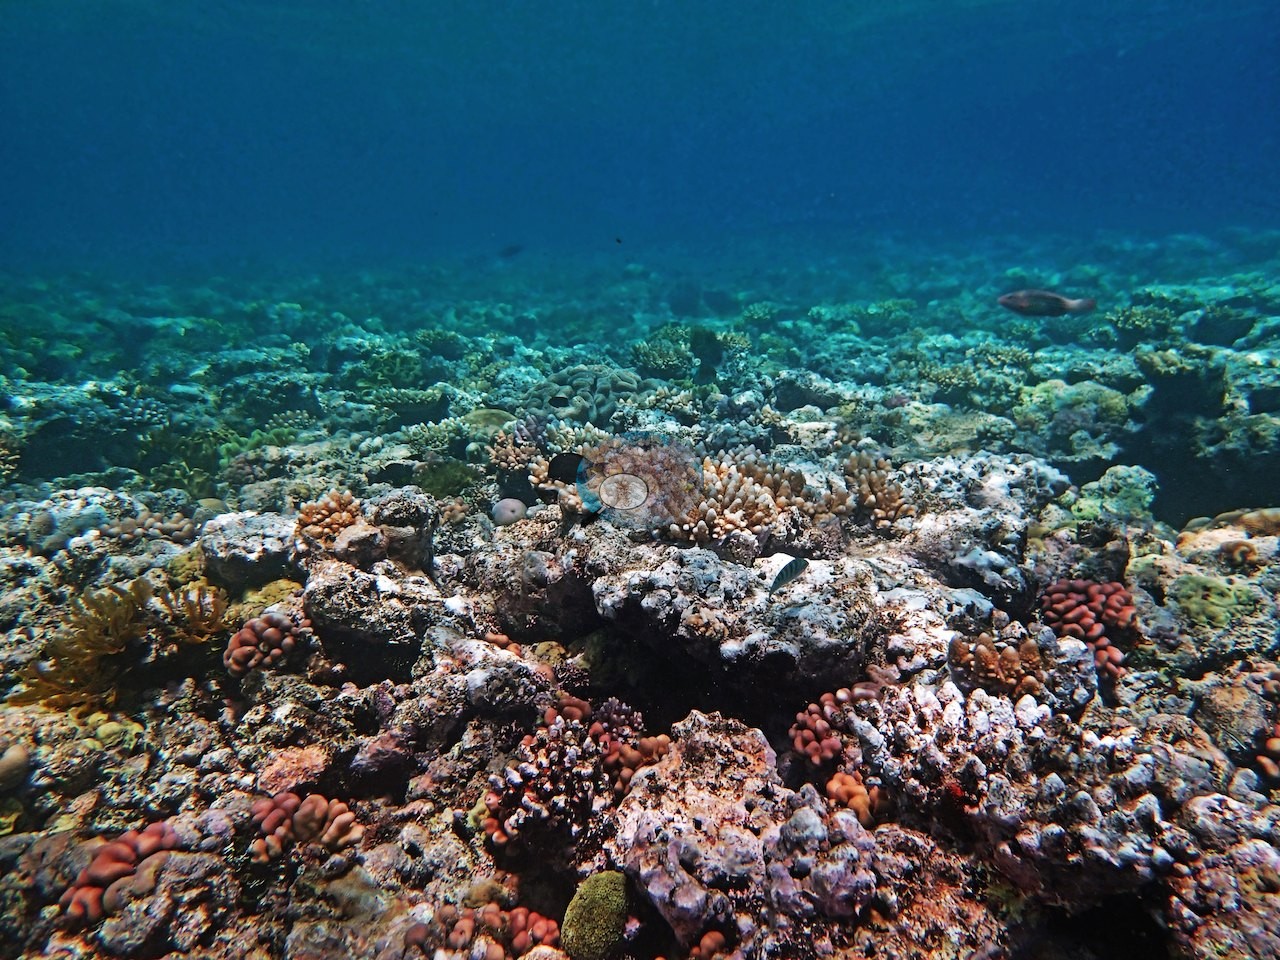
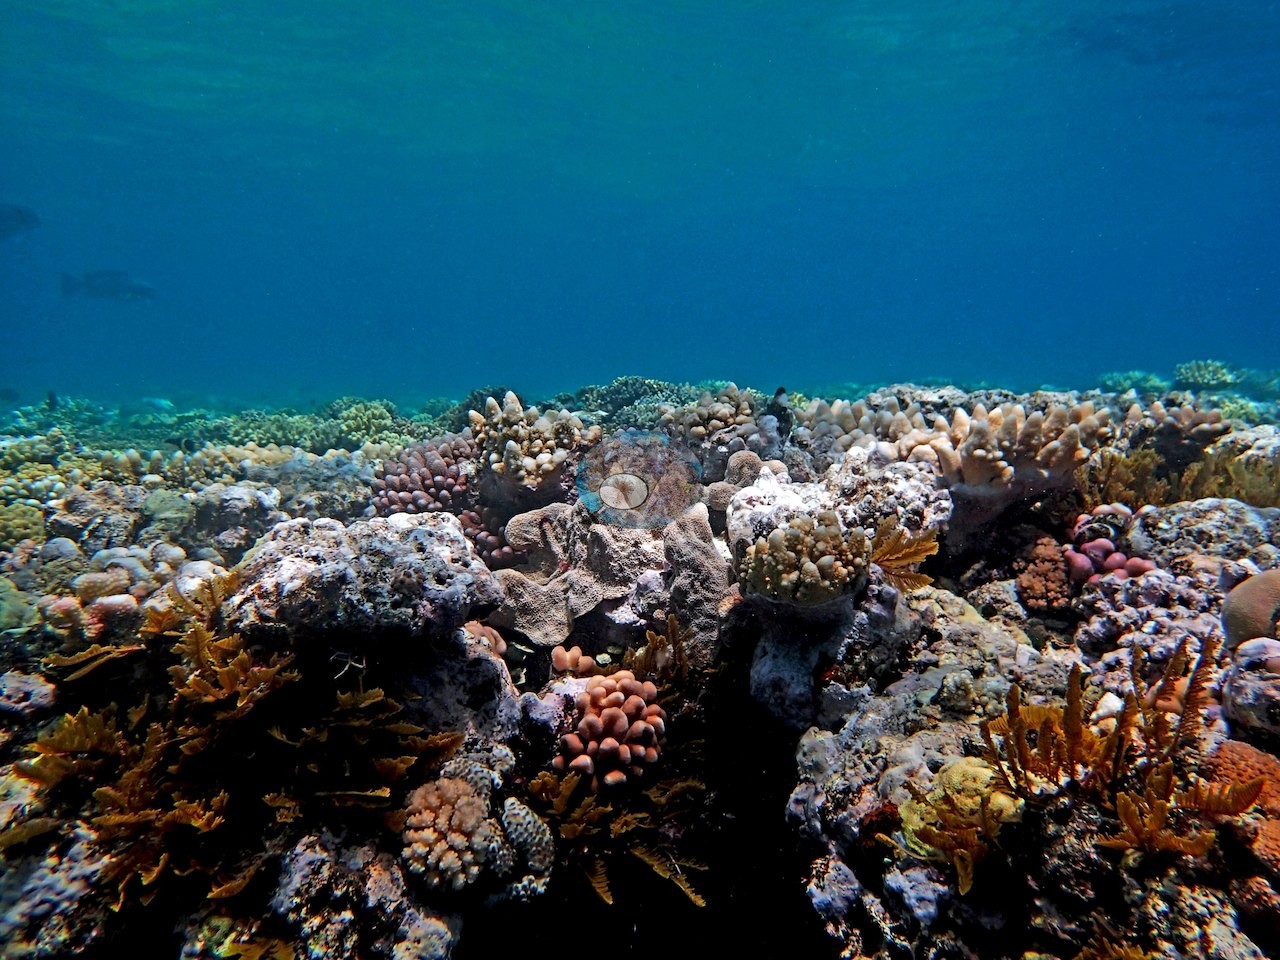
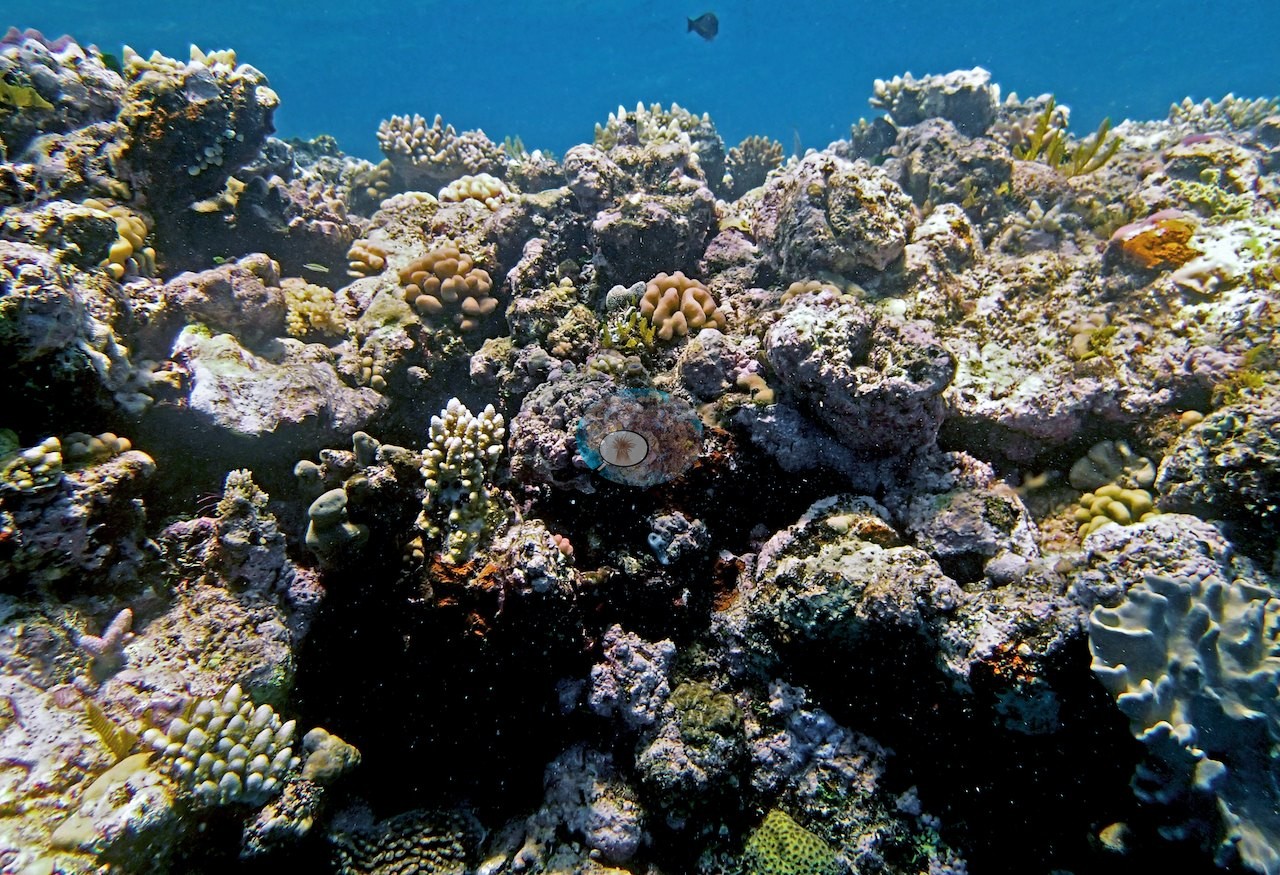
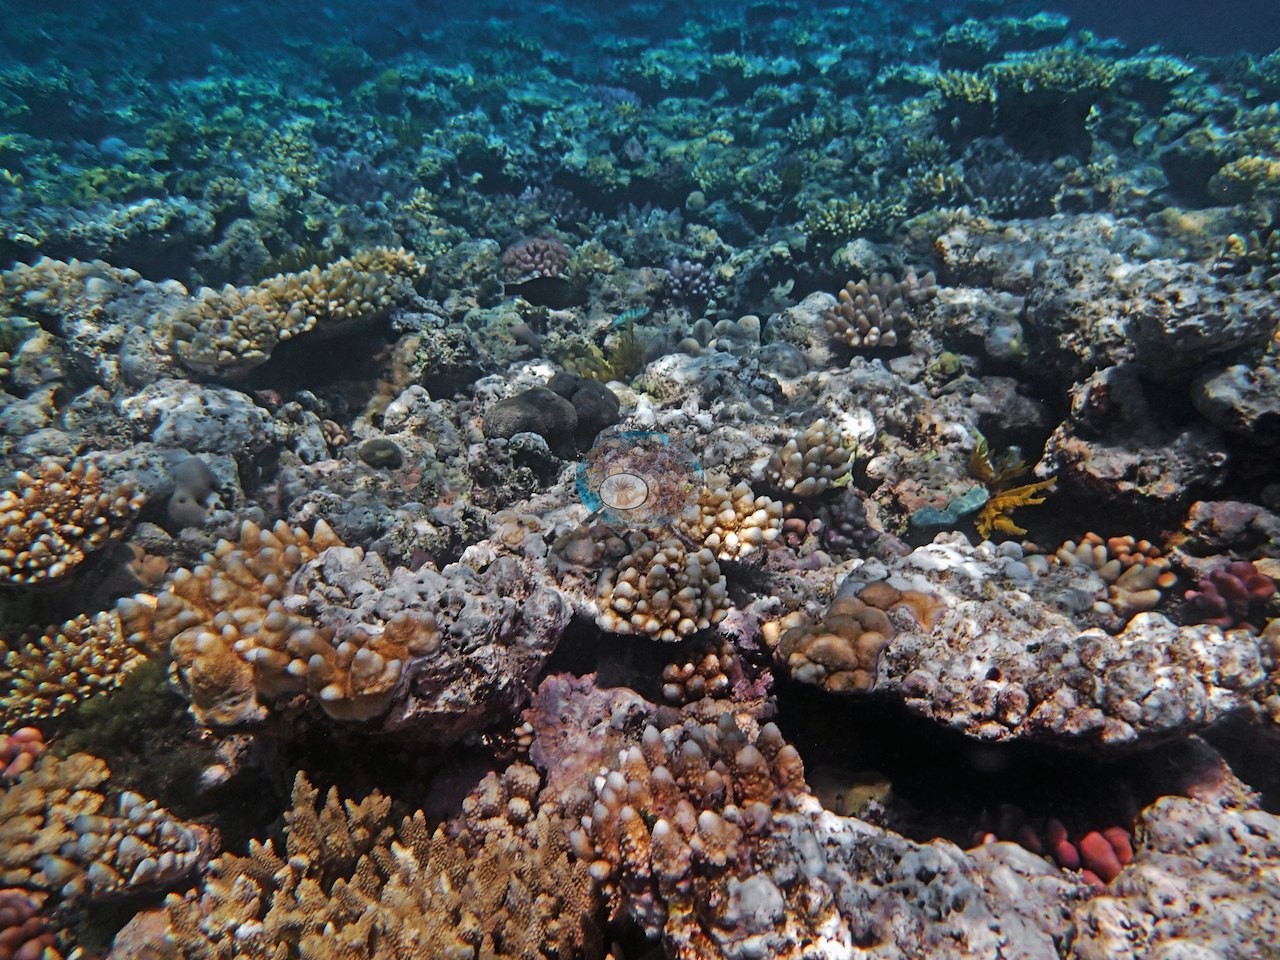
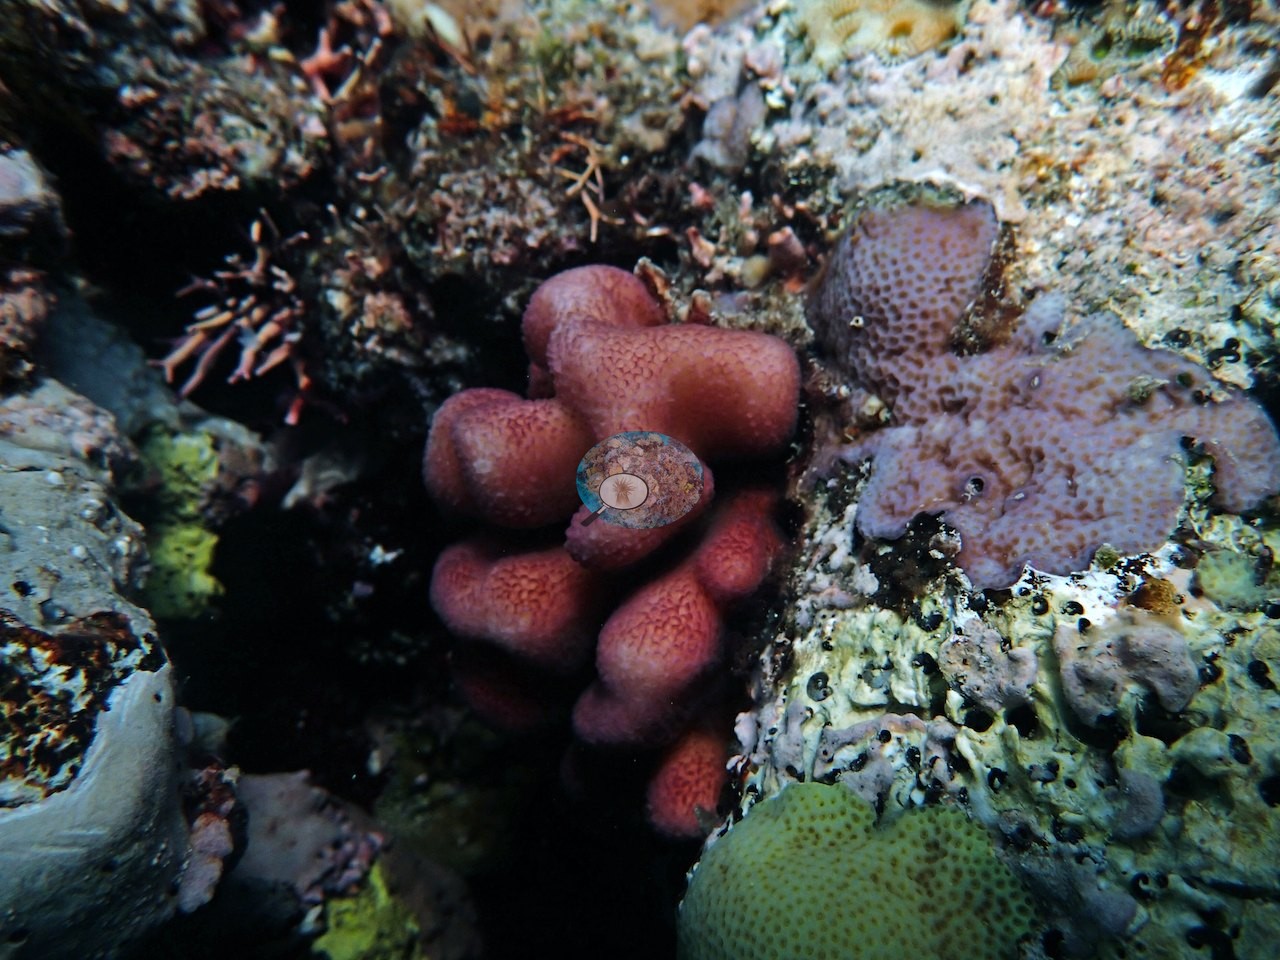
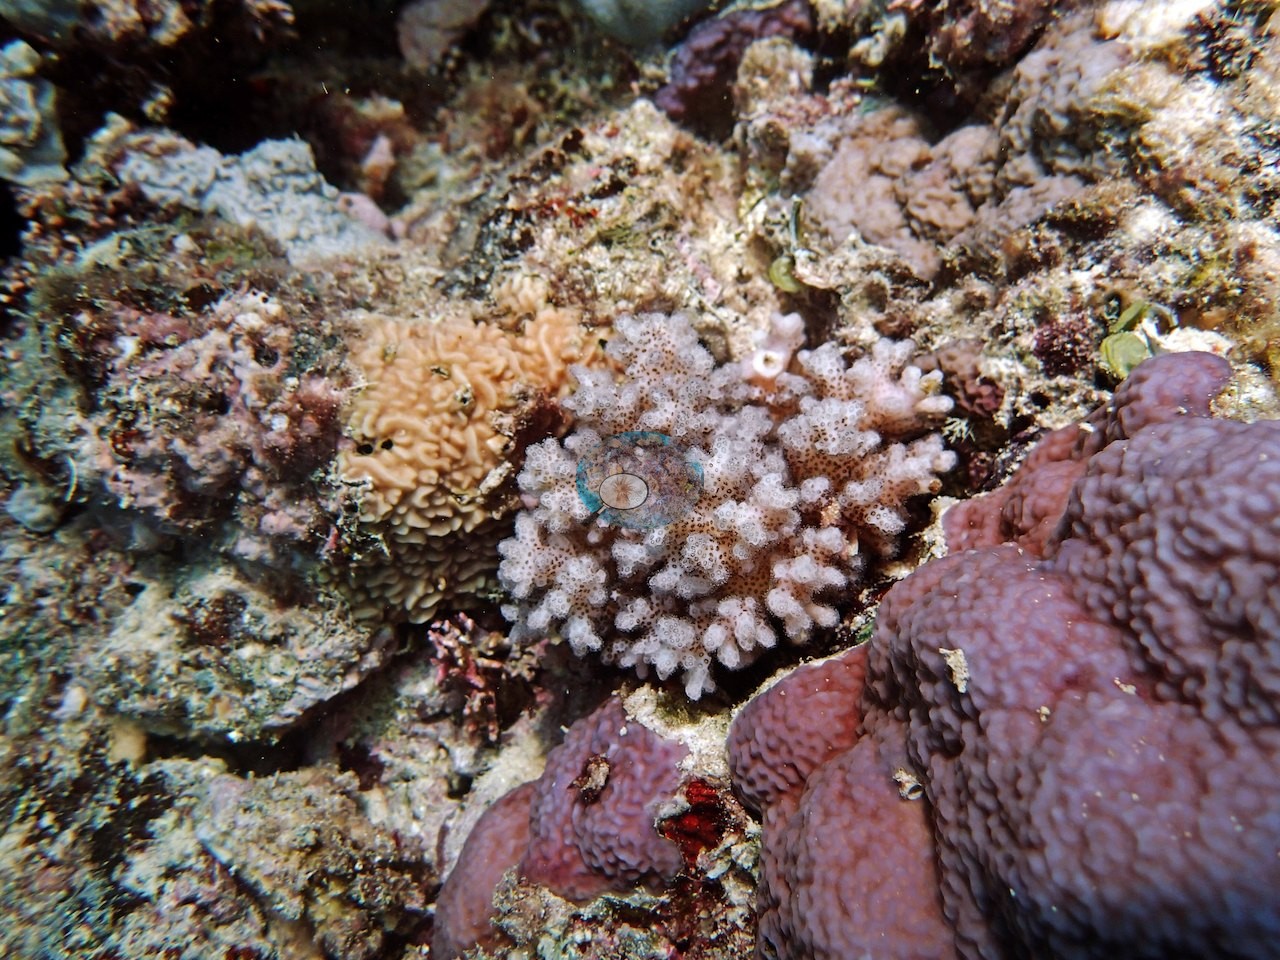
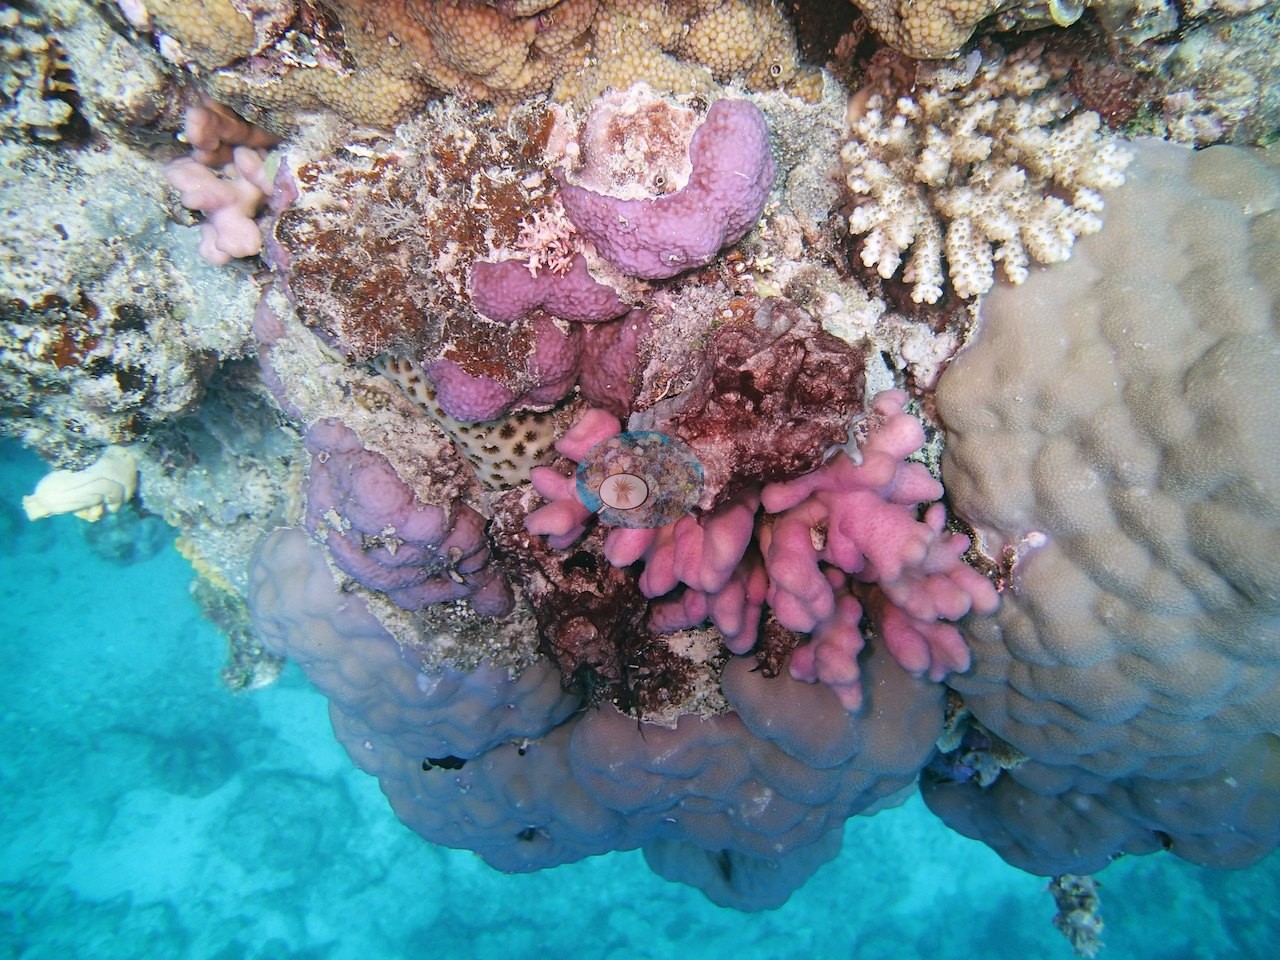
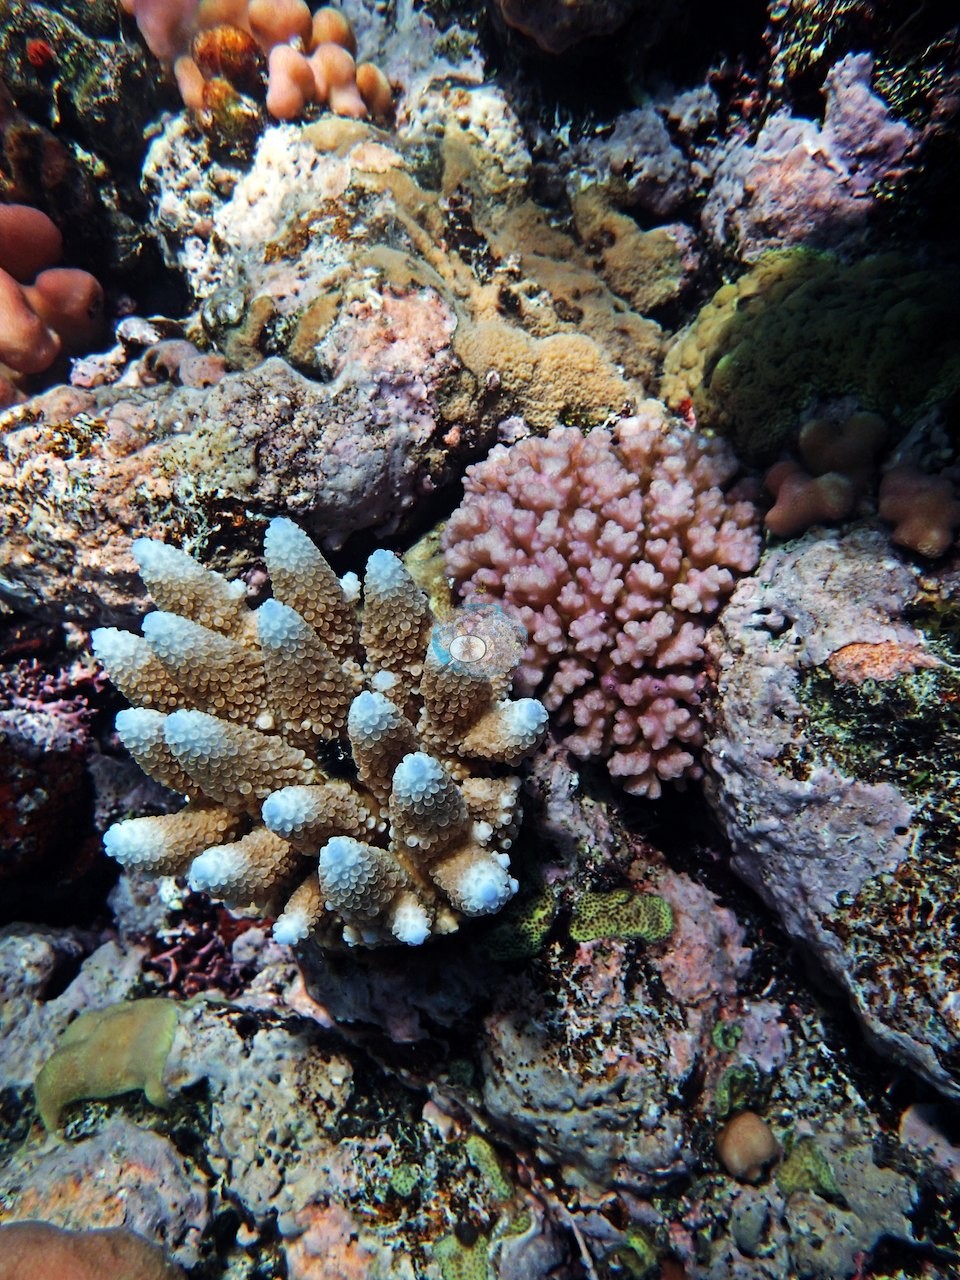
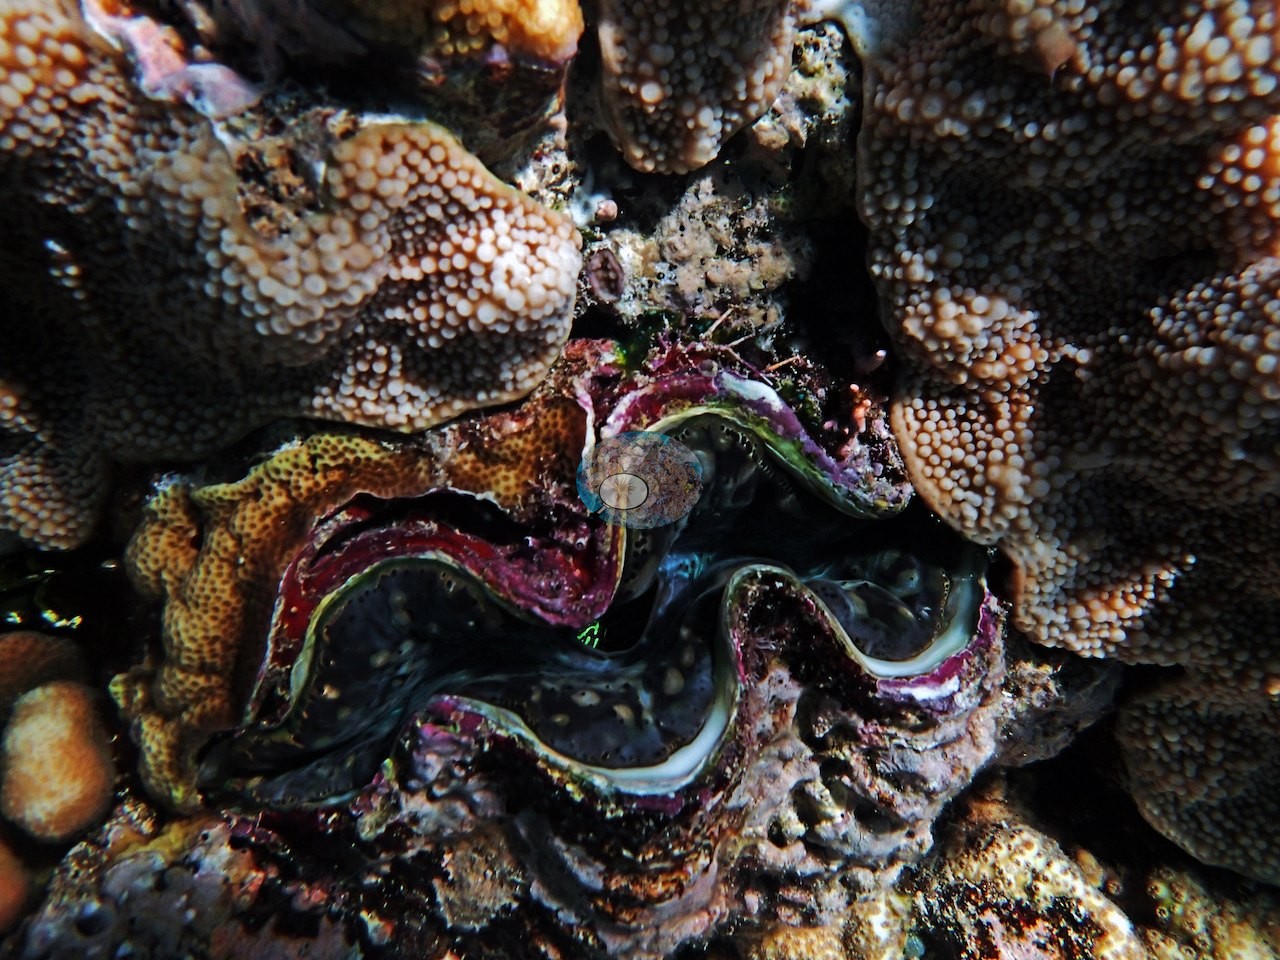
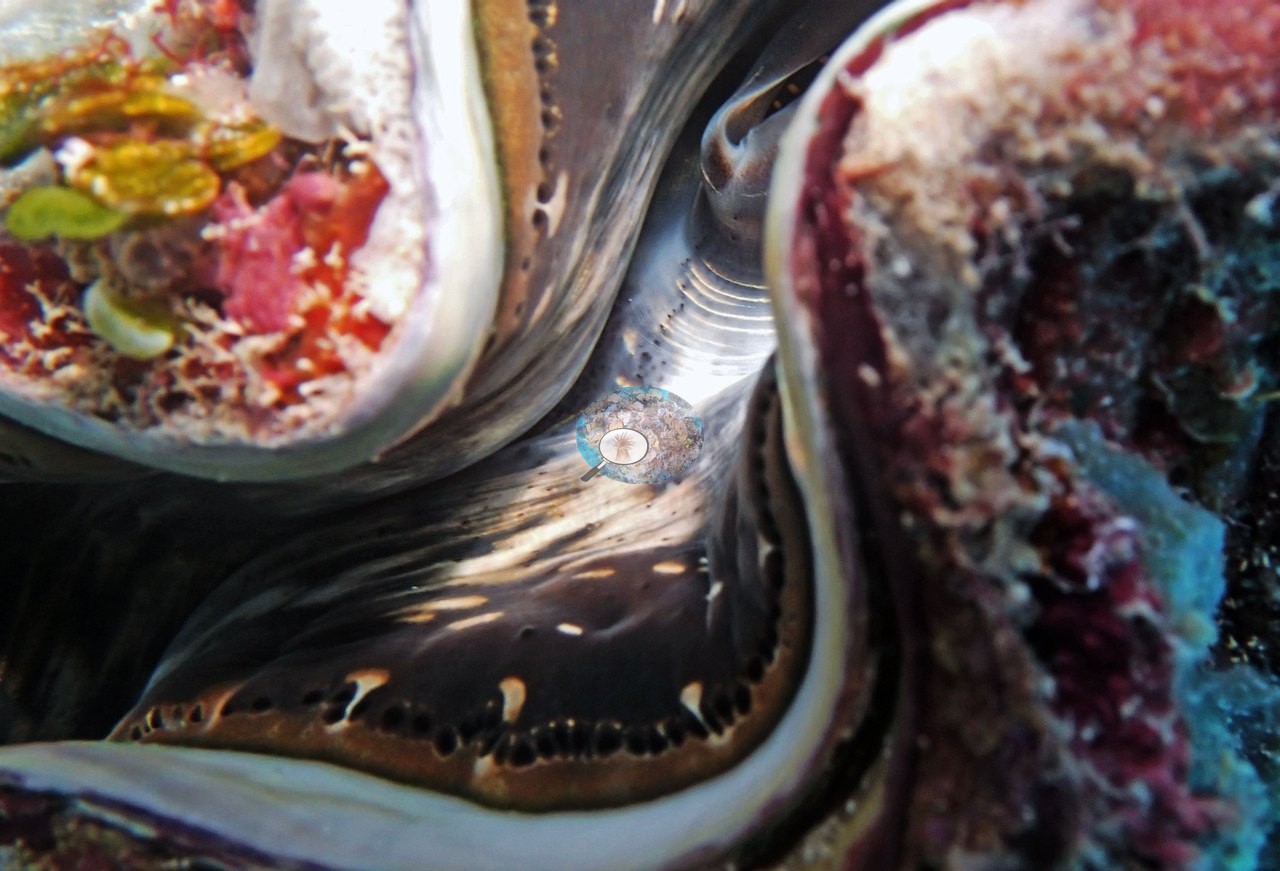
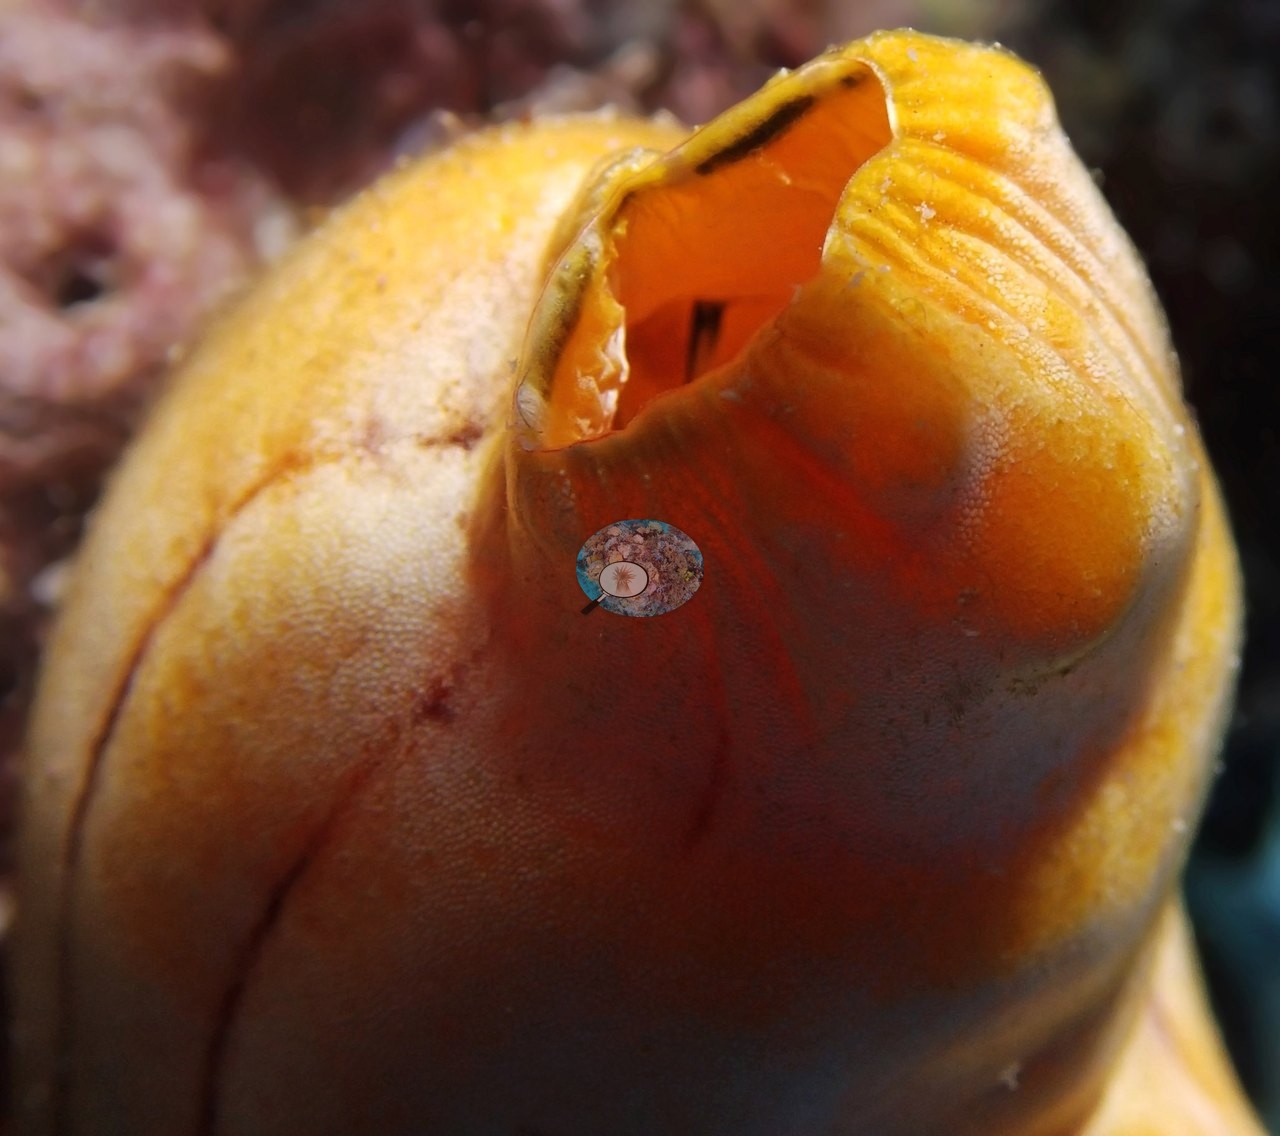
The rest of the 33-frame gallery holds close views of mixed colonies, including bright pink branching colonies (e.g., Image 14, Image 16, Image 24), a bommie top crowded with yellow soft corals and small colonies (e.g., Image 23), a giant clam (e.g., Image 15, Image 20), and an orange tubular sponge (e.g., Image 11).
Coral cover
- Reference: Khaled bin Sultan Living Oceans Foundation, Global Reef Expedition (in situ transect)
- Point-count cover at this particular survey point measured 14%.
- One transect was scored at this station (14%; n = 1, so no SE; Living Oceans Foundation per-transect benthic data); it is the expedition's station value printed above.
Stressors
No bleaching, disease, or crown-of-thorns activity was reported.
Comparisons with other data
No other surveys have been conducted at this site to date. Within 5 km, five independent stations (AIMS LTMP, AIMS manta tow, and XL Catlin Seaview Survey) recorded 3.9–73% hard coral cover between 1993 and 2023; the nearest, AIMS LTMP at CARTER REEF site 1, 1.47 km away, read 7.5–73% between 1993 and 2022.
CV model comparison
More info
The photo row below is a methods comparison only: it is never averaged with the transect and never used as the headline. It compares site means only: the photos come from the same survey dive as the transect but not from the same points.| Method | Hard-coral cover (%) | Photos (n) ± SE |
|---|---|---|
| Transect (published) | 14.0 | |
| CoralSCOP edited | 26.0 | n = 20 · SE 1.9 |
| Claude (edited photos) | 18.9 | n = 20 · SE 3.3 |
The two computer-vision methods differ by 7.1 pp (19–26%) and read 4.9–12.0 pp above the in-water transect (14%); the headline is the in-water transect because a diver transect is independent of the photographs.
Independent surveys nearby
| Agency / program | Year(s) | Stations / distance | Link |
|---|---|---|---|
| AIMS LTMP | 1993–2022 | 3 stations, 1.47–2.07 km | Records ↓ |
| AIMS manta tow | 1993–2023 | 1 station, 2.88 km | Records ↓ |
| XL Catlin Seaview Survey | 2012–2017 | 1 station, 2.34 km | Records ↓ |
 LOF Global Reef ExpeditionYear-average (illustrative only, programs differ)
Within 5 km, 5 independent survey stations recorded hard coral cover in 93 surveys between 1993 and 2023. Of the 5 stations surveyed in more than one year, 4 were scored by divers or by people annotating photographs: 4 increased (by 10.8–26.0 points) between their first and latest surveys. The other 1 was scored by automated image analysis: changed by 7 points or less, inside the 7-point method-noise floor (inconclusive). The longest record, CARTER REEF (AIMS manta tow, 2.88 km away), went from 16% in 1993 to 33% in 2023. Since 2021, station-year means average 29% (range 18–36%; n = 9 station-years from 9 surveys). This site's own estimate (14%) sits 15 points below the recent range up to 2 km away (29–36%); the methods differ, so the comparison is context, not a like-for-like test.
Collected by other programs using different methods (AIMS manta tow is a towed visual estimate in categorical bins; AIMS LTMP uses fixed photo-transects; the XL Catlin Seaview Survey uses photo-transects with automated image annotation), so these are context for the figures above, not a like-for-like comparison. Where a station was surveyed more than once, the cell shows either the range of its values or, as a single value, the mean of surveys made in one year. Station names are not dive-site names.
| Agency | Site / location | Date | Hard coral cover (%) | Distance | Link |
|---|---|---|---|---|---|
| AIMS LTMP | CARTER REEF site 1 | 1993–2022 | 7.5–73% (range of yearly means; 22 surveys) | 1.47 km | doi:10.25845/5c09bc4ff315c |
| AIMS LTMP | CARTER REEF site 2 | 1993–2022 | 8.8–65% (range of yearly means; 22 surveys) | 1.72 km | doi:10.25845/5c09bc4ff315c |
| AIMS LTMP | CARTER REEF site 3 | 1993–2022 | 7.7–59% (range of yearly means; 22 surveys) | 2.07 km | doi:10.25845/5c09bc4ff315c |
| AIMS manta tow | CARTER REEF | 1993–2023 | 3.9–35% (23 surveys) | 2.88 km | doi:10.25845/5c09b0abf315a |
| XL Catlin Seaview Survey | transect 12025 | 2012–2017 | 13–19% (4 surveys) | 2.34 km | doi:10.14264/uql.2019.930 |
Data & links
- Download benthic survey data (CSV) ↗
- Download all LOF-GRE data (933 sites) ↗
- Photo portfolio ↗
- Coral Reef Diagnostics country page ↗
All images from Coral Reef Diagnostics. Data are from the Khaled bin Sultan Living Oceans Foundation Global Reef Expedition, Coral Reef Diagnostics, and the organizations named in the data sources above.
 © Coral Reef Diagnostics.