
Fiji - Lau

Overview of 73 dive sites. Figures are averages across the sites that report them (n = sites with a value); each site's own page has its individual values. Regional summaries: Northern Lau (Vanua Balavu / Cicia / Nayau), Southern Lau (Kabara / Fulaga), Moala Group (Moala / Totoya / Matuku).
⬇ Download this overview as a report card

Heat stress
Long-term record: 11 years from 1985 through 2025 reached 8 or more °C-weeks at NOAA’s Fiji station. Download the annual DHW data (CSV).
73 sites in this region — click a marker to open that site.
Overview
Between 3 and 26 June 2013, the Khaled bin Sultan Living Oceans Foundation's Global Reef Expedition surveyed 70 benthic stations in eastern Fiji, at Vanua Balavu, Cicia, Mago, Nayau, Tuvuca, and Vanua Vatu in Northern Lau, Fulaga and Kabara in Southern Lau, and Totoya, Matuku, and Moala in the Moala Group. With an island marker each for Vanua Balavu and Totoya and a snorkel site at Nayau, the area has 73 sites. The Lau Islands crown the Lau Ridge along Fiji's eastern edge, separated from the main Fiji Platform by the Nanuku Channel. Spalding et al. (2001) describe mostly high volcanic islands in the north of the chain and carbonate islands farther south, with atolls and near-atolls throughout; Vanua Balavu is a high island joined to an extensive barrier reef in the Exploring Isles. The Moala Group, three high volcanic islands ringed mainly by fringing reefs, is part of Lau.
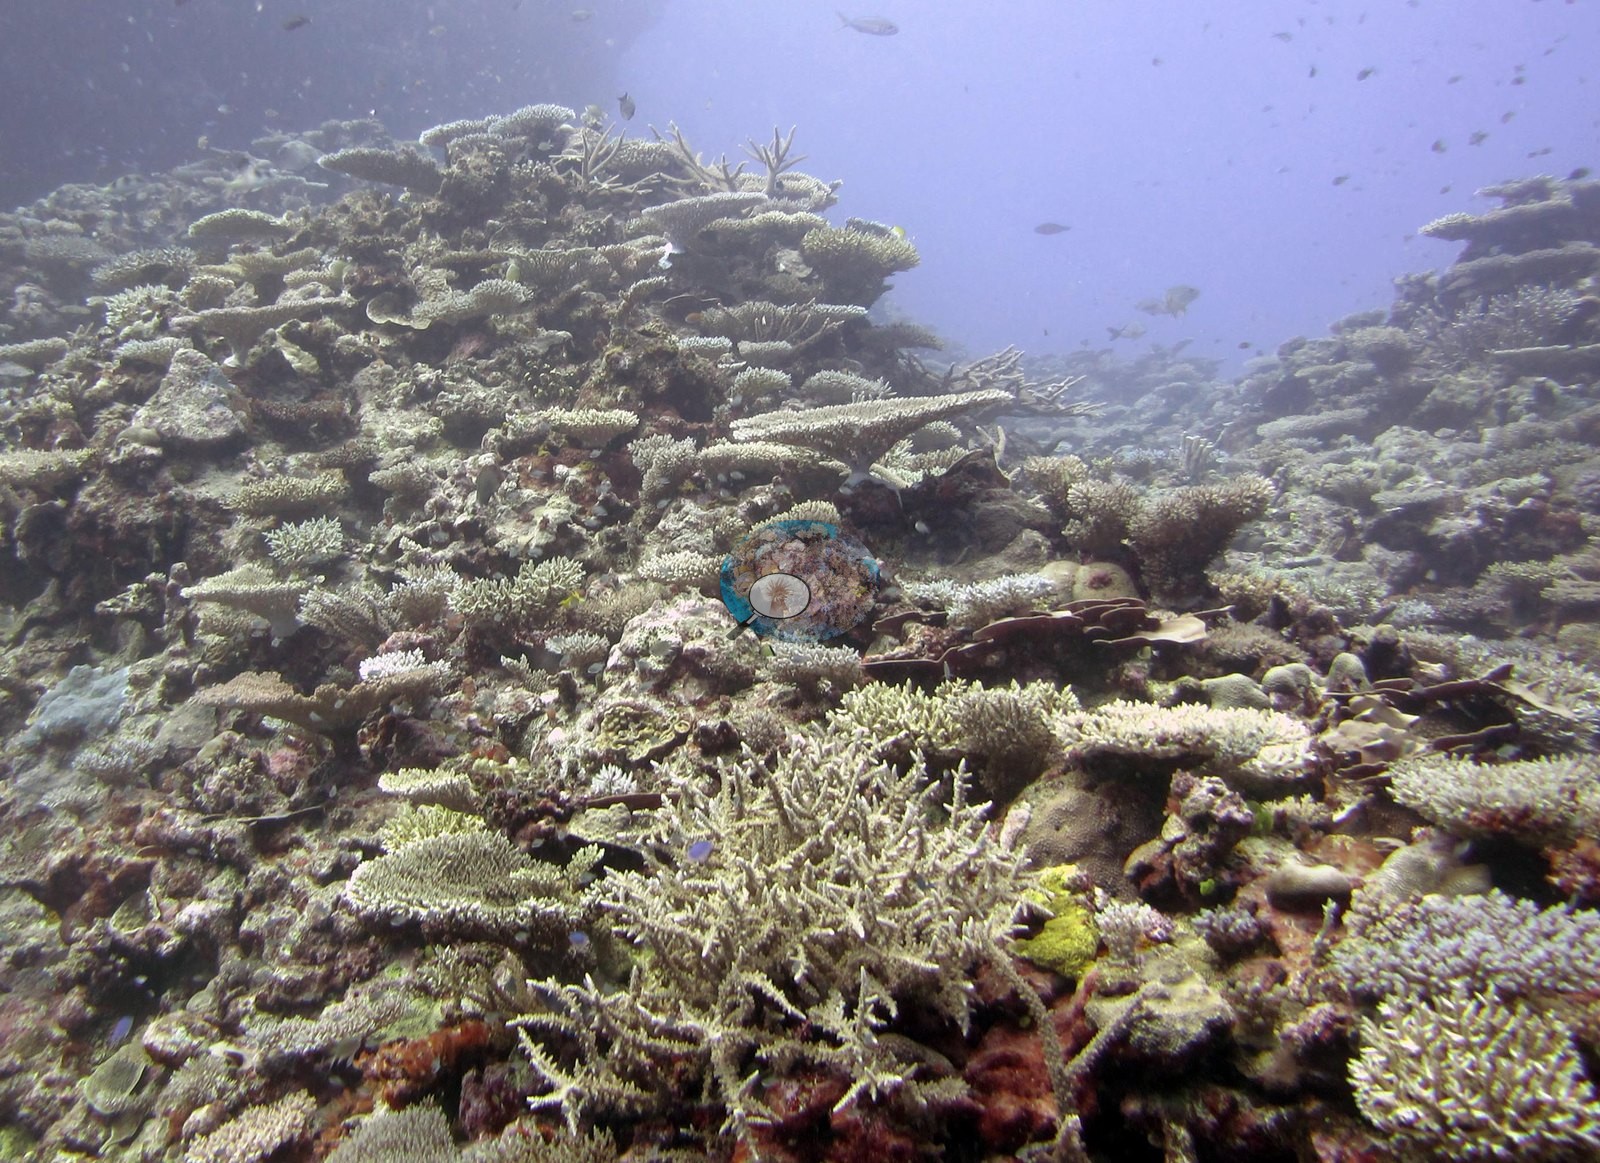
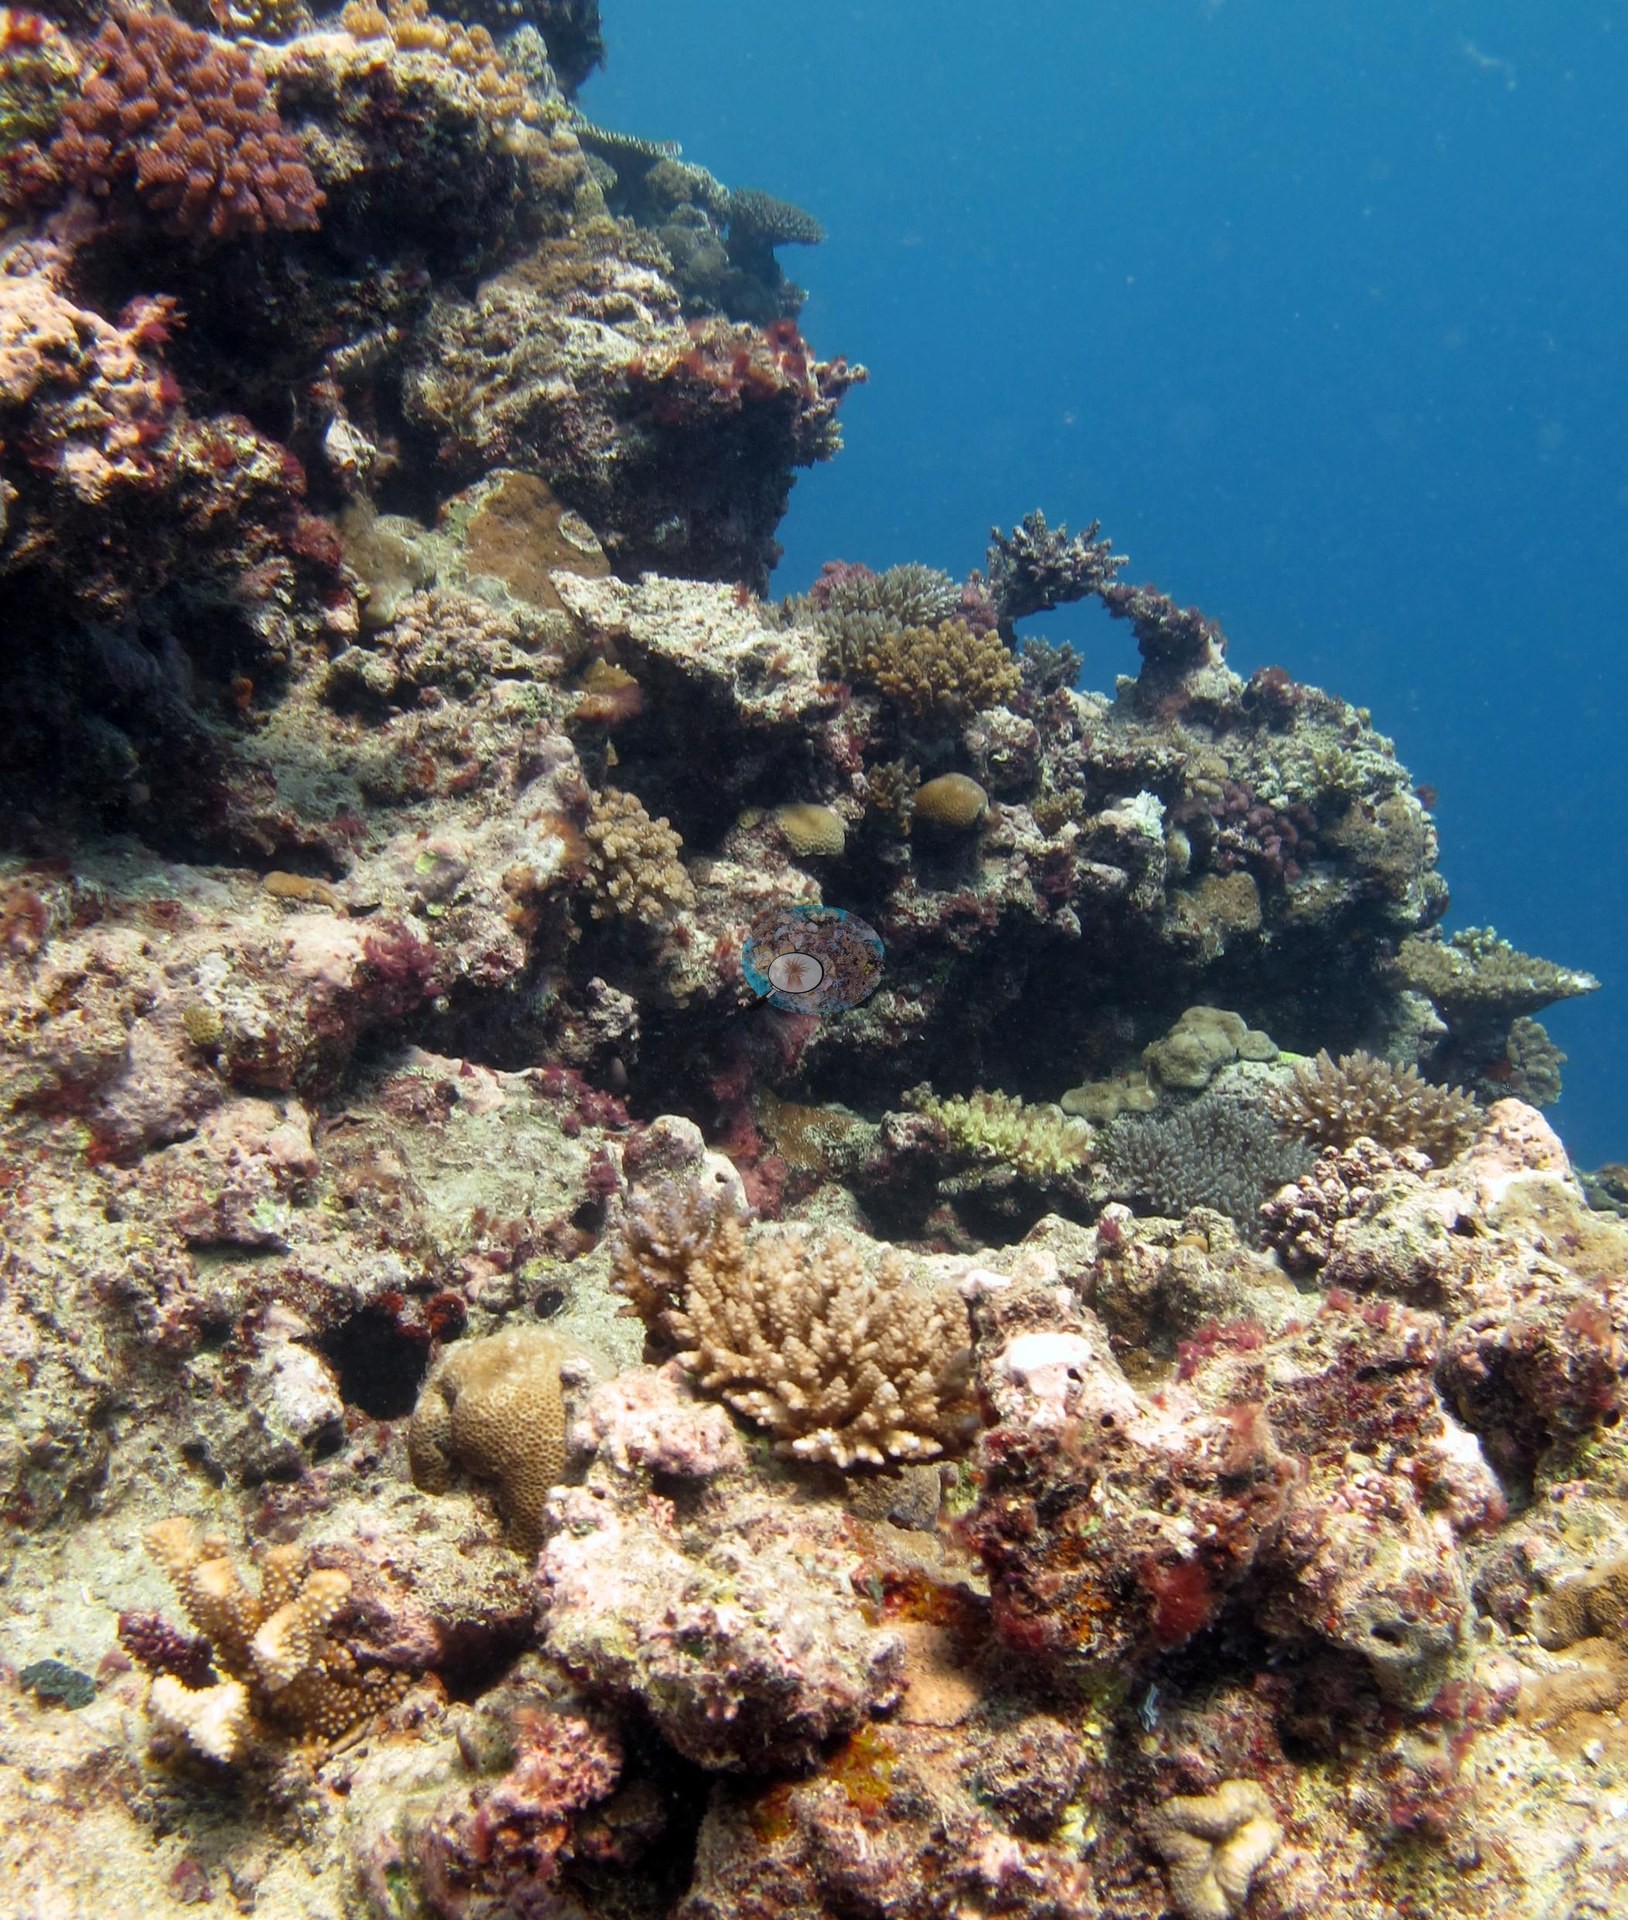
The expedition began in the Moala Group, on Totoya (3-5 June), Matuku (6-7 June), and Moala (8-10 June), then moved to Fulaga (11-12 June) and Kabara (13-14 June) in Southern Lau, and worked north through Vanua Vatu, Nayau, Tuvuca, Cicia, and Mago to finish on Vanua Balavu (21-26 June). The majority of stations sit on fore-reef terraces, spur-and-groove slopes, and walls, with maximum dive depths up to 32.3 m at FJCC47 (the Nayau snorkel station, with no logged dive, is 2 m deep); among the scuba stations the shallowest dive was 4 m at FJFU29. Among the less typical settings are the lagoon pinnacles inside Fulaga's enclosed lagoon (FJFU28), a lagoon pinnacle of large Acropora tables at FJML21, a narrow coral canyon at FJML23, a seamount top off Matuku (FJMT14), and a current-swept gorgonian wall at FJTV41.
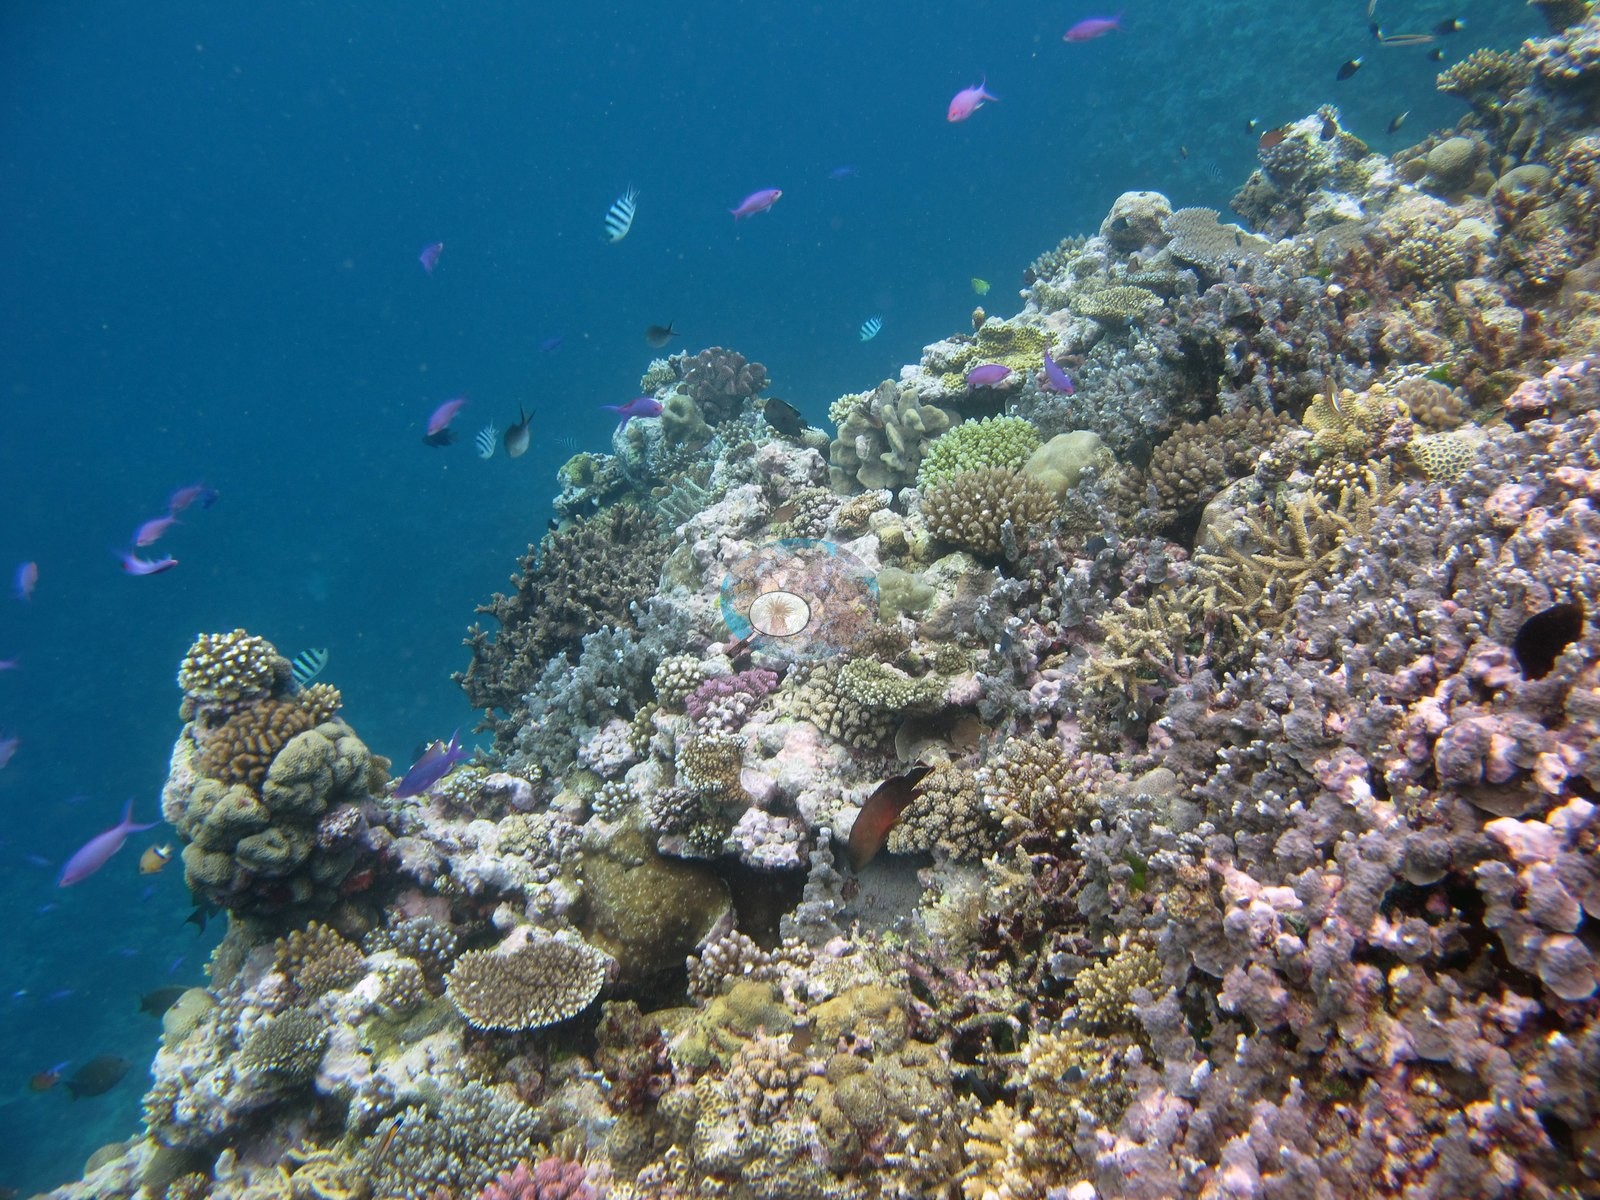
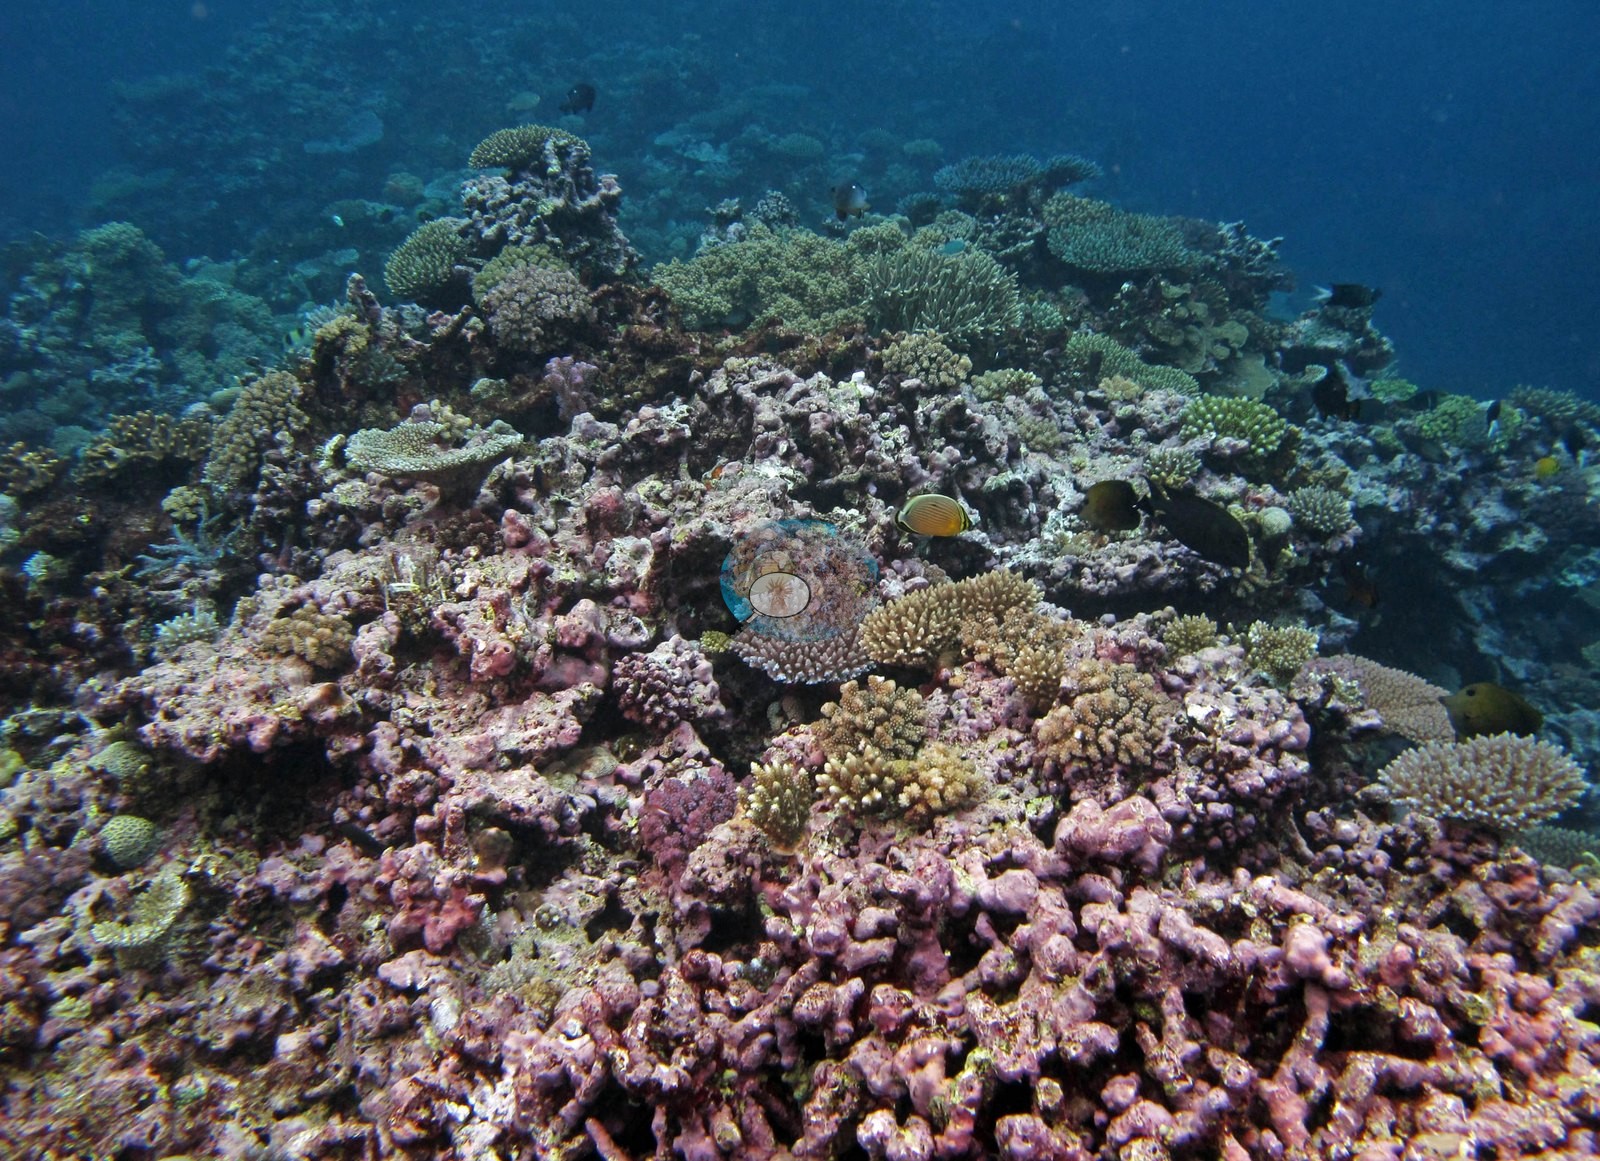
Hard coral cover averaged 33% over the 70 stations with cover, from 2.5% at FJVB64 on Vanua Balavu to 67% on the Cicia barrier reef at FJCC46. By region, Northern Lau averaged 31% (n = 36), Southern Lau 39% (n = 11) and the Moala Group 32% (n = 23), but the Northern Lau figure hides the area's sharpest contrast. Vanua Balavu averaged 19% (n = 19), with 17 of its 19 stations below 30% coral and algae covering 64% of the benthos on average, up to 90% at FJVB69. The other northern islands averaged 45% (n = 17), with Acropora-led reefs on Cicia (49%, n = 5), Nayau (48%, n = 3), and Mago, where FJMG49 held 53%. In southern Lau, Fulaga averaged 44% (n = 6) and Kabara 33% (n = 5), where FJKA32 held 62% against 19% at FJKA34. In the Moala Group, Moala averaged 33% (n = 9, up to 51% at FJML19), Totoya 32% (n = 9, down to 12% at FJTO06) and Matuku 30% (n = 5).
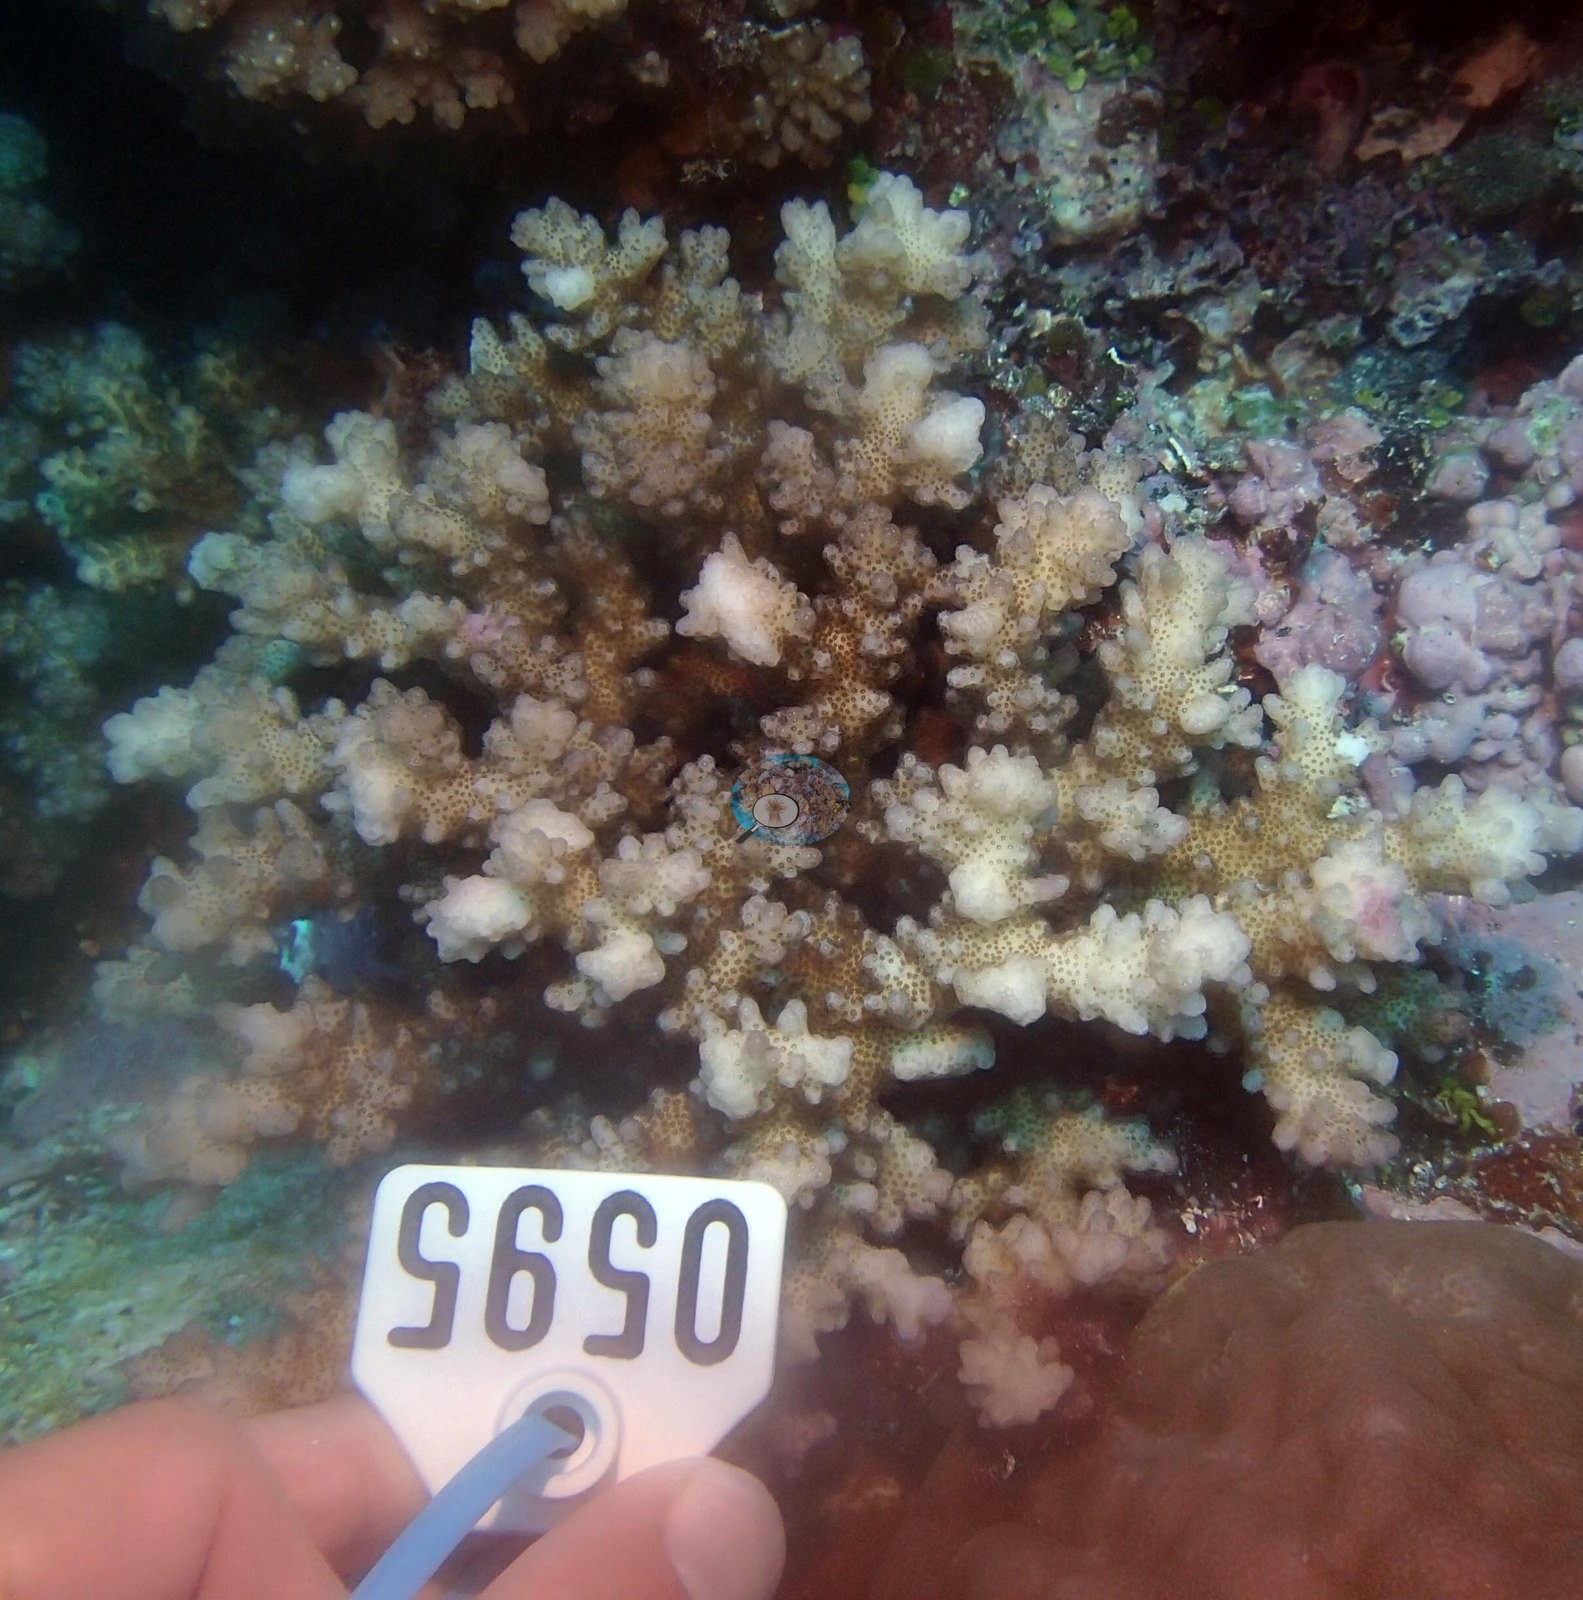
Condition was patchy rather than uniformly poor. The expedition's field report records an active crown-of-thorns outbreak on one Cicia reef, with 212 starfish removed, crown-of-thorns predation with large areas of white coral at Mago (FJMG50), and crown-of-thorns predation noted at FJVB55. Corallivorous snails (Drupella) were on Acropora at Nayau and Matuku, and cushion stars (Culcita) had scarred tables at Moala's west-side stations. Bleaching was colony-level rather than reef-wide: Anderson's sampling sheet records pale or partly bleached colonies at many stations, including colonies 80% or more bleached at FJCC44, FJMG51, FJMT13, FJVB60, FJVB63, and FJVV36, and all ten sampled at FJKA31 as partly to fully bleached; the photographs show bleached or partly bleached colonies at FJMG51, FJML21, FJMT13, FJNA38, FJNA40, FJTO04, FJTV41, FJVB60, FJVB63, FJVV35, and FJVV36 (see the thumbnails under Notable observations). The only disease records come from Vanua Balavu, where survey notes describe diseased Porites as common and a trematode-affected Diploastrea near FJVB61, along with cyanobacteria mats and old dead coral; cyanobacteria also covered 13% of the FJML15 transects on Moala. The three Vanua Vatu stations (FJVV35-FJVV37) carry a Coral Health Index of 3.50 out of 5. In the molecular-physiology screening, island-pooled scores (0-5, 5 = no outliers) ran from 5.00 at Cicia and Tuvuca to 3.75 at Kabara, and the only coral with an outlier score at each of FJVB67, FJTO05, and FJTO07 was flagged as a stress outlier.
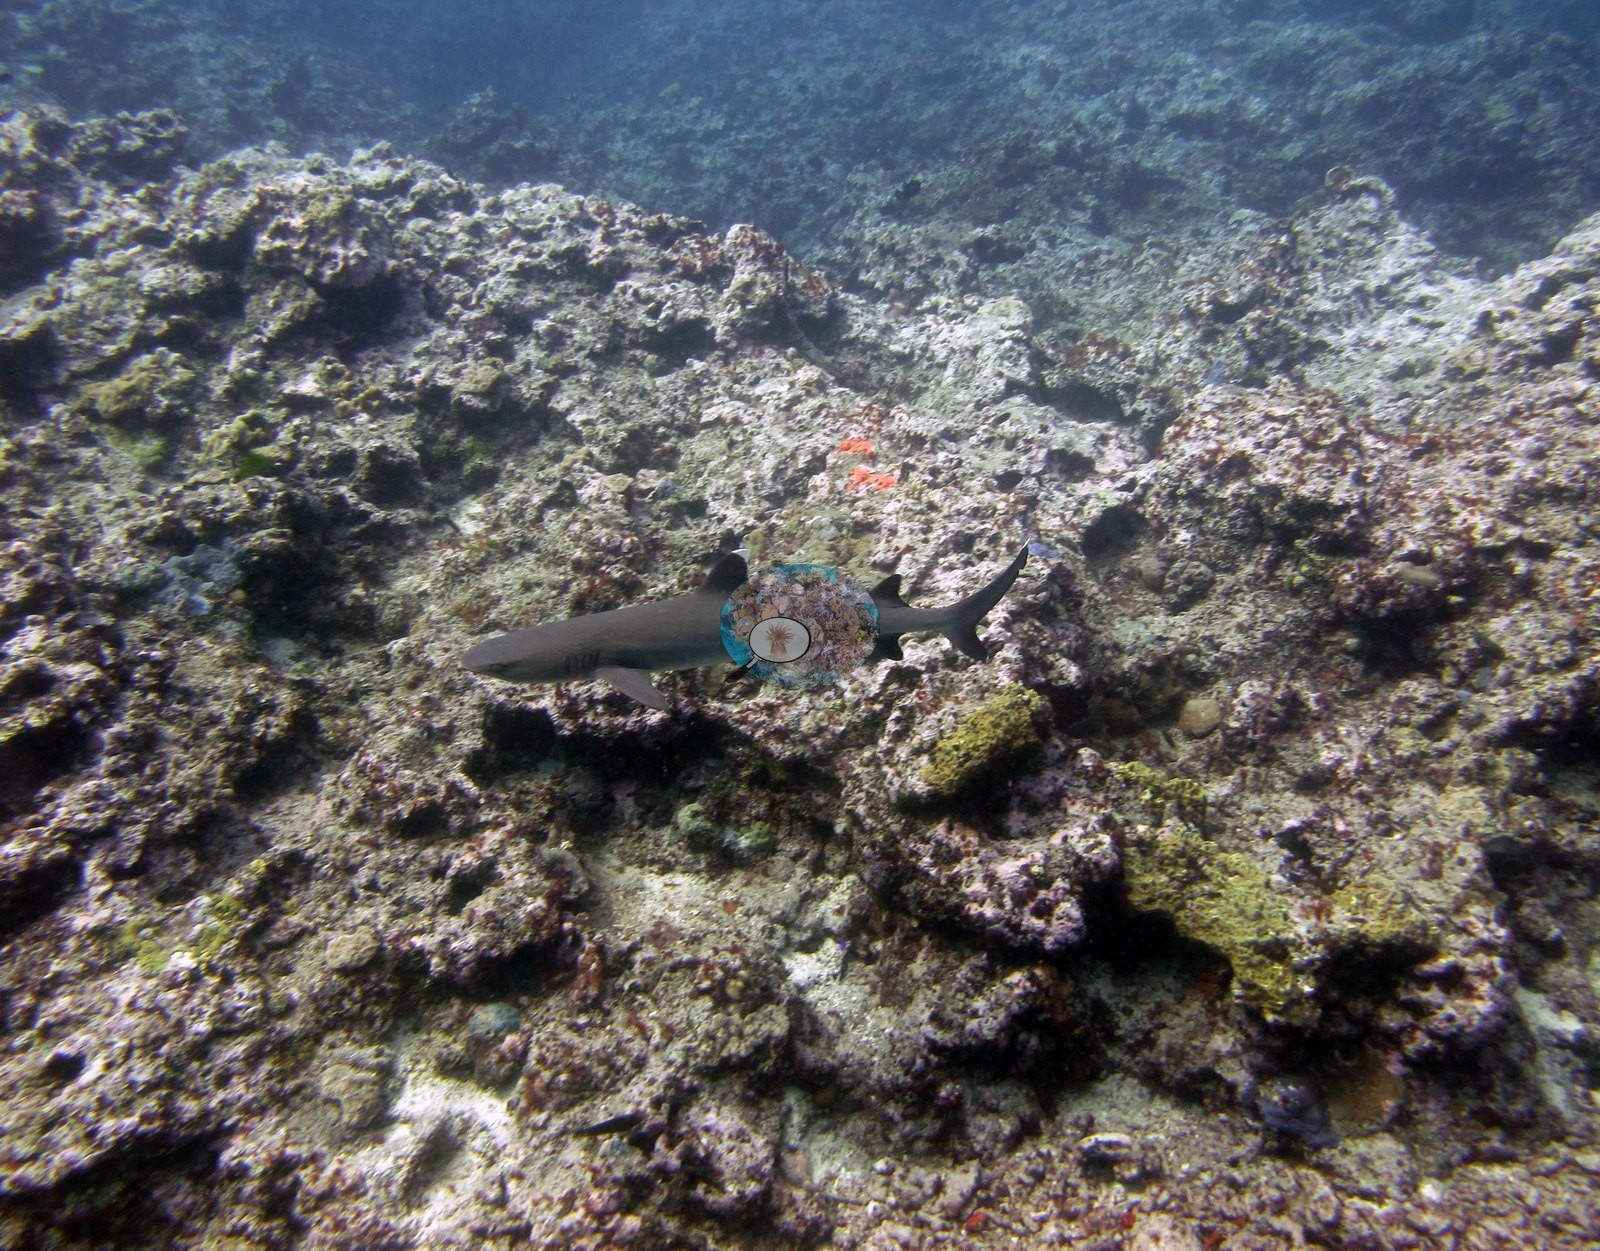
Seven stations held 50% cover or more, on Cicia, Kabara, Mago, Fulaga, Nayau, and Moala, and none on Vanua Balavu, the most heavily surveyed island and the last stop, where algae dominated. At Tuvuca, FJTV42 carries near-continuous staghorn meadows. Sightings included a manta ray at FJVB65, spotted eagle rays at FJTV42, a dogtooth tuna at FJVB54, whitetip and other reef sharks, and giant clams on Cicia, Mago, Nayau, Vanua Vatu, Vanua Balavu, Totoya, and Moala.
Highlights
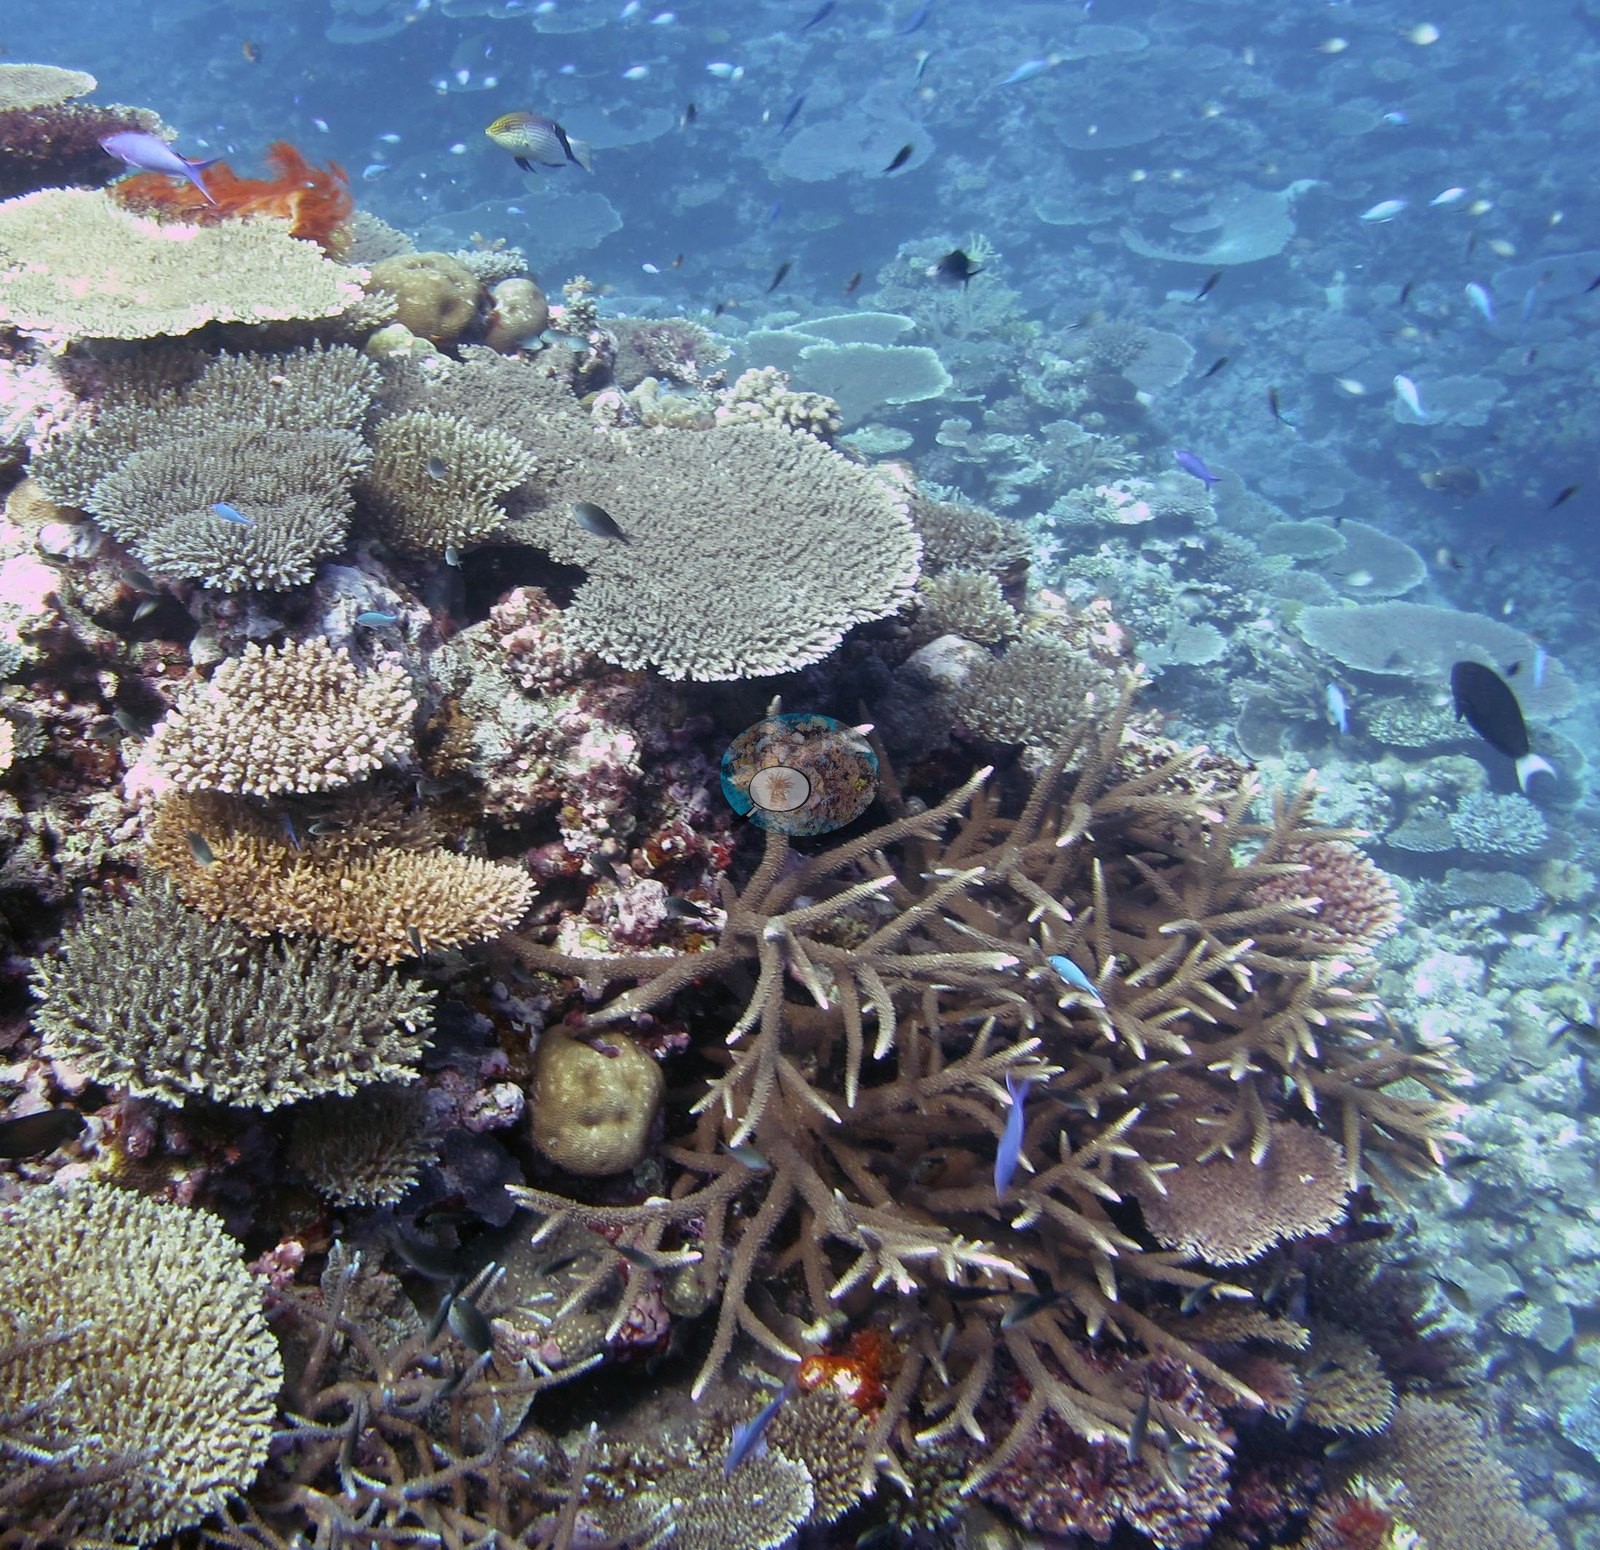
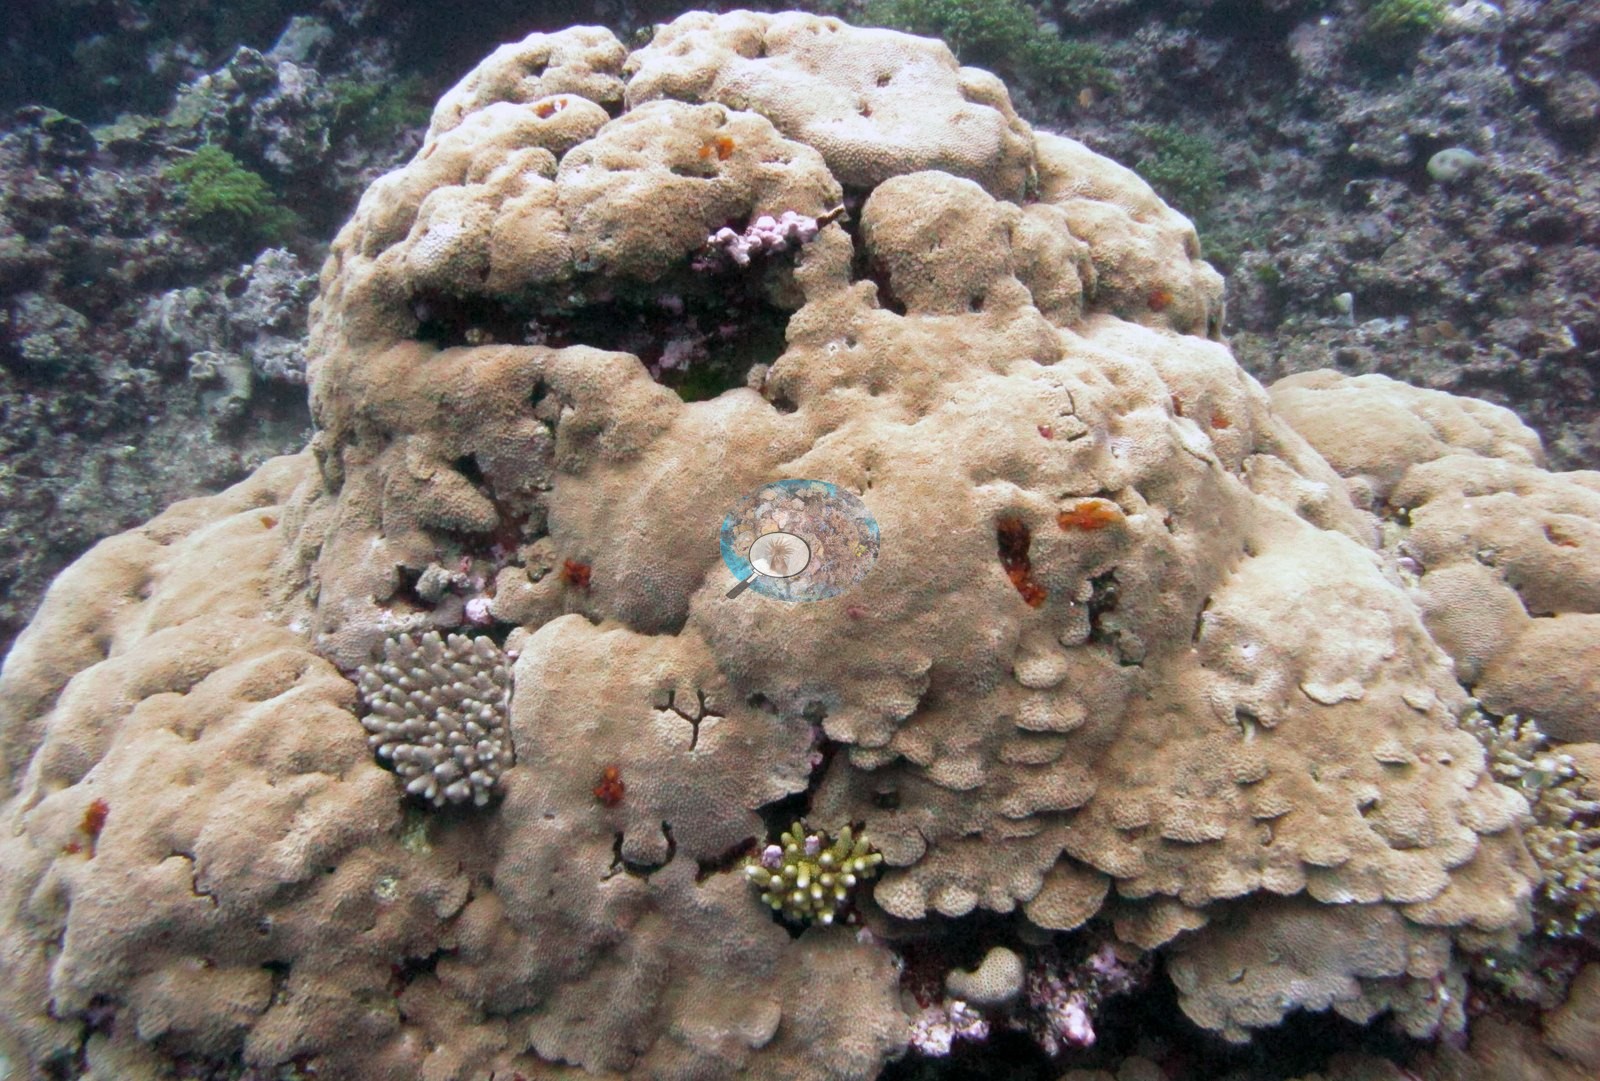
- Cover of 67% on the Cicia barrier reef (FJCC46), and a flat-topped coral mountain paved with table Acropora (FJCC45).
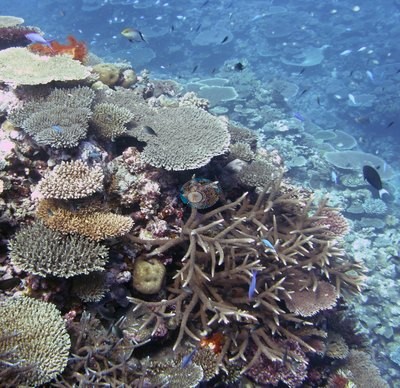
- Near-continuous staghorn Acropora meadows with spotted eagle rays at Tuvuca, which Anderson's photo labels single out as a highlight of the trip (FJTV42).
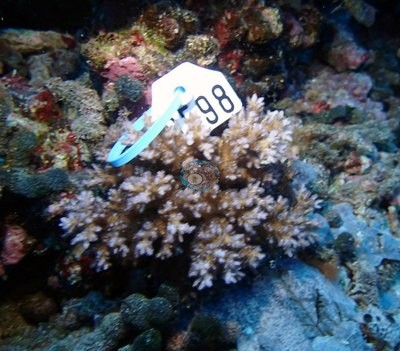
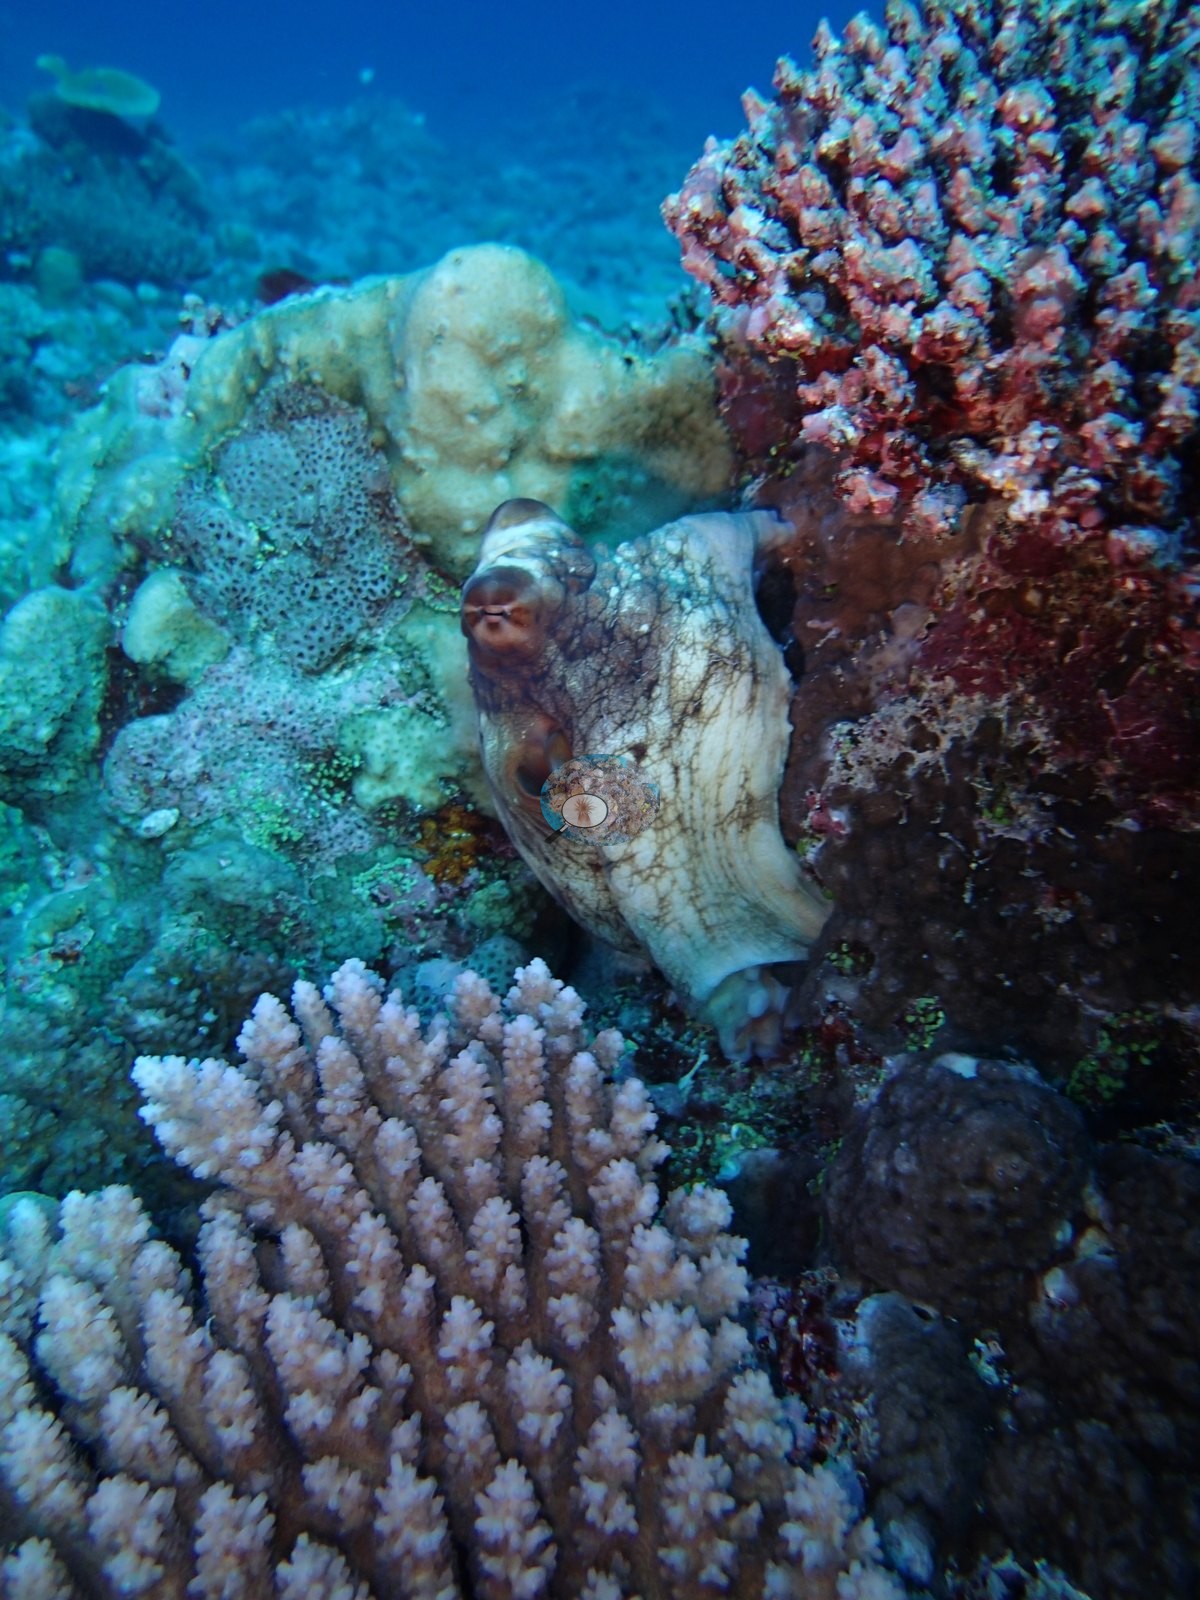
- An acroporid-dominated Mago slope at 53% cover, with a day octopus (FJMG49).
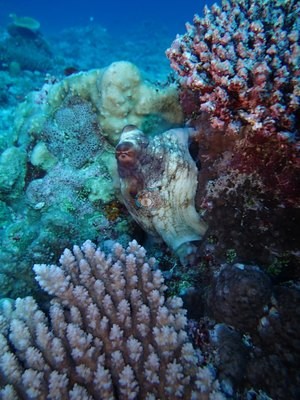
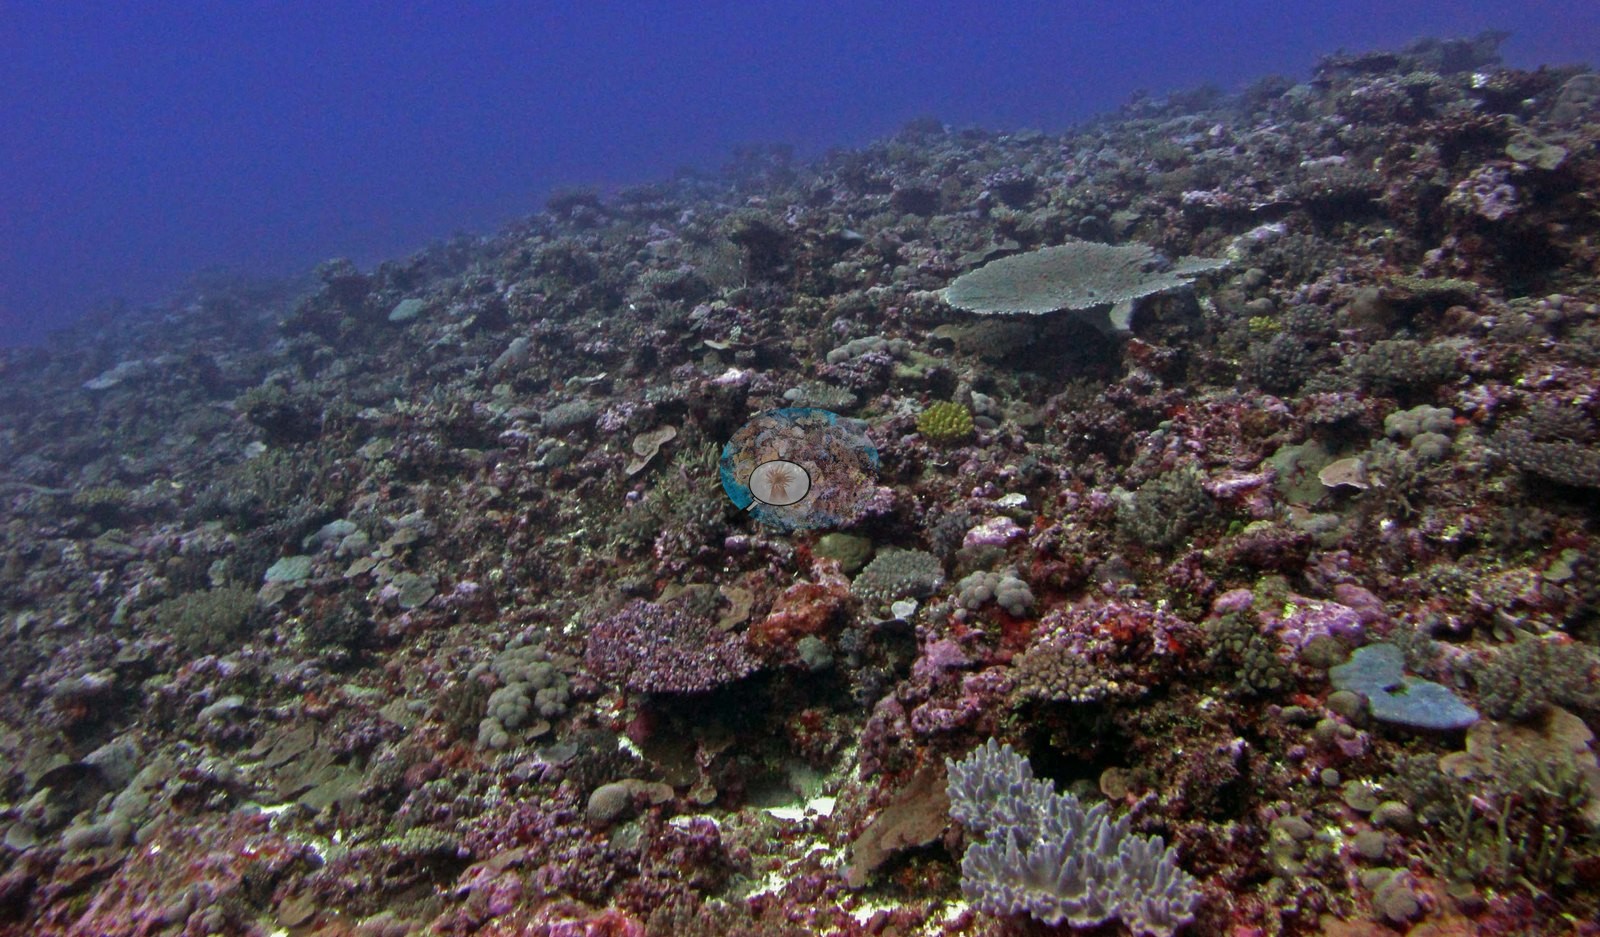
- Vanua Balavu was algae-dominated: 17 of its 19 stations below 30% coral, down to 2.5%, with algae up to 90% (FJVB69, FJVB64).
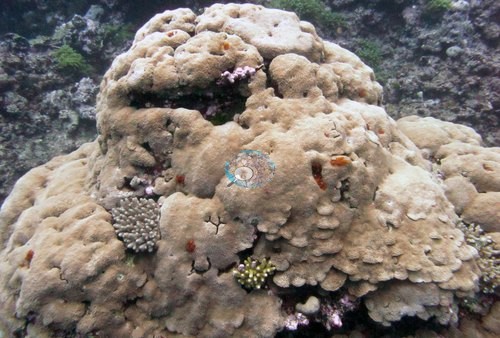
- Cover of 51% on Moala's west-side fore reef (FJML19), and large tables with continuous staghorn on the Totoya crest (FJTO05).
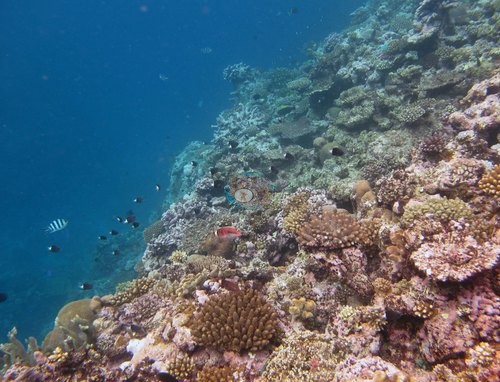
- A seamount summit off Matuku where pink coralline algae in places covers more ground than live coral (FJMT14).
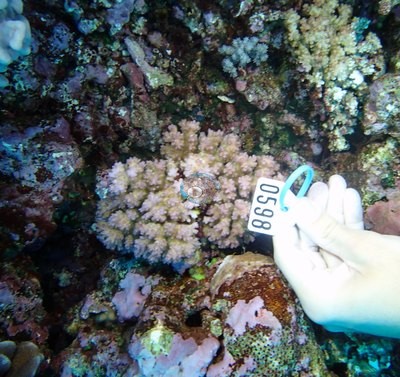
- Kabara held 62% coral at FJKA32 and 19% at a neighboring station, FJKA34.
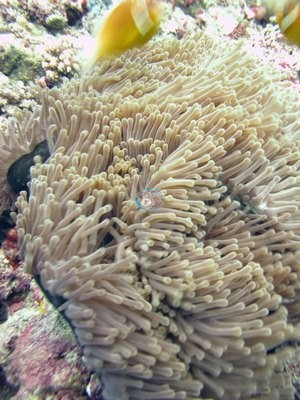
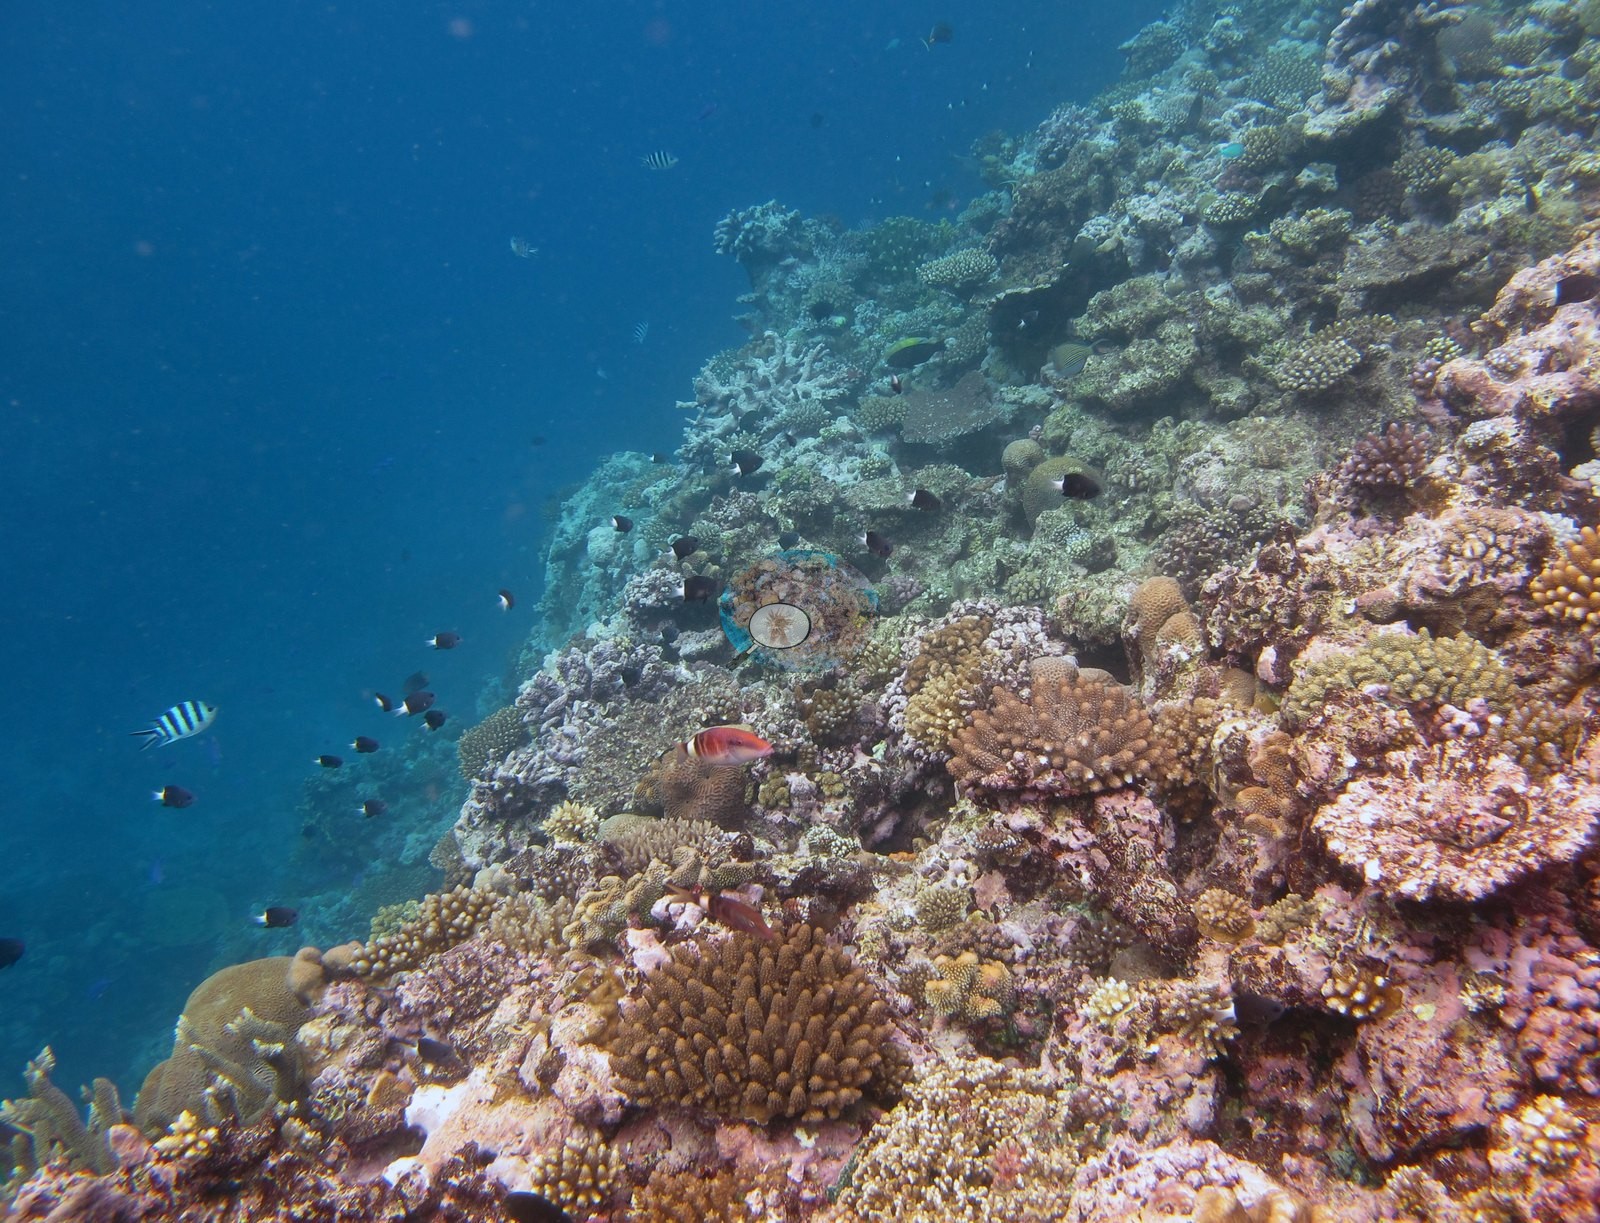
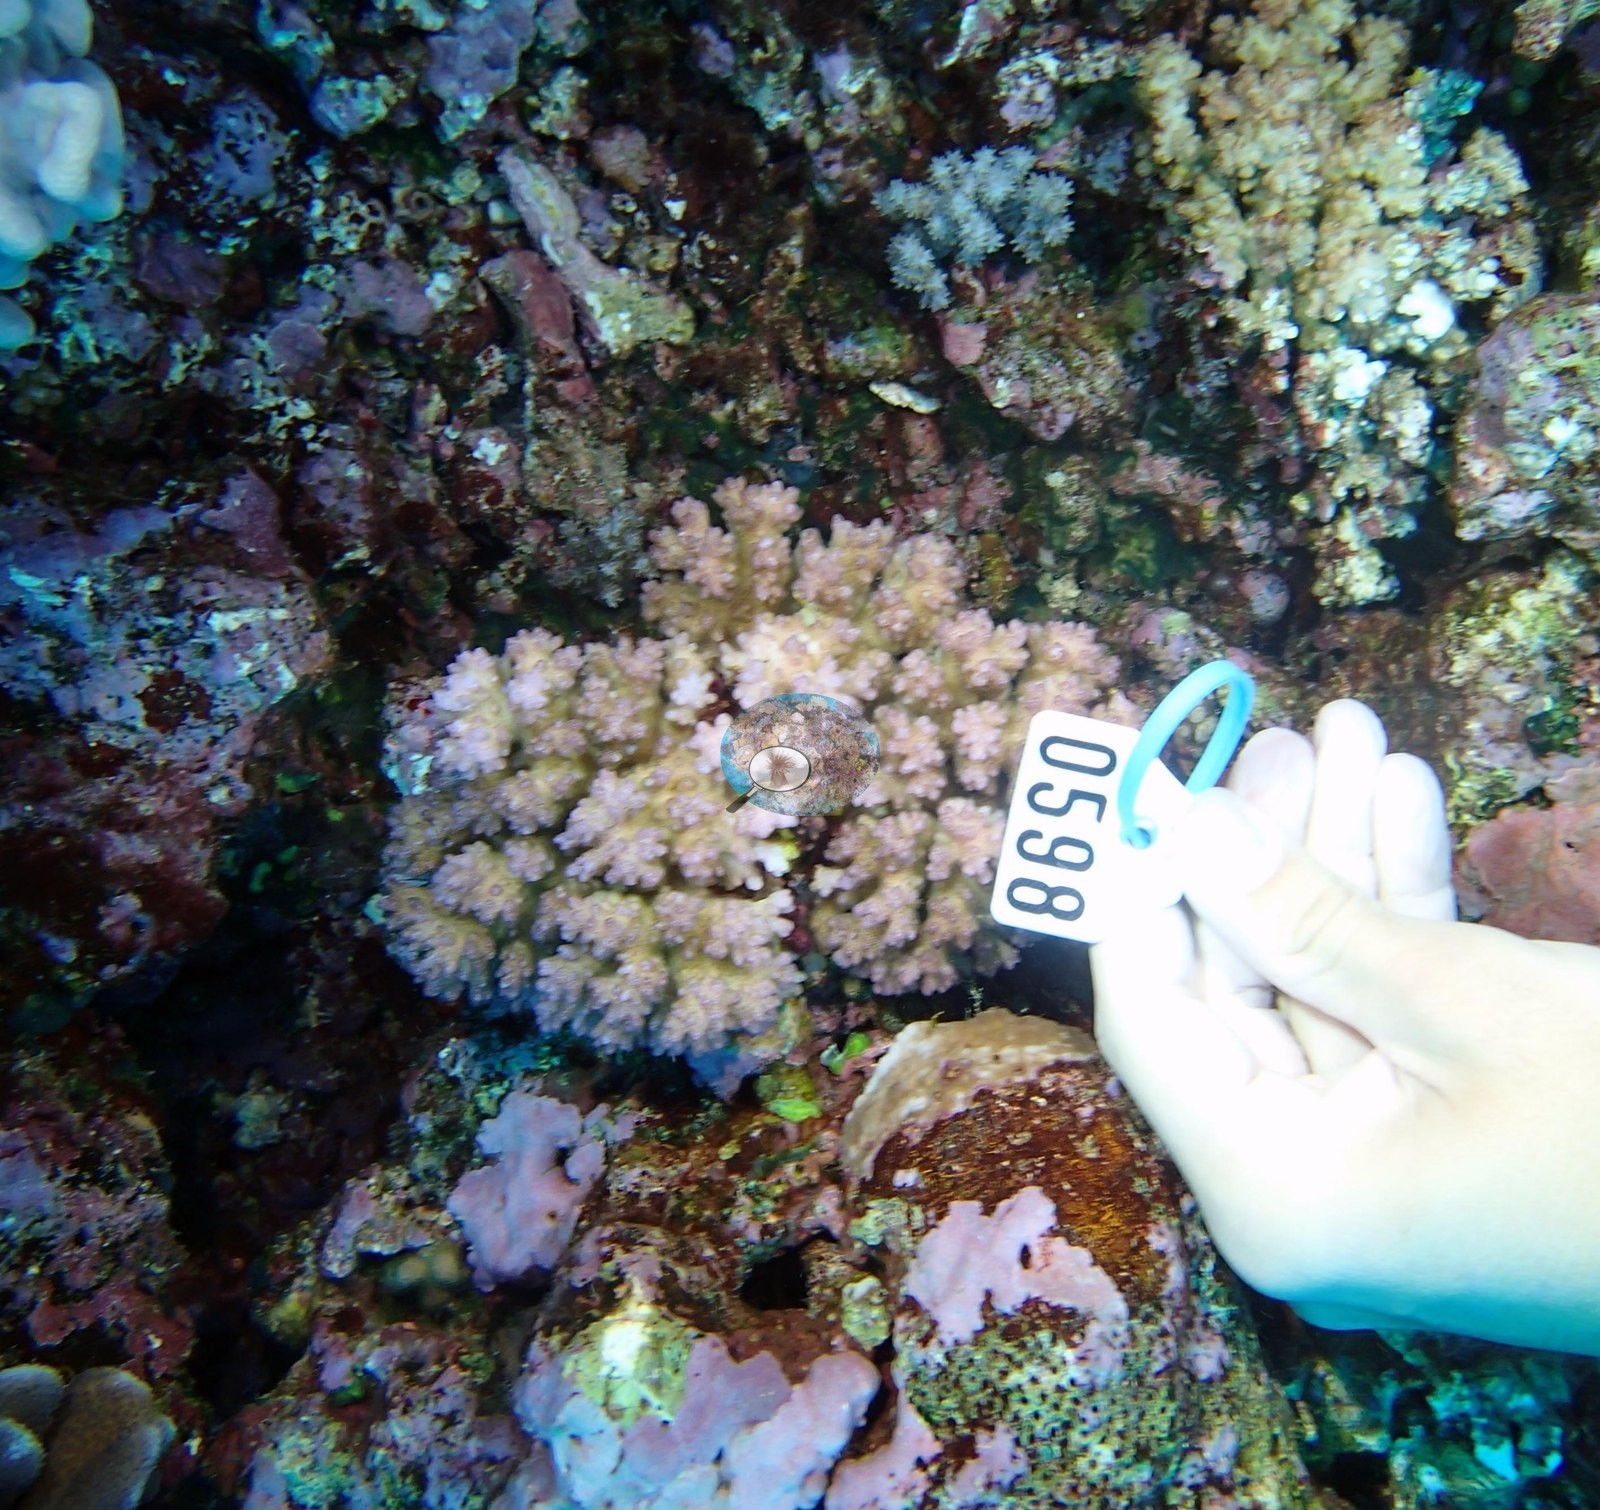
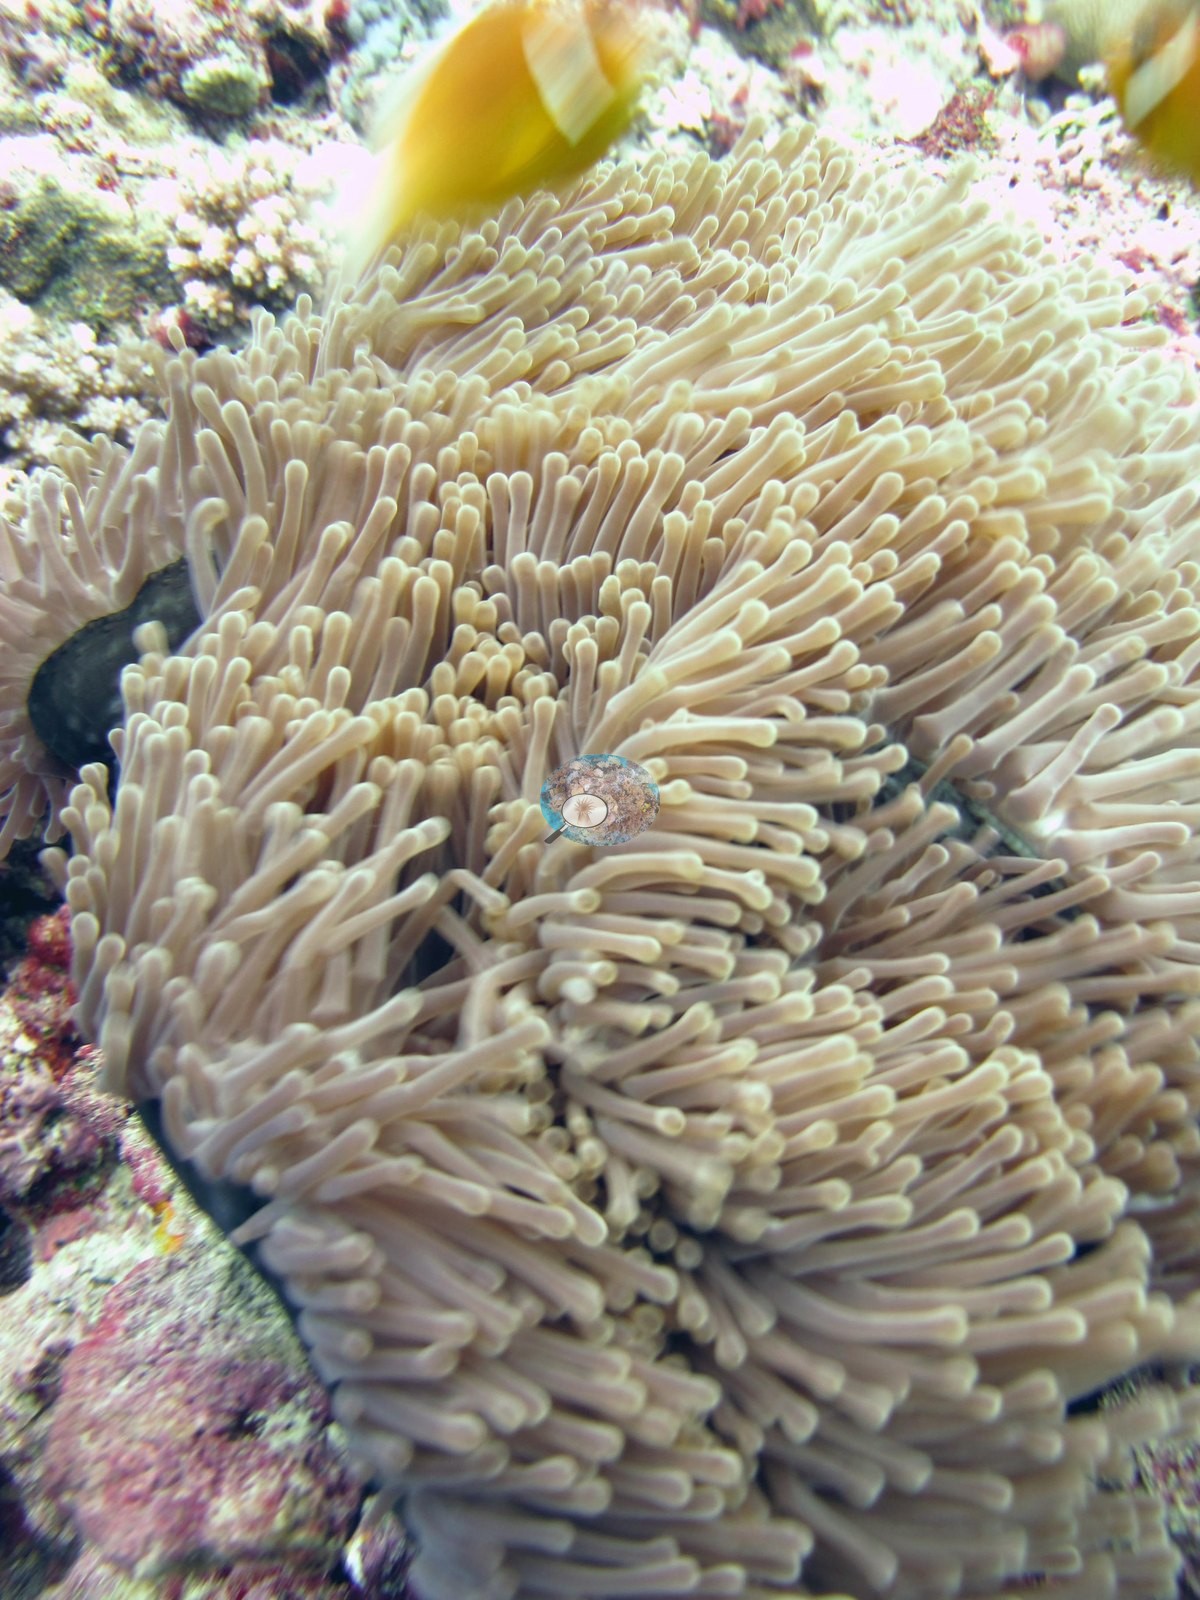
Notable observations (16)
- Fiji - Cicia (FJCC46): Crown-of-thorns outbreak (field report): 212 crown-of-thorns starfish (COTS) were removed from one outbreak reef on Cicia, where hundreds were found in very shallow water down to about 15 m; the report does not tie that reef to a surveyed station. The FJCC46 transects logged 7.3% dead coral. No starfish or feeding scars appear in the photographs of the other Cicia stations.
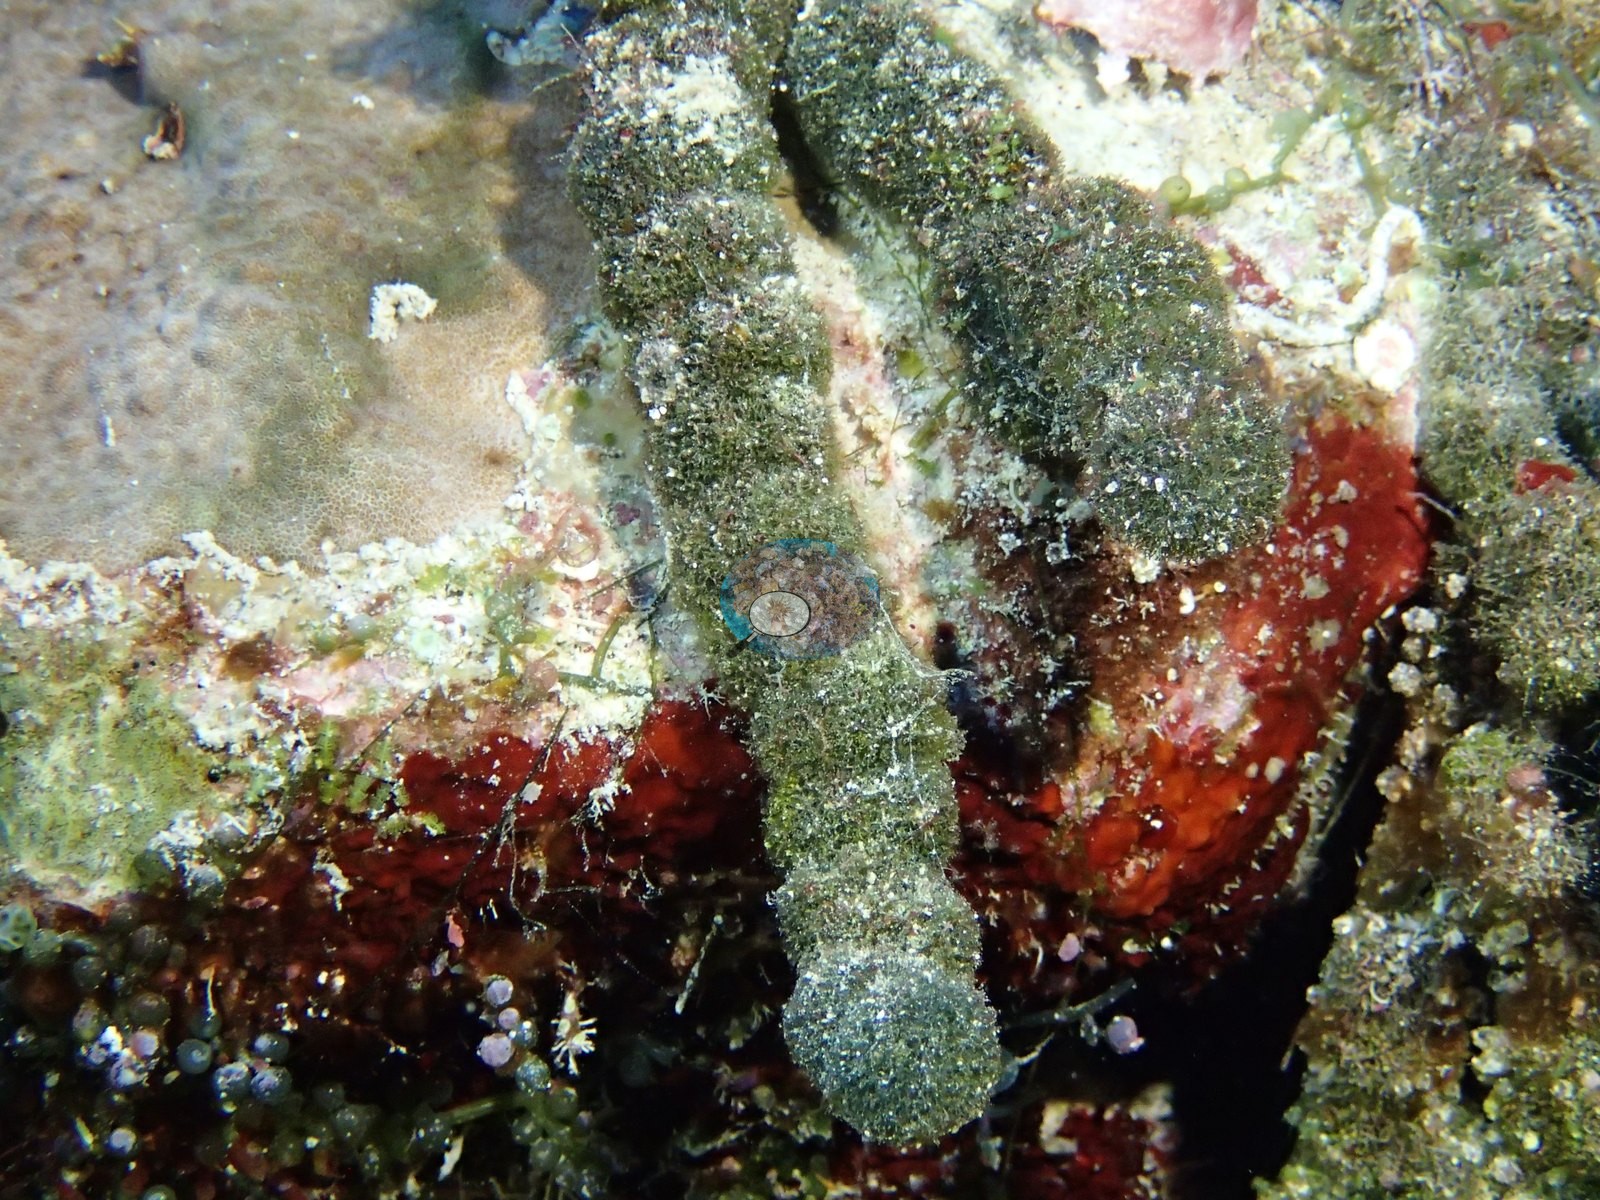
 photo: Fiji - Cicia (FJCC44)
- Fiji - Mago (FJMG50): Survey notes record COTS predation with large areas of white corals; two large tables look pale under a strong blue cast (paling cannot be separated from natural pale color in these frames), and Anderson's sampling sheet records two of the five colonies sampled here as partly bleached (50% and 20%); several large tables turned over from possible storm damage.
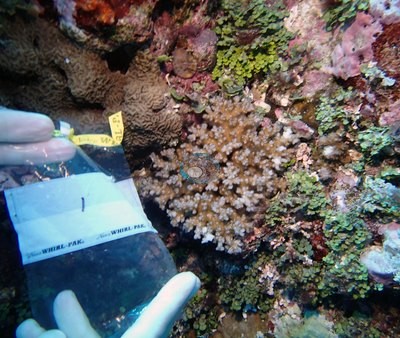
- Fiji - Vanua Balavu (FJVB55): "Some COTS predation found at FJVB55" (stated in the survey notes).
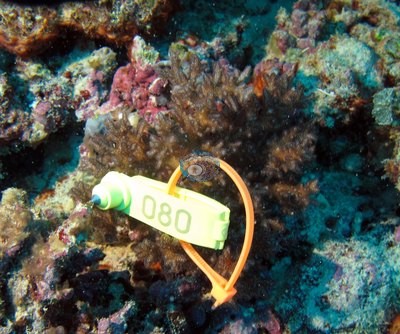
- Fiji - Vanua Balavu (FJVB61): Diploastrea at 20 m had a mortality gradient with what appears to be a high trematode abundance; diseased Porites were also common (survey notes).
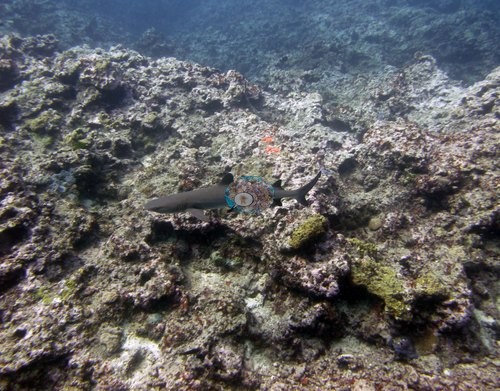
- Fiji - Vanua Balavu (FJVB67): Physiological stress outliers: the one coral colony Anderson sampled here (F153, recorded on the sheet as 10% bleached) was flagged as a physiological stress outlier (Mayfield et al. 2017, PLoS ONE); island-level screening flagged 4 of the 18 corals with an outlier score.
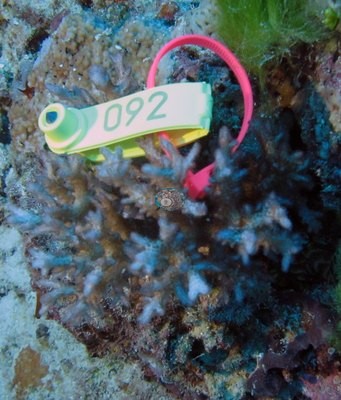
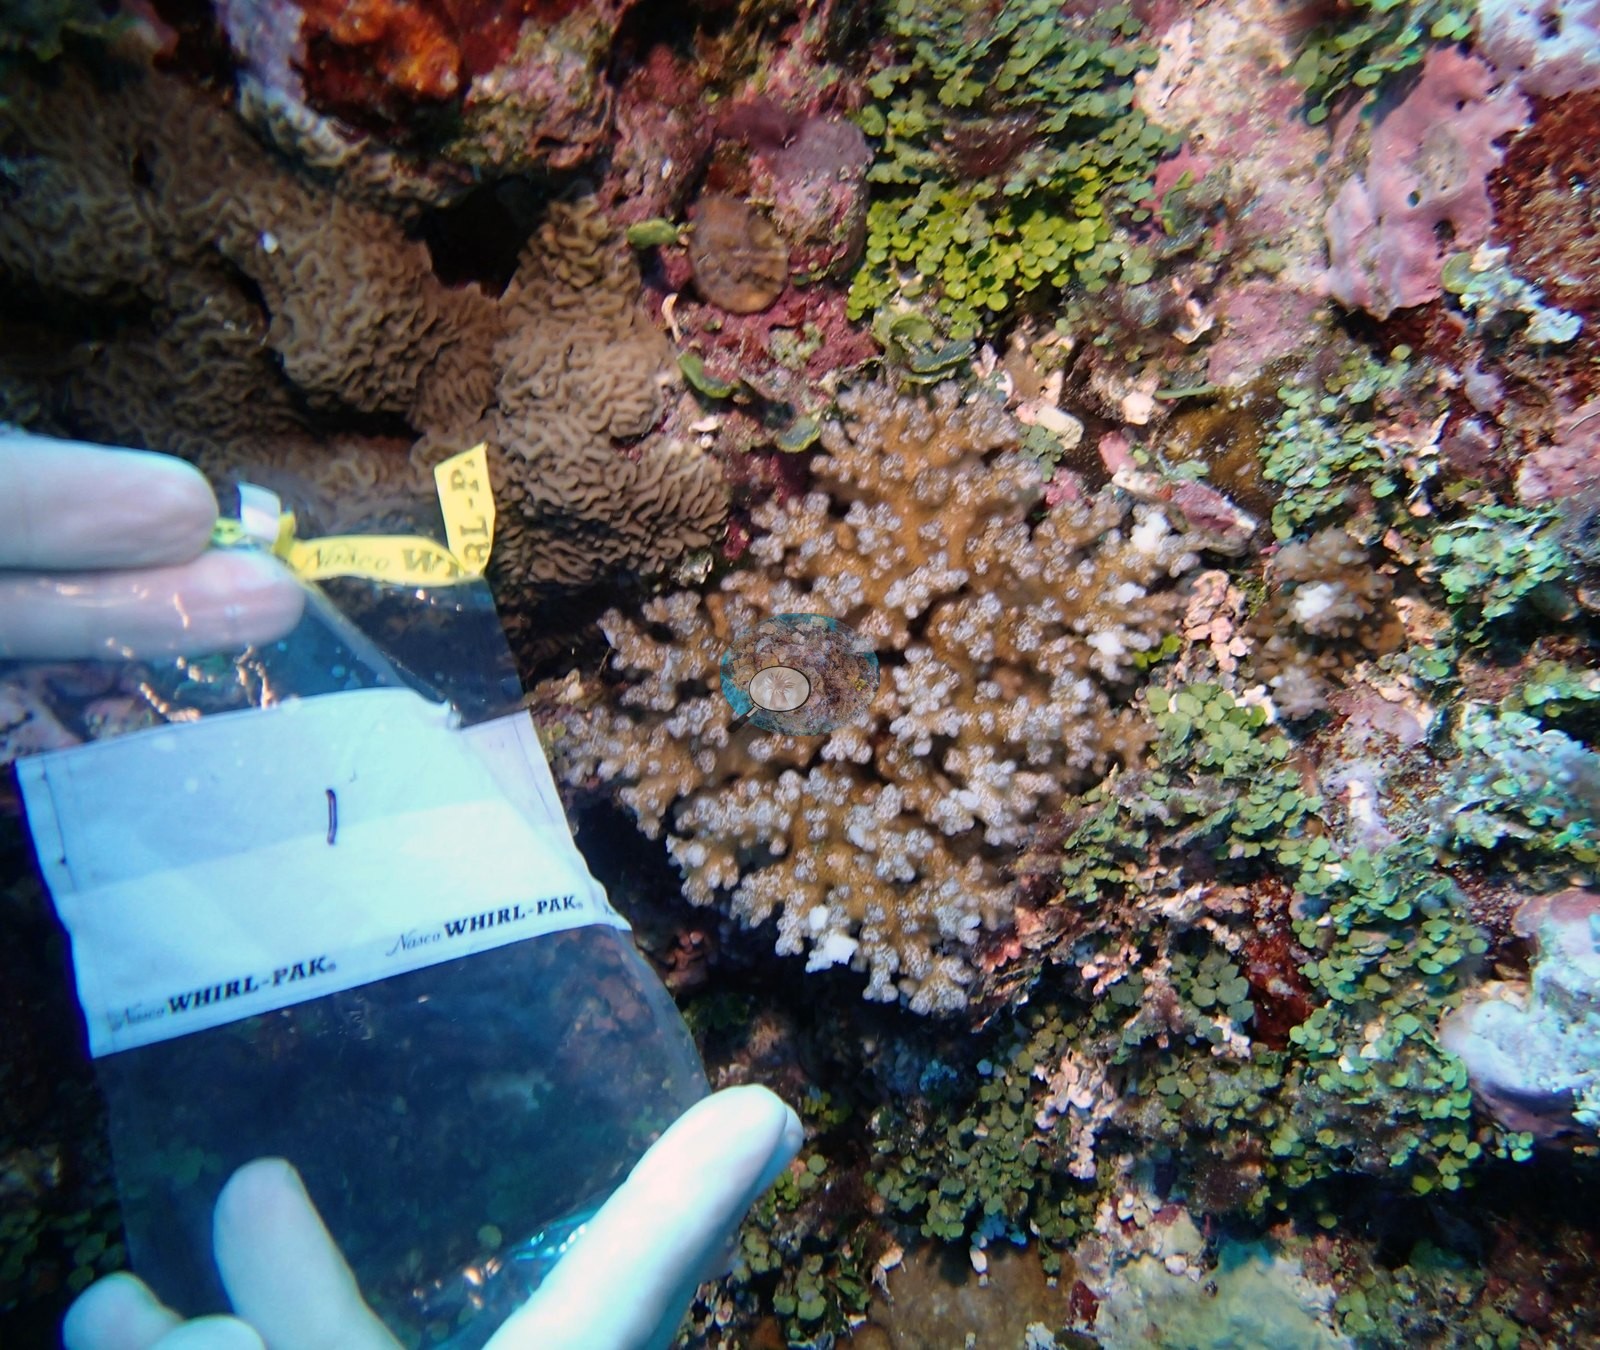
- Fiji - Nayau (FJNA40): Bleaching: a bushy pocilloporid Anderson recorded as bleached, uniformly cream-white, and a second pocilloporid with pale, partly bleached tissue between still-brown polyps (single colonies, no extent inferred). The survey team's notes for Nayau's northwest side record Drupella snails on several Acropora colonies (station not stated). No crown-of-thorns starfish recorded.
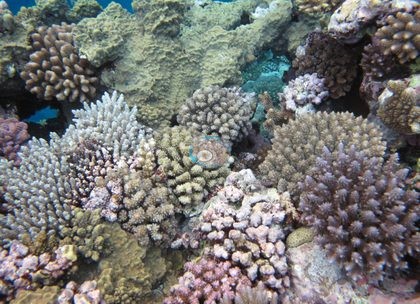
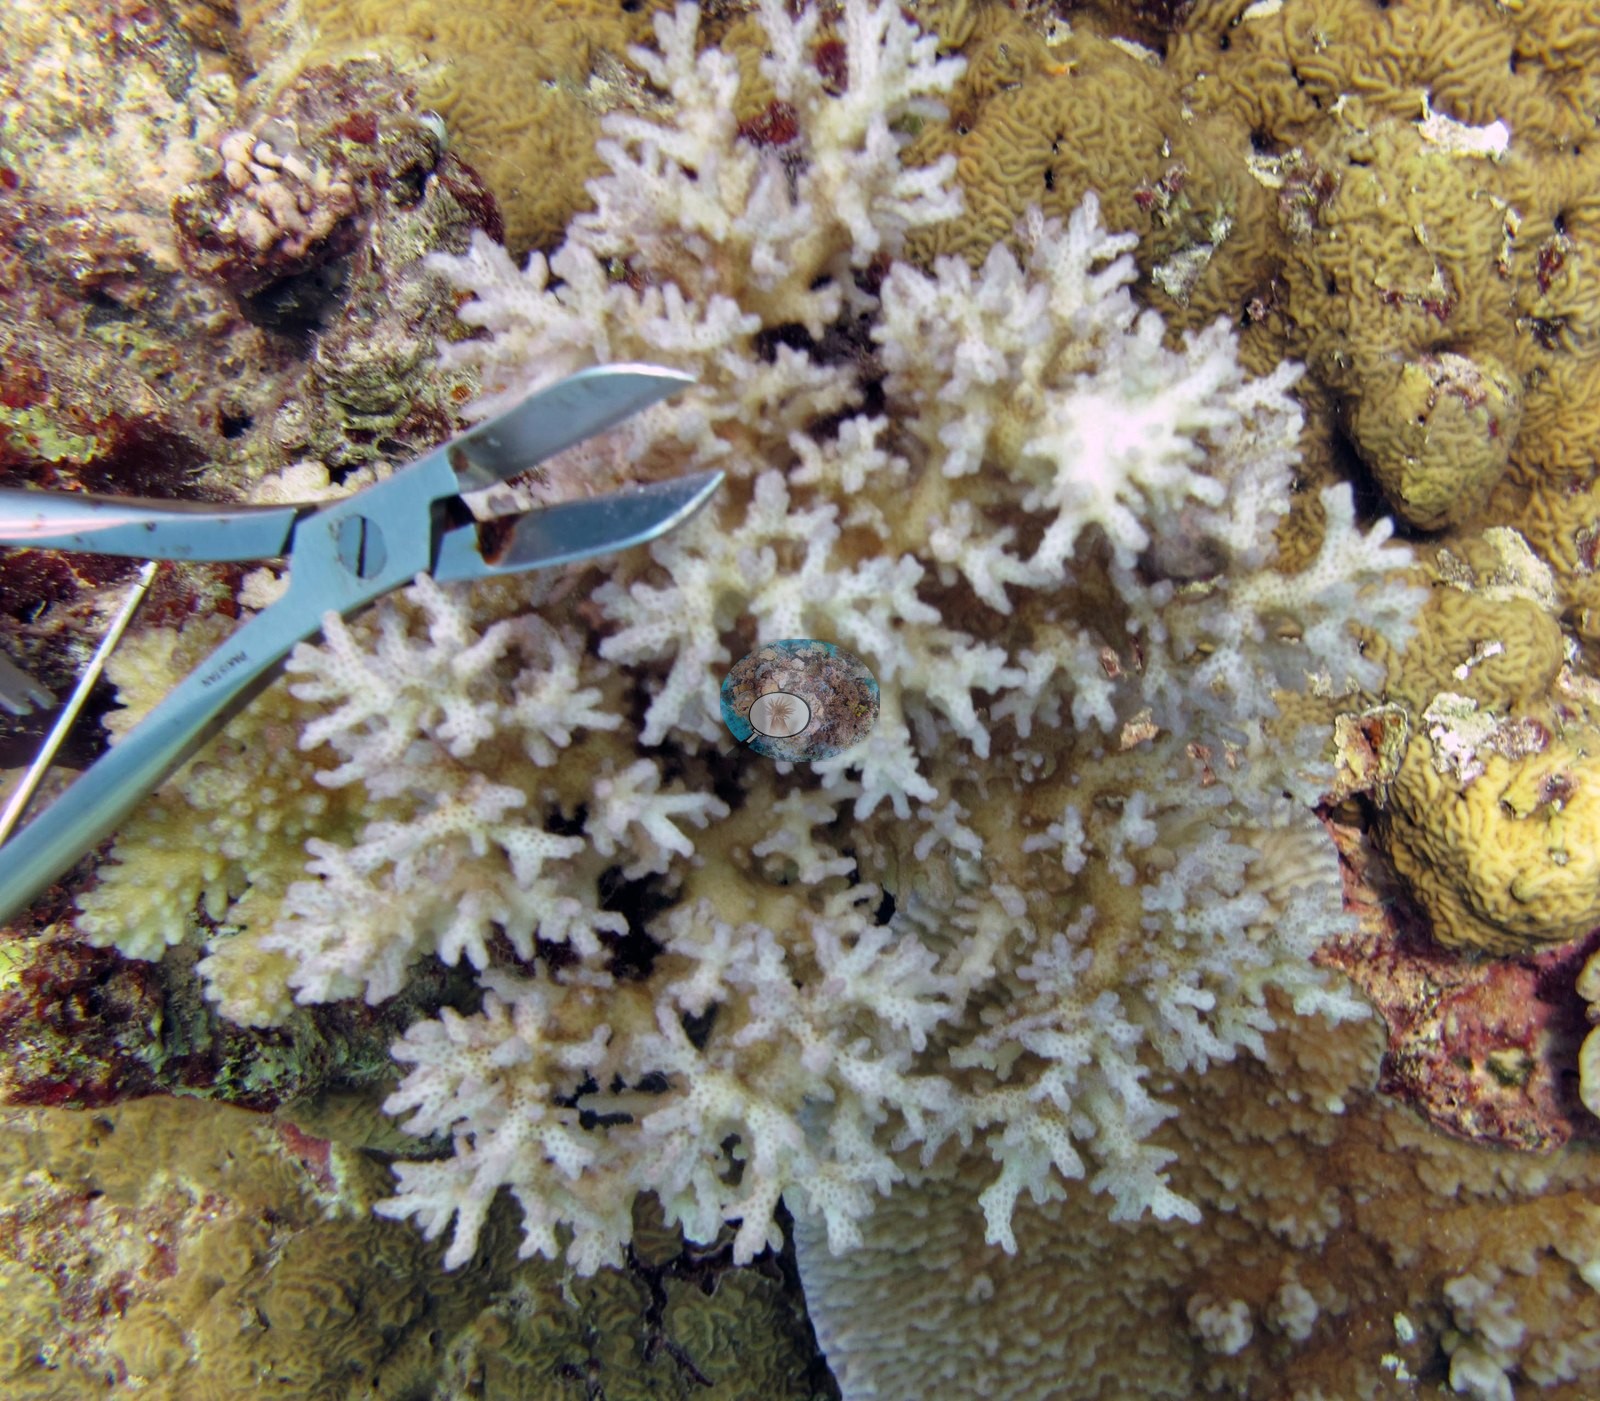
- Fiji - Mago (FJMG51): One Pocillopora damicornis colony labeled "bleached Pdam" by Anderson, stark white beside pigmented neighbors; the sampling sheet records two of the three colonies sampled here as 80–95% bleached (no reef-wide extent inferred).
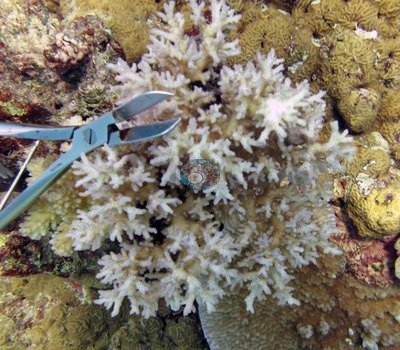
- Fiji - Moala (FJML19): Corallivores: some evidence of feeding scars on table and plating corals, likely due to an increase in cushion stars (Culcita) at the two west-side stations, FJML19 and FJML20 (Moala survey note).
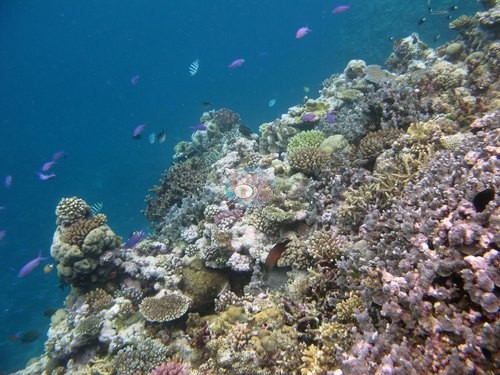
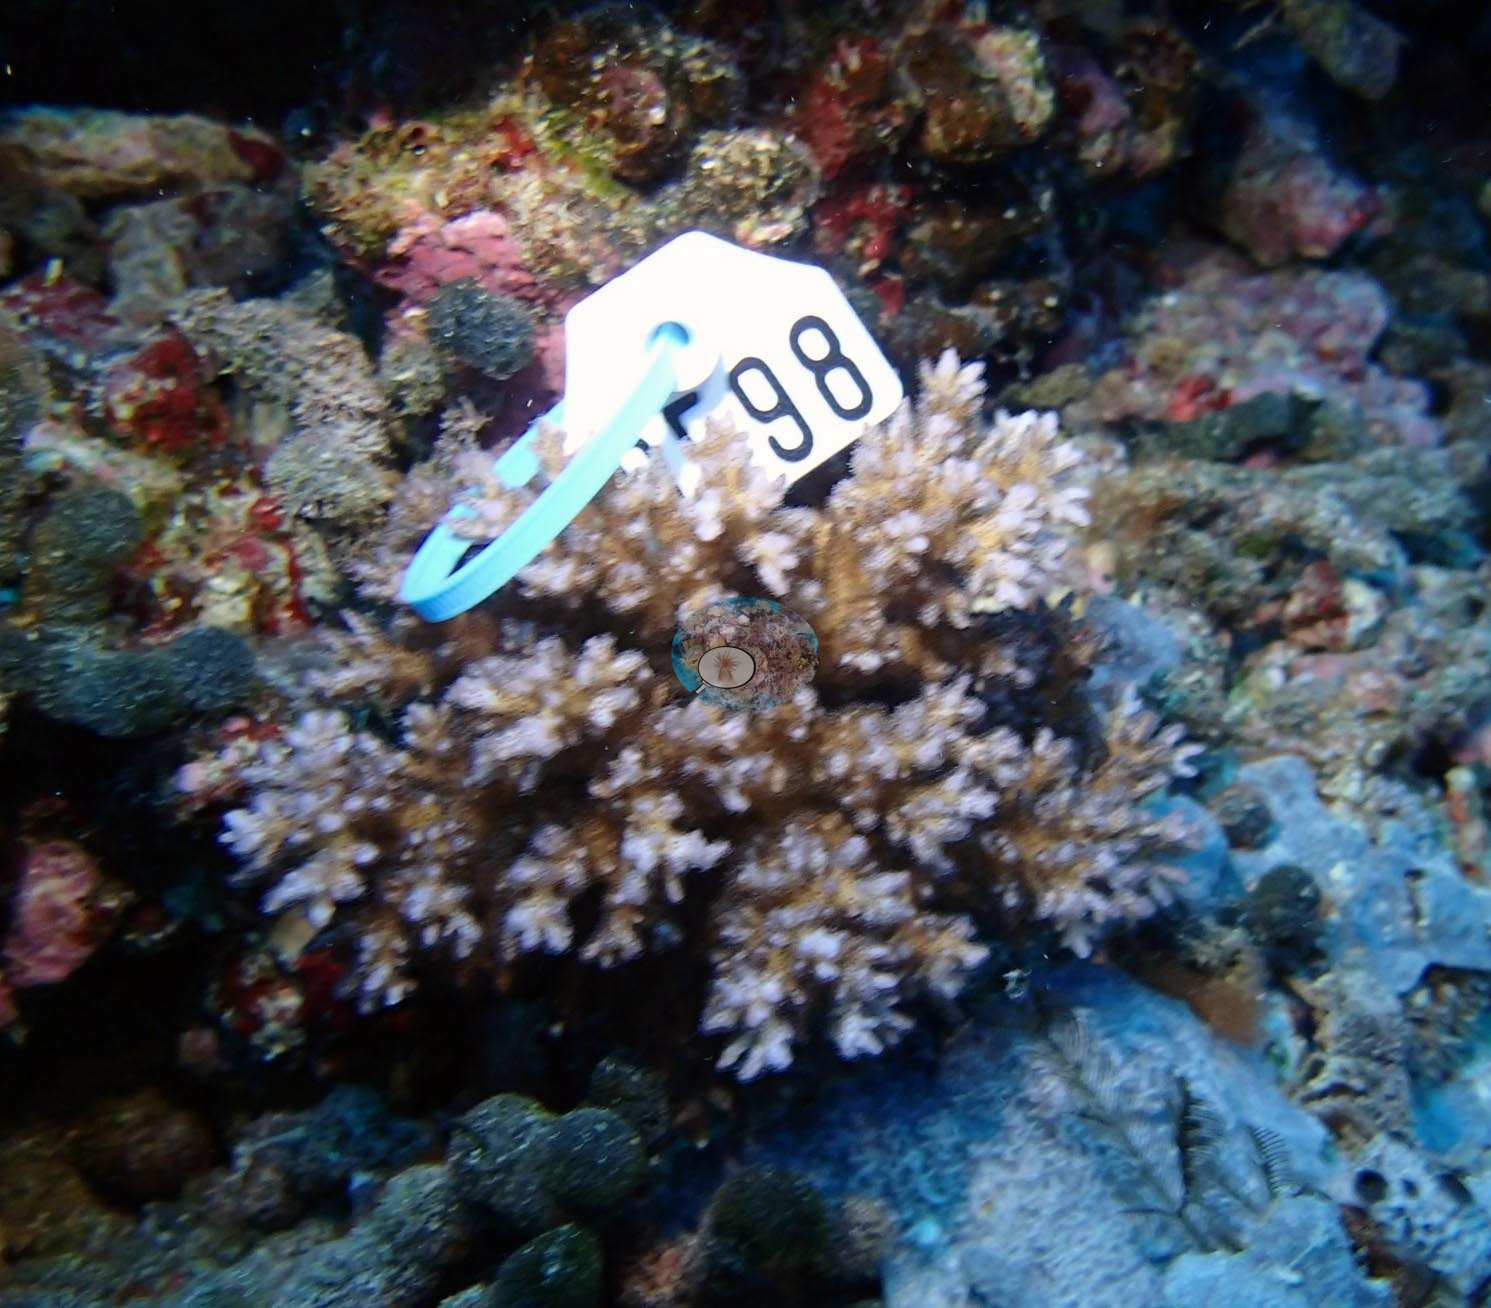
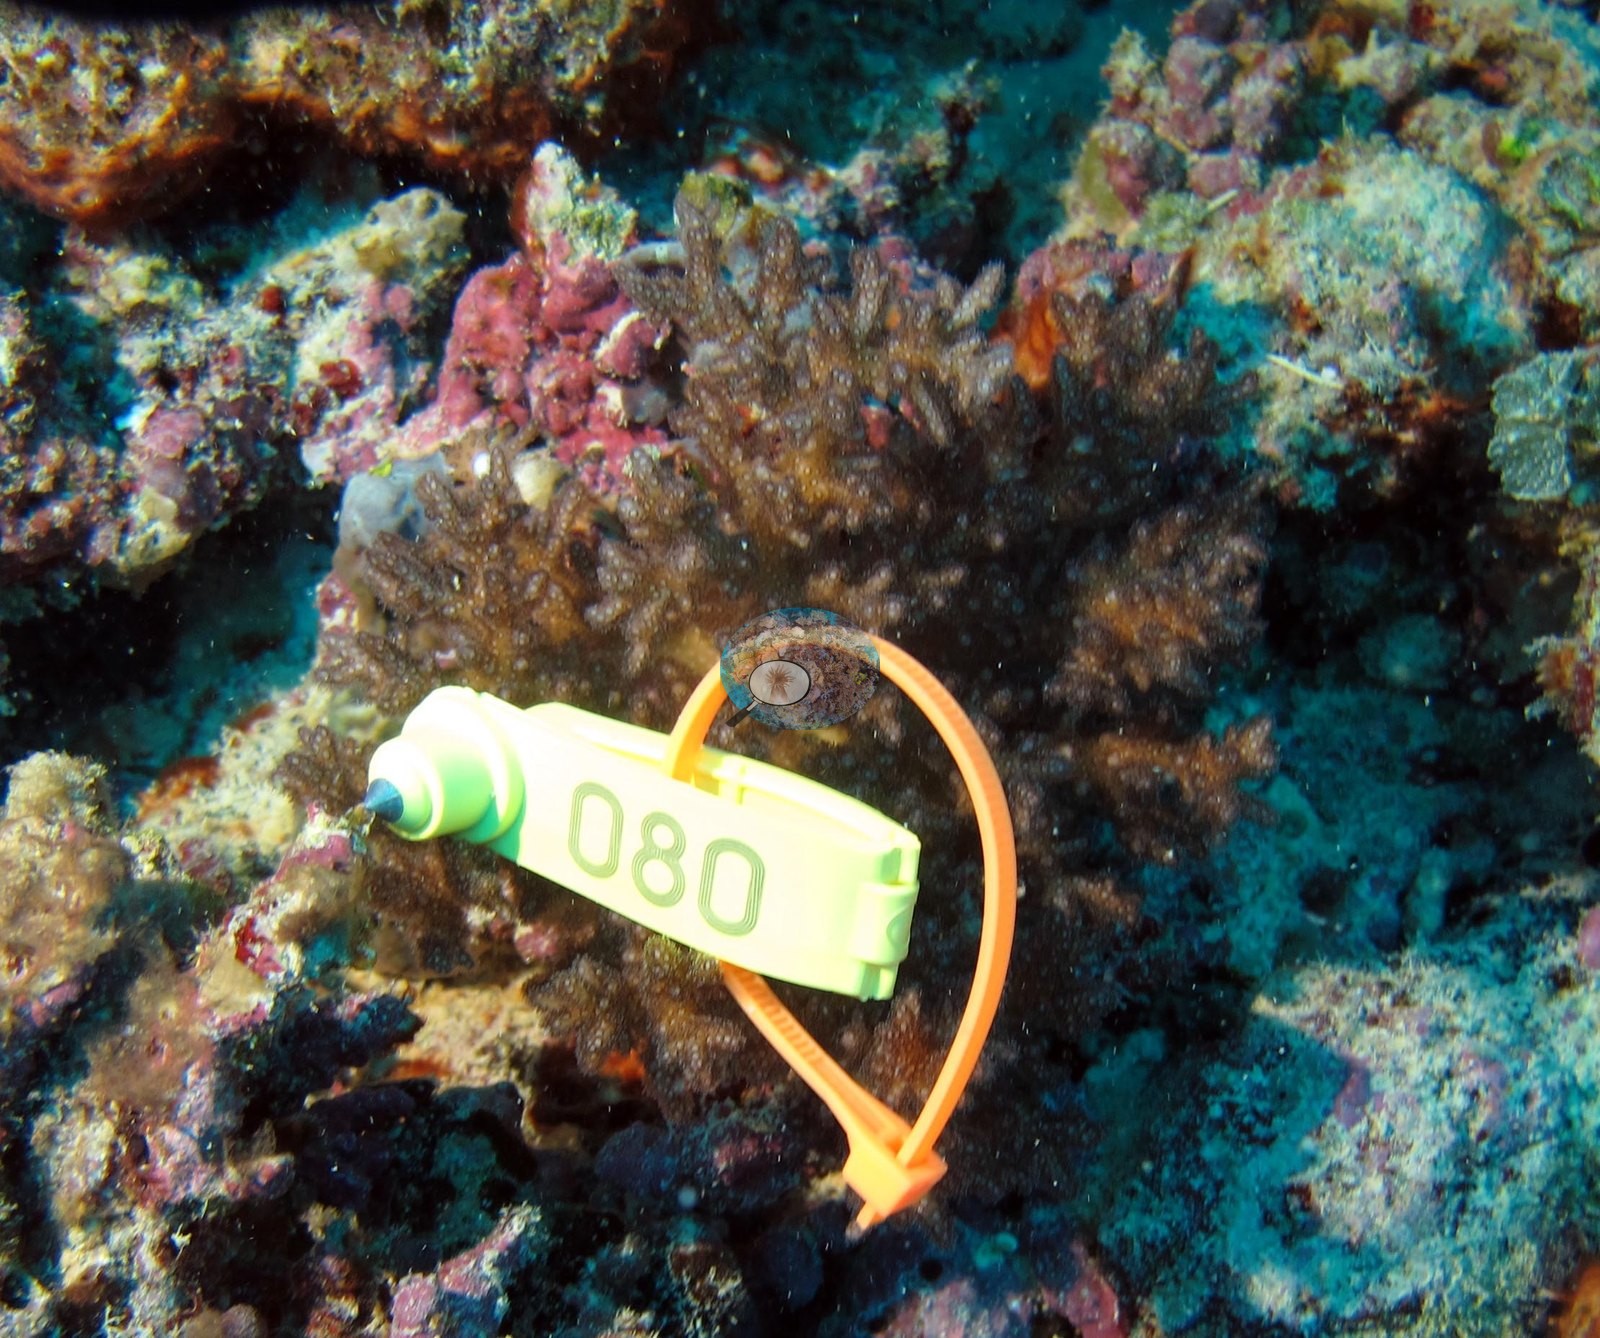
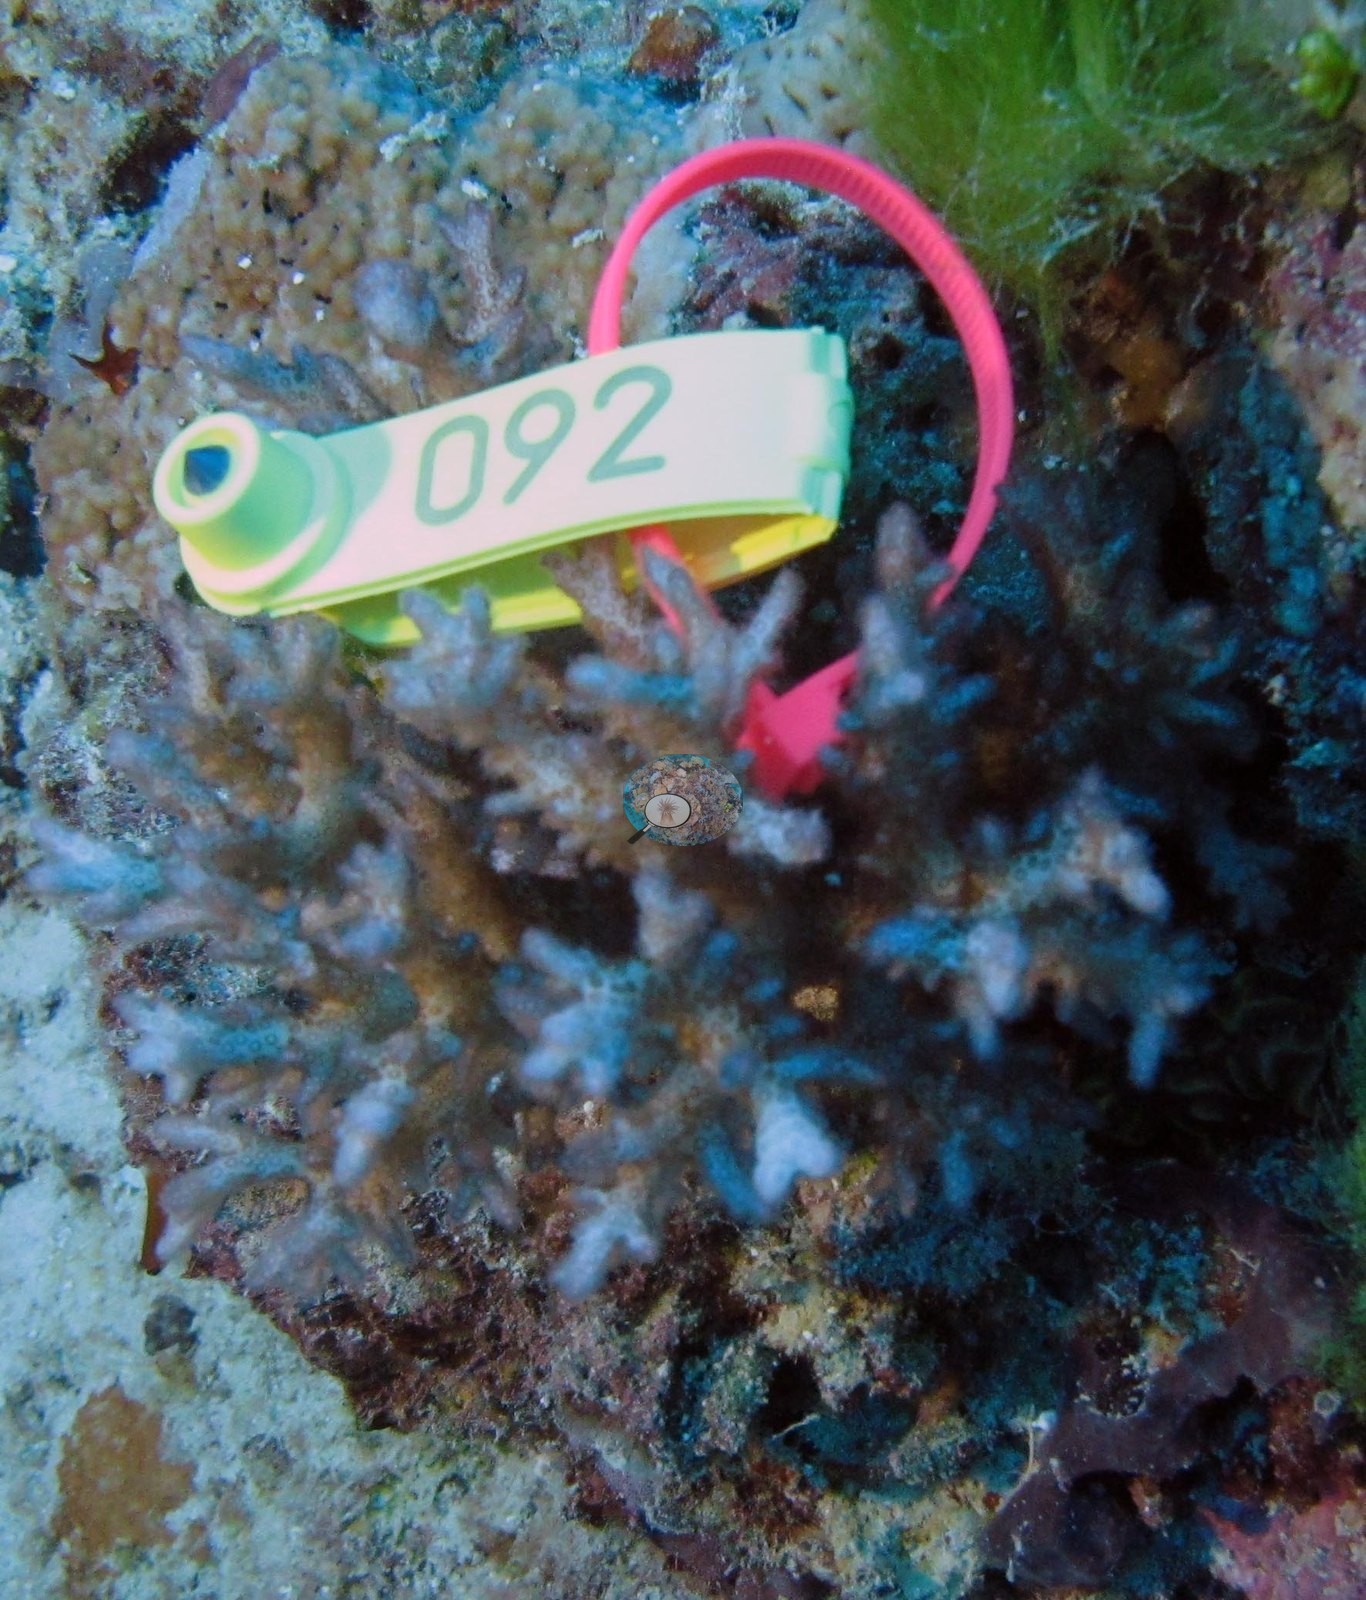
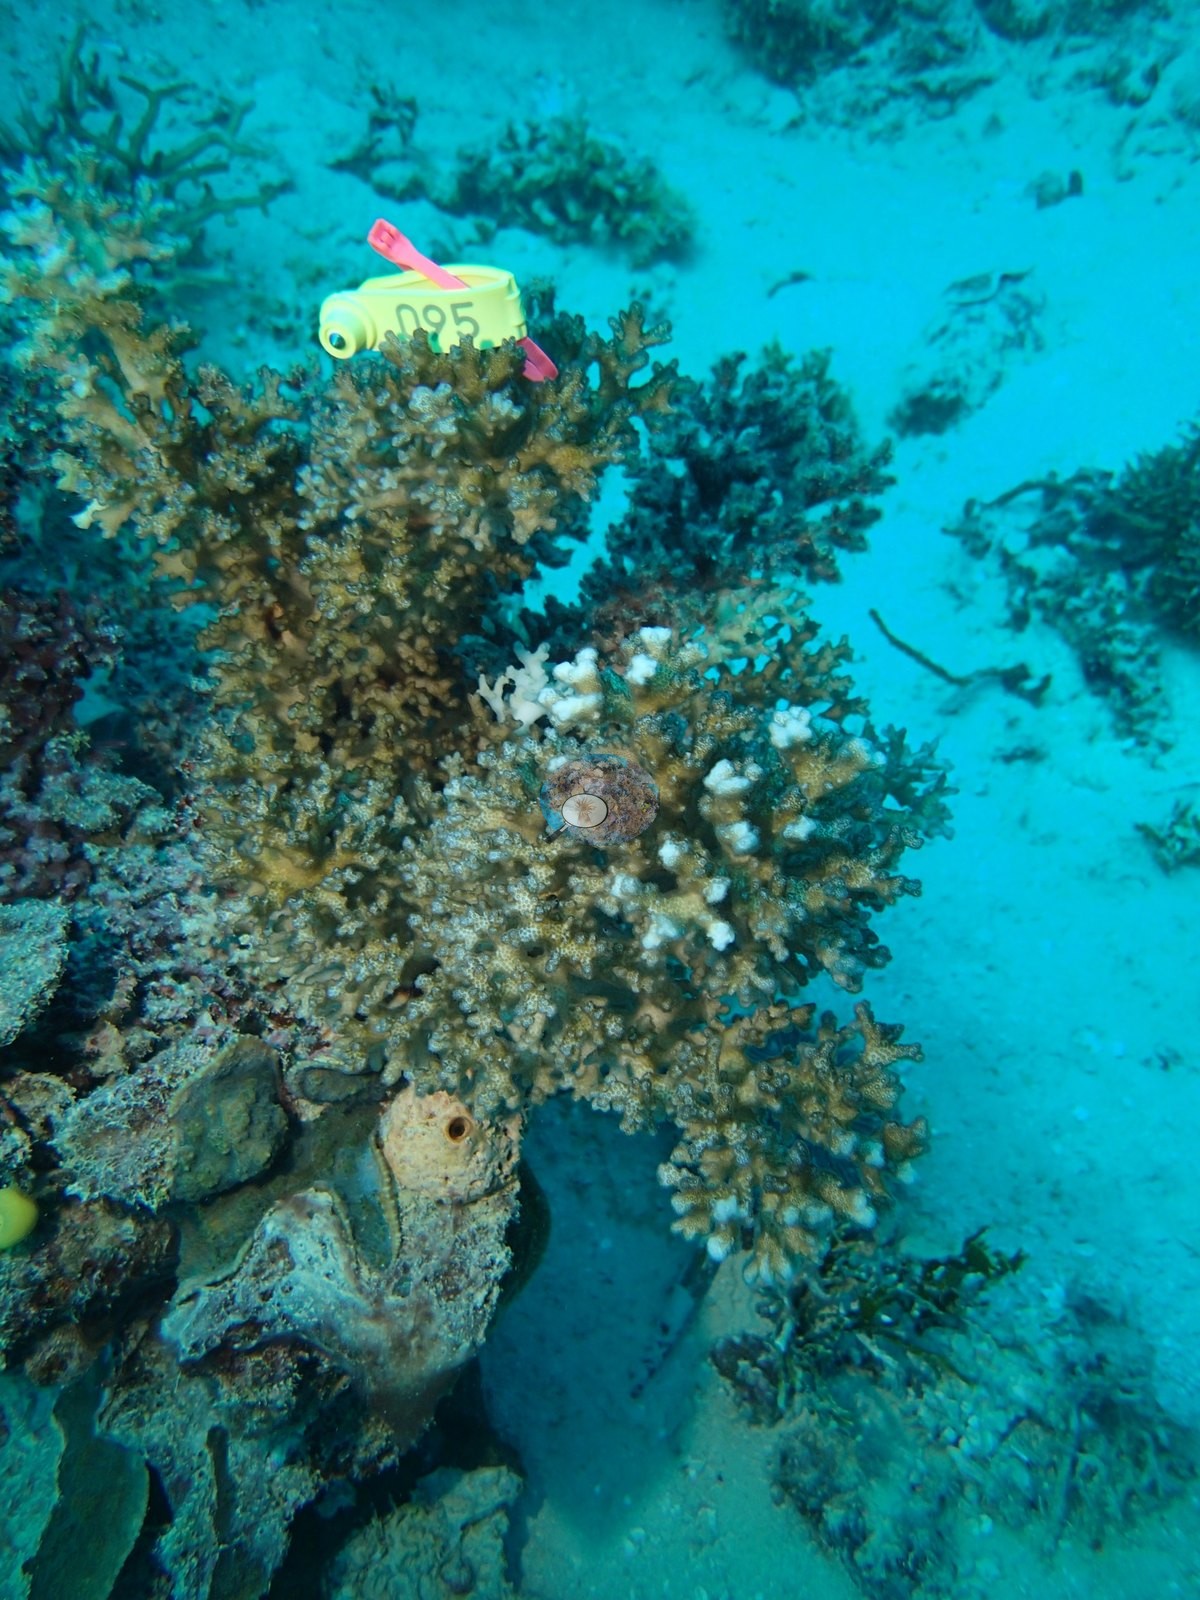
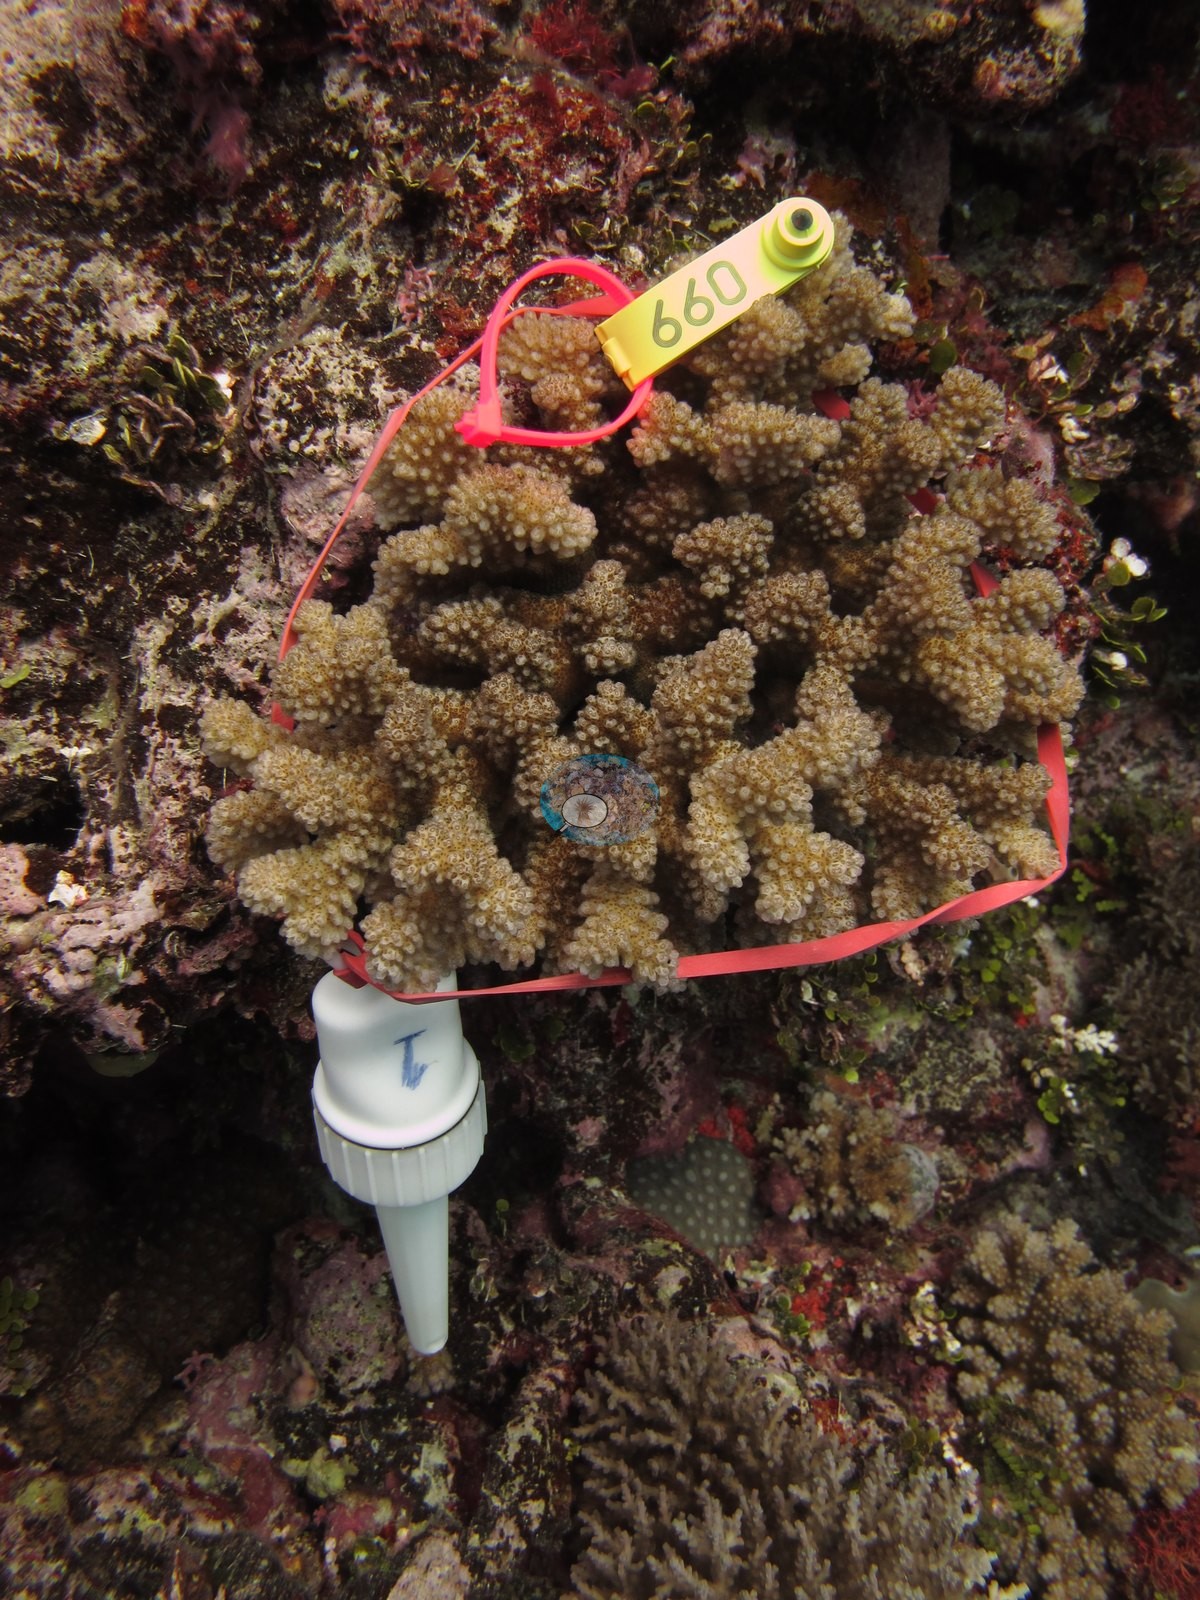
- Fiji - Moala (FJML21): One Pocillopora damicornis labeled by Anderson as bleaching, a stark chalk-white colony beside pigmented neighbors; no extent inferred. A tagged probe colony (tag 097) is fully bleached.
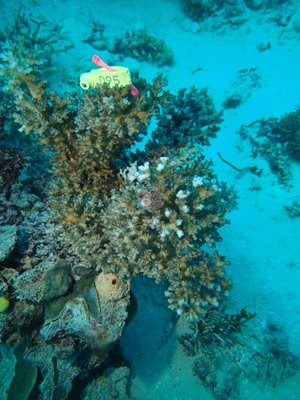
- Fiji - Moala (FJML15): Cyanobacteria covered 13% of the transects on this exposed east-side slope, alongside 66% total algae.
- Fiji - Totoya (FJTO07): Physiological stress outliers: the one coral colony from this site with an outlier score was flagged (Mayfield et al. 2017, PLoS ONE), as was the one from FJTO05; island-level screening flagged 2 of the 9 corals with an outlier score.
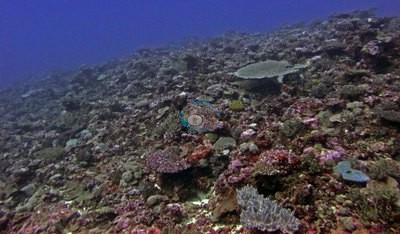
- Fiji - Matuku (FJMT11): Corallivores and recent mortality: Drupella snails were found on several colonies, which could account for some recent mortality scars on the acroporids (same survey note on FJMT10, FJMT13, and FJMT14).
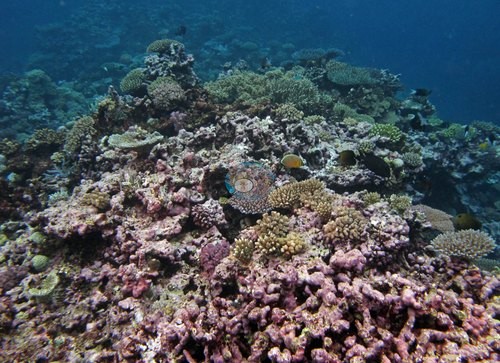
- Fiji - Kabara (FJKA31): All ten Pocillopora colonies Anderson sampled here were partly to fully bleached (20-100% of each colony).
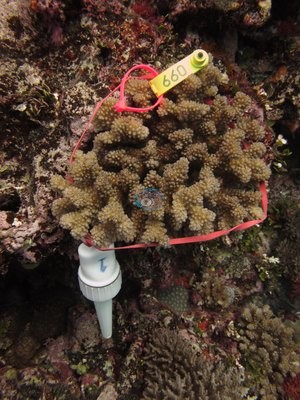
- Fiji - Nayau (FJNA38): Debris: an old anchor chain lying across the pavement has been colonized by small Pocillopora.
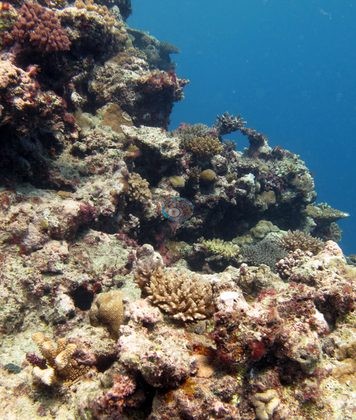
- Fiji - Vanua Vatu (FJVV36): Bleaching: Anderson's sampling sheet records two of the four colonies sampled here as 95% and 90% bleached and 'likely unhealthy' (F72, F73), and the frames of them show cream-white over nearly the whole colony (see the FJVV36 thumbnail); apart from the sampled colonies, no bleaching is visible in the reef frames.
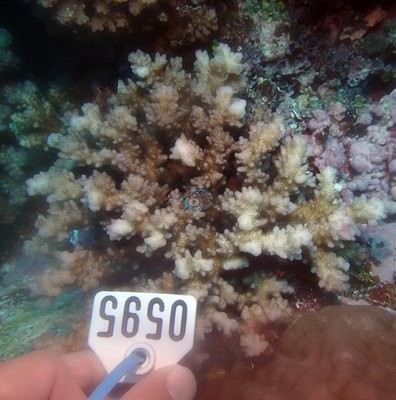
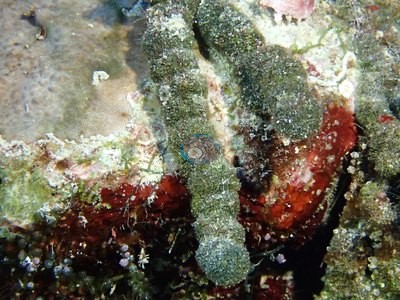
- Fiji - Tuvuca (FJTV41): Bleaching: two colonies photographed bleached, a badly bleached fine-branching colony being overgrown by algae and a partially bleached pocilloporid; Anderson's sampling sheet records the six colonies sampled here as healthy, three of them pale or partly pale (up to 20%).
Coral cover over time (pooled)
 the year includes Global Reef Expedition dives made with the Khaled bin Sultan Living Oceans Foundation (CRD+LOF data).
Sites in this region (73)
- Fiji - Cicia (FJCC44) — 42% coral cover
- Fiji - Cicia (FJCC45) — 50% coral cover
- Fiji - Cicia (FJCC46) — 67% coral cover
- Fiji - Cicia (FJCC47) — 38% coral cover
- Fiji - Cicia (FJCC48) — 47% coral cover
- Fiji - Fulaga (FJFU24) — 43% coral cover
- Fiji - Fulaga (FJFU25) — 35% coral cover
- Fiji - Fulaga (FJFU26) — 55% coral cover
- Fiji - Fulaga (FJFU27) — 37% coral cover
- Fiji - Fulaga (FJFU28) — 44% coral cover
- Fiji - Fulaga (FJFU29) — 50% coral cover
- Fiji - Kabara (FJKA30) — 25% coral cover
- Fiji - Kabara (FJKA31) — 36% coral cover
- Fiji - Kabara (FJKA32) — 62% coral cover
- Fiji - Kabara (FJKA33) — 24% coral cover
- Fiji - Kabara (FJKA34) — 19% coral cover
- Fiji - Lau Islands: Totoya
- Fiji - Lau Islands: Vanua Balavu
- Fiji - Mago (FJMG49) — 53% coral cover
- Fiji - Mago (FJMG50) — 42% coral cover
- Fiji - Mago (FJMG51) — 47% coral cover
- Fiji - Matuku (FJMT10) — 38% coral cover
- Fiji - Matuku (FJMT11) — 30% coral cover
- Fiji - Matuku (FJMT12) — 26% coral cover
- Fiji - Matuku (FJMT13) — 26% coral cover
- Fiji - Matuku (FJMT14) — 29% coral cover
- Fiji - Moala (FJML15) — 23% coral cover
- Fiji - Moala (FJML16) — 33% coral cover
- Fiji - Moala (FJML17) — 33% coral cover
- Fiji - Moala (FJML18) — 40% coral cover
- Fiji - Moala (FJML19) — 51% coral cover
- Fiji - Moala (FJML20) — 37% coral cover
- Fiji - Moala (FJML21) — 22% coral cover
- Fiji - Moala (FJML22) — 29% coral cover
- Fiji - Moala (FJML23) — 29% coral cover
- Fiji - Nayau (FJNA38) — 48% coral cover
- Fiji - Nayau (FJNA39) — 52% coral cover
- Fiji - Nayau (FJNA40) — 44% coral cover
- Fiji - Nayau snorkel (FJNA38SN)
- Fiji - Totoya (FJTO01) — 28% coral cover
- Fiji - Totoya (FJTO02) — 36% coral cover
- Fiji - Totoya (FJTO03) — 33% coral cover
- Fiji - Totoya (FJTO04) — 25% coral cover
- Fiji - Totoya (FJTO05) — 46% coral cover
- Fiji - Totoya (FJTO06) — 12% coral cover
- Fiji - Totoya (FJTO07) — 42% coral cover
- Fiji - Totoya (FJTO08) — 36% coral cover
- Fiji - Totoya (FJTO09) — 29% coral cover
- Fiji - Tuvuca (FJTV41) — 28% coral cover
- Fiji - Tuvuca (FJTV42) — 37% coral cover
- Fiji - Tuvuca (FJTV43) — 41% coral cover
- Fiji - Vanua Balavu (FJVB52) — 47% coral cover
- Fiji - Vanua Balavu (FJVB53) — 25% coral cover
- Fiji - Vanua Balavu (FJVB54) — 37% coral cover
- Fiji - Vanua Balavu (FJVB55) — 29% coral cover
- Fiji - Vanua Balavu (FJVB56) — 16% coral cover
- Fiji - Vanua Balavu (FJVB57) — 13% coral cover
- Fiji - Vanua Balavu (FJVB58) — 13% coral cover
- Fiji - Vanua Balavu (FJVB59) — 10% coral cover
- Fiji - Vanua Balavu (FJVB60) — 15% coral cover
- Fiji - Vanua Balavu (FJVB61) — 15% coral cover
- Fiji - Vanua Balavu (FJVB62) — 30% coral cover
- Fiji - Vanua Balavu (FJVB63) — 28% coral cover
- Fiji - Vanua Balavu (FJVB64) — 2.5% coral cover
- Fiji - Vanua Balavu (FJVB65) — 3.3% coral cover
- Fiji - Vanua Balavu (FJVB66) — 12% coral cover
- Fiji - Vanua Balavu (FJVB67) — 22% coral cover
- Fiji - Vanua Balavu (FJVB68) — 30% coral cover
- Fiji - Vanua Balavu (FJVB69) — 9.0% coral cover
- Fiji - Vanua Balavu (FJVB70) — 17% coral cover
- Fiji - Vanua Vatu (FJVV35) — 49% coral cover
- Fiji - Vanua Vatu (FJVV36) — 33% coral cover
- Fiji - Vanua Vatu (FJVV37) — 42% coral cover
% coral cover by method
Pooled across 10 dive sites
| Method | Mean % coral cover | Std. dev. between dive sites | n dive sites | Note |
|---|---|---|---|---|
| CoralSCOP (SAM-based mask-sum), edited photos | 37% | ±7.7 | 10 | 9 of these 10 values rest on 10–19 photographs (*) |
| Claude (Anthropic), blind point count | 34% | ±10 | 10 | 9 of these 10 values rest on 10–19 photographs (*) |
| In-water diver transect (line/point intercept) | 40% | ±6.8 | 10 | — |
The mean is an UNWEIGHTED mean of the dive site values — each dive site counts once, whatever its photo count — which is the convention of the published tables and of every other figure on this page. Each value is the one printed on that dive site's own page; a page that prints no value for a method (fewer than 10 photographs) is left out of that method's mean.
Deviation from the reference
Over the dive sites where an independent reference exists, Claude (Anthropic), blind point count has a mean absolute deviation of 10.2 pp from it across 10 dive sites. Not in this ranking: CoralSCOP (edited), which measures coral area rather than points. A mean absolute deviation is not an accuracy score: a model with a consistent offset is correctable, while one with the same deviation scattered in both directions is not.
By dive site
| Dive site | CoralSCOP (edited) | Claude | Diver transect |
|---|---|---|---|
| FJCC45 | 41%* n=18 | 41%* n=18 | 50% |
| FJCC48 | 38%* n=14 | 39%* n=14 | 47% |
| FJML16 | 41%* n=19 | 35%* n=19 | 33% |
| FJML18 | 38%* n=10 | 24%* n=10 | 40% |
| FJML20 | 54%* n=13 | 51%* n=13 | 37% |
| FJNA40 | 31%* n=15 | 28%* n=15 | 44% |
| FJTO02 | 34%* n=12 | 26%* n=12 | 36% |
| FJVB52 | 34%* n=11 | 39%* n=11 | 47% |
| FJTO09 | 25%* n=13 | 18%* n=13 | 29% |
| FJTV42 | 38% n=23 | 45% n=23 | 37% |
n under each value is the number of photographs that method scored at that dive site. ⚠ marks a cell that is not an independent check. * marks a value resting on only 10–19 photographs, which is less certain.
Reference: Living Oceans Foundation (LOF) Global Reef Expedition in-water transects (mean of all the station's transects, Living Oceans Foundation per-transect benthic data). Denominator: line/point intercept along the transect; not a photo-point denominator. Source: LOF Global Reef Expedition 2013, per-transect benthic data ('GRE data-full benthic'): the mean of all of each station's transects The transect is THE coral-cover value at every site; the Claude photo estimate is a methods comparison only, never averaged with the transect and never a headline. Site-level only: the photos come from the survey dives, not from the transect points. Few usable habitat photos exist for Fiji: only 10 sites have 10 or more, and 9 of them have fewer than 20 (low-n), so these are not confident site estimates. Accuracy, Claude vs transect, 10 sites: mean difference -5.4 pp (95% CI -12.7 to +1.9), mean absolute difference 10.3 pp, r 0.35. Claude reads lower than the transect at most sites and does not track it from site to site. This is a methods comparison, not a ranking.
Nearby external survey stations
17 independent survey records within 5 km of a site in this region (each record counted once; 15 lines, and a line that pools several records says how many).
- Reef Check — Barracuda Point (2006): 59% hard coral cover, 4.99 km from Fiji - Cicia (FJCC44)
- Reef Check — Dabu Passage (1999): 51% hard coral cover, 4.23 km from Fiji - Matuku (FJMT11)
- Reef Check — Maccadame Reef (1999): 56% hard coral cover, mean of 2 surveys (2 m and 10 m), 0.53 km from Fiji - Matuku (FJMT11) (2 records)
- Reef Check — North of Arua (1999): 39% hard coral cover, 0.88 km from Fiji - Matuku (FJMT11)
- Vatuvara Foundation Fiji / WCS Fiji via MERMAID — Ada01 (2017): 7.0% hard coral cover, 4.68 km from Fiji - Lau Islands: Vanua Balavu
- Vatuvara Foundation Fiji / WCS Fiji via MERMAID — Ada04 (2017): 9.3% hard coral cover, 4.50 km from Fiji - Vanua Balavu (FJVB54)
- Vatuvara Foundation Fiji / WCS Fiji via MERMAID — Kan04 (2017): 9.7% hard coral cover, 4.86 km from Fiji - Vanua Balavu (FJVB54)
- WCS Fiji via MERMAID — TY01 (2011): 36% hard coral cover, 0.18 km from Fiji - Totoya (FJTO06)
- WCS Fiji via MERMAID — TY02 (2011): 53% hard coral cover, 0.32 km from Fiji - Totoya (FJTO06)
- WCS Fiji via MERMAID — TY04 (2011): 58% hard coral cover, 0.05 km from Fiji - Totoya (FJTO07)
- WCS Fiji via MERMAID — TY06 (2011): 46% hard coral cover, 0.68 km from Fiji - Totoya (FJTO06)
- WCS Fiji via MERMAID — TY08 (2011): 53% hard coral cover, 1.26 km from Fiji - Totoya (FJTO06)
- WCS Fiji via MERMAID — TY10 (2011): 53% hard coral cover, 1.27 km from Fiji - Totoya (FJTO07)
- WCS Fiji via MERMAID — TY13 (2011): 64% hard coral cover, 1.24 km from Fiji - Totoya (FJTO06)
- WCS Fiji via MERMAID — TY15 (2011): 43% hard coral cover, mean of 2 surveys, 0.99 km from Fiji - Totoya (FJTO06) (2 records)
All images from Coral Reef Diagnostics. Data are from the Khaled bin Sultan Living Oceans Foundation Global Reef Expedition, Coral Reef Diagnostics, Reef Check Foundation, WCS Fiji, and Vatuvara Foundation Fiji.
© Coral Reef Diagnostics.