
Part of the regional summaries: Fiji - Totoya, Fiji - Moala Group (Moala / Totoya / Matuku), and Fiji - Lau
More info
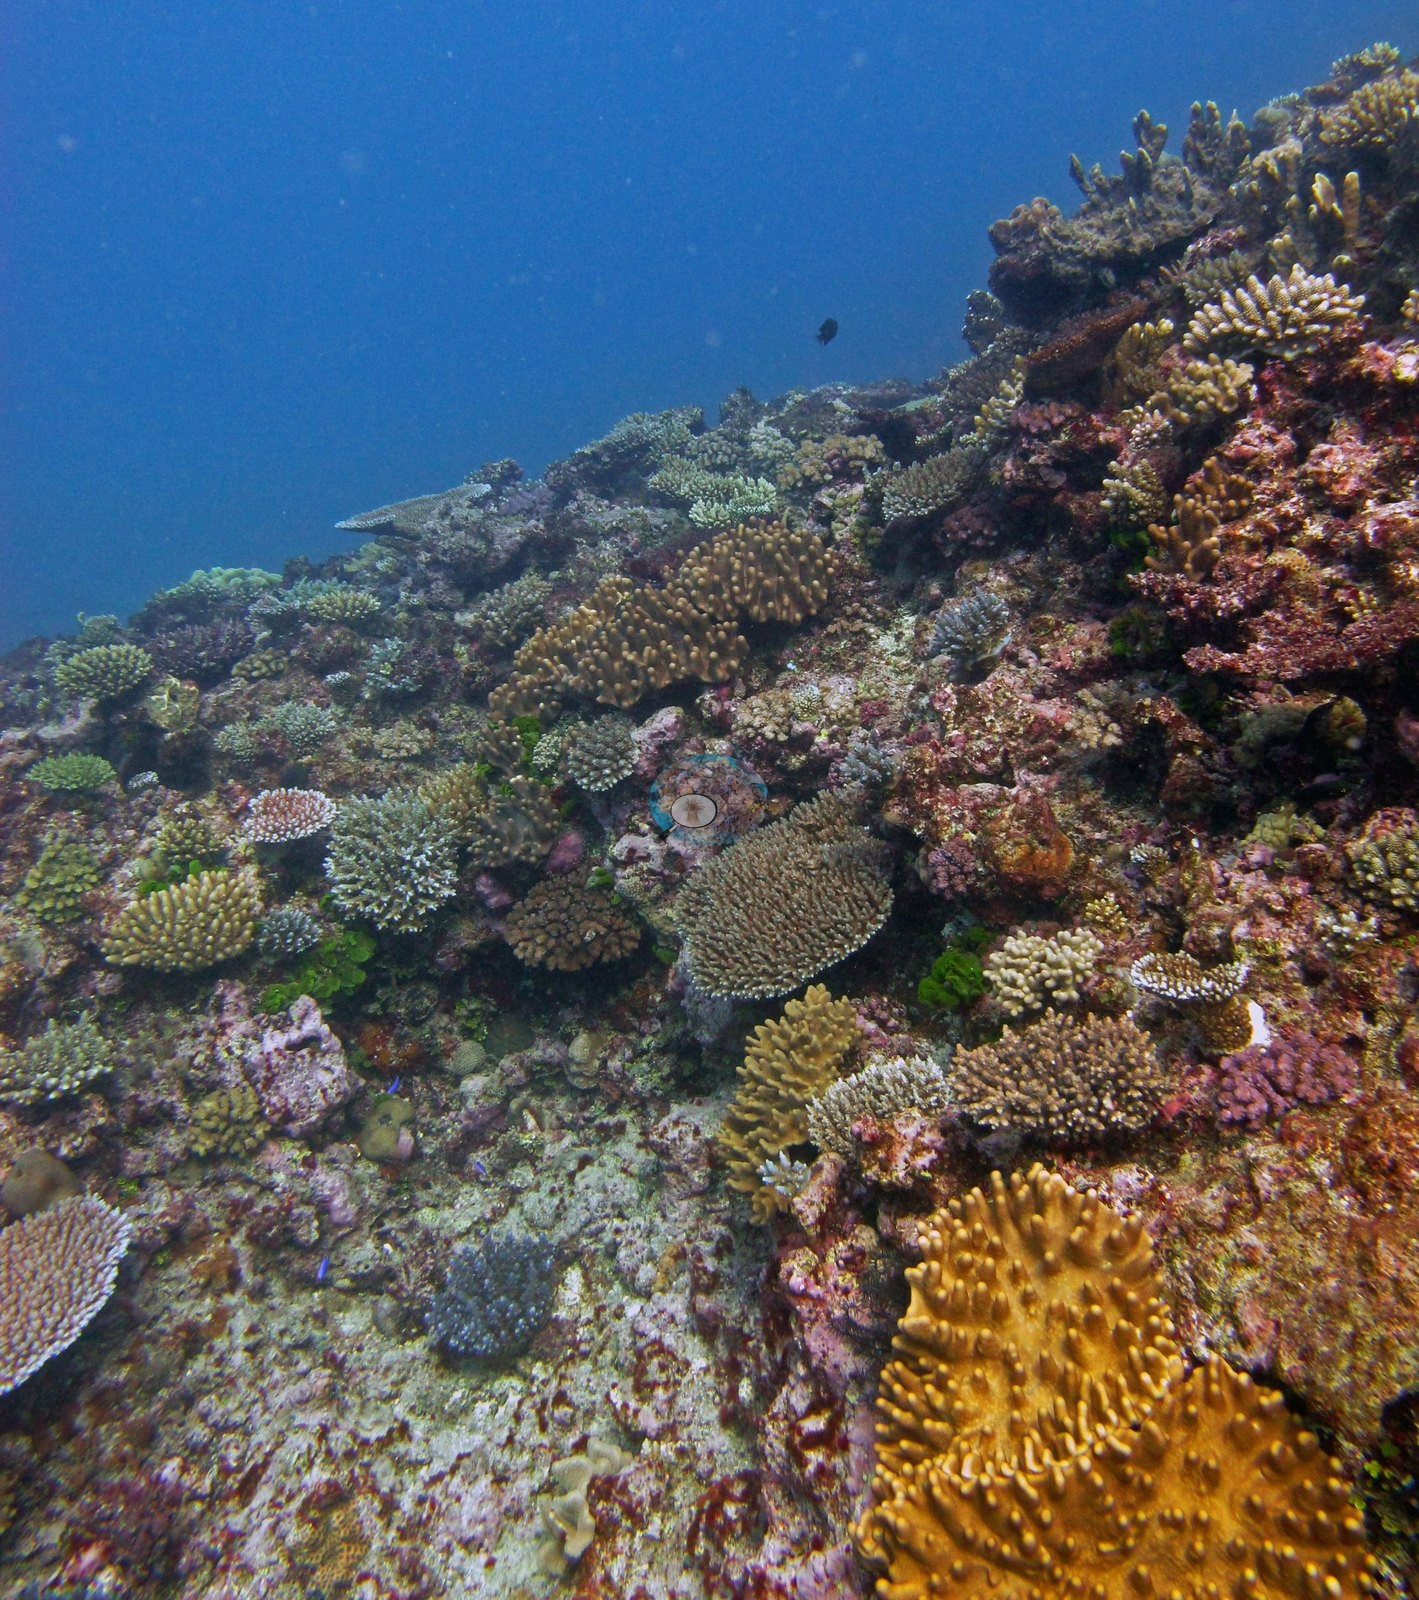
Fiji (NOAA CRW virtual station)A Totoya reef of contrasts: dense, extremely diverse patches of interlocking branching, table, and encrusting corals, separated by broad terraces of coralline-crusted pavement with only scattered colonies. Coral cover averages 36%. Surveyed on the Living Oceans Foundation's Global Reef Expedition.
E dua na cakau e Totoya e veibasai: na vanua e vonu ka veimataqali vakaidina ni lase vakatabataba, vakatepeli, kei na lase e kabita na vatu (encrusting) e veisemati, e veitawasei ena vanua raraba (terraces) levu ni vatu raraba e ubi ena lumi vakalase (coralline) kei na vica ga na lase veitawasei. Na ubi ni lase (coral cover) e 36% na kena ivakatagedegede.
AI translation of this summary; the English is authoritative. (low confidence)
CTD-cast midpoint of 27.1–27.2°C
One other CRD dive site with its own page within 5 km shown in orange — click a marker to open its page.
🗺 Detailed map of the Global Reef Expedition dive sites, Totoya, Fiji (Khaled bin Sultan Living Oceans Foundation; opens in a new window)
Site description
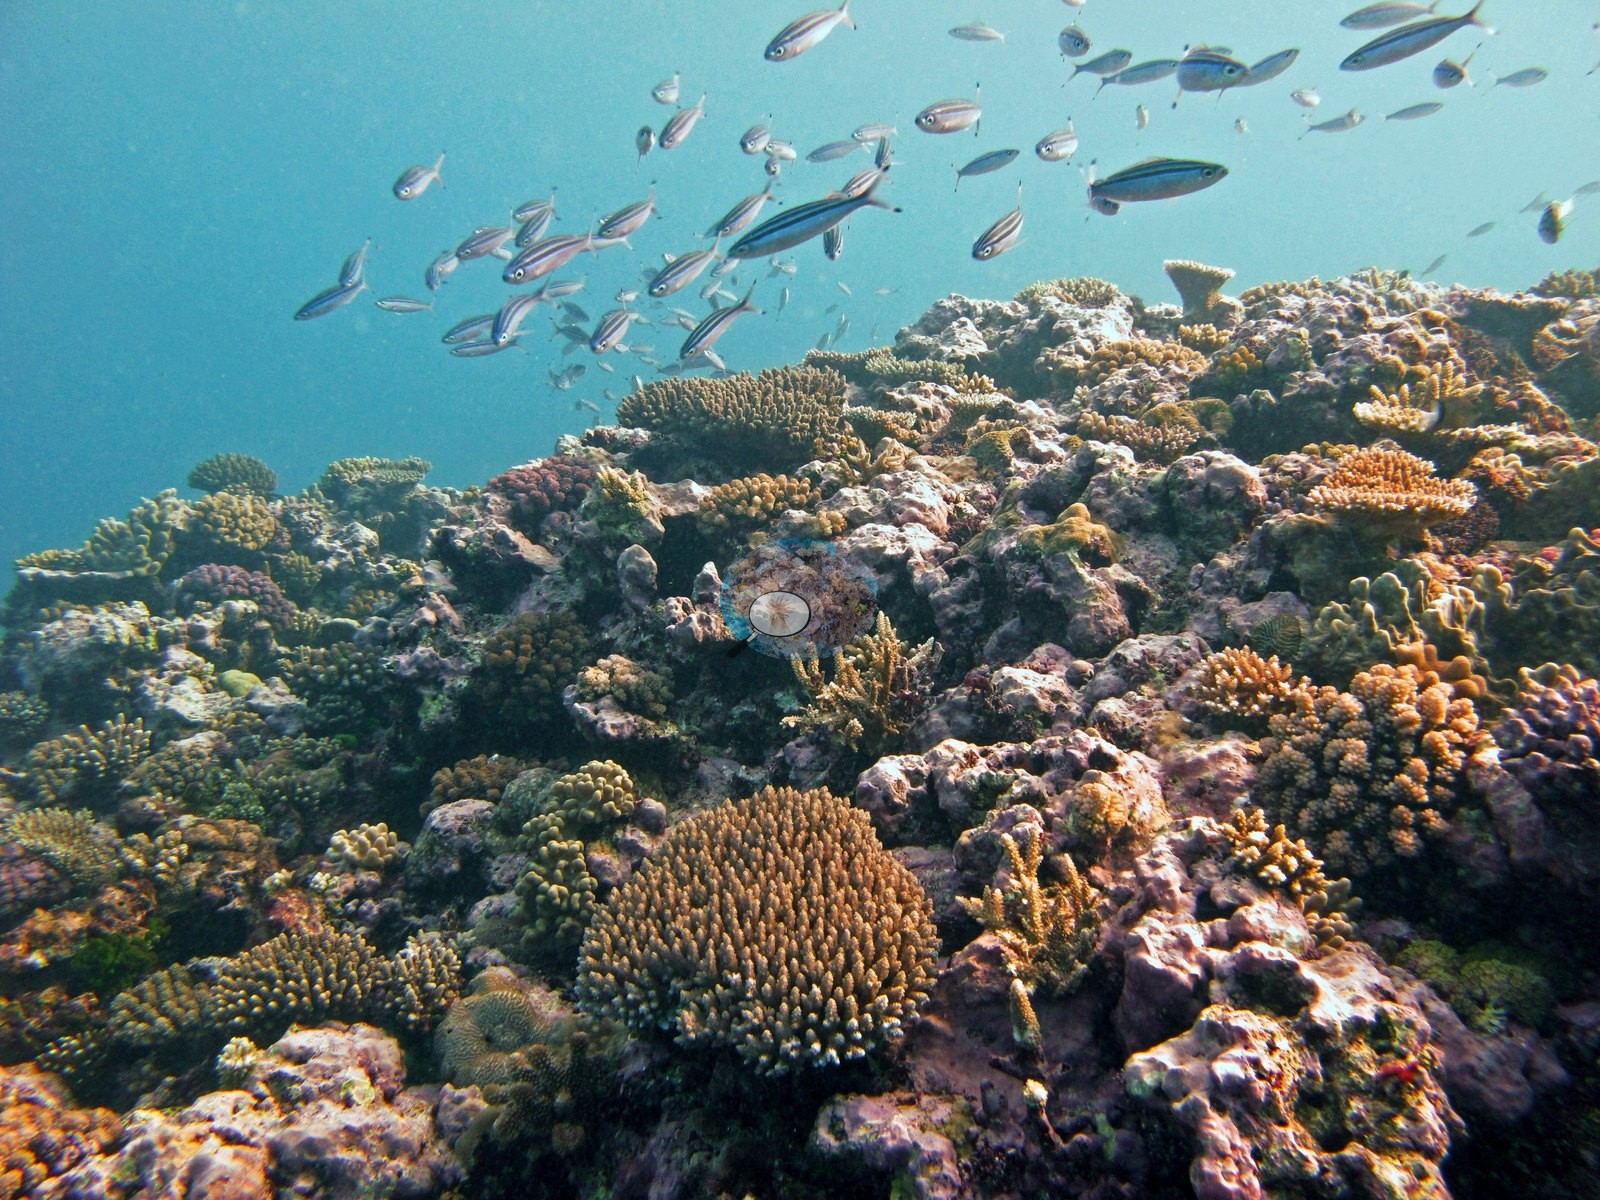
One contrast runs through the full set: this reef alternates between densely packed, extremely diverse patches and broad stretches of low-relief, coralline-crusted framework carrying only scattered colonies. The dense, diverse patches are the ones Anderson singled out. Image 4 and Image 3 are the two busiest frames — golden-yellow knobbed and finger-forming colonies, tan and cream corymbose Acropora, orange-brown corymbose plates, white-tipped digitate colonies, small tabulate plates, and encrusting sheets interlocking with almost no gap between them, all bedded in red and pink coralline crust.
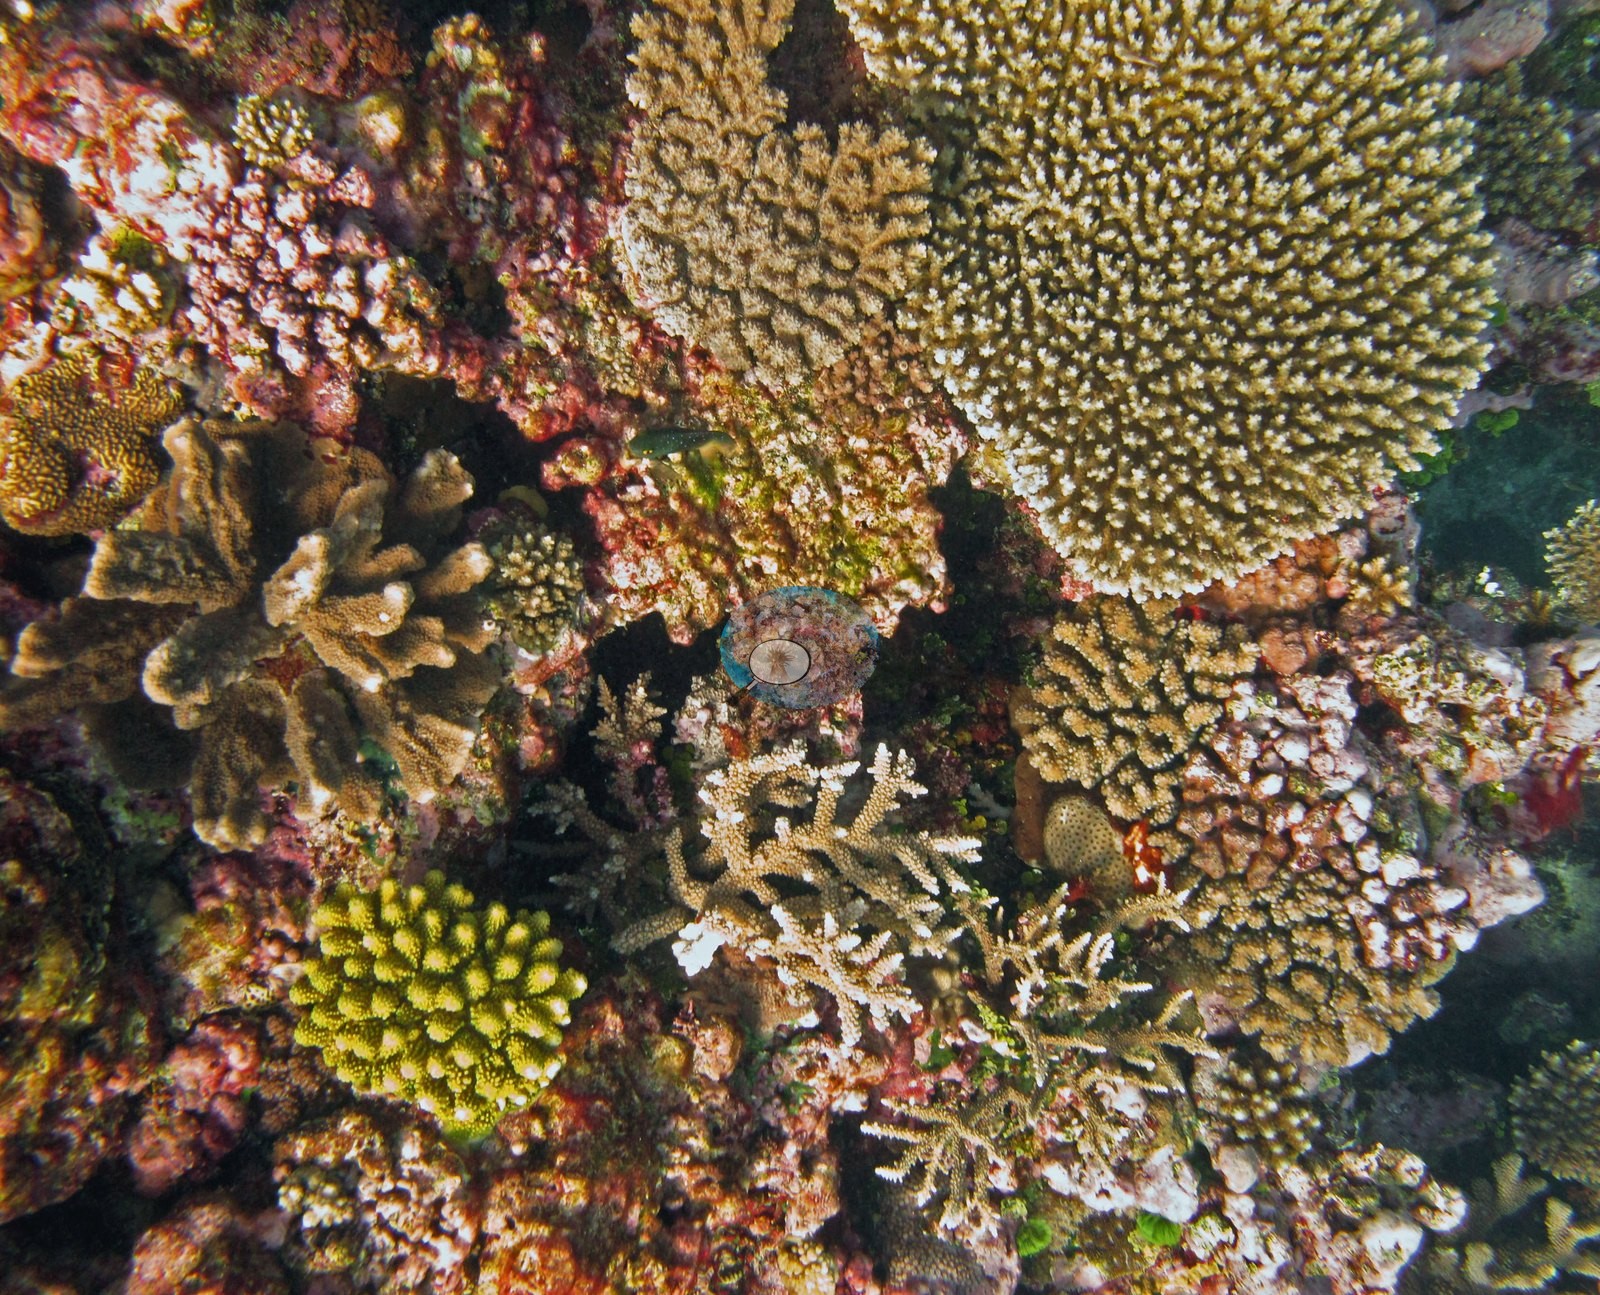
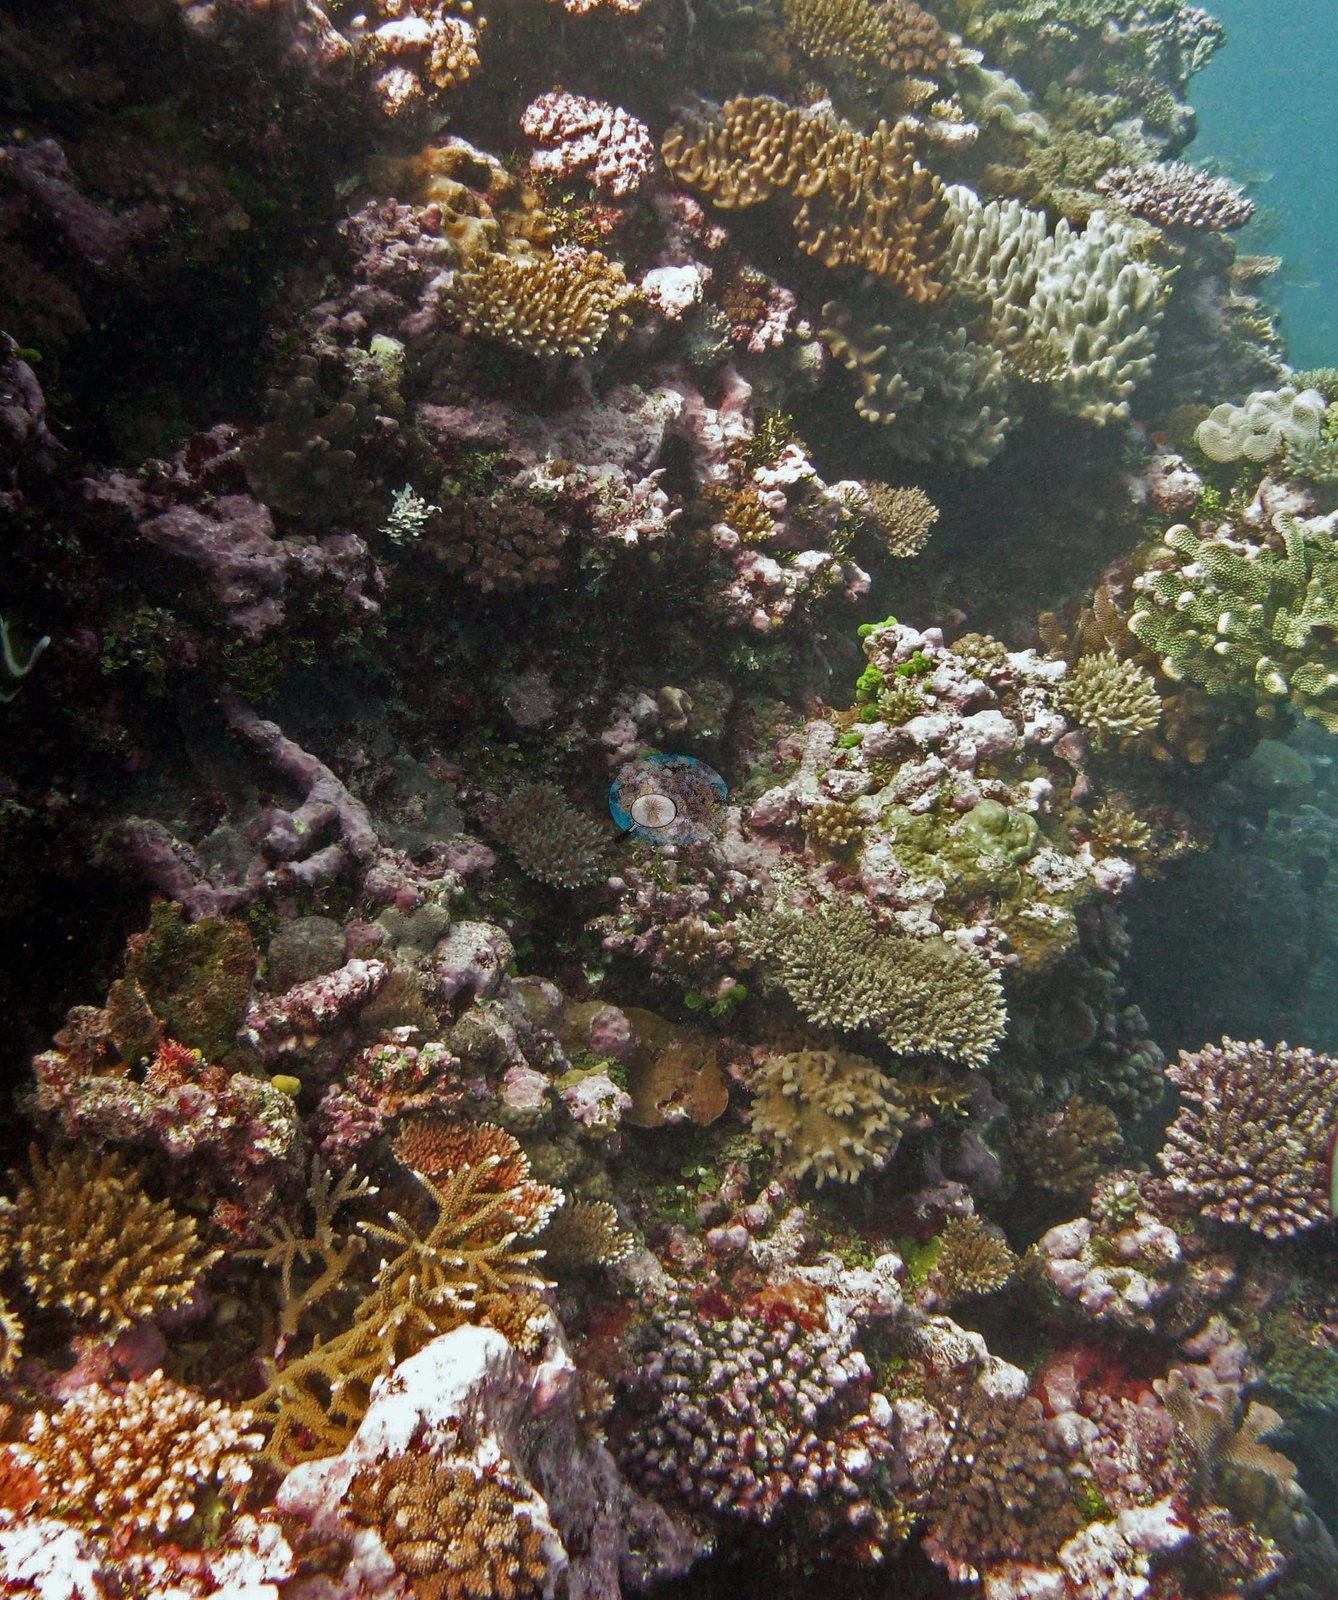
Image 12 and Image 10 are similar but shot wider, with a vivid chartreuse-green branching colony standing out against olive and tan neighbors.
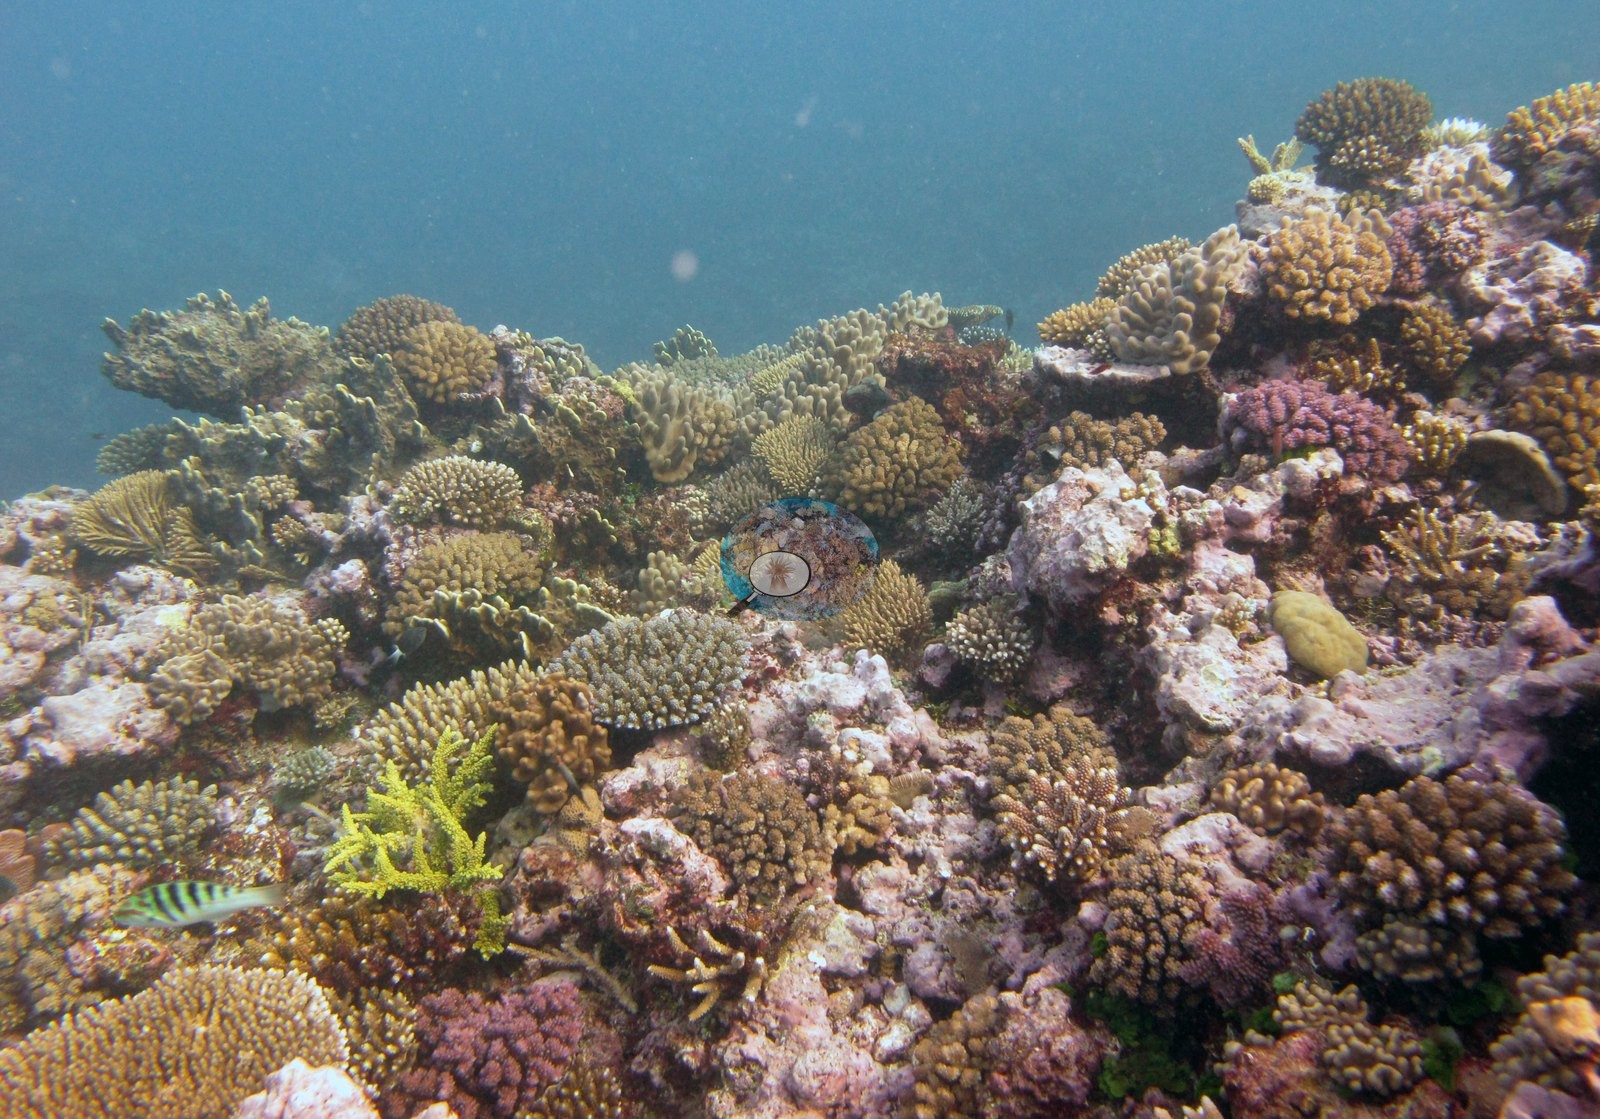
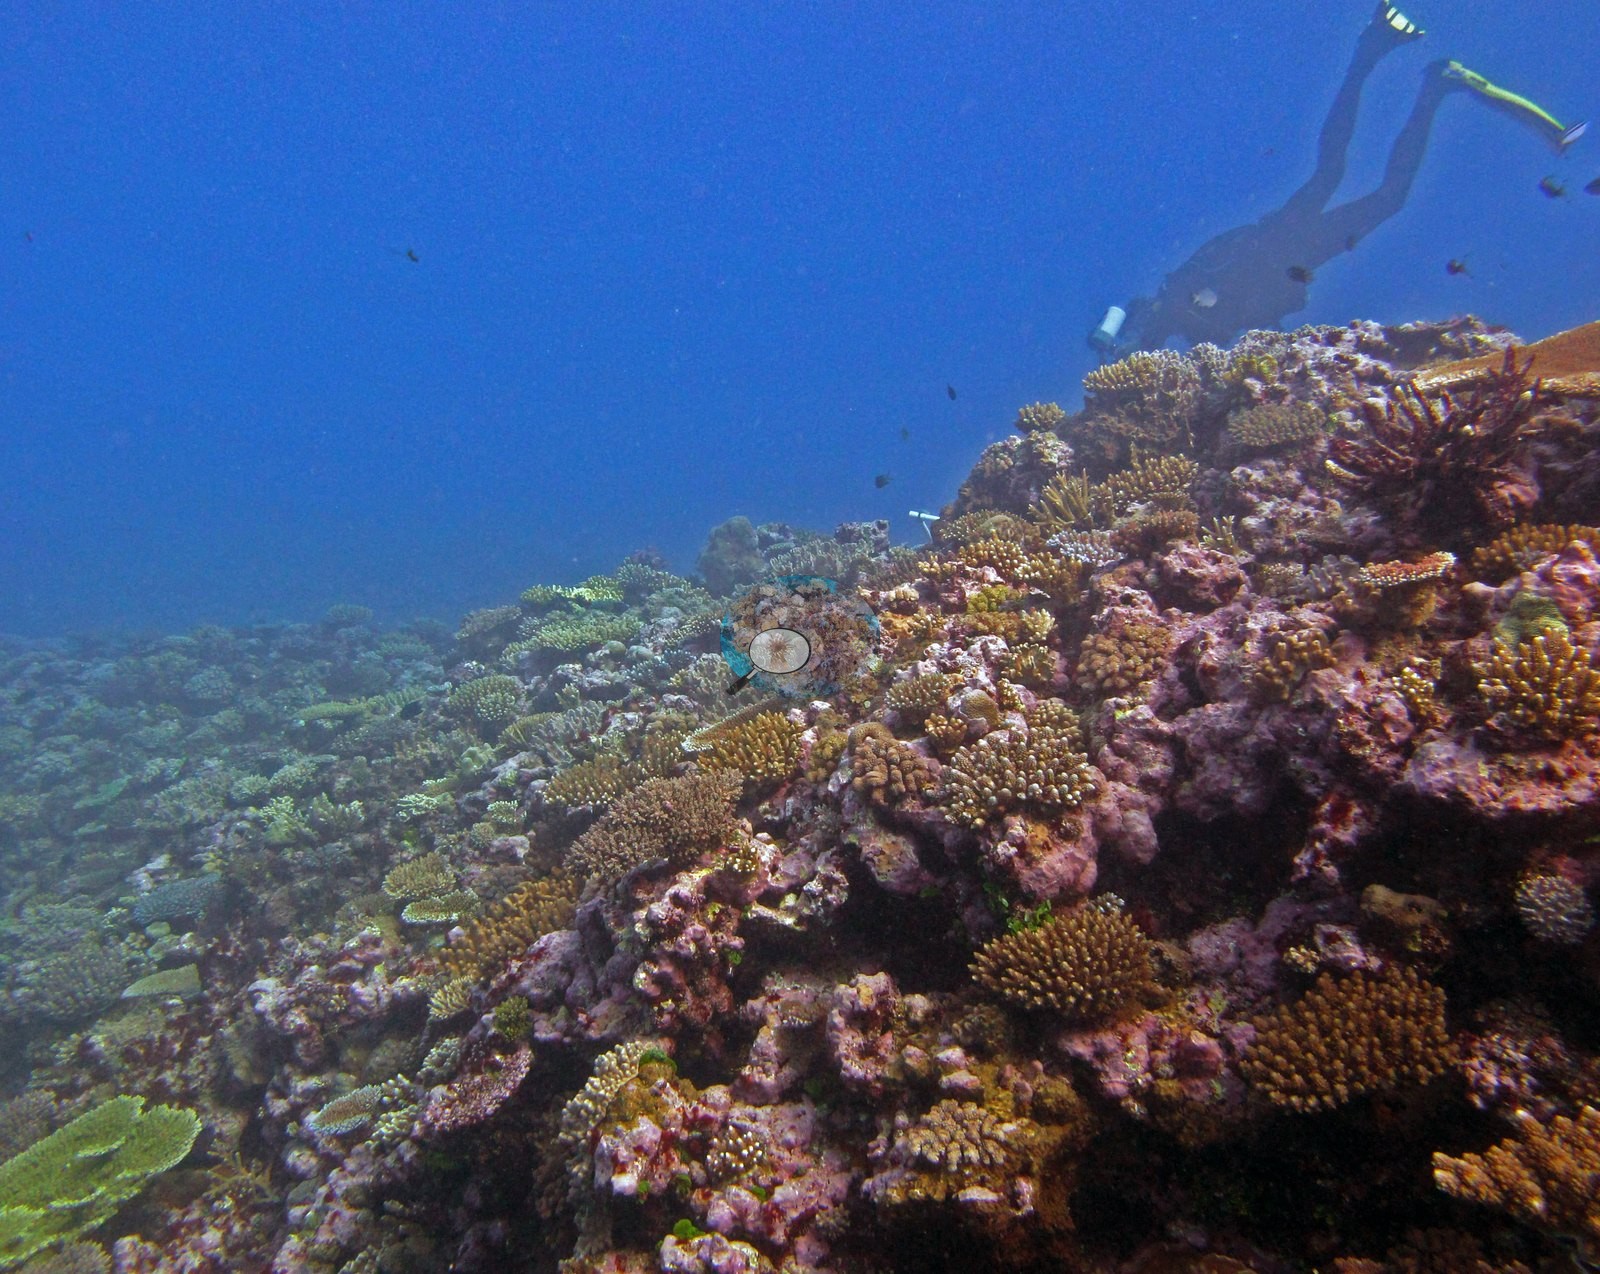
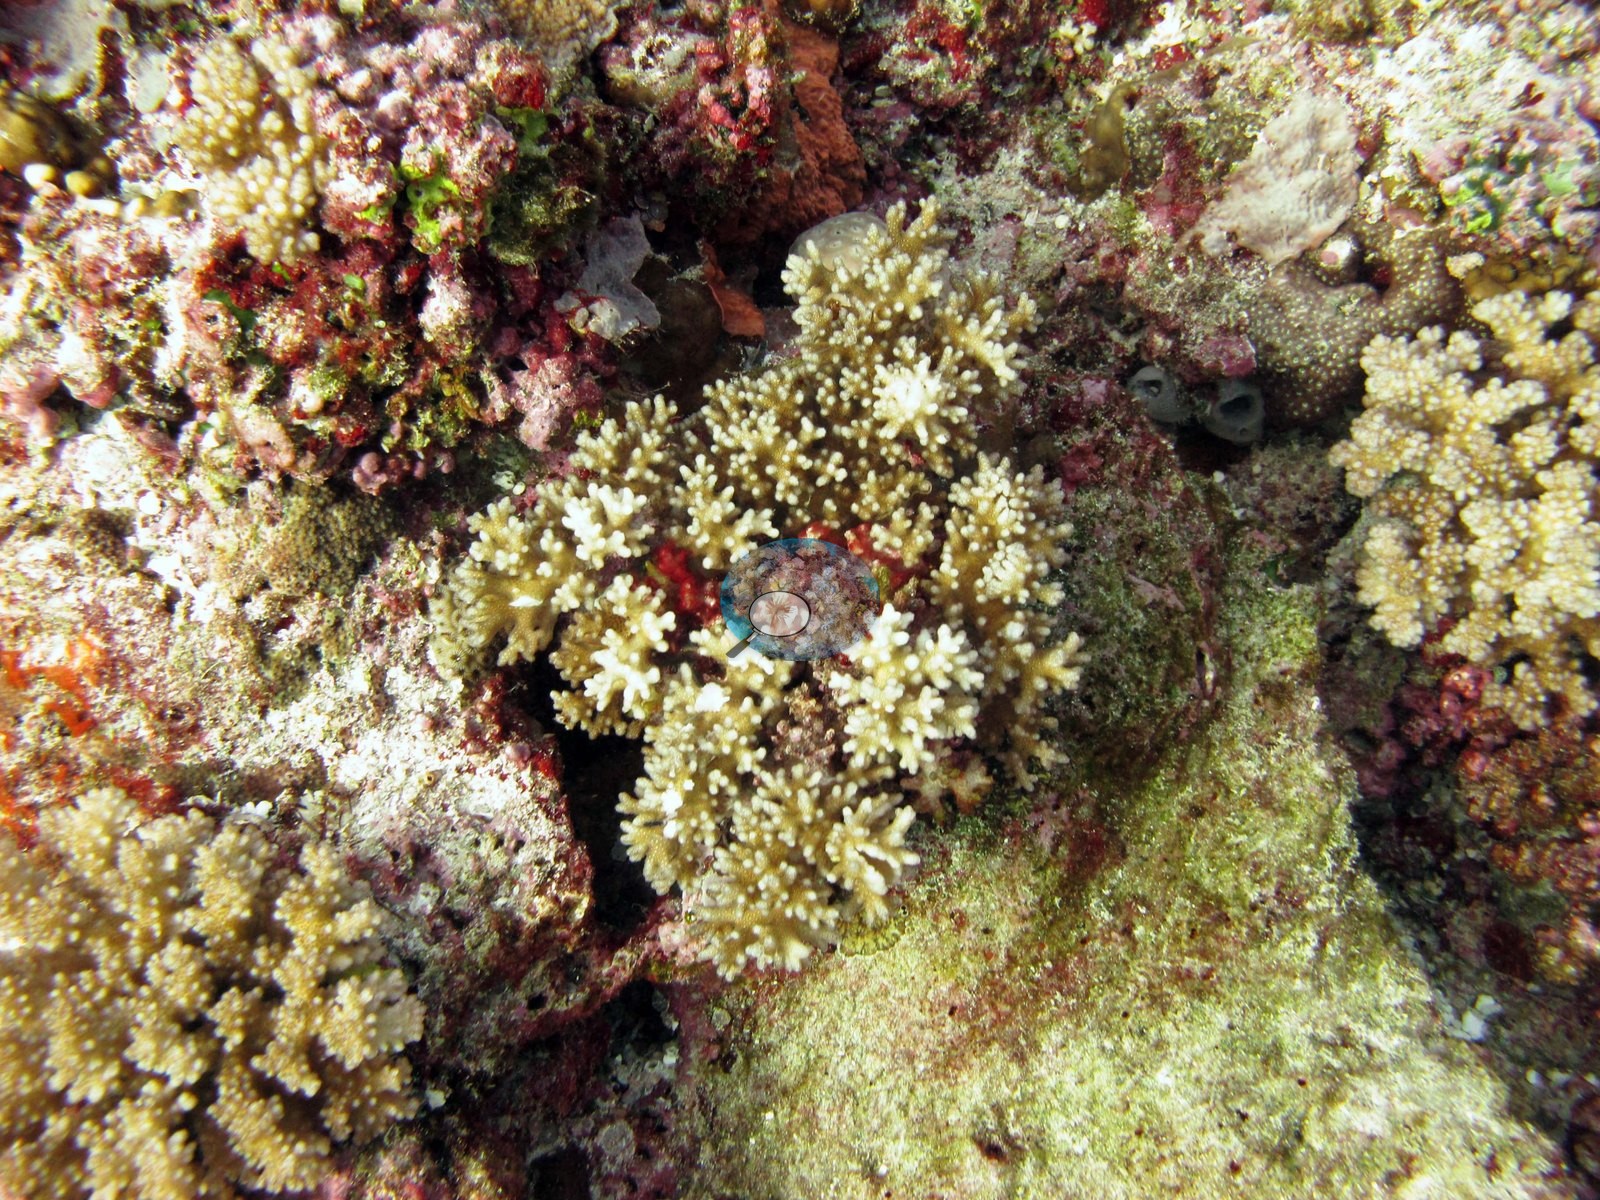
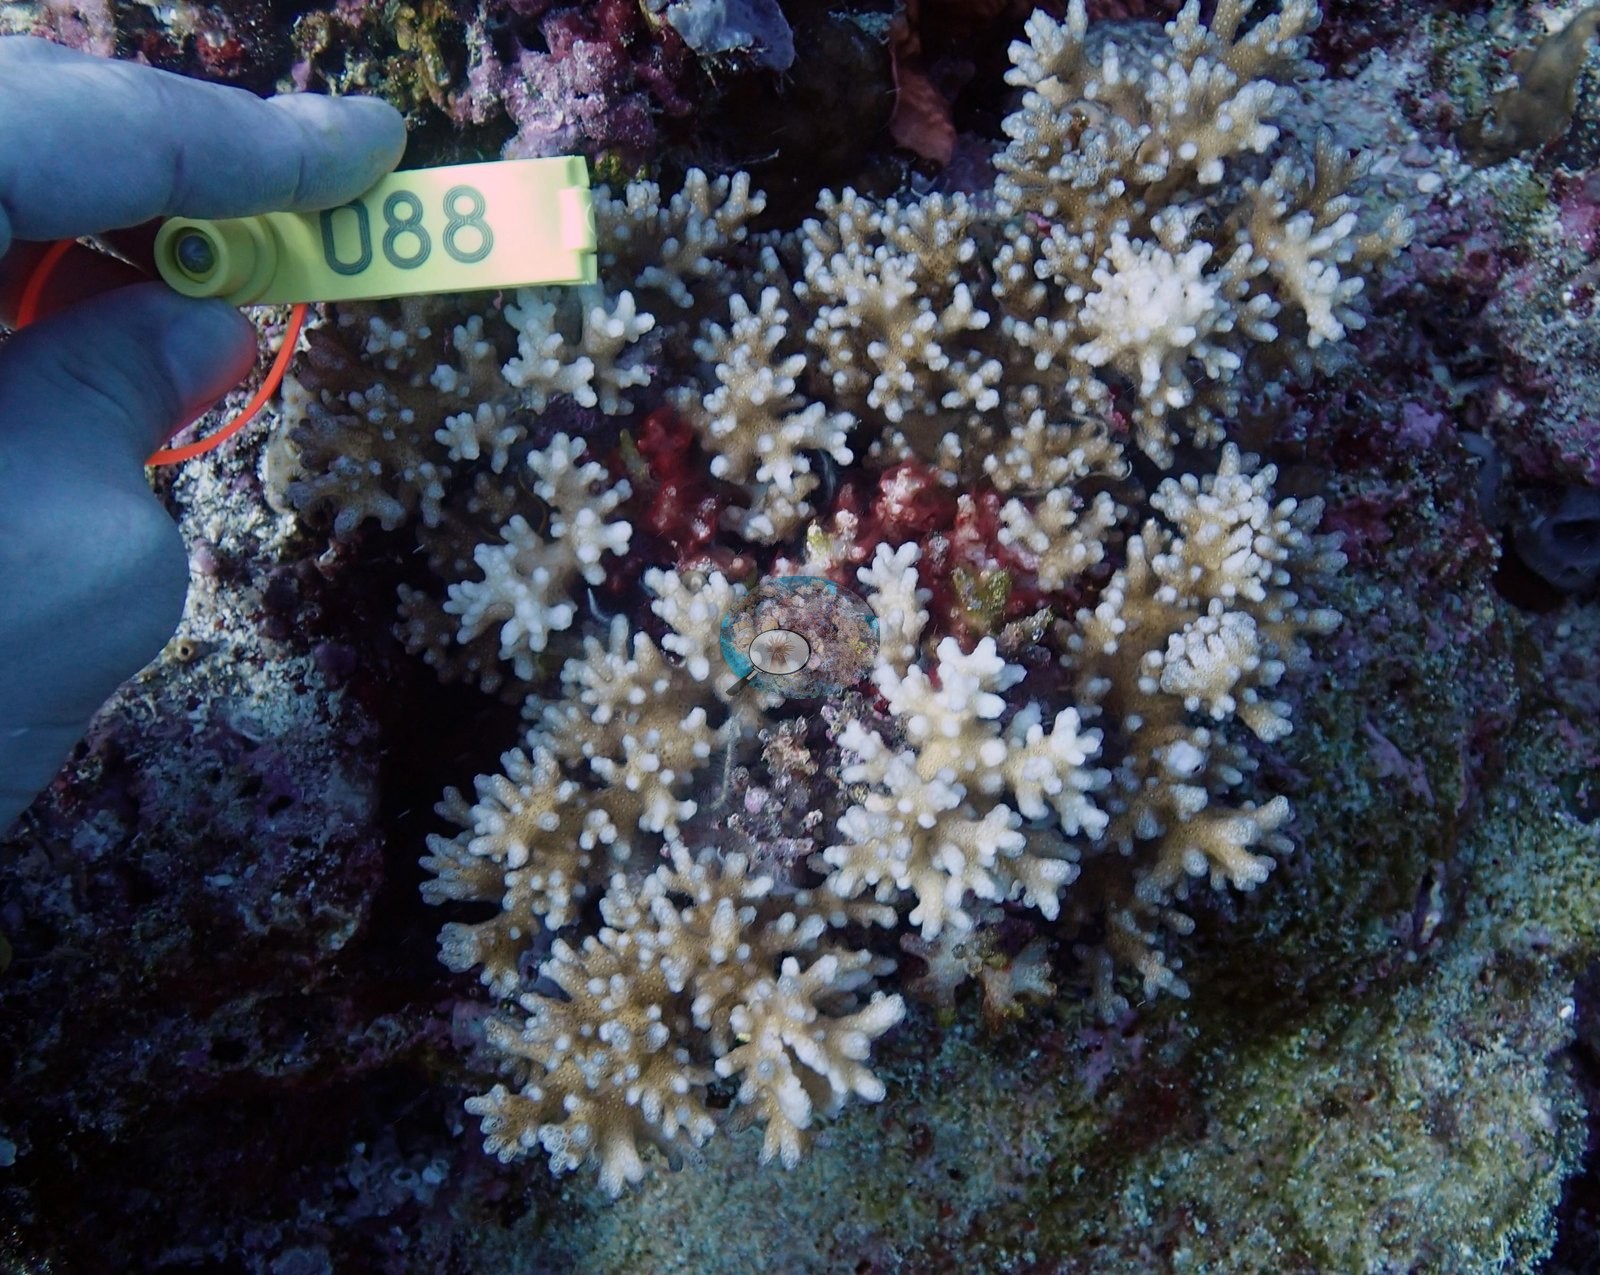
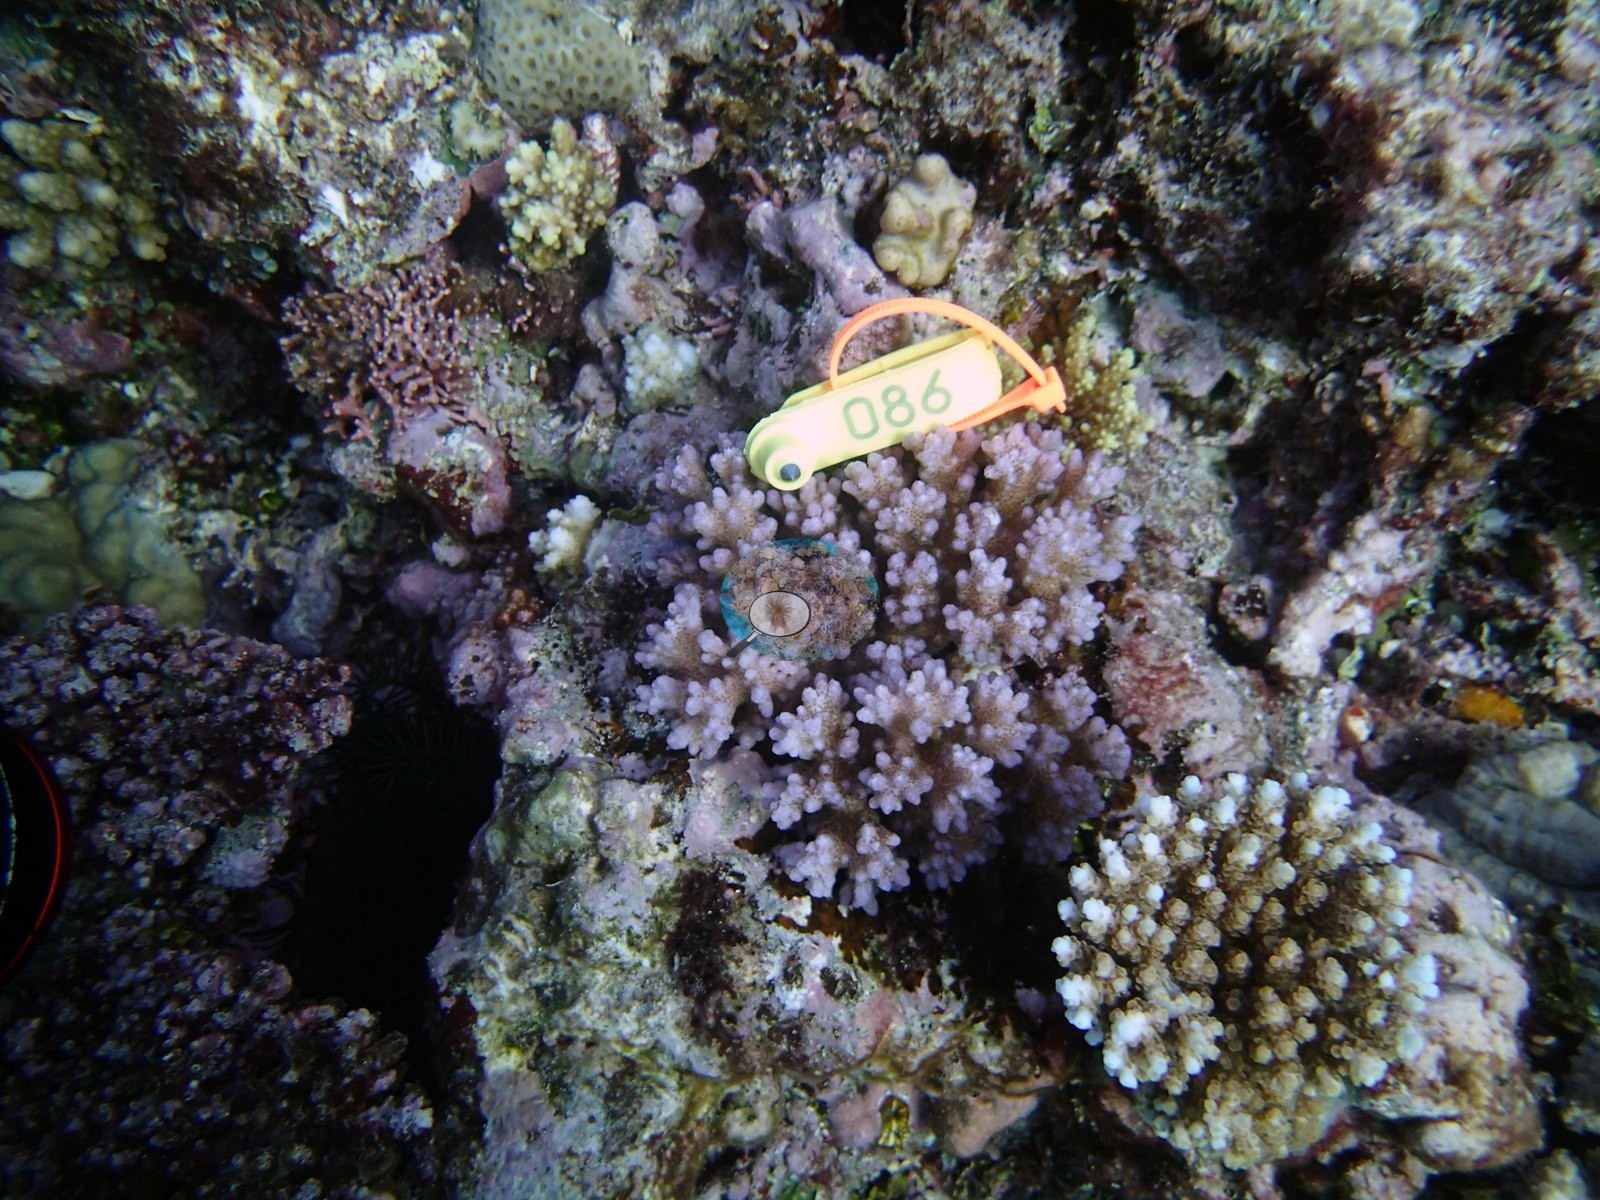
Image 5 is Anderson's sampled colony 4 (P. damicornis), which the sheet records as healthy: tan tissue with white growth tips.
Against those, Image 7, Image 14, and Image 13 look across wide, gently sloping terraces where mauve and purple coralline-crusted pavement is the dominant surface and small tan, olive, and gray colonies are spread thinly over it — the same reef with a very different texture, and as much a part of the site as the more photogenic frames (e.g., Image 6, Image 15).
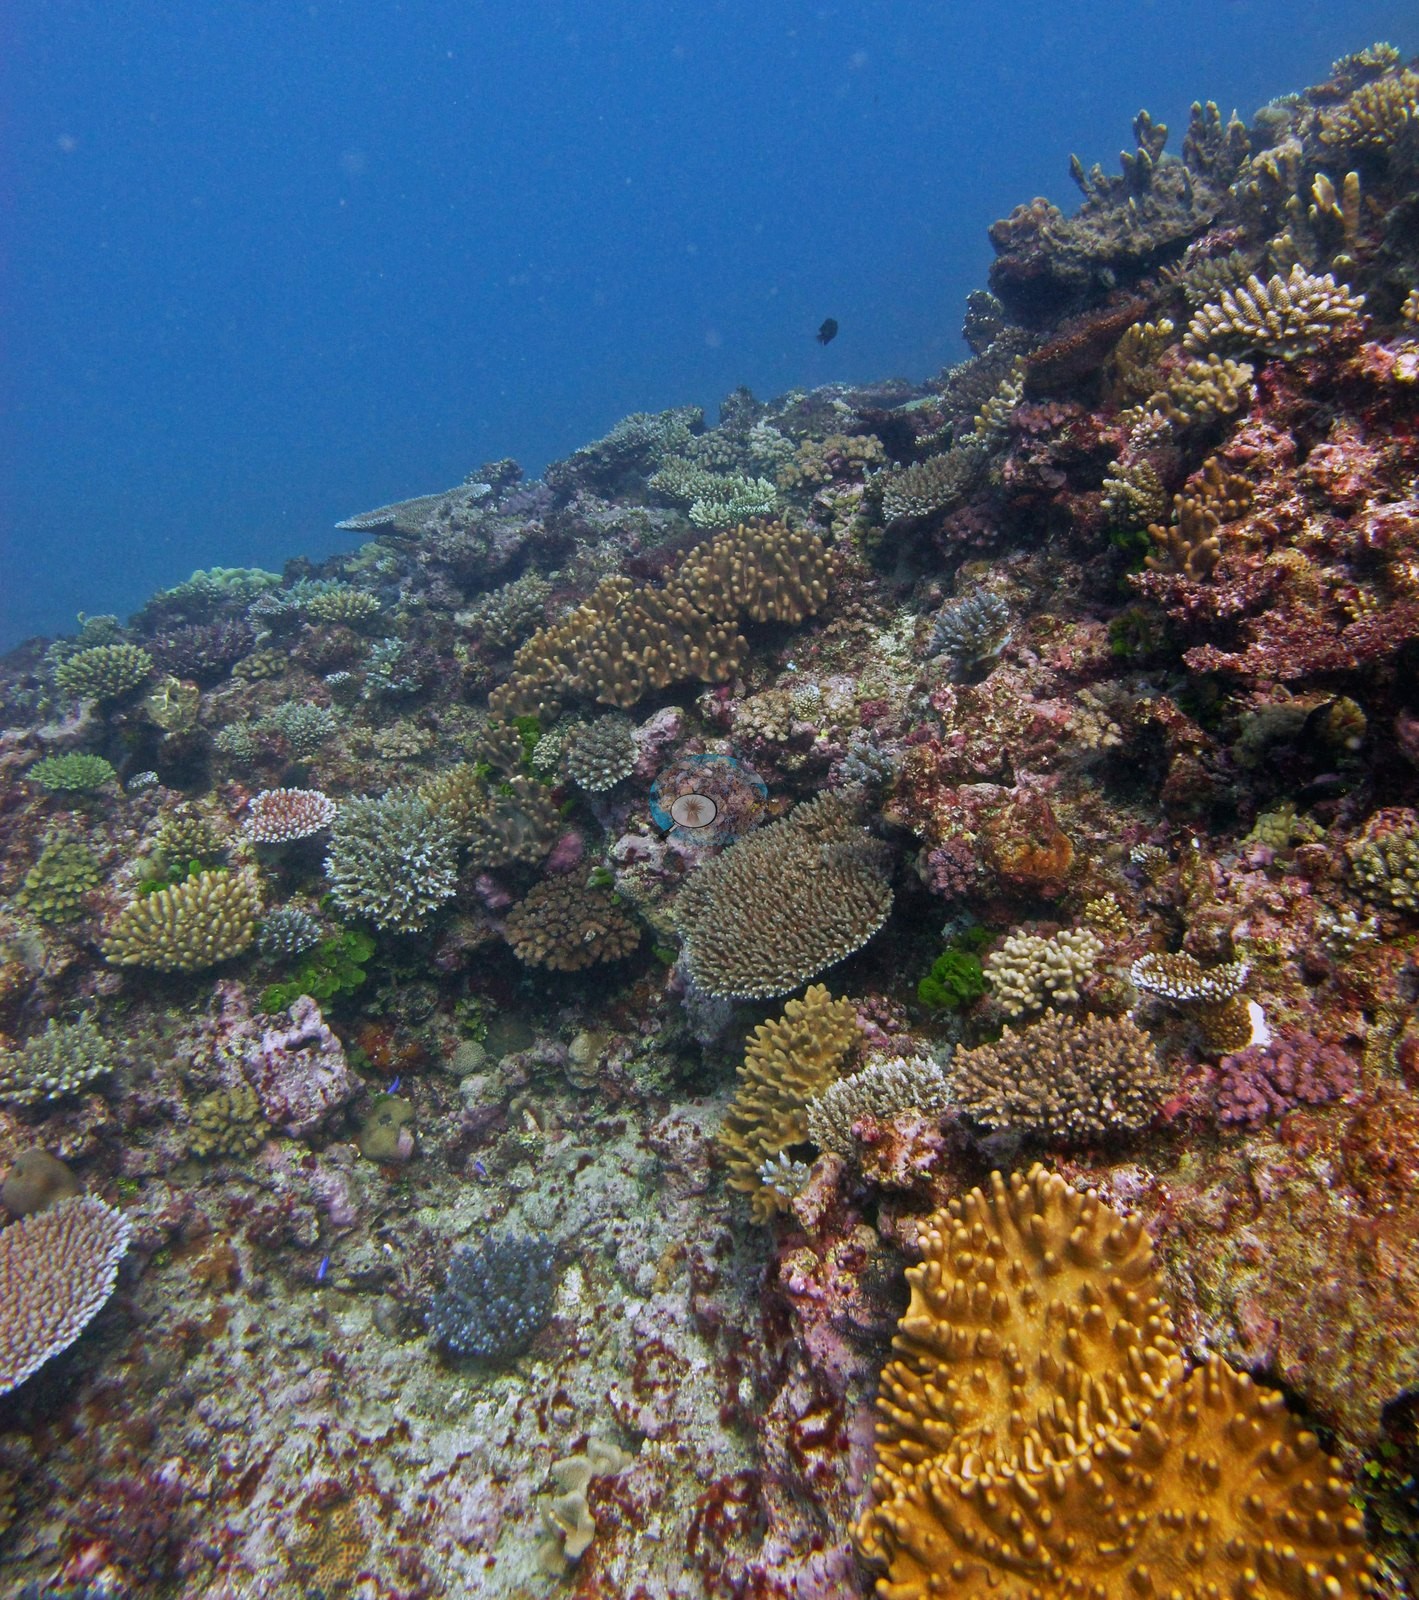
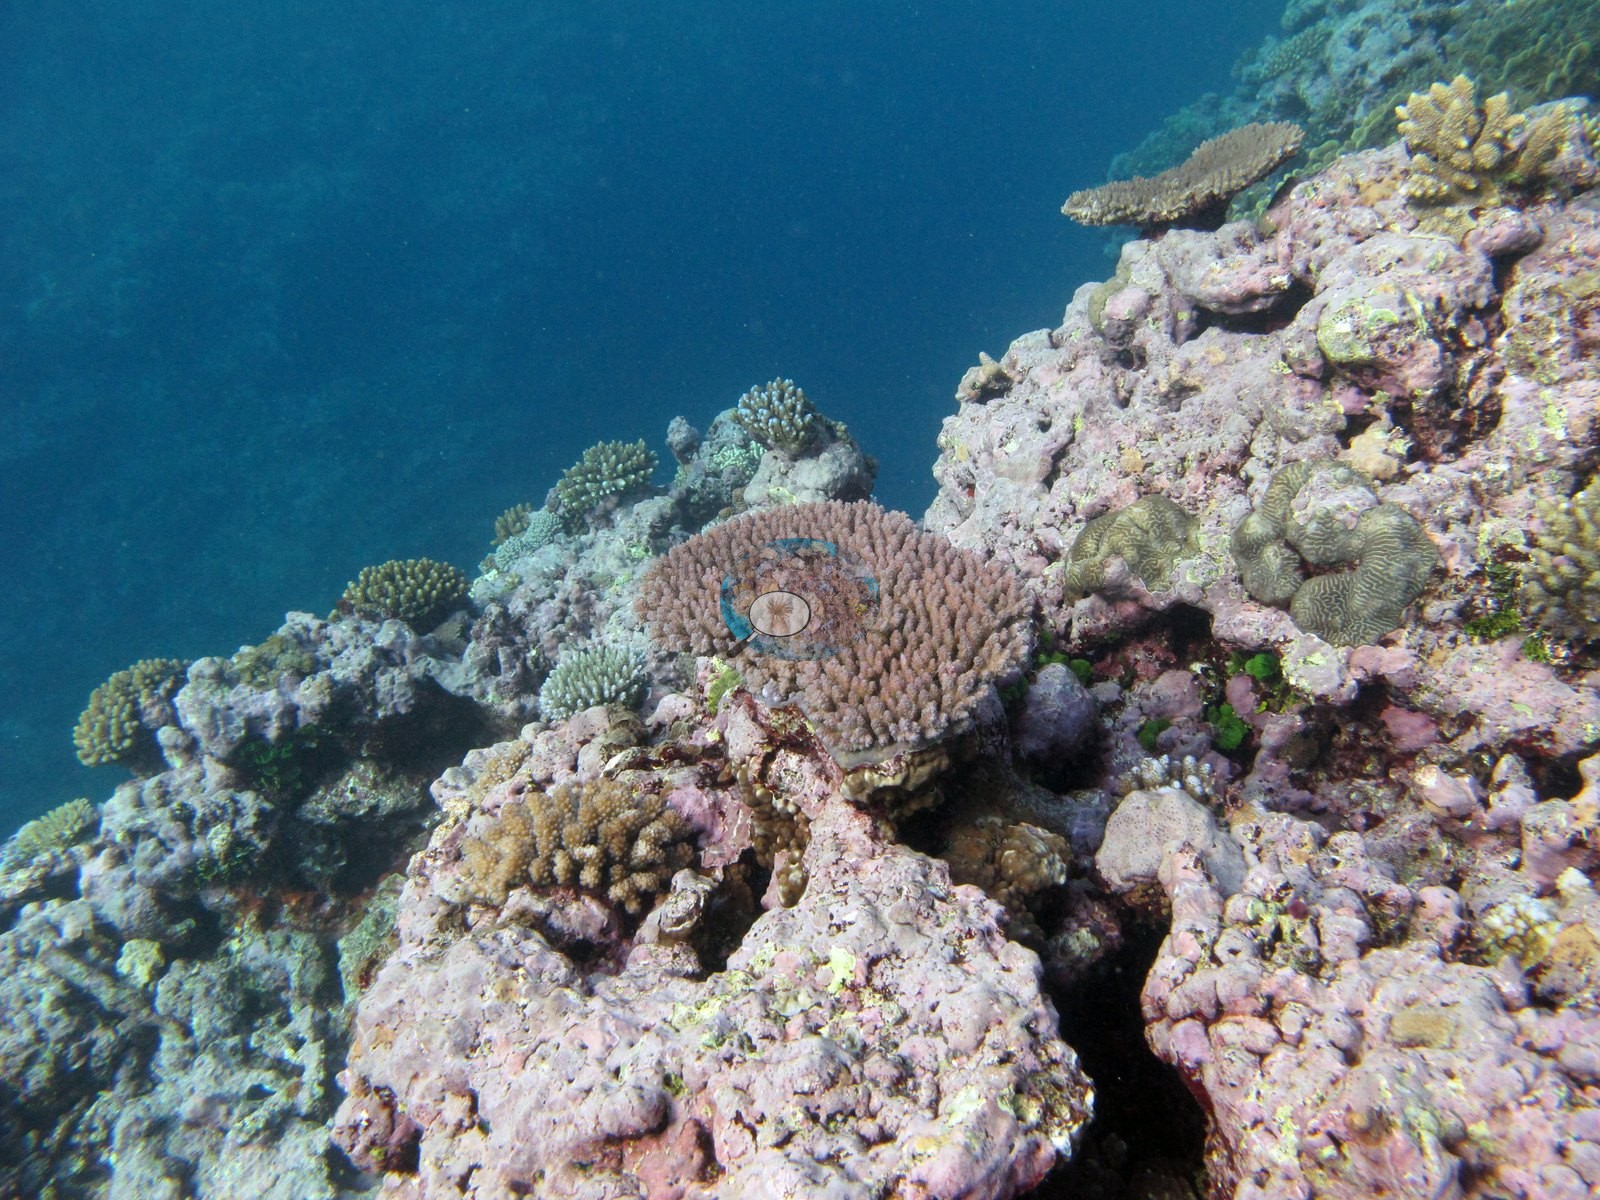
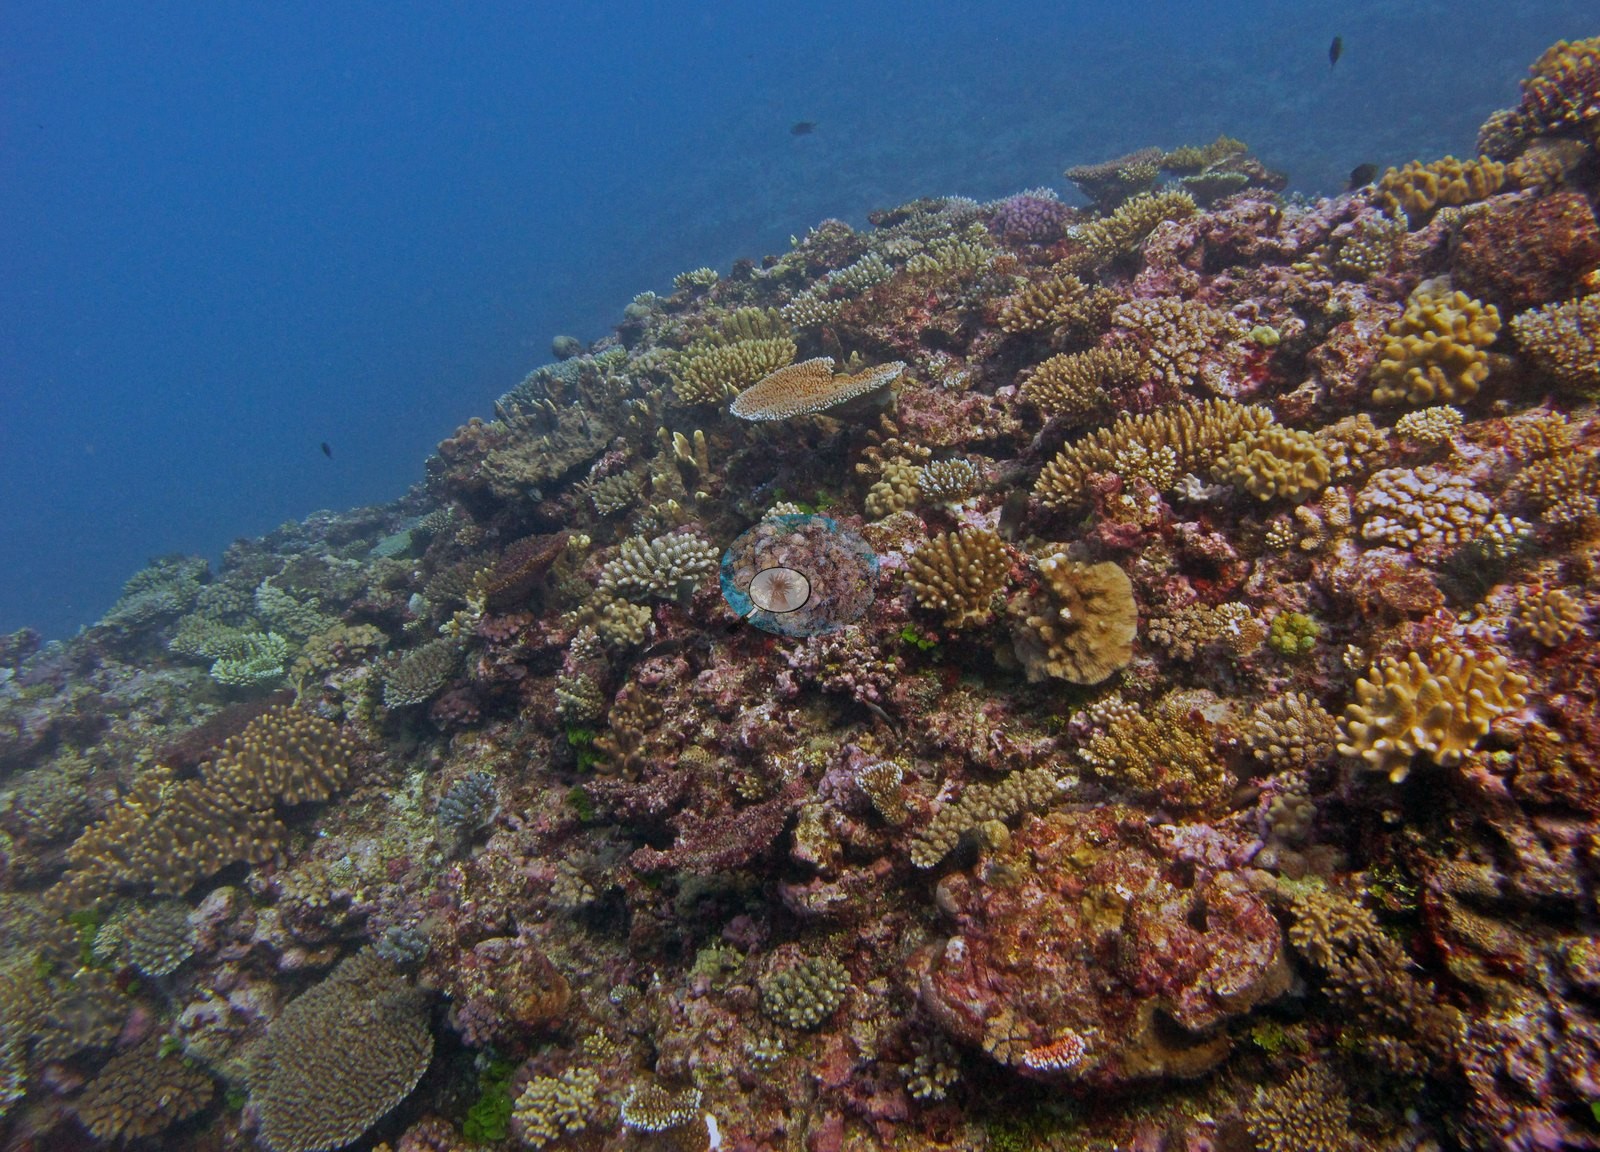
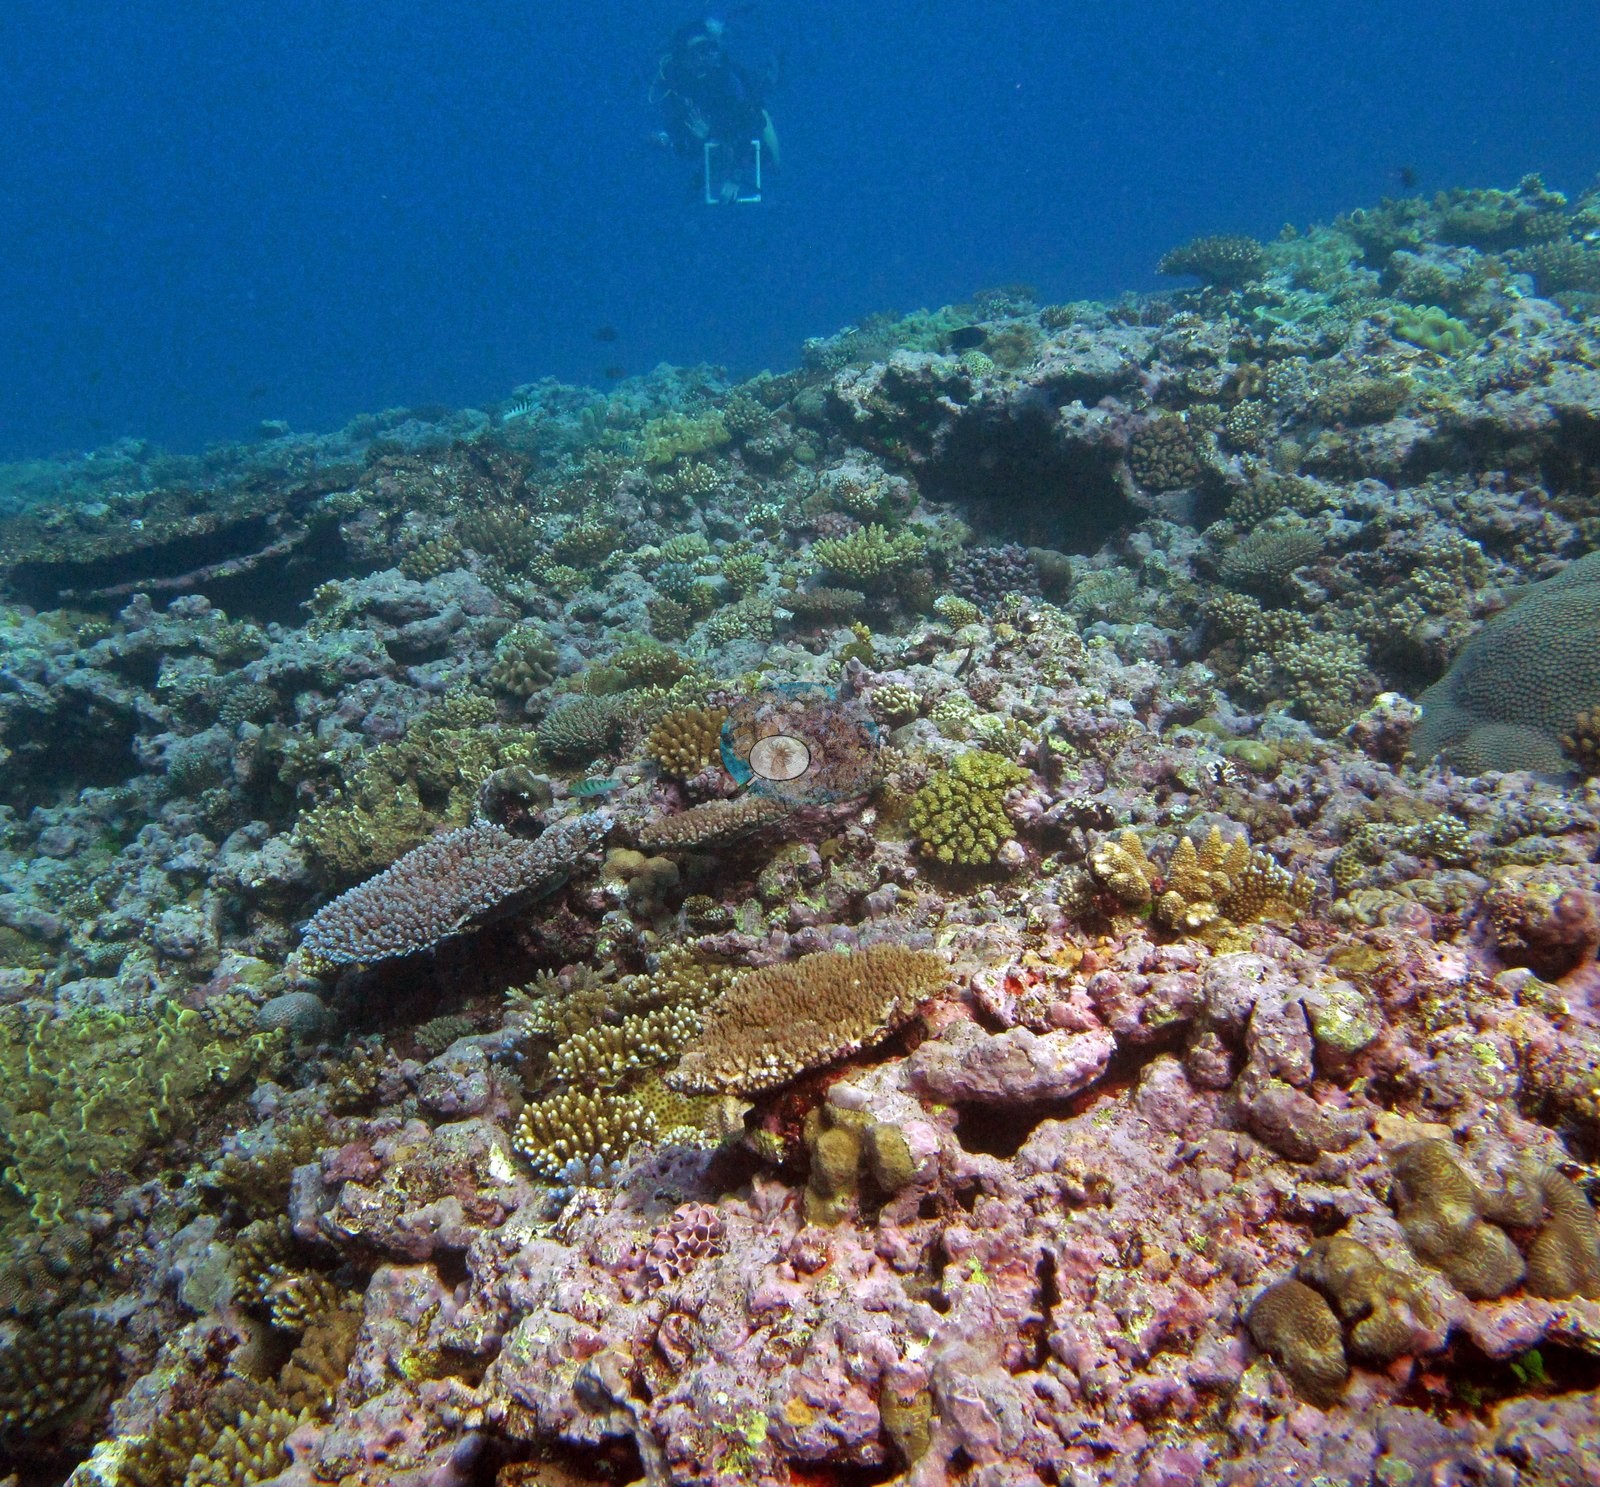
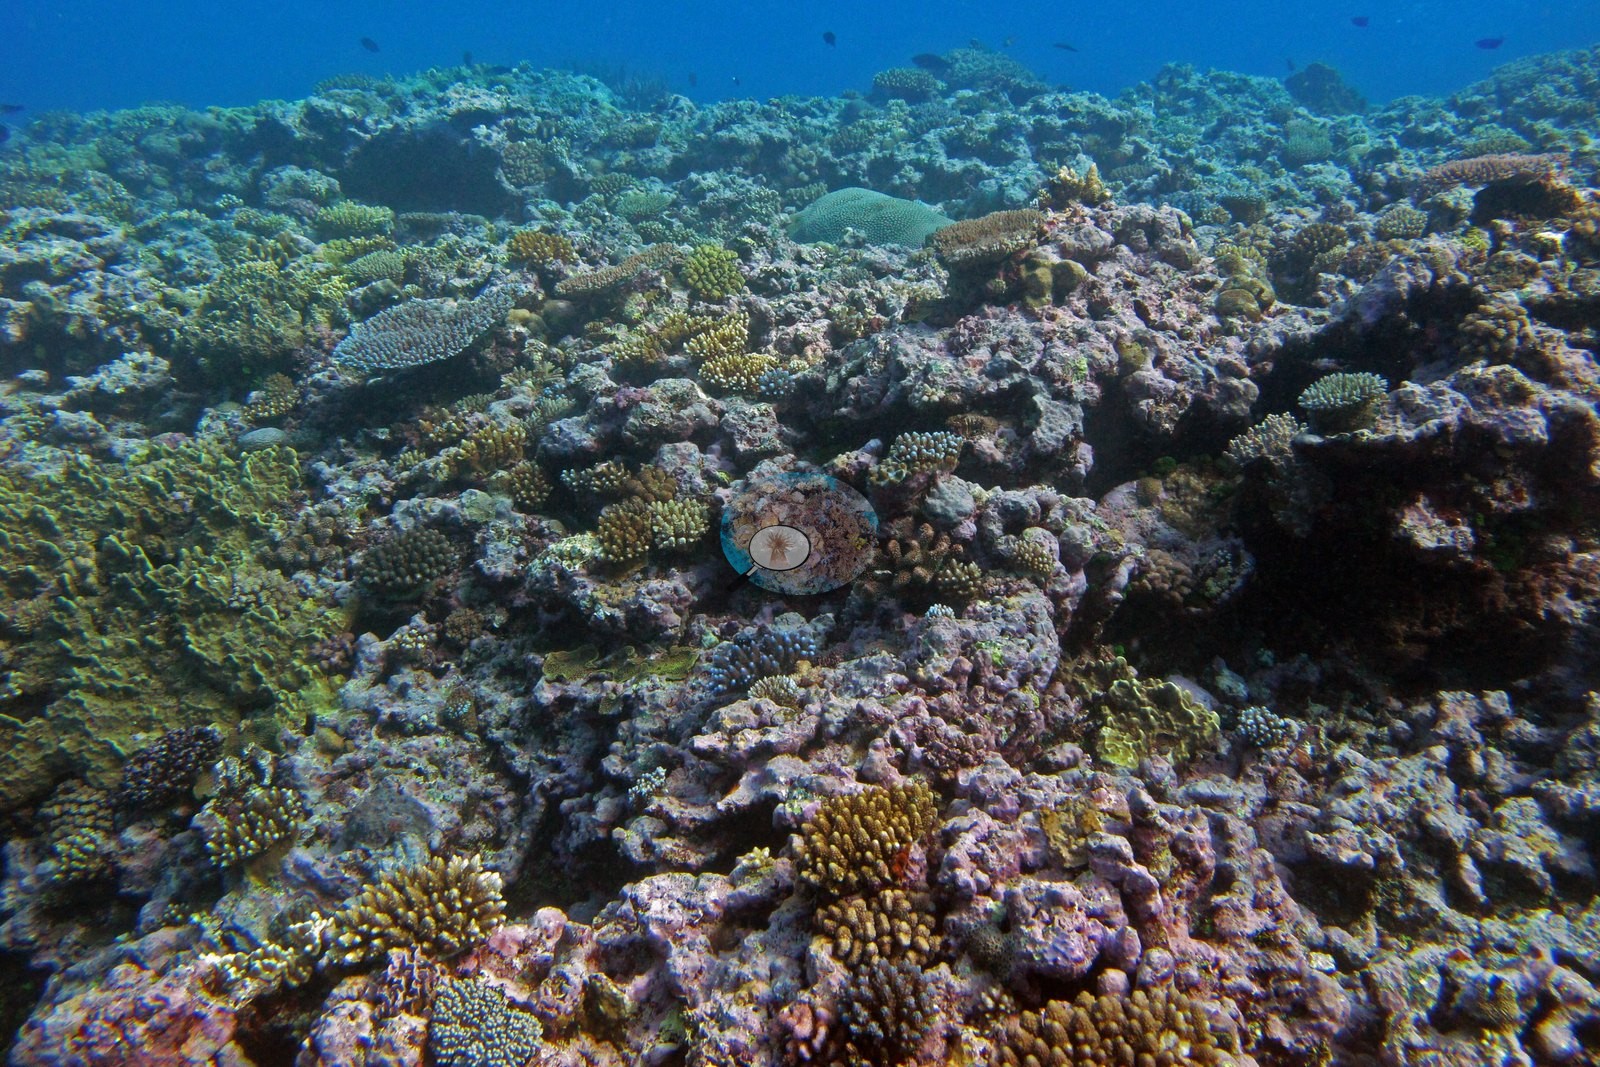
Individual landmarks recur: a tan tabulate Acropora plate perched on a pale coralline mound in Image 15, a large golden-orange corymbose colony low in Image 6, and stepped ridges dropping into clear blue in Image 9, Image 6, and Image 8.
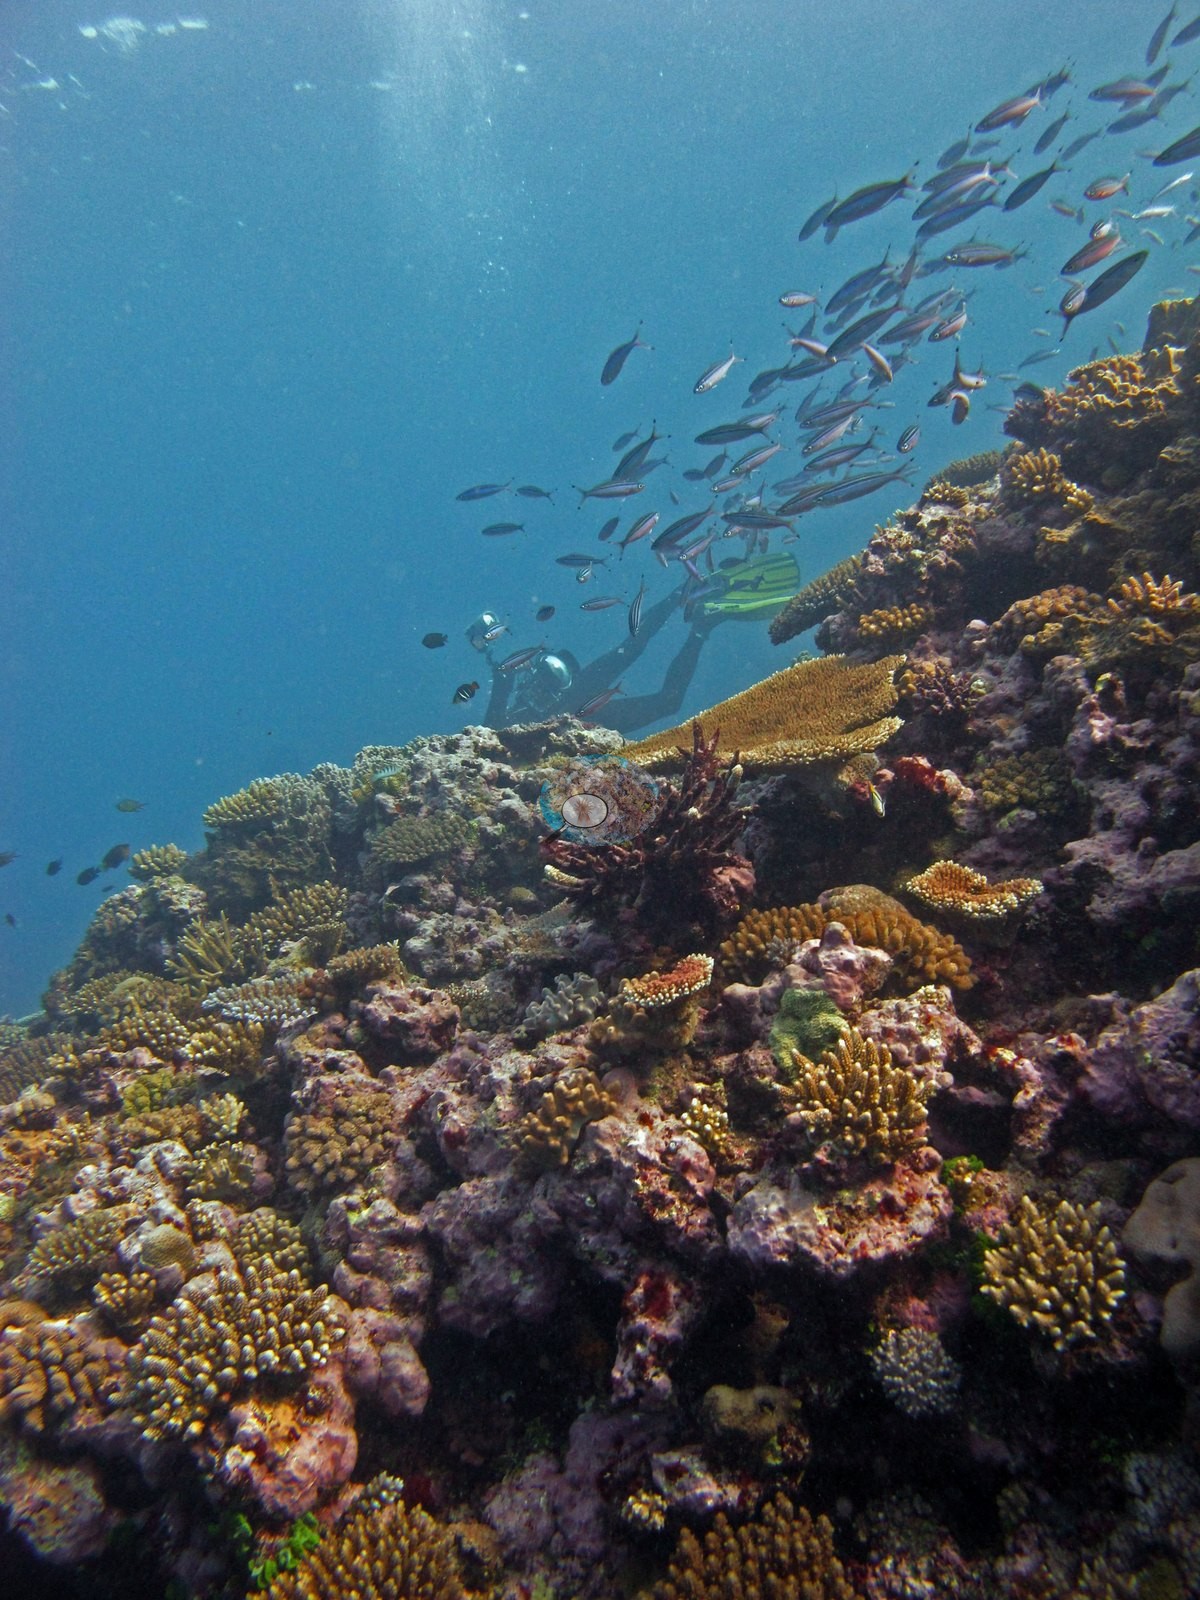
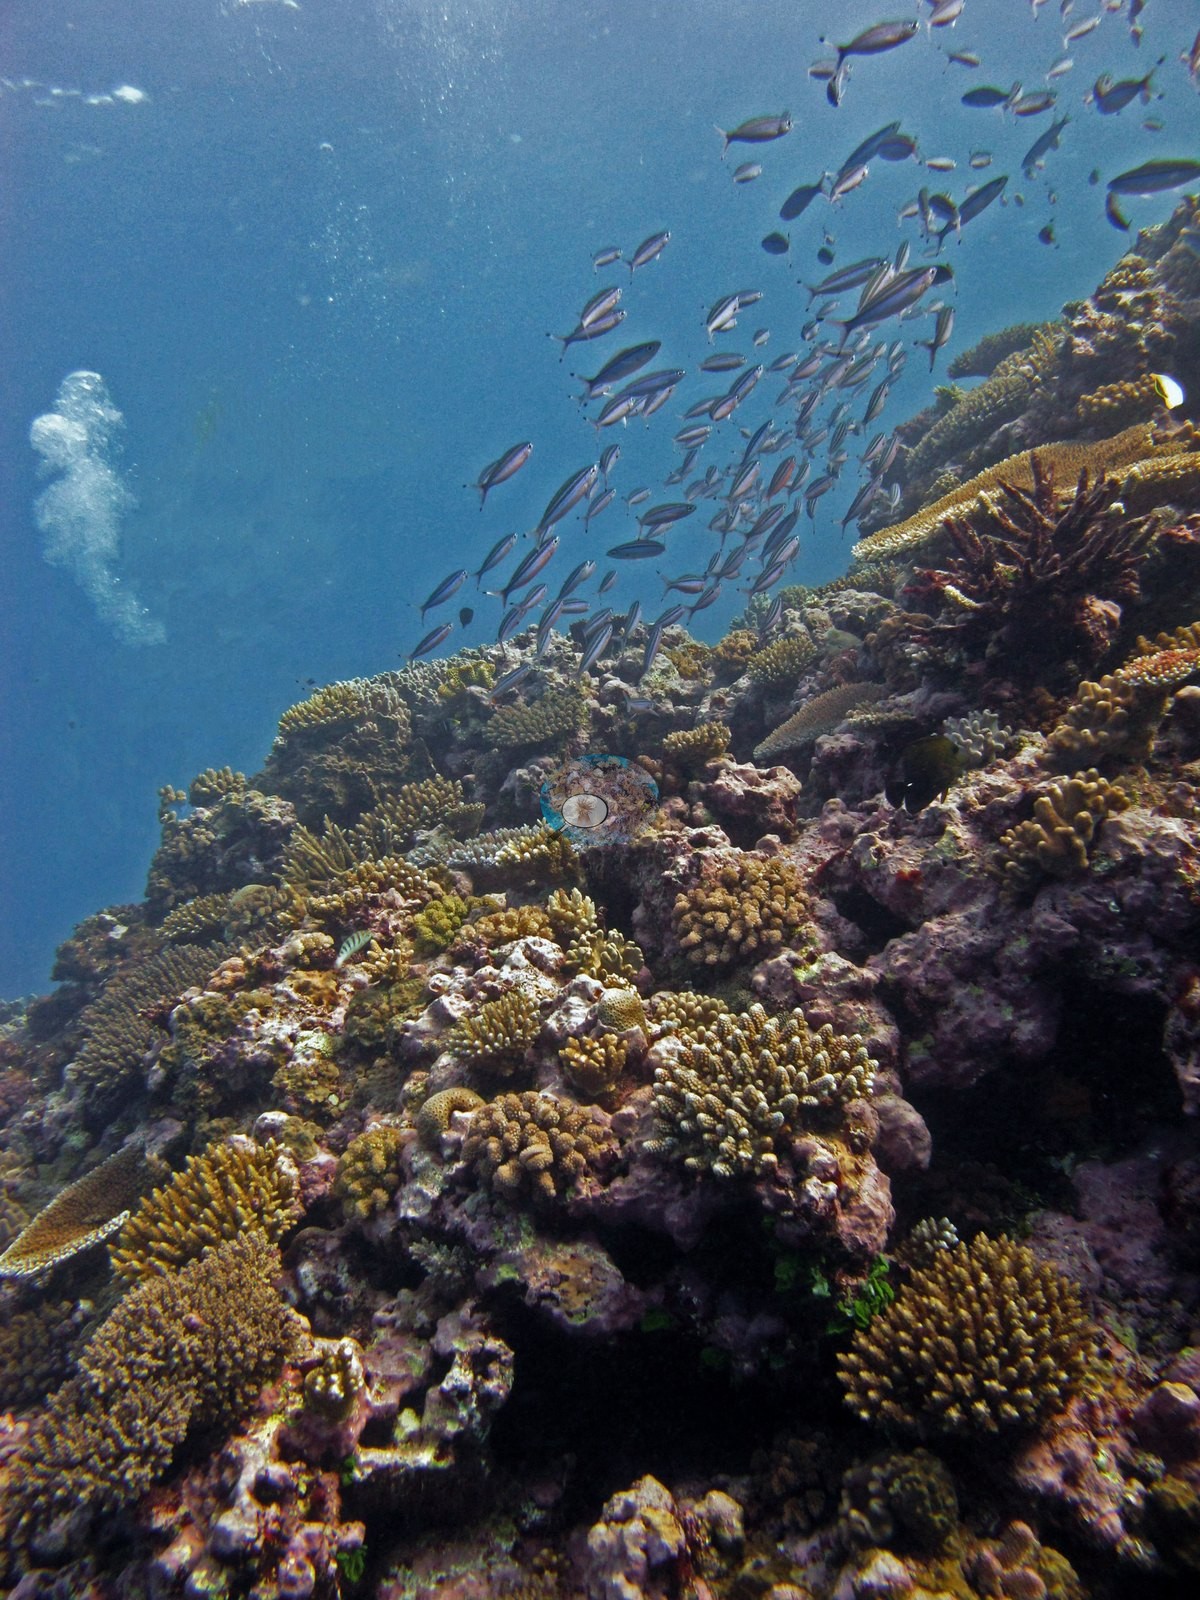
Fish are a consistent presence rather than a subject — shoals of small fusiliers and planktivores stream over the reef in Image 11, Image 9, and Image 8, and a few larger fish appear in Image 13, as Anderson noted (e.g., Image 8, Image 9, Image 11).
Divers appear at the top of Image 14 and Image 10. No bleaching front, disease lesion, or crown-of-thorns feeding scar is visible in any of the 15 frames; Images 1-2 are the tagged sampled colonies 4 and 5.
Coral cover 36%, from the LOF-GRE in situ benthic transect (the mean of all of this station's own transects in the expedition's per-transect benthic data) — a diver transect, and the authoritative figure for this site. Transect mean 36 ± 5.6% SE (n = 5 transects; Living Oceans Foundation per-transect benthic data); the headline above is this all-transect mean.
FJTO02 (Totoya, Lau Archipelago): surveyed 3 Jun 2013 during the Khaled bin Sultan Living Oceans Foundation Global Reef Expedition. Coral cover 36% (point-count surveys). Neither of the two coral colonies from this site with an outlier score was flagged as a physiological outlier (Mayfield et al. 2017, PLoS ONE).
Survey team's site notes. A diverse benthic community with the dominant scleractinian community differing by location. Shallower areas may be dominated by branching acroporids and (sub)massive poritids with encrusting and plating corals also present. Small mounds of hosting diverse mixed coral assemblages may be present. At greater depths, colonies take on plating morphologies and form a series of shingle-like structures. Prominent macroalgae include Halimeda, Caulerpa, and Dictyota. High coral cover, with large spur and groove ridges. Sediment filled grooves, with large pieces of rubble. Shallower depths are dominated with small Acropora and Pocillopora colonies. Fore reef sand flats benthic cover is usually very low because the substrate is mobile and largely unconsolidated thus inhibiting colonization by benthic organisms. In some cases, large Porites lobata colonies and tabular acroporids occur within the sand flats, especially in deeper areas (30-50 m). Macroalgae become more common with depth due to the abatement of wave energy with increasing depth. The deeper fore reef habitats at the base of the reef were generally low relief sand flats, mostly uncolonized. Often there were sparse assemblages of cyanobacteria and small patches of macroalgae, along with isolated larger corals. The Living Oceans Foundation transects here recorded 12% cyanobacteria and no recently dead coral.
CV model comparison
More info
The photo row below is a methods comparison only: it is never averaged with the transect and never used as the headline. It compares site means only: the photos come from the same survey dive as the transect but not from the same points.| Method | Hard coral cover (%) | Photos (n) ± SE |
|---|---|---|
| Transect mean (all transects) | 36.2 | |
| CoralSCOP edited | 33.7* | n = 12 · SE 4.8 |
| Claude (edited photos) | 25.6* | n = 12 · SE 4.0 |
The two computer-vision methods differ by 8.1 pp (25.6–33.7%) and read 2.5–10.6 pp below the in-water transect (36.2%); the headline is the in-water transect because a diver transect is independent of the photographs.
*Based on only 12 reef-habitat photos; this estimate is less certain.
See a more detailed, stand-alone version of this table.
Data & links
- Download benthic survey data (CSV) ↗
- Download all LOF-GRE data (933 sites) ↗
- Photo portfolio ↗
- Coral Reef Diagnostics region page ↗
All images from Coral Reef Diagnostics. Data are from the Khaled bin Sultan Living Oceans Foundation Global Reef Expedition and Coral Reef Diagnostics.
 © Coral Reef Diagnostics.