
Fiji - Moala Group (Moala / Totoya / Matuku)

Regional summary of 24 dive sites. Figures are averages across the sites that report them (n = sites with a value); each site's own page has its individual values. Part of the Fiji - Lau overview. Island summaries: Totoya, Matuku, Moala.
⬇ Download this region as a report card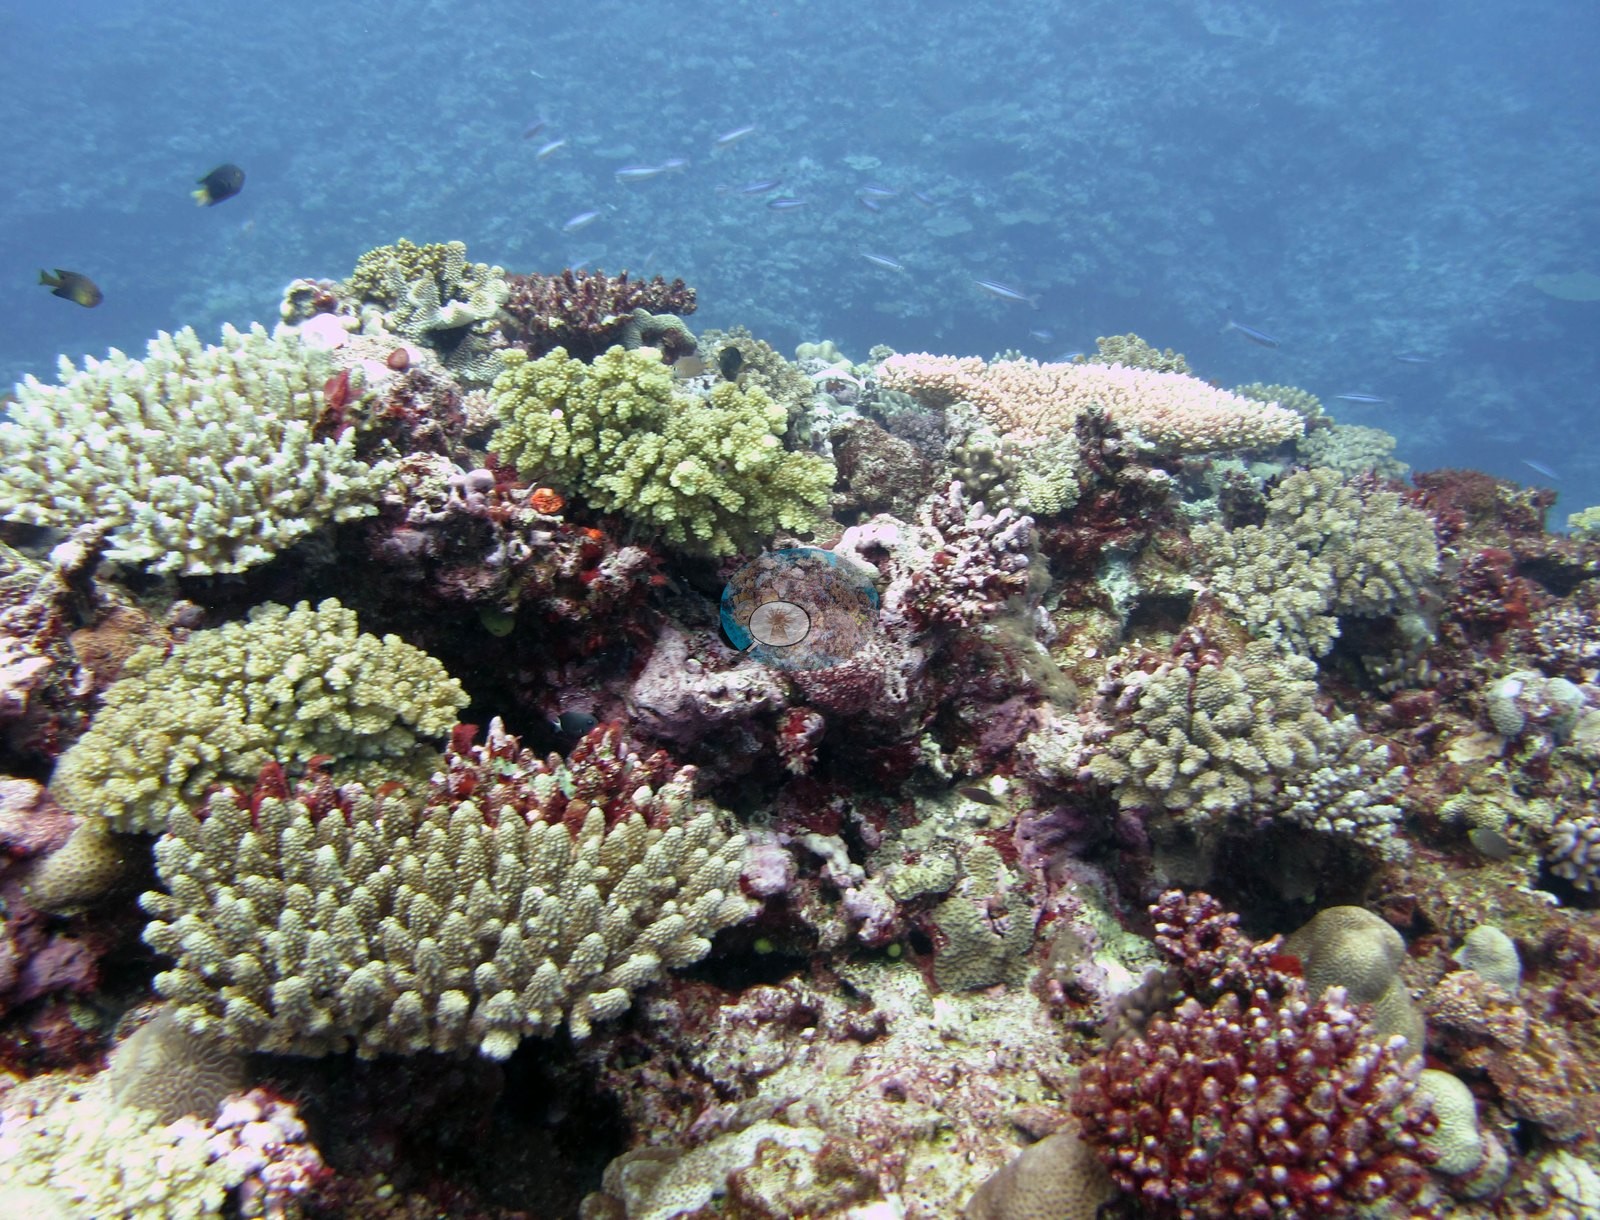

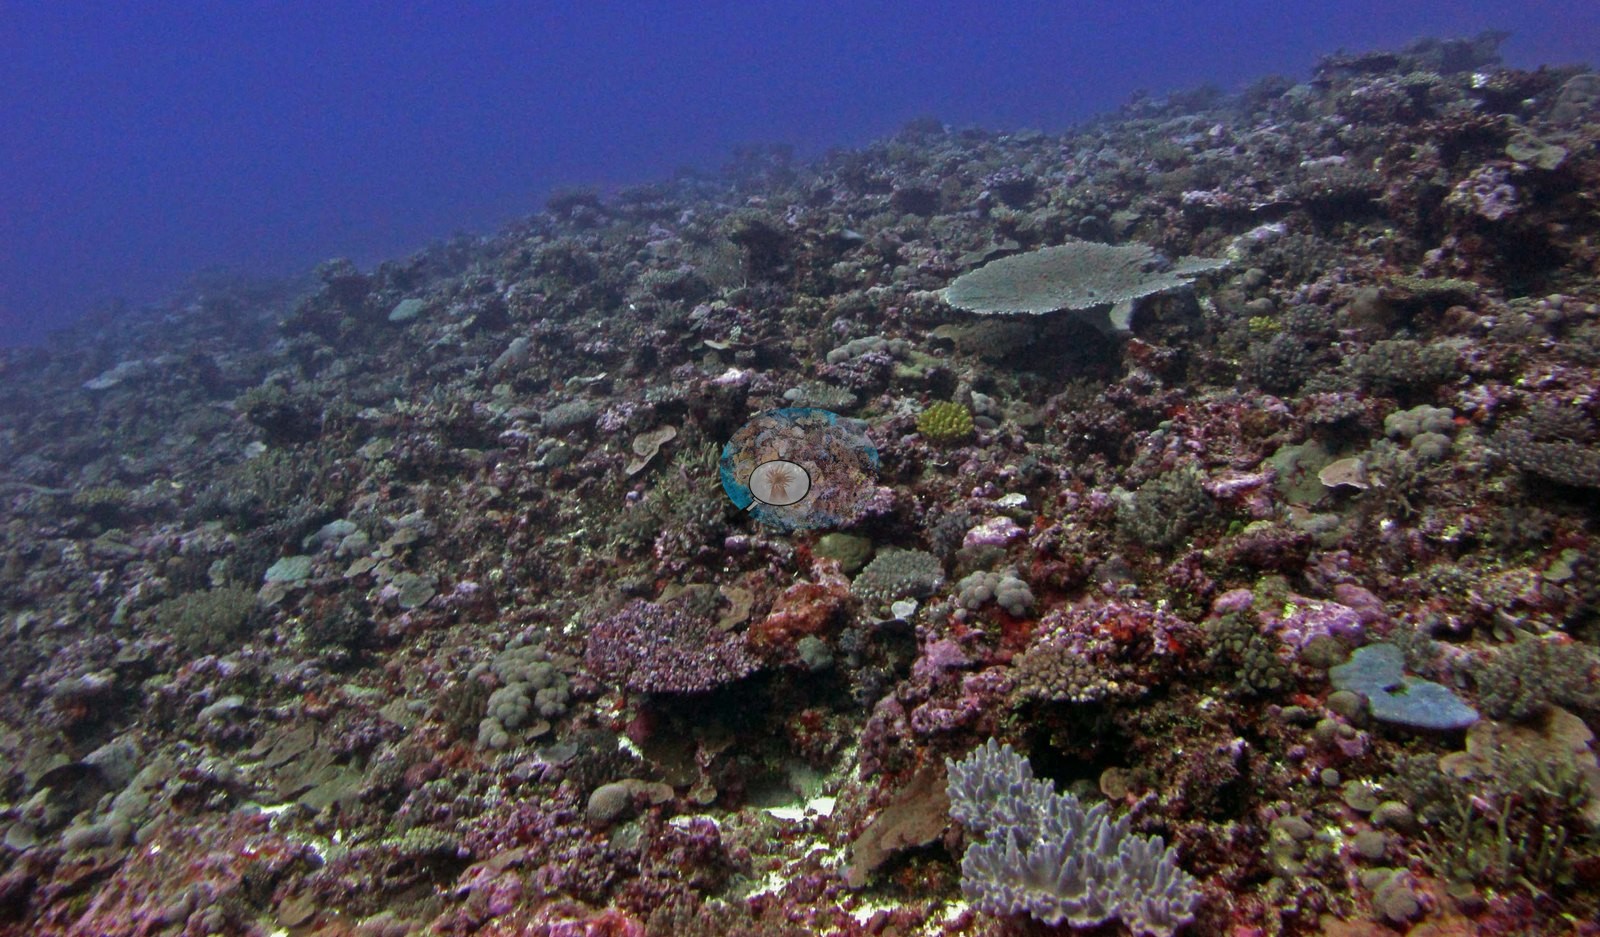
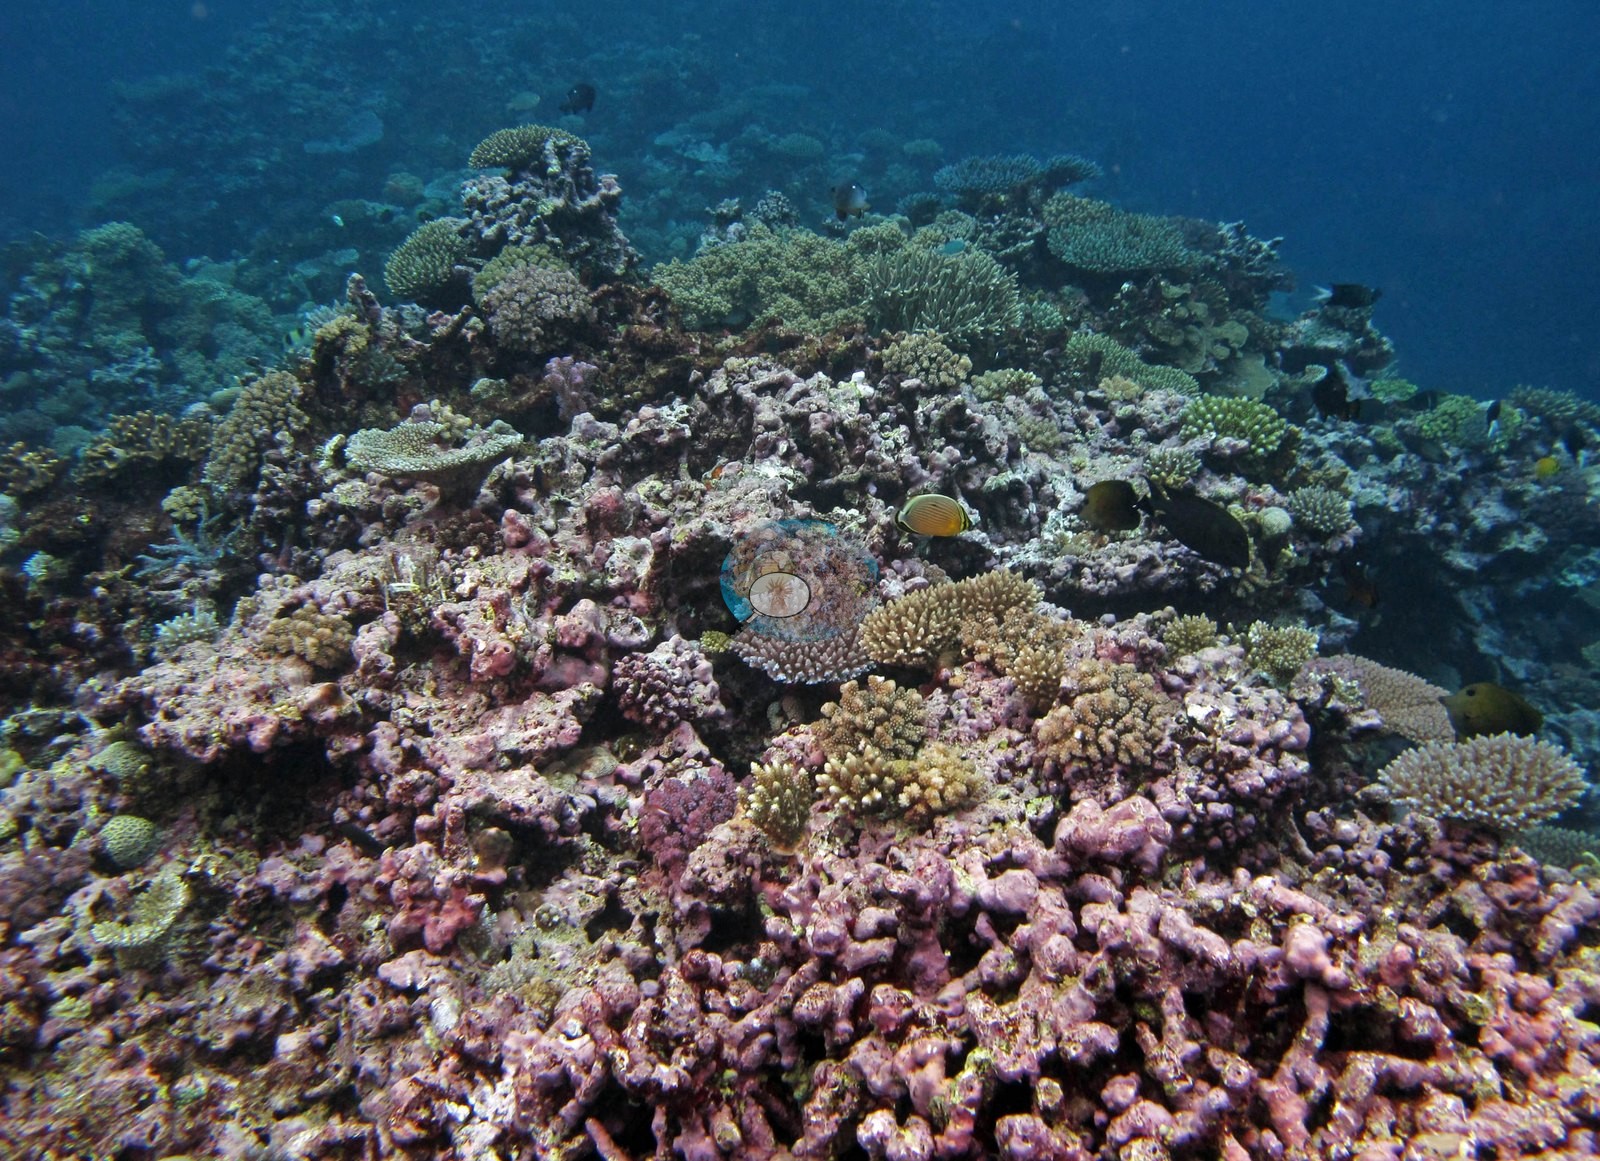
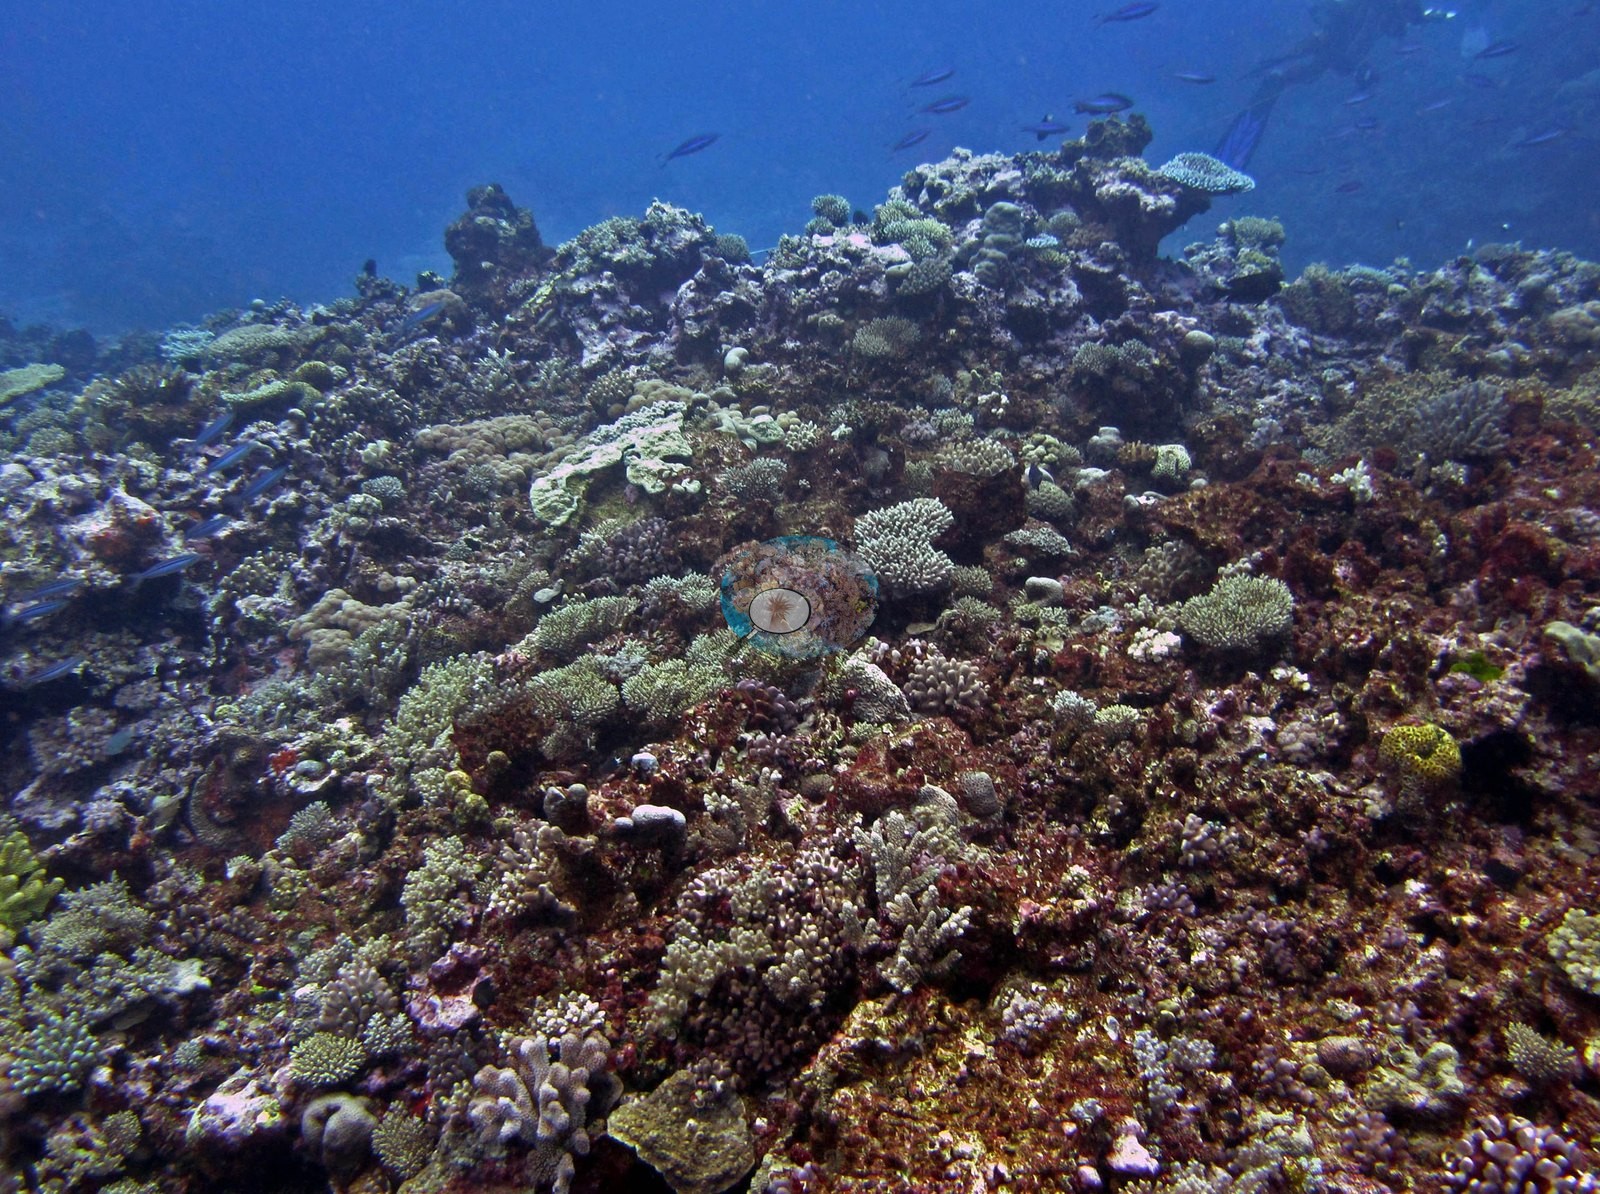
The volcanic Moala group's fore-reef terraces, spur-and-groove ridges, and steep slopes, surveyed in June 2013, also hold a coral canyon, a cave passage, and a small seamount. Cover ranged from 12% to 51%, and no crown-of-thorns starfish were recorded.
Heat stress
Long-term record: 11 years from 1985 through 2025 reached 8 or more °C-weeks at NOAA’s Fiji station. Download the annual DHW data (CSV).
24 sites in this region — click a marker to open that site.
Regional setting
Spalding et al. (2001) place Fiji's islands on two shallow geological foundations, the Fiji Platform in the west and the Lau Ridge in the east, and they treat the Moala group separately from the Lau Islands. The Moala group appears in their account of the Koro Sea, the relatively enclosed body of water between the Lau Islands and Viti Levu, where only a few islands are scattered. South of the mostly volcanic Lomaiviti group, the atlas describes the Moala group as three high volcanic islands ringed mainly by fringing reefs, a contrast with the Lau chain to the east, where carbonate islands, atolls, and near-atolls are common. For Fiji as a whole, Spalding et al. (2001) estimate about 10,020 km² of coral reef and list some 298 recorded scleractinian coral species, which they relate to Fiji's position near the Indo-Pacific center of diversity and to its wide variety of reef types. They add that most study had been concentrated near Suva and on the Great Astrolabe Reef, so that much of Fiji's reef area remained poorly known. As of 2001, the most recent major disturbance they record is a warming event early in 2000 that bleached 50–100% of corals over wide areas and down to 30 m, after which many corals died, chiefly along the southern coasts of Viti Levu and Vanua Levu.
None of the sources report on the Moala group after 2000; the recent picture is regional. Wilkinson (2006), summarizing the 2004 Southwest Pacific assessment that included Fiji, found the region's reefs mostly in good shape even after widespread bleaching in 2000–2002, although recovery was uneven. In Anderson's account, cyclones and human activities posed the greatest threats, with crown-of-thorns starfish and disease also noted, and overexploitation and pollution were focused around towns and lagoons. Souter et al. (2021) record that coral cover in the Fiji Islands subregion rose from 2002 to 2008. For the Pacific as a whole, they show average cover dropping from roughly 37% before 1998 to 31% in 2019, with bleaching the main driver and El Niño conditions in 2015 and 2016 causing considerable coral mortality.
Overview
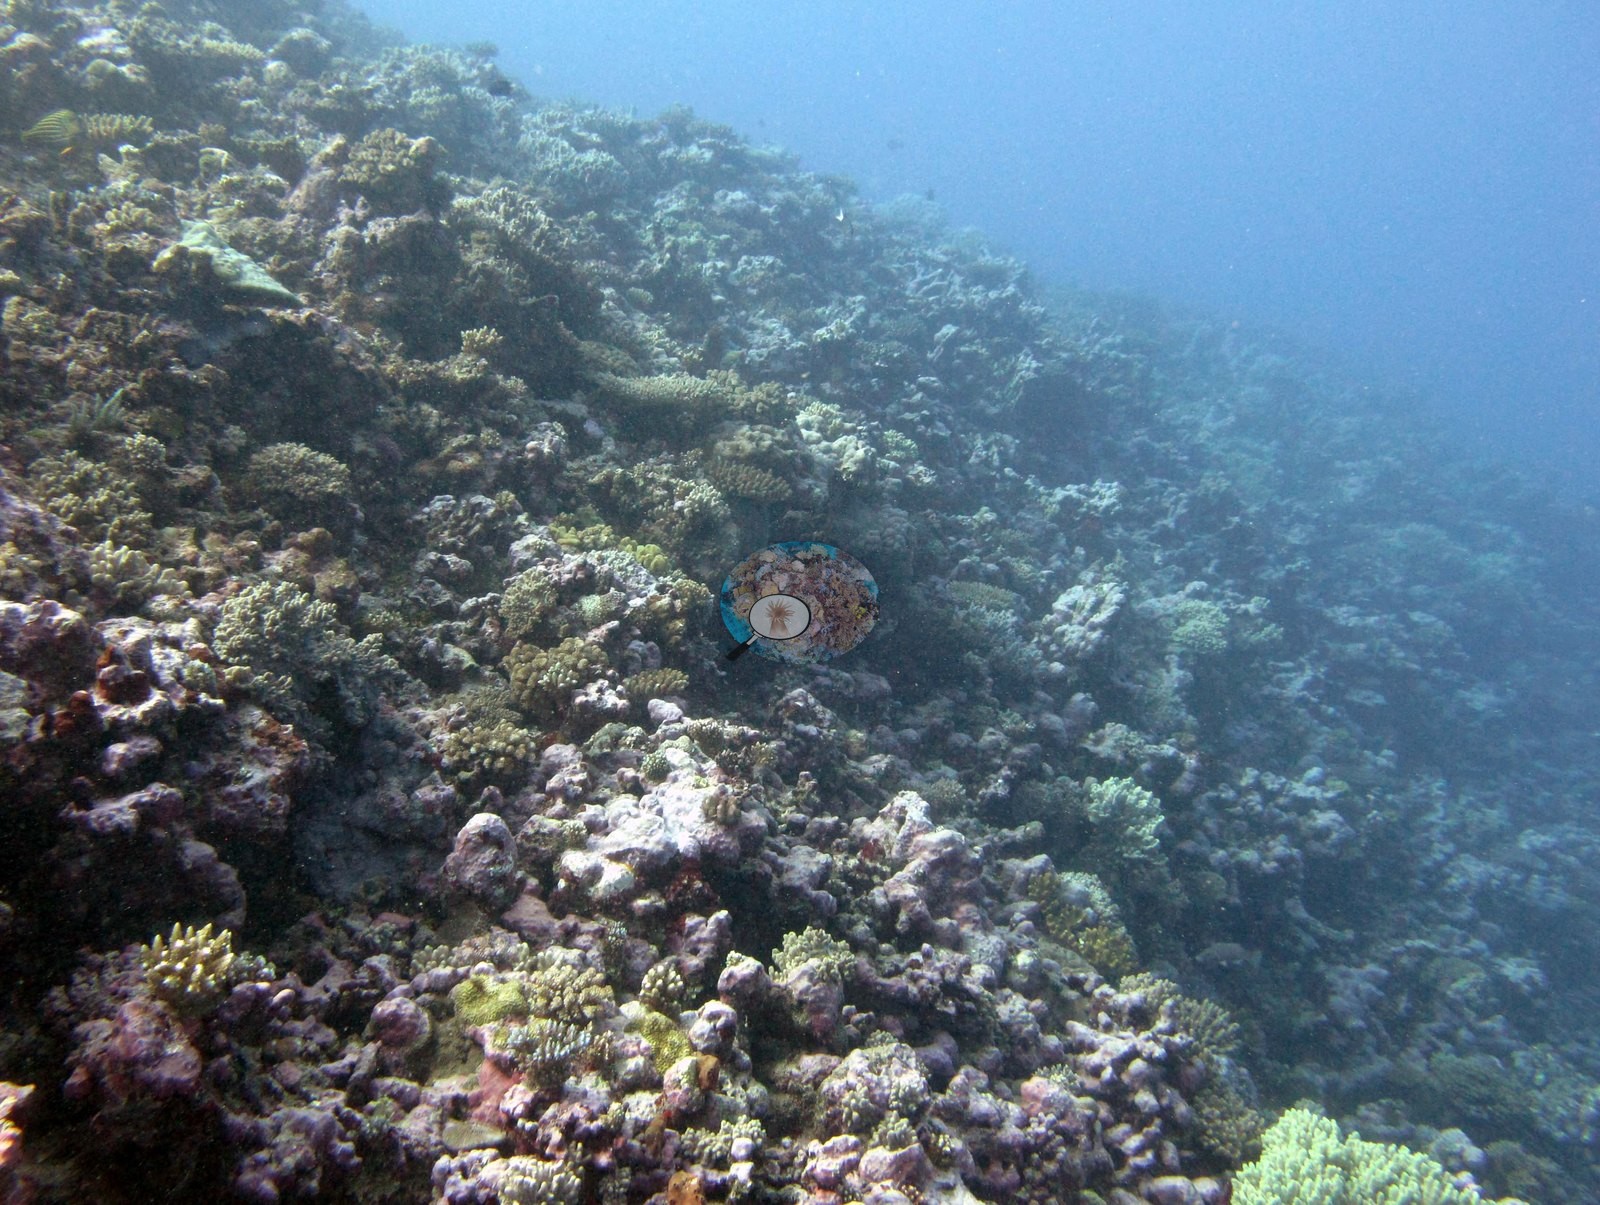
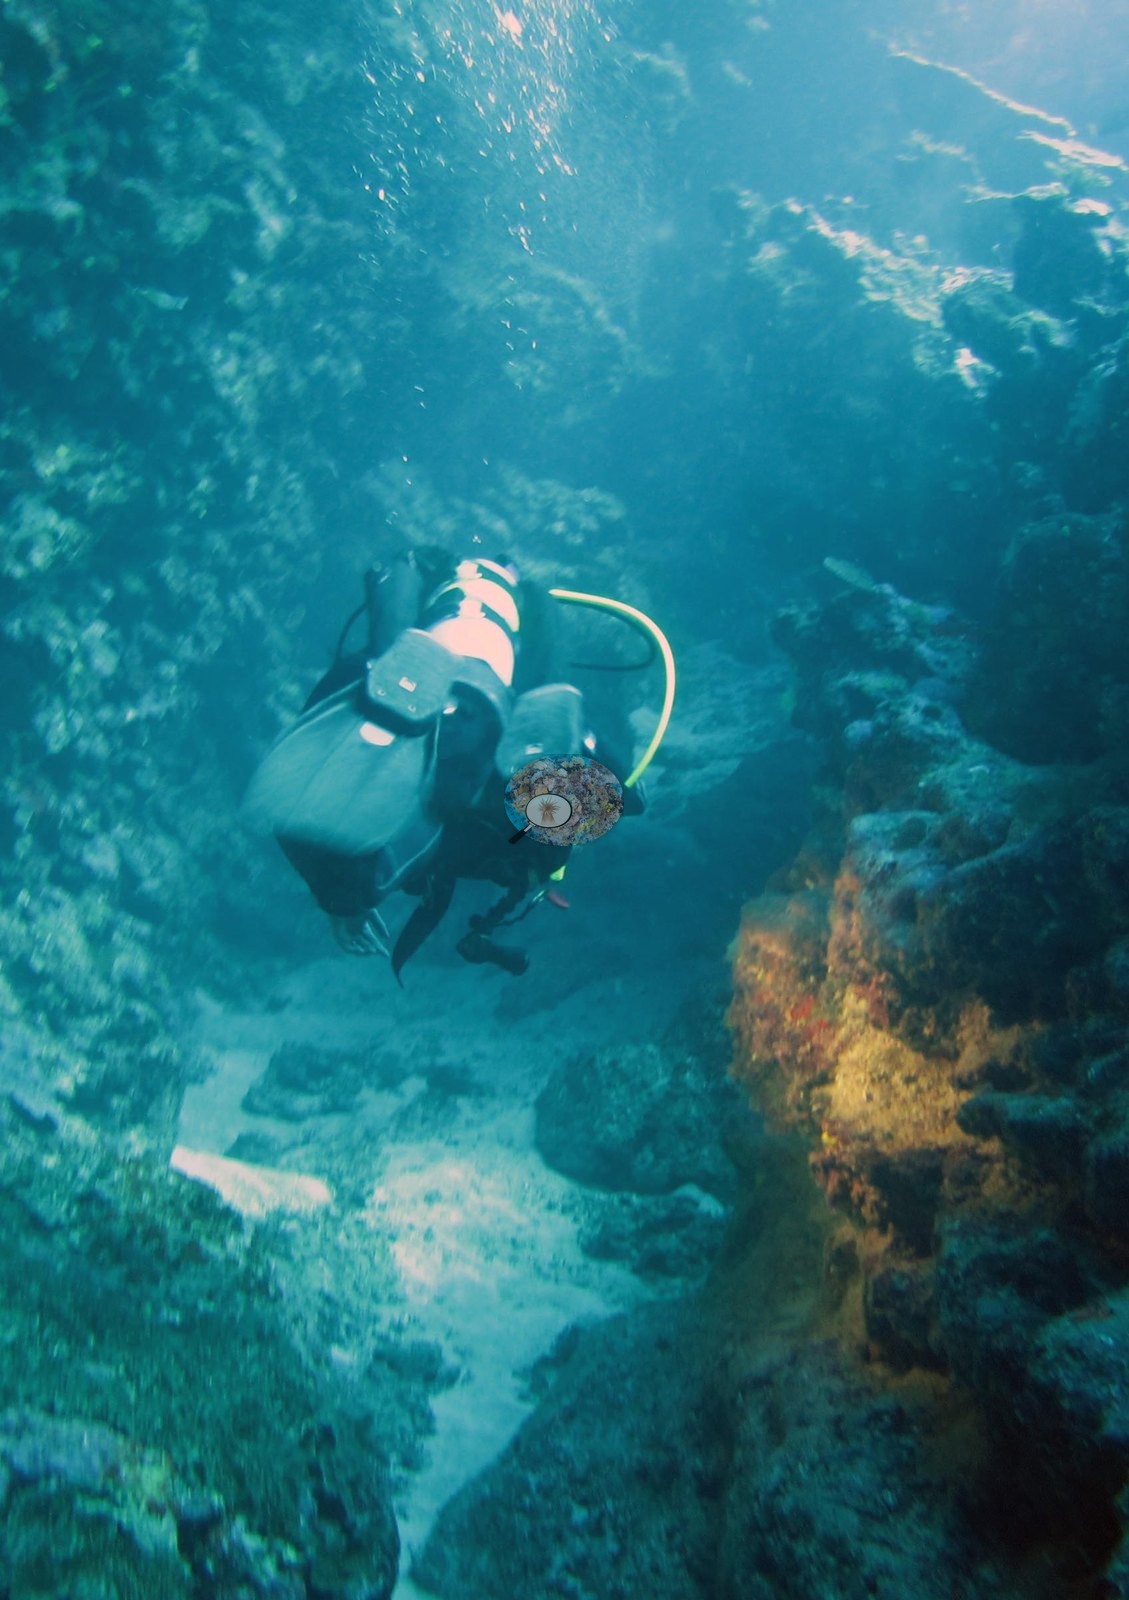
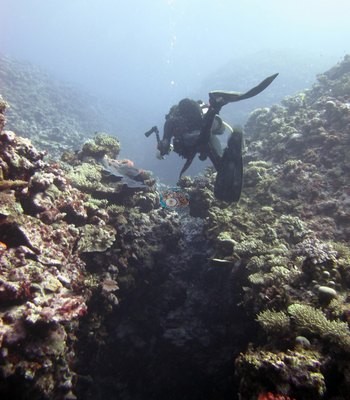
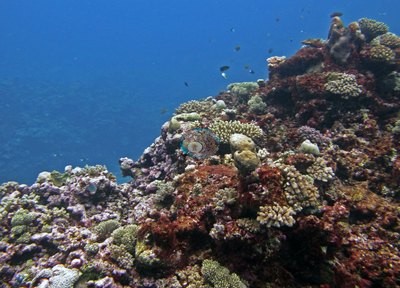
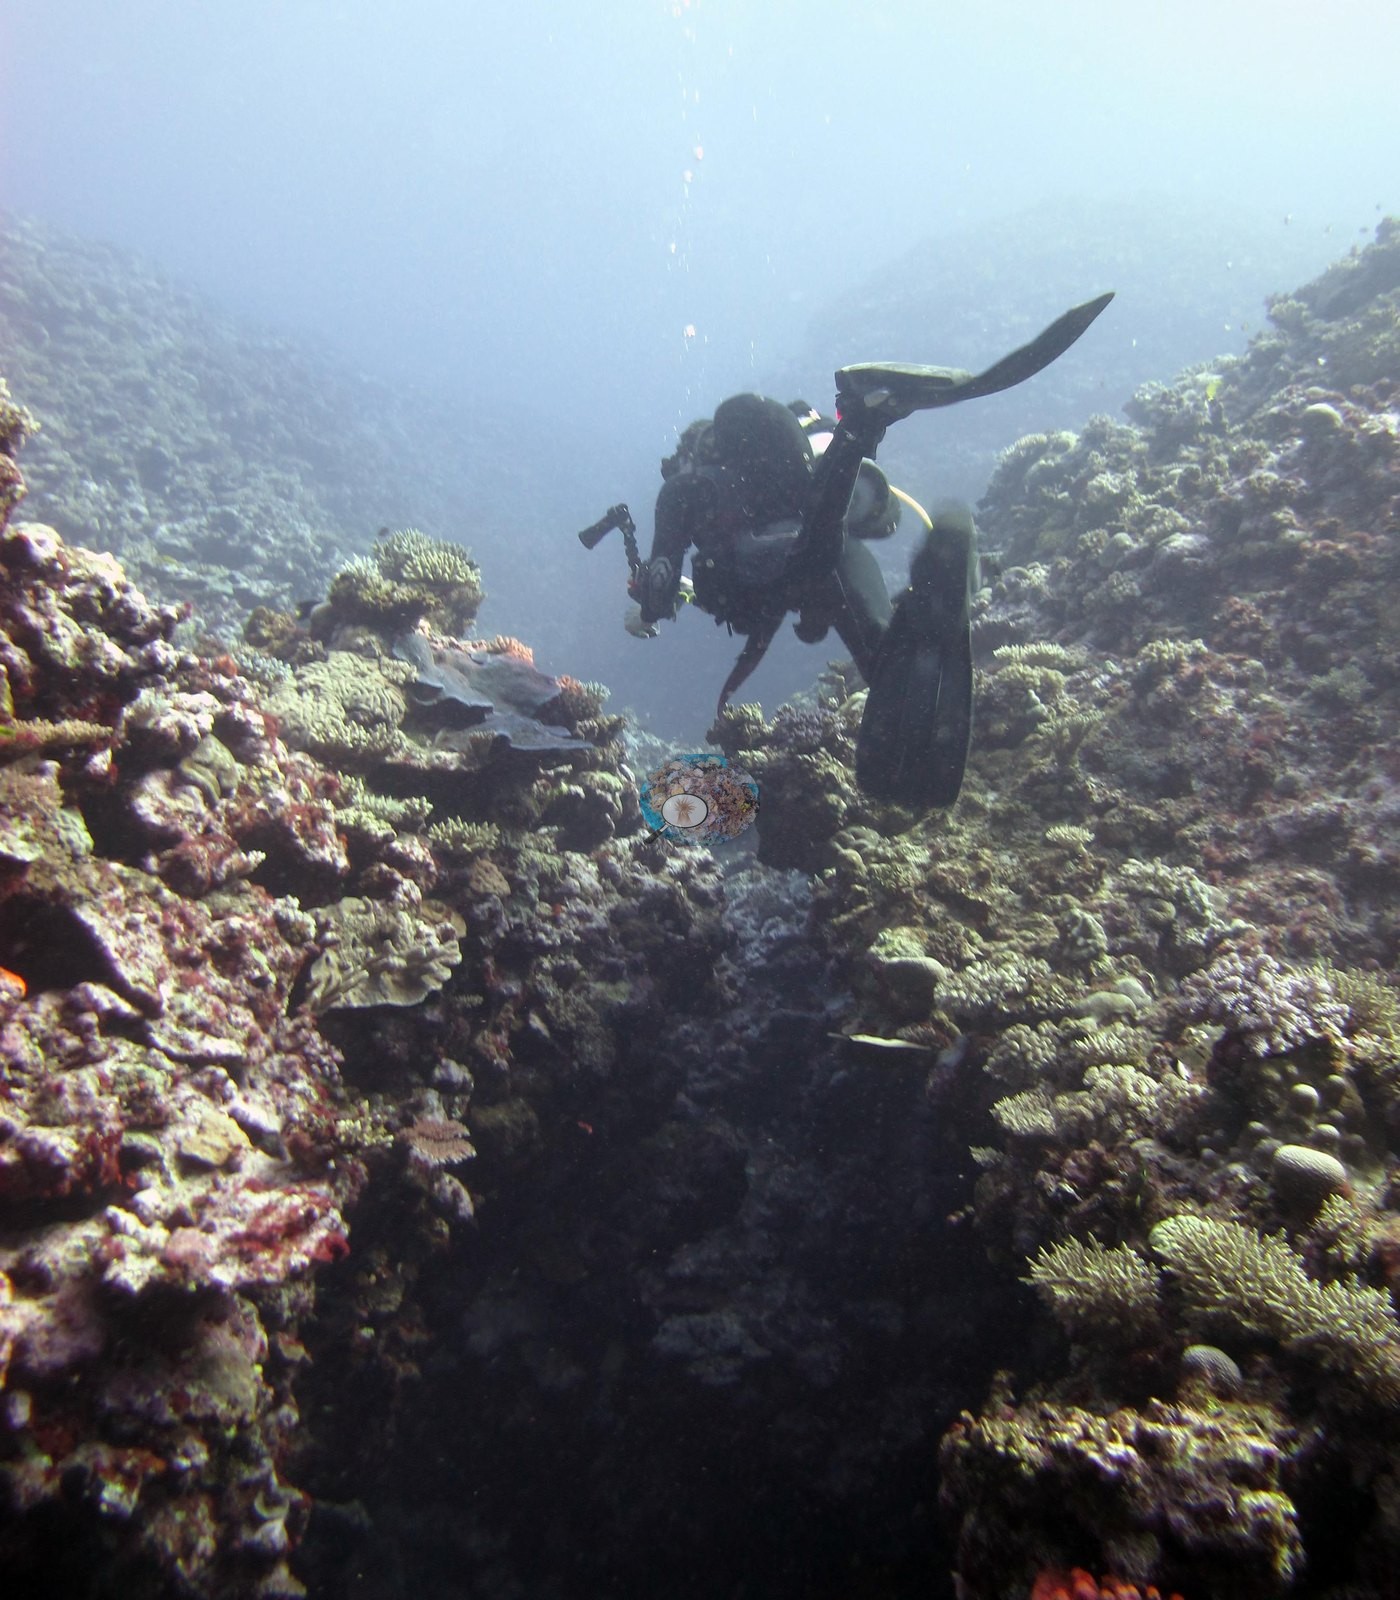
This unit holds 23 Global Reef Expedition benthic stations in the Moala Group of Lau Province, on Totoya, Matuku, and Moala, plus an island-level marker for Totoya, 24 members in all. Totoya was surveyed on 3-5 June 2013, the first Fiji stops of the expedition, Matuku on 6-7 June, and Moala on 8-10 June. Maximum depths dived ran from 12.5 m at FJML17 to 30.8 m at FJML23, and most stations lay on fore-reef terraces, spur-and-groove ridges, and steep slopes. The group also has more unusual settings: a lagoon pinnacle crowned with large Acropora tables at FJML21, a narrow coral canyon at FJML23, a small seamount top off Matuku at FJMT14, and spurs, walls, and an overhung cave passage at FJTO09.
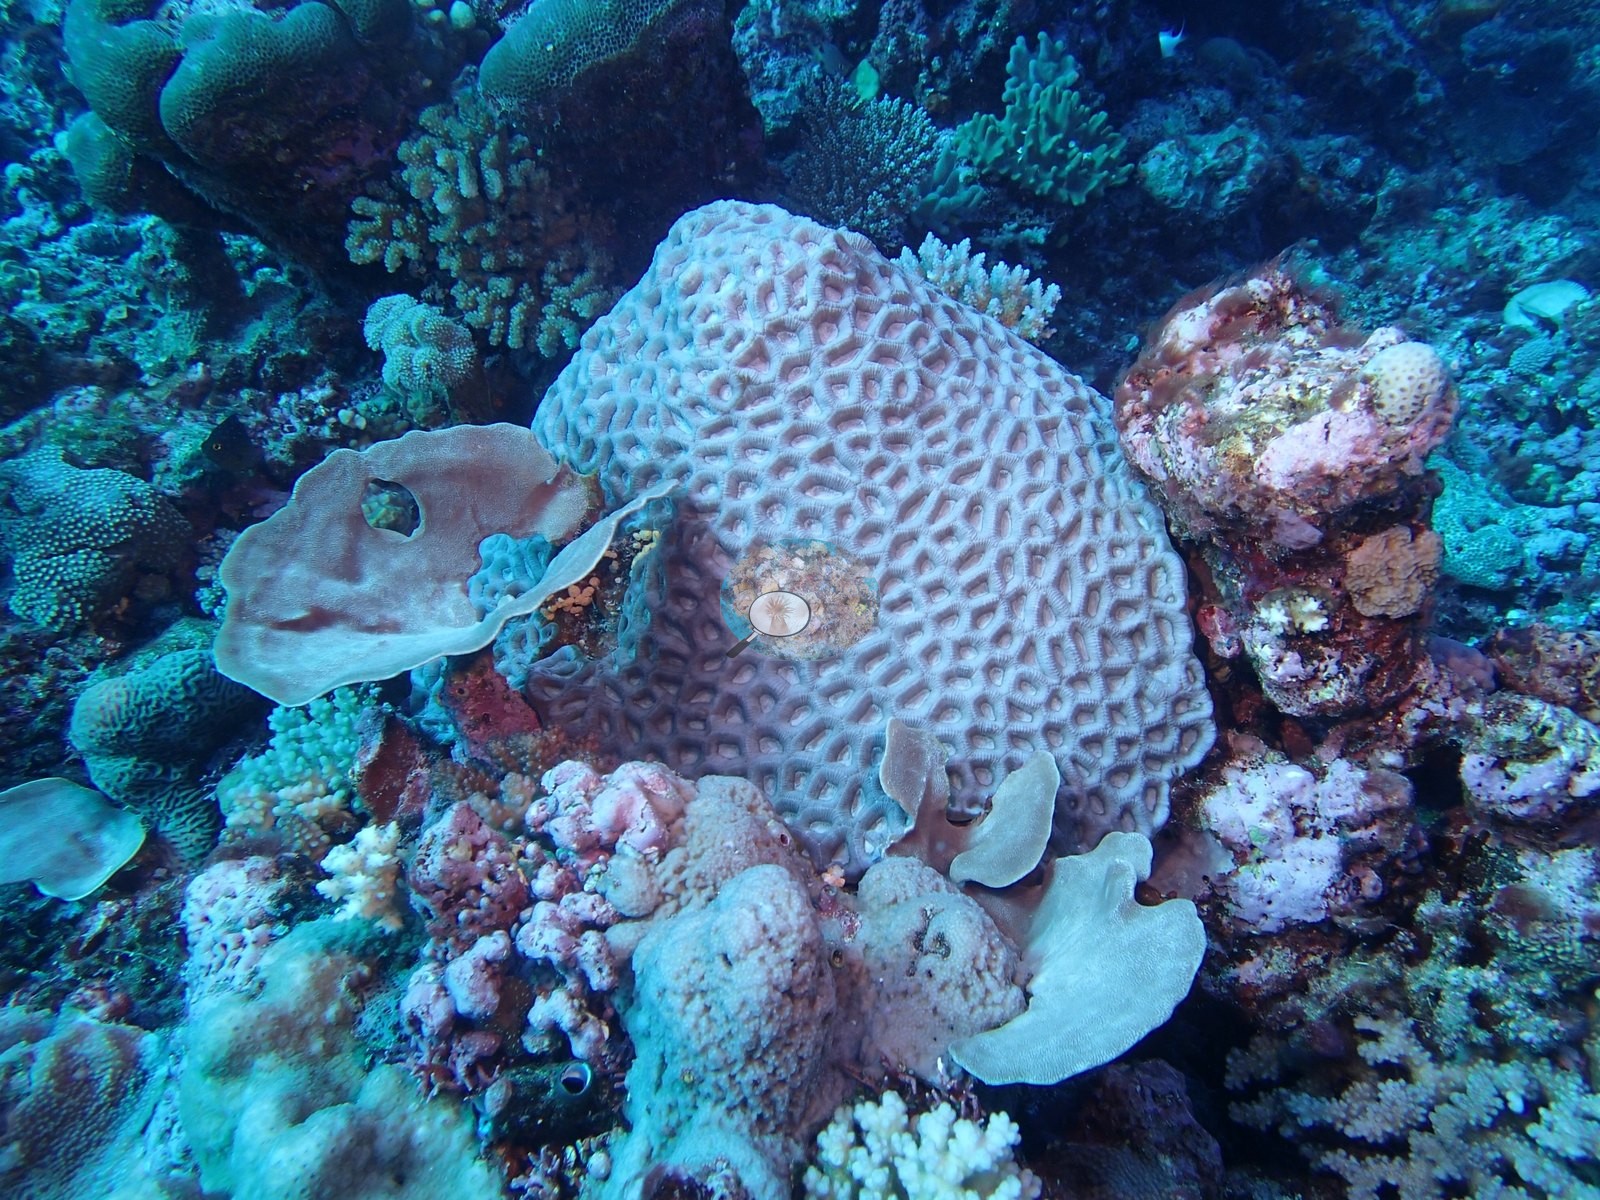
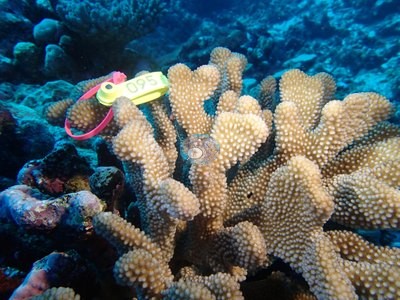
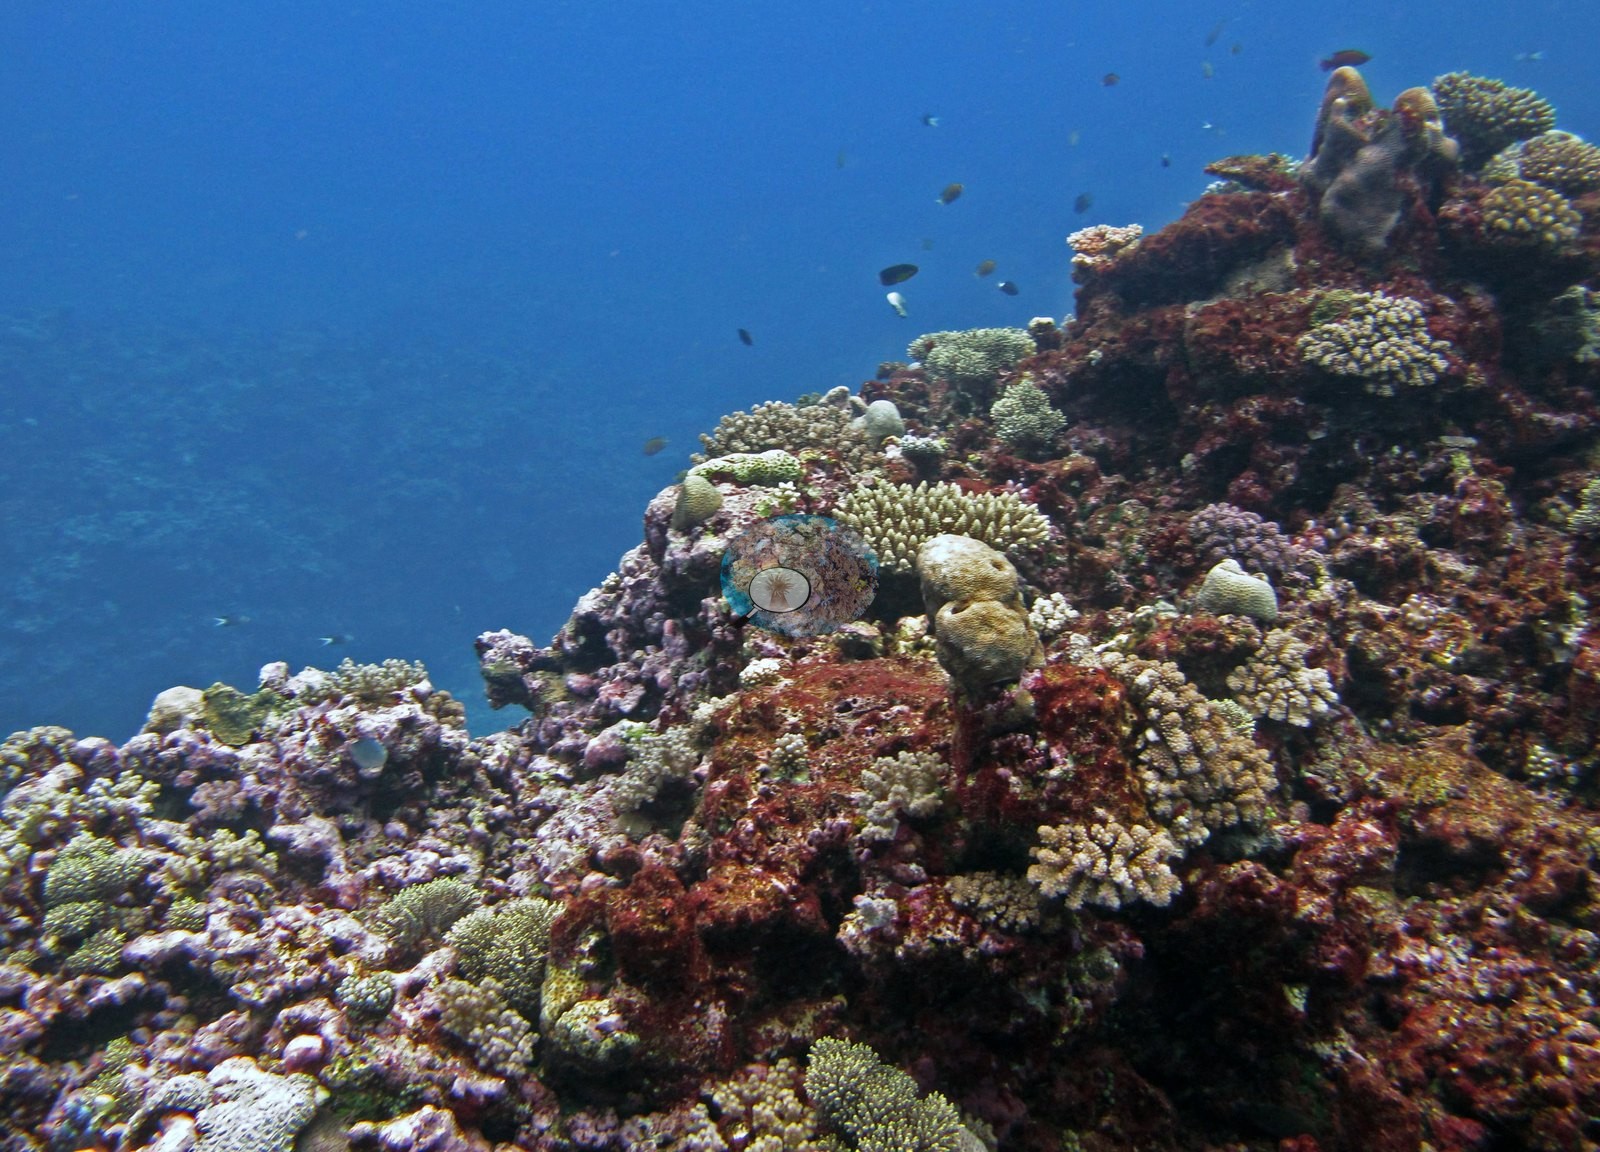
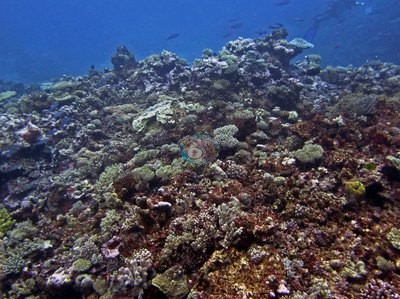
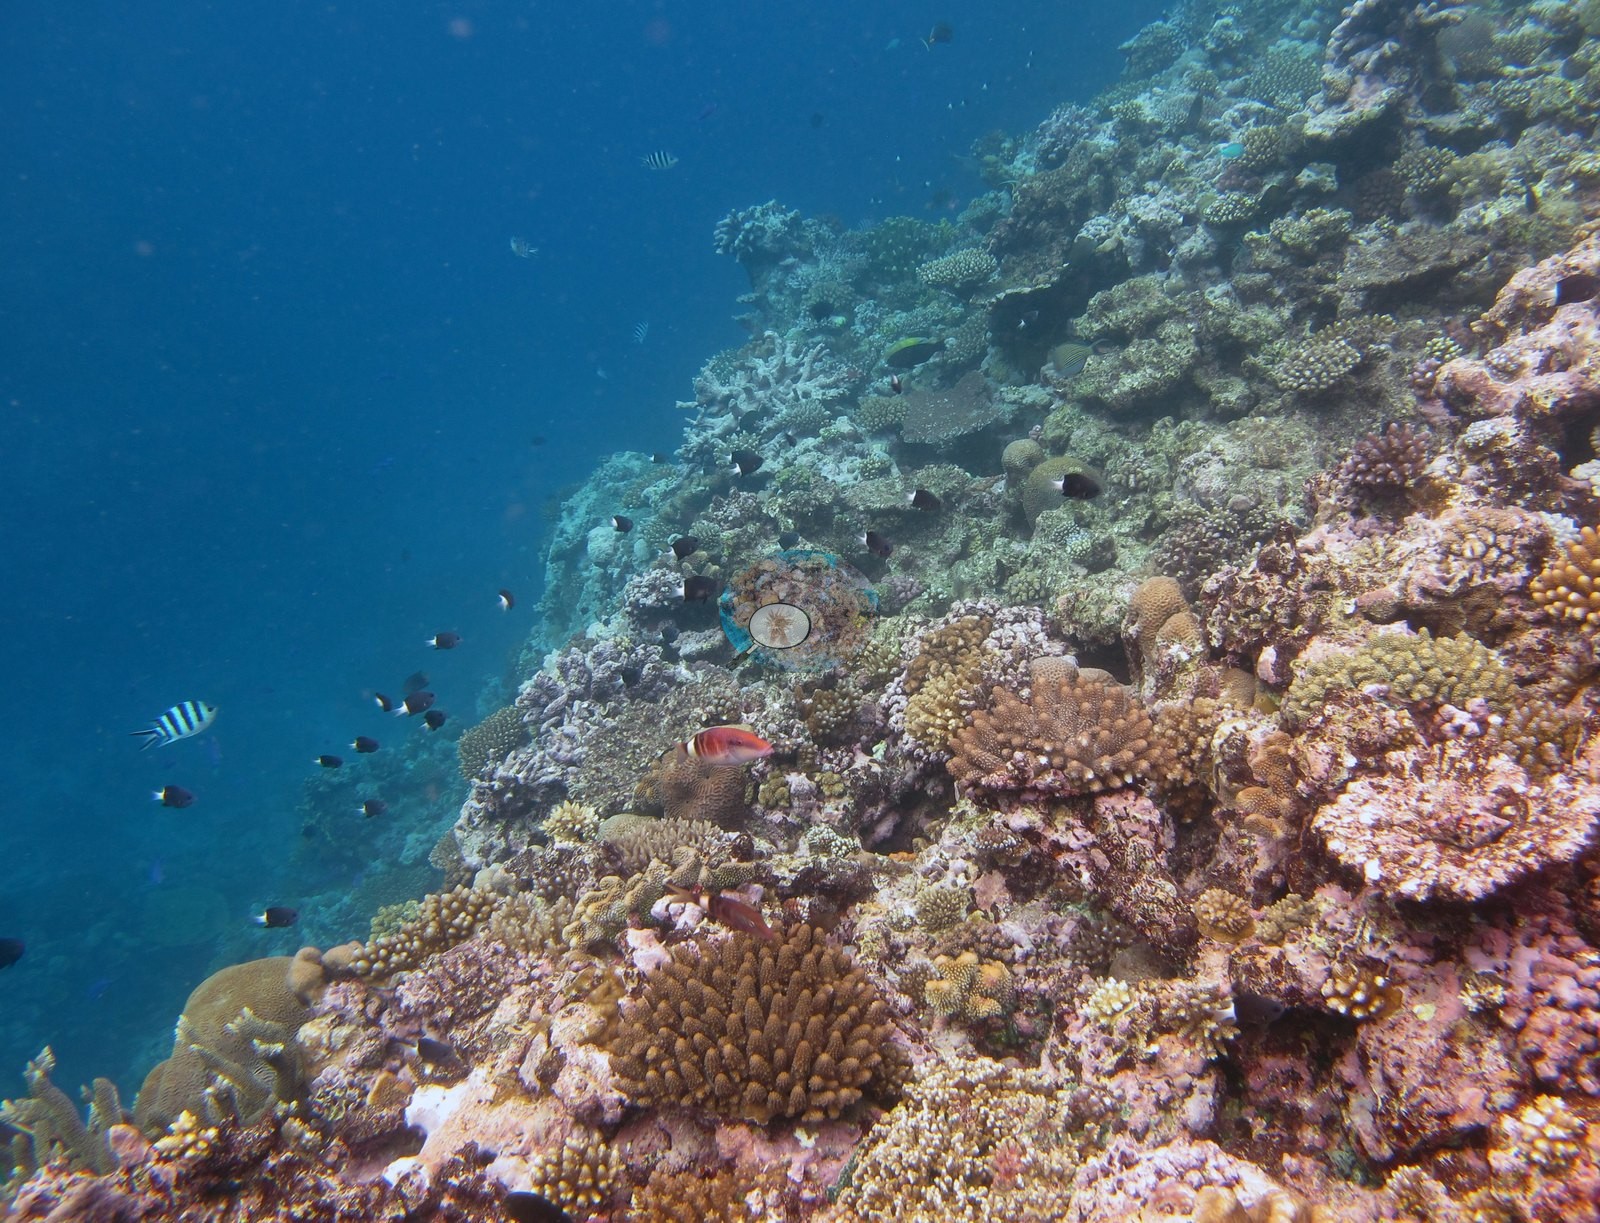
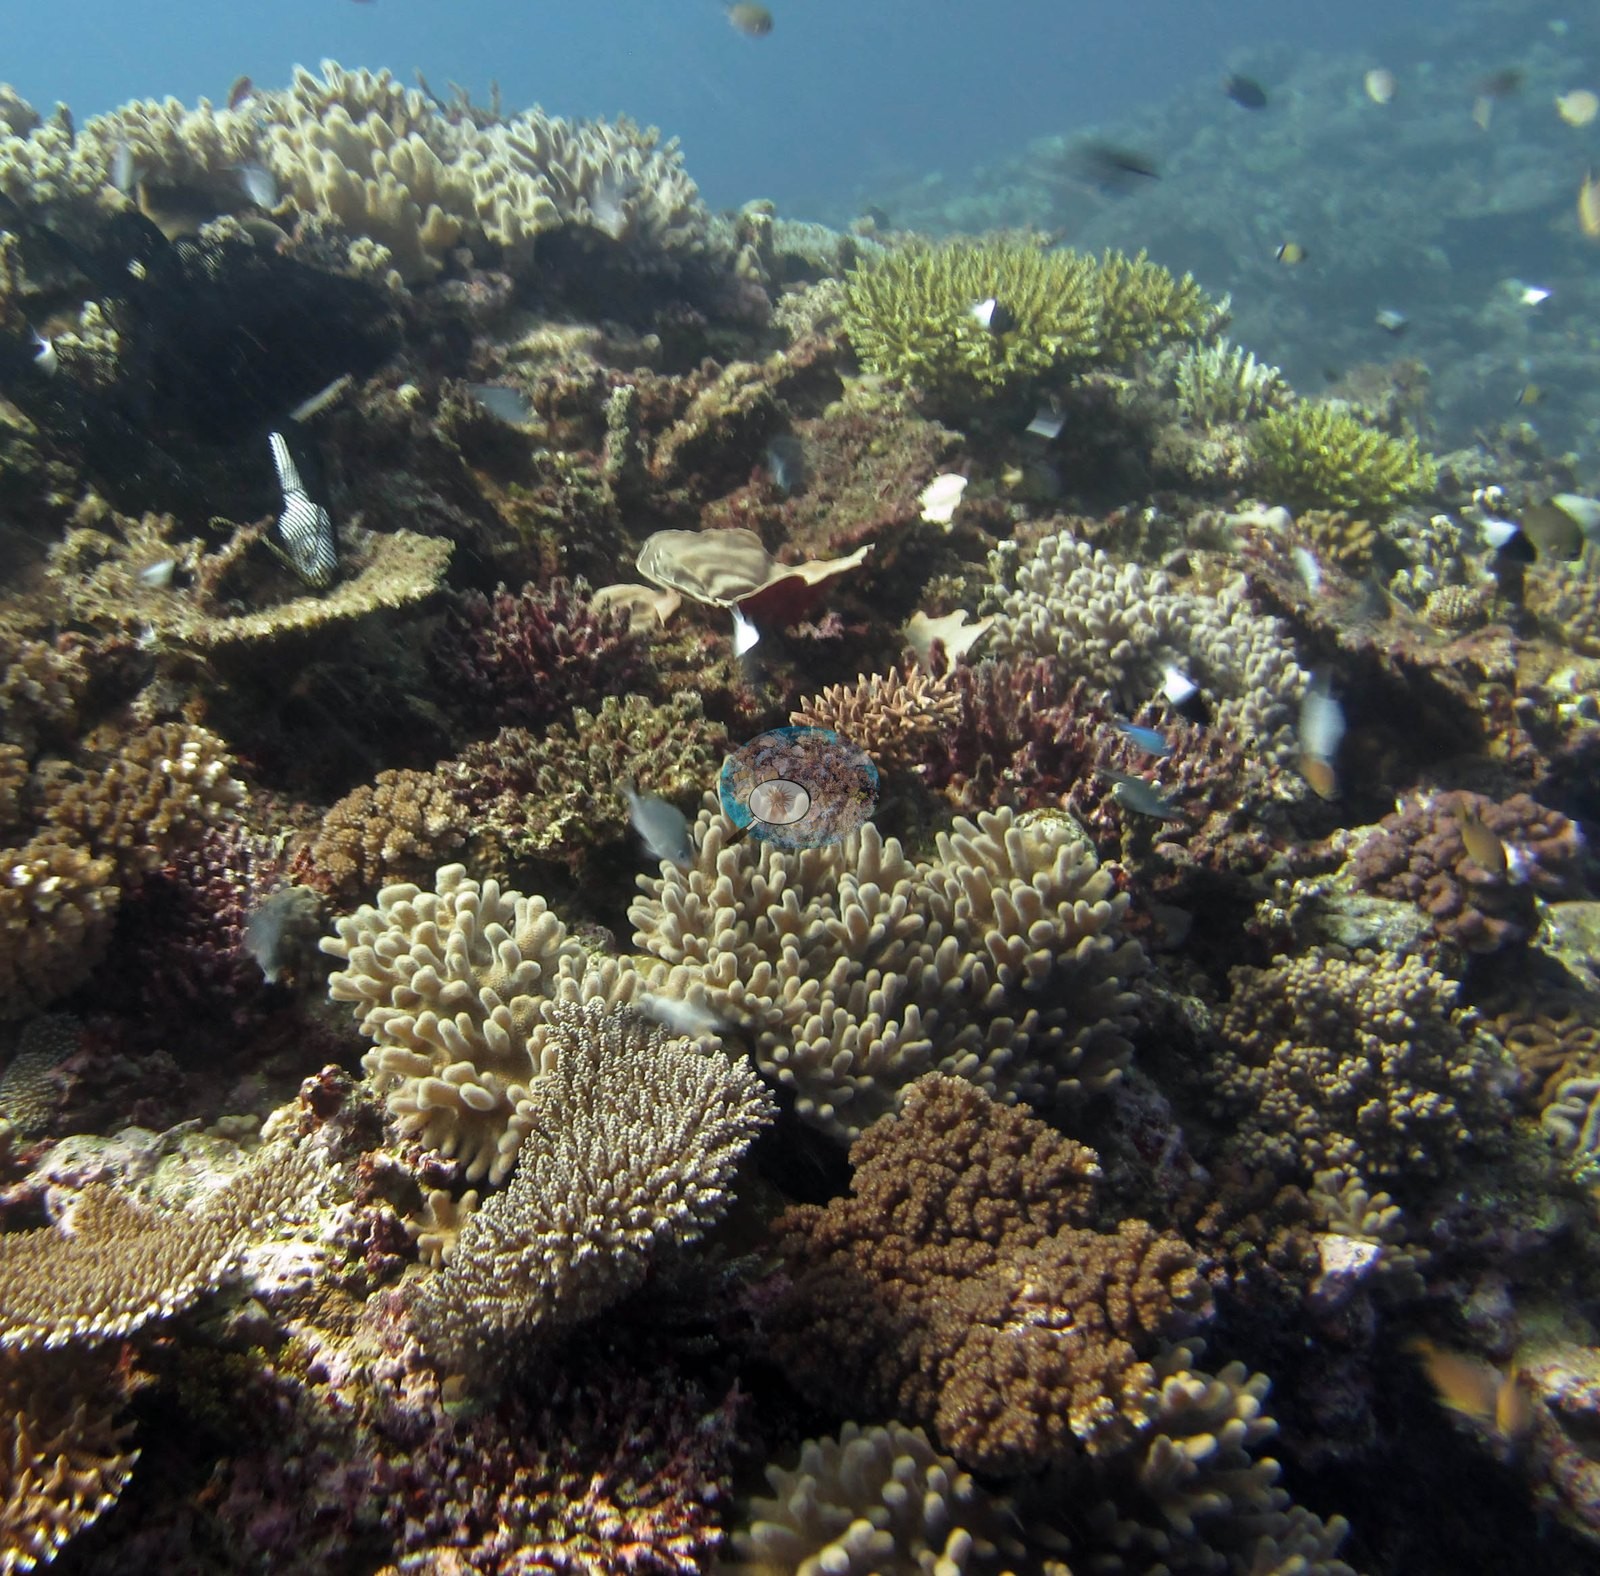
Coral cover ranged from 12% at FJTO06, a Totoya lagoon channel where algae sheets the old framework, to 51% on Moala's west-side fore reef (FJML19), where coral continues past 40 m. FJTO05 (46%) is a crest of large tables and continuous staghorn stands, and FJML18 held 40%. Moala's survey notes describe coral build-ups on massive framework, spaced 15-20 m apart and topped by branching acroporids, with Porites rus plates and staghorn down the slope. Totoya alternates between dense, diverse patches and broad coralline-crusted pavement; FJTO08 is a flat, low-relief terrace. Matuku ran from 26% (FJMT12) to 38% (FJMT10), in poor, silty visibility: plating Pachyseris and Echinopora at the base of the slope, and monospecific stands of Pavona clavus and Porites rus covering almost 20 m of substrate in the FJMT12 channel.
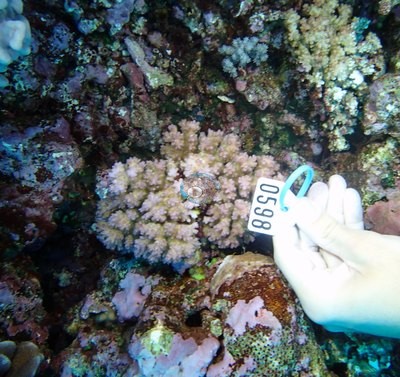
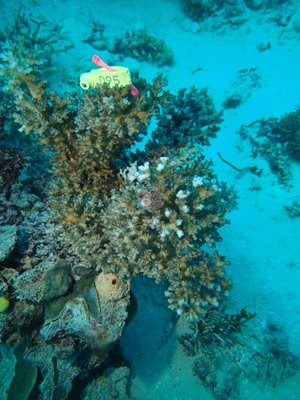
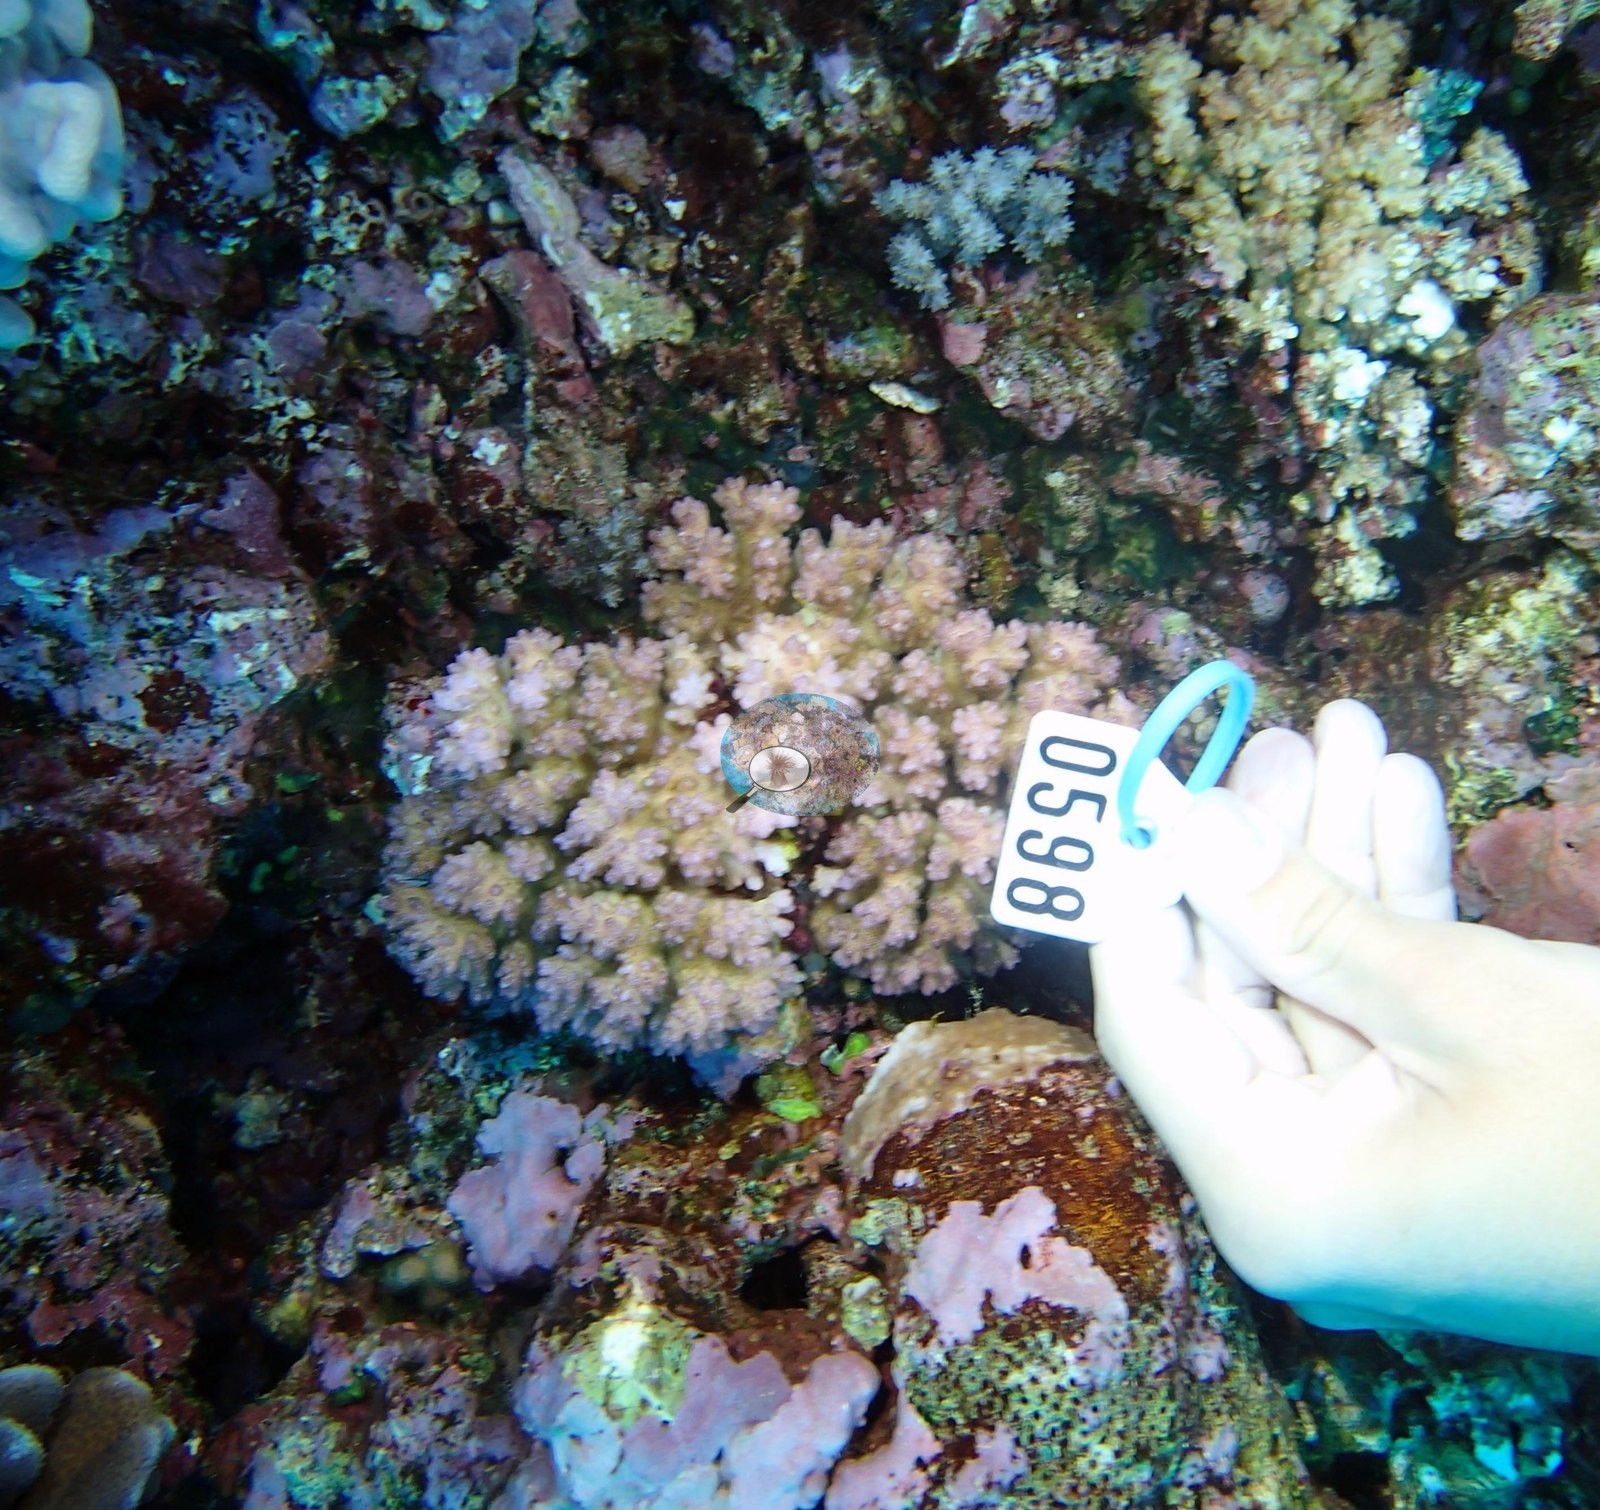
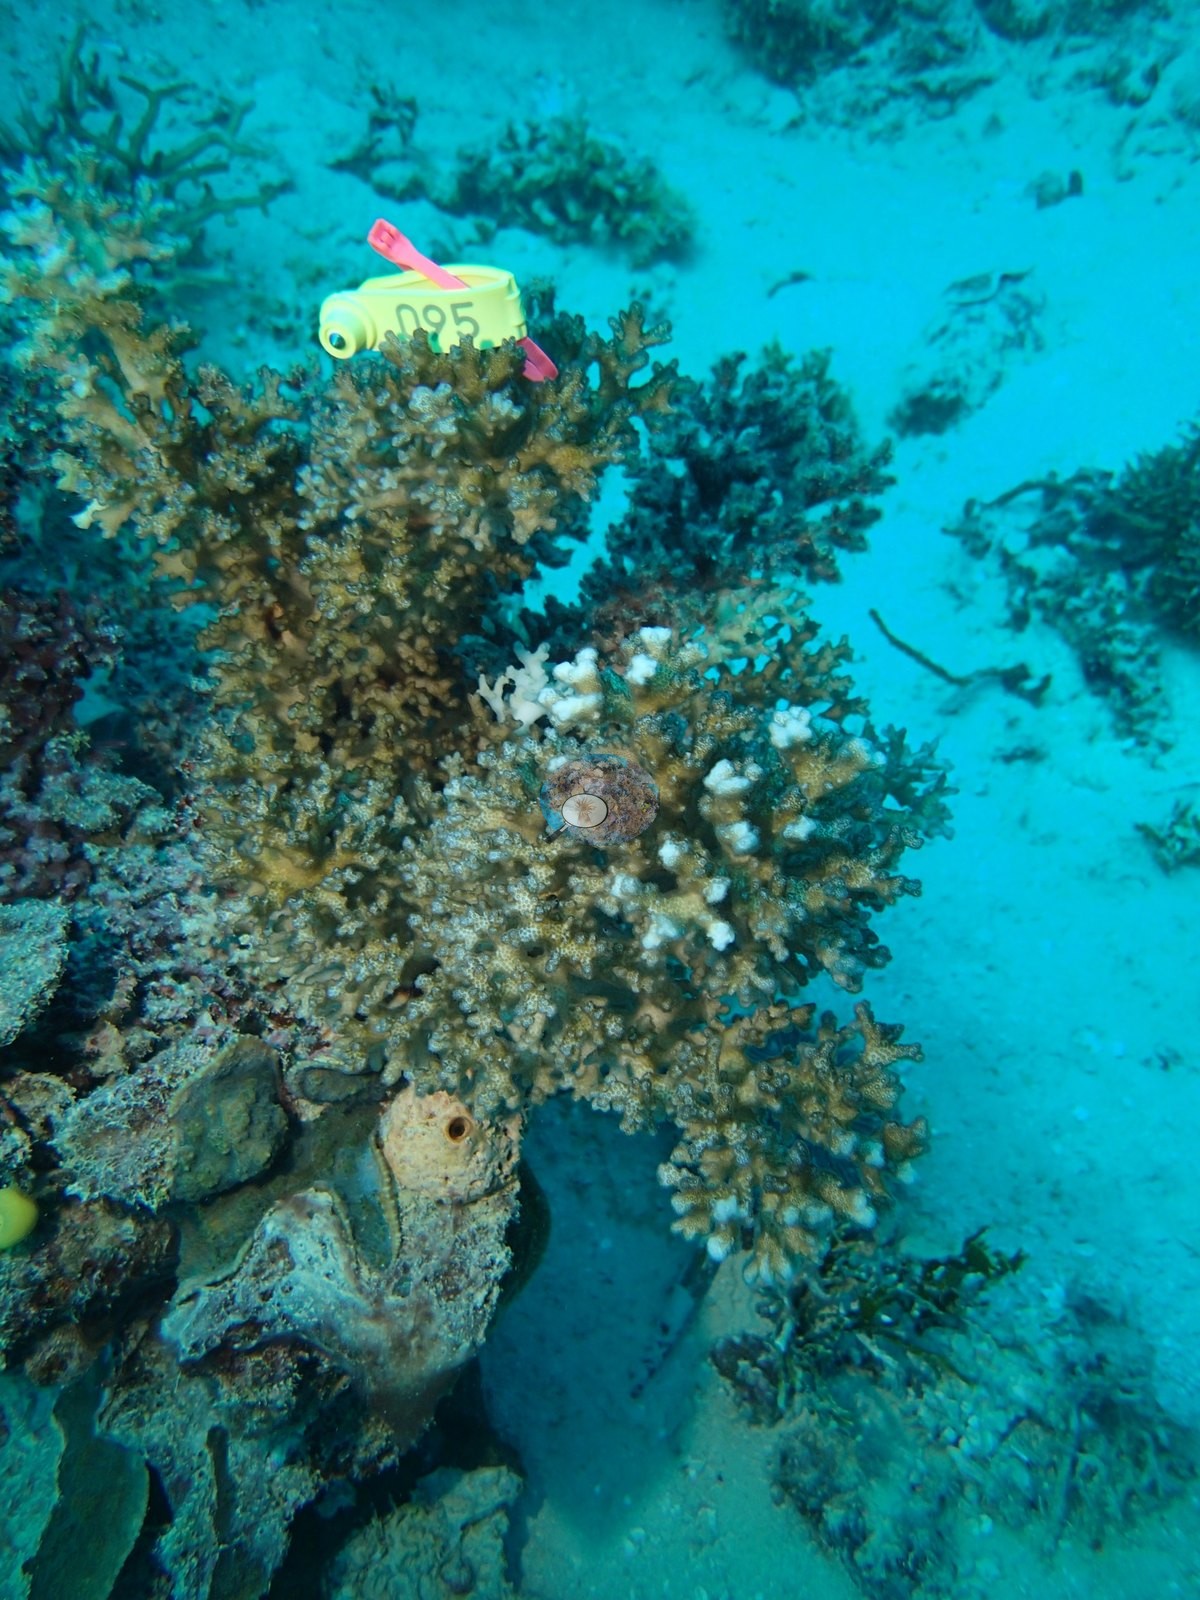
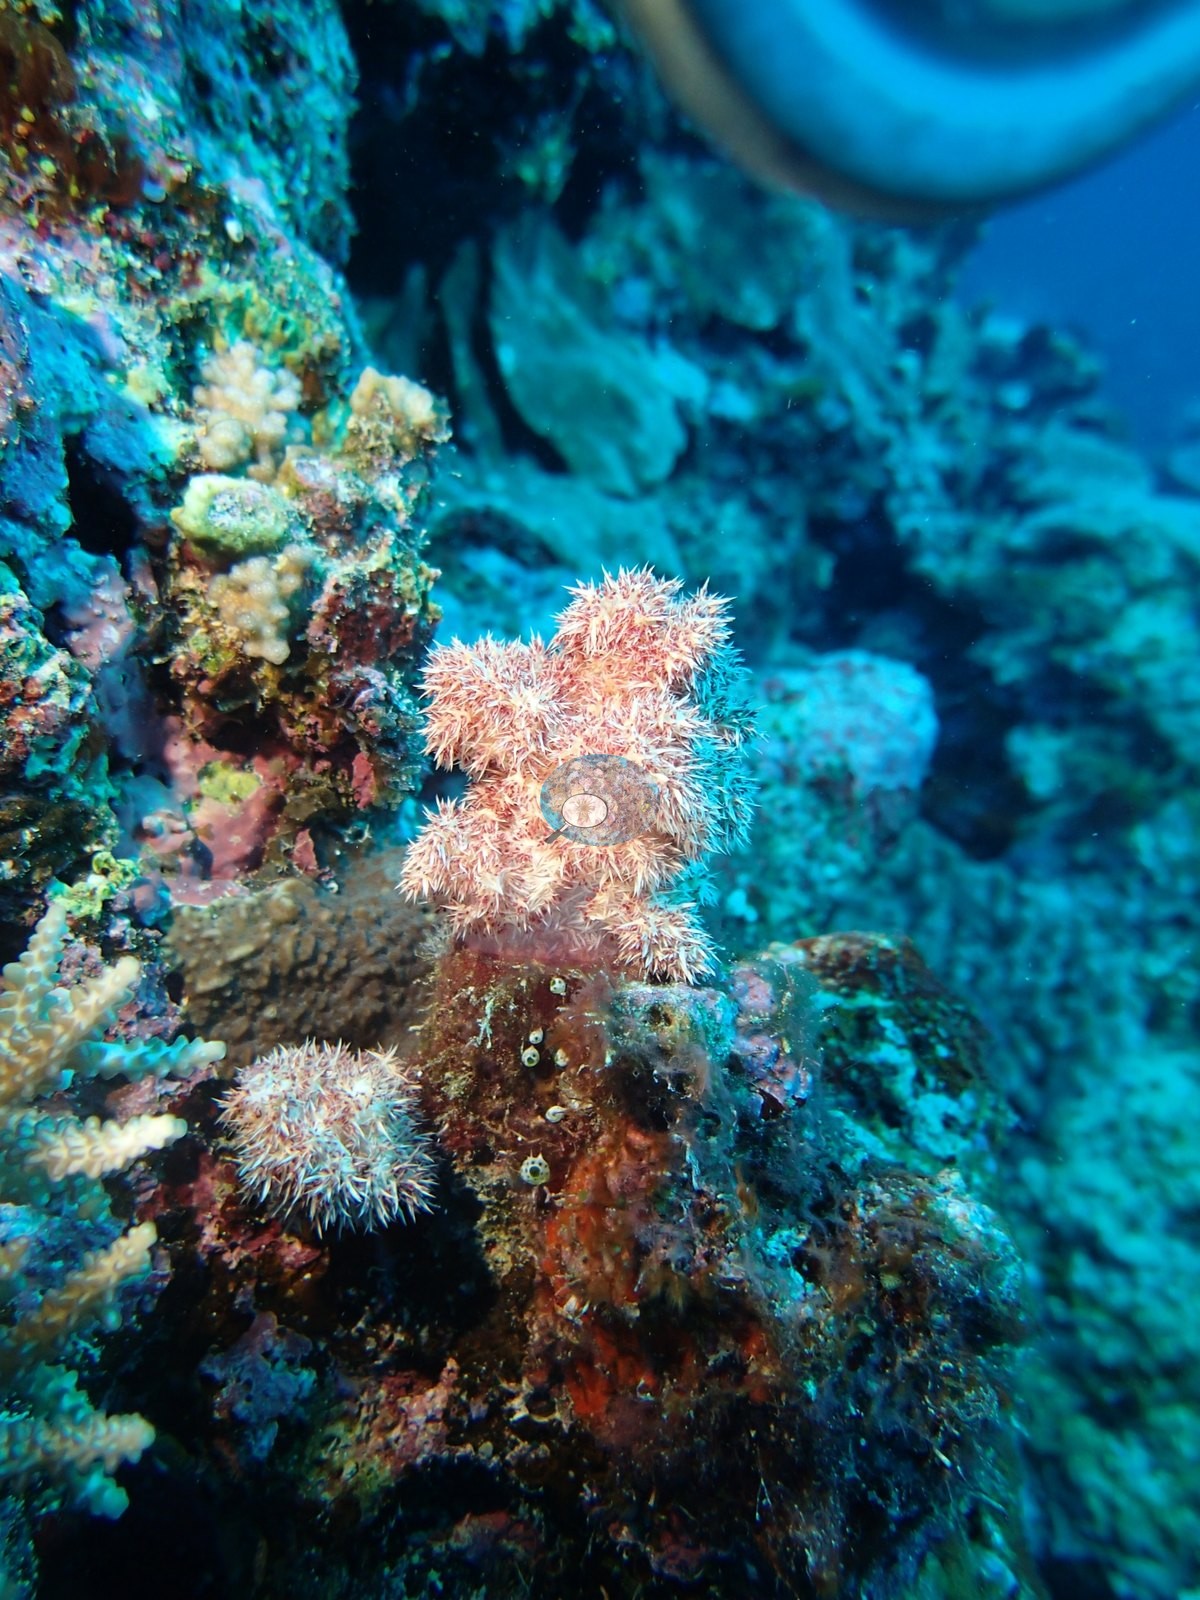
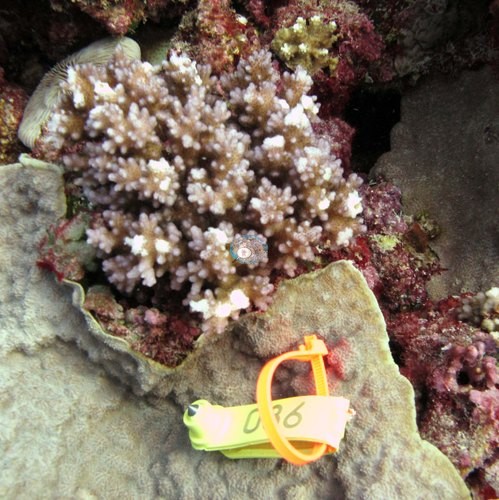
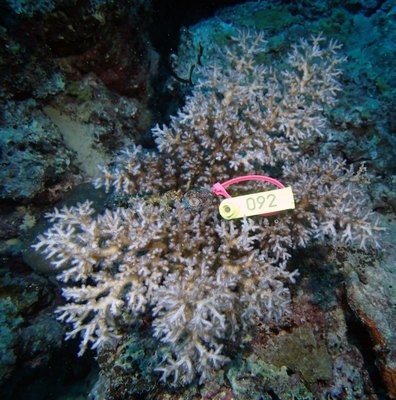
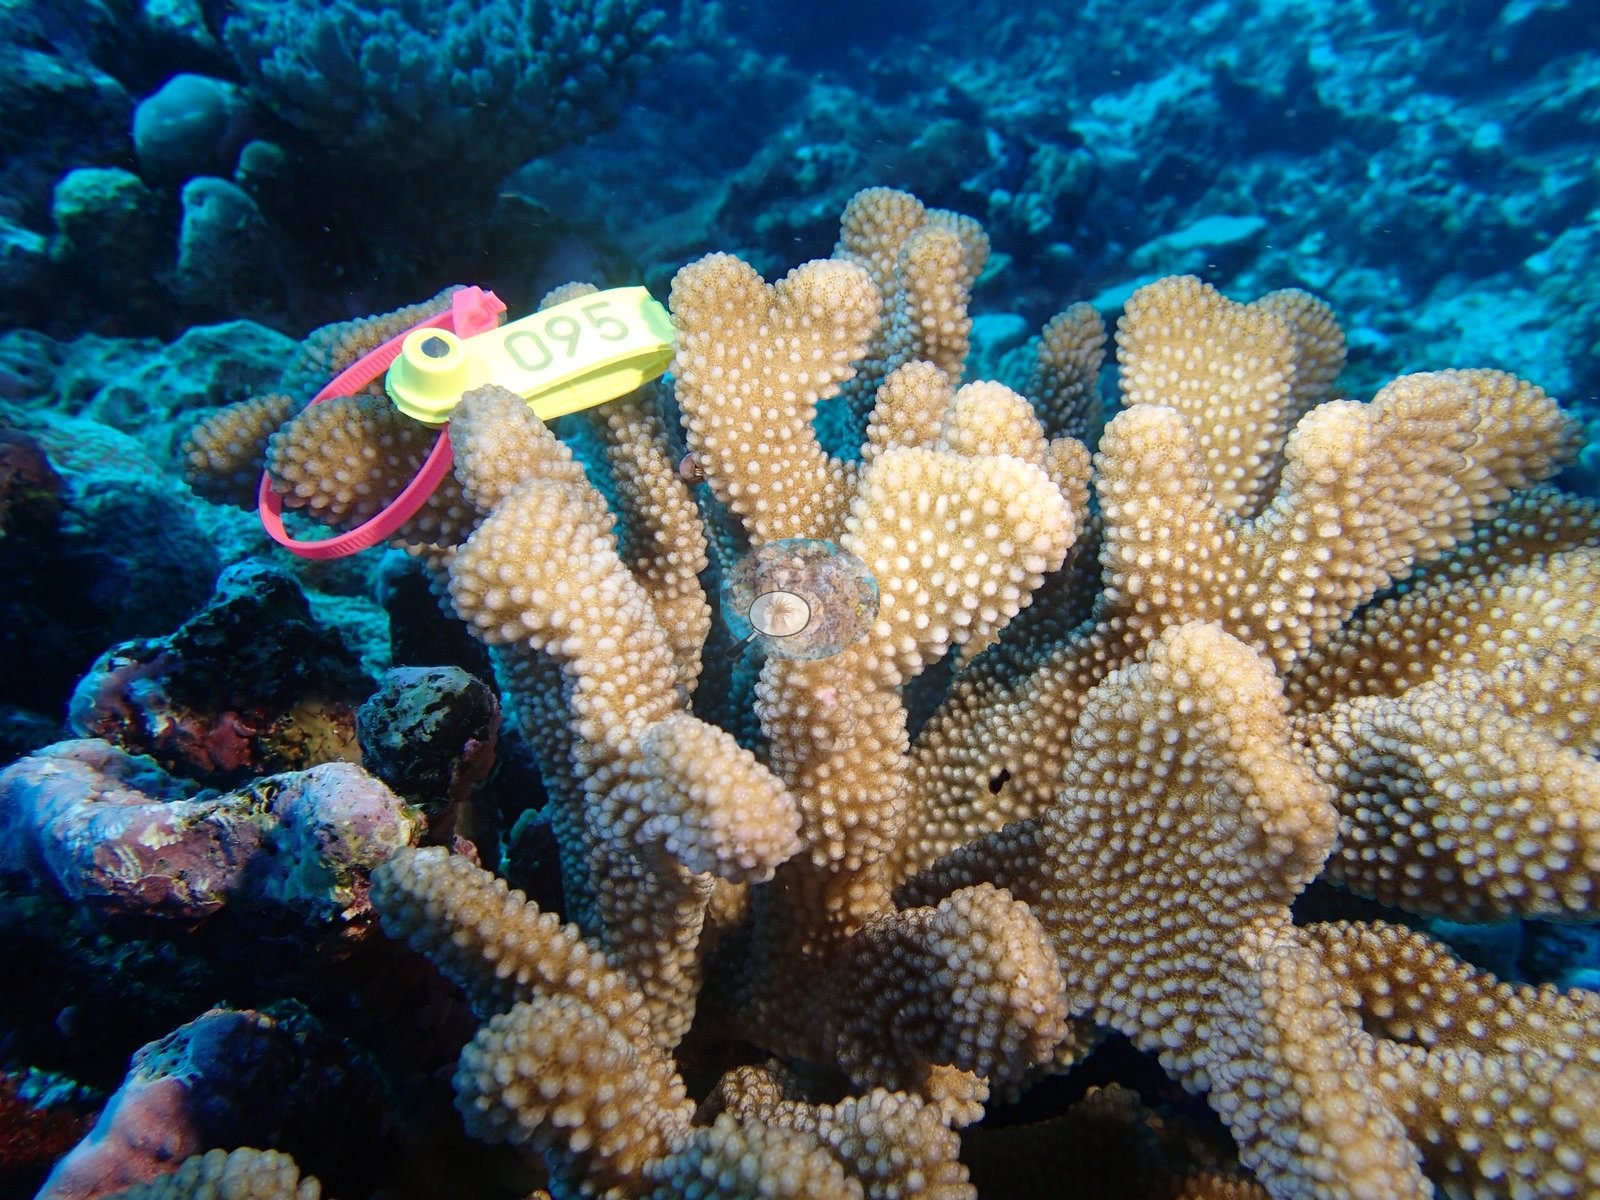
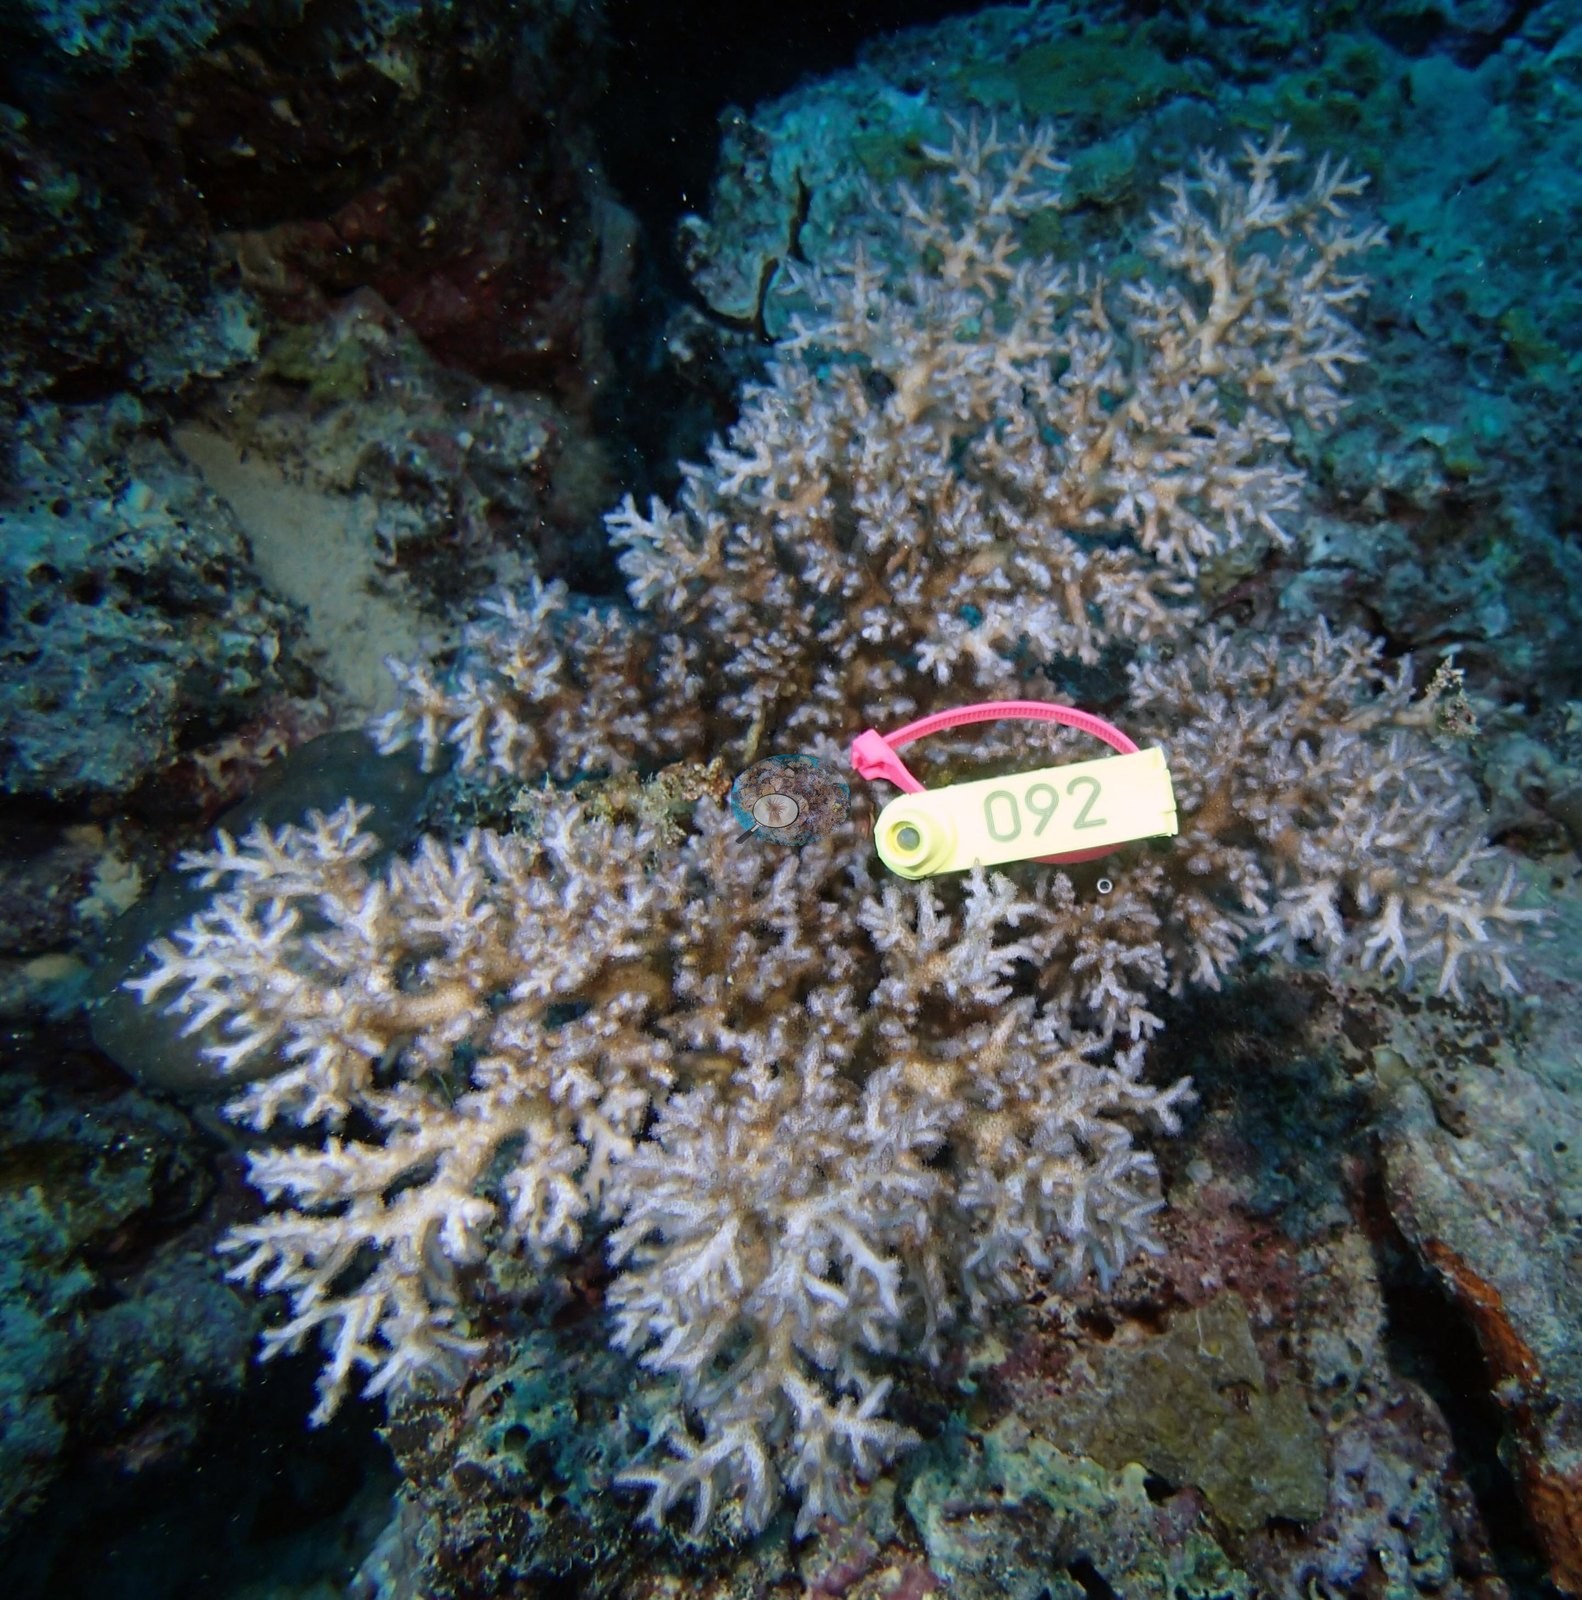
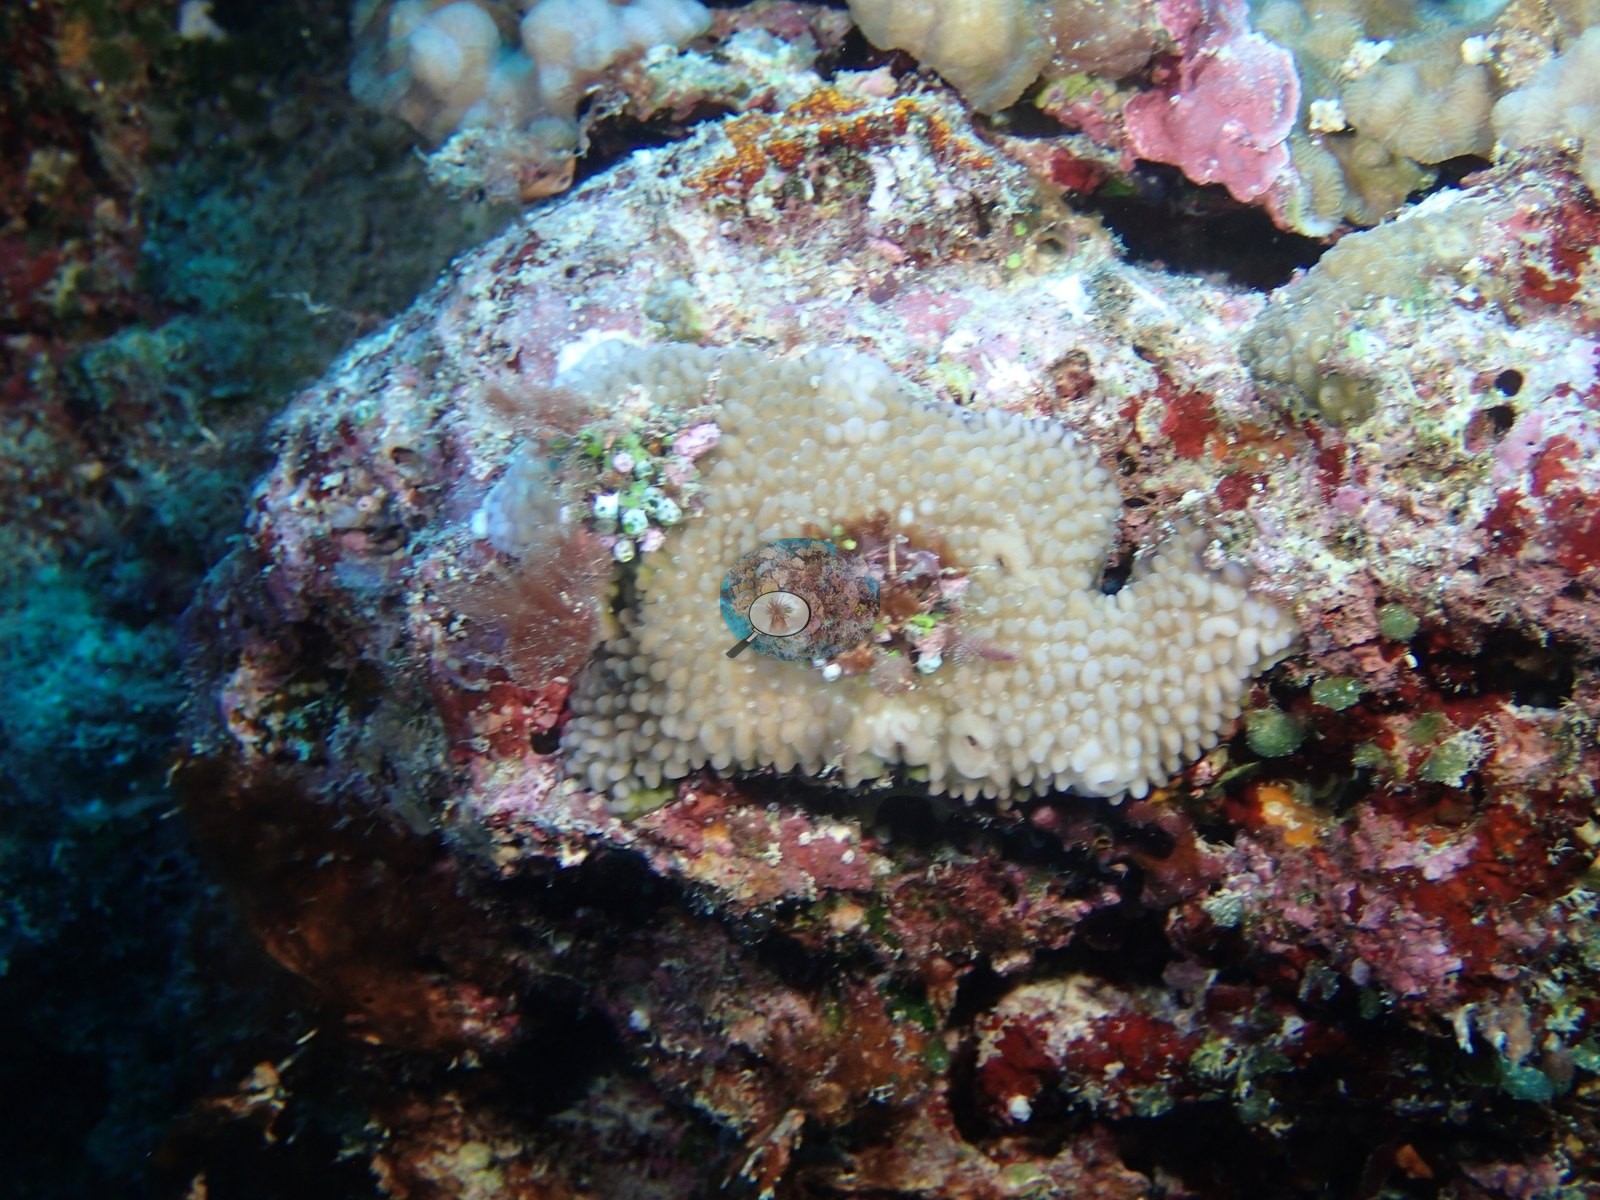
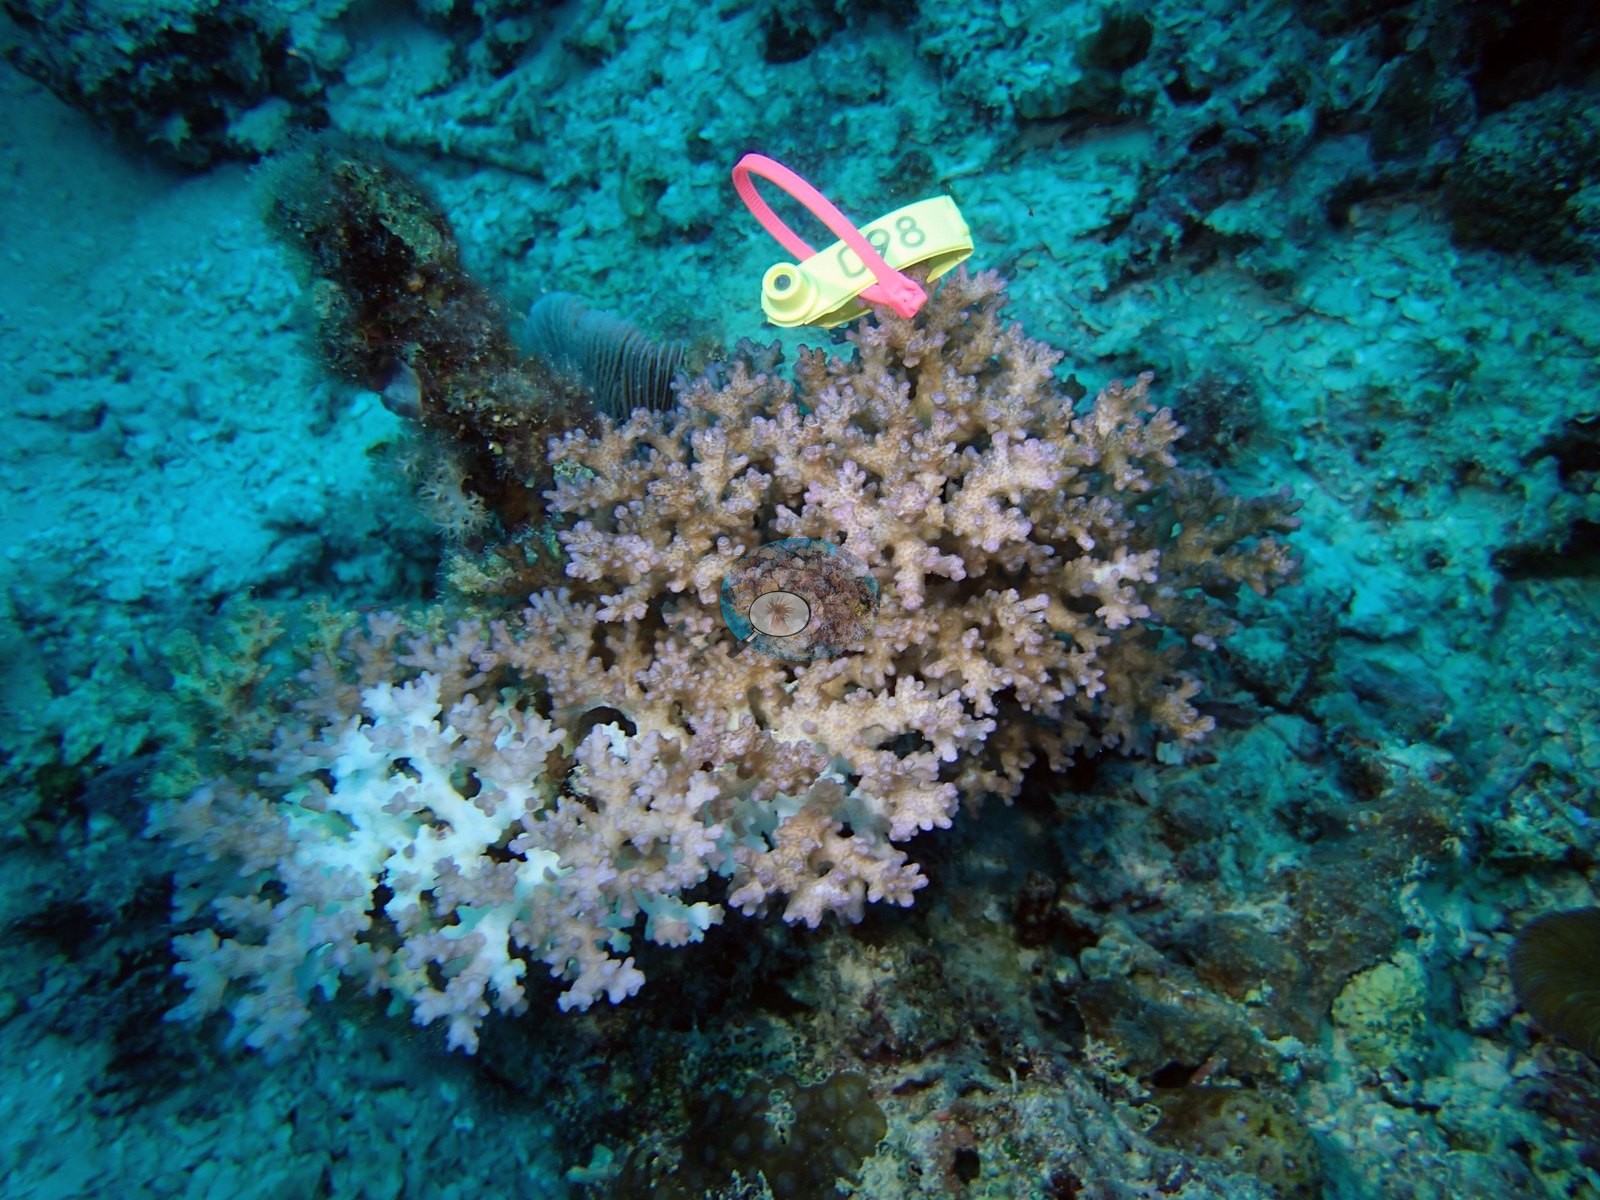
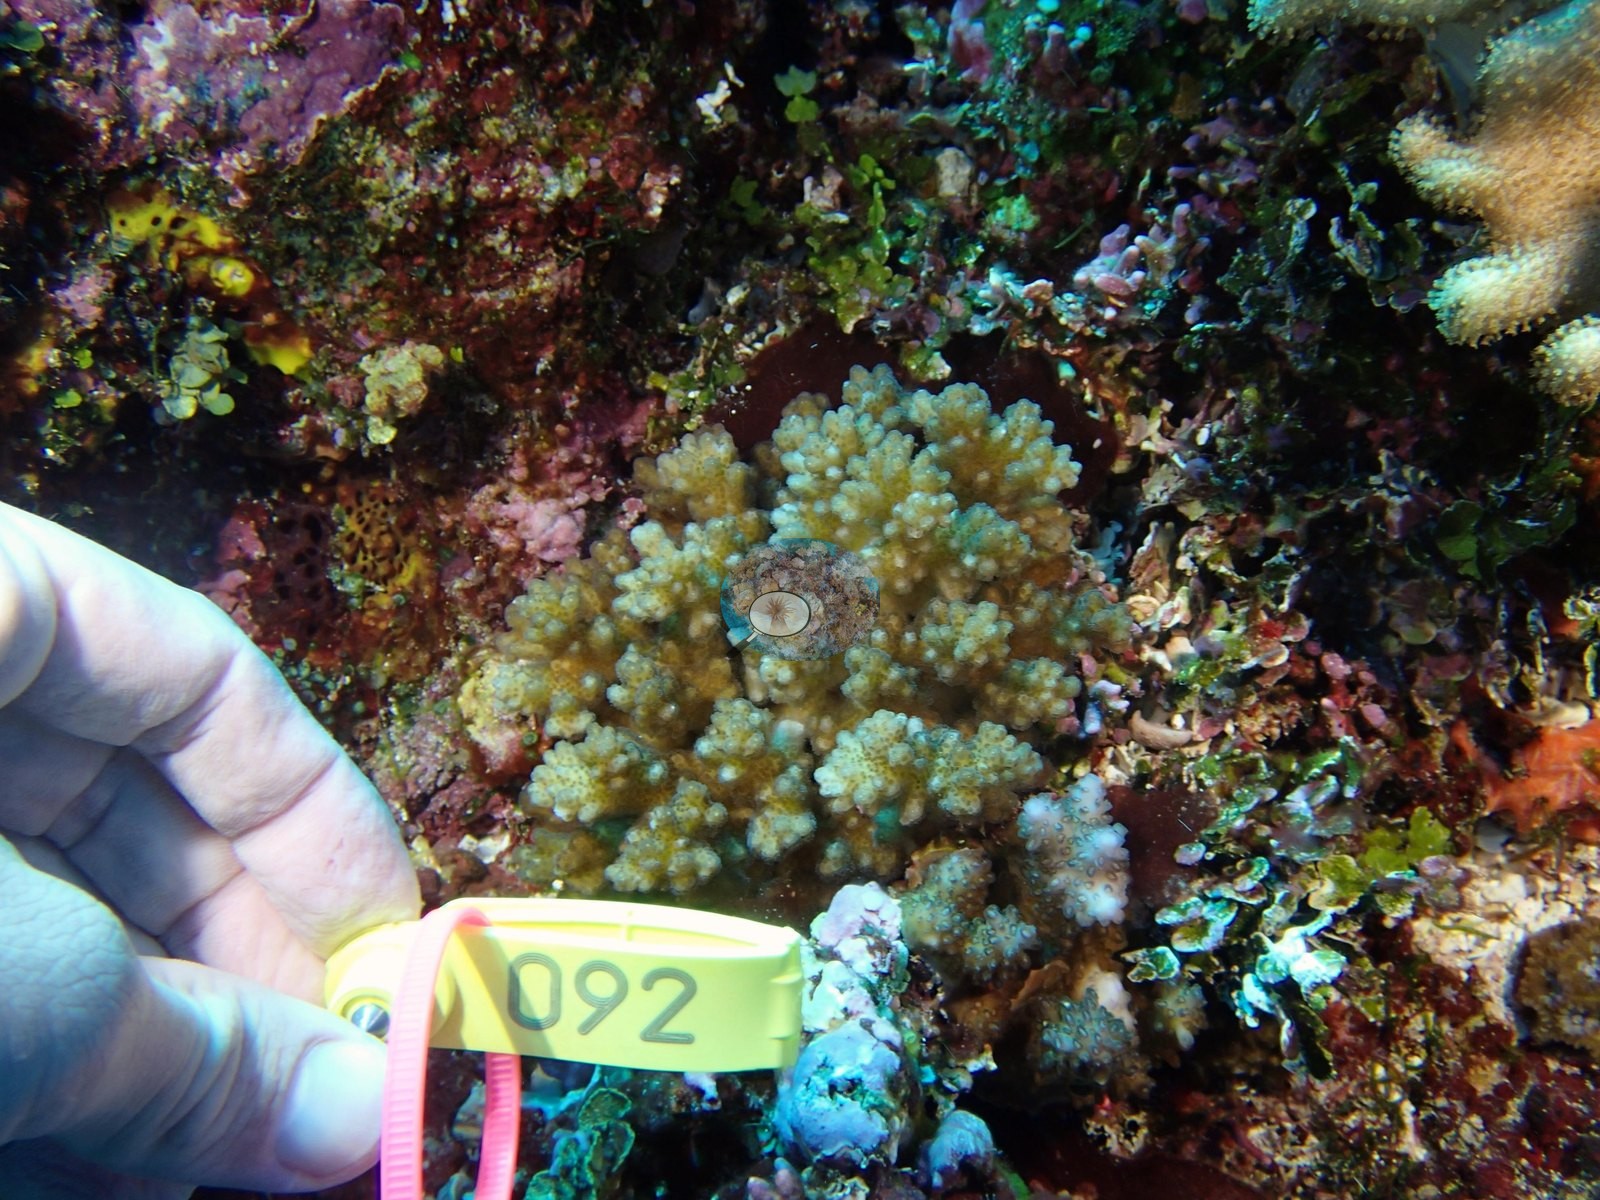
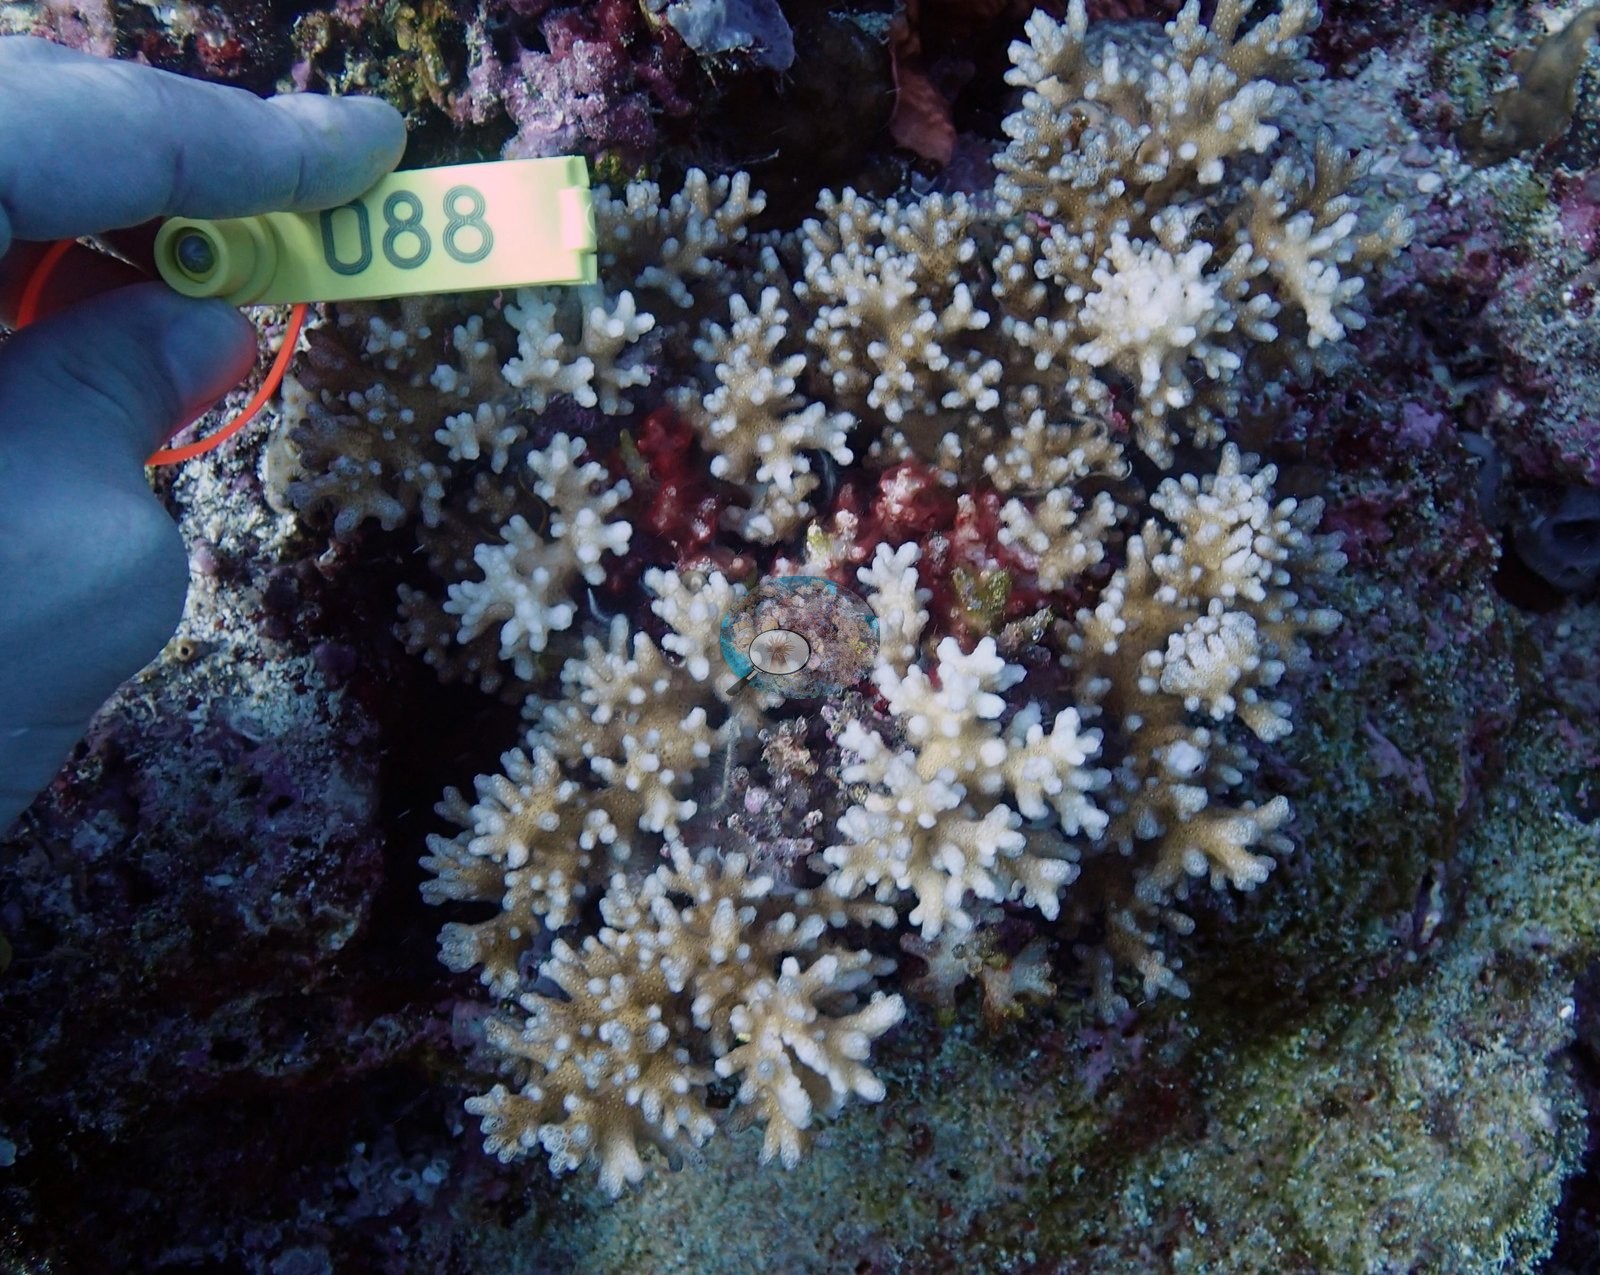
Pink crustose coralline algae is conspicuous throughout, and at FJMT14 it covers more visible surface than live coral. No station carries a Coral Health Index. Island-pooled physiological outlier scores were 4.50 at Moala, 4.44 at Matuku, and 3.89 at Totoya on a 0-5 scale (5 = no outliers; Mayfield et al. 2017, PLoS ONE); at Totoya, the one coral with an outlier score from each of FJTO05 and FJTO07 was flagged. The surveys recorded Drupella snails and recent mortality scars on acroporids at Matuku, table and plate corals scarred by cushion-star (Culcita) feeding at Moala's west-side stations FJML19 and FJML20, cyanobacteria over 13% of the transects at FJML15, one bleaching Pocillopora damicornis and a fully bleached tagged probe colony (tag 097) at FJML21, a small bleached colony at FJTO04, and a pale, partly bleached young colony in one FJMT13 frame; Anderson's sampling sheet also records partly bleached sampled colonies, including about 80% at FJMT13, about 50% at FJML16, and about 10% on three of five at FJML17. No crown-of-thorns seastars are recorded for this group.
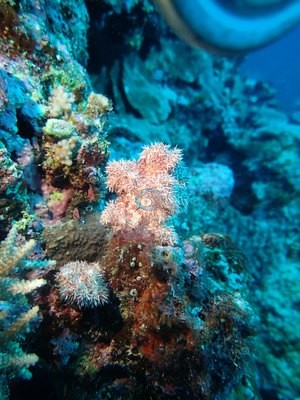
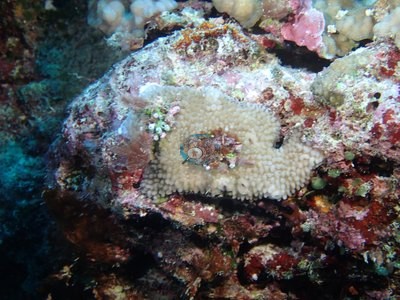
Sightings include a whitetip reef shark and a giant clam at FJTO04, a reef shark and a giant clam at FJTO09, a school of yellow-striped snapper over the FJTO05 staghorn, a giant clam in the shallows at FJML23, and a school of small blue-black fish streaming over the FJMT14 seamount.
Highlights
- Cover from 12% on an algae-sheeted Totoya slope (FJTO06) to 51% on Moala's west-side fore reef (FJML19).
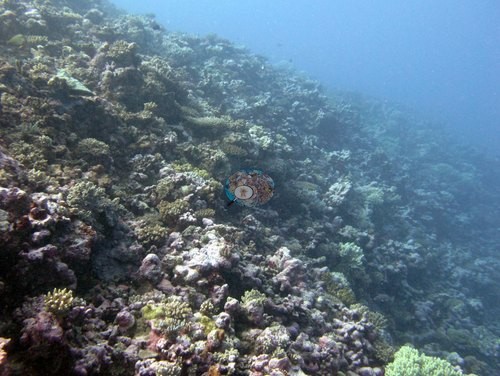
- A narrow coral canyon at Moala and an overhung cave passage at Totoya (FJML23, FJTO09).
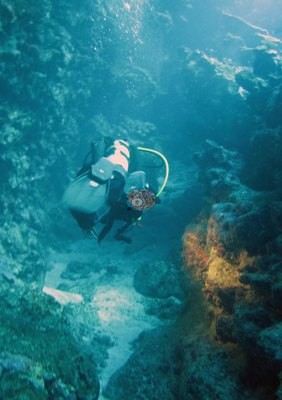
- Large Acropora tables and continuous staghorn on the Totoya crest, crossed by yellow-striped snapper (FJTO05).
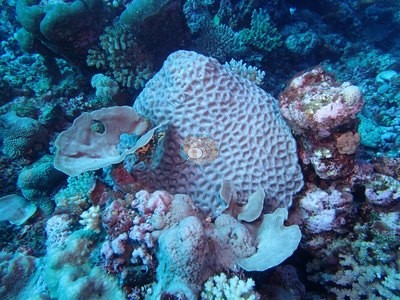
- A small seamount top off Matuku where pink coralline algae covers more surface than live coral (FJMT14).
- A lagoon pinnacle crowned by large Acropora tables under clouds of electric-blue damselfish (FJML21).
- A whitetip reef shark and a giant clam on a Totoya reef (FJTO04).
Oqo e dua na vakadewa vakamasini ni ivakamacala lekaleka ena vosa vakavalagi; na ivola ena vosa vakavalagi ga e dina ka rawa ni vakararavi kina. AI translation of this summary, low confidence and not yet reviewed by a native speaker; the English is authoritative.
Regional setting
Ko Spalding et al. (2001) era vakatikora na yanuyanu i Viti ena rua na yavu vakaveiyaqani ni vuravura e sega ni titobu, na Fiji Platform e na ra kei na Lau Ridge e na tokalau, ka ra vakatikora tani na yatu Moala mai na Yasayasa vaka-Lau. E tiko na yatu Moala ena nodra ivakamacala ni Koro Sea, na wasawasa e vakaviribaitaki tu ena maliwa ni Yasayasa vaka-Lau kei Viti Levu, ka vica ga na yanuyanu e veitawasei tu kina. E ceva ni yatu Lomaiviti, e levu kina na yanuyanu vulikano, e vakamacalataka na ivola (atlas) ni yatu Moala e tolu na yanuyanu vulikano cecere e vakavolivolitaki vakalevu ena cakau e taba ni vanua (fringing reefs), e duatani mai na yatu vaka-Lau e na tokalau, e levu kina na yanuyanu ni vatu ni cakau (carbonate), na atoll kei na vanua e voleka ni atoll. Me baleta na Viti taucoko, e vakatau ko Spalding et al. (2001) ni rauta ni 10,020 km² na cakau, ka ra lisitaka e rauta ni 298 na mataqali lase dina (scleractinian) e volai, ka ra vakasamataka ni baleta ni tiko o Viti e voleka ni loma ni duidui ni bula ni Indo-Pacific kei na nona levu na mataqali cakau. Era kaya tale ga ni levu na vakadidike e cakava voleka ga i Suva kei na Great Astrolabe Reef, ka se sega ni kilai vinaka e levu na cakau i Viti. Ena 2001, na leqa levu vou duadua era volaa e dua na katakata ni wasawasa ena itekitekivu ni 2000 ka vulavula kina na 50–100% ni lase ena vanua levu ka yacova na 30 m, ka mate e levu na lase ni oti oya, vakalevu ena baravi i ceva i Viti Levu kei Vanua Levu.
E sega ni dua na ivola e vakamacalataka na yatu Moala ni oti na 2000; na ivakarau vou e vakayasana ga. Ko Wilkinson (2006), ena nona vakalekalekataka na vakadidike ni Southwest Pacific ena 2004 ka okati kina o Viti, a raica ni levu na cakau ni yasana e se tiko vinaka ga ni oti na vulavula ni lase e veivanua ena 2000–2002, ia e sega ni tautauvata na kena vakabulai. Ena nona ivakamacala, na cagilaba kei na cakacaka ni tamata era leqa levu duadua, ka volai tale ga na bula ni ika (crown-of-thorns starfish) kei na mate ni lase, ka na vakayagataki vakasivia kei na dukadukali e vakalevu e voleka ni koro kei na wai e loma ni cakau. E volaa ko Souter et al. (2021) ni a tubu na ubi ni lase ena yasana Fiji Islands mai na 2002 ki na 2008. Me baleta na Pasifika taucoko, era vakaraitaka ni lutu na ubi ni lase e rauta ni 37% ni bera na 1998 ki na 31% ena 2019, ka vu levu ni oqo na vulavula ni lase, ka mate e levu na lase ena ituvaki ni El Niño ena 2015 kei na 2016.
Overview
E tiko ena tikina oqo e 23 na vanua ni vakadidike ni botoni ni cakau (benthic stations) ni Global Reef Expedition ena yatu Moala ena Yasana o Lau, e Totoya, Matuku kei Moala, kei na dua na ivakatakilakila ni yanuyanu ko Totoya, e 24 kece na lewena. A vakadidiketaki o Totoya ena 3-5 Jiune 2013, na imatai ni vanua i Viti ni ilakolako, o Matuku ena 6-7 Jiune, ka o Moala ena 8-10 Jiune. Na titobu levu duadua ni nuku e tekivu mai na 12.5 m e FJML17 ki na 30.8 m e FJML23, ka levu na vanua ni vakadidike ena ituvatuvu ni cakau i tuba (fore-reef terraces), na ivakarau spur-and-groove kei na taba e titobu vakasauri. E tiko tale ga ena yatu oqo eso na vanua duatani: e dua na ulu ni cakau ena wai e loma ni cakau (lagoon pinnacle) e ubia na teveli Acropora lelevu e FJML21, e dua na tobu lase (canyon) e rabailailai e FJML23, e dua na ulu ni delana lailai e wasawasa (seamount) e matai Matuku e FJMT14, kei na spurs, bati tu cake (walls) kei na sala ni qara e ubia e FJTO09.
Na ubi ni lase e tekivu mai na 12% e FJTO06, e dua na sala ni wai ena loma ni cakau e Totoya e ubia kina na lumi na yavu makawa, ki na 51% ena cakau i tuba e na ra i Moala (FJML19), ka toso tiko kina na lase ka sivia na 40 m. Ko FJTO05 (46%) e dua na dela ni cakau e tiko kina na teveli lelevu kei na staghorn e veitaravi, ka o FJML18 e 40%. E vakamacalataka na ivola ni vakadidike i Moala na ulu ni lase e tara ena yavu levu (massive framework), e 15-20 m na kena veiyawaki ka ubi ena acroporids vakataba, kei na lase bebeka Porites rus kei na staghorn e sobu ena taba. O Totoya e veisau tiko ena maliwa ni tiki e vavaku ka duidui na lase kei na botoni rabailevu e ubia na coralline; o FJTO08 e dua na ituvatuvu e bibi ka sega ni cecere. Na ubi ni lase e Matuku e tekivu mai na 26% (FJMT12) ki na 38% (FJMT10), ena wai e sega ni matata ka dukadukali: na lase bebeka Pachyseris kei Echinopora e ruku ni taba, kei na veikoro lase ni dua ga na mataqali Pavona clavus kei Porites rus e ubia e voleka ni 20 m ni botoni ena sala ni wai e FJMT12.
E rawa ni raici vakalevu na lumi damudamu ni coralline (crustose coralline algae), ka e FJMT14 e levu cake na kena ubia na botoni mai na lase bula. E sega ni dua na vanua ni vakadidike e tiko kina na Coral Health Index. Na naba ni duidui vakayago (physiological outlier scores) ni yanuyanu taucoko e 4.50 e Moala, 4.44 e Matuku kei na 3.89 e Totoya ena ivakatagedegede 0-5 (5 = sega ni duidui; Mayfield et al. 2017, PLoS ONE); e Totoya, a vakatakilakilataki na dua ga na lase e tiko na nona naba ni duidui (outlier score) mai FJTO05 kei na dua mai FJTO07. A volaa na vakadidike na qari Drupella kei na mate vou ni acroporids e Matuku, na teveli kei na lase bebeka e kania na ika lomalagi (cushion star, Culcita) ena vanua ni vakadidike e na ra i Moala FJML19 kei FJML20, na cyanobacteria ka ubia na 13% ni transects e FJML15, e dua na Pocillopora damicornis e vulavula tiko kei na dua na lase ni vakadidike e vakatakilakilataki (tag 097) e vulavula taucoko e FJML21, e dua na lase lailai e vulavula e FJTO04, kei na dua na lase gone e vulavula vakalailai ka vulavula vakaiwasewase ena dua na itaba e FJMT13; e volai tale ga ena ivola ni sampling i Anderson na lase a tauri ka vulavula vakaiwasewase, okati kina e rauta ni 80% e FJMT13, e rauta ni 50% e FJML16, kei na rauta ni 10% ena tolu vei lima e FJML17. E sega ni volai e dua na crown-of-thorns ena yatu oqo.
Na veika e raici e okati kina na dua na qio batidua vulavula (whitetip reef shark) kei na dua na vasua e FJTO04, dua na qio ni cakau kei na dua na vasua e FJTO09, e dua na ilawalawa ni ika dravudravua vakatoka (yellow-striped snapper) e cake ni staghorn e FJTO05, dua na vasua ena wai mamaca e FJML23, kei na dua na ilawalawa ika lalai karakarawa-loaloa e qalo tiko e cake ni ulu ni delana e FJMT14.
Highlights
- Ubi ni lase mai na 12% ena dua na taba e Totoya e ubia na lumi (FJTO06) ki na 51% ena cakau i tuba e na yasana i ra i Moala (FJML19).
- E dua na tobu lase e rabailailai e Moala kei na dua na sala ni qara e ubia e Totoya (FJML23, FJTO09).
- Teveli Acropora lelevu kei na staghorn e veitaravi ena dela ni cakau i Totoya, e qalo kina na ika dravudravua (FJTO05).
- E dua na ulu ni delana lailai e wasawasa e matai Matuku, e levu cake kina na lumi damudamu ni coralline mai na lase bula (FJMT14).
- E dua na ulu ni cakau ena wai e loma ni cakau e ubia na teveli Acropora lelevu, e ruku ni o ni ika lalai karakarawa ramase (FJML21).
- E dua na qio batidua vulavula (whitetip reef shark) kei na dua na vasua ena dua na cakau e Totoya (FJTO04).
Notable observations
- Fiji - Moala (FJML19): Corallivores: some evidence of feeding scars on table and plating corals, likely due to an increase in cushion stars (Culcita) at the two west-side stations, FJML19 and FJML20 (Moala survey note).
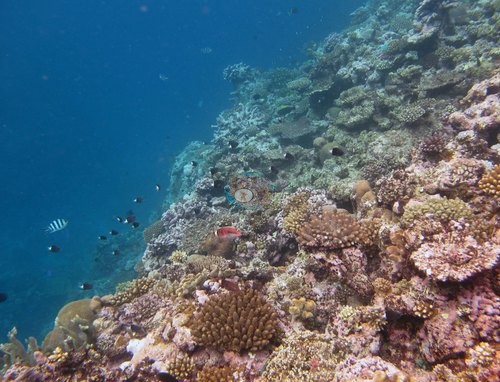
- Fiji - Moala (FJML21): One Pocillopora damicornis labeled by Anderson as bleaching, a stark chalk-white colony beside pigmented neighbors; no extent inferred. A tagged probe colony (tag 097) is fully bleached.
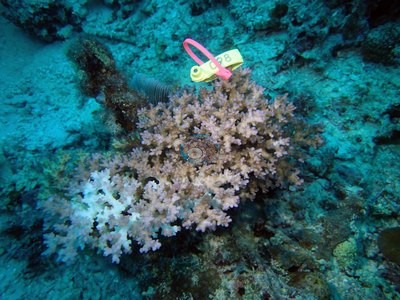
- Fiji - Moala (FJML18): Old coral rubble along the overhang edges; the survey note says it could be evidence of a storm surge event (same note on FJML17). Of the four colonies here with an outlier score, one was flagged as a physiological outlier (Mayfield et al. 2017); Anderson's sheet records all five colonies sampled as healthy, four with small pale spots or tips (5–10%).
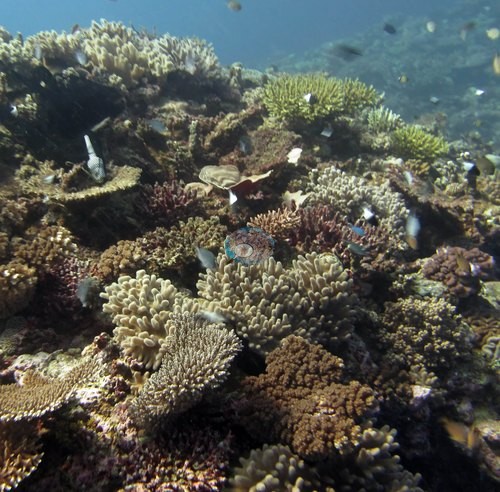
- Fiji - Moala (FJML15): Cyanobacteria covered 13% of the transects on this exposed east-side slope, alongside 66% total algae.
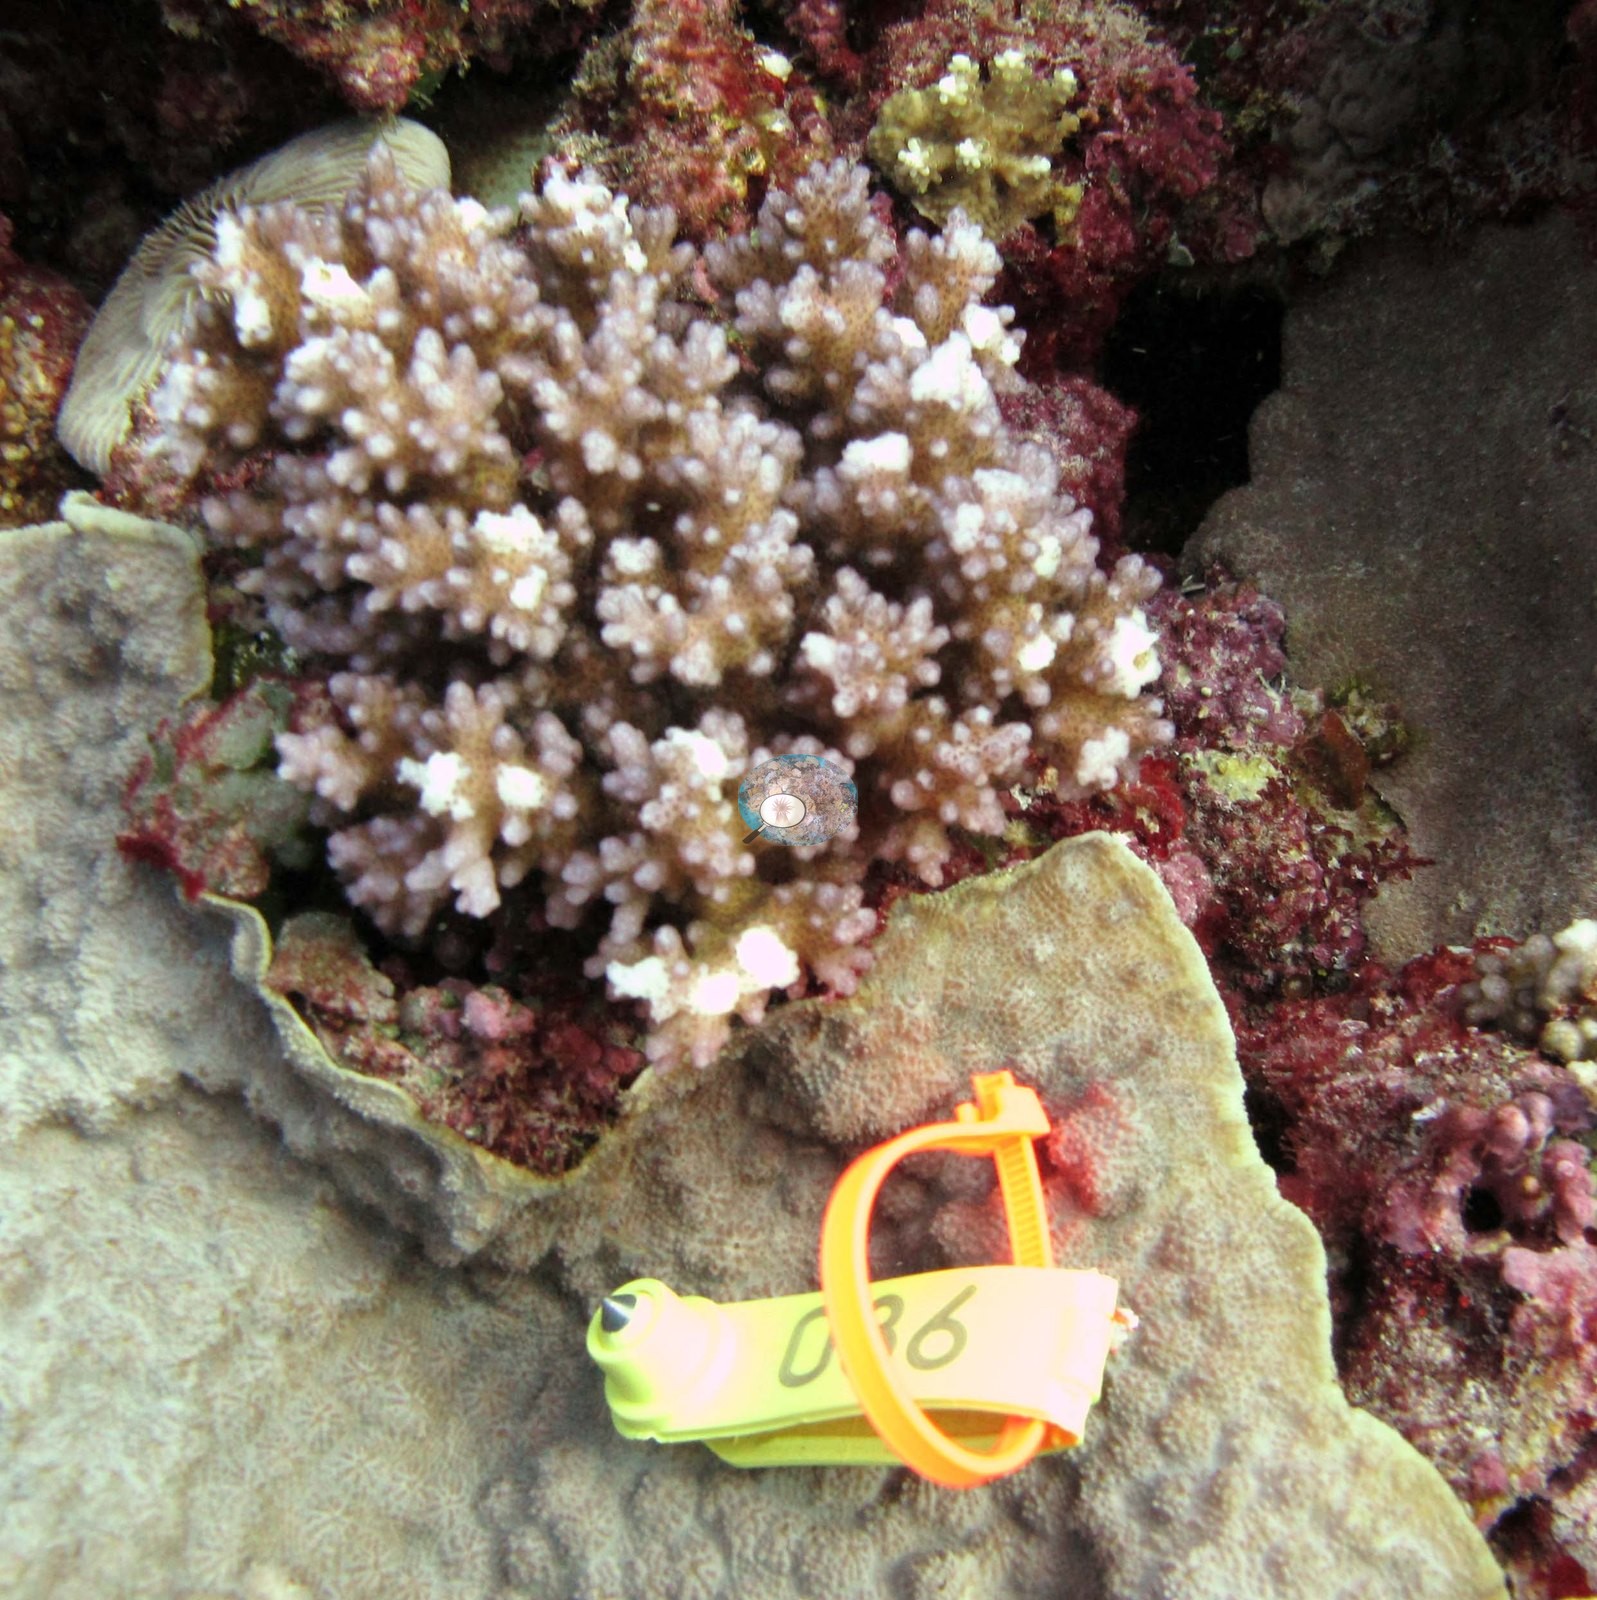
- Fiji - Totoya (FJTO08): No disease lesions or crown-of-thorns feeding scars in the eleven frames; white patches on the branch tips of one Pocillopora colony (which Anderson identified as P. damicornis) are over-exposure, not tissue loss.
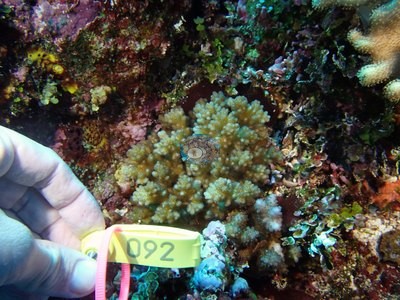
- Fiji - Totoya (FJTO02): No bleaching front, disease lesion, or crown-of-thorns feeding scar in any of the 15 frames.
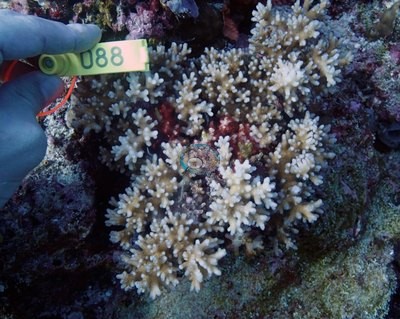
- Fiji - Totoya (FJTO07): Physiological stress outliers: the one coral colony from this site with an outlier score was flagged (Mayfield et al. 2017, PLoS ONE), as was the one from FJTO05; island-level screening flagged 2 of the 9 corals with an outlier score.
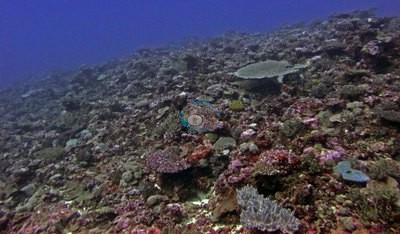
- Fiji - Matuku (FJMT11): Corallivores and recent mortality: Drupella snails were found on several colonies, which could account for some recent mortality scars on the acroporids (same survey note on FJMT10, FJMT13, and FJMT14).
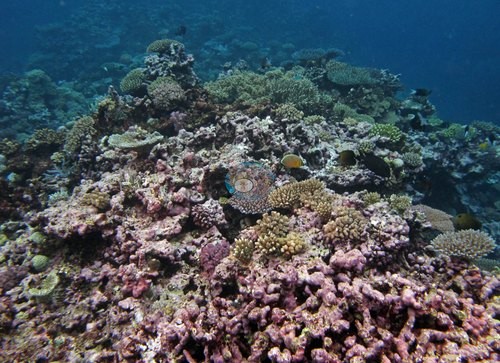
- Fiji - Matuku (FJMT14): Possible paling: two frames show a small cream-and-tan Pocillopora damicornis colony, darker at the branch bases and pale at the tips. Tissue is intact with no exposed skeleton, and natural pale pigmentation cannot be ruled out; no bleaching is claimed.
Coral cover over time (pooled)
 the year includes Global Reef Expedition dives made with the Khaled bin Sultan Living Oceans Foundation (CRD+LOF data).
Sites in this region (24)
- Fiji - Lau Islands: Totoya
- Fiji - Matuku (FJMT10) — 38% coral cover
- Fiji - Matuku (FJMT11) — 30% coral cover
- Fiji - Matuku (FJMT12) — 26% coral cover
- Fiji - Matuku (FJMT13) — 26% coral cover
- Fiji - Matuku (FJMT14) — 29% coral cover
- Fiji - Moala (FJML15) — 23% coral cover
- Fiji - Moala (FJML16) — 33% coral cover
- Fiji - Moala (FJML17) — 33% coral cover
- Fiji - Moala (FJML18) — 40% coral cover
- Fiji - Moala (FJML19) — 51% coral cover
- Fiji - Moala (FJML20) — 37% coral cover
- Fiji - Moala (FJML21) — 22% coral cover
- Fiji - Moala (FJML22) — 29% coral cover
- Fiji - Moala (FJML23) — 29% coral cover
- Fiji - Totoya (FJTO01) — 28% coral cover
- Fiji - Totoya (FJTO02) — 36% coral cover
- Fiji - Totoya (FJTO03) — 33% coral cover
- Fiji - Totoya (FJTO04) — 25% coral cover
- Fiji - Totoya (FJTO05) — 46% coral cover
- Fiji - Totoya (FJTO06) — 12% coral cover
- Fiji - Totoya (FJTO07) — 42% coral cover
- Fiji - Totoya (FJTO08) — 36% coral cover
- Fiji - Totoya (FJTO09) — 29% coral cover
% coral cover by method
Pooled across 5 dive sites
| Method | Mean % coral cover | Std. dev. between dive sites | n dive sites | Note |
|---|---|---|---|---|
| CoralSCOP (SAM-based mask-sum), edited photos | 38% | ±11 | 5 | 5 of these 5 values rest on 10–19 photographs (*) |
| Claude (Anthropic), blind point count | 31% | ±13 | 5 | 5 of these 5 values rest on 10–19 photographs (*) |
| In-water diver transect (line/point intercept) | 35% | ±4.4 | 5 | — |
The mean is an UNWEIGHTED mean of the dive site values — each dive site counts once, whatever its photo count — which is the convention of the published tables and of every other figure on this page. Each value is the one printed on that dive site's own page; a page that prints no value for a method (fewer than 10 photographs) is left out of that method's mean.
This table pools only the 5 dive sites in this unit that have a method comparison; the table for all 10 dive sites is on the Fiji - Lau page.
Deviation from the reference
Over the dive sites where an independent reference exists, Claude (Anthropic), blind point count has a mean absolute deviation of 10.6 pp from it across 5 dive sites. Not in this ranking: CoralSCOP (edited), which measures coral area rather than points. A mean absolute deviation is not an accuracy score: a model with a consistent offset is correctable, while one with the same deviation scattered in both directions is not.
By dive site
| Dive site | CoralSCOP (edited) | Claude | Diver transect |
|---|---|---|---|
| FJML16 | 41%* n=19 | 35%* n=19 | 33% |
| FJML18 | 38%* n=10 | 24%* n=10 | 40% |
| FJML20 | 54%* n=13 | 51%* n=13 | 37% |
| FJTO02 | 34%* n=12 | 26%* n=12 | 36% |
| FJTO09 | 25%* n=13 | 18%* n=13 | 29% |
n under each value is the number of photographs that method scored at that dive site. ⚠ marks a cell that is not an independent check. * marks a value resting on only 10–19 photographs, which is less certain.
Reference: Living Oceans Foundation (LOF) Global Reef Expedition in-water transects (mean of all the station's transects, Living Oceans Foundation per-transect benthic data). Denominator: line/point intercept along the transect; not a photo-point denominator. Source: LOF Global Reef Expedition 2013, per-transect benthic data ('GRE data-full benthic'): the mean of all of each station's transects For all 10 dive sites in the comparison: The transect is THE coral-cover value at every site; the Claude photo estimate is a methods comparison only, never averaged with the transect and never a headline. Site-level only: the photos come from the survey dives, not from the transect points. Few usable habitat photos exist for Fiji: only 10 sites have 10 or more, and 9 of them have fewer than 20 (low-n), so these are not confident site estimates. Accuracy, Claude vs transect, 10 sites: mean difference -5.4 pp (95% CI -12.7 to +1.9), mean absolute difference 10.3 pp, r 0.35. Claude reads lower than the transect at most sites and does not track it from site to site. This is a methods comparison, not a ranking.
Nearby external survey stations
13 independent survey records within 5 km of a site in this region (each record counted once; 11 lines, and a line that pools several records says how many).
- Reef Check — Dabu Passage (1999): 51% hard coral cover, 4.23 km from Fiji - Matuku (FJMT11)
- Reef Check — Maccadame Reef (1999): 56% hard coral cover, mean of 2 surveys (2 m and 10 m), 0.53 km from Fiji - Matuku (FJMT11) (2 records)
- Reef Check — North of Arua (1999): 39% hard coral cover, 0.88 km from Fiji - Matuku (FJMT11)
- WCS Fiji via MERMAID — TY01 (2011): 36% hard coral cover, 0.18 km from Fiji - Totoya (FJTO06)
- WCS Fiji via MERMAID — TY02 (2011): 53% hard coral cover, 0.32 km from Fiji - Totoya (FJTO06)
- WCS Fiji via MERMAID — TY04 (2011): 58% hard coral cover, 0.05 km from Fiji - Totoya (FJTO07)
- WCS Fiji via MERMAID — TY06 (2011): 46% hard coral cover, 0.68 km from Fiji - Totoya (FJTO06)
- WCS Fiji via MERMAID — TY08 (2011): 53% hard coral cover, 1.26 km from Fiji - Totoya (FJTO06)
- WCS Fiji via MERMAID — TY10 (2011): 53% hard coral cover, 1.27 km from Fiji - Totoya (FJTO07)
- WCS Fiji via MERMAID — TY13 (2011): 64% hard coral cover, 1.24 km from Fiji - Totoya (FJTO06)
- WCS Fiji via MERMAID — TY15 (2011): 43% hard coral cover, mean of 2 surveys, 0.99 km from Fiji - Totoya (FJTO06) (2 records)
All images from Coral Reef Diagnostics. Data are from the Khaled bin Sultan Living Oceans Foundation Global Reef Expedition, Coral Reef Diagnostics, Reef Check Foundation, and WCS Fiji.
© Coral Reef Diagnostics.
References
- Souter D, et al. (eds) (2021) Status of Coral Reefs of the World: 2020. International Coral Reef Initiative / Global Coral Reef Monitoring Network. [PDF]
- Spalding MD, et al. (2001) World Atlas of Coral Reefs. University of California Press, Berkeley. [PDF]
- Wilkinson C (2006) Status of coral reefs of the world: summary of threats and remedial action. In: Côté IM, Reynolds JD (eds) Coral Reef Conservation. Cambridge University Press, Cambridge. [PDF]
- Mayfield AB, Chen CS, Dempsey AC (2017). Identifying corals displaying aberrant behavior in Fiji’s Lau Archipelago. PLOS ONE 12:e0177267. PDF