
Part of the regional summaries: Fiji - Moala, Fiji - Moala Group (Moala / Totoya / Matuku), and Fiji - Lau
More info
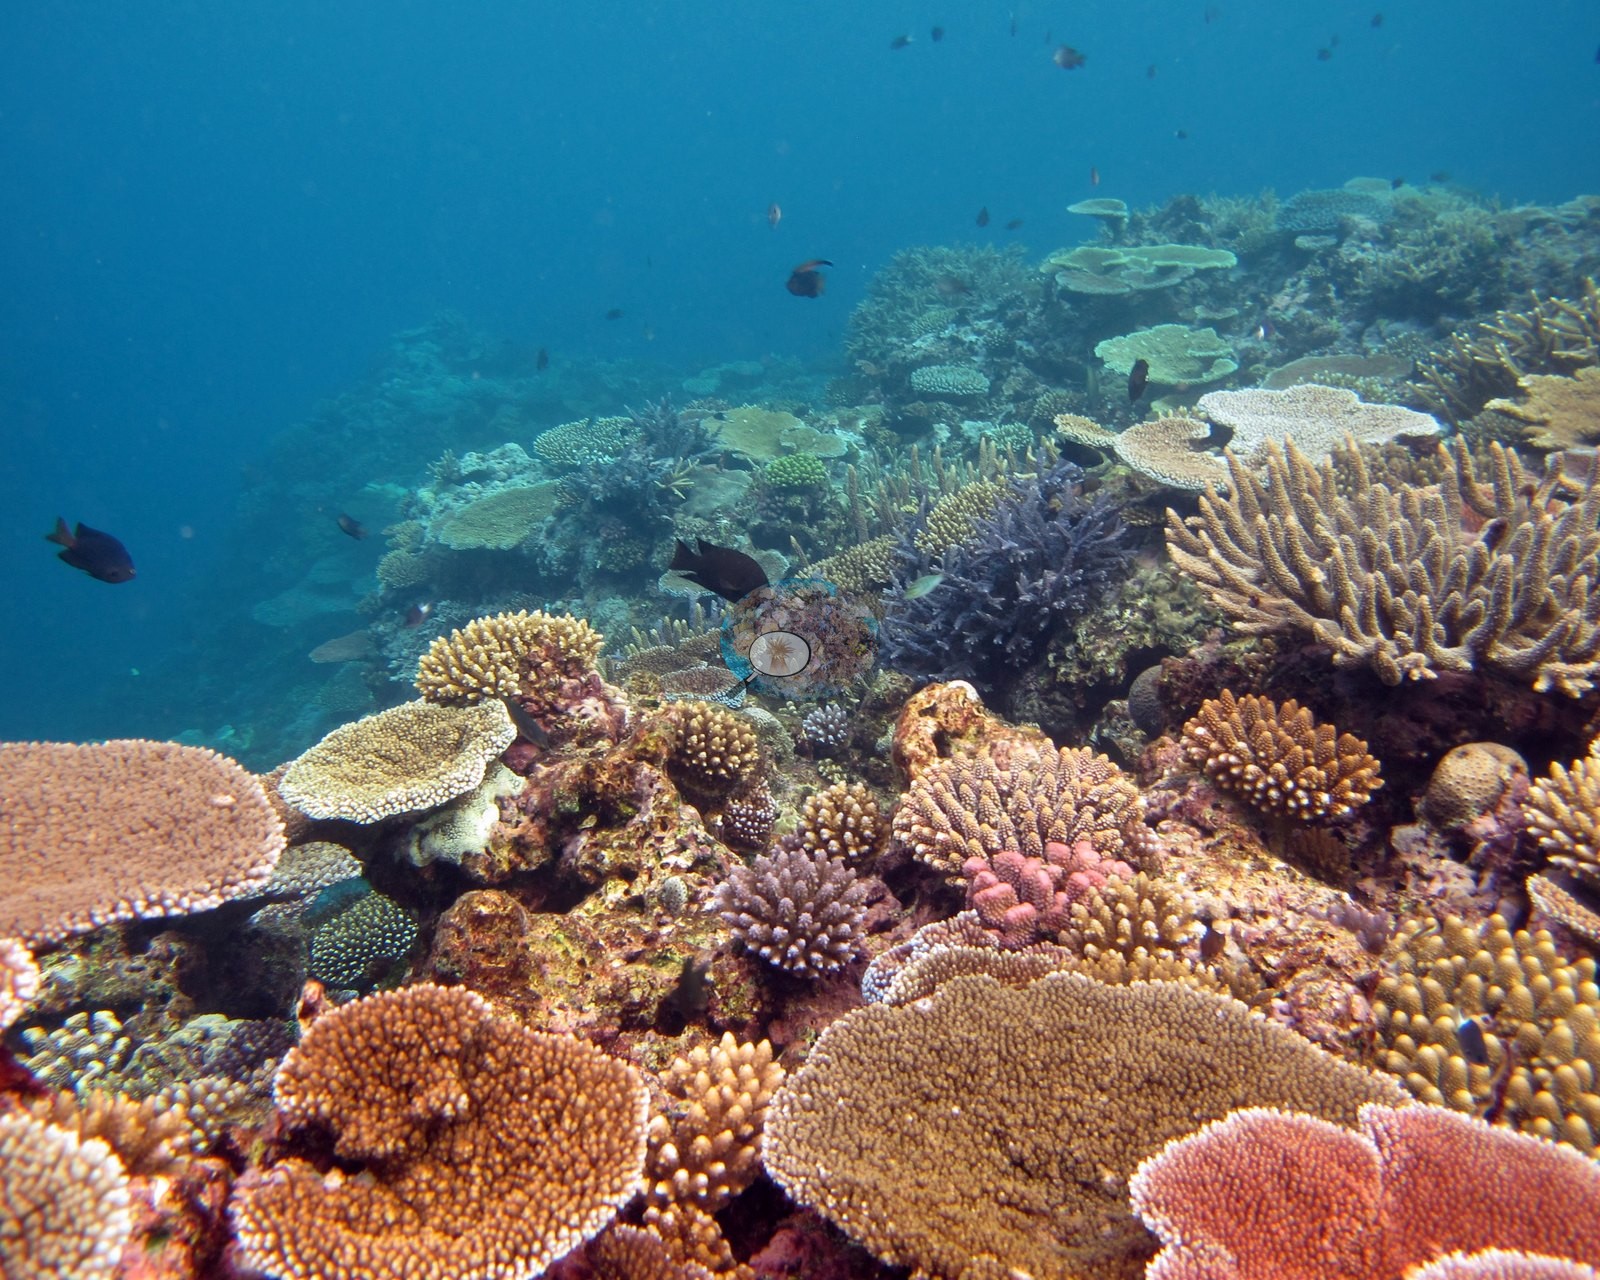
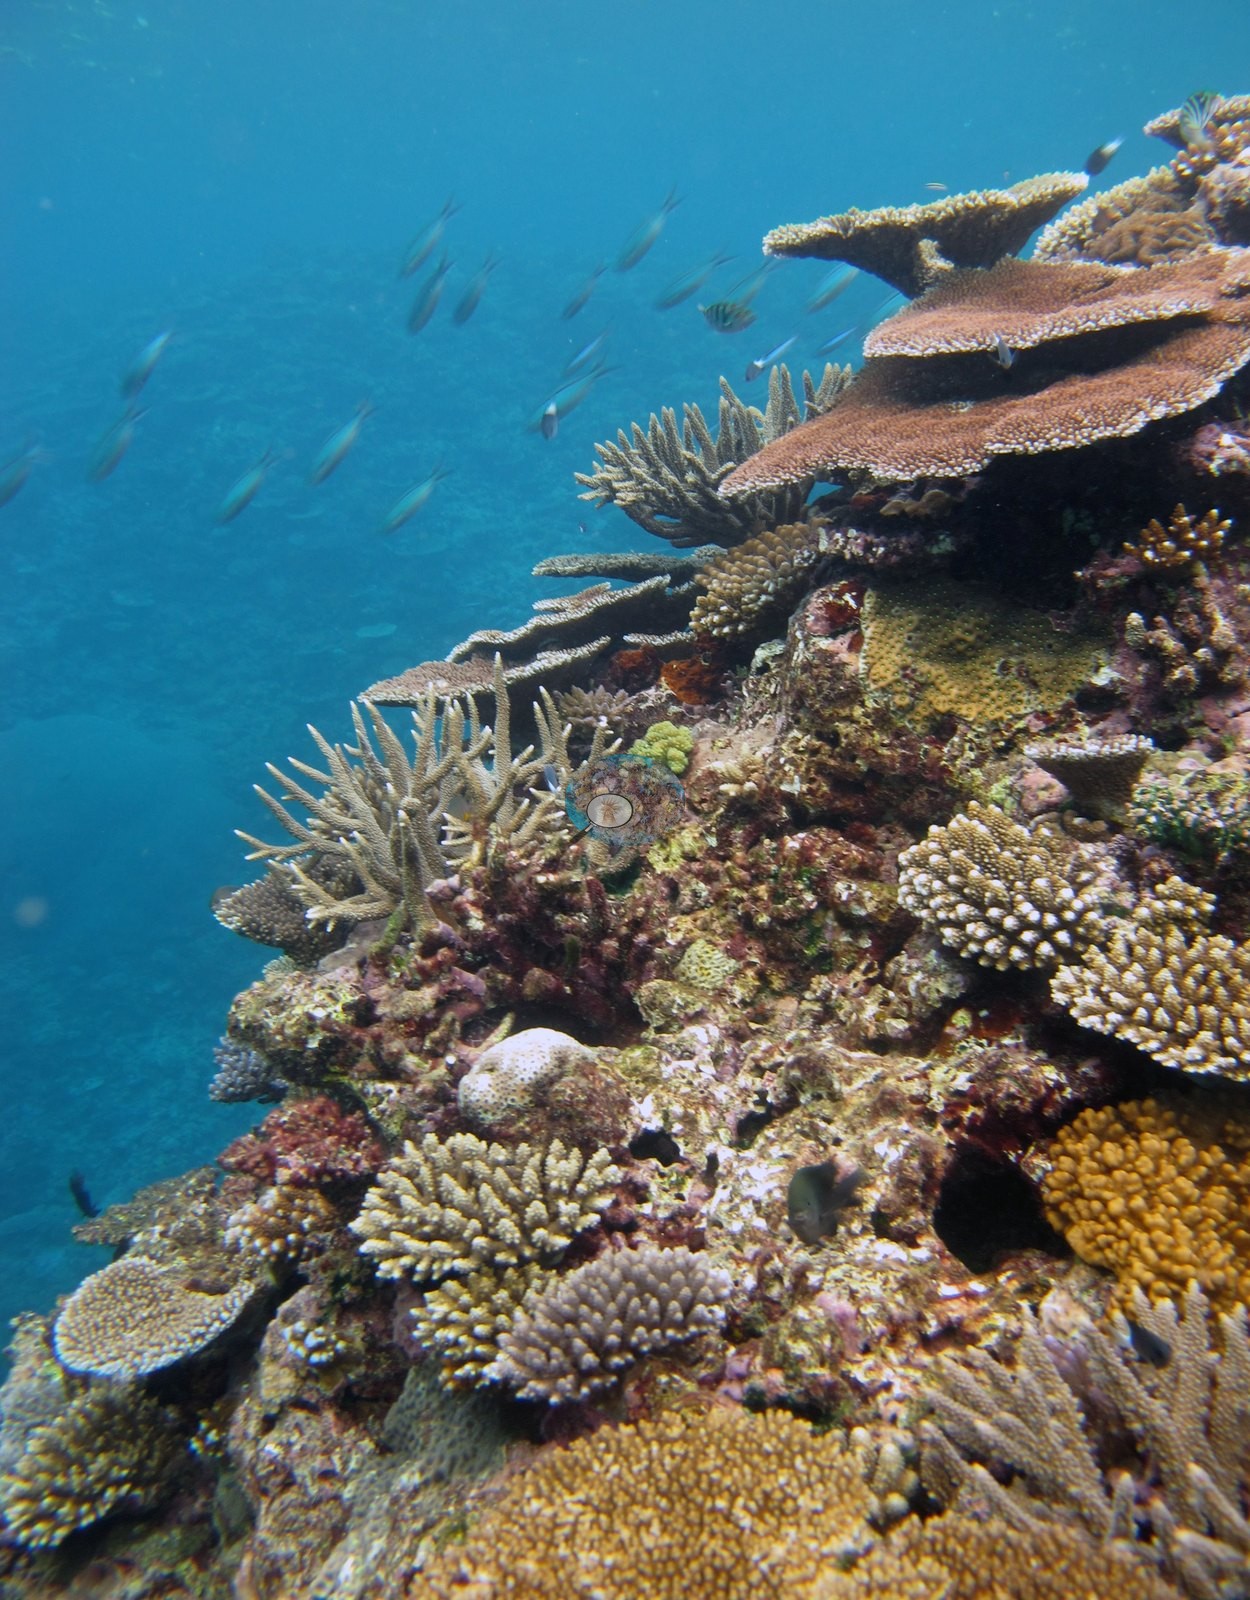
Fiji (NOAA CRW virtual station)A fore-reef slope on Moala's west side, dived the same day as FJML19, at 37% cover. The survey team reported coral build-ups on the terrace carrying branching corals, Porites rus plates and staghorn down the slope, coral continuing past 40 m, and feeding scars on table and plate corals likely from Culcita cushion stars. Surveyed on the Living Oceans Foundation's Global Reef Expedition.
E dua na baba ni yasana i tuba ni cakau (fore-reef slope) ena yasana i ra i Moala, a nunu kina ena siga vata kei na FJML19, ka 37% na ubi ni lase (coral cover). Na ilawalawa ni vakadidike e vola na lase e vakasoqoni (build-ups) ena vanua raraba (terrace) e tu kina na lase vakatabataba, na lase vakaiteba ni Porites rus kei na staghorn e sobu ki na baba, na lase e se tomana tiko ka sivia na 40 m, kei na mavoa ni kana ena lase tepeli kei na lase vakaiteba ka rairai vakavuna na basaga Culcita (cushion stars).
AI translation of this summary; the English is authoritative. (low confidence)
CTD-cast midpoint of 27.1–27.2°C
One other CRD dive site with its own page within 5 km shown in orange — click a marker to open its page.
🗺 Detailed map of the Global Reef Expedition dive sites, Moala, Fiji (Khaled bin Sultan Living Oceans Foundation; opens in a new window)
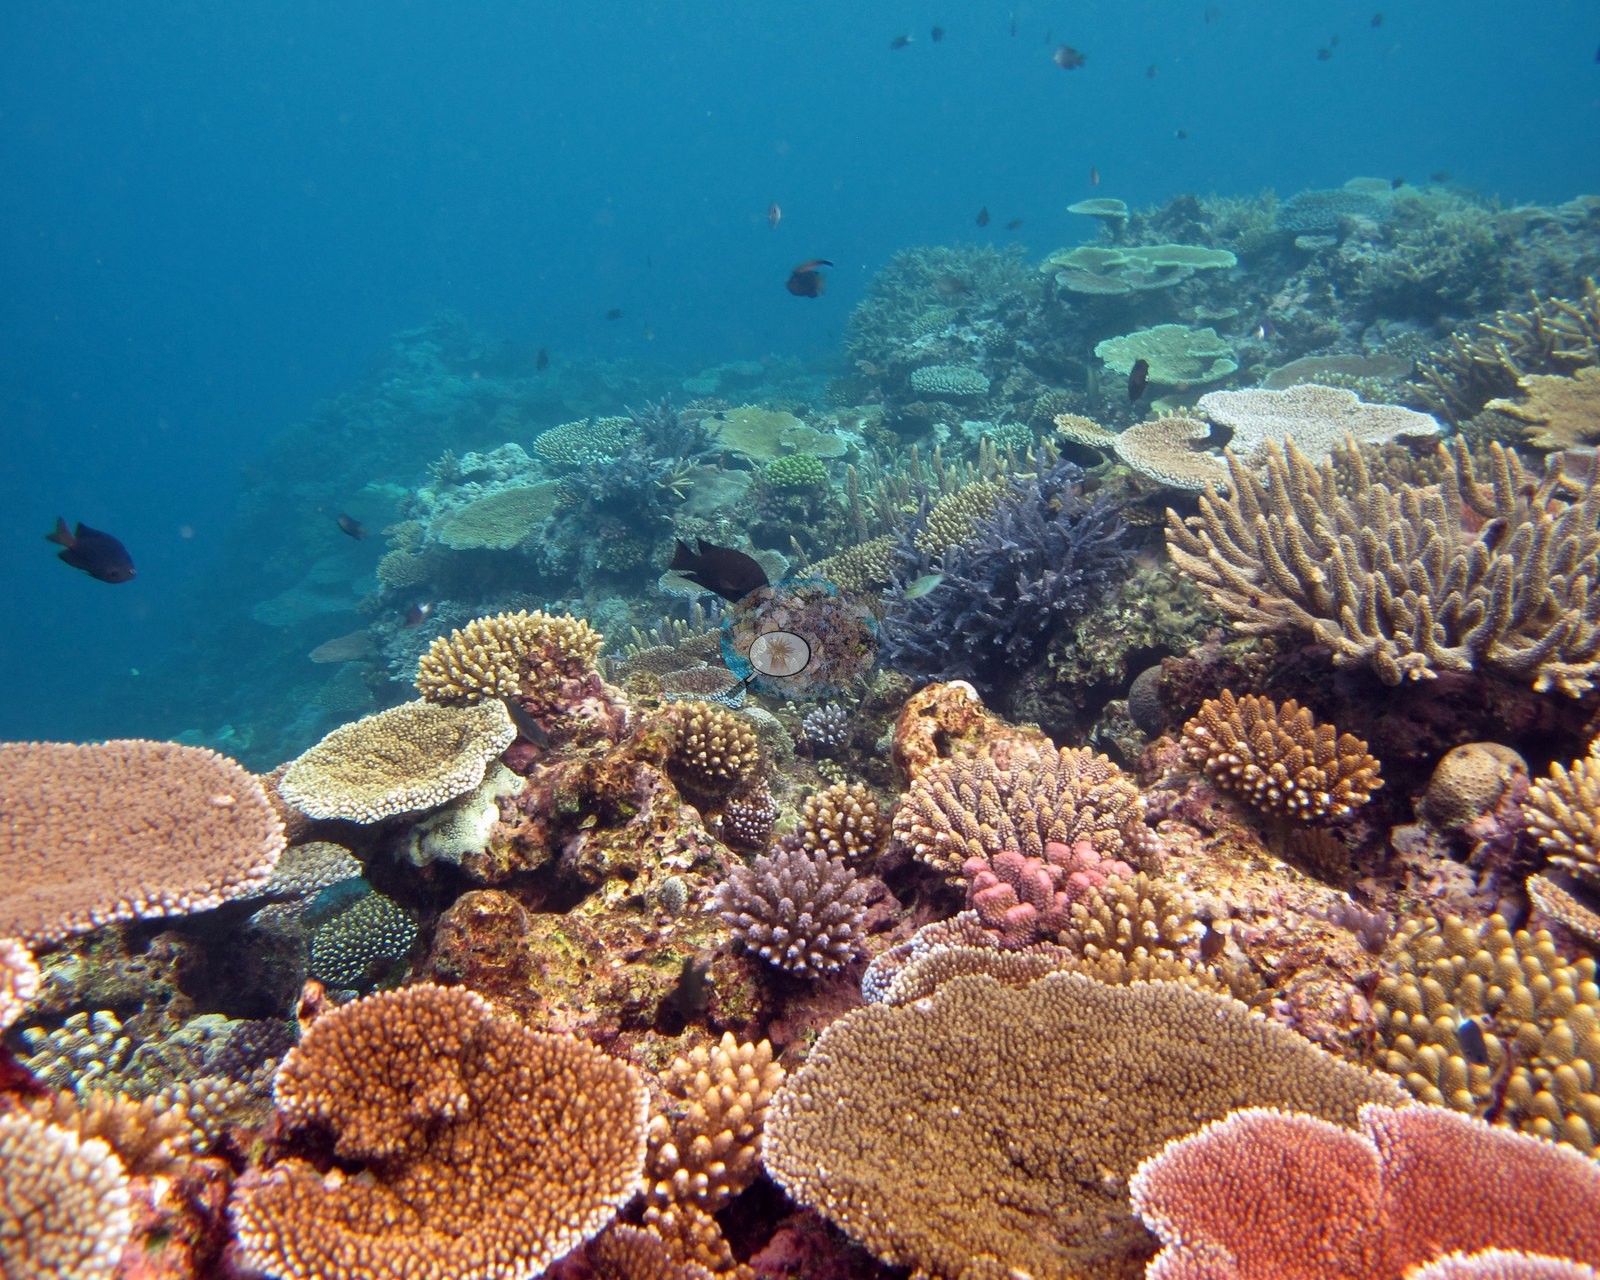
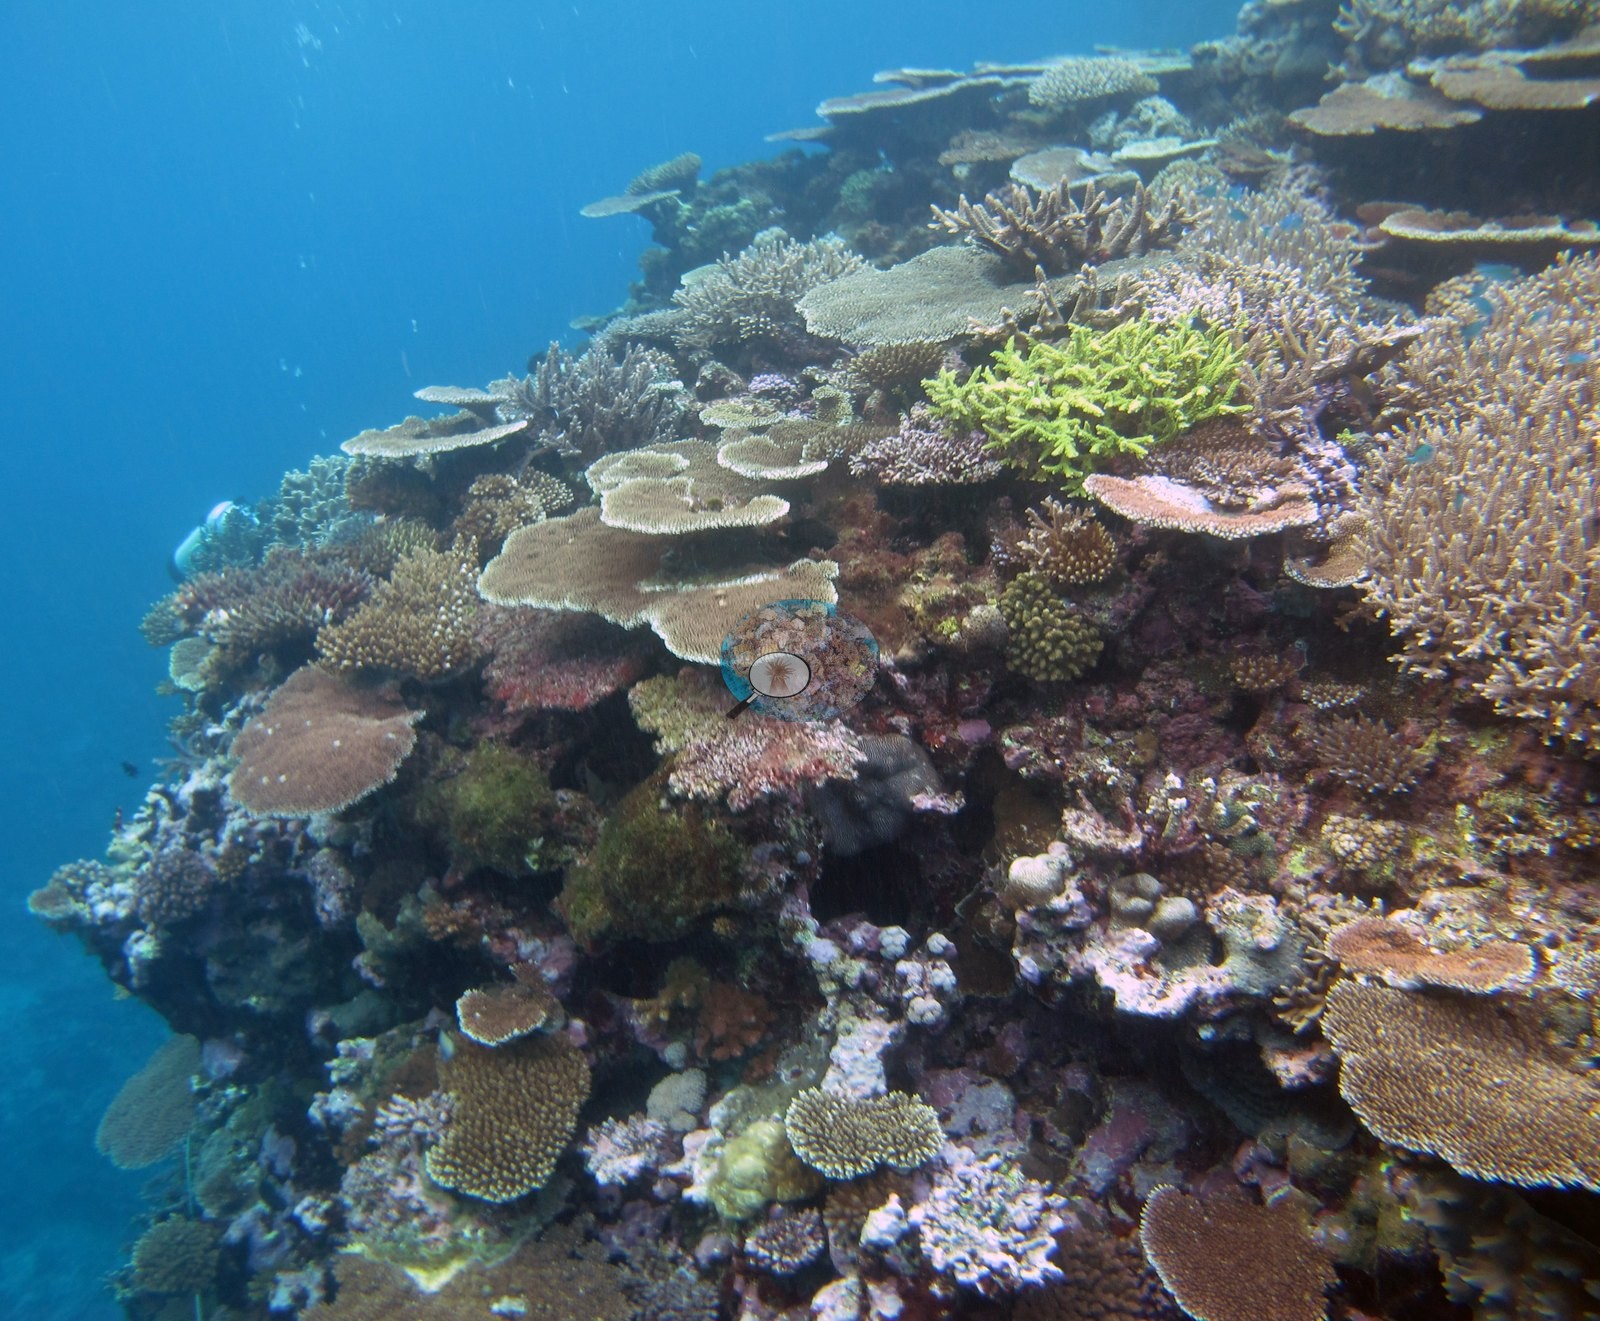
4 of the 18 photographs on this page are shown beside the text that discusses them under "Site description" below.
Site description
Setting
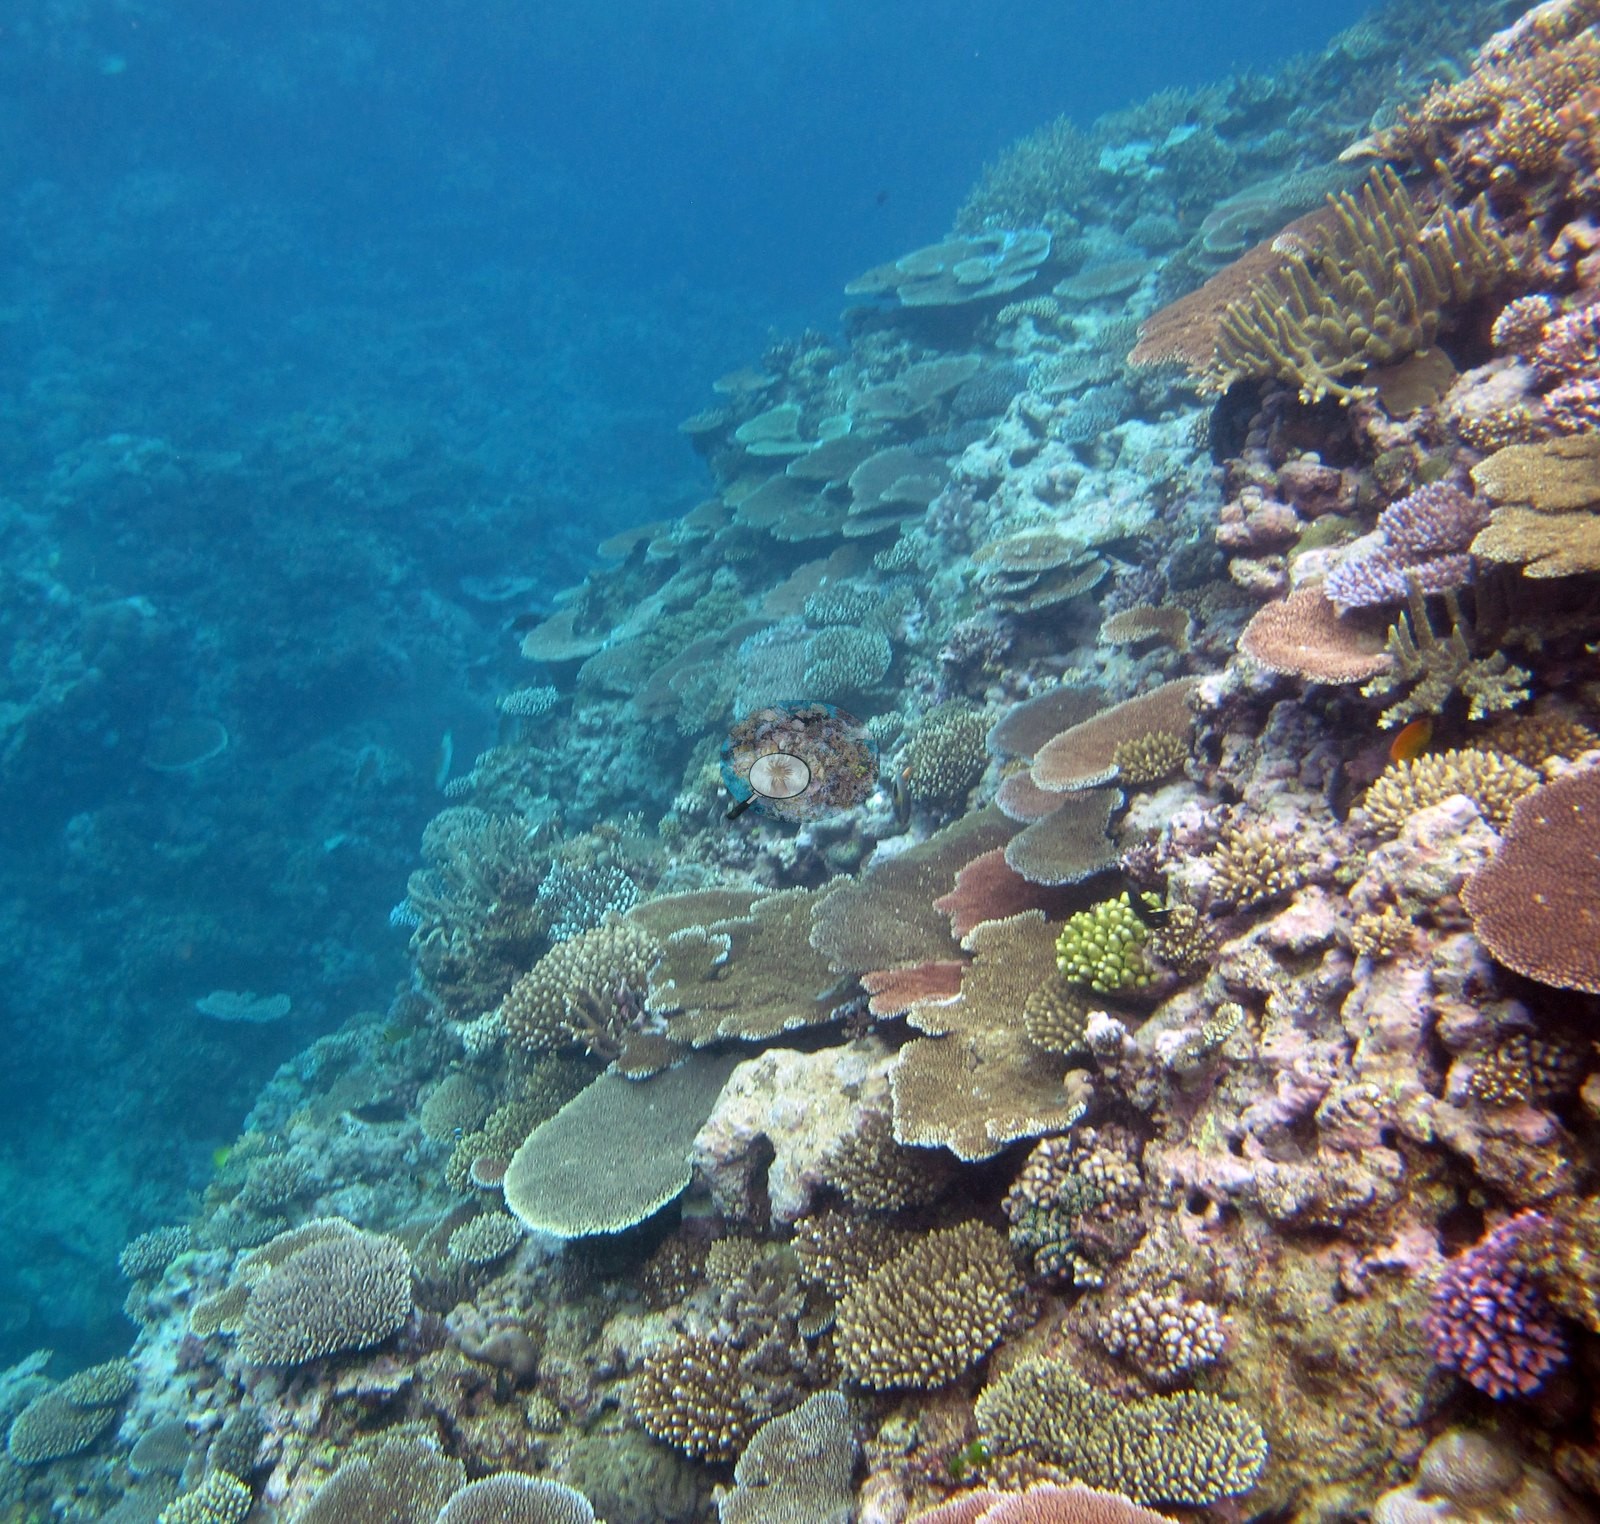
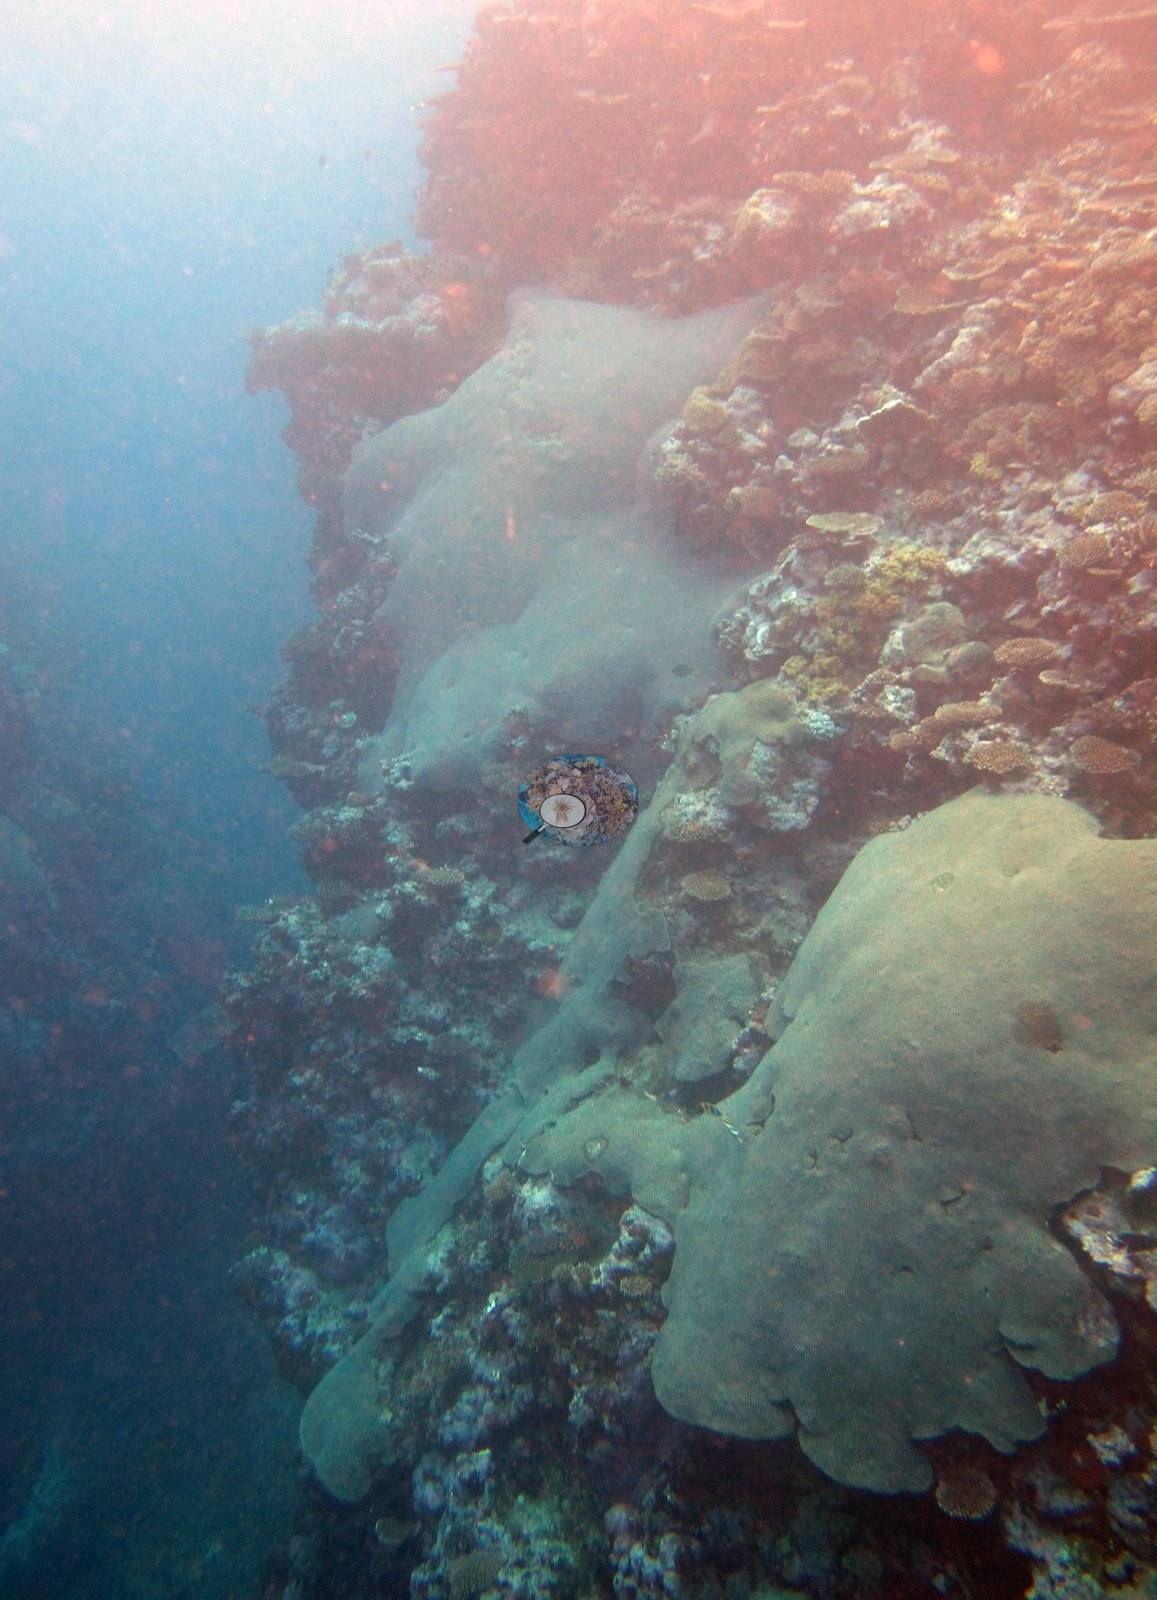
Survey team's Moala notes. FJML19 and FJML20 were located on the west side of the island. Both sites were on the fore reef slope, with slope and coral cover continuing beyond 40 m off the fore reef terrace.
General benthic features
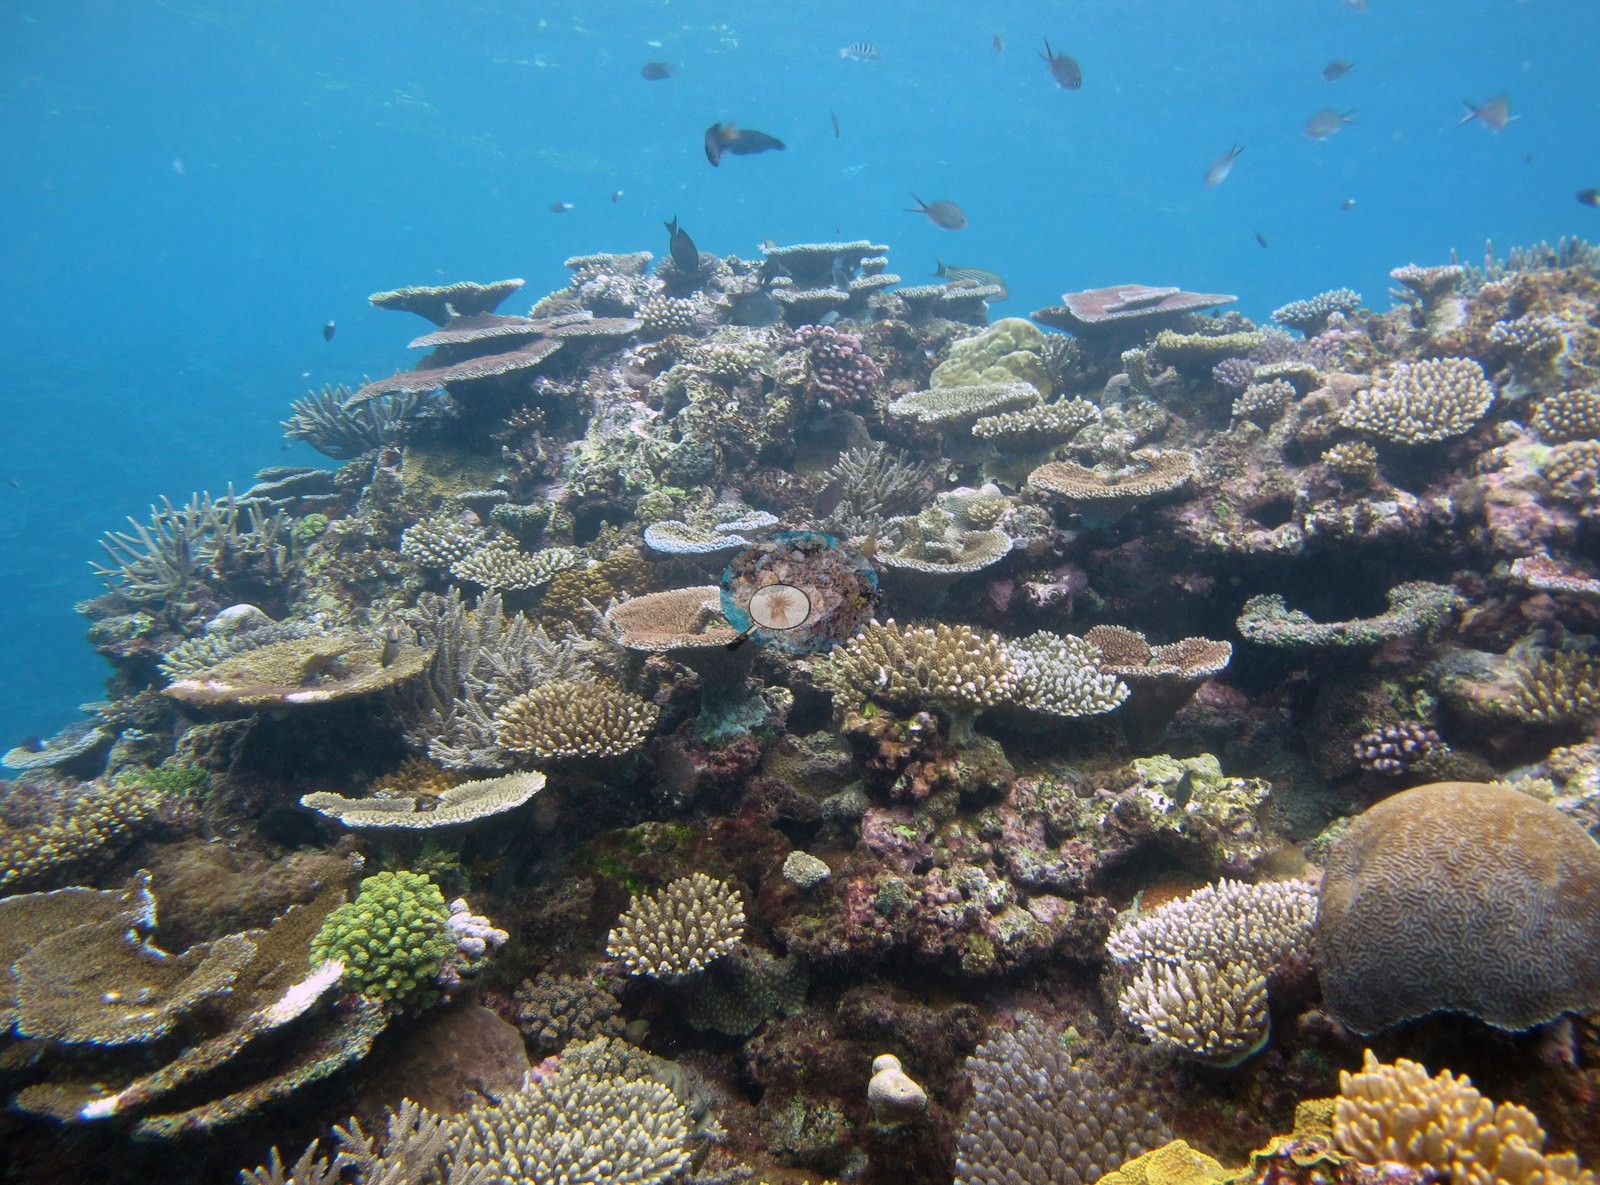
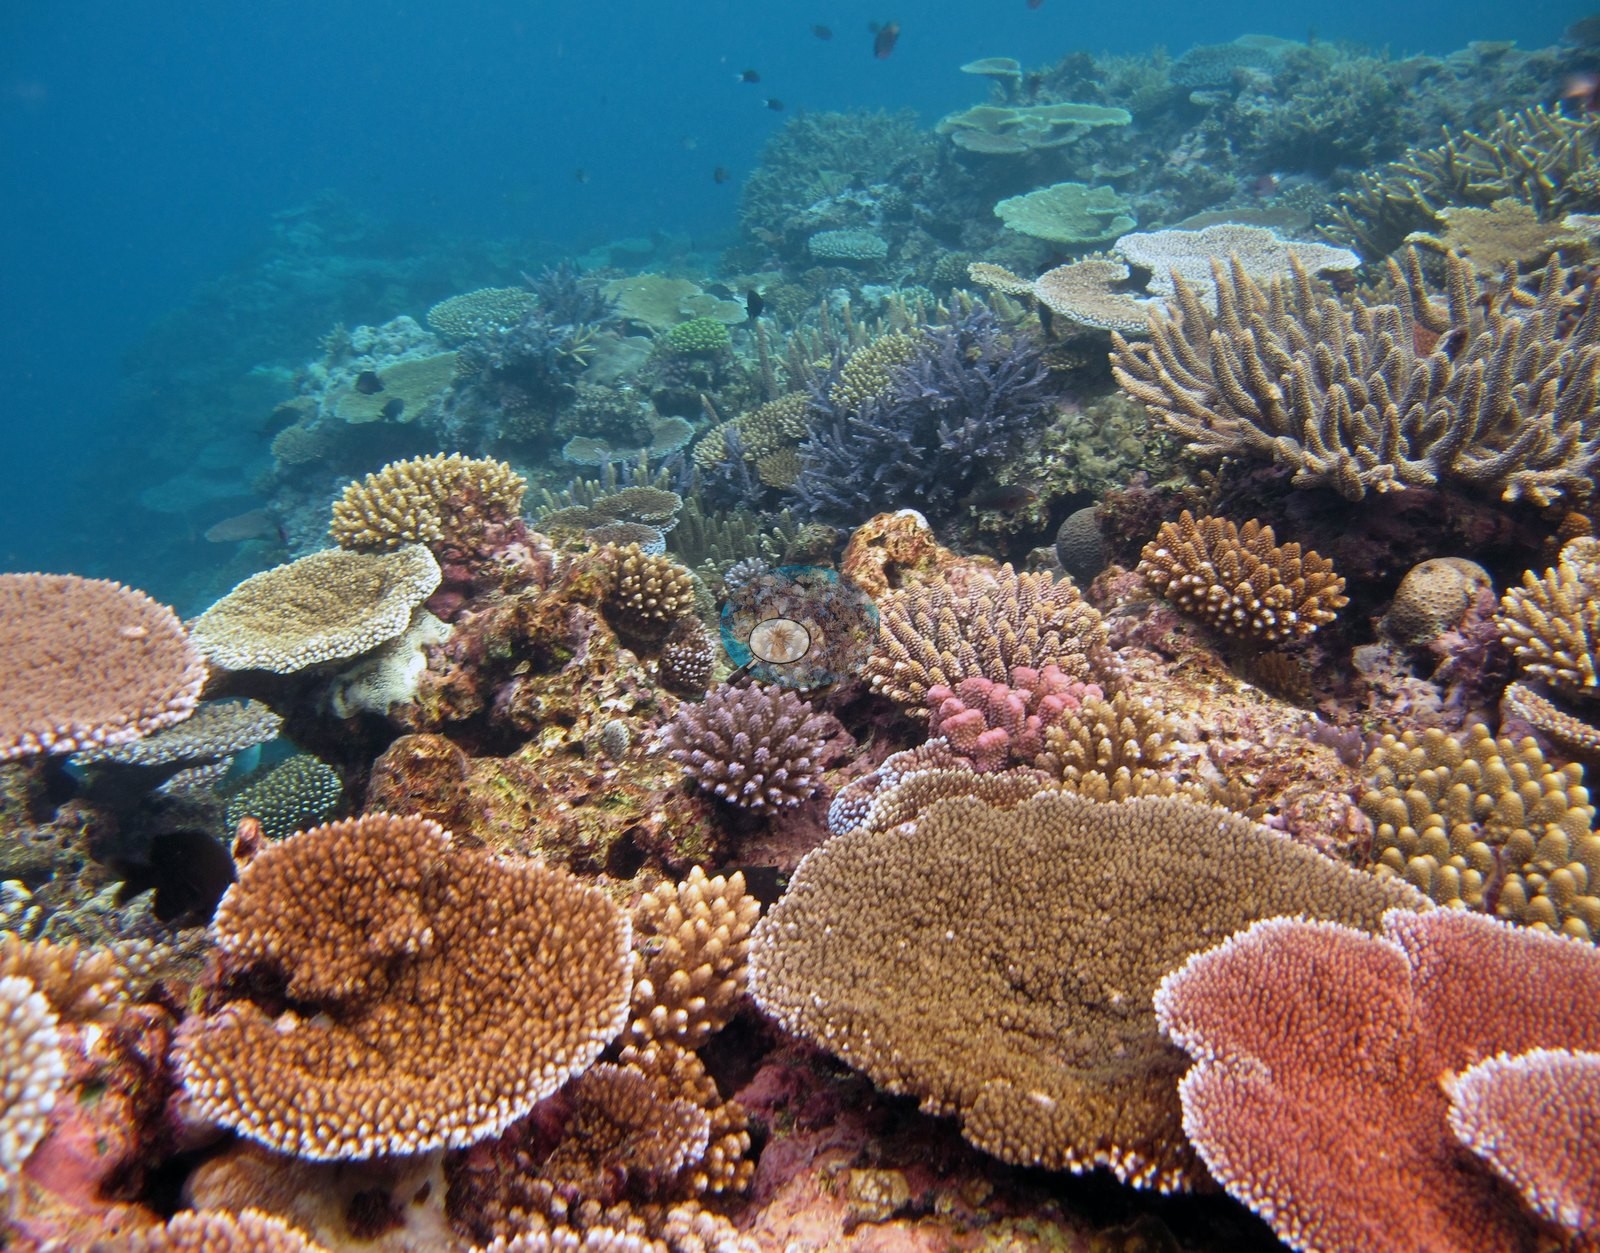
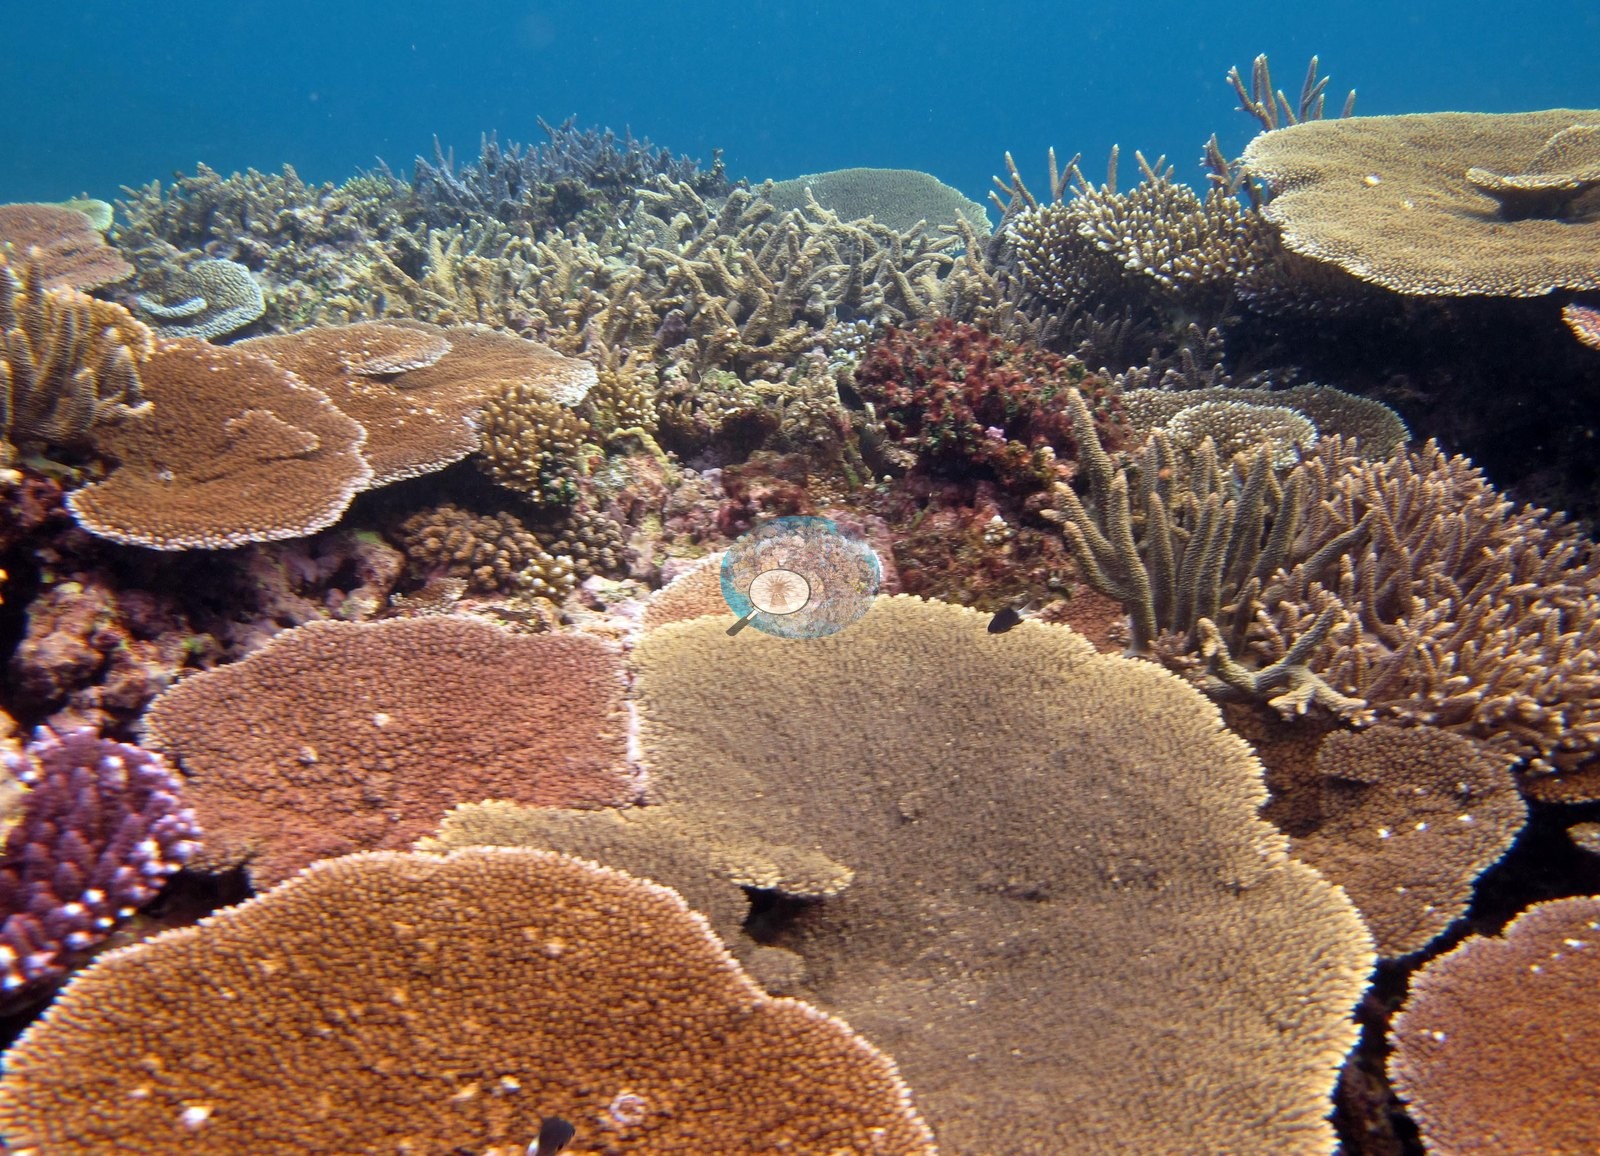
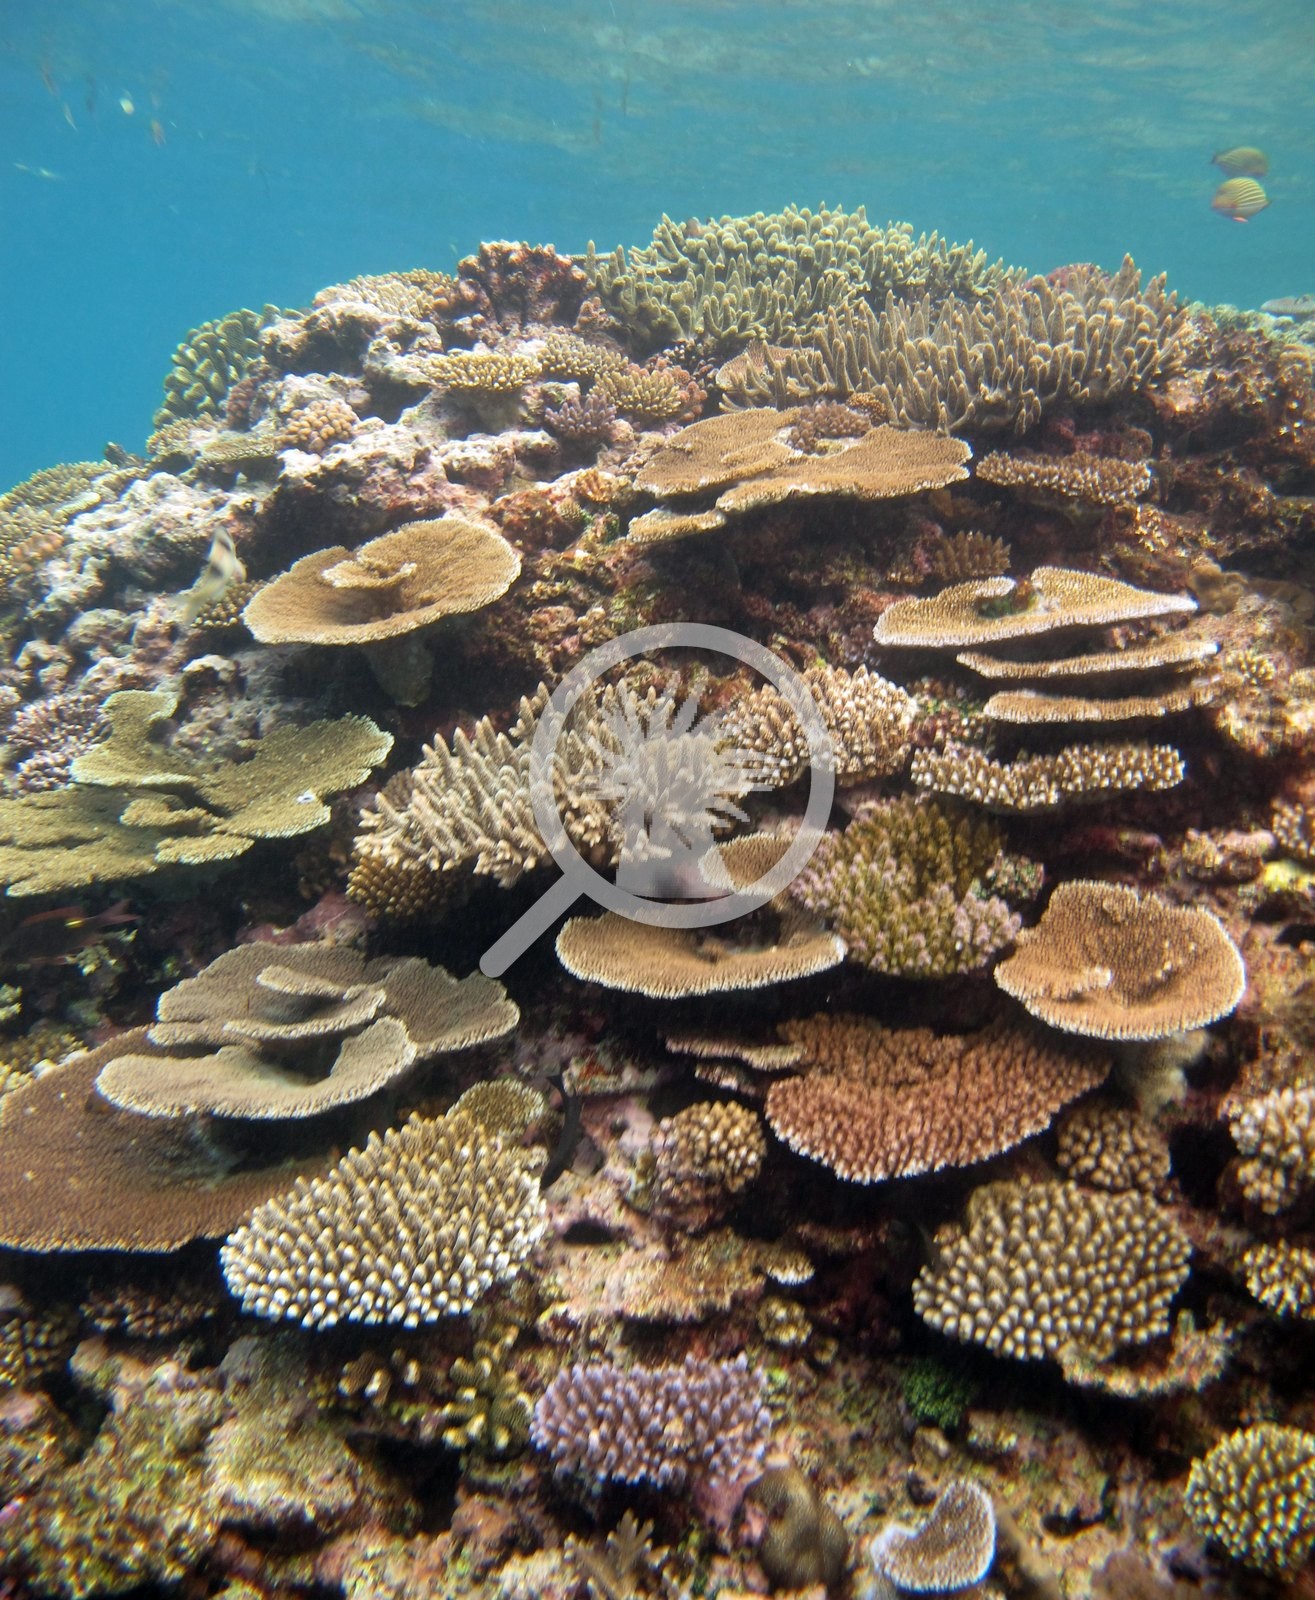
The survey team's notes (FJML19 and FJML20, with some lines written for the island's other stations): up on the terrace, coral build ups on top of massive framework were common (e.g., Image 1).
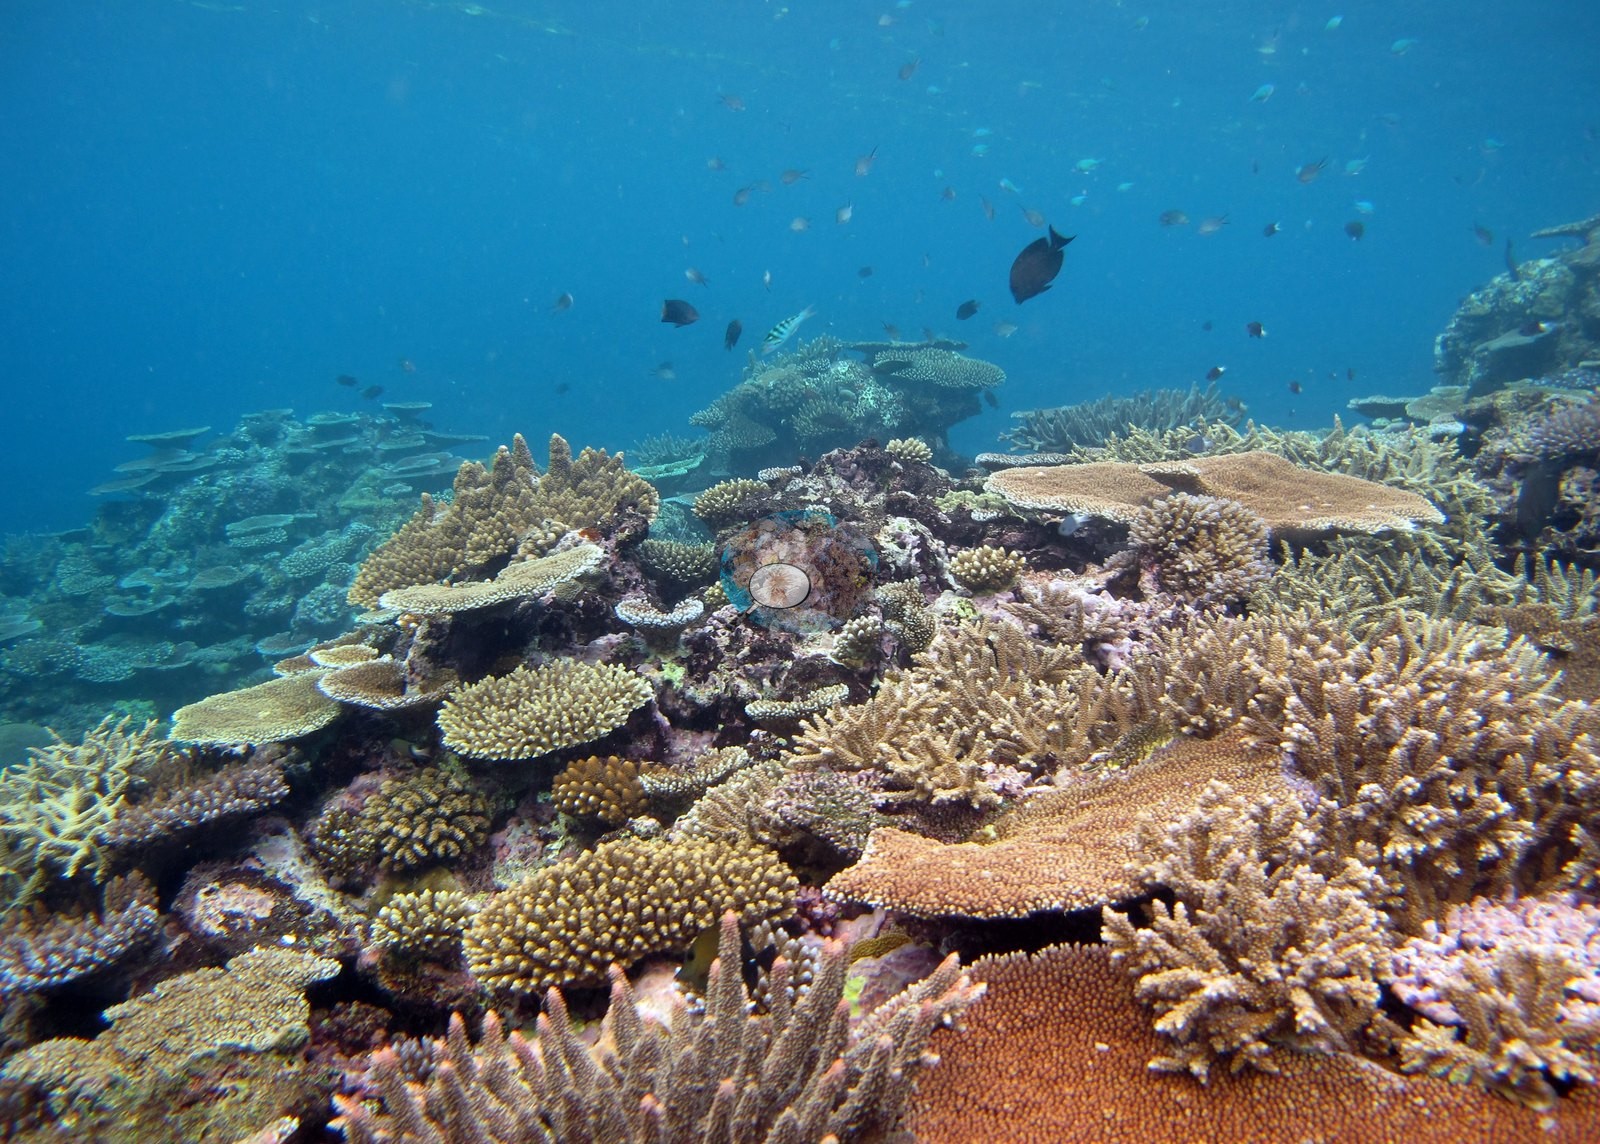
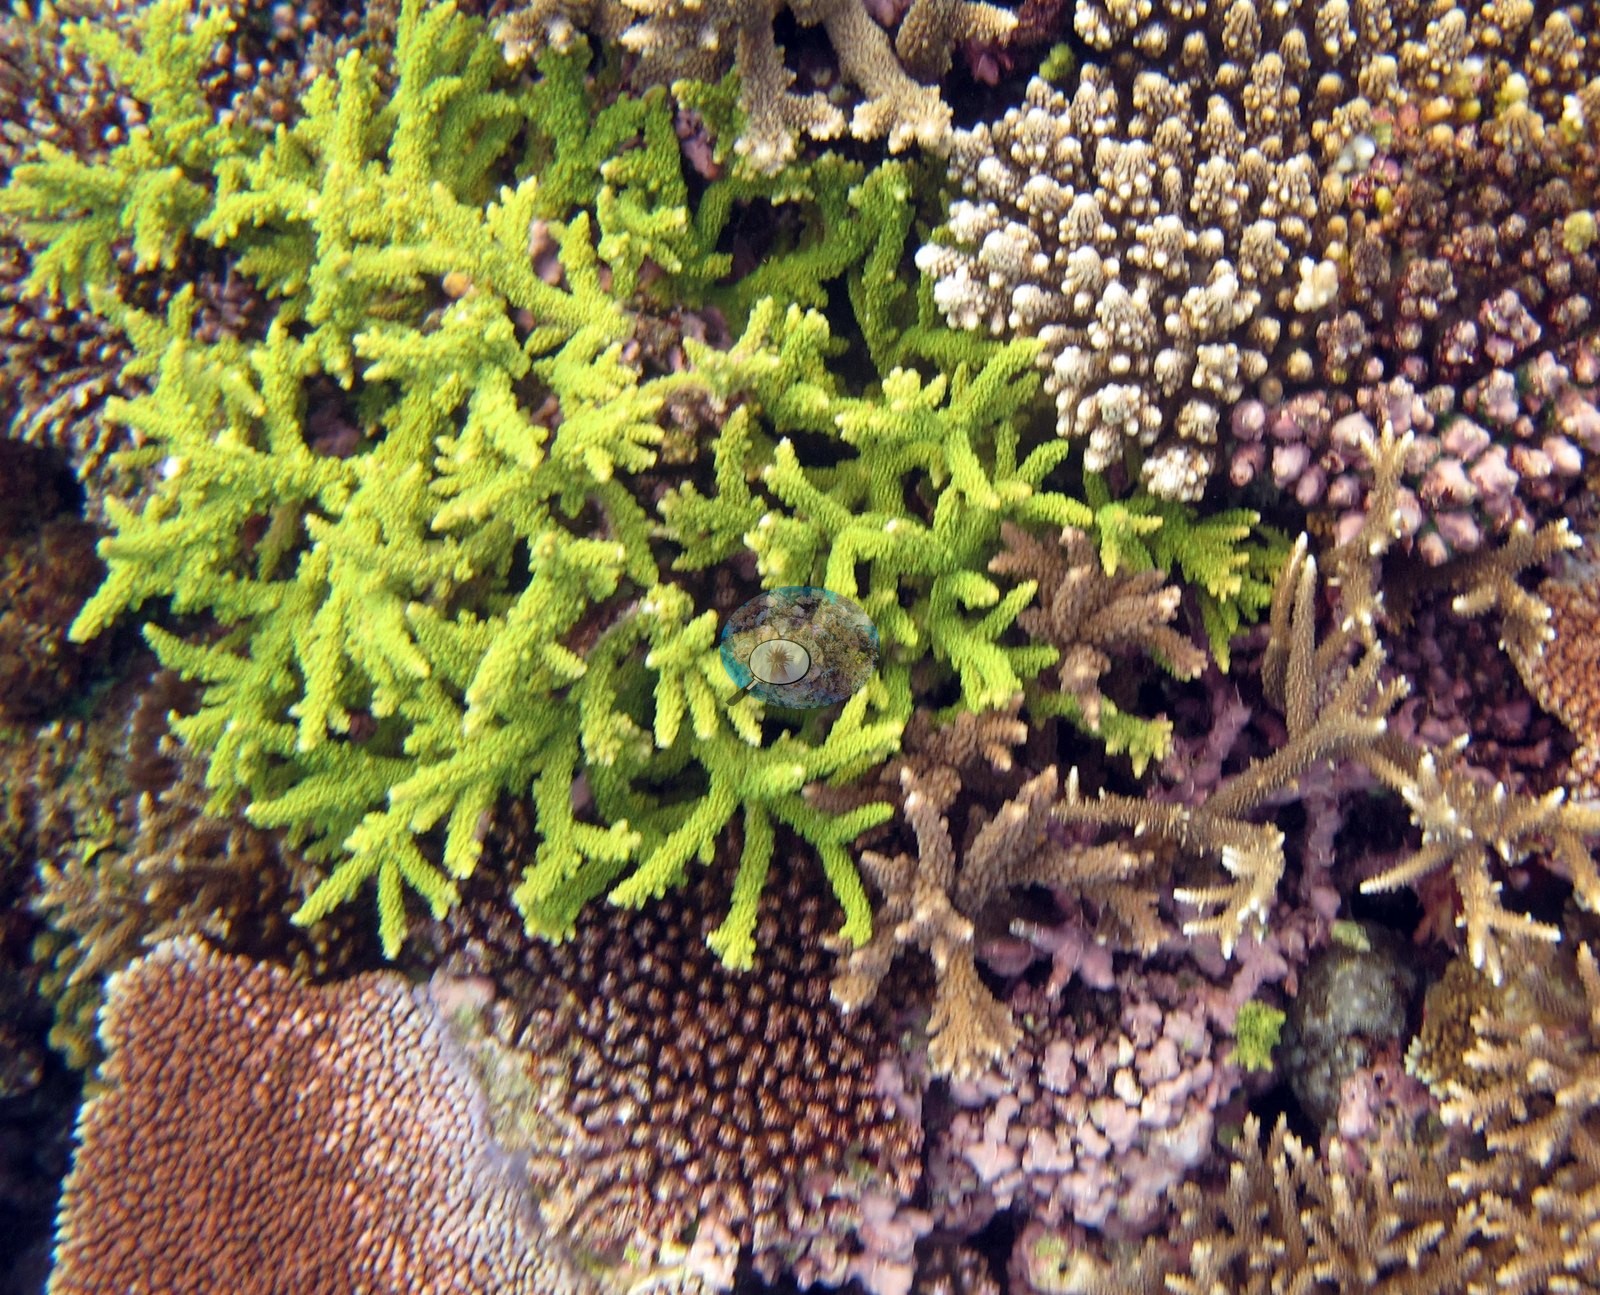
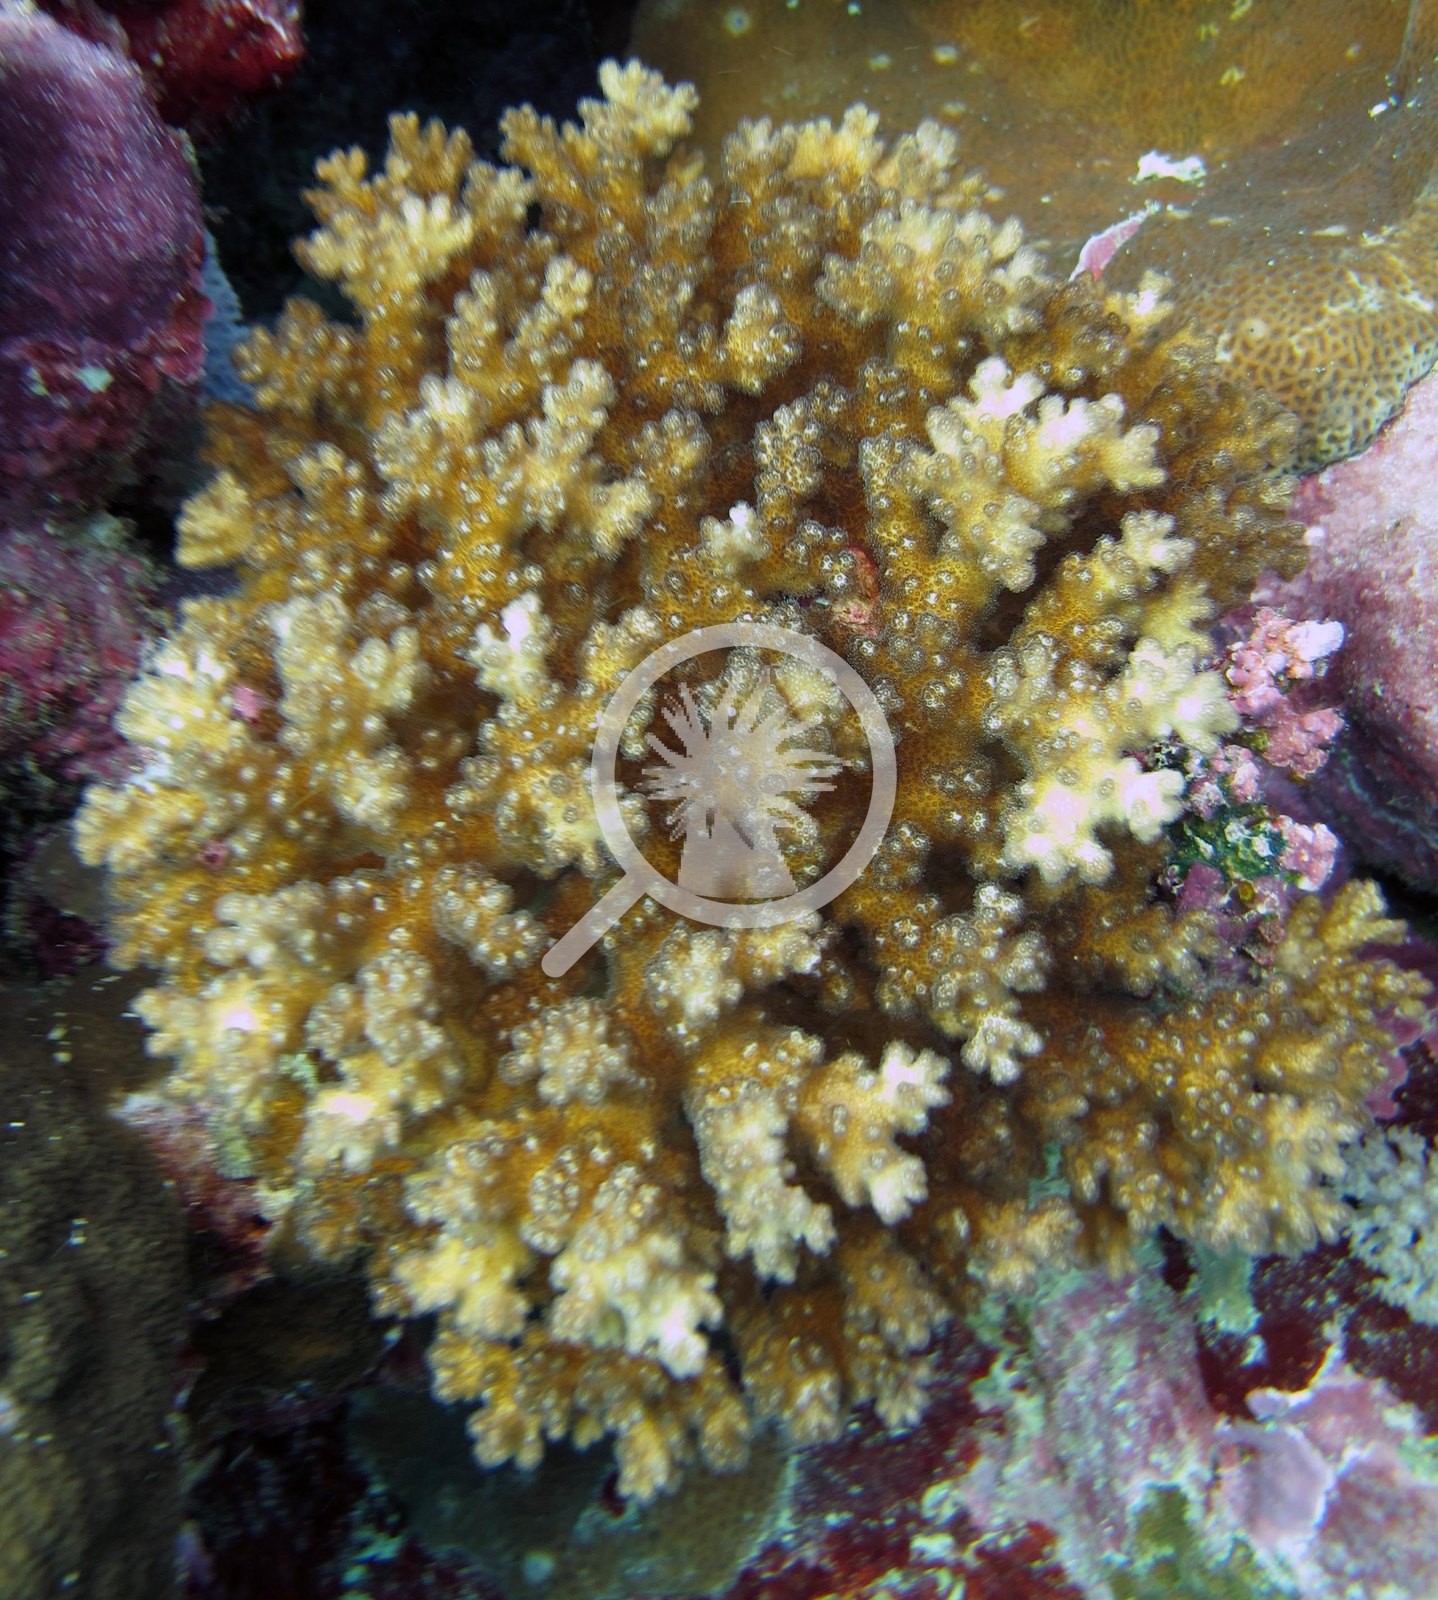
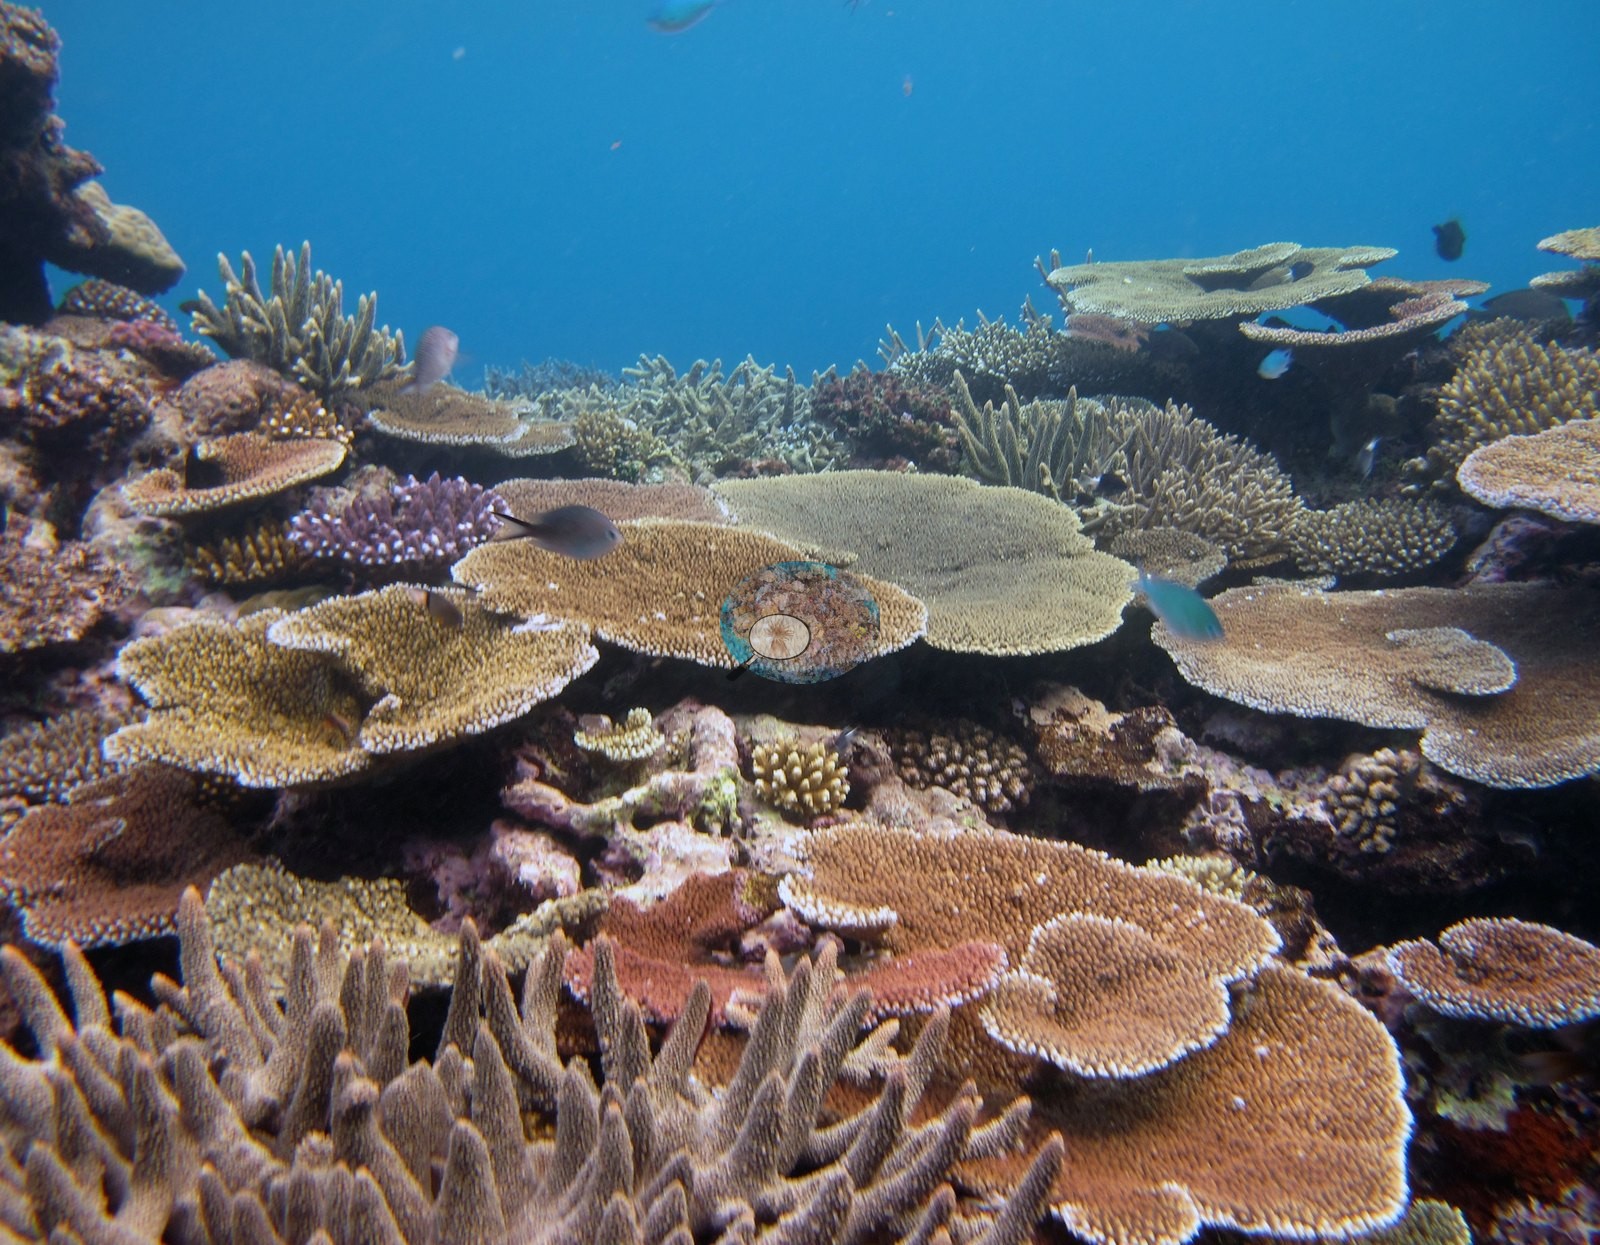
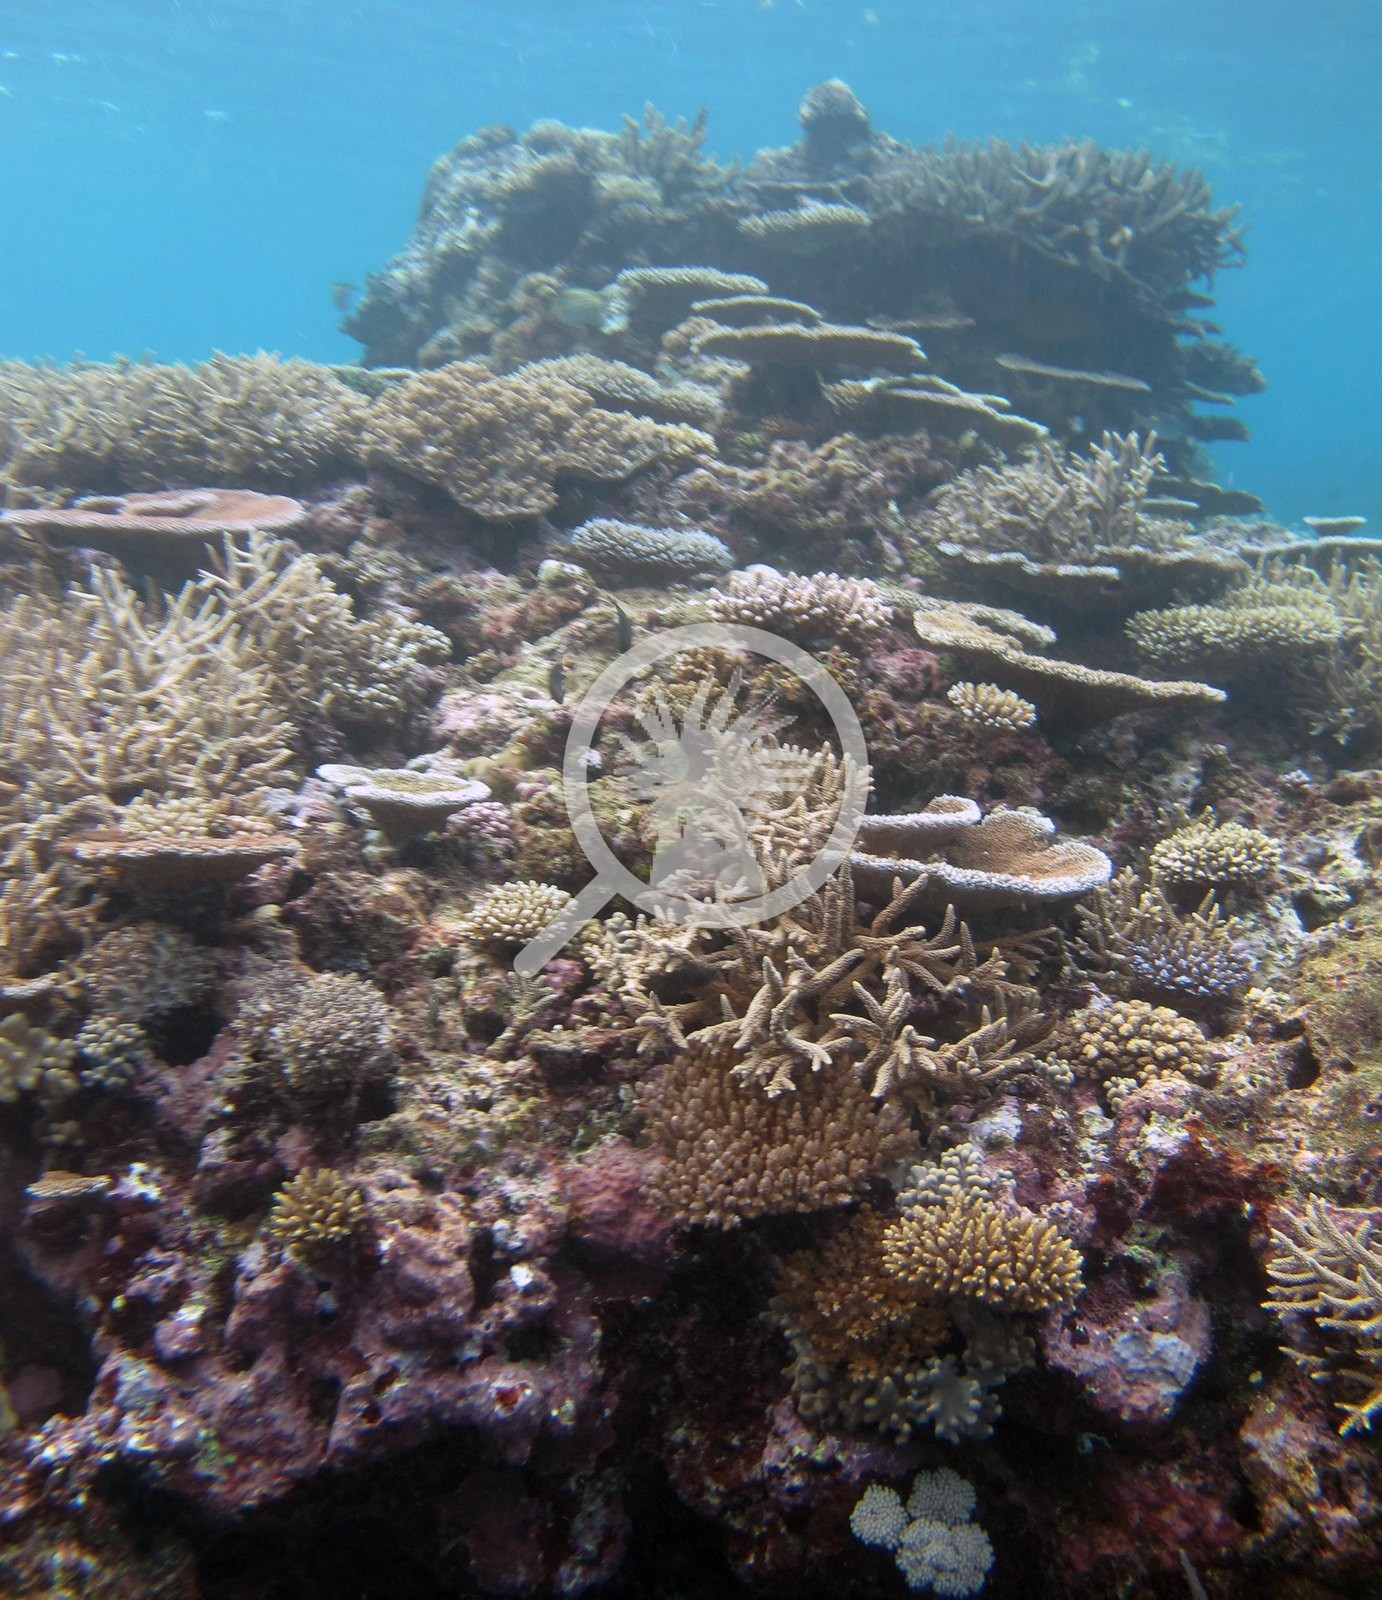
Around 15–20 m was the approximate distance between each build up. Acroporids and other branching corals were common on the tops of the build ups (e.g., Image 4).
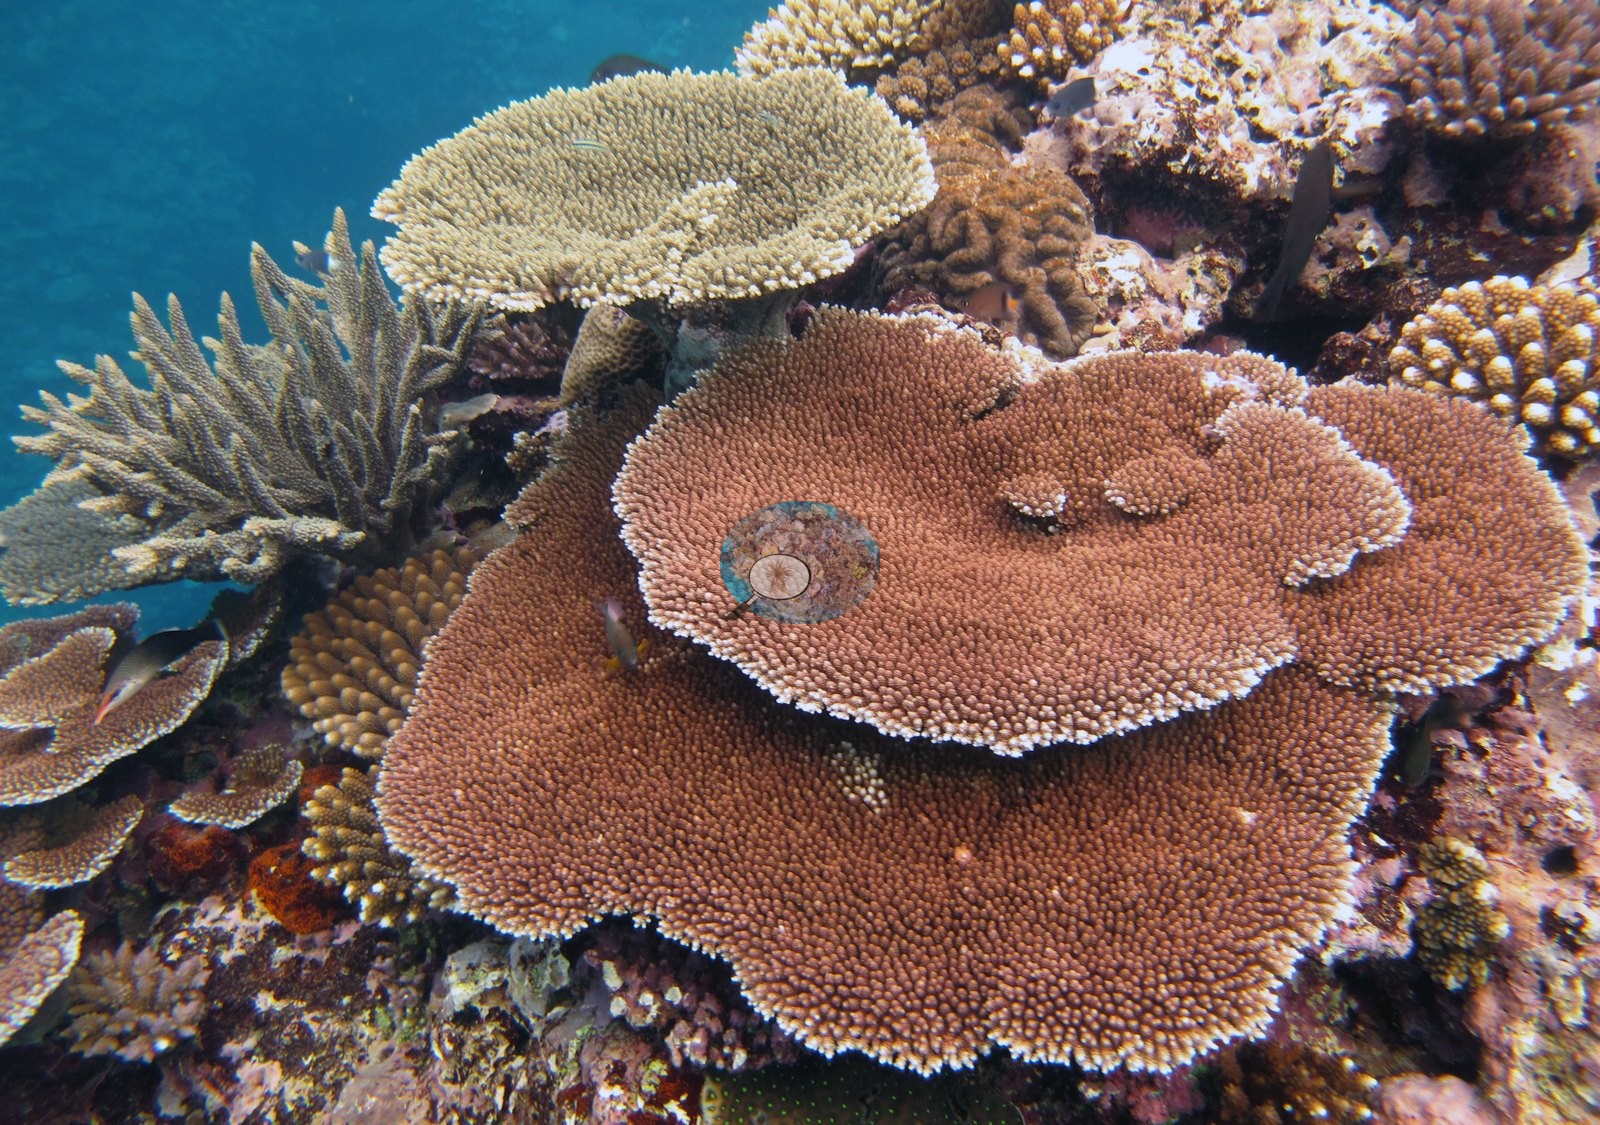
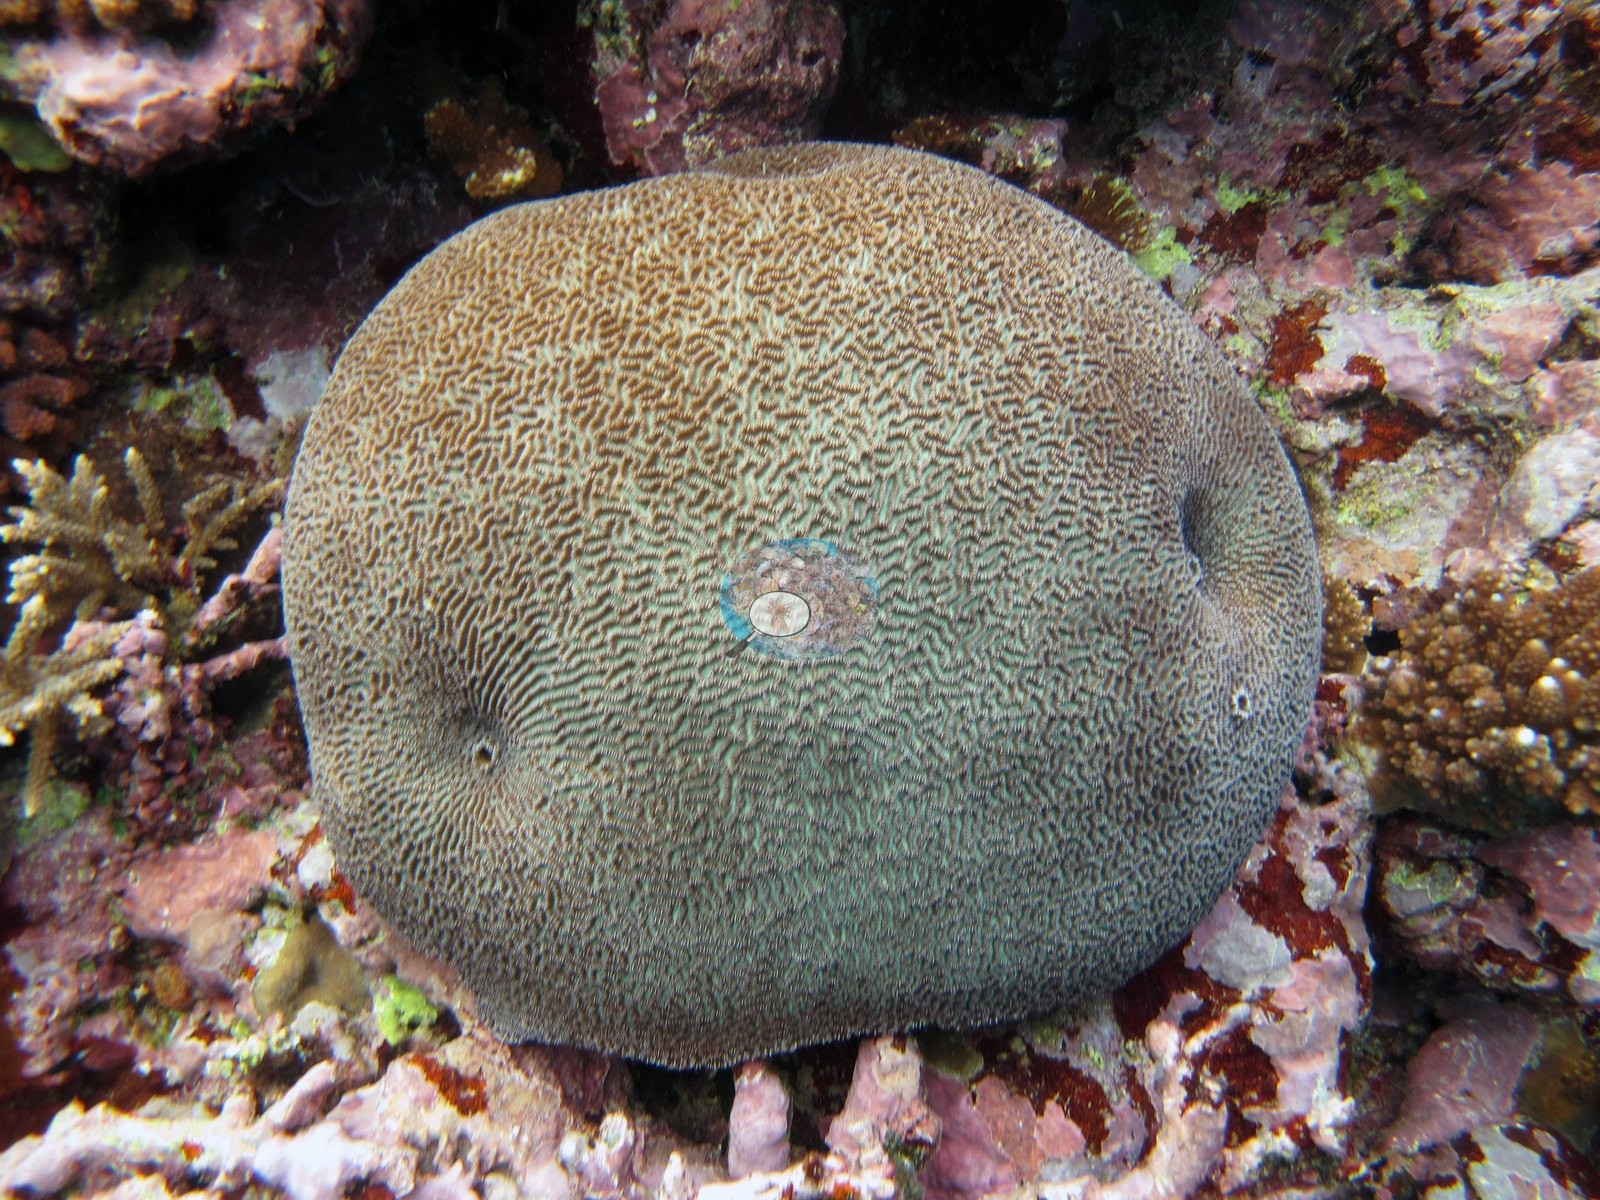
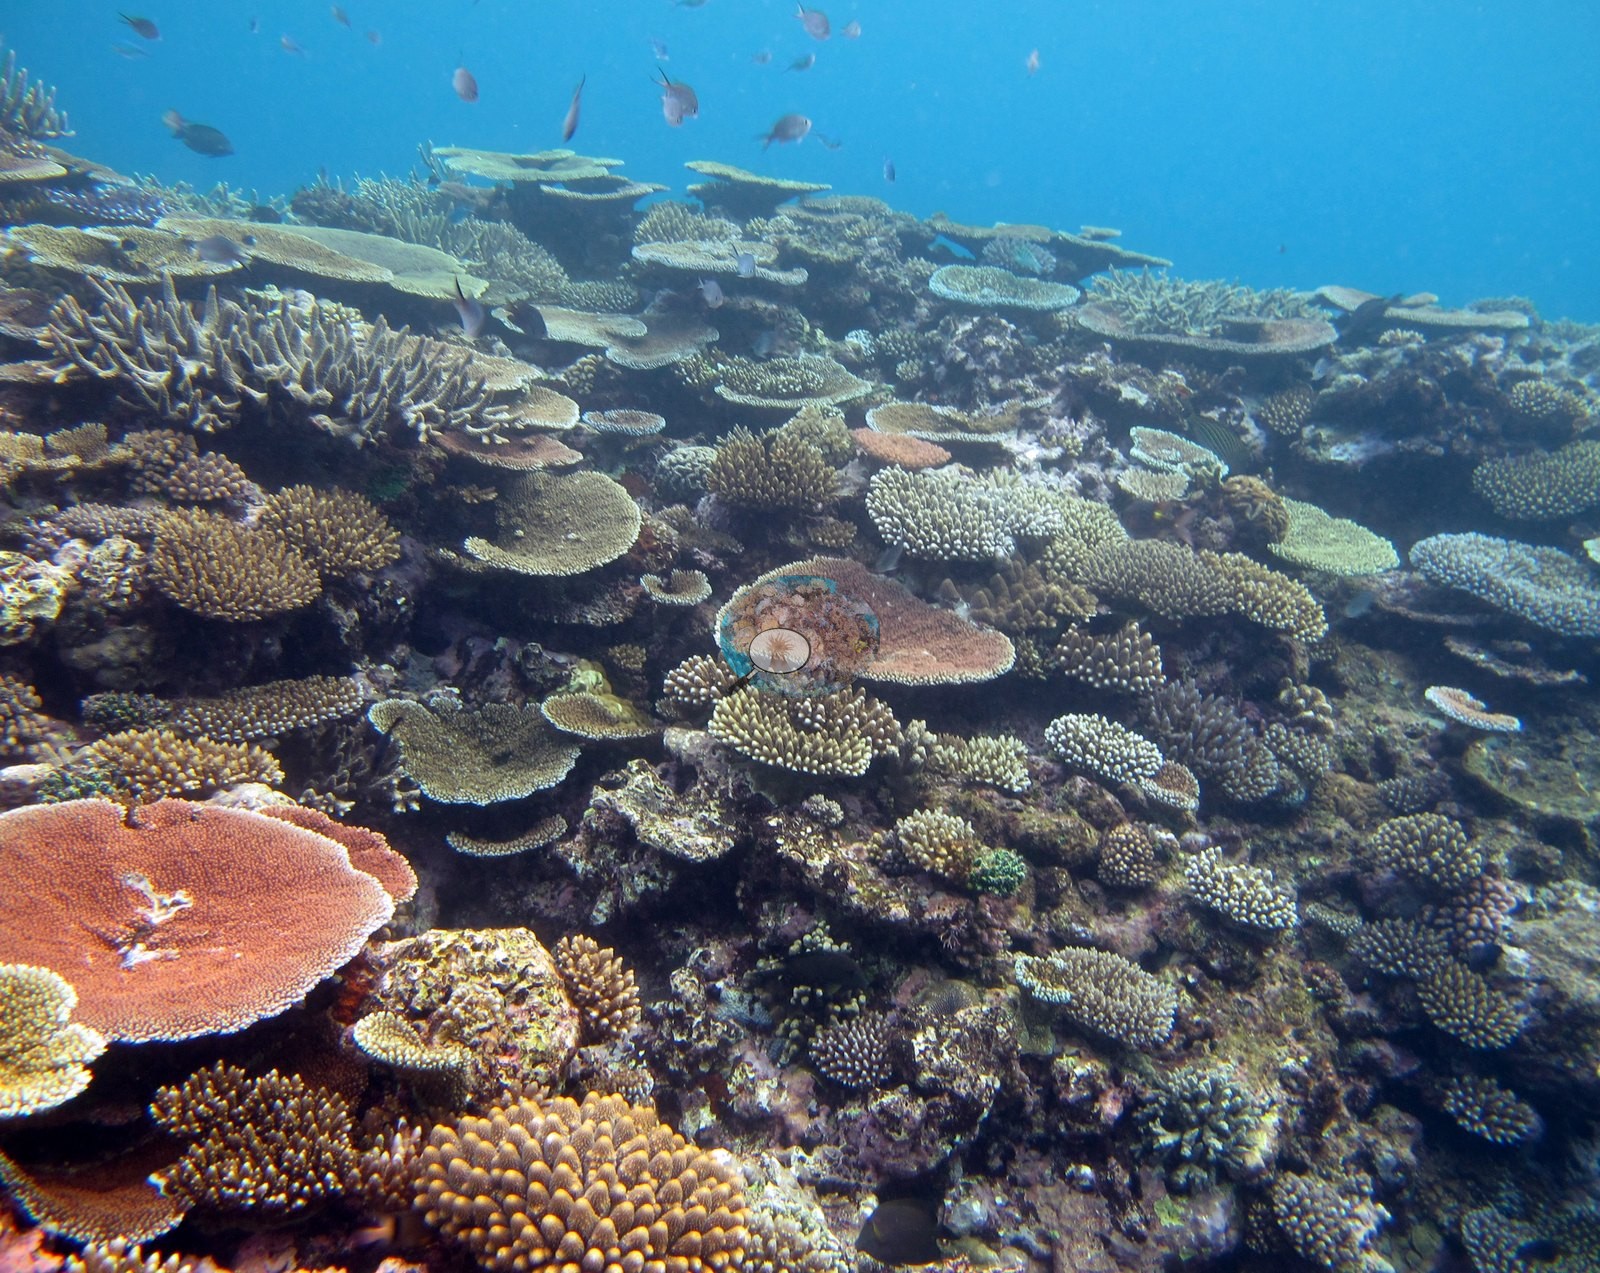
Down the slope, P. rus plates were common as well as stands of staghorn acroporids. On the fore reef terraces, a prominent spur and groove morphology was populated by small branching coral colonies with old mortality colonized by CCA. The survey team's notes for FJML17 and FJML18 add that Porites rus colonies populated the edges of the overhangs where large sand flats were located, often with old coral rubble that could be evidence of a storm surge event. Most of the corals were smaller in size around 45–60 cm in diameter. Large colonies of Porites and Diploastrea were common on the sides of the slope. Small colonies of Platygyra, Lobophyllia, and Echinopora were common.
Coral cover
- Reference: Khaled bin Sultan Living Oceans Foundation, Global Reef Expedition (in situ transect)
- Coral cover 37% (the expedition's in situ transects).
- Moderate to high coral cover was found on the tops of the build ups (e.g., Image 2, Image 5).
- At the terrace level, less coral cover and higher turf and CCA coverage.
- On the island's east side, coming up the slope from 32 m, coral cover was not very high, but CCA was common.
- Transect mean 37 ± 2.8% SE (n = 5 transects; Living Oceans Foundation per-transect benthic data); the headline above is this all-transect mean.
Stressors
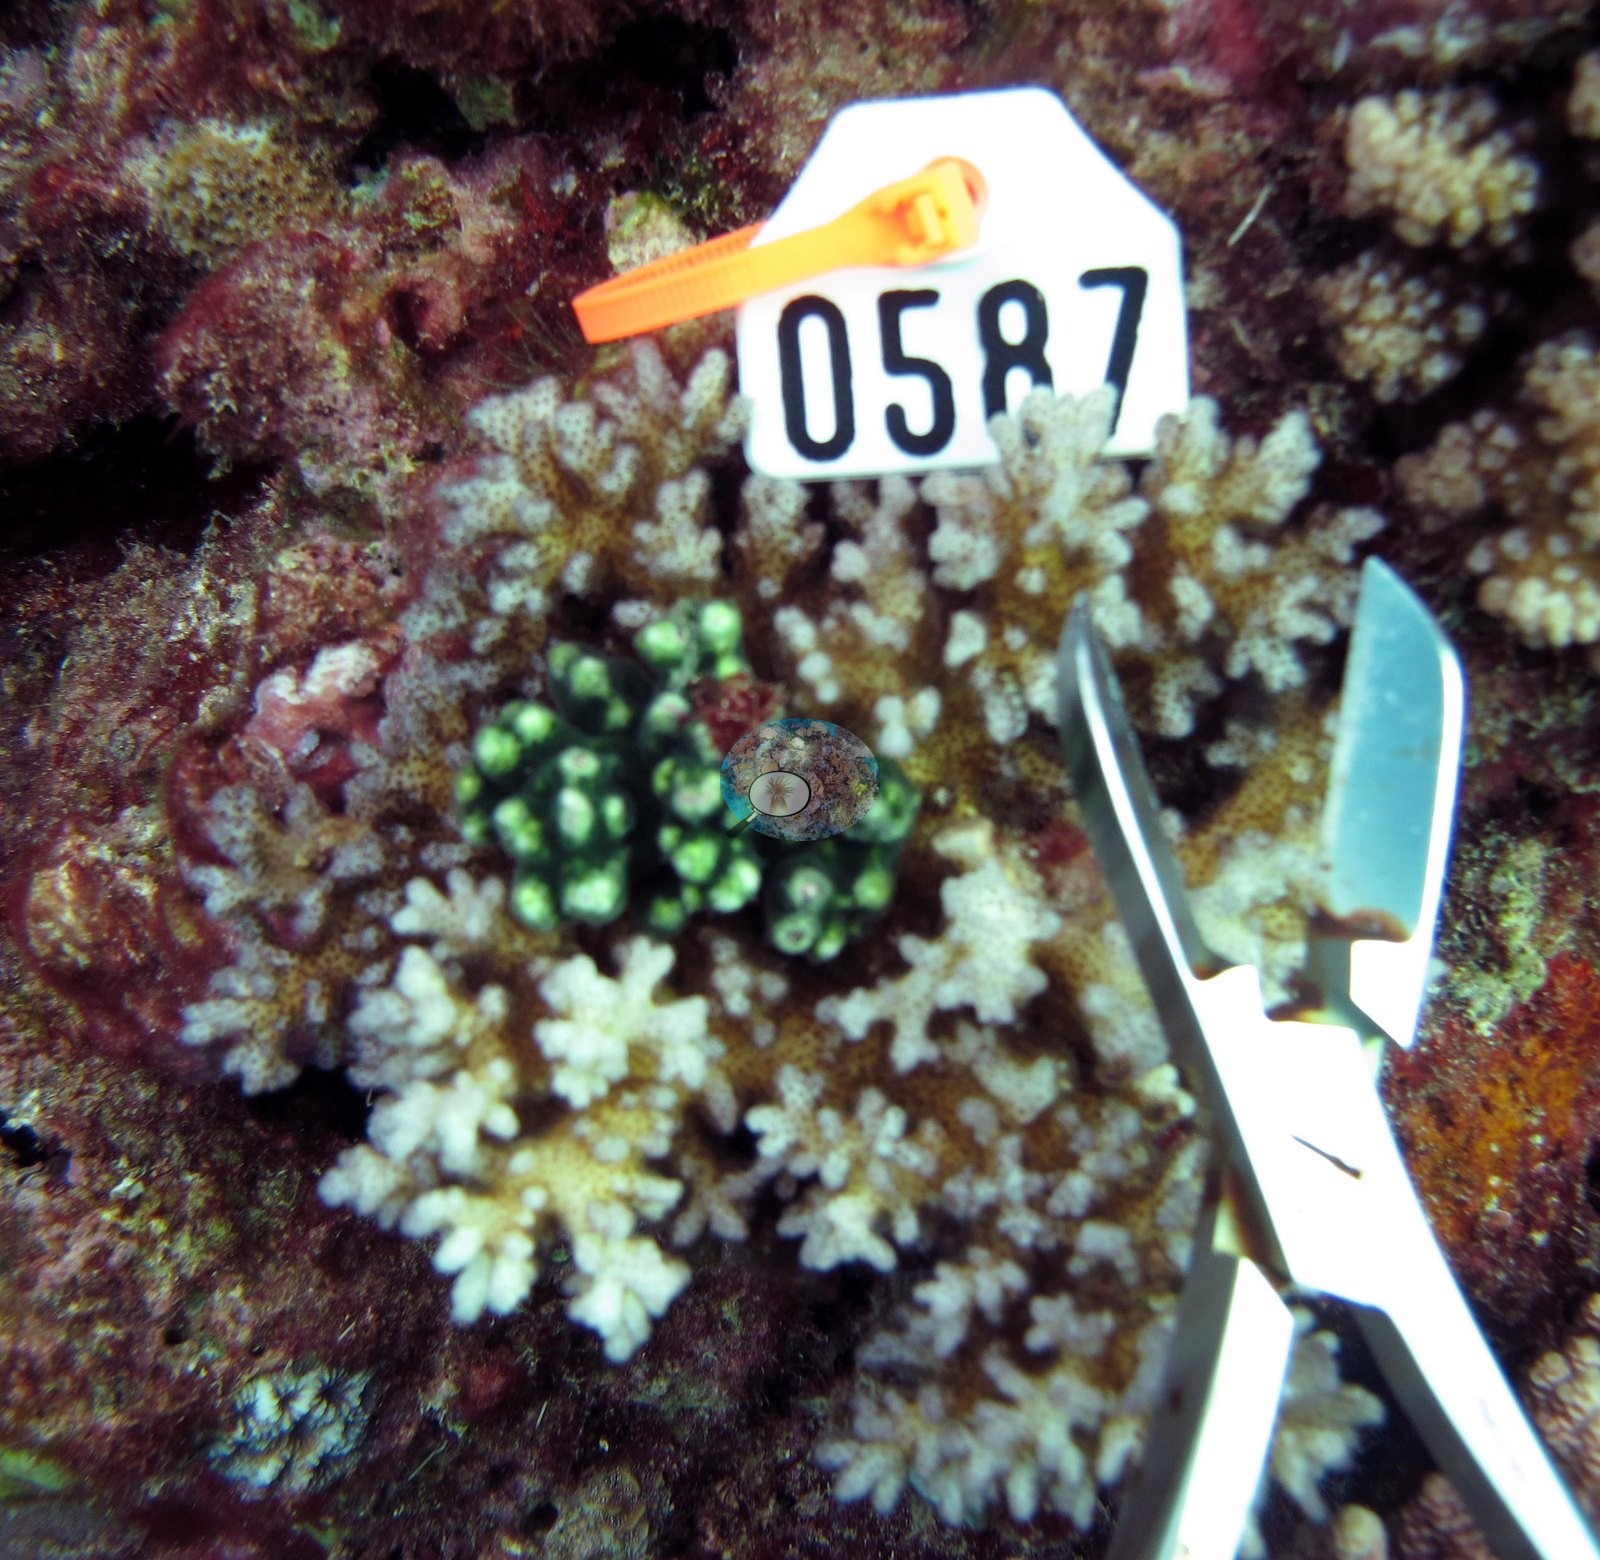
The one coral colony from this site with an outlier score was not flagged as a physiological outlier (Mayfield et al. 2017, PLoS ONE). The survey team's notes record some feeding scars on table and plating corals at FJML19 and FJML20, likely due to an increase in Culcita sea stars at the two sites. The Living Oceans Foundation transects here recorded 3.6% cyanobacteria and no recently dead coral.
Comparisons with other data
Apart from the Living Oceans Foundation survey shown here, we found no other surveys at this site as of 2026. If you would like to share yours, please email us.
Dive record
FJML20 (Moala, Lau Archipelago): surveyed 9 Jun 2013 during the Khaled bin Sultan Living Oceans Foundation Global Reef Expedition.
CV model comparison
More info
The photo row below is a methods comparison only: it is never averaged with the transect and never used as the headline. It compares site means only: the photos come from the same survey dive as the transect but not from the same points.| Method | Hard coral cover (%) | Photos (n) ± SE |
|---|---|---|
| Transect mean (all transects) | 36.8 | |
| CoralSCOP edited | 54.1* | n = 13 · SE 5.6 |
| Claude (edited photos) | 50.7* | n = 13 · SE 5.9 |
The two computer-vision methods agree within 3.4 pp (50.7–54.1%) and read 13.9–17.3 pp above the in-water transect (36.8%); the headline is the in-water transect because a diver transect is independent of the photographs.
*Based on only 13 reef-habitat photos; this estimate is less certain.
See a more detailed, stand-alone version of this table.
Data & links
- Download benthic survey data (CSV) ↗
- Download all LOF-GRE data (933 sites) ↗
- Photo portfolio ↗
- Coral Reef Diagnostics page for this area ↗
All images from Coral Reef Diagnostics. Data are from the Khaled bin Sultan Living Oceans Foundation Global Reef Expedition and Coral Reef Diagnostics.
 © Coral Reef Diagnostics.