
Tonga

Overview of 59 dive sites (50 with their own page). Figures are averages across the sites that report them (n = sites with a value); each site's own page has its individual values. Regional summaries: Ha'apai, Niuatoputapu, Vava'u.
⬇ Download this overview as a report card

Heat stress
Long-term record: 9 years from 1985 through 2025 reached 8 or more °C-weeks at NOAA’s Northern Tonga, Southern Tonga stations. Download the annual DHW data (CSV).
59 sites in this region — click a marker to open that site.
Overview
From 11 to 30 September 2013, the Khaled bin Sultan Living Oceans Foundation's Global Reef Expedition surveyed 59 stations in three island groups of Tonga: Ha'apai, Vava'u and, in the far north, Niuatoputapu. Tonga's islands run for more than 800 km along the convergent boundary of the Indo-Australian and Pacific plates, with the Tonga Trench to the east. Spalding et al. (2001) describe two parallel arcs: a western line of high volcanic islands, mostly too unstable for significant reef growth, and an eastern arc of islands built largely of reef material. Ha'apai is a complex scatter of reefs and low-lying islands in the middle of that eastern arc, and the Vava'u group anchors its northern end. Niuatoputapu lies far to the north, near Tafahi and the volcanic island of Niuafo'ou.
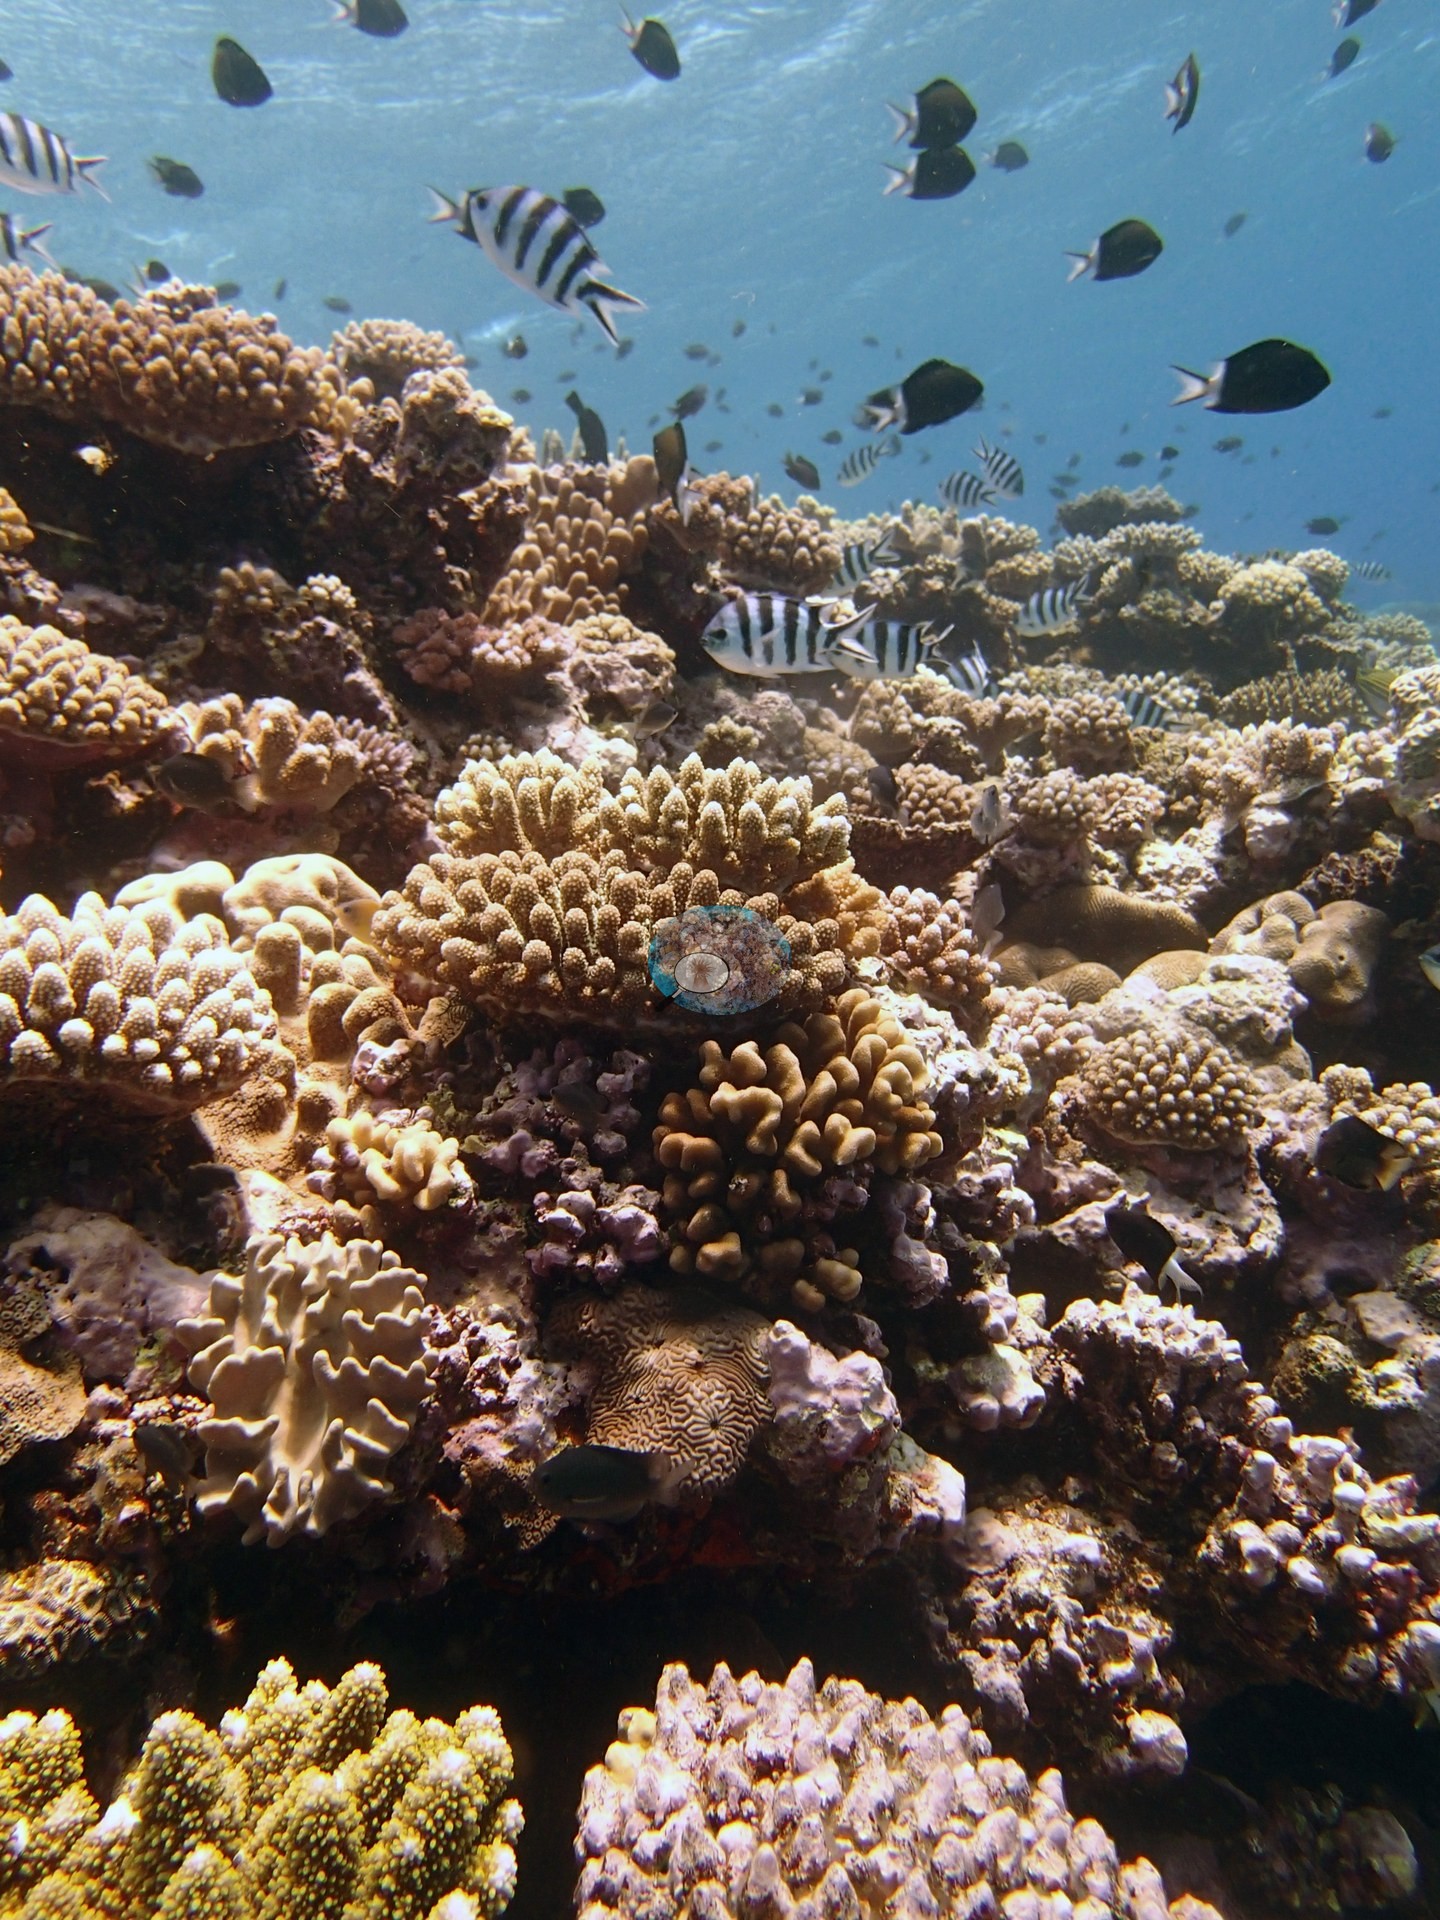
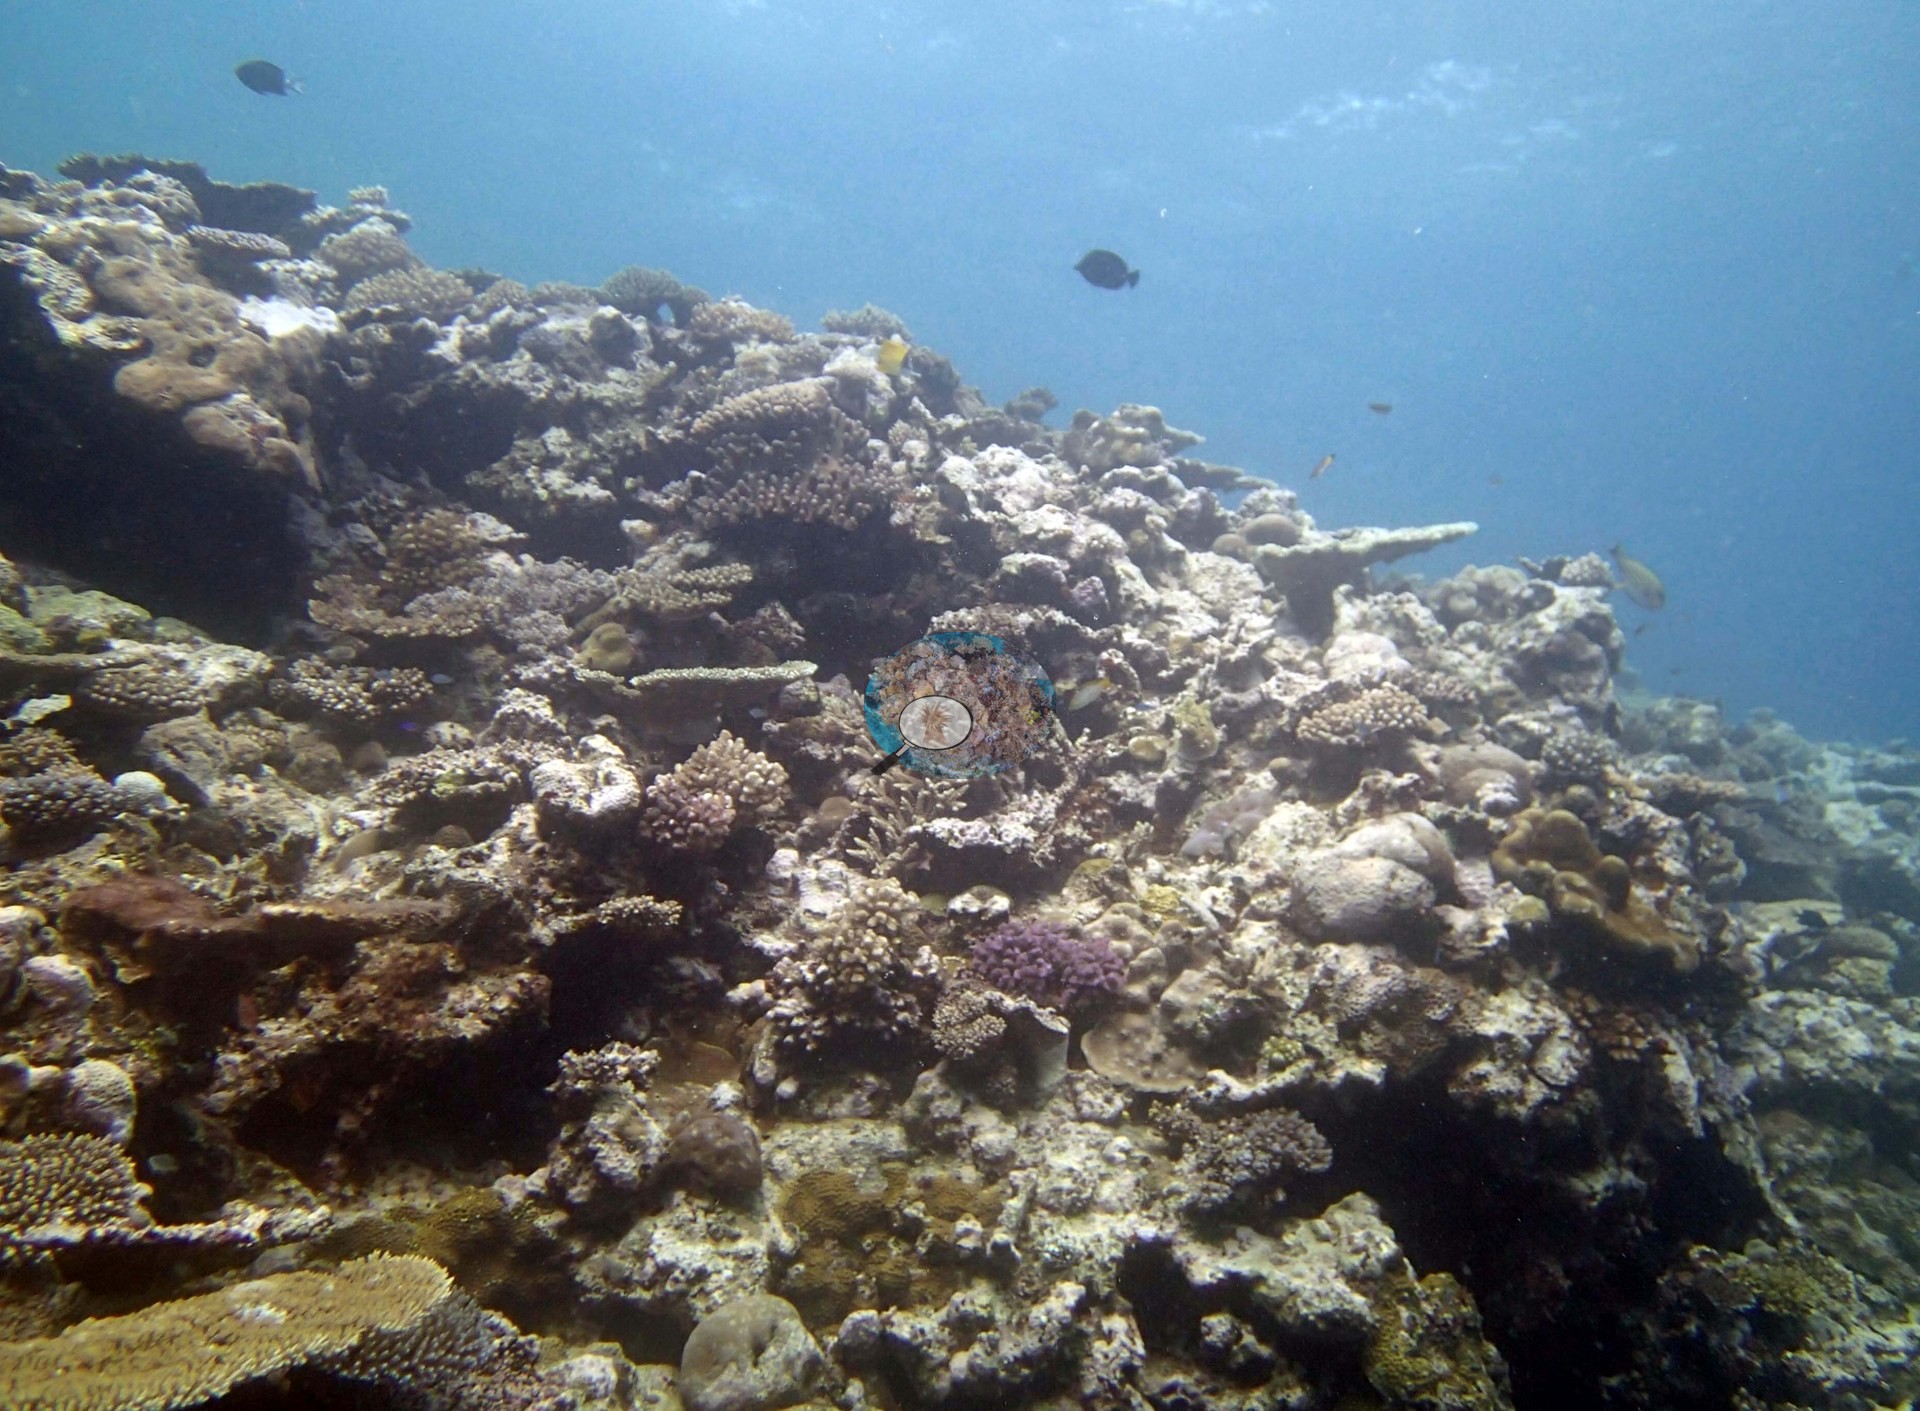
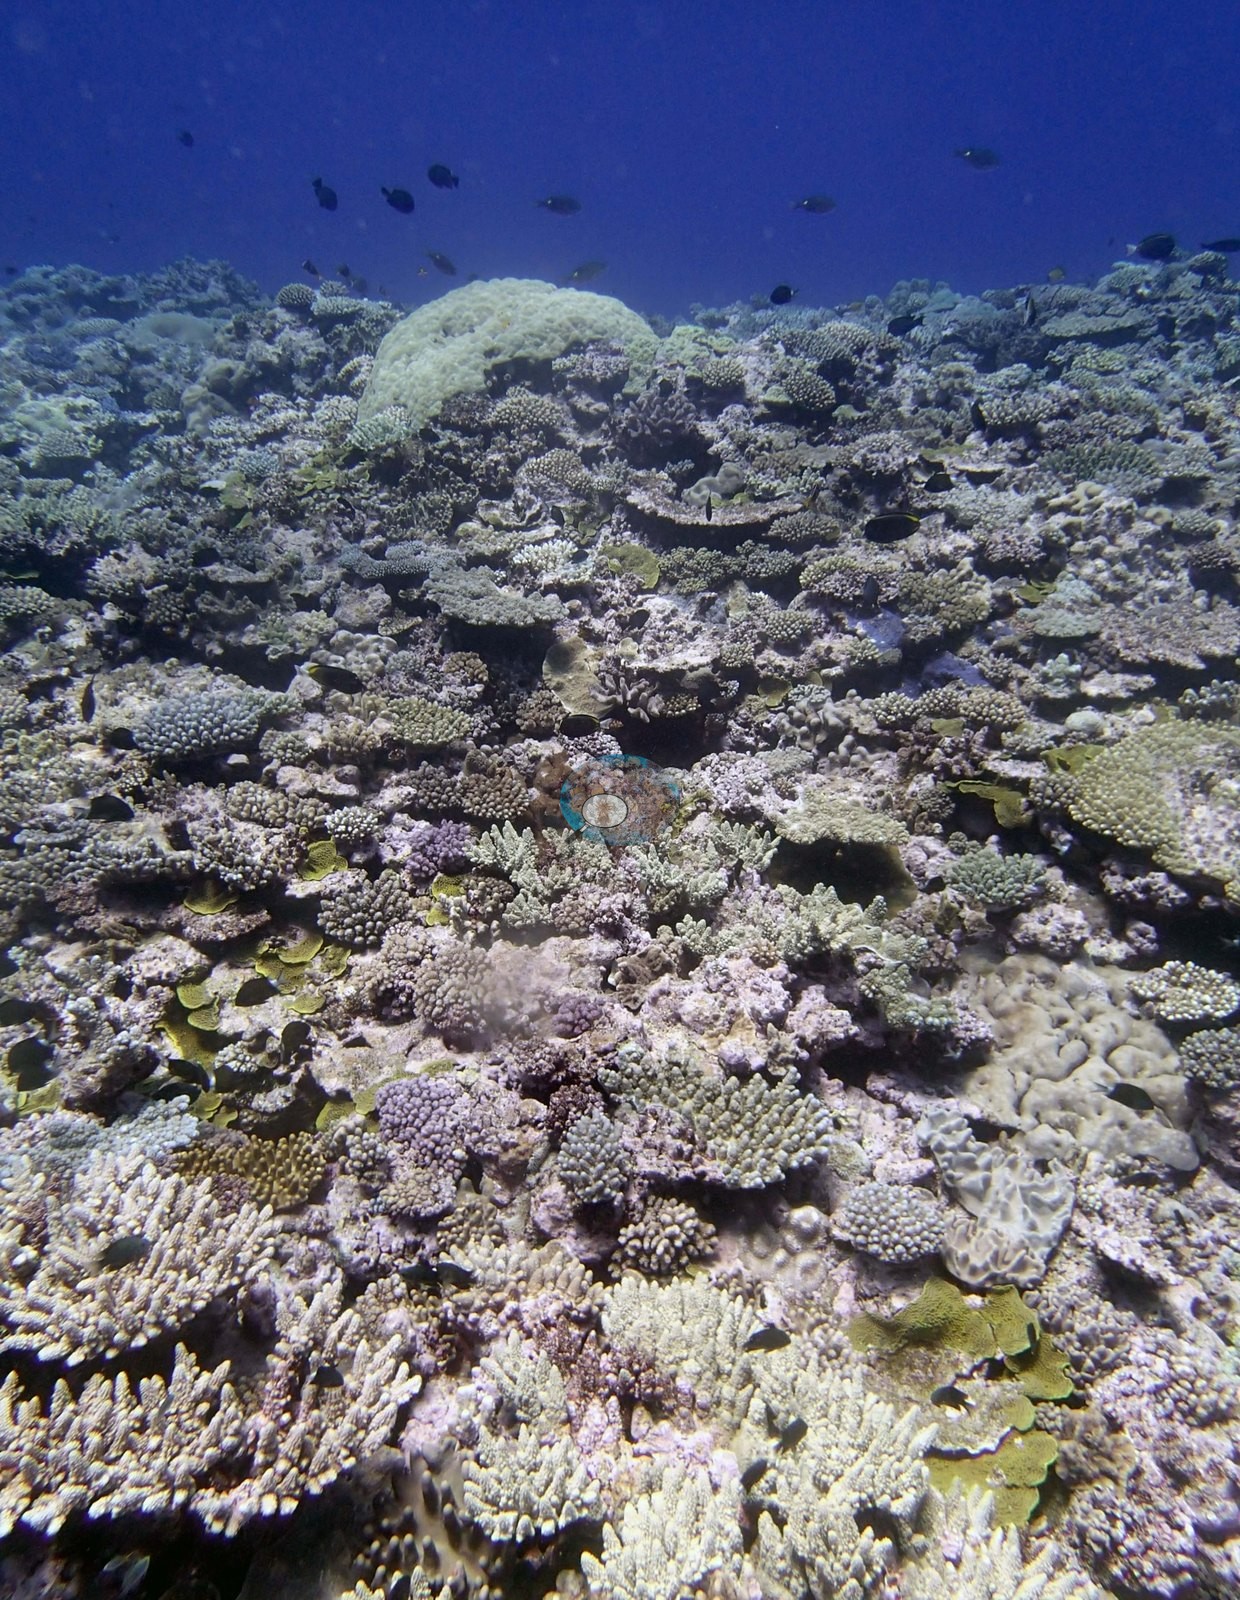
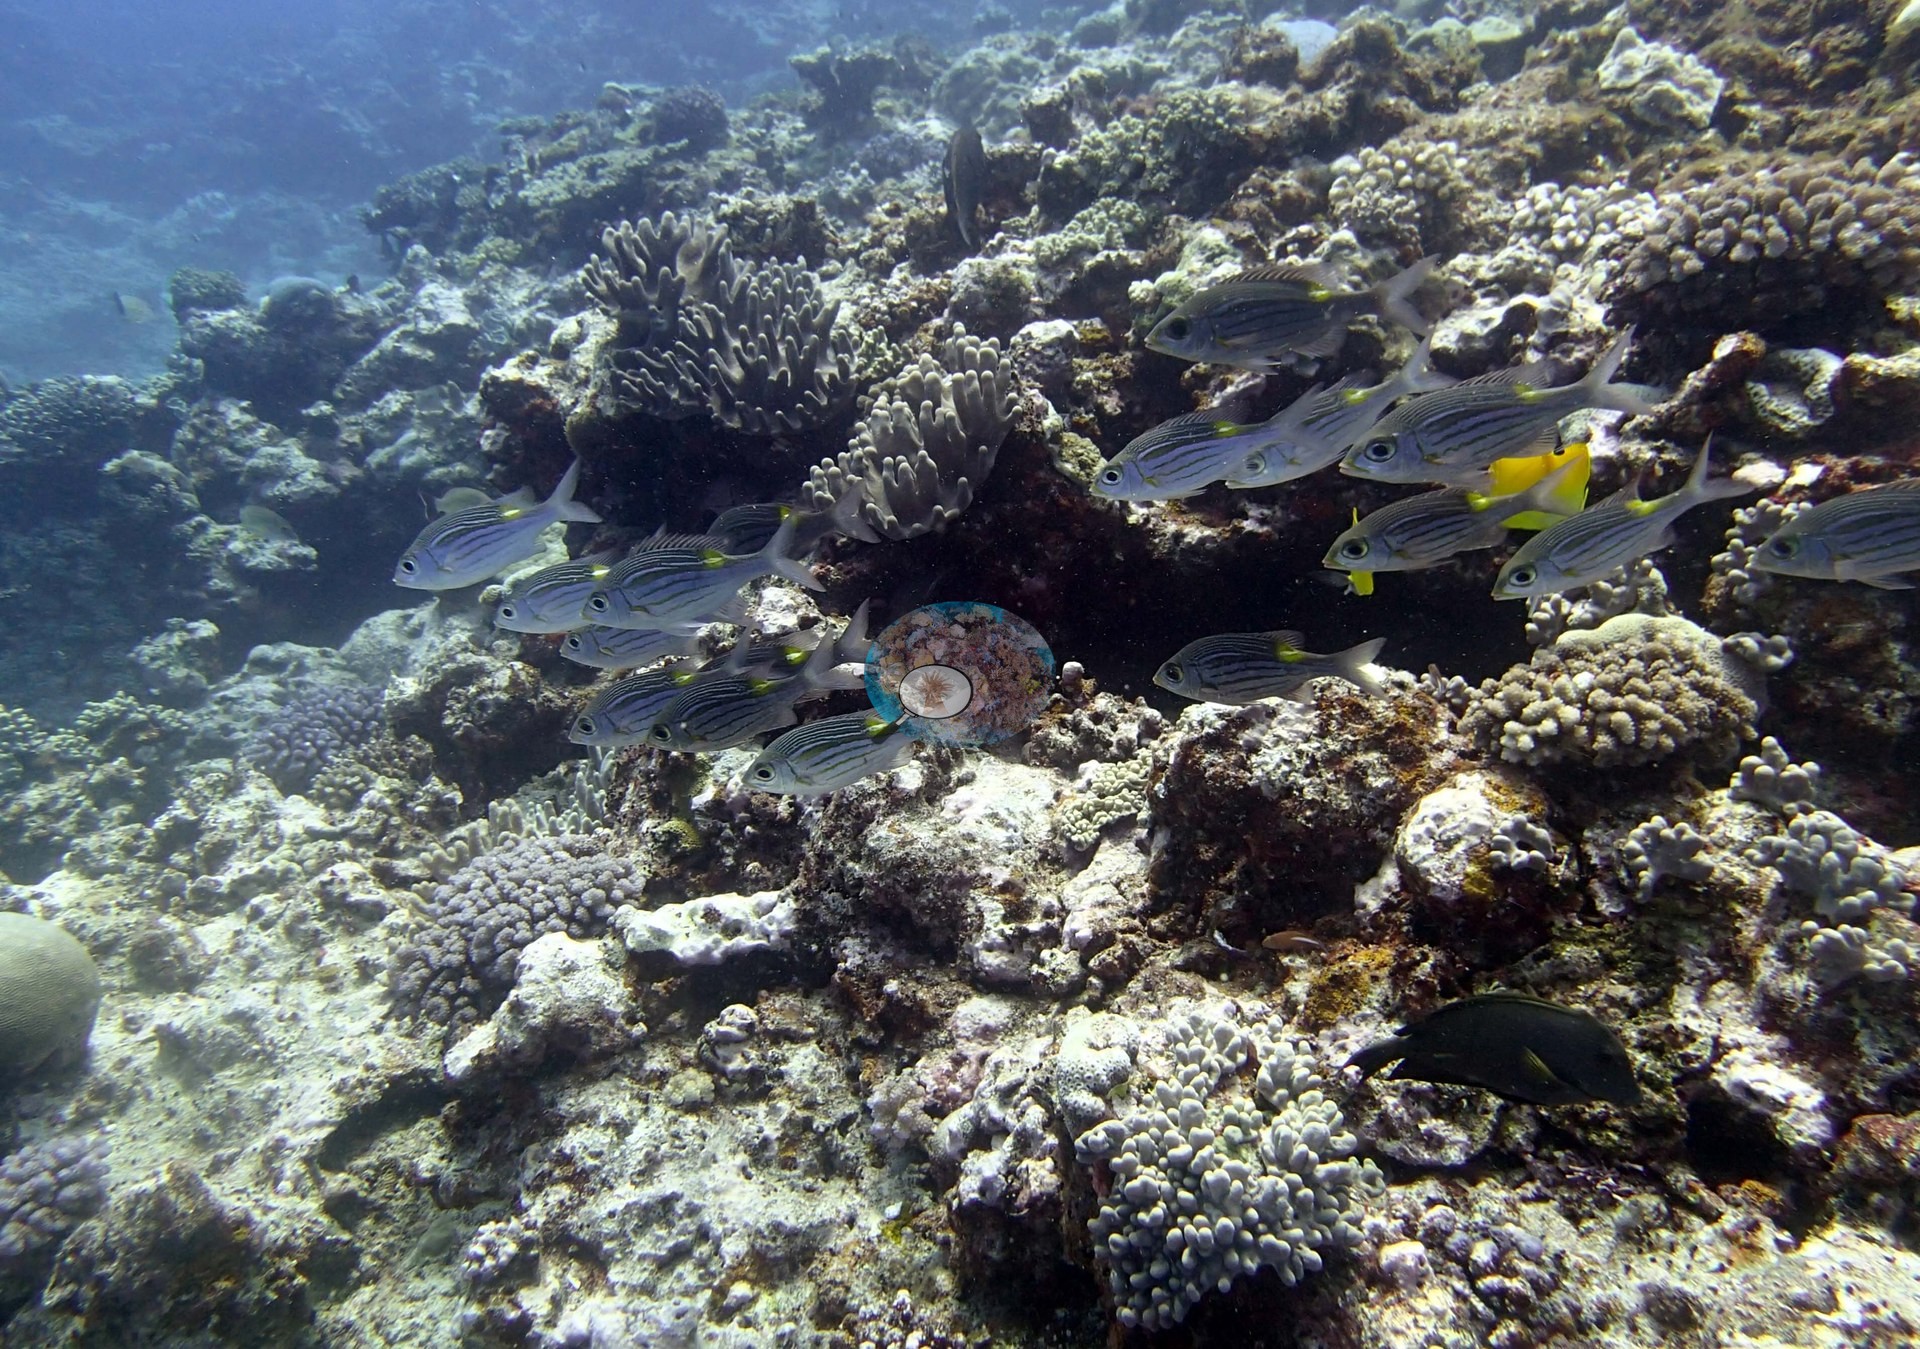
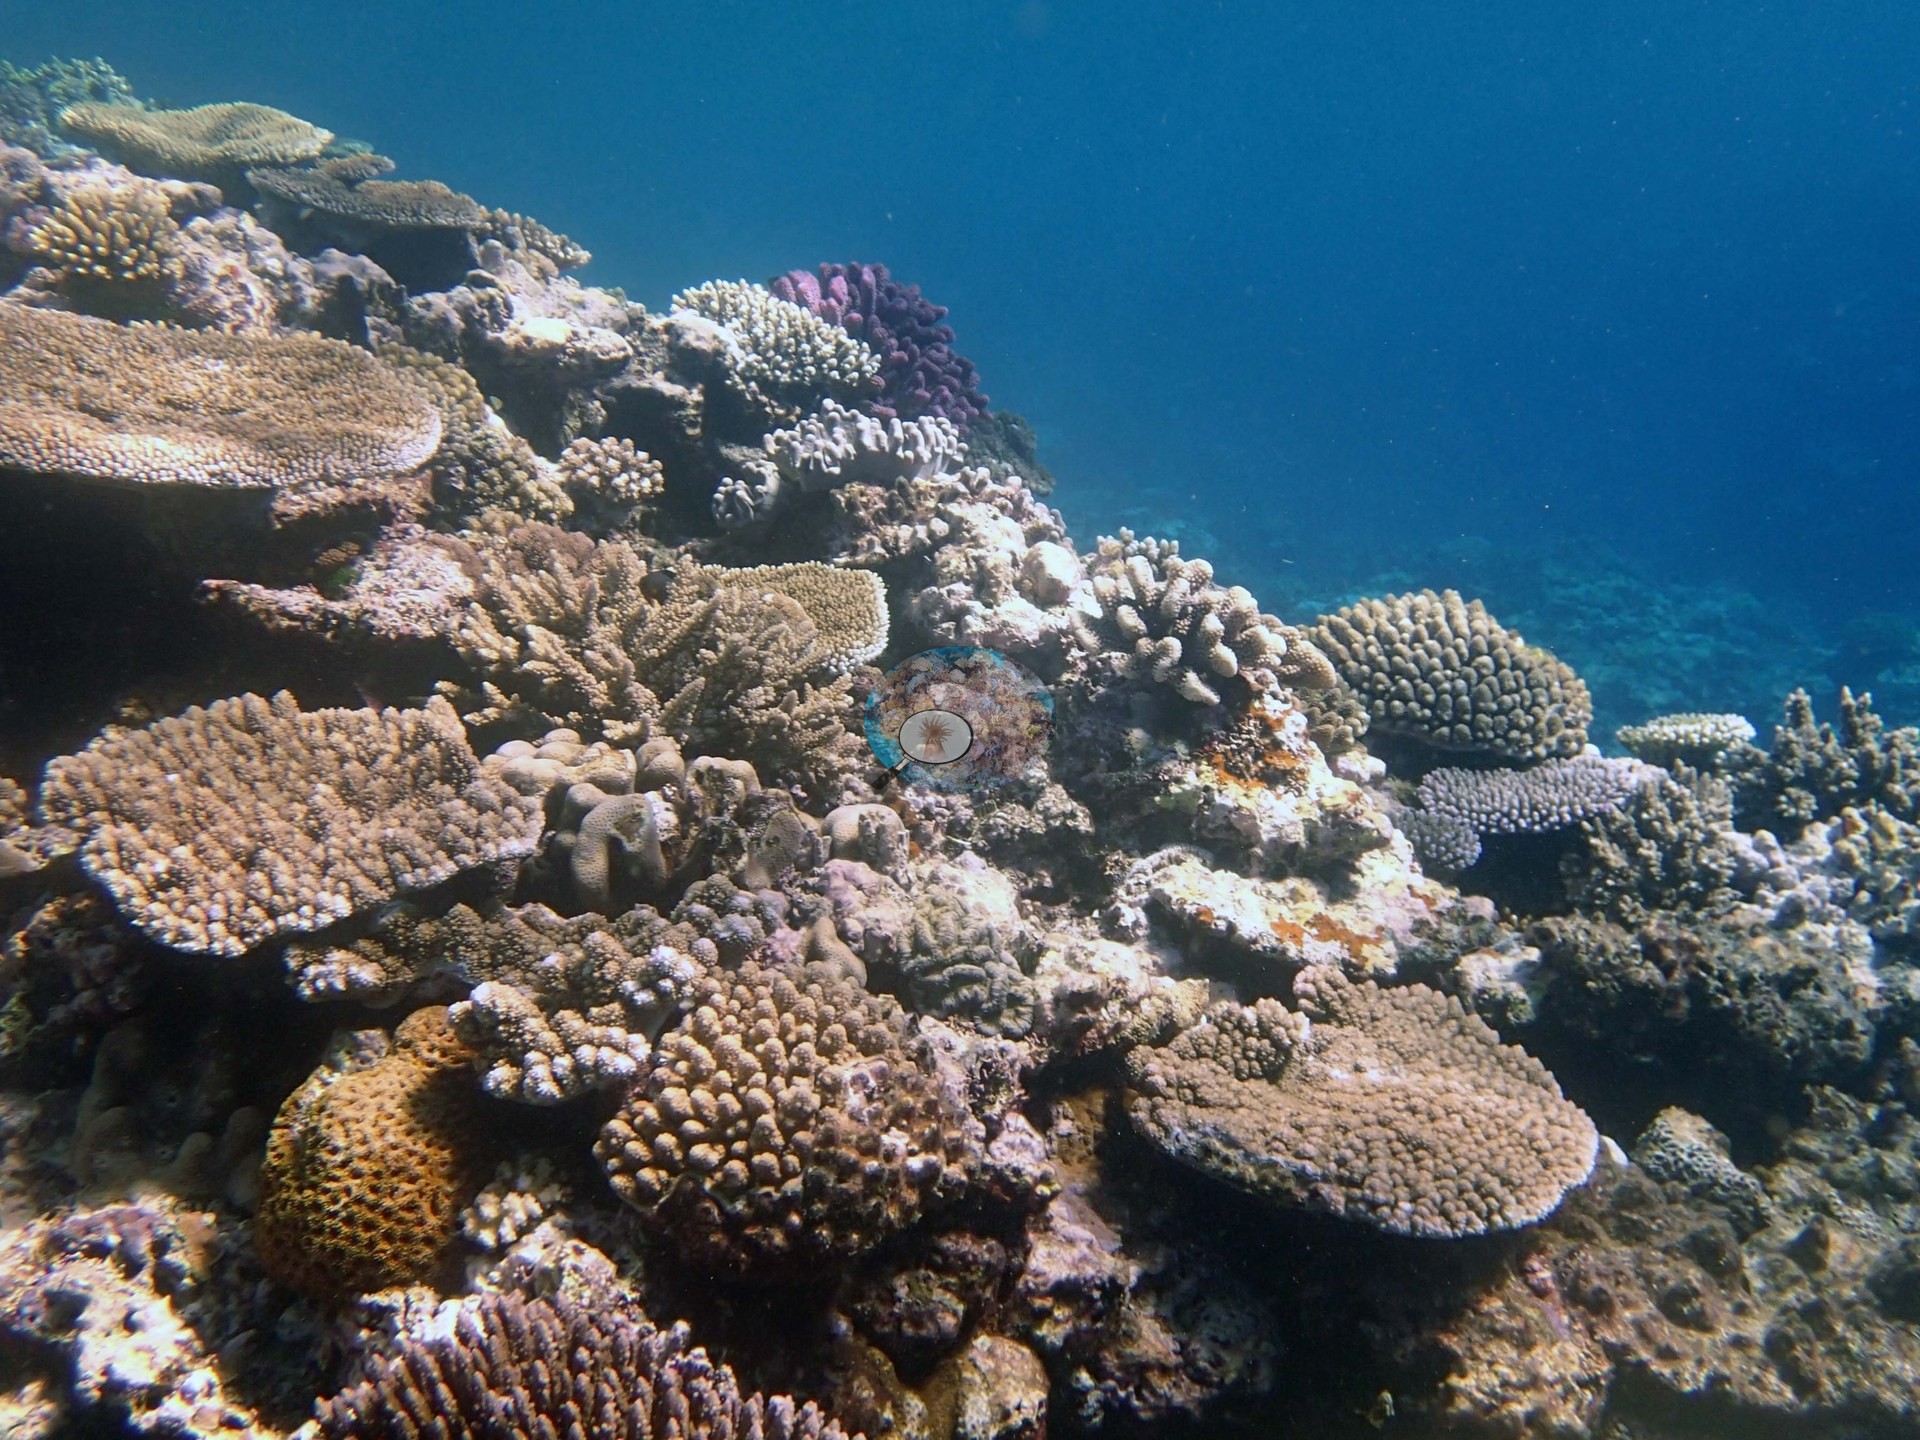
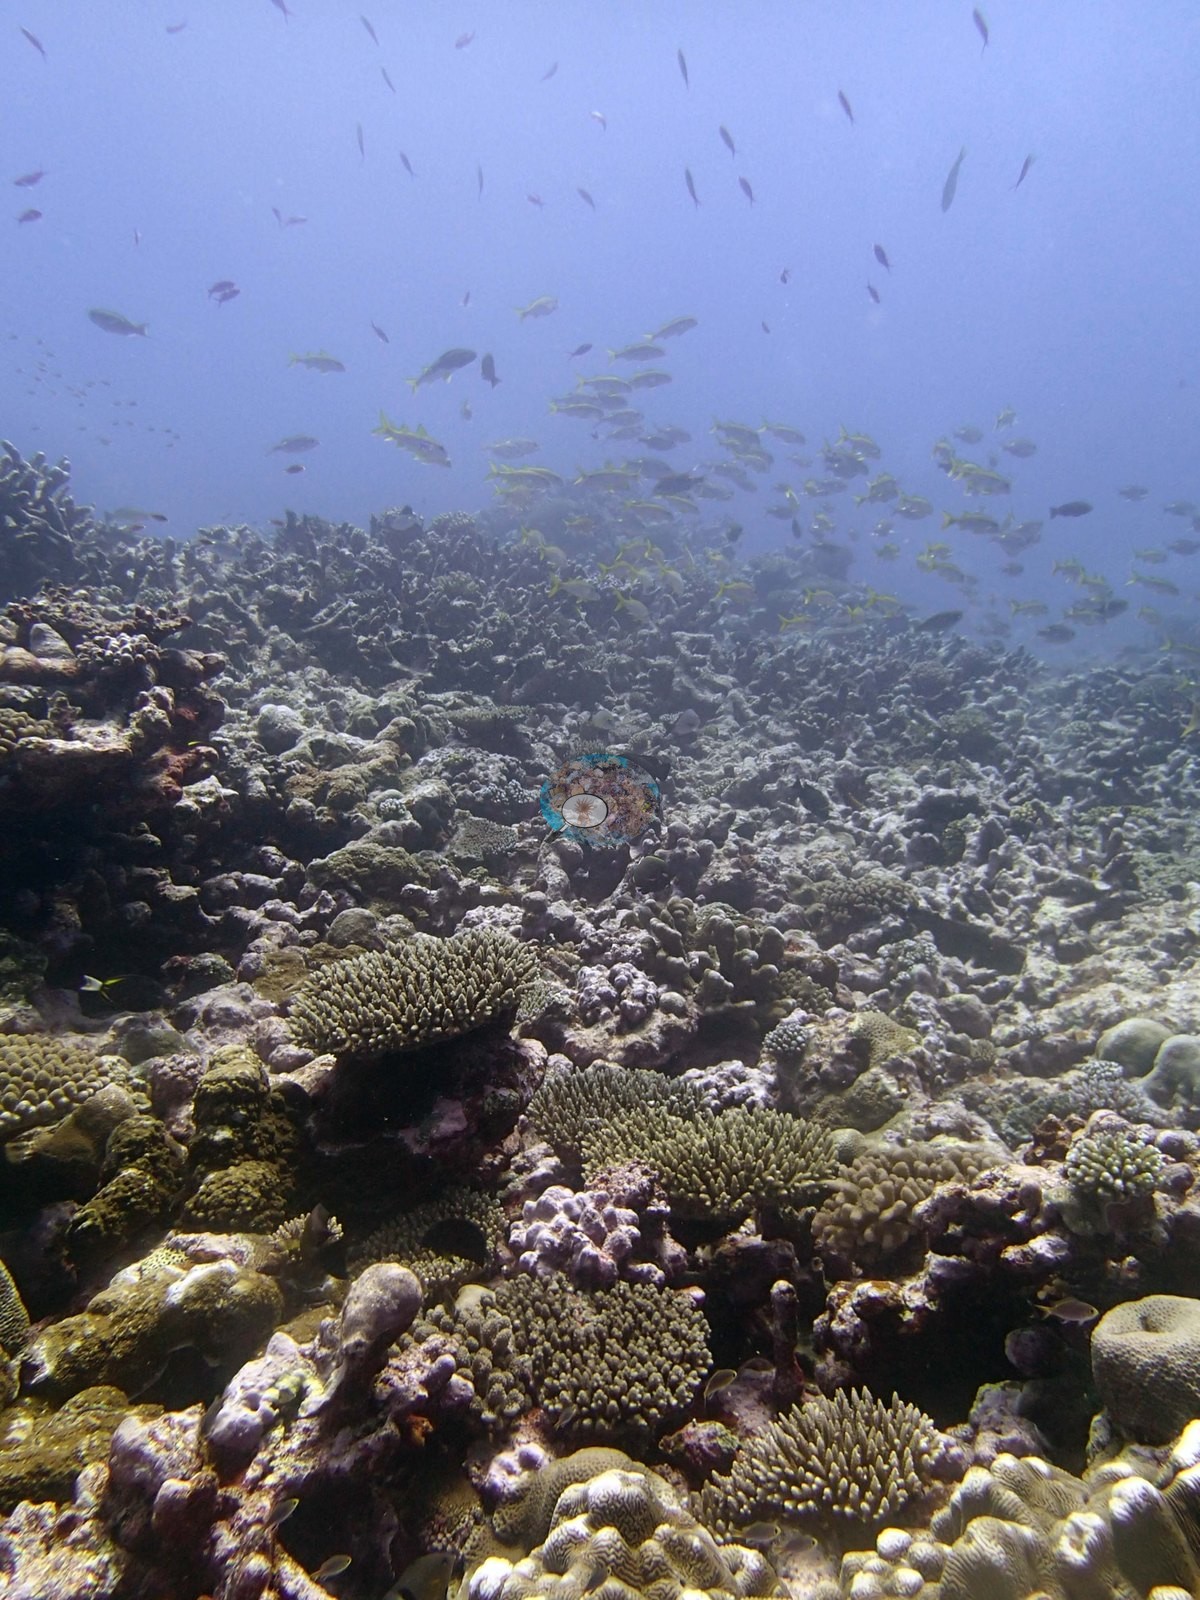
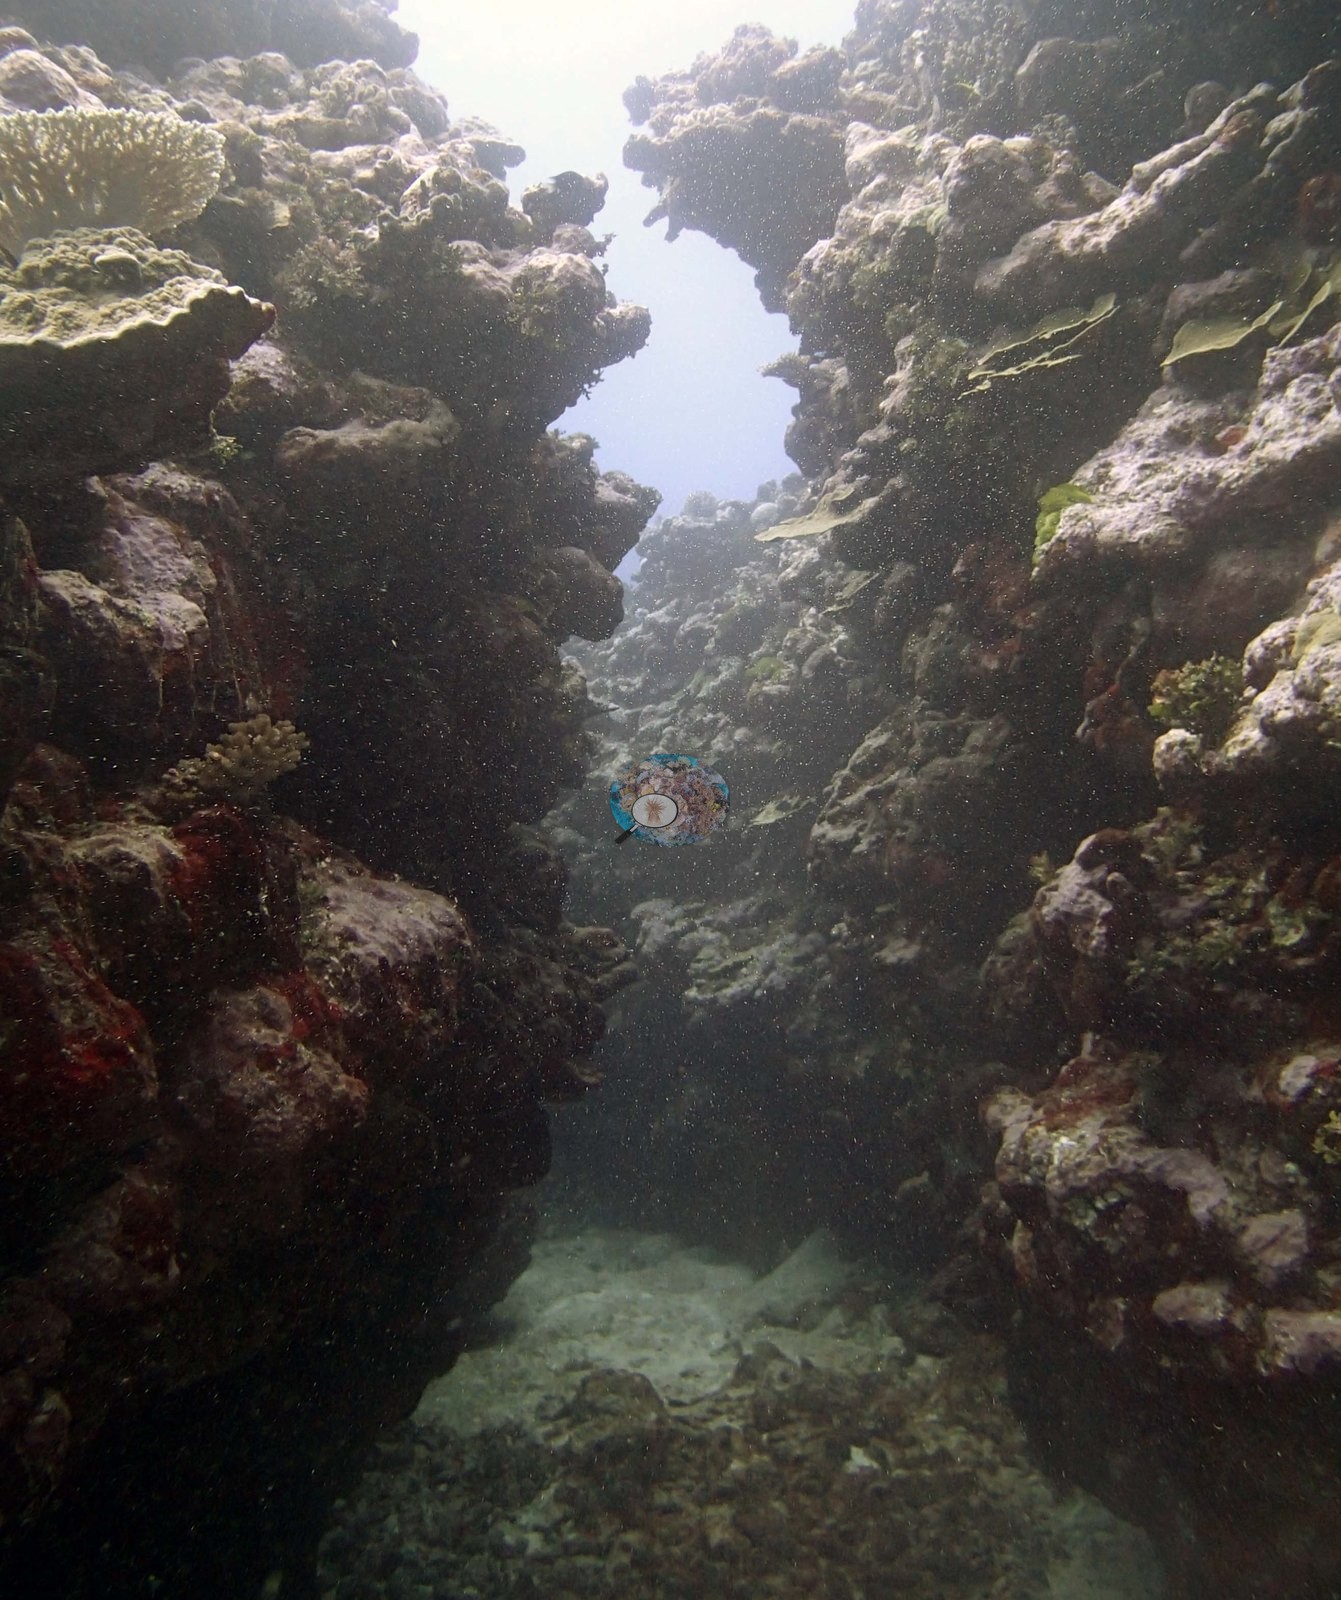
The expedition worked Ha'apai first (32 stations, 11-21 September), then Vava'u (21 stations, 22-28 September) and Niuatoputapu (6 stations, 29-30 September). Maximum depths dived ran from 13.1 m at TOHA07 in Ha'apai to 32.9 m at TONI54 on Niuatoputapu. Ha'apai's reefs are built around large shallow mounds and spurs separated by sand and rubble channels, along with lagoonal patch reefs and a barrier fore reef. Vava'u adds sheltered lagoon reefs, channel entrances, fore reefs below uplifted cliffs, caves, and a steep pinnacle wall. Niuatoputapu's fringing and barrier reefs have modest relief.
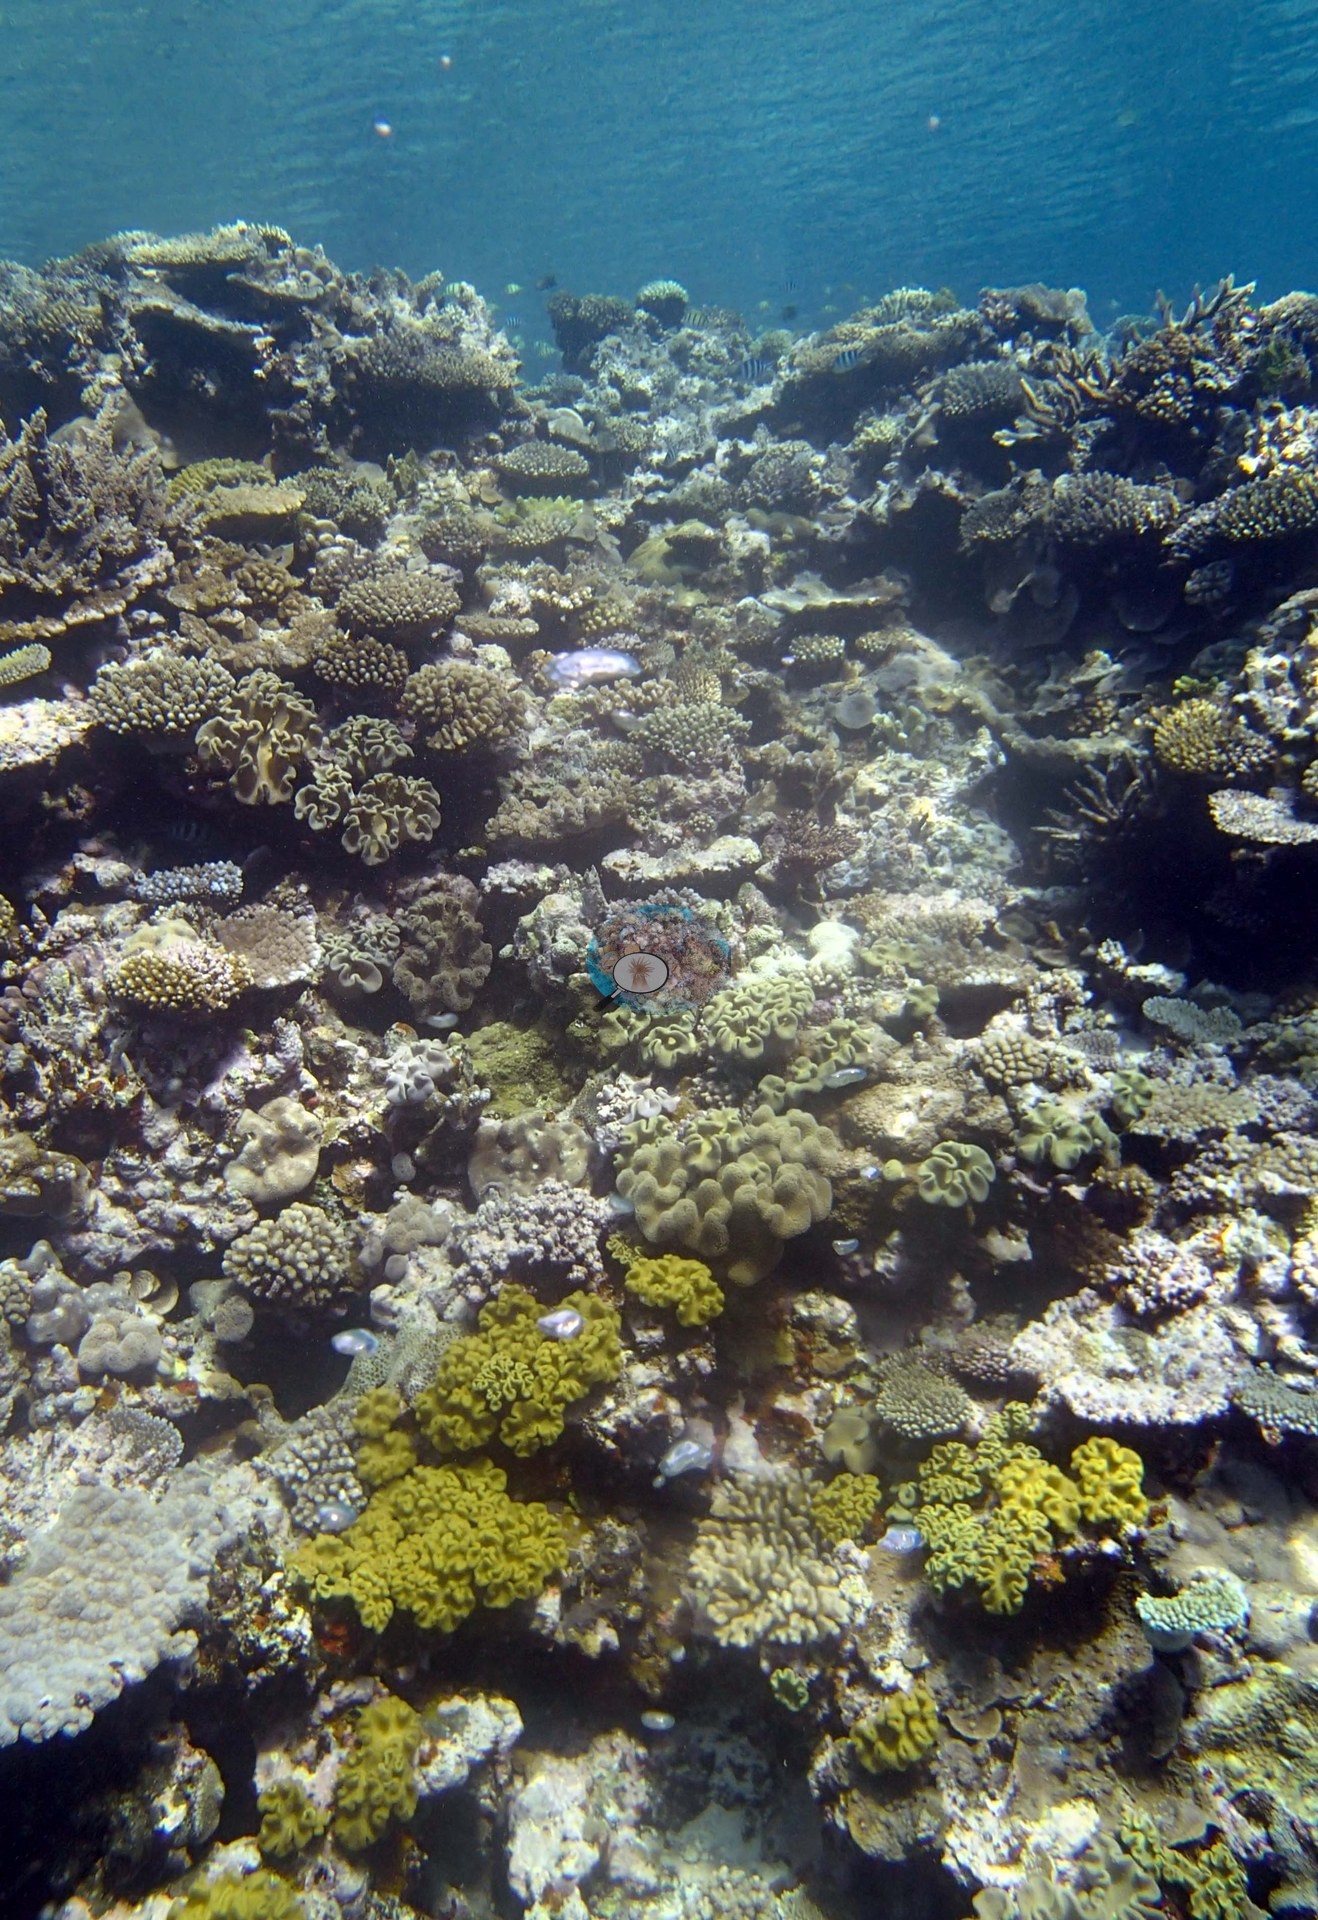
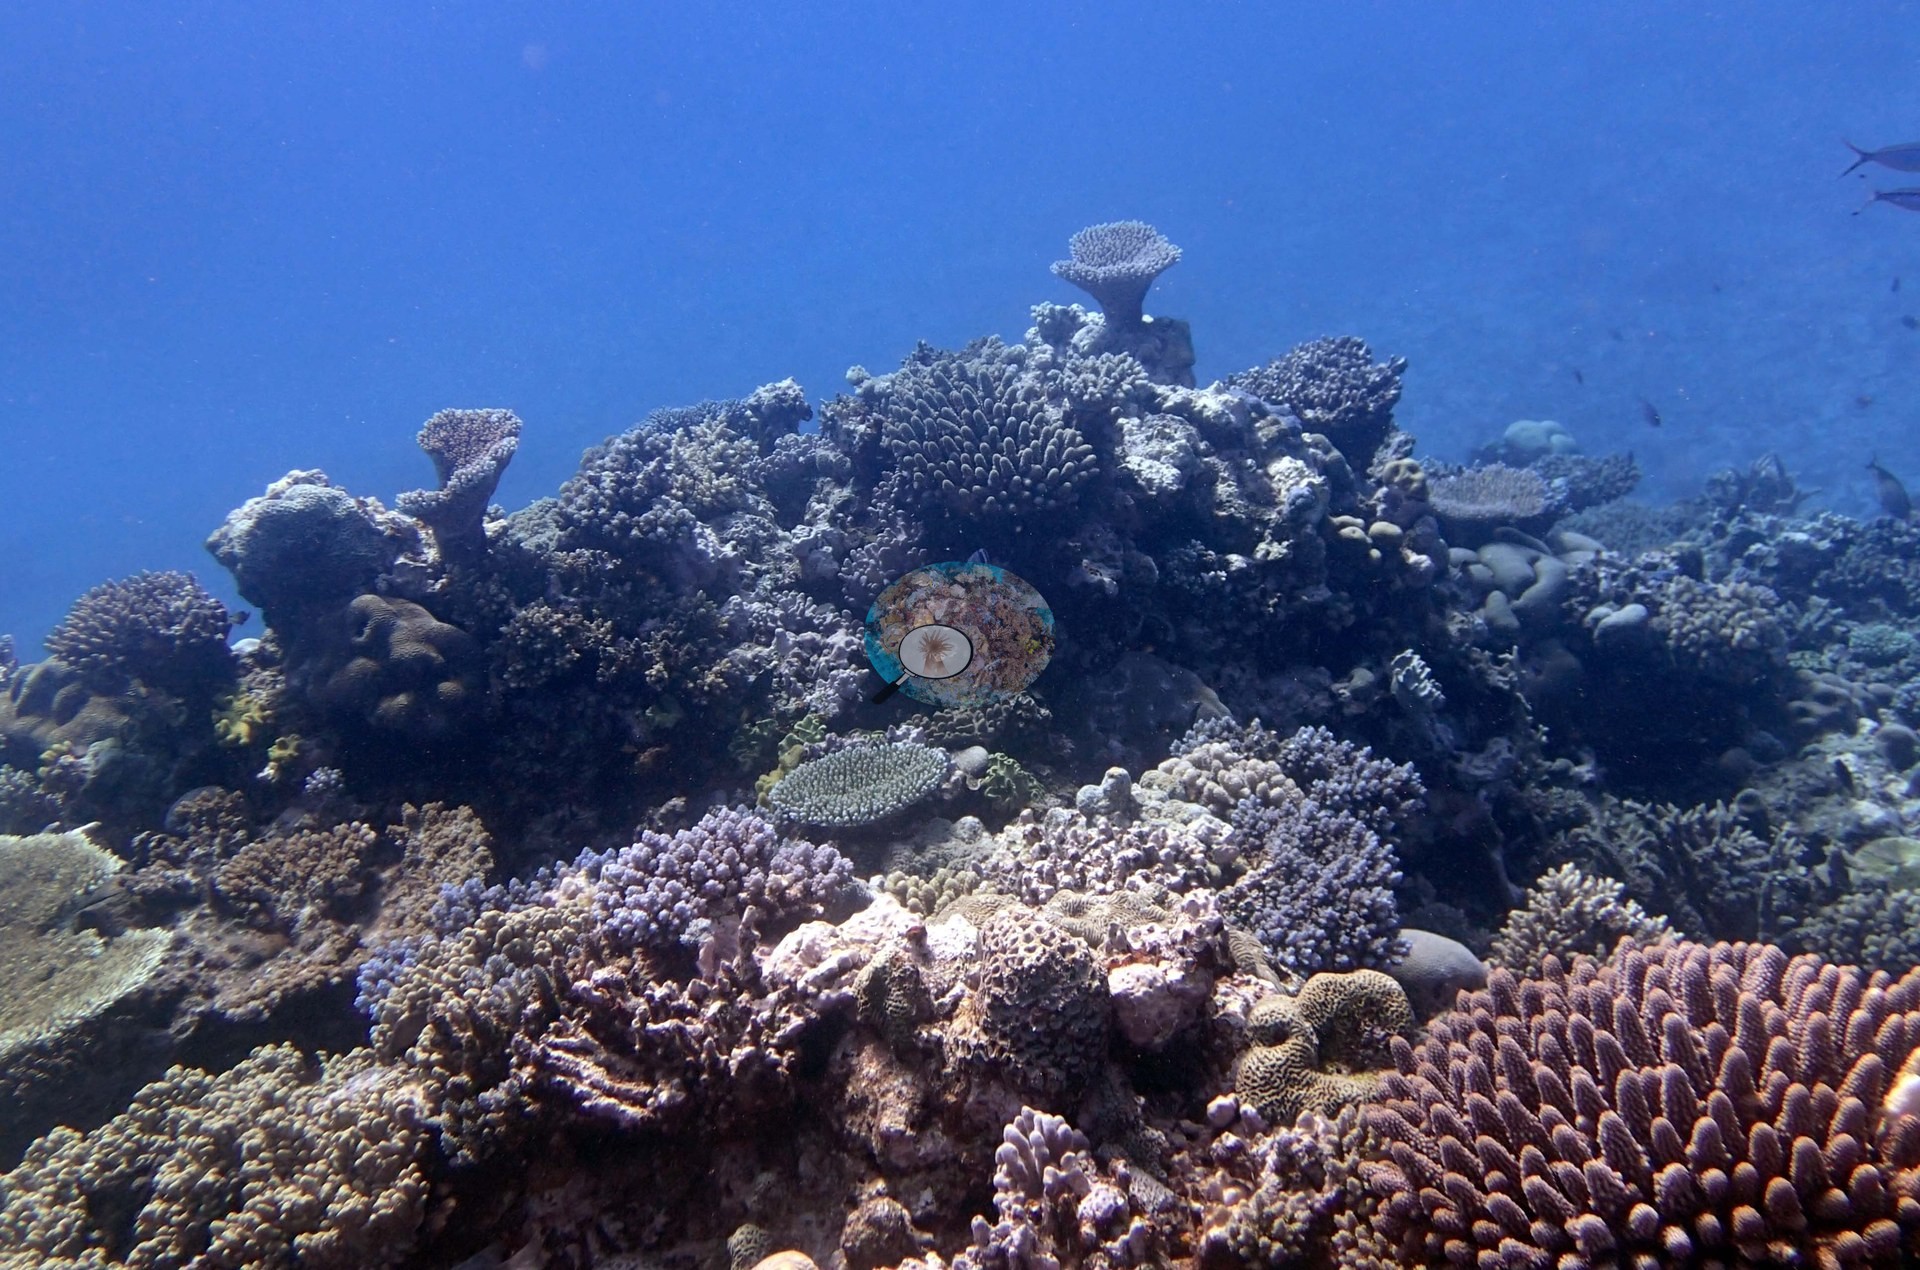
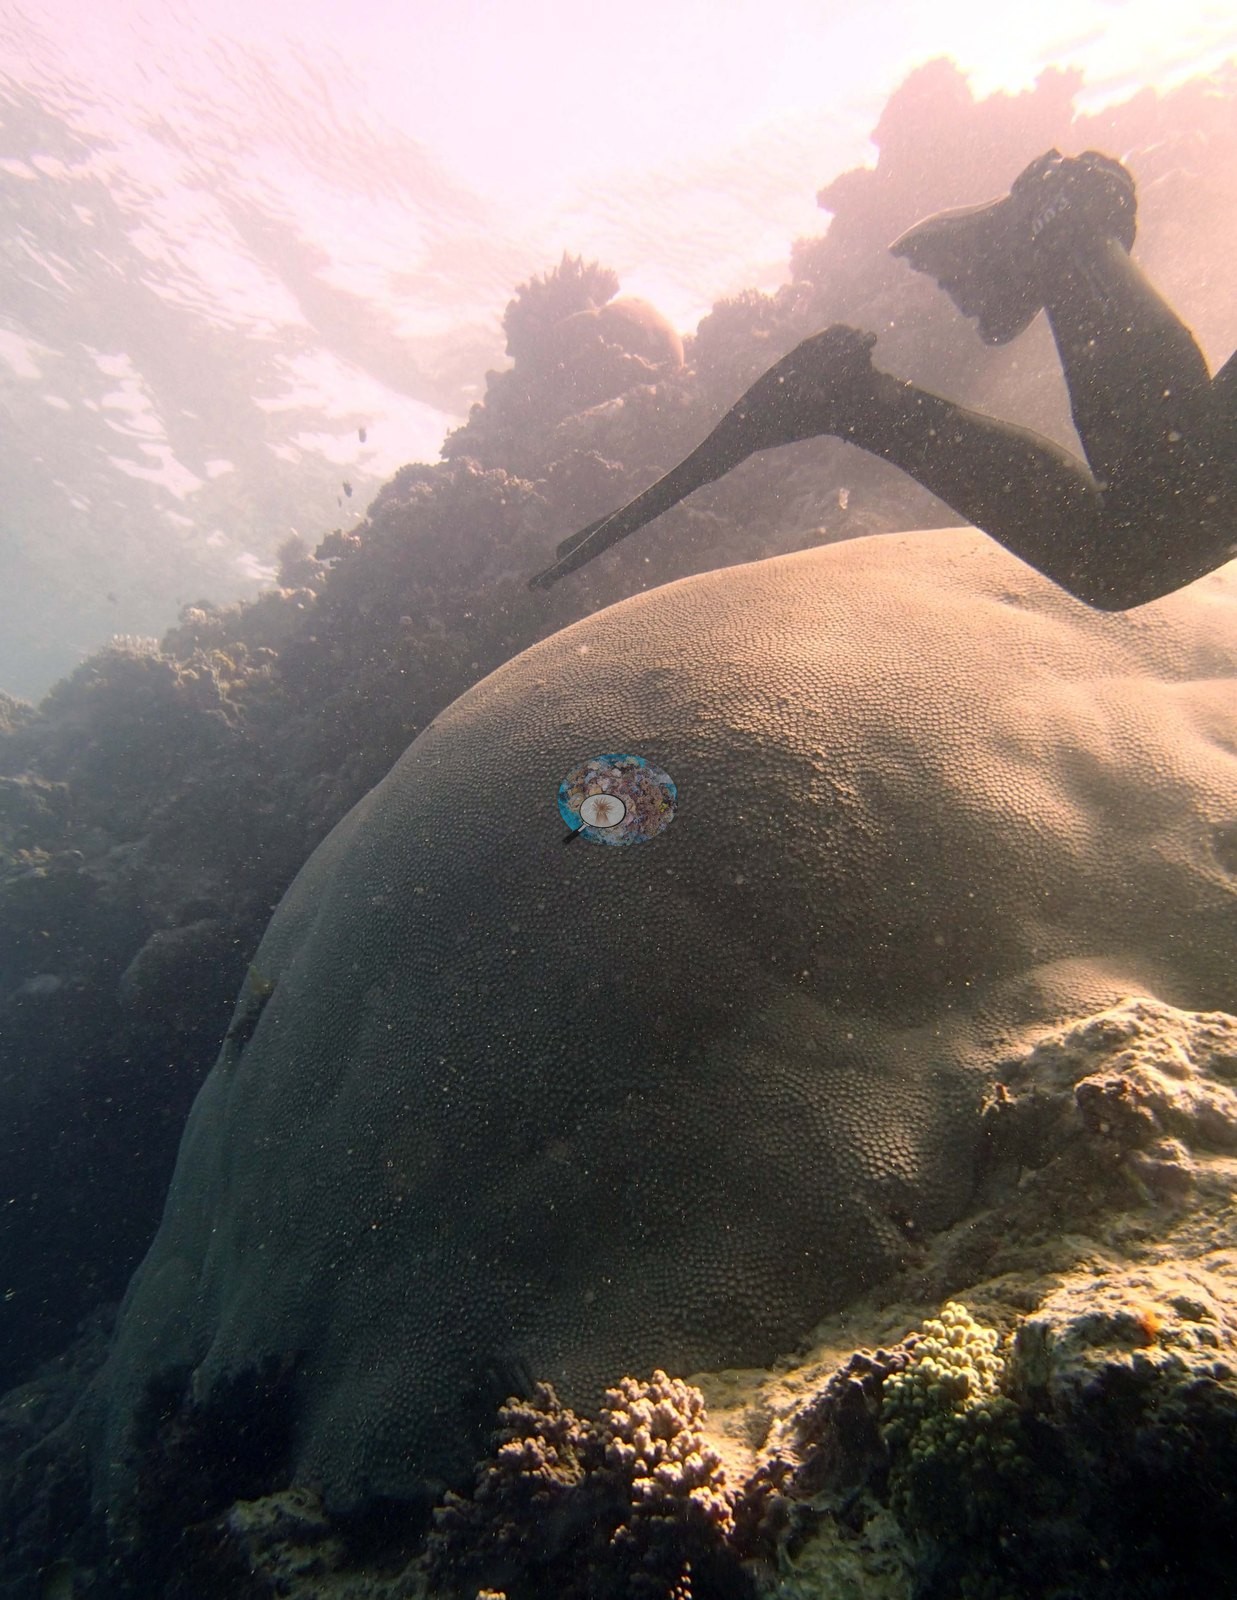
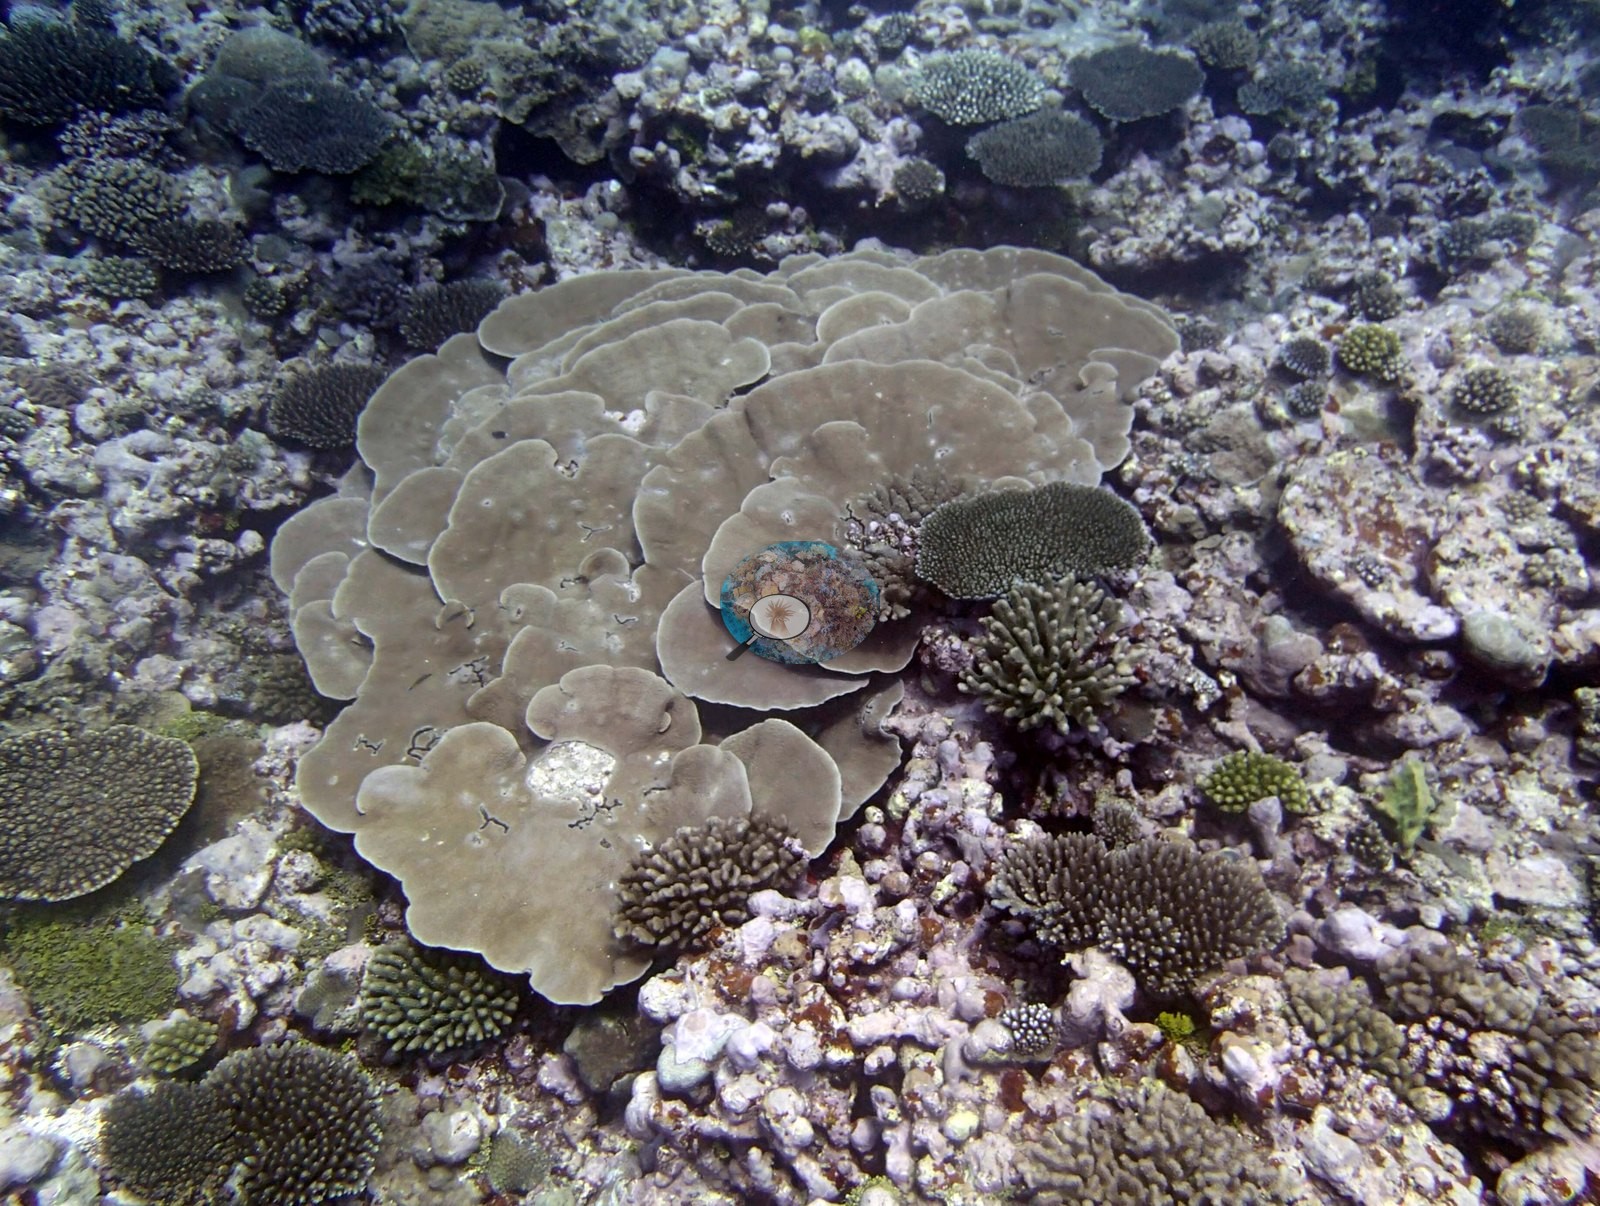
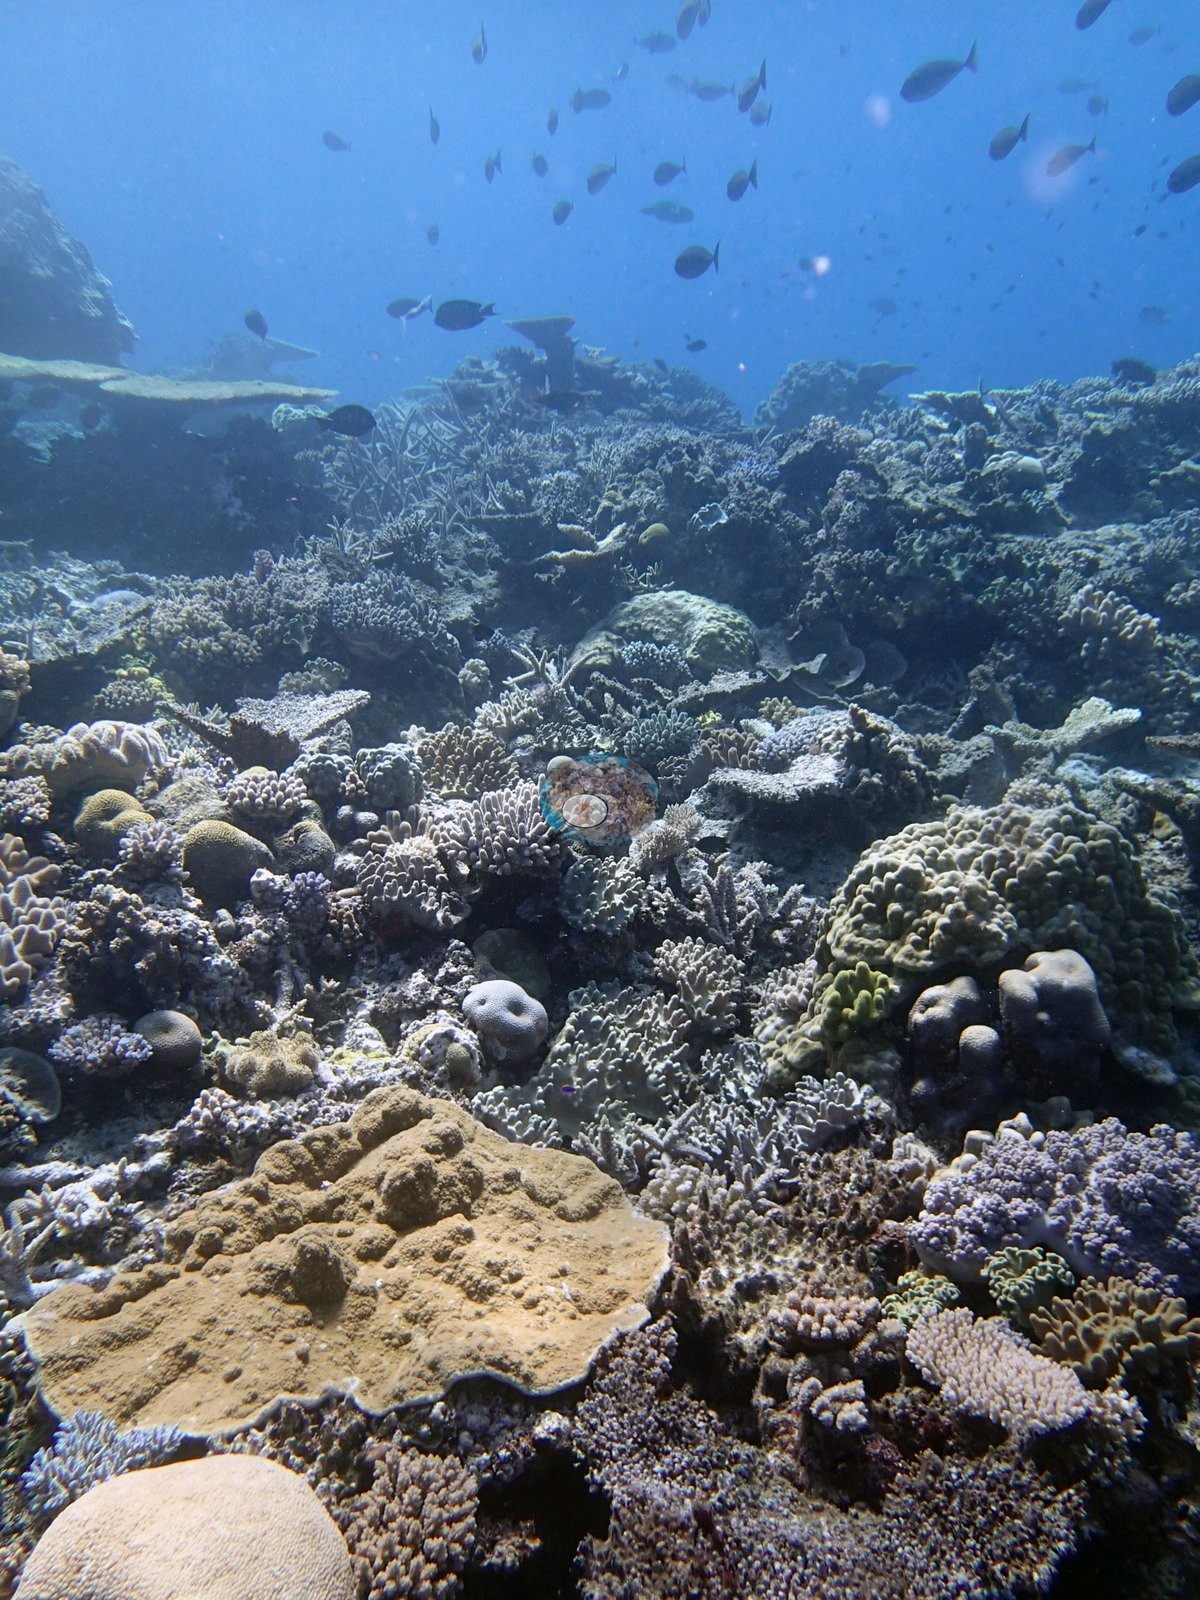
Hard coral cover averaged 32% across all 59 stations, from 8.6% at TOHA25, surge channels where algae covered 84% of the benthos, to 53% at TOHA18, both in Ha'apai. The three groups were close on average: Vava'u 33% (n = 21, from 9.6% at TOVA50 to 53% at TOVA44), Ha'apai 31% (n = 32) and Niuatoputapu 30% (n = 6, from 15% at TONI57 to 44% at TONI56). Algae separated them more clearly, averaging 44% in Ha'apai, 51% in Vava'u and 66% on Niuatoputapu. Table, staghorn, and bottlebrush Acropora dominate the shallow mound tops and terraces of Ha'apai and Vava'u, with massive Porites deeper and on the spurs. Niuatoputapu was the exception: its reefs were built mainly by mounding Astreopora, plating Montipora, Turbinaria, and Porites.
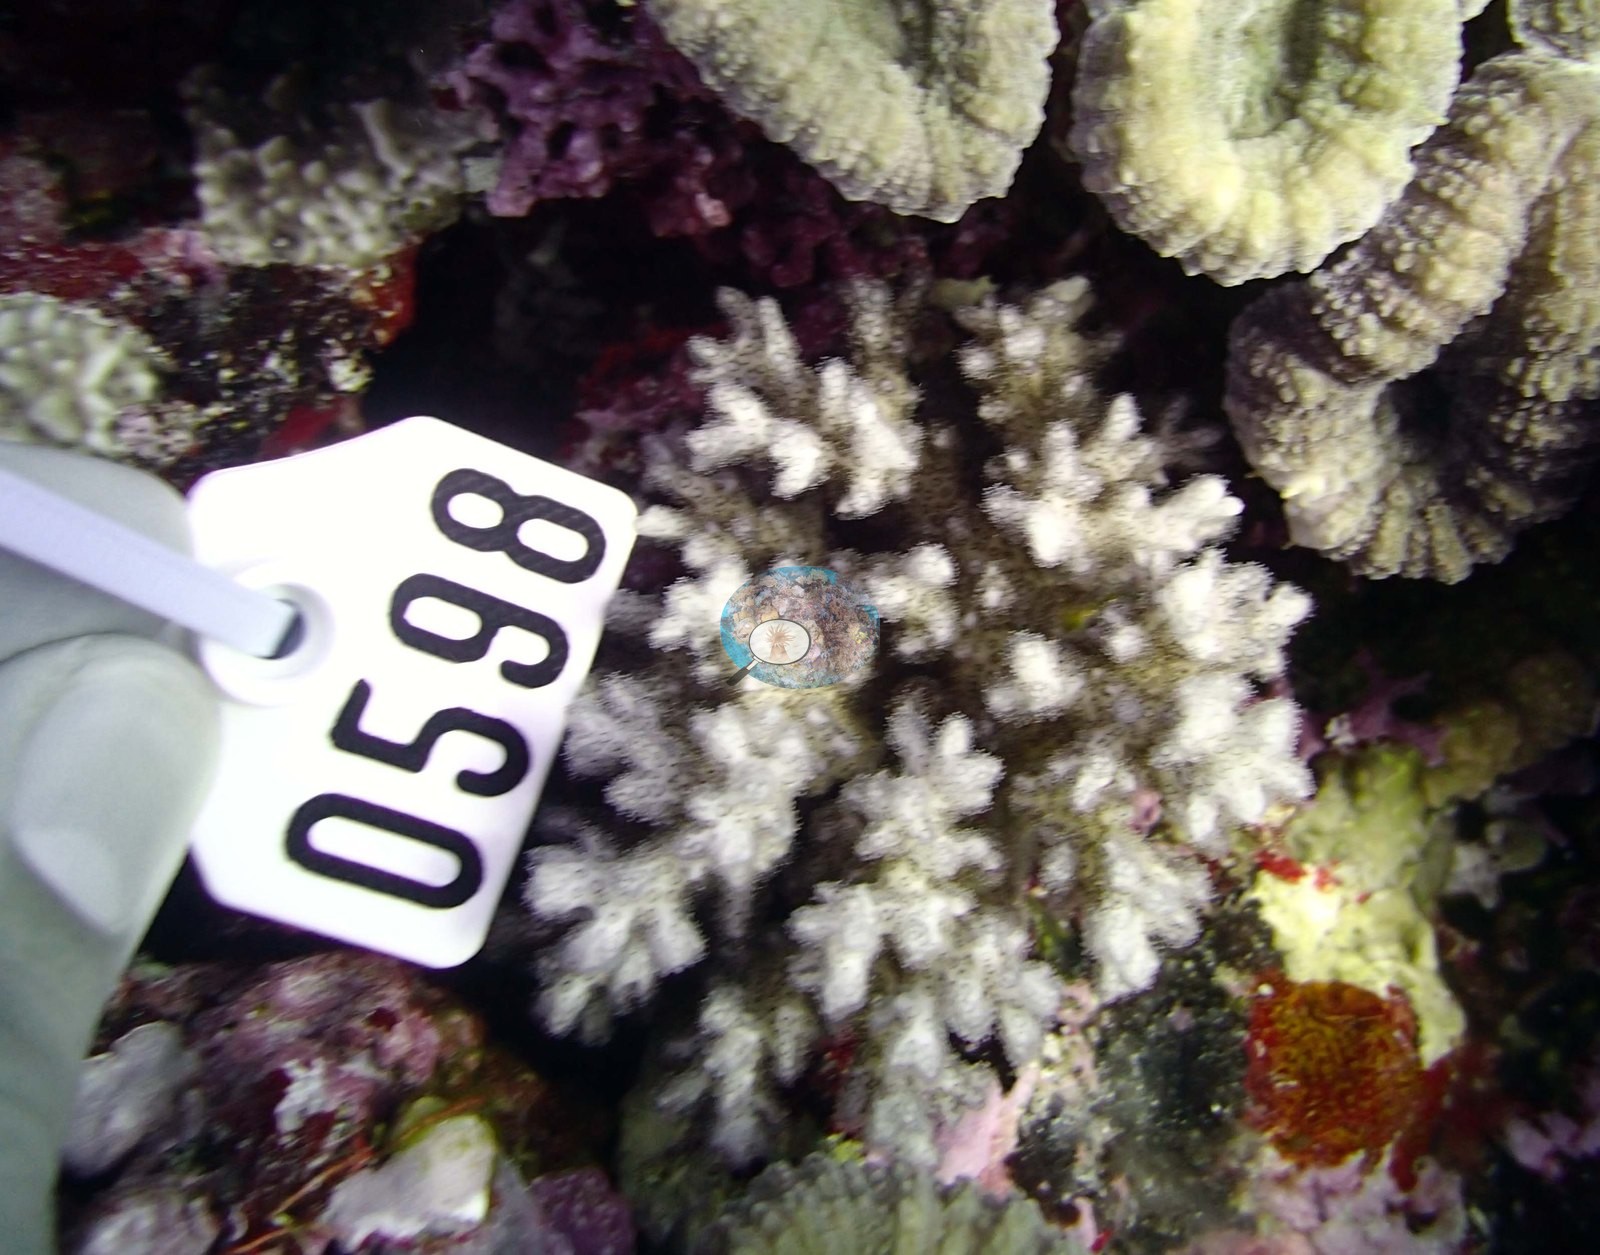
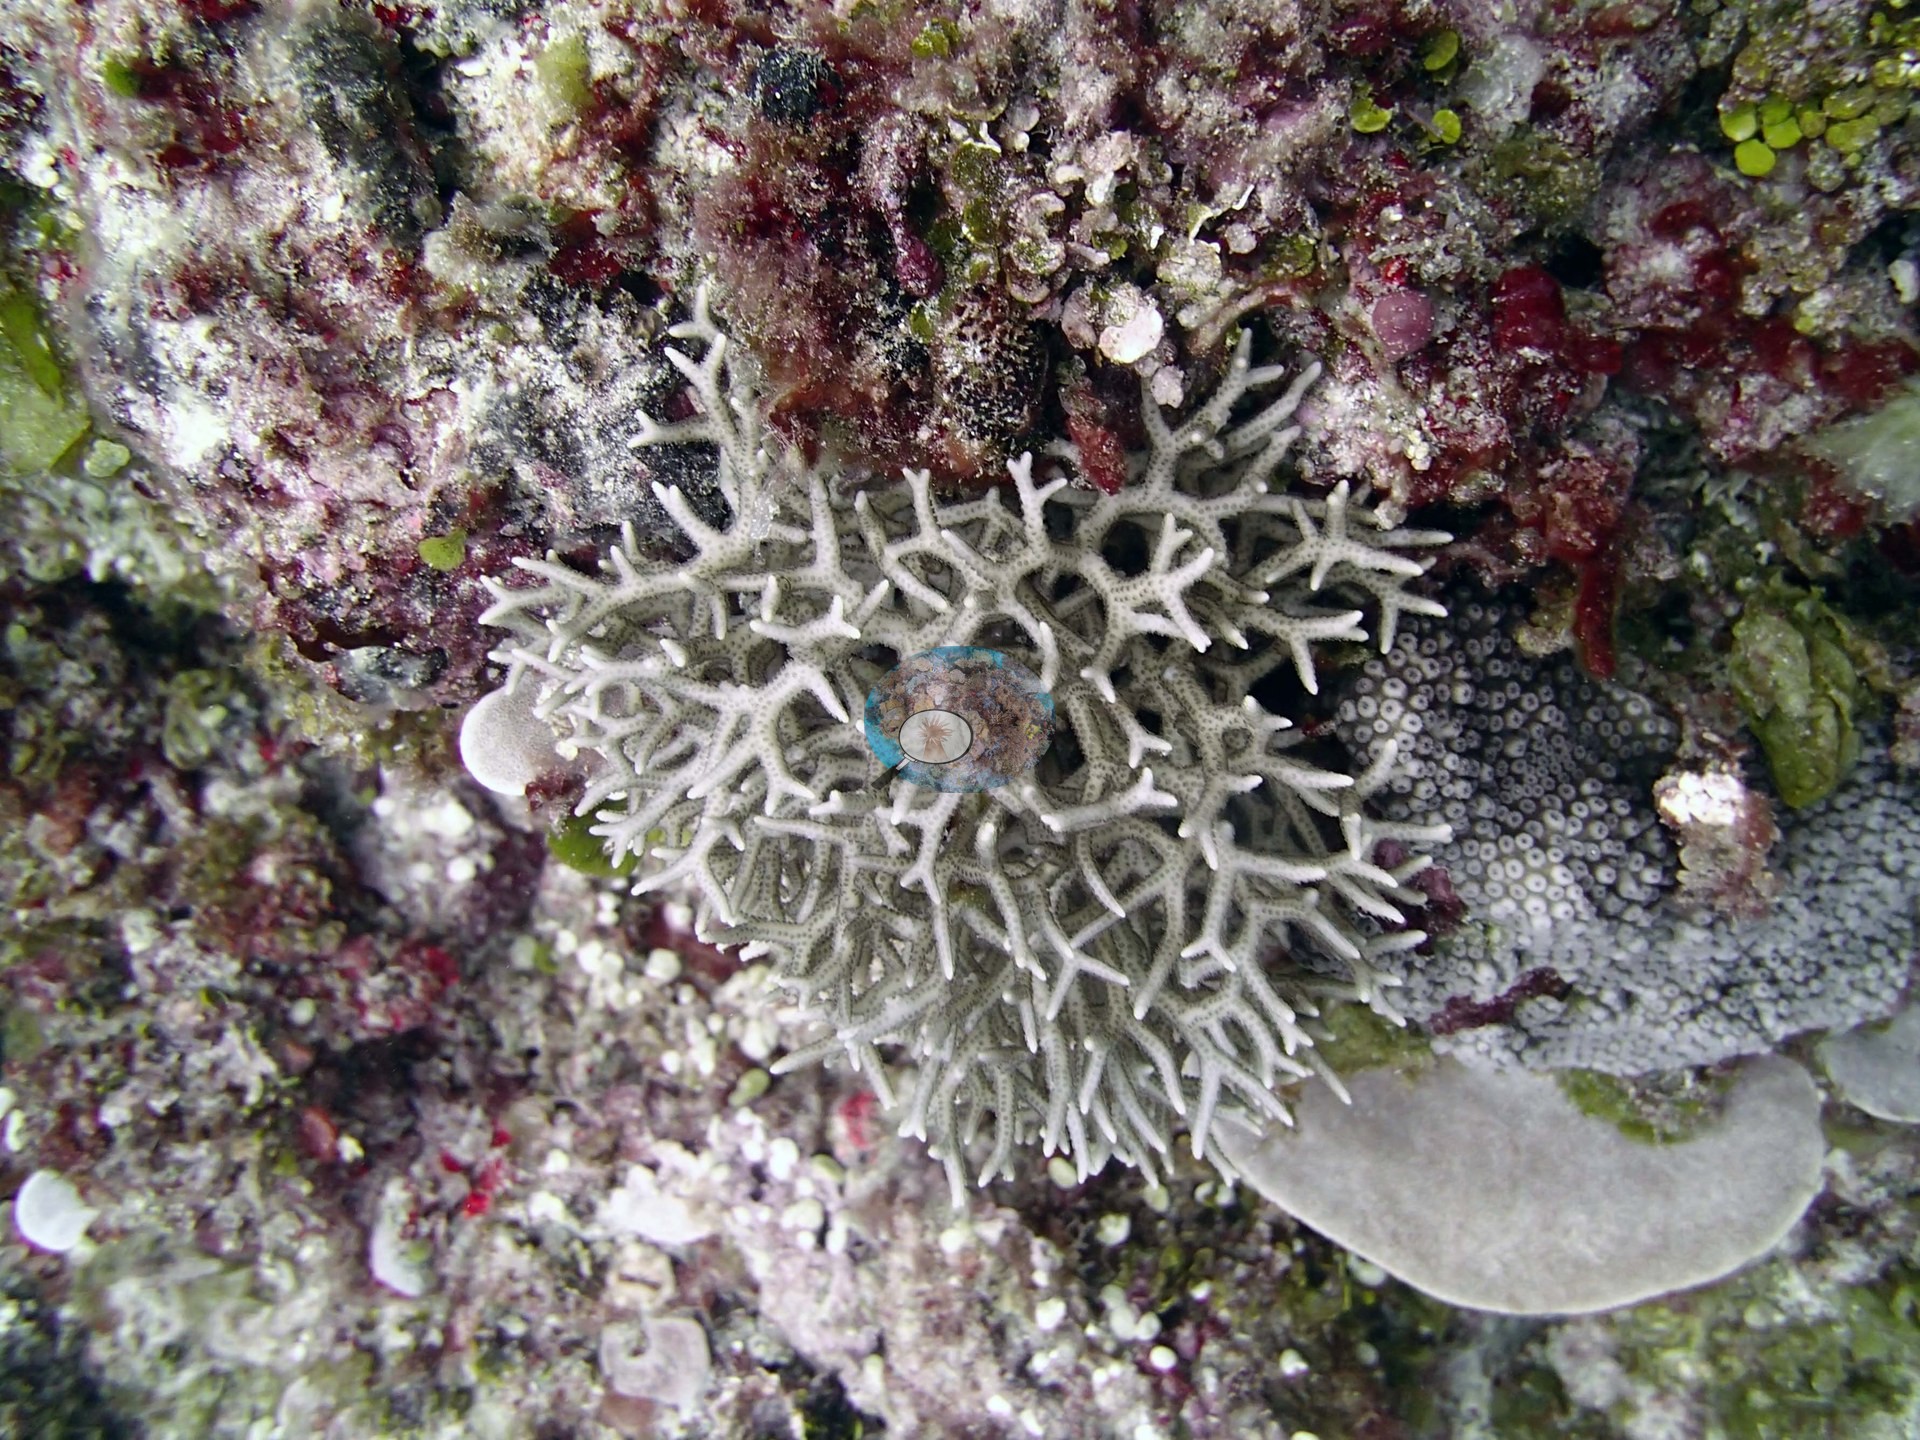
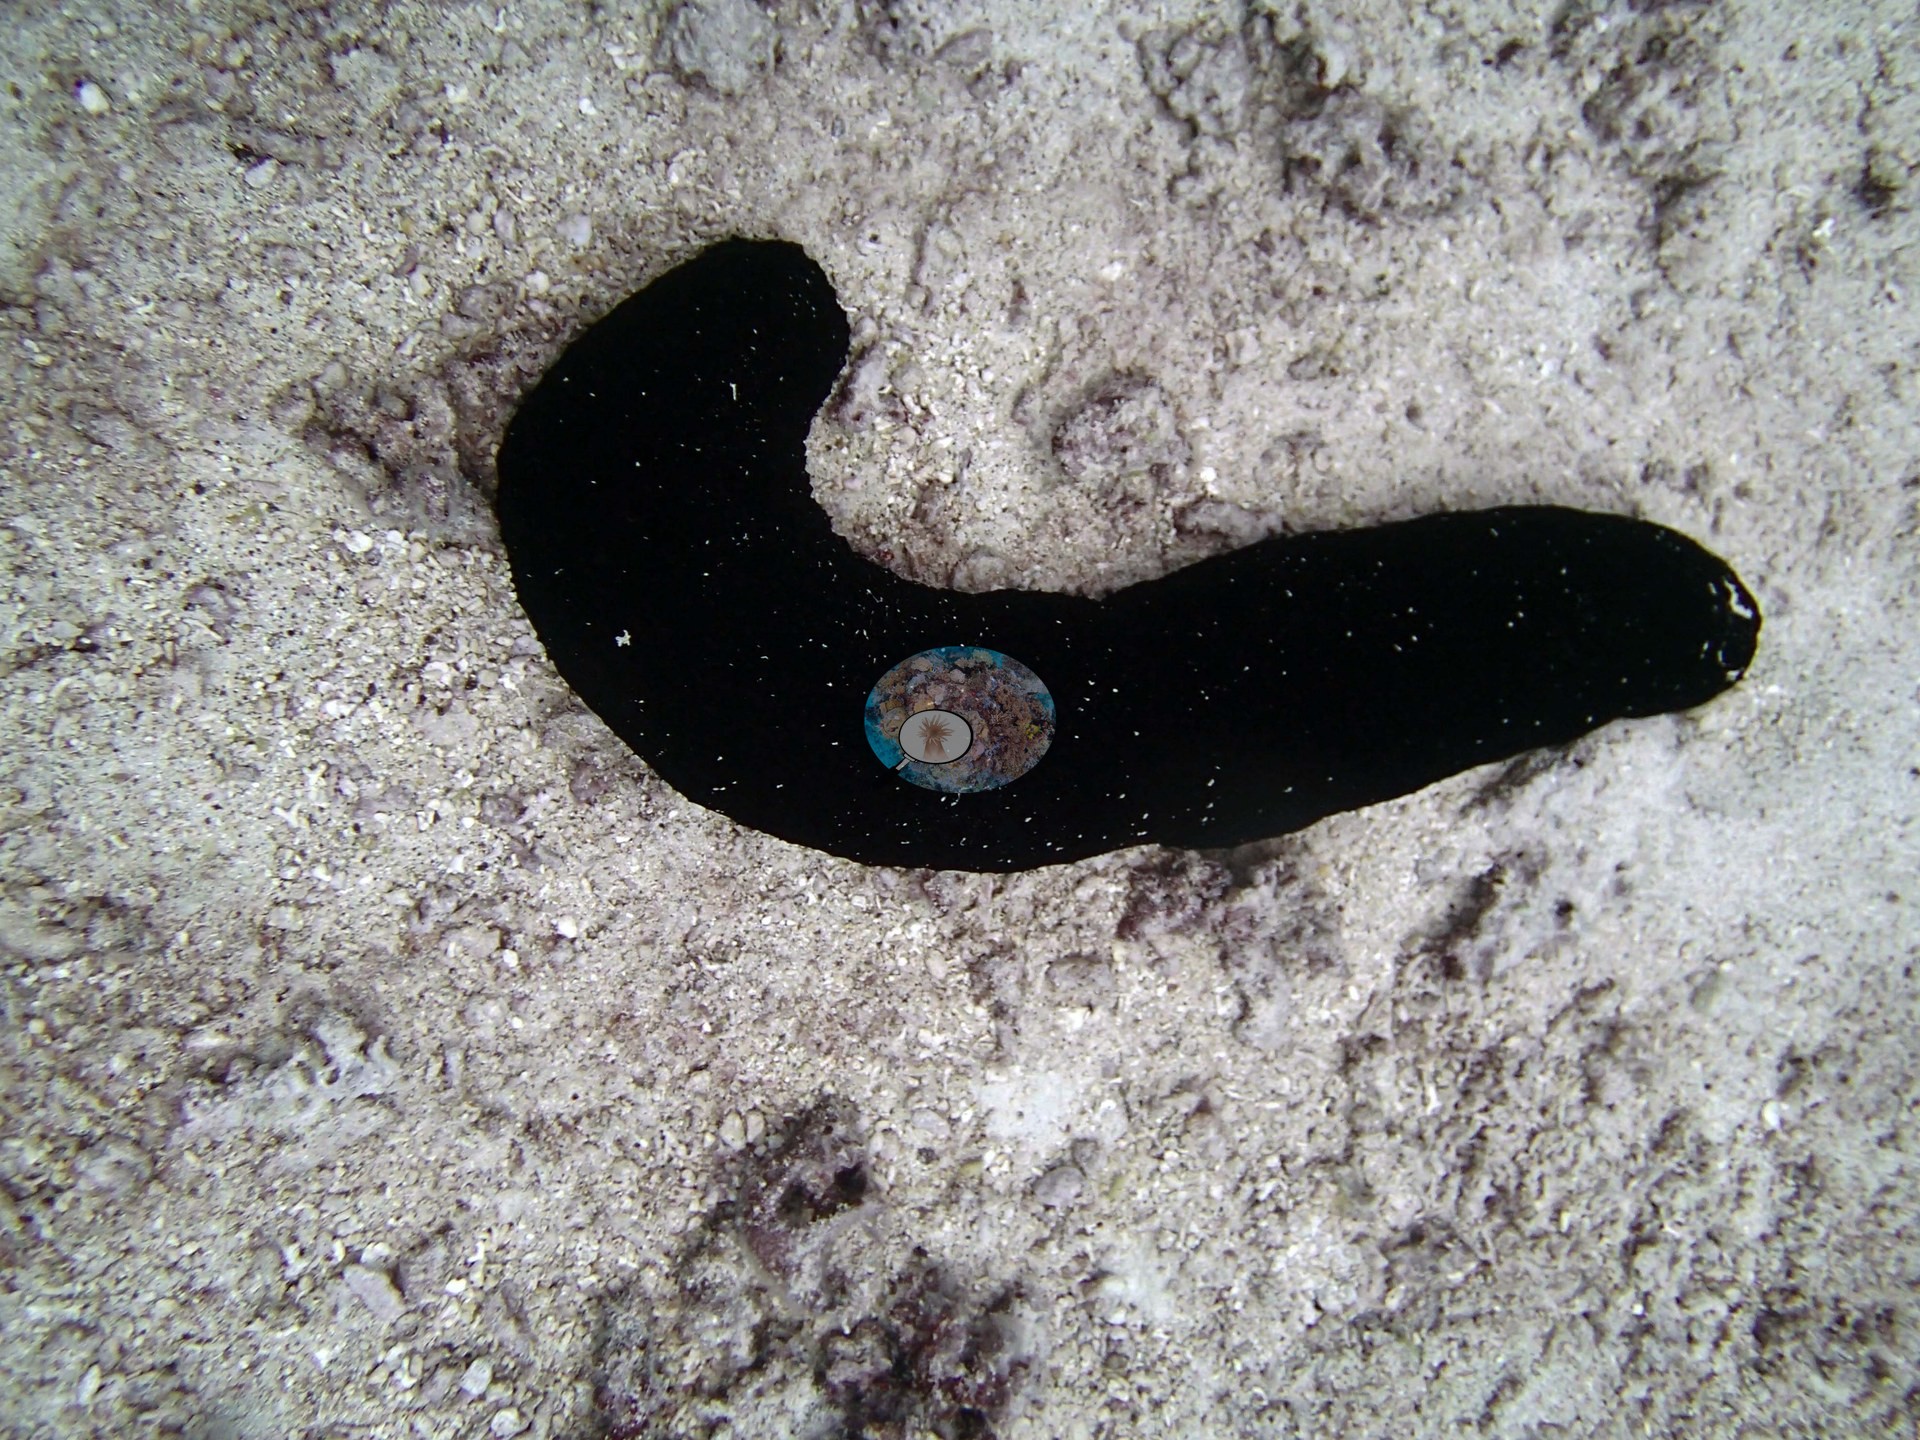
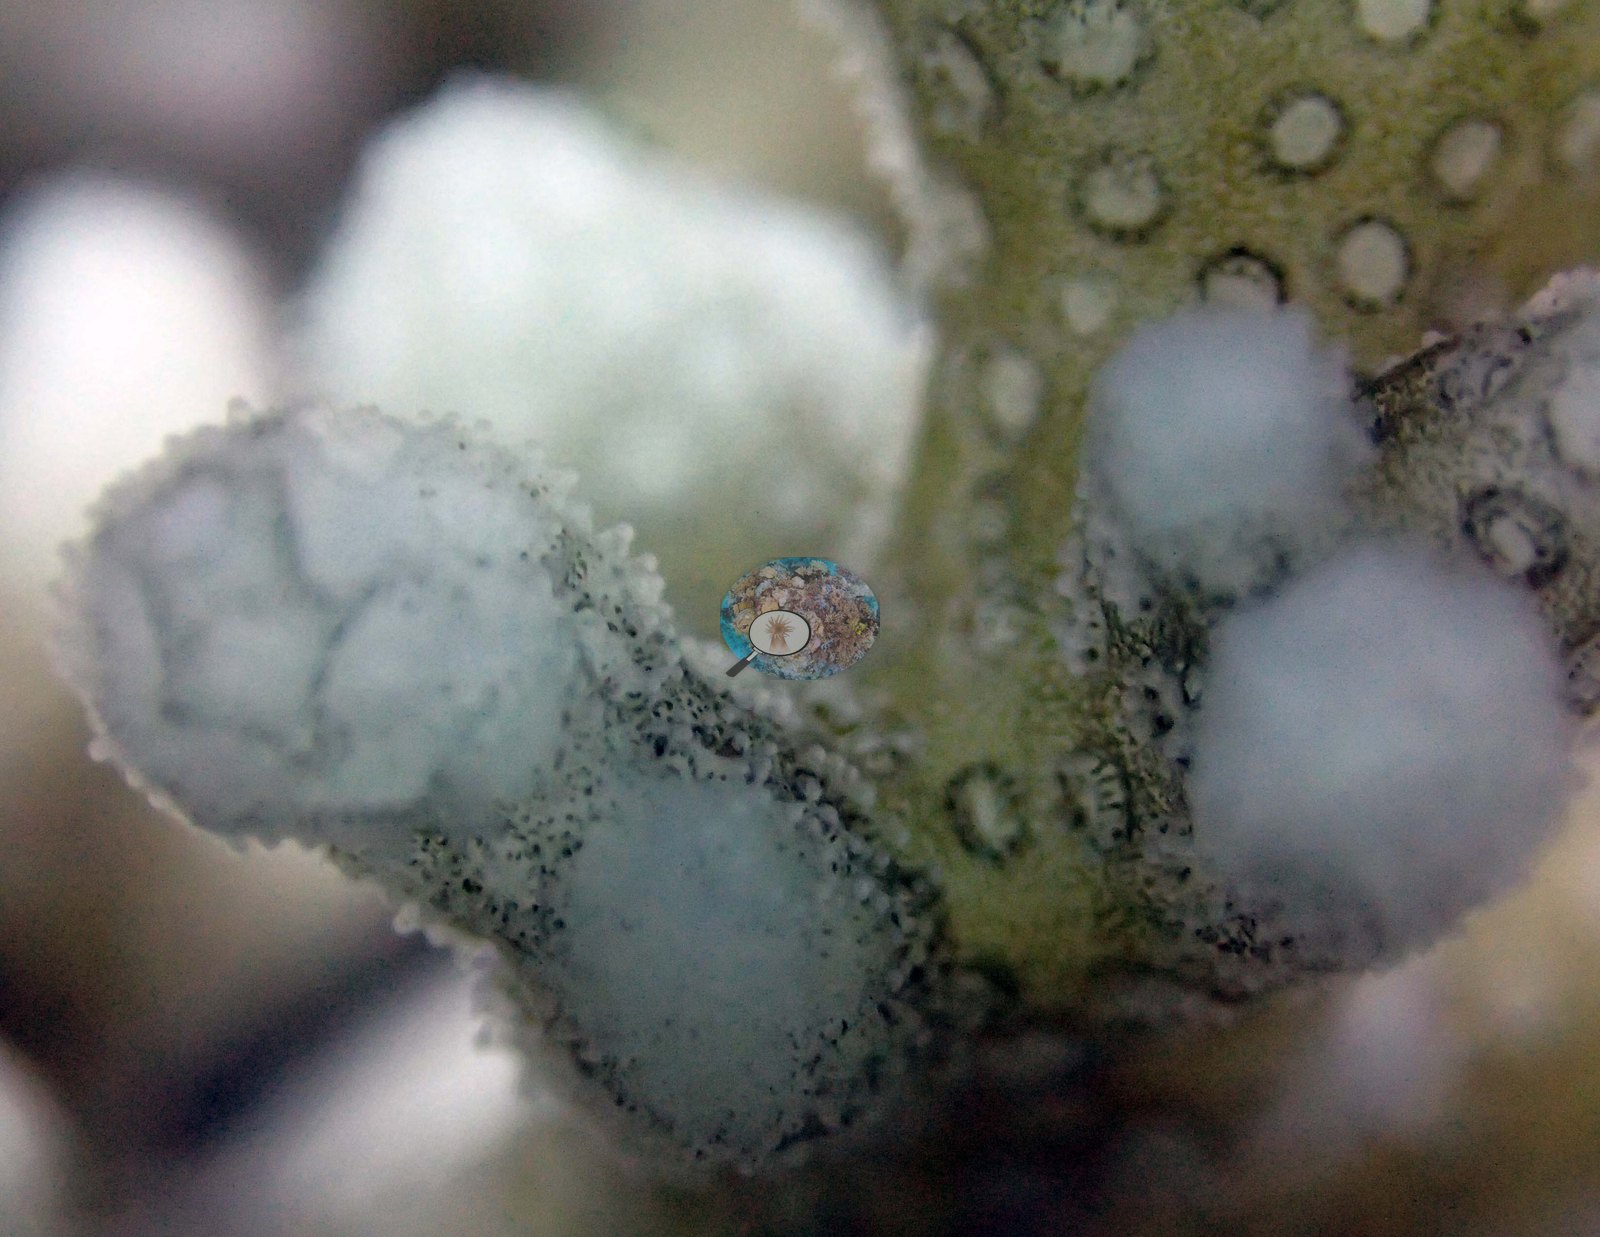
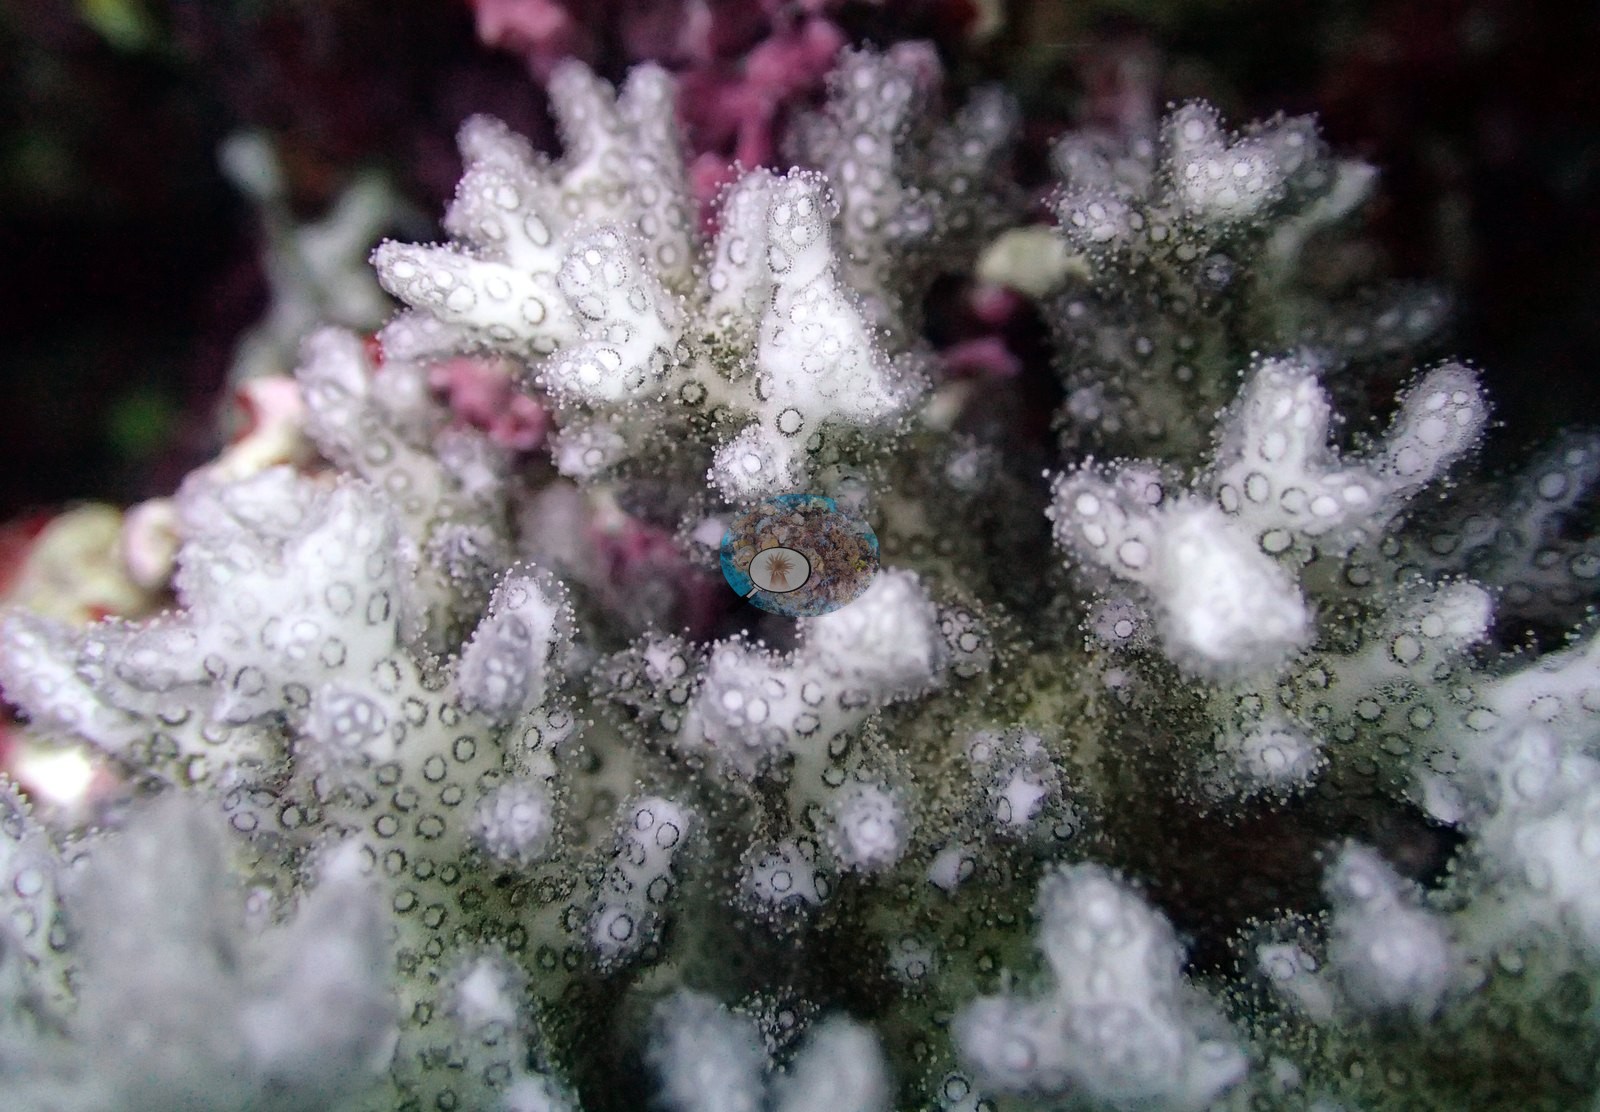
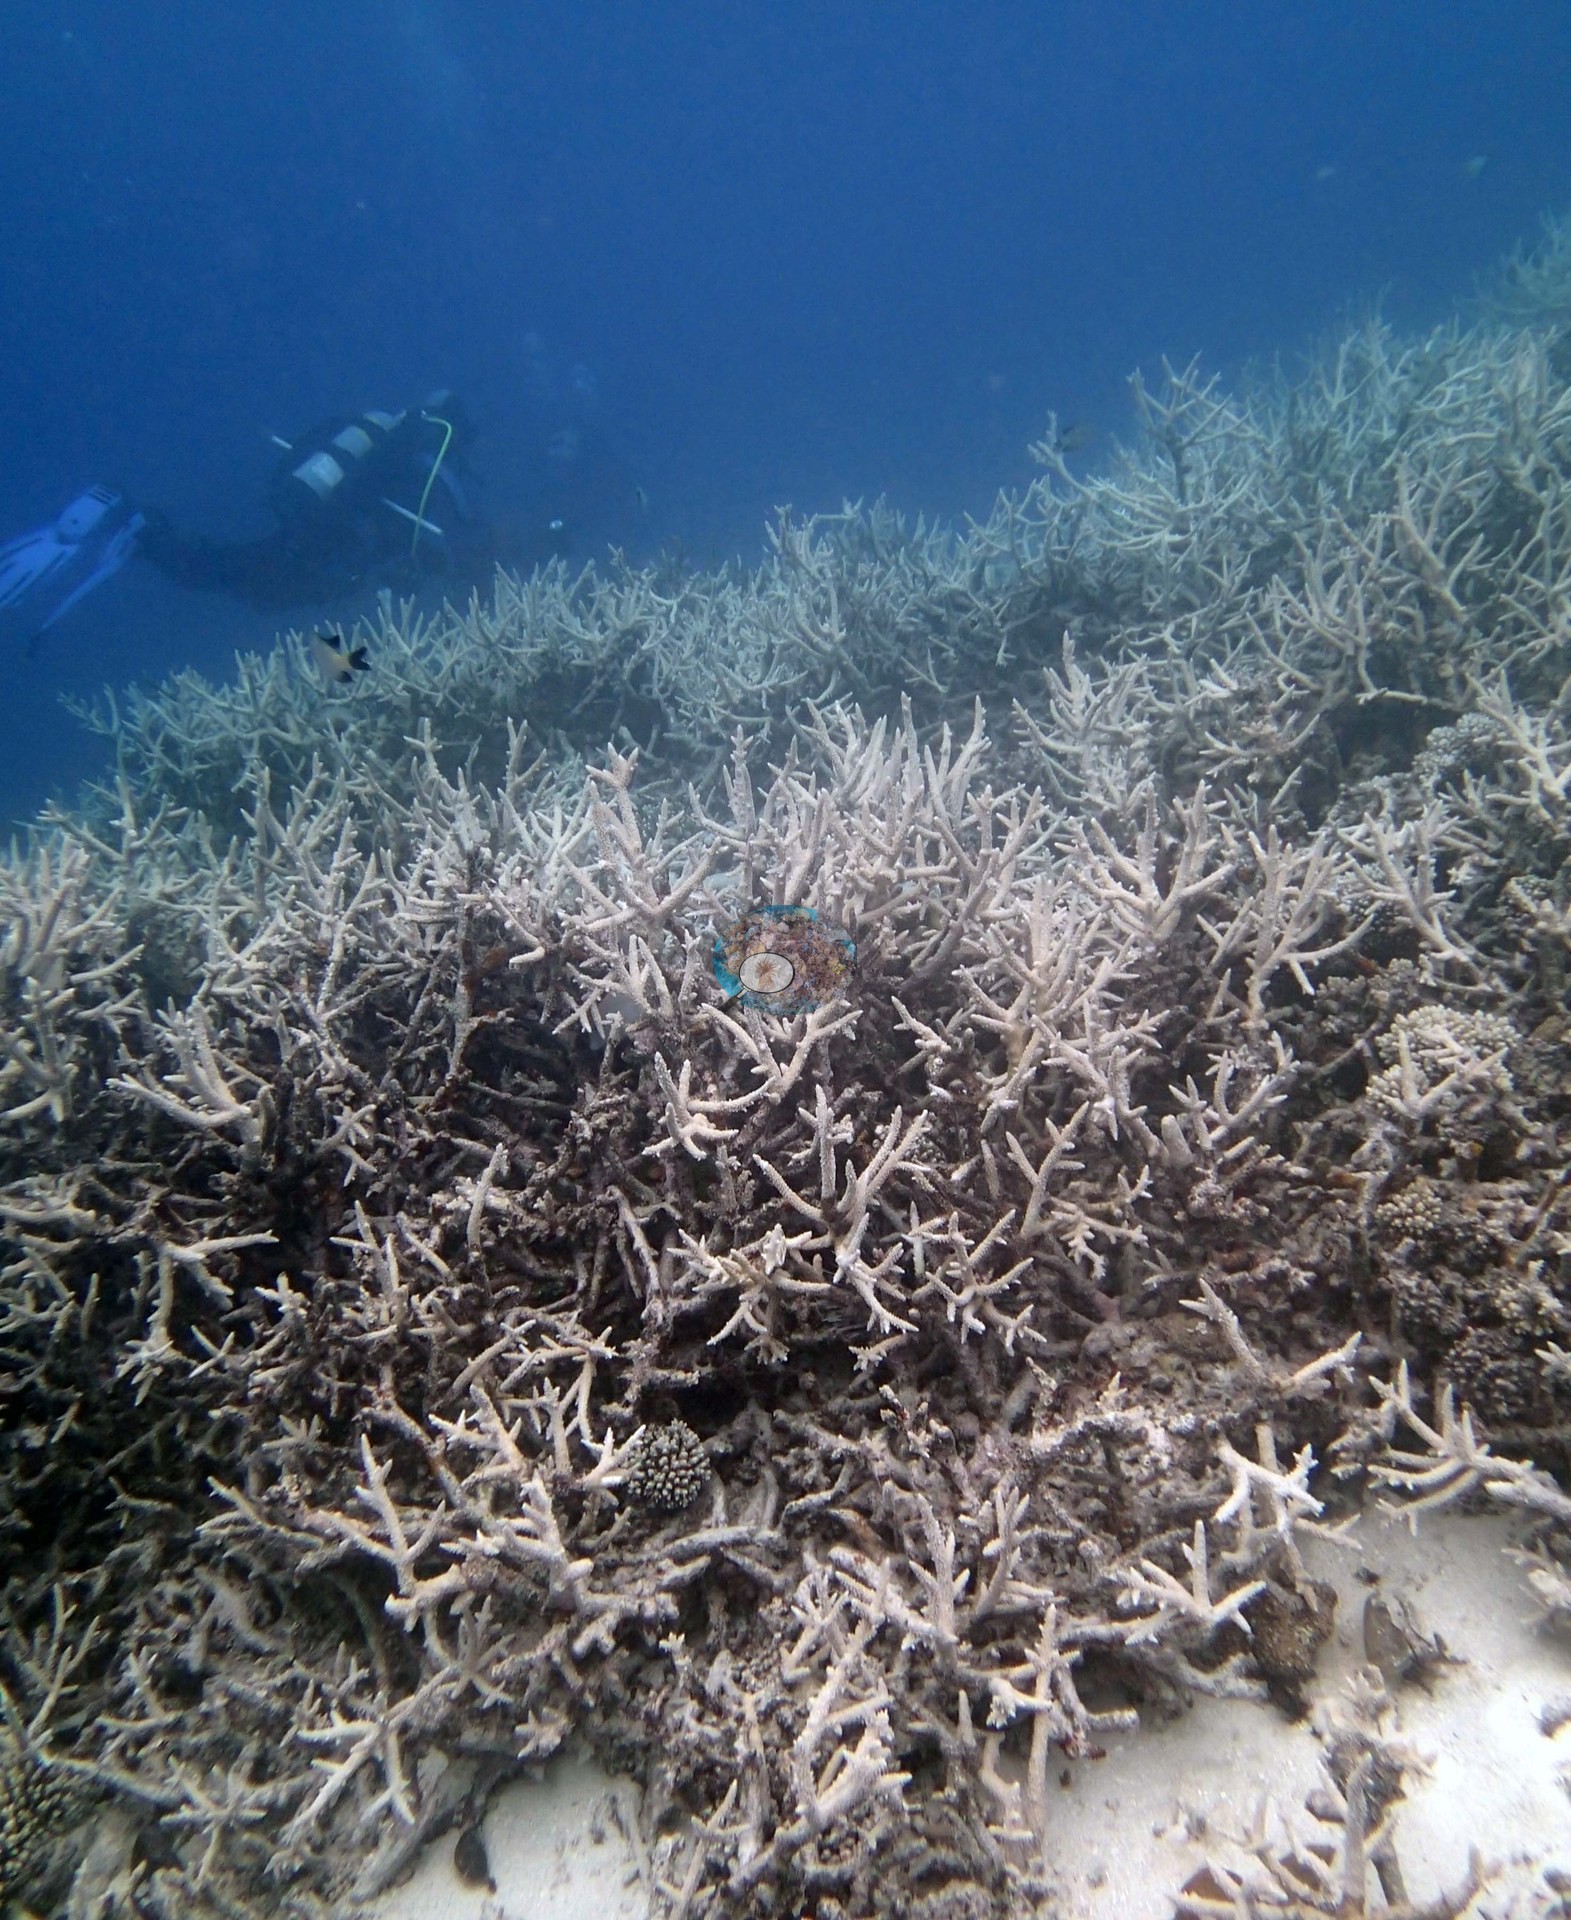
The Coral Health Index averaged 2.56 across the 19 stations where it was scored (scale of zero to five; higher is healthier): 2.28 in Ha'apai (n = 11) and 2.96 in Vava'u (n = 8), with none scored on Niuatoputapu. It ranged from 1.00 at TOHA18 to 4.24 at Pete's Paradise (TOVA34) in Vava'u. Crown-of-thorns starfish were recorded at seven Ha'apai stations, including a minor outbreak at TOHA26 and 12 starfish at TOHA23, and at four in Vava'u, with 15 on one bommie at the Japanese Coral Gardens (TOVA42). Culcita cushion stars and Drupella snails turned up widely, and the survey notes at TOVA39 record a high density of coral-eating snails. Anderson's photographs also record bleaching in the 2013 frames: pale gray-white staghorn and a small stark-white colony at TOHA01, a partly bleached poritid at TOHA04, bleached staghorn stands at TOHA18, a large bleached table at TOHA27, two small fully bleached pocilloporids at TOHA28 (recorded as dying), and paling branching colonies at TOHA29. The sampling sheets record bleaching among the Pocillopora sampled at 17 stations, nine in Ha'apai and eight in Vava'u (for example, all seven colonies 20-80% bleached at TOVA34). White syndrome was noted at five Ha'apai stations, and diseased Pocillopora at five of the six Niuatoputapu stations, where the TONI57 barrier reef also appeared to have suffered extensive tsunami damage.
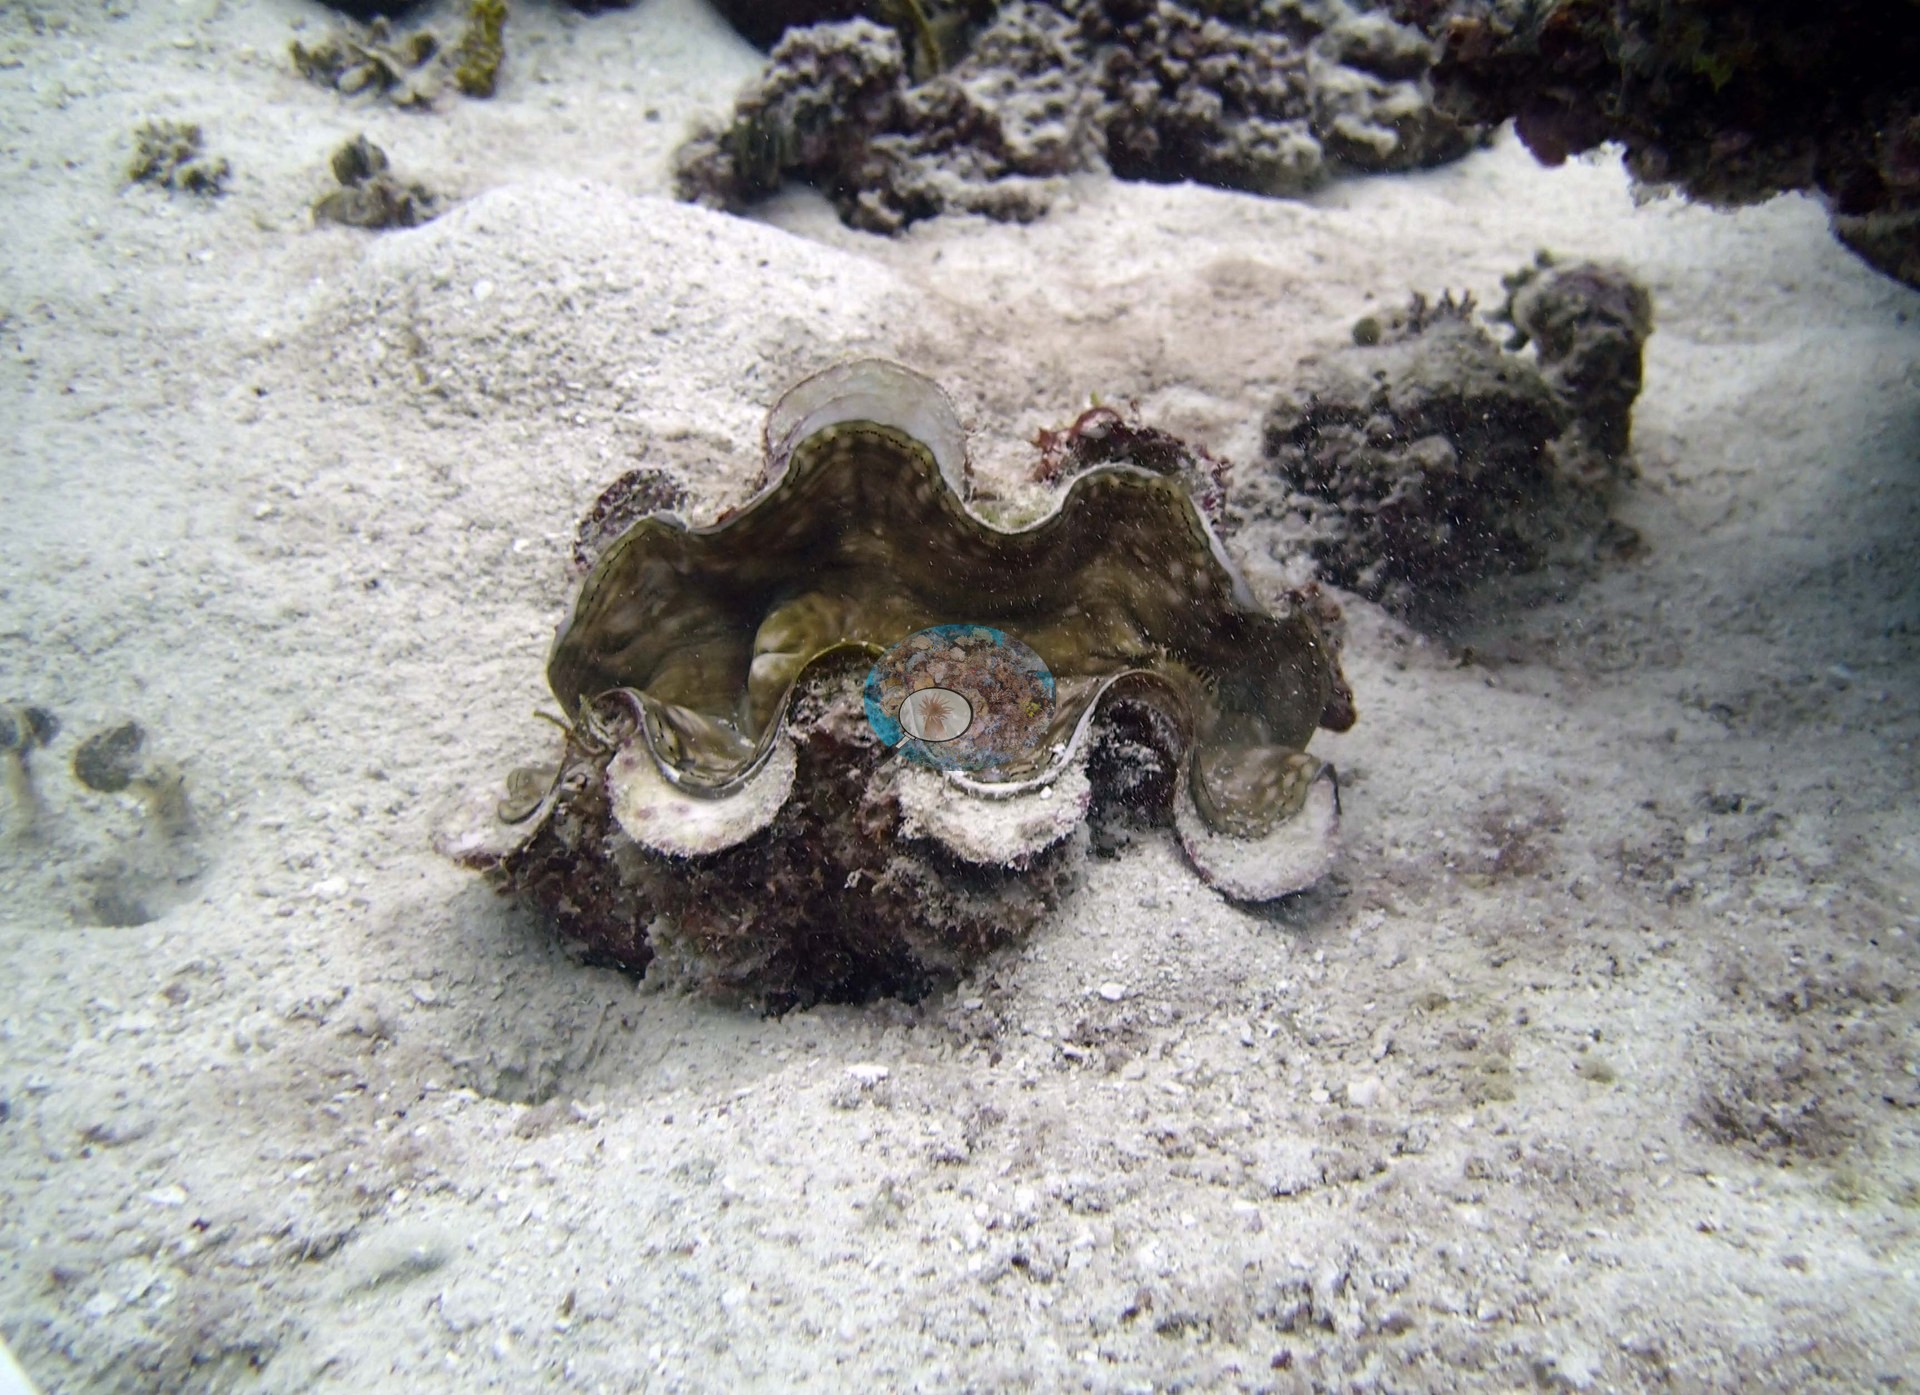
What stands out in Tonga is that cover and condition did not track each other. TOHA18 recorded 53% cover with a health score of 1.00, and TOVA35, a high-cover stand of massive Porites known as the Aquarium, scored 1.50 because large dead patches had been taken over by damselfish algal lawns. Dead or partly dead staghorn stands under damselfish lawns recur from Ha'apai to Vava'u. Vava'u's scored stations averaged 2.96 on the health index and Ha'apai's 2.28, and sightings included banded sea snakes at TOVA36 and TOVA37, a banded sea snake at TOHA03, a large blotched stingray at TOHA06, and giant clams in all three groups.
Highlights
- 53% coral cover on high-relief mounds and spurs in Ha'apai, with a Coral Health Index of 1.00 (TOHA18).
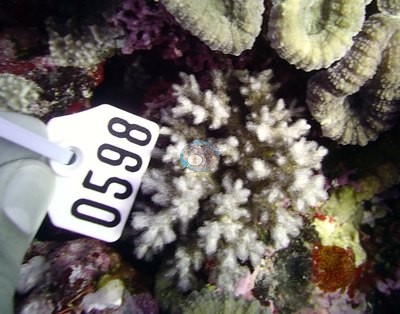
- Pete's Paradise scored a Coral Health Index of 4.24 on wide Acropora spurs and mounds up to 5 m tall (TOVA34).
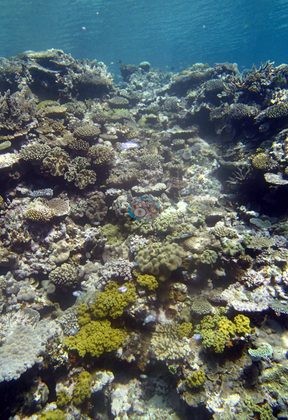
- A multi-layered platform of table and staghorn Acropora, with 53% cover (TOVA44).
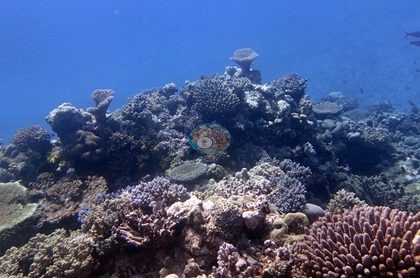
- A single enormous mound blanketed in branching and staghorn Acropora, which Anderson named an Acropora mountain (TOHA03).
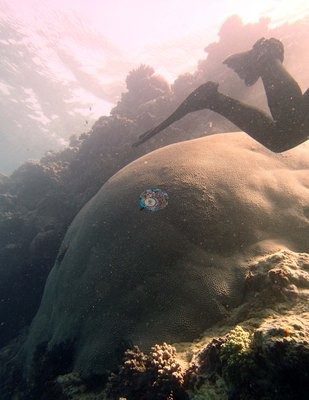
- Crown-of-thorns starfish at eleven stations across Ha'apai and Vava'u, including a minor outbreak at TOHA26 and several massed together on the reef at TOVA51.
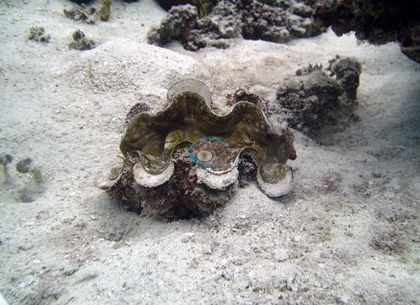
- An Acropora-poor Niuatoputapu platform of mounding Astreopora, plating Montipora, and big Turbinaria, with extensive stands of blade-like fire coral (TONI55).
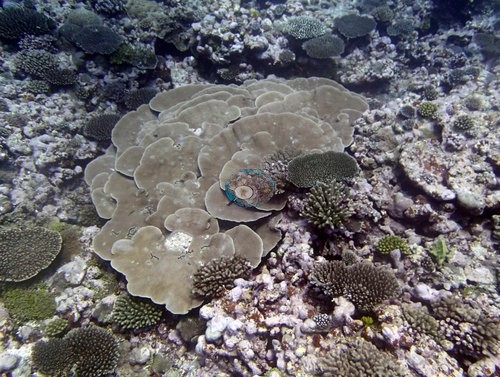
- 8.6% cover, in narrow surge channels between undercut walls (TOHA25).
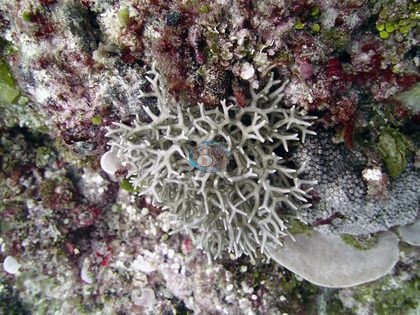
Notable observations (16)
- Tonga - Ha'apai (TOHA26): Minor outbreak of crown-of-thorns starfish (COTS) - collected 7, saw 5 additional; 5-10 recently eaten corals near each den.
- Tonga - Ha'apai (TOHA23): 12 COTS seen and 1 Culcita; about two dozen areas with aggregates of small recently eaten corals from COTS.
- Tonga - Ha'apai (TOHA28): Considerable COTS damage at 20-23 m; many Goniastrea with large multifocal lesions; staghorn 30-40% dead. Bleaching: two small pocilloporids fully bleached but still alive (recorded as dying), with more stark-white branching colonies in other frames.
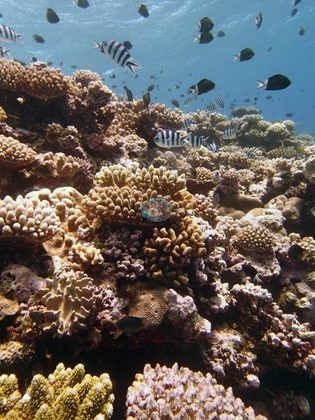
- Tonga - Ha'apai (TOHA09): Between 2-5% of the table acroporids and Pocillopora show signs of white syndrome; 1 Culcita.
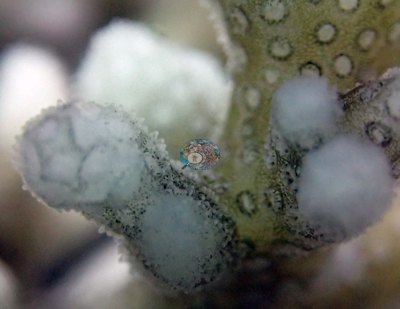
- Tonga - Ha'apai (TOHA01): Drupella on a small number of acroporids; Culcita with small recently eaten corals; a few isolated cases of white syndrome and a few colonies with tumors. Bleaching (Anderson's reading of the frames): a pale gray-white staghorn thicket and a small stark-white branching colony.
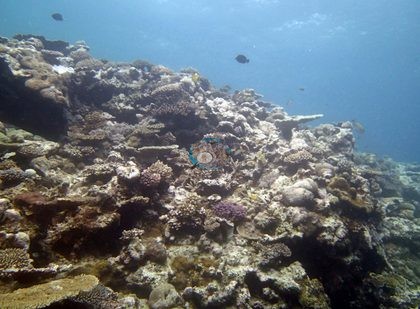
- Tonga - Ha'apai (TOHA10): Stark white colonies in two photographs and a pale table in a third; cause not settled from the frames (survey notes: large Drupella snails in high numbers). Anderson's sheet records one of three sampled colonies 20-30% bleached.
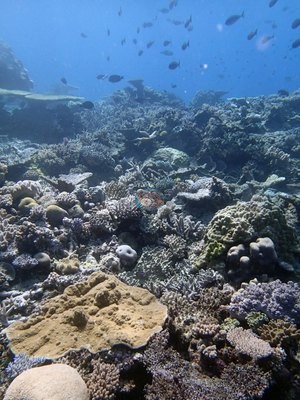
- Tonga - Ha'apai (TOHA18): Extensive pale gray-white staghorn bleached but alive (Anderson's reading), and a bleached ruffled colony (possibly a soft coral) in one frame; survey recorded some staghorn dead or partly dead.
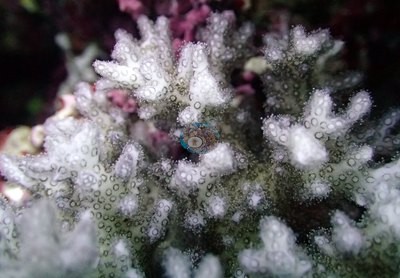
- Tonga - Ha'apai (TOHA31): Many Favia stelligera and a few other corals were partially bleached; snail damage on Acropora; 2 Culcita.
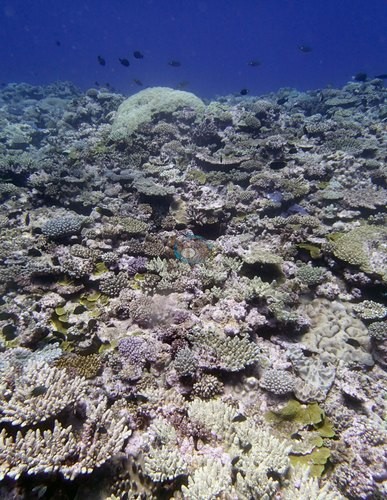
- Tonga - Vava'u (TOVA42): One bommie with much more mortality and 15 COTS; more than 40 Culcita among the bommies and surrounding rubble; many acroporids with dead spots.
- Tonga - Vava'u (TOVA51): Several crown-of-thorns starfish massed together feeding on the reef; the staghorn thicket bleached pale gray-white, still alive.
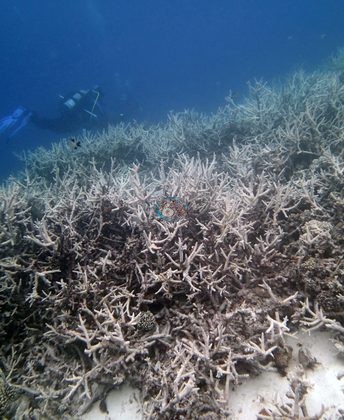
- Tonga - Vava'u (TOVA39): A high density of coral-eating snails; about 20% of the Isopora, digitate Acropora, and Pocillopora with old and recent mortality, mostly due to snails; 3 Culcita.
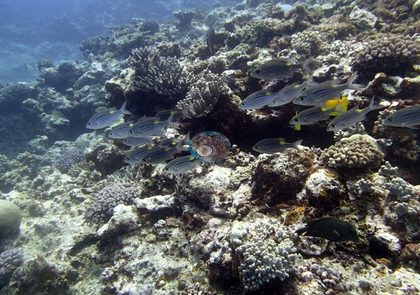
- Tonga - Vava'u (TOVA44): From 20-30% of the table acroporids were dead in growth position and 5.0% had large white lesions; 1 Culcita and 1 COTS.
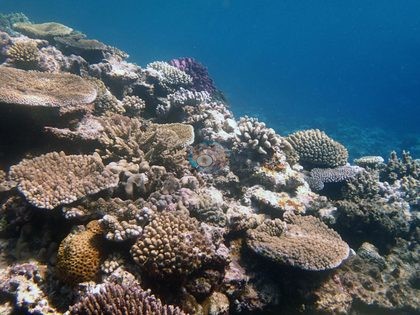
- Tonga - Vava'u (TOVA35): Low Coral Health Index (1.50) despite 41% cover: large dead patches of the massive Porites stand taken over by damselfish algal lawns.
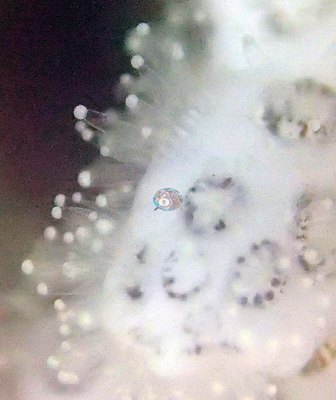
- Tonga - Niua (TONI54): High numbers of diseased Pocillopora; about 30% dead corals, including a large dead stand of thick-branched staghorn at 15 m; one massive/encrusting colony with several rounded lesions.
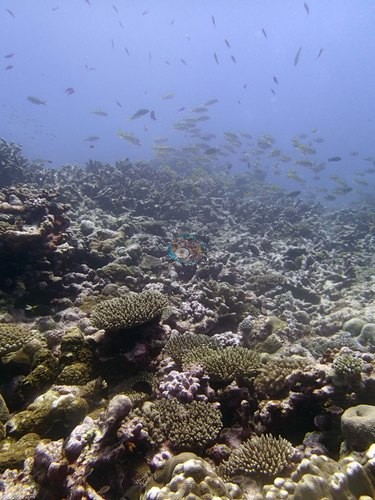
- Tonga - Niua (TONI57): Many of the Pocillopora colonies have disease; large patches of cyanobacteria; extensive apparent tsunami damage; an old rope across the reef, colonized by a branching coral.
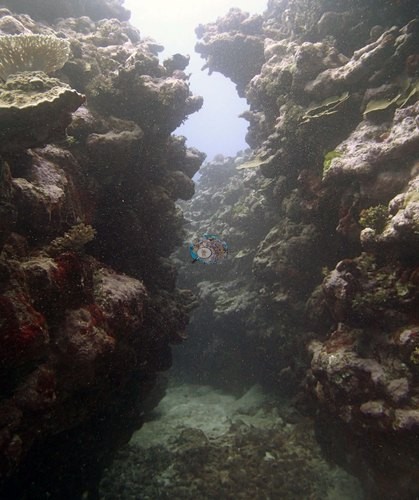
- Tonga - Niua (TONI59): No snails, COTS, or Culcita seen but high numbers of diseased Pocillopora; a ~10 m Porites had lost roughly 80% of its tissue.
Sites in this region (59)
- Tonga - Ha'apai (TOHA01) — 30% coral cover
- Tonga - Ha'apai (TOHA02) — 31% coral cover
- Tonga - Ha'apai (TOHA03) — 20% coral cover
- Tonga - Ha'apai (TOHA04) — 25% coral cover
- Tonga - Ha'apai (TOHA05) — 35% coral cover
- Tonga - Ha'apai (TOHA06) — 23% coral cover
- Tonga - Ha'apai (TOHA07) — 16% coral cover
- Tonga - Ha'apai (TOHA08) — 22% coral cover
- Tonga - Ha'apai (TOHA09) — 25% coral cover
- Tonga - Ha'apai (TOHA10) — 40% coral cover
- Tonga - Ha'apai (TOHA11) — 50% coral cover
- Tonga - Ha'apai (TOHA12) — 45% coral cover
- Tonga - Ha'apai (TOHA13) — 23% coral cover
- Tonga - Ha'apai (TOHA14) — 44% coral cover
- Tonga - Ha'apai (TOHA15) — 41% coral cover
- Tonga - Ha'apai (TOHA16) — 18% coral cover
- Tonga - Ha'apai (TOHA17) — 21% coral cover
- Tonga - Ha'apai (TOHA18) — 53% coral cover
- Tonga - Ha'apai (TOHA19) — 26% coral cover
- Tonga - Ha'apai (TOHA20) — 26% coral cover
- Tonga - Ha'apai (TOHA21) — 35% coral cover
- Tonga - Ha'apai (TOHA22) — 40% coral cover
- Tonga - Ha'apai (TOHA23) — 37% coral cover
- Tonga - Ha'apai (TOHA24) — 26% coral cover
- Tonga - Ha'apai (TOHA25) — 8.6% coral cover
- Tonga - Ha'apai (TOHA26) — 31% coral cover
- Tonga - Ha'apai (TOHA27) — 31% coral cover
- Tonga - Ha'apai (TOHA28) — 31% coral cover
- Tonga - Ha'apai (TOHA29) — 42% coral cover
- Tonga - Ha'apai (TOHA30) — 40% coral cover
- Tonga - Ha'apai (TOHA31) — 34% coral cover
- Tonga - Ha'apai (TOHA32) — 34% coral cover
- Tonga - Niua (TONI54) — 34% coral cover
- Tonga - Niua (TONI55) — 33% coral cover
- Tonga - Niua (TONI56) — 44% coral cover
- Tonga - Niua (TONI57) — 15% coral cover
- Tonga - Niua (TONI58) — 18% coral cover
- Tonga - Niua (TONI59) — 34% coral cover
- Tonga - Vava'u (TOVA33) — 33% coral cover
- Tonga - Vava'u (TOVA34) — 50% coral cover
- Tonga - Vava'u (TOVA35) — 41% coral cover
- Tonga - Vava'u (TOVA36) — 30% coral cover
- Tonga - Vava'u (TOVA37) — 28% coral cover
- Tonga - Vava'u (TOVA38) — 41% coral cover
- Tonga - Vava'u (TOVA39) — 15% coral cover
- Tonga - Vava'u (TOVA40) — 21% coral cover
- Tonga - Vava'u (TOVA41) — 31% coral cover
- Tonga - Vava'u (TOVA42) — 32% coral cover
- Tonga - Vava'u (TOVA43) — 33% coral cover
- Tonga - Vava'u (TOVA44) — 53% coral cover
- Tonga - Vava'u (TOVA45) — 38% coral cover
- Tonga - Vava'u (TOVA46) — 19% coral cover
- Tonga - Vava'u (TOVA47) — 44% coral cover
- Tonga - Vava'u (TOVA48) — 22% coral cover
- Tonga - Vava'u (TOVA49) — 22% coral cover
- Tonga - Vava'u (TOVA50) — 9.6% coral cover
- Tonga - Vava'u (TOVA51) — 35% coral cover
- Tonga - Vava'u (TOVA52) — 47% coral cover
- Tonga - Vava'u (TOVA53) — 38% coral cover
% coral cover by method
Pooled across 22 dive sites
| Method | Mean % coral cover | Std. dev. between dive sites | n dive sites | Note |
|---|---|---|---|---|
| CoralSCOP (SAM-based mask-sum), unedited photos | 33% | ±6.1 | 22 | — |
| Claude (Anthropic), blind point count | 32% | ±11 | 22 | — |
| In-water diver transect (line/point intercept) | 36% | ±8.6 | 22 | — |
The mean is an UNWEIGHTED mean of the dive site values — each dive site counts once, whatever its photo count — which is the convention of the published tables and of every other figure on this page. Each value is the one printed on that dive site's own page; a page that prints no value for a method (fewer than 10 photographs) is left out of that method's mean.
Deviation from the reference
Over the dive sites where an independent reference exists, Claude (Anthropic), blind point count has a mean absolute deviation of 8.4 pp from it across 22 dive sites. Not in this ranking: CoralSCOP (unedited), which is not comparable with this reference. A mean absolute deviation is not an accuracy score: a model with a consistent offset is correctable, while one with the same deviation scattered in both directions is not.
By dive site
| Dive site | CoralSCOP (unedited) | Claude | Diver transect |
|---|---|---|---|
| TOHA03 | 32% n=16 | 20% n=16 | 20% |
| TOHA04 | 26% n=14 | 18% n=14 | 25% |
| TOHA08 | 28% n=26 | 34% n=26 | 22% |
| TOHA10 | 25% n=23 | 29% n=23 | 40% |
| TOHA14 | 33% n=38 | 36% n=38 | 44% |
| TOHA18 | 29% n=16 | 48% n=16 | 53% |
| TOHA21 | 38% n=12 | 32% n=12 | 35% |
| TOHA22 | 21% n=21 | 12% n=21 | 40% |
| TOHA27 | 39% n=13 | 25% n=13 | 31% |
| TOHA28 | 32% n=17 | 46% n=17 | 31% |
| TOHA29 | 41% n=13 | 45% n=13 | 42% |
| TOHA30 | 36% n=10 | 36% n=10 | 40% |
| TOHA31 | 39% n=18 | 37% n=18 | 34% |
| TOHA32 | 27% n=11 | 44% n=11 | 34% |
| TONI54 | 34% n=13 | 20% n=13 | 34% |
| TONI55 | 34% n=15 | 35% n=15 | 33% |
| TOVA33 | 36% n=21 | 33% n=21 | 33% |
| TOVA37 | 25% n=18 | 12% n=18 | 28% |
| TOVA38 | 31% n=41 | 30% n=41 | 41% |
| TOVA44 | 40% n=15 | 32% n=15 | 53% |
| TOVA52 | 43% n=17 | 43% n=17 | 47% |
| TOVA53 | 39% n=34 | 40% n=34 | 38% |
n under each value is the number of photographs that method scored at that dive site. ⚠ marks a cell that is not an independent check.
Reference: Living Oceans Foundation (LOF) Global Reef Expedition in-water transects (mean of all the station's transects, Living Oceans Foundation per-transect benthic data). Denominator: line/point intercept along the transect; not a photo-point denominator. Source: LOF Global Reef Expedition 2013, per-transect benthic data ('GRE data-full benthic'): the mean of all of each station's transects The transect is THE coral-cover value at every site; the Claude photo estimate is a methods comparison only, never averaged with the transect and never a headline. Site-level only: the photos come from the survey dives, not from the transect points. Accuracy, Claude vs transect, the 22 sites with 10 or more reef-habitat photos (sampled-colony close-ups left out; sites with fewer than 10 have no Claude row): mean difference -4.2 pp (95% CI -8.8 to +0.5), mean absolute difference 8.4 pp, r 0.43. Claude tracks the transect only weakly from site to site in Tonga. This is a methods comparison, not a ranking.
Nearby external survey stations
3 independent survey records within 5 km of a site in this region (each record counted once; 2 lines, and a line that pools several records says how many).
- Reef Check — Kito si'I (2002): 18% hard coral cover, mean of 2 surveys (3 m and 10 m), 2.11 km from Tonga - Ha'apai (TOHA03) (2 records)
- Reef Check — The Coral Gardens (2013): 59% hard coral cover, 1.34 km from Tonga - Vava'u (TOVA34)
All images from Coral Reef Diagnostics. Data are from the Khaled bin Sultan Living Oceans Foundation Global Reef Expedition, Coral Reef Diagnostics, and Reef Check Foundation.
© Coral Reef Diagnostics.
References
- Spalding MD, Ravilious C, Green EP (2001). World Atlas of Coral Reefs. University of California Press, Berkeley. PDF