
Chagos Archipelago - Great Chagos Bank West / Brothers / Eagle

Regional summary of 50 dive sites. Figures are averages across the sites that report them (n = sites with a value); each site's own page has its individual values. Part of the Chagos Archipelago overview.
⬇ Download this region as a report card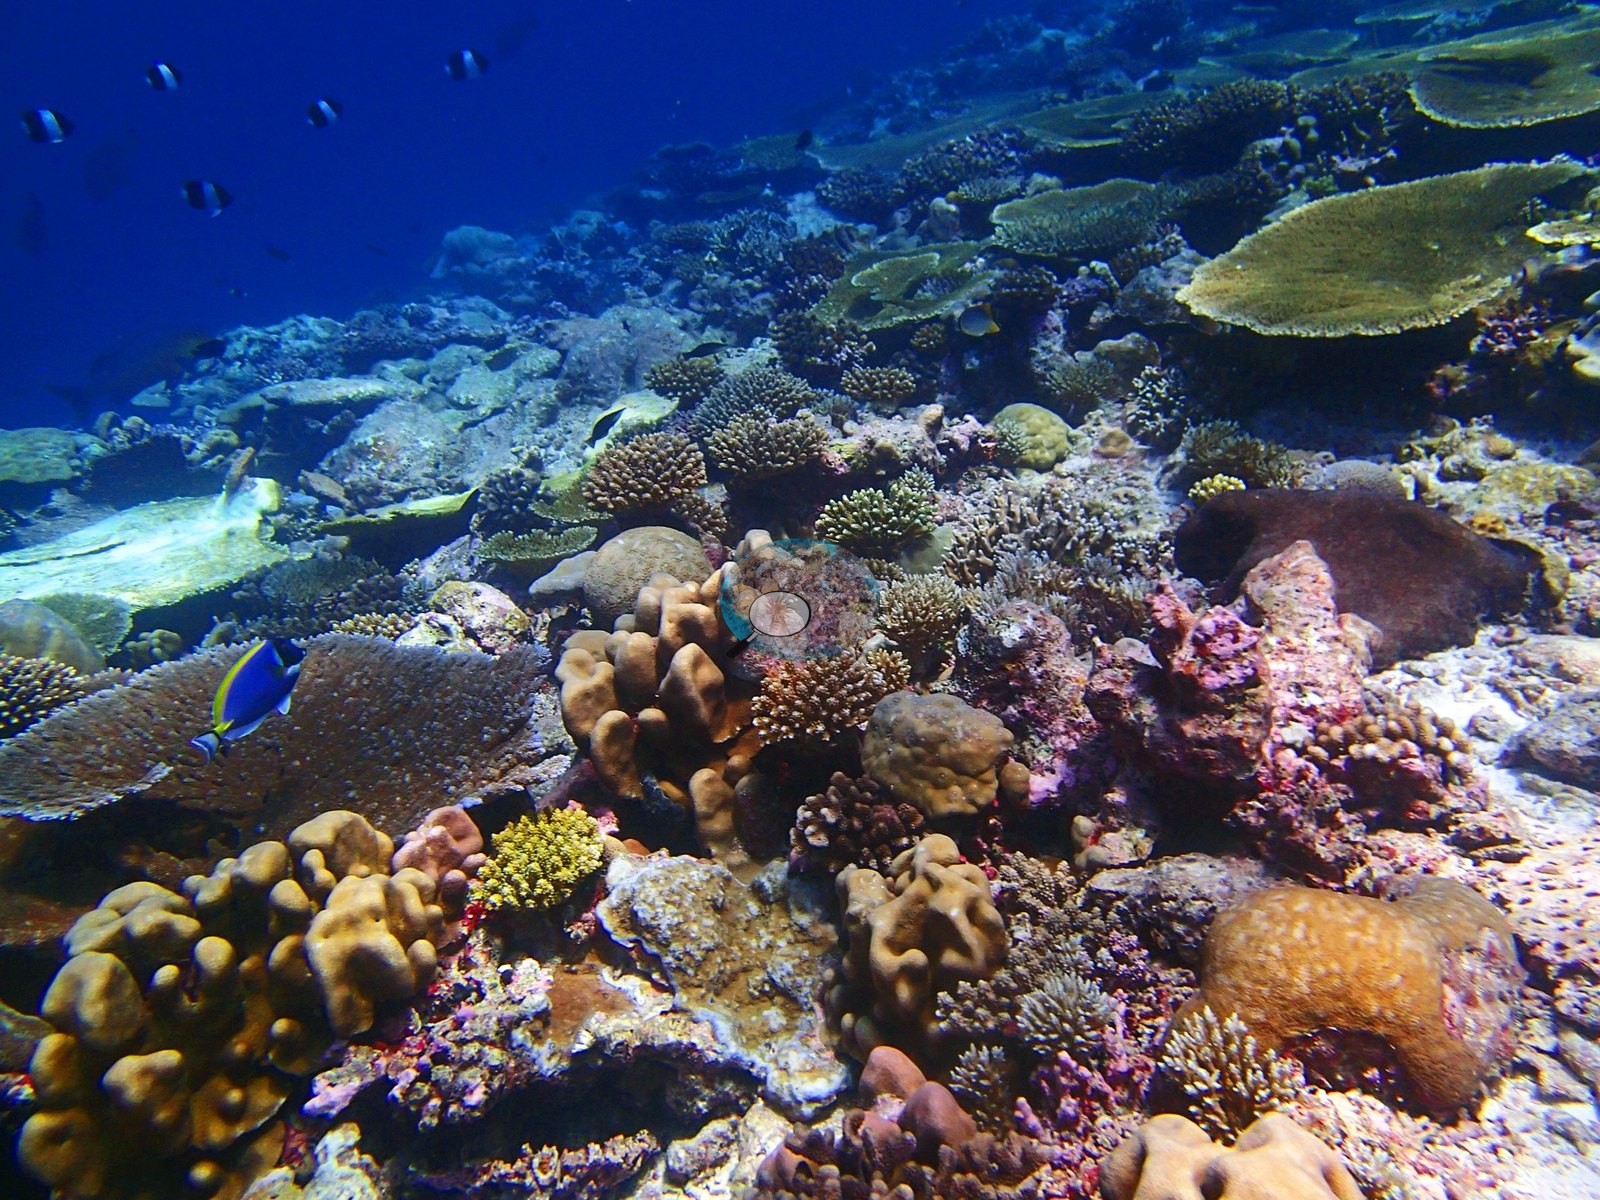

Fifty sheltered lagoon, bank, and channel reefs on the western Great Chagos Bank, dived in March 2015, range from algae-dominated banks to the rich Three Brothers reefs, where one depth band was 93% blue coral. Sharks were seen throughout, and young corals were recolonizing old dead pavement.
Heat stress
Long-term record: 3 years since 1985 reached 8 or more °C-weeks at NOAA’s Chagos station. Download the annual DHW data (CSV).
50 sites in this region — click a marker to open that site.
Regional setting
This unit sits on the western side of the Great Chagos Bank, a mostly submerged atoll that Spalding et al. (2001) rank as the world's largest atoll structure, at about 13,000 km². The atlas map places Eagle, the Three Brothers, and Danger Island along the western rim, and both Danger Island and the Three Brothers and Resurgent Islands were declared Strict Nature Reserves in 1998. Spalding et al. (2001) treat the Central Indian Ocean as a zone of transition, with coral diversity peaking in a narrow band, the "Chagos Stricture", centered on the southern Maldives and the Chagos. The Chagos reefs alone hold some 220 scleractinian species, with faunal ties to both Indonesia and East Africa. The same chapter ranks the Chagos among the least impacted reefs anywhere, and cites water-quality studies suggesting its waters are among the least polluted on Earth. Low human pressure did not spare these reefs from the 1998 bleaching, however. Corals had typically covered 50–80% of seaward and lagoon slopes to about 40 m, and seaward reefs are estimated to have lost 80–85% of their coral, on average. Spalding et al. (2001) estimate about 3,770 km² of reef across the whole archipelago, and Souter et al. (2021) give 2,731 km² for the Chagos ecoregion.
Wilkinson (2006), drawing on the 2004 status report, describes encouraging recovery in the Chagos after the 1998 die-off. Souter et al. (2021) show Chagos coral cover rising until about 2015 before the 2016 bleaching reversed the gains. That event killed more than 42% of living hard coral across South Asia, yet mortality was lower than in 1998, partly because less coral was left to die and partly because the surviving communities held more bleaching-resistant species. In 1998, Acropora and Echinopora had been the most vulnerable genera. Localized bleaching continued from 2017 to 2019. Souter et al. (2021) describe the Chagos atolls as protected, lightly pressured reefs, within the region's largest marine protected area (MPA), for which bleaching is the main threat.
Overview
This unit covers 50 sites on the western Great Chagos Bank, surveyed between 12 and 28 March 2015: the Three Brothers group, Eagle Island, the Danger Island reefs, and a set of Central Chagos lagoon banks. Most are sheltered lagoon, bank and channel reefs, with fringing forereefs off South and Middle Brother. Logged maximum depths ran from 16.4 m at BIDI08 to 31.1 m at BIEA24 (BITB49, BITB57, BIEA24.5 and BITB34.5 have no logged depth).
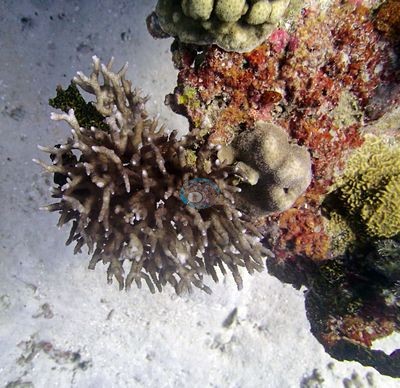
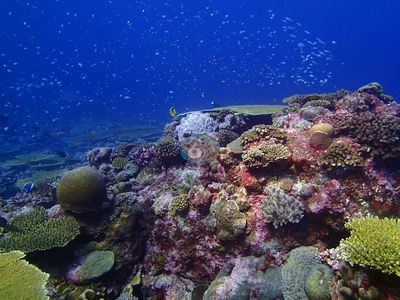
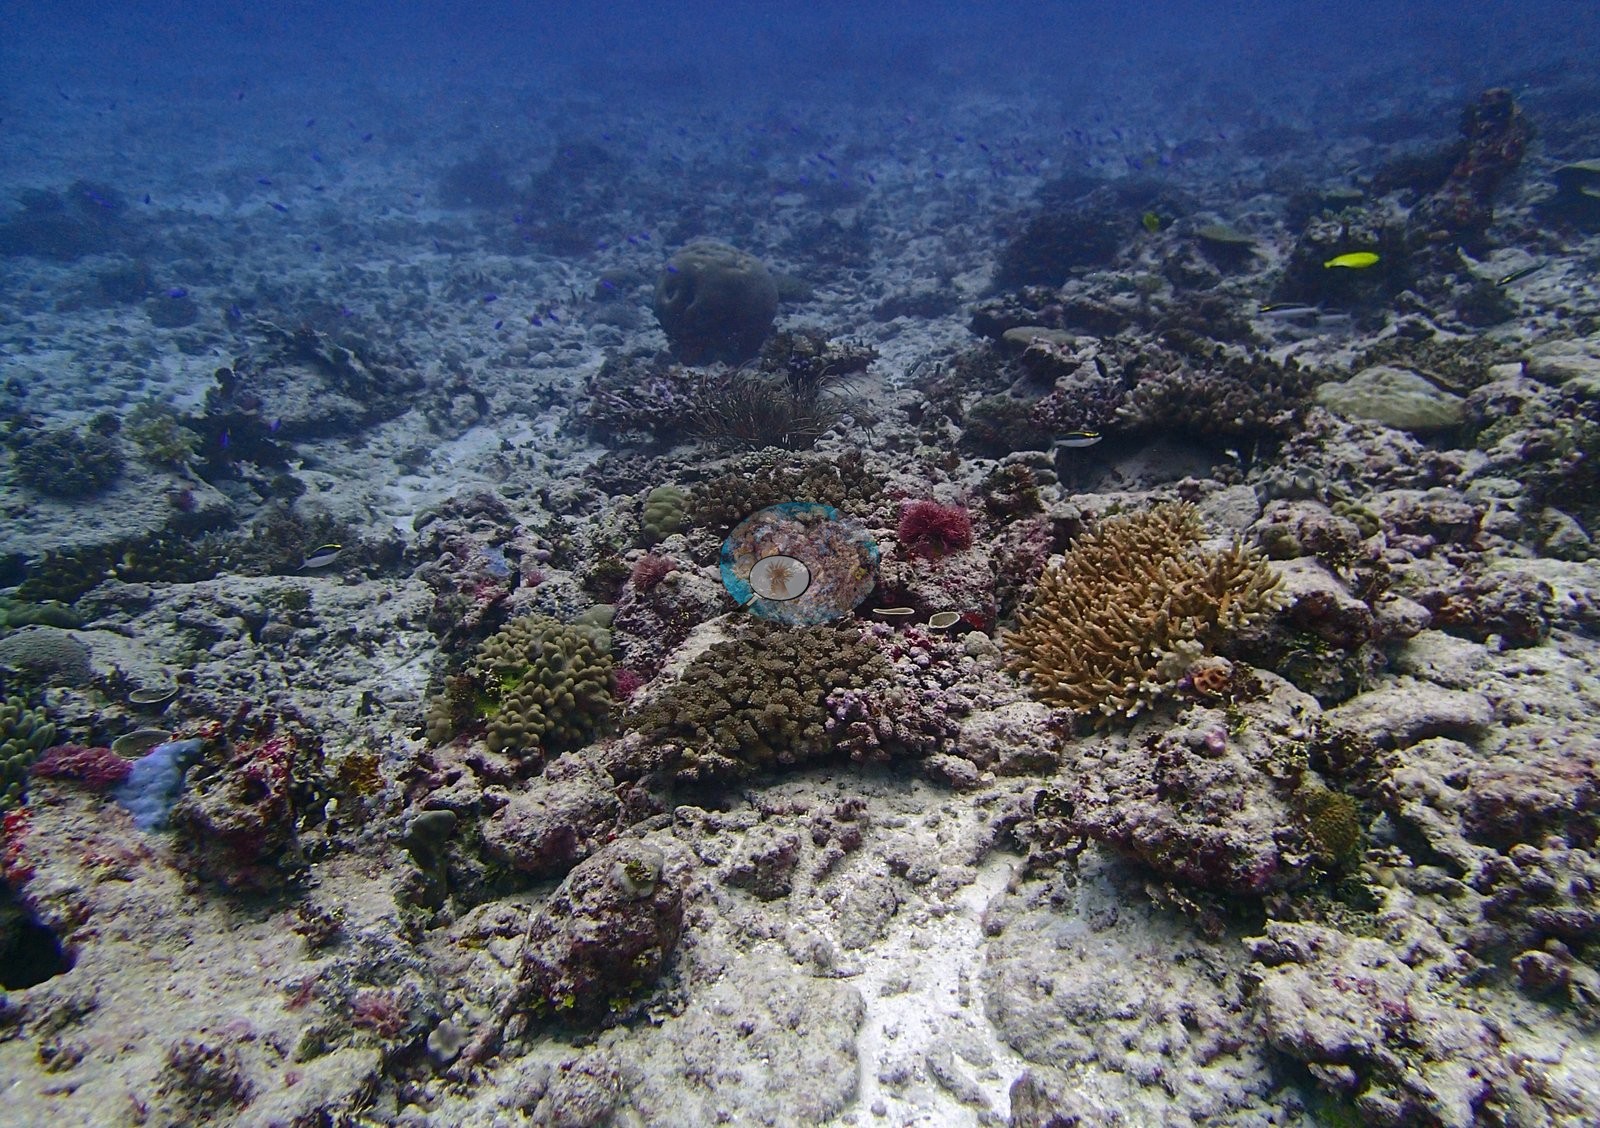
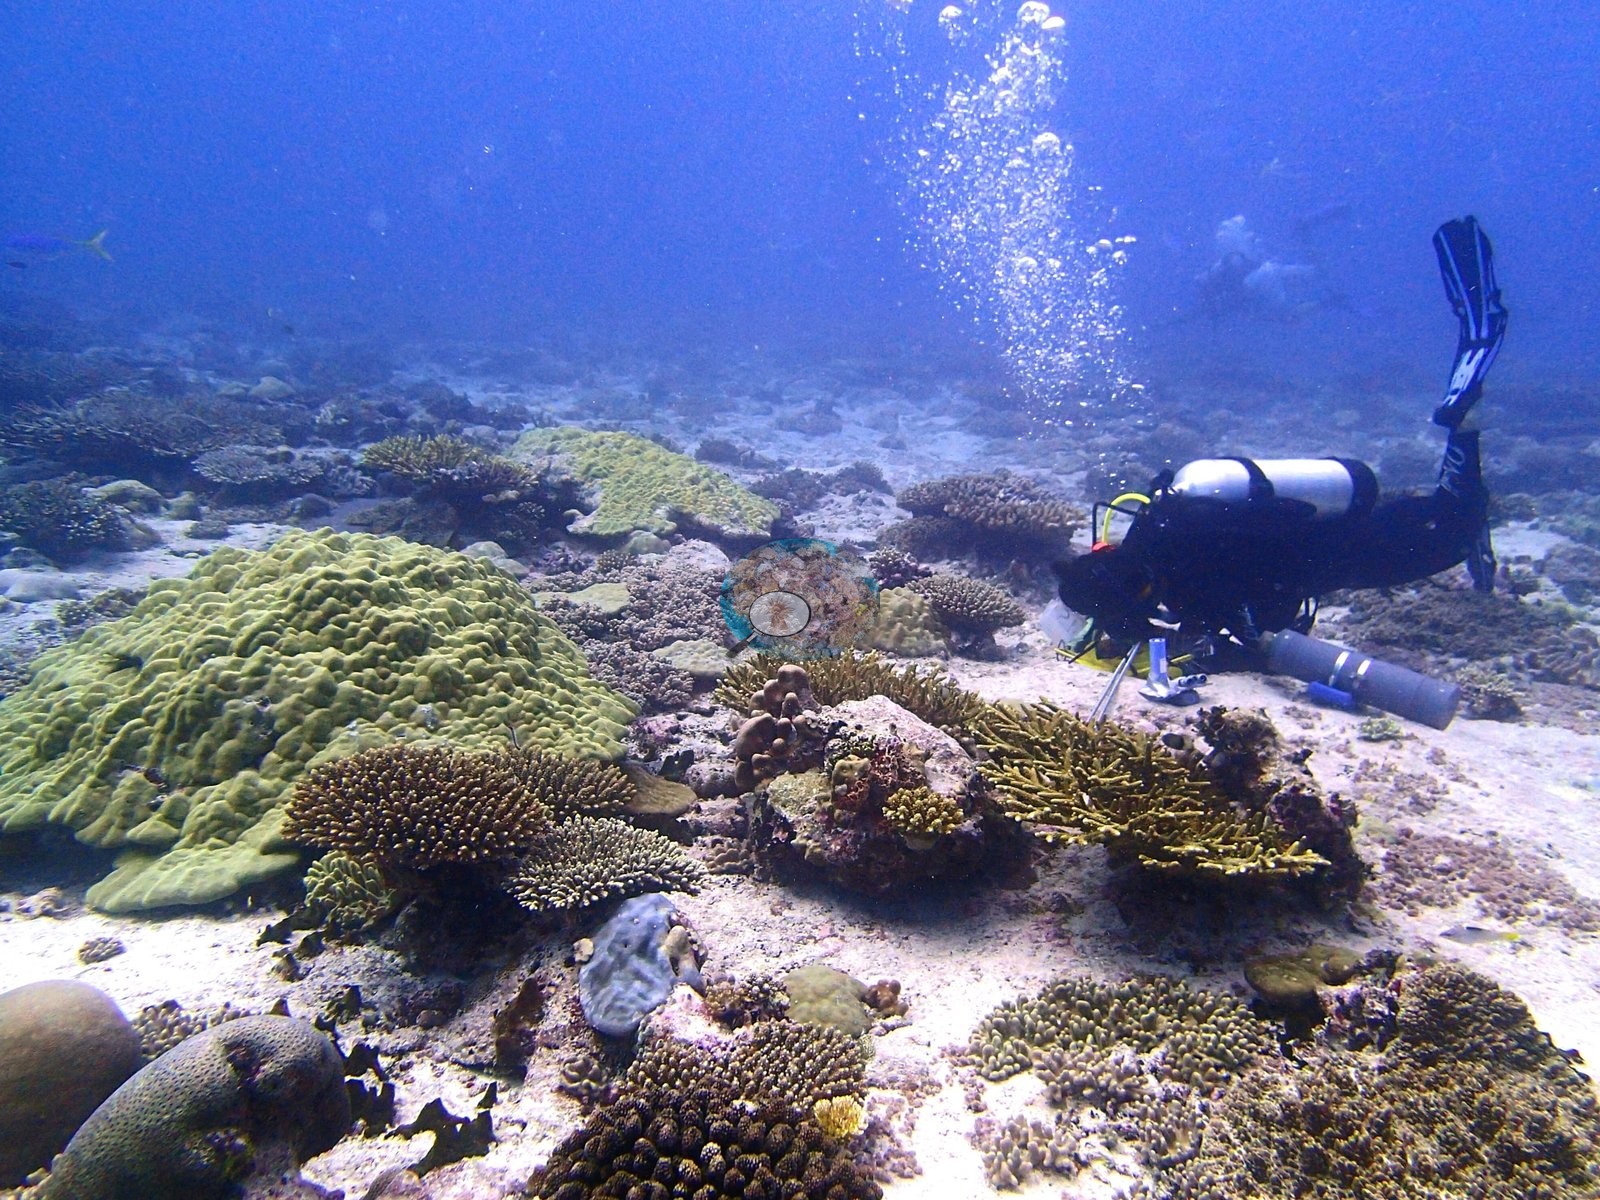
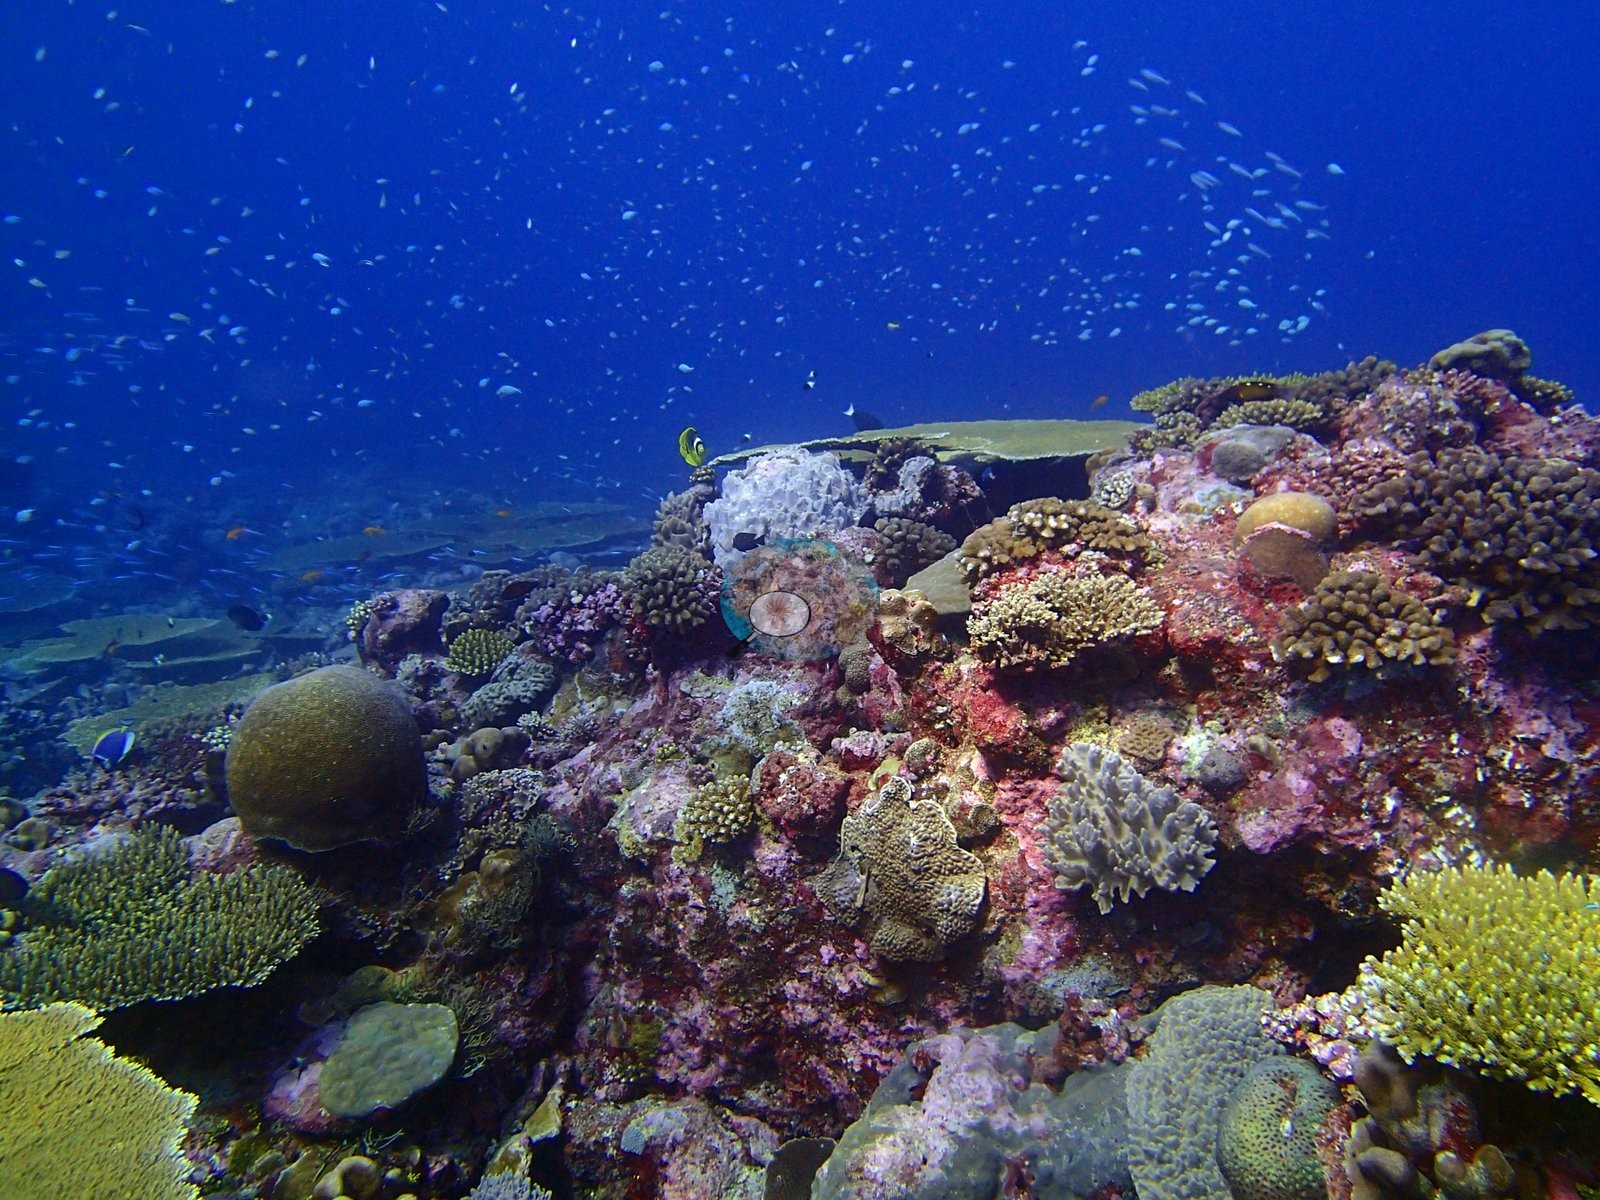
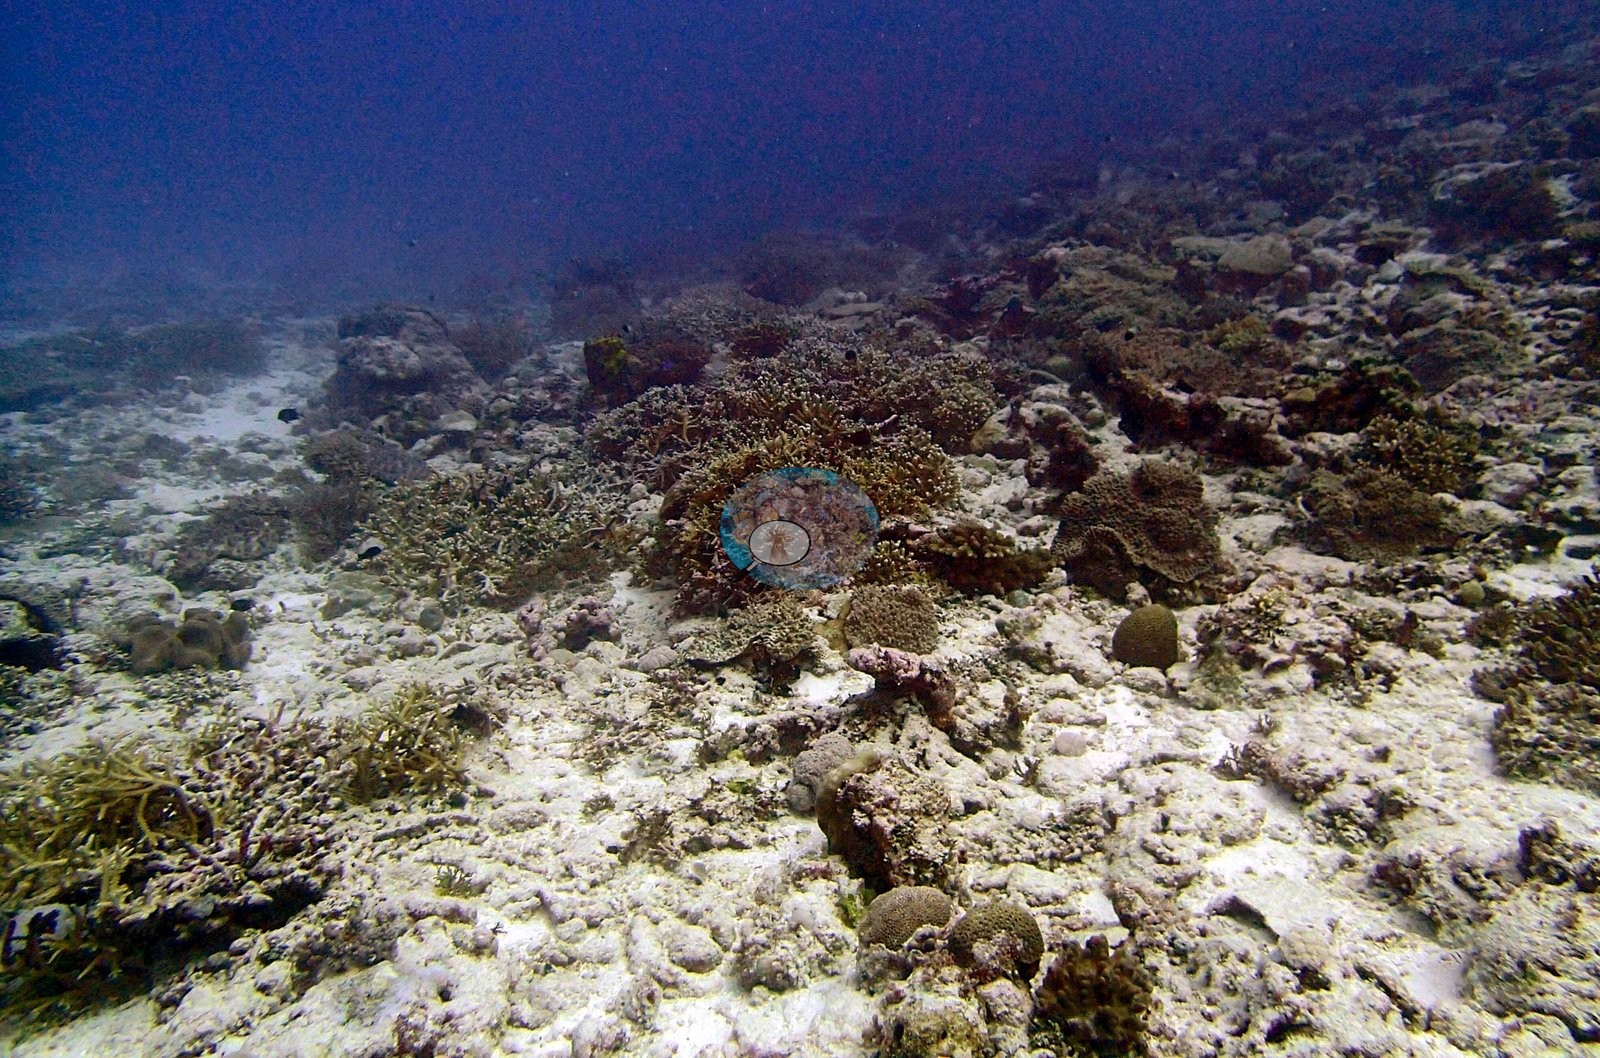
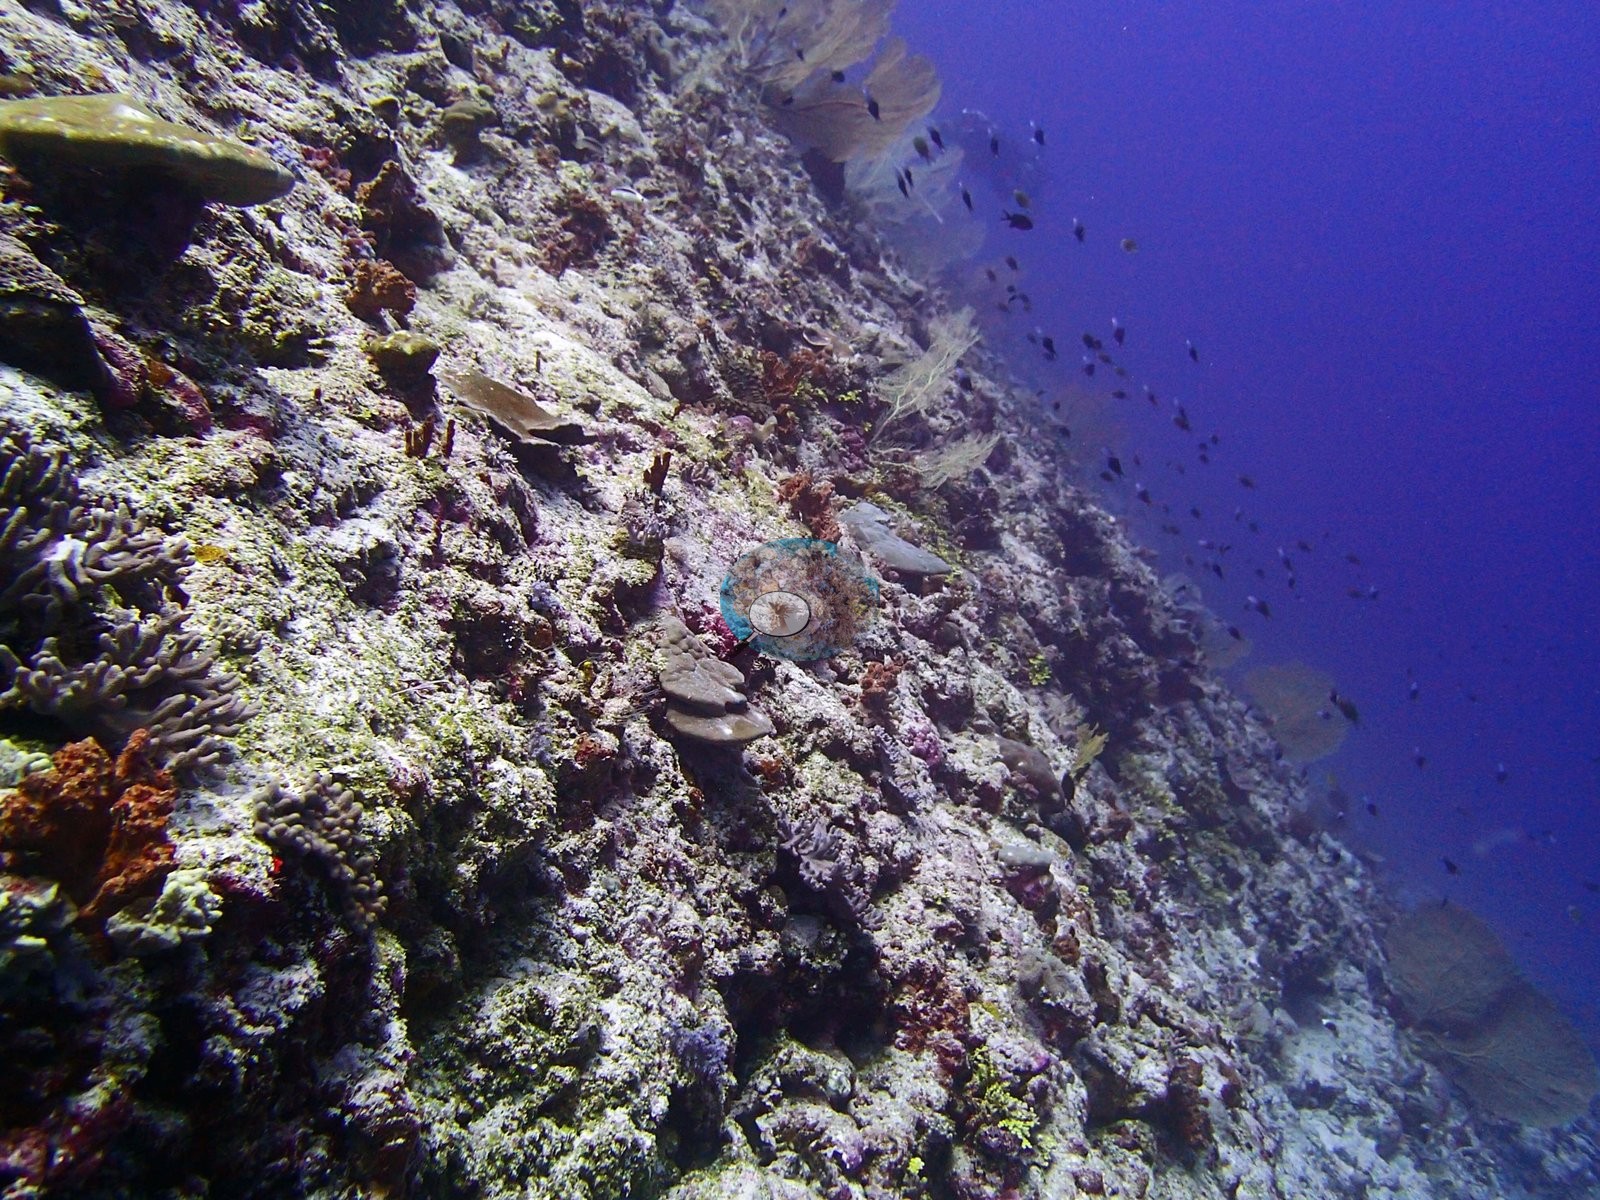
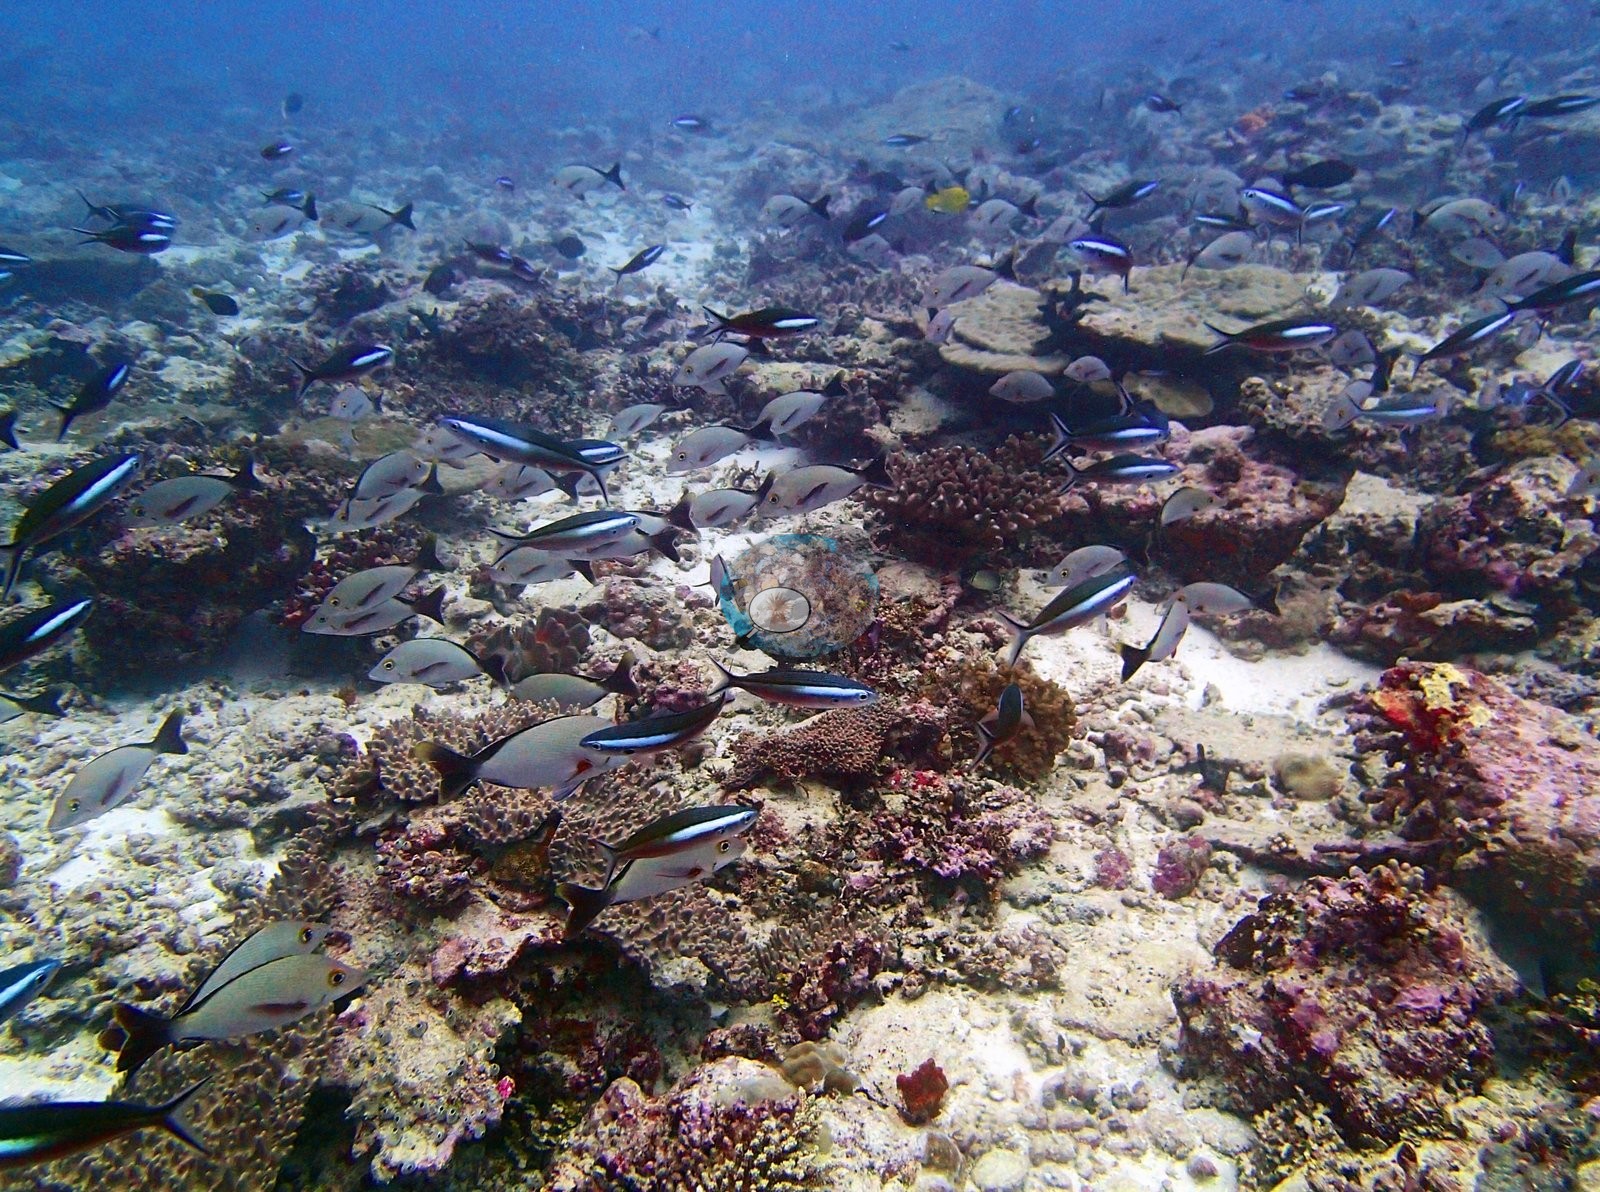
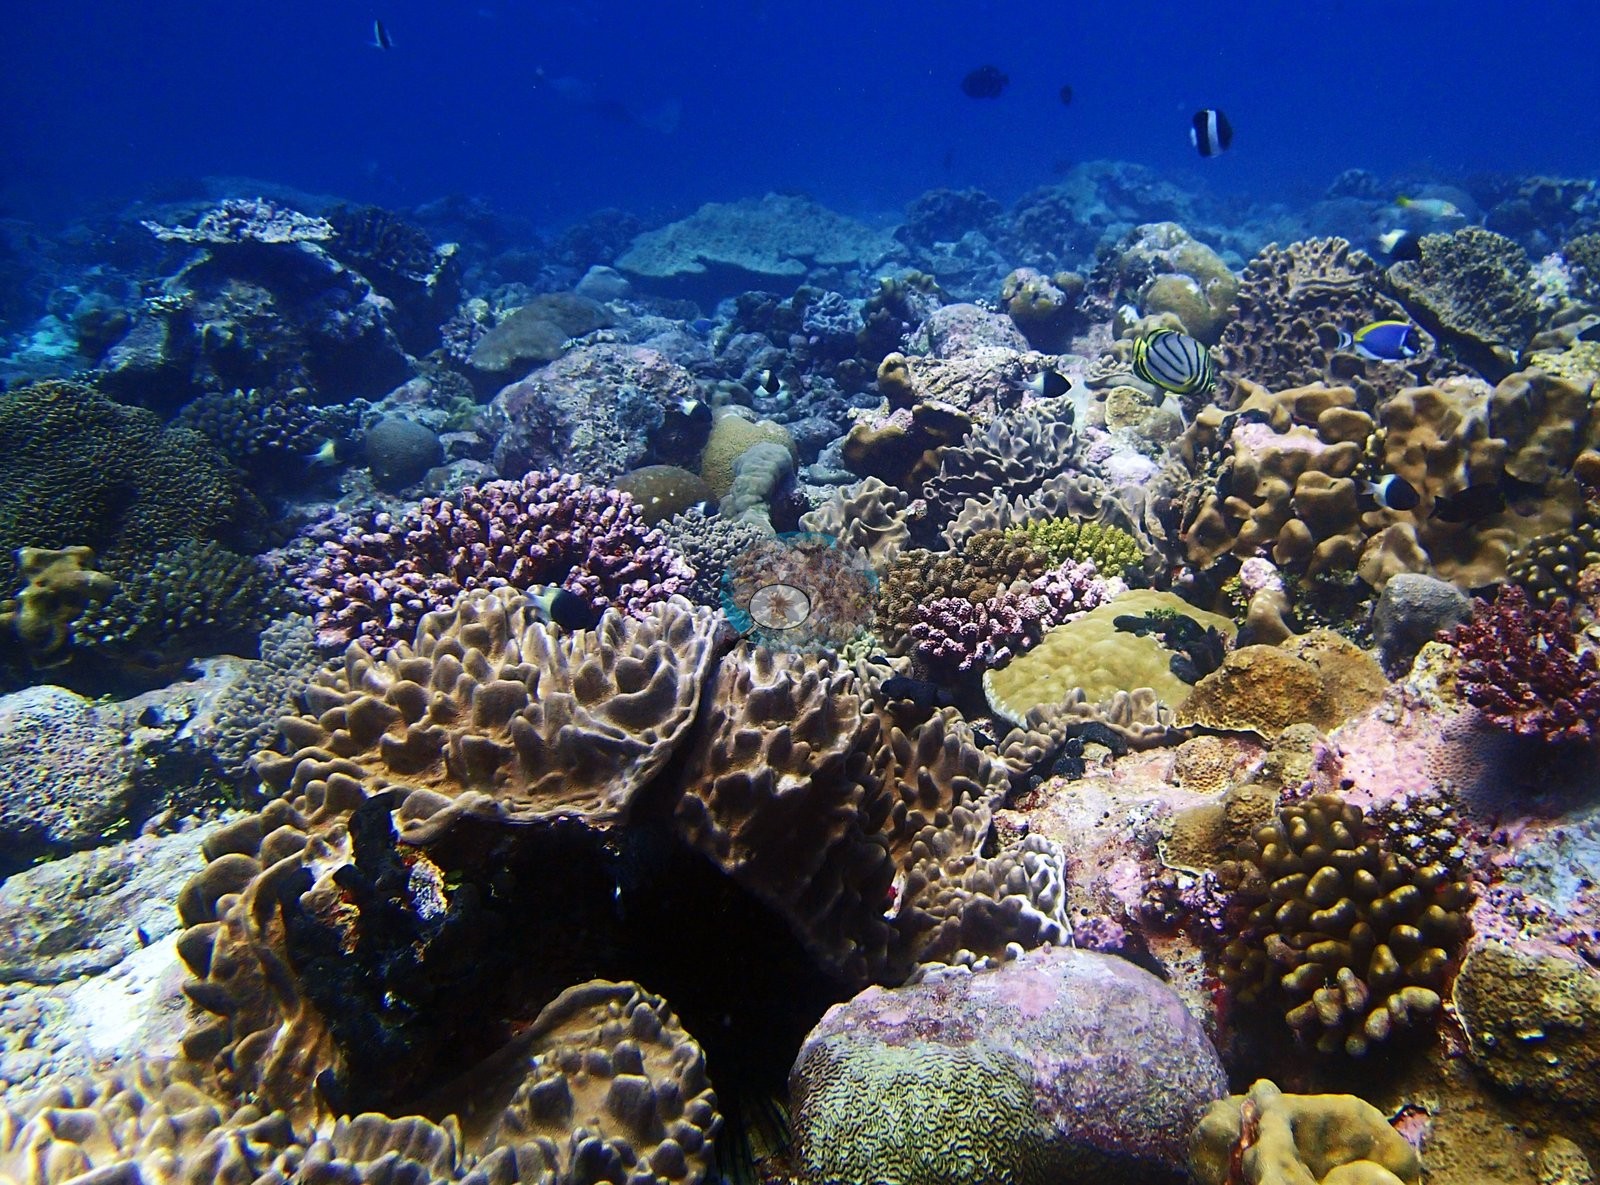
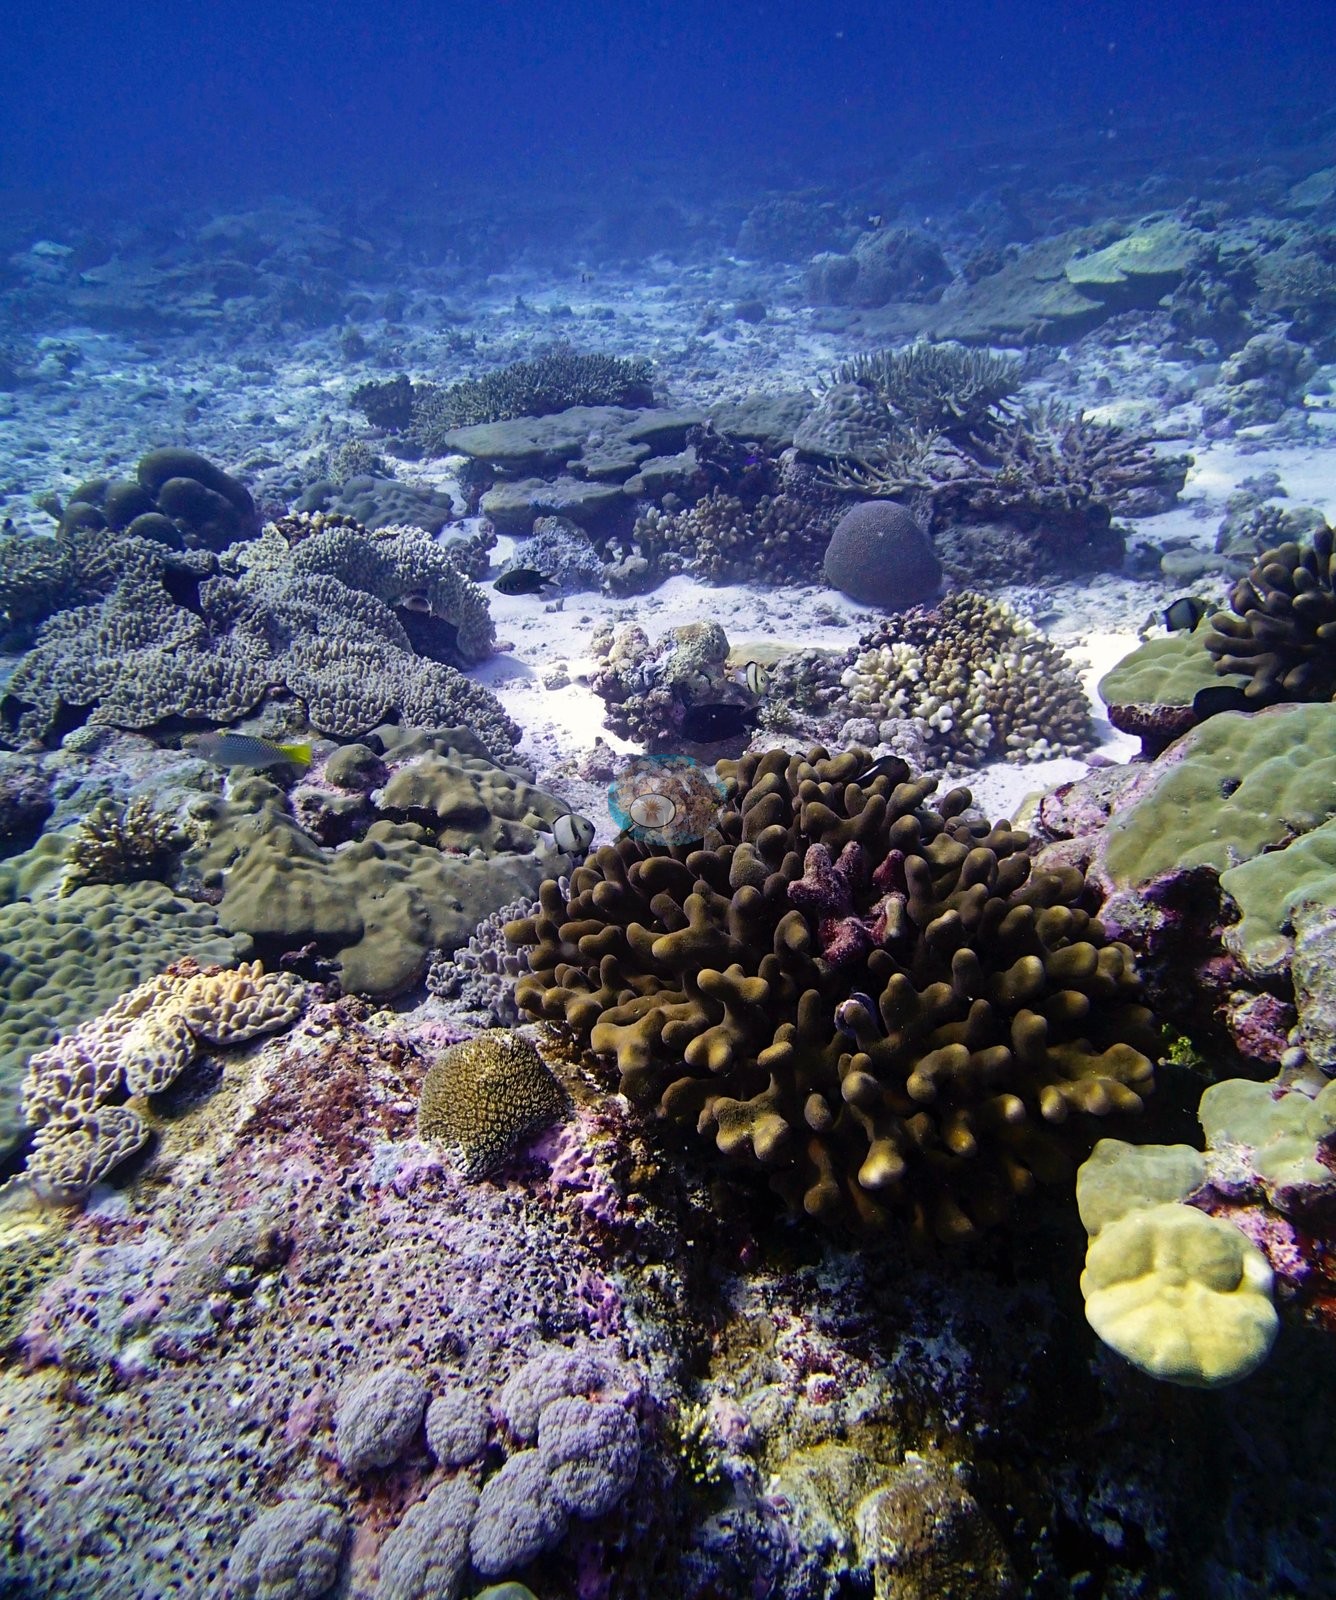
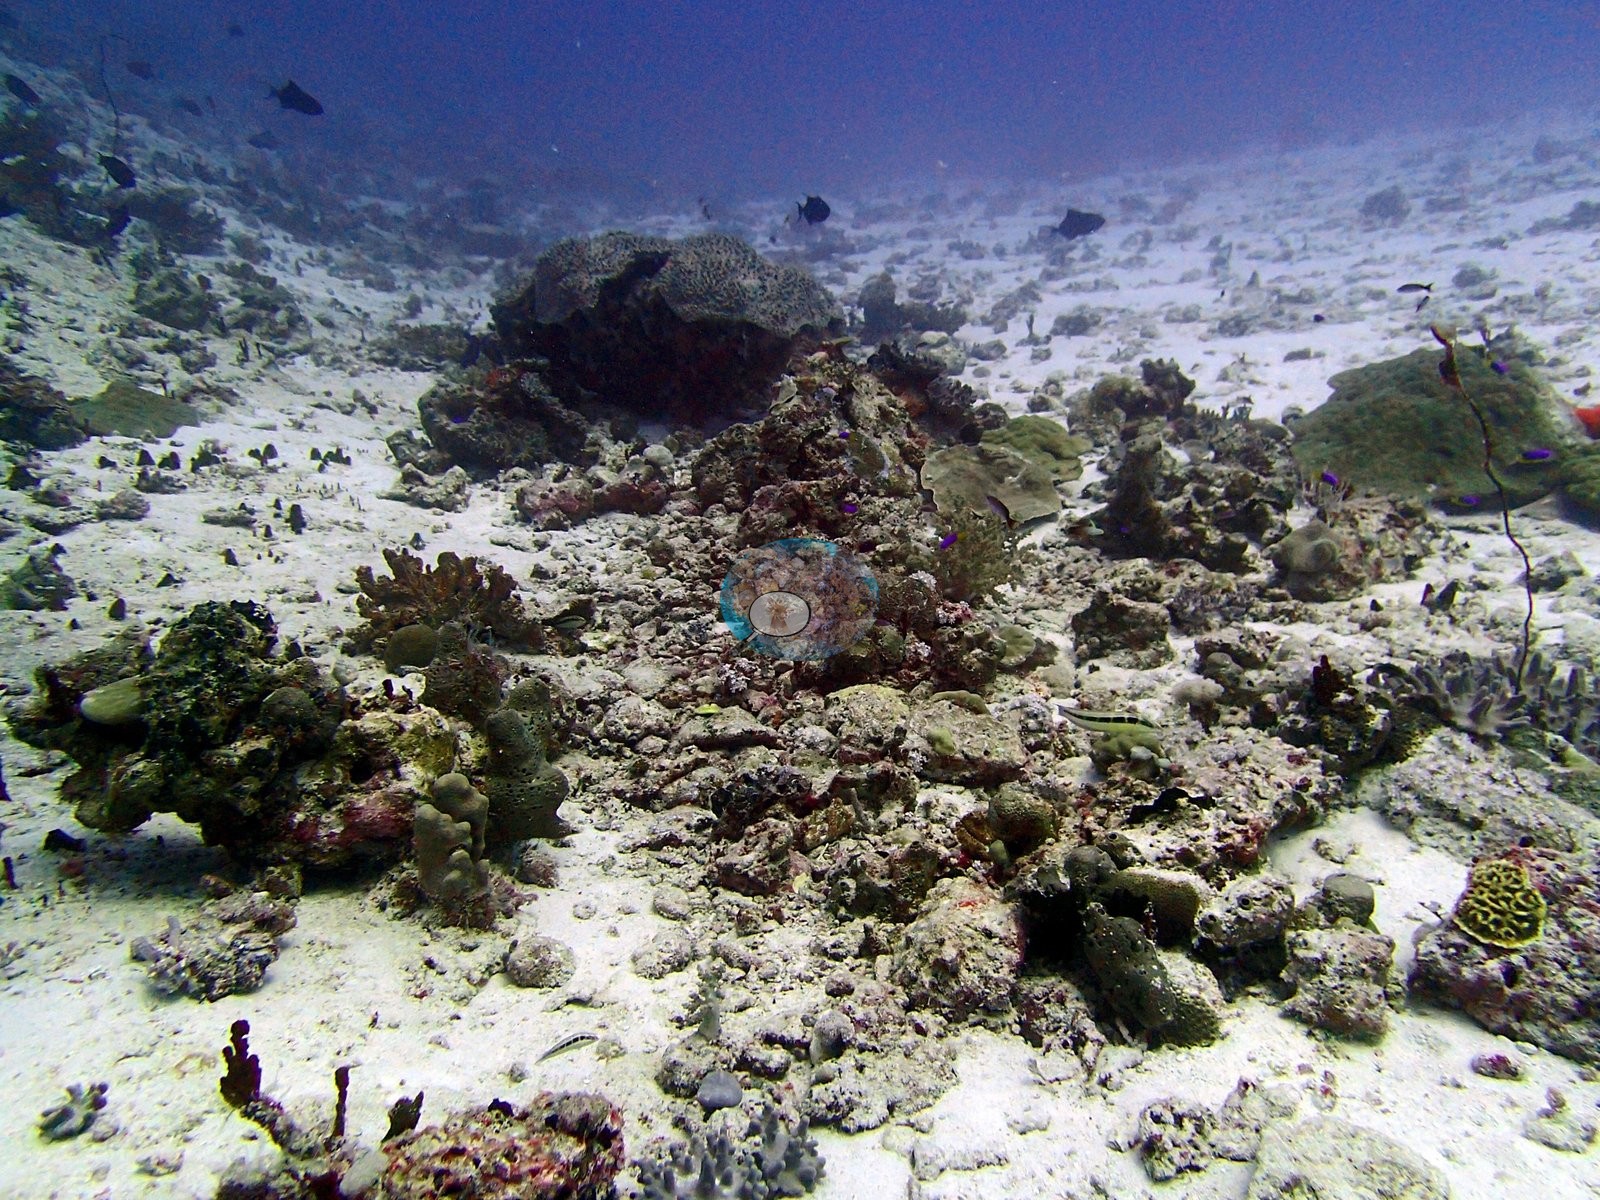
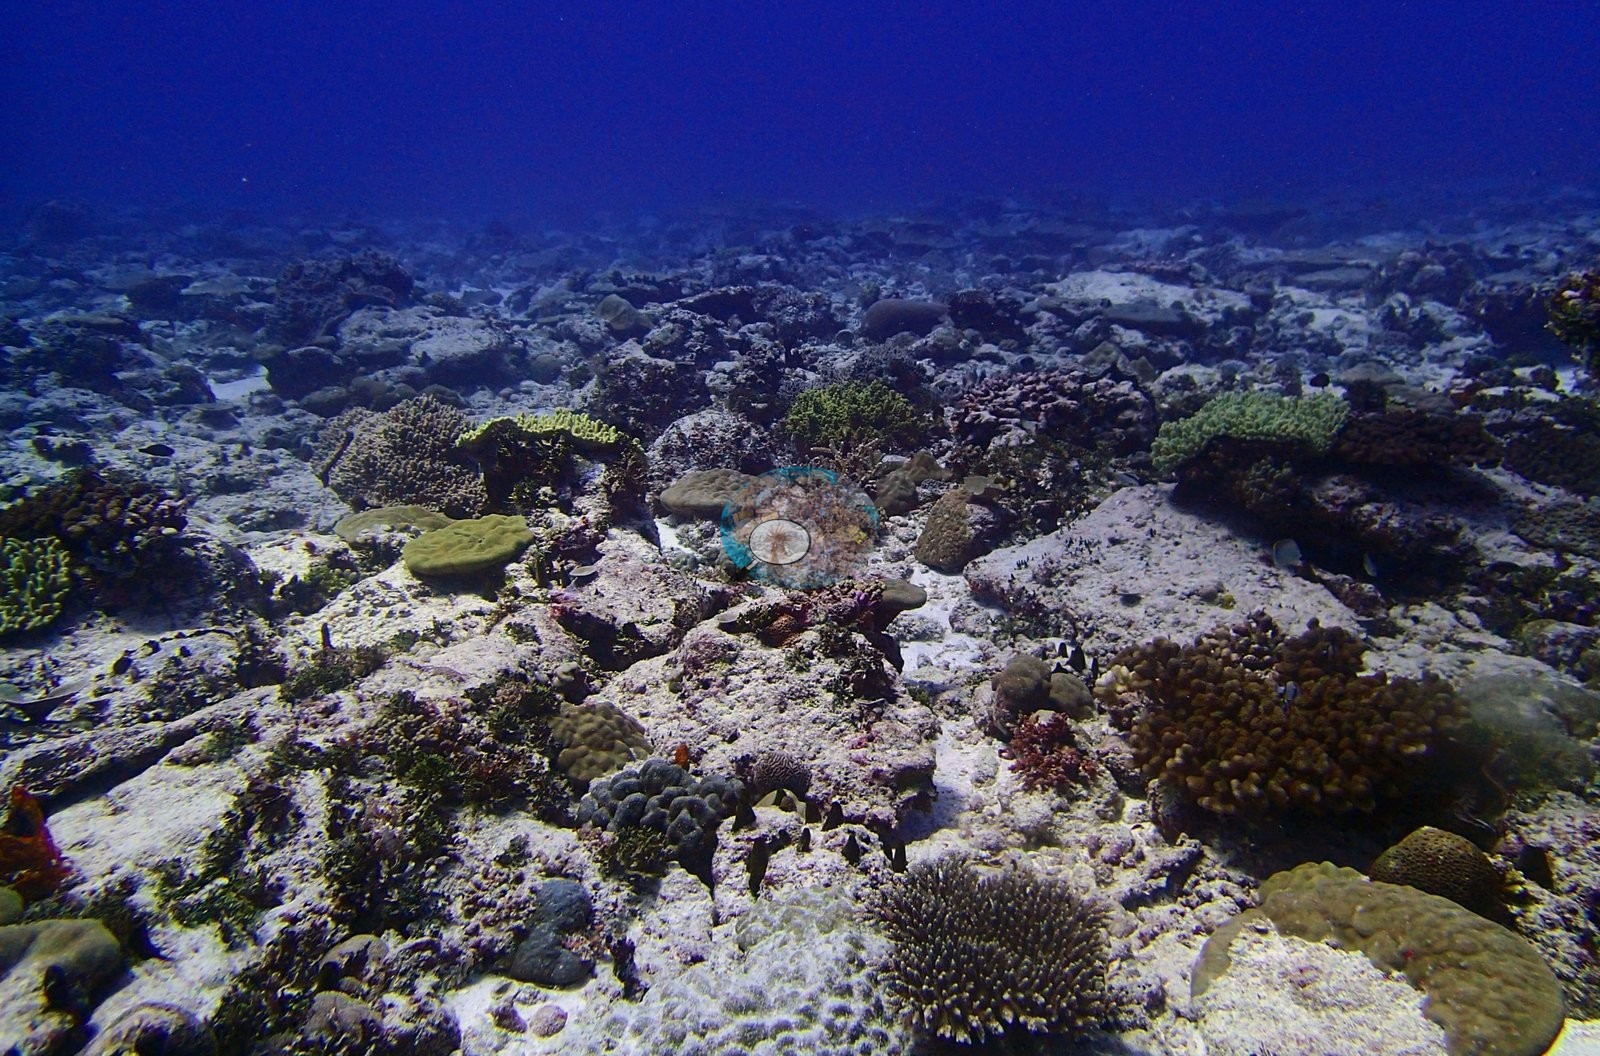
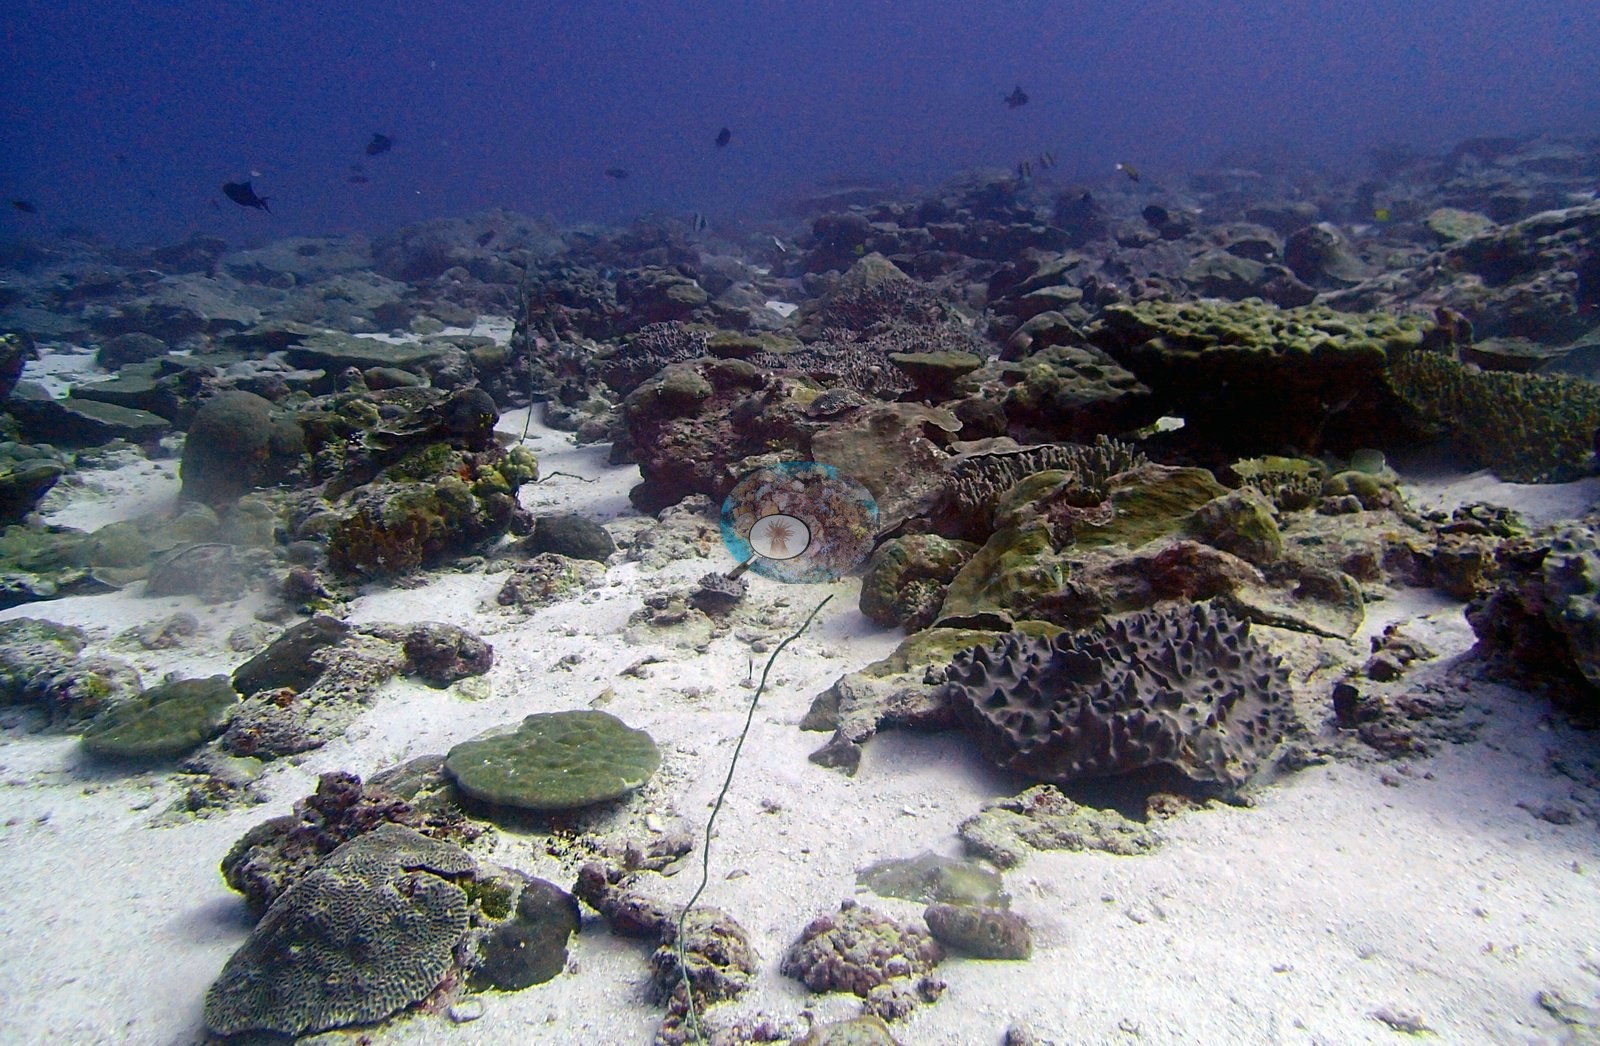
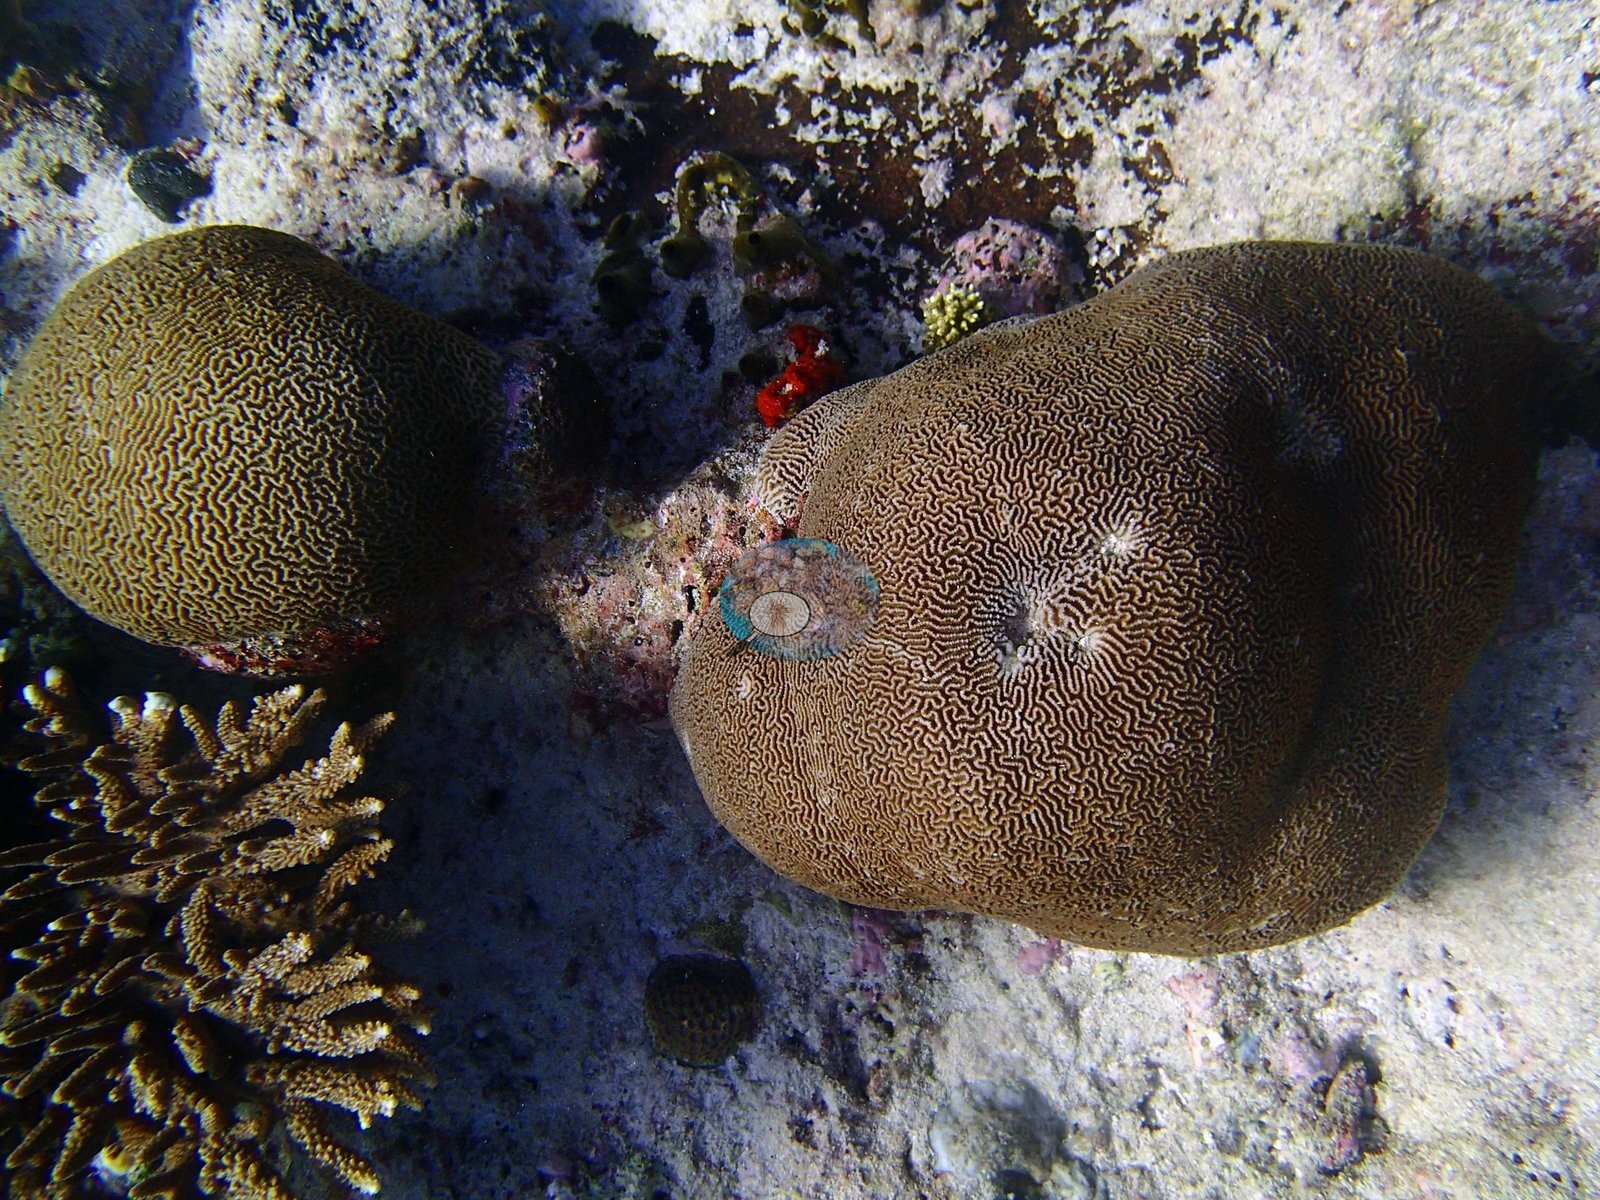
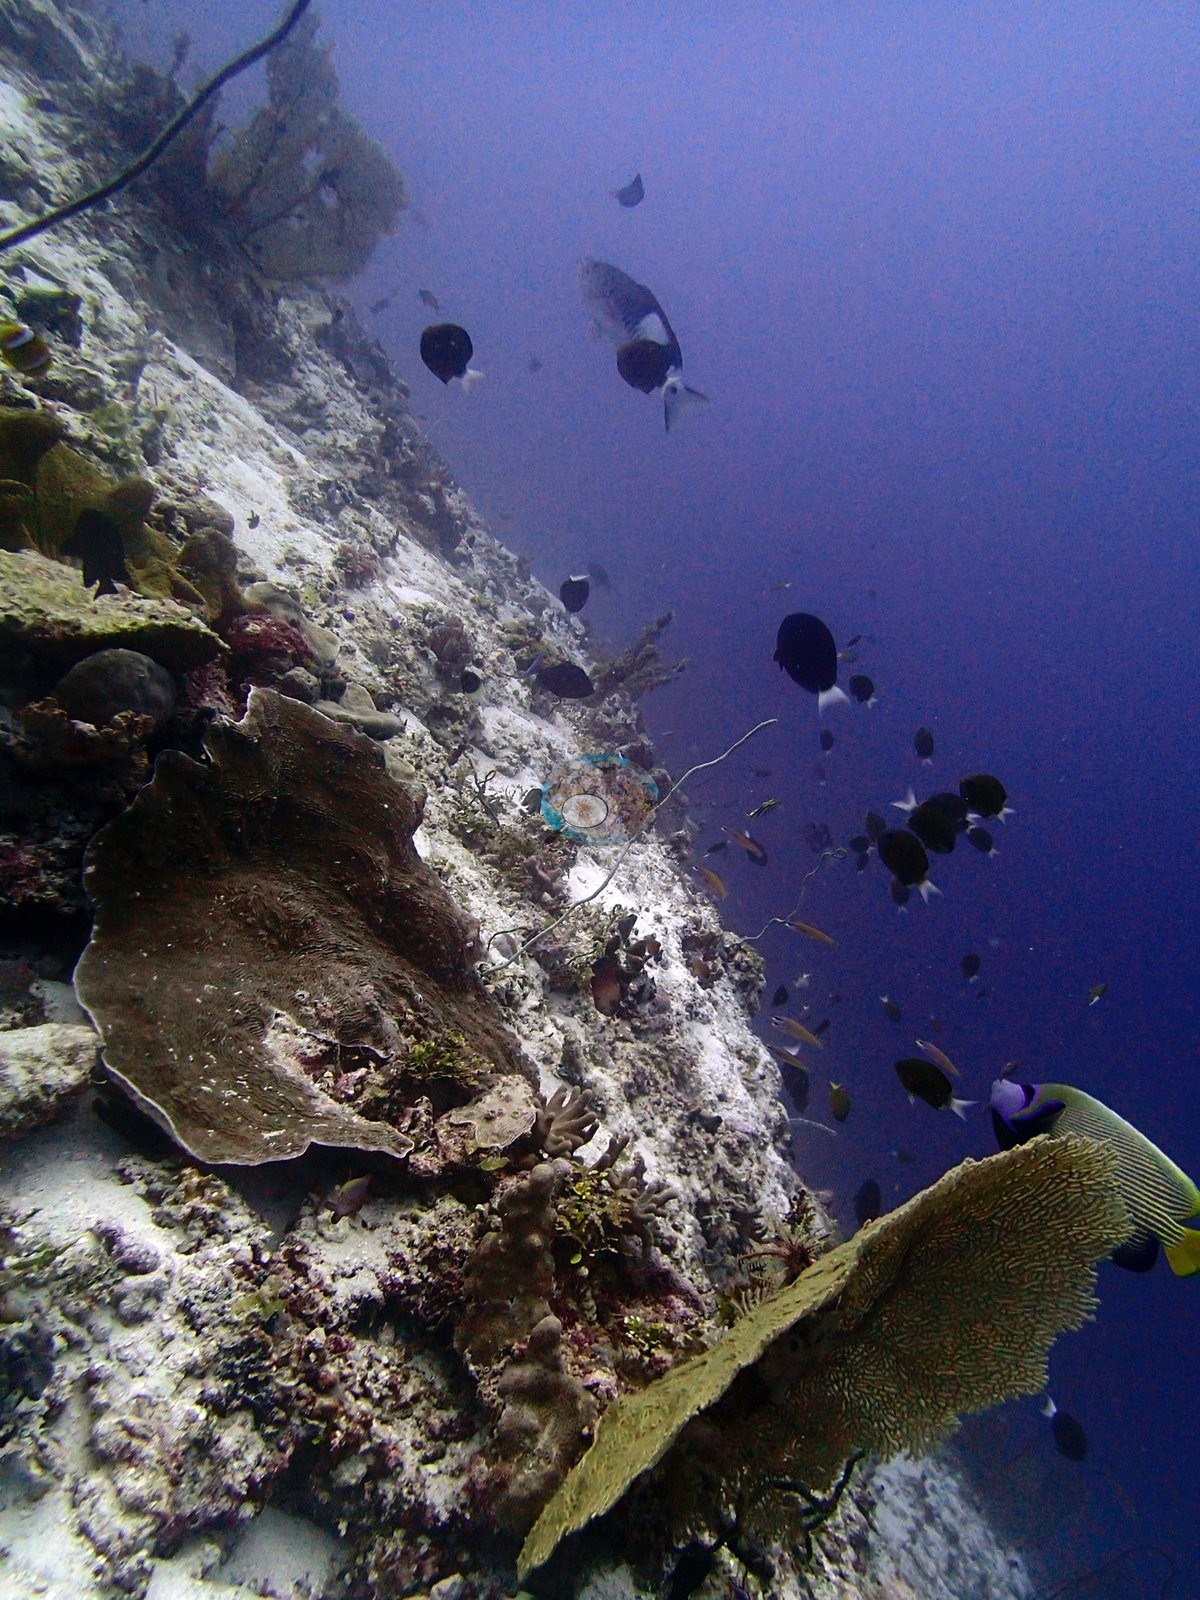
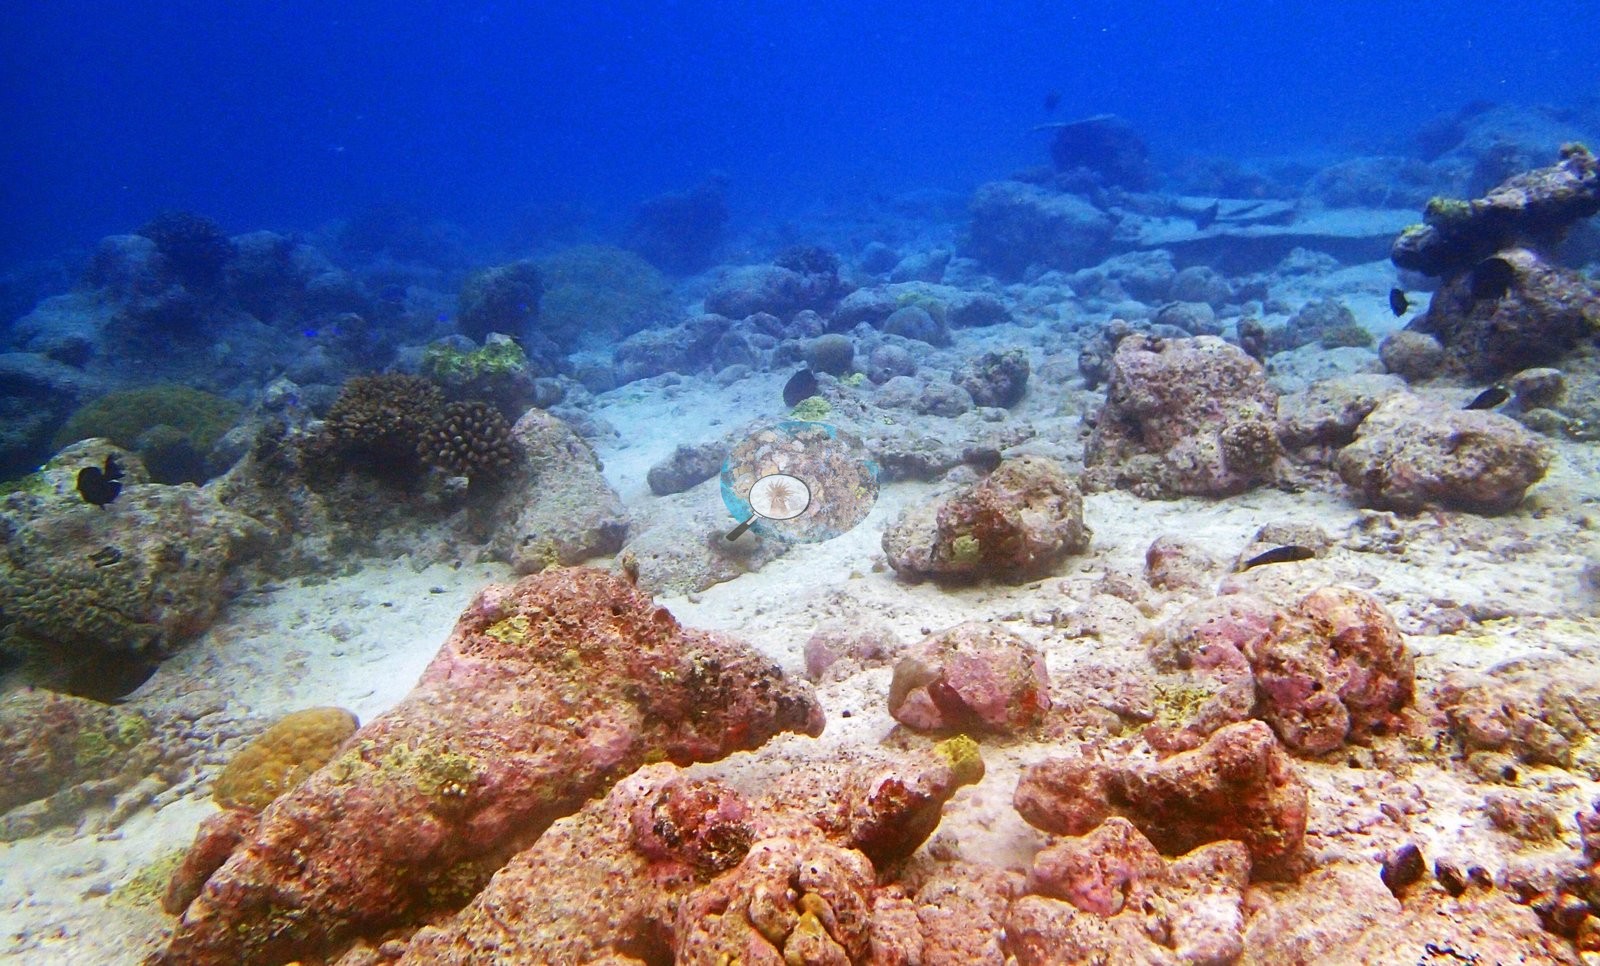
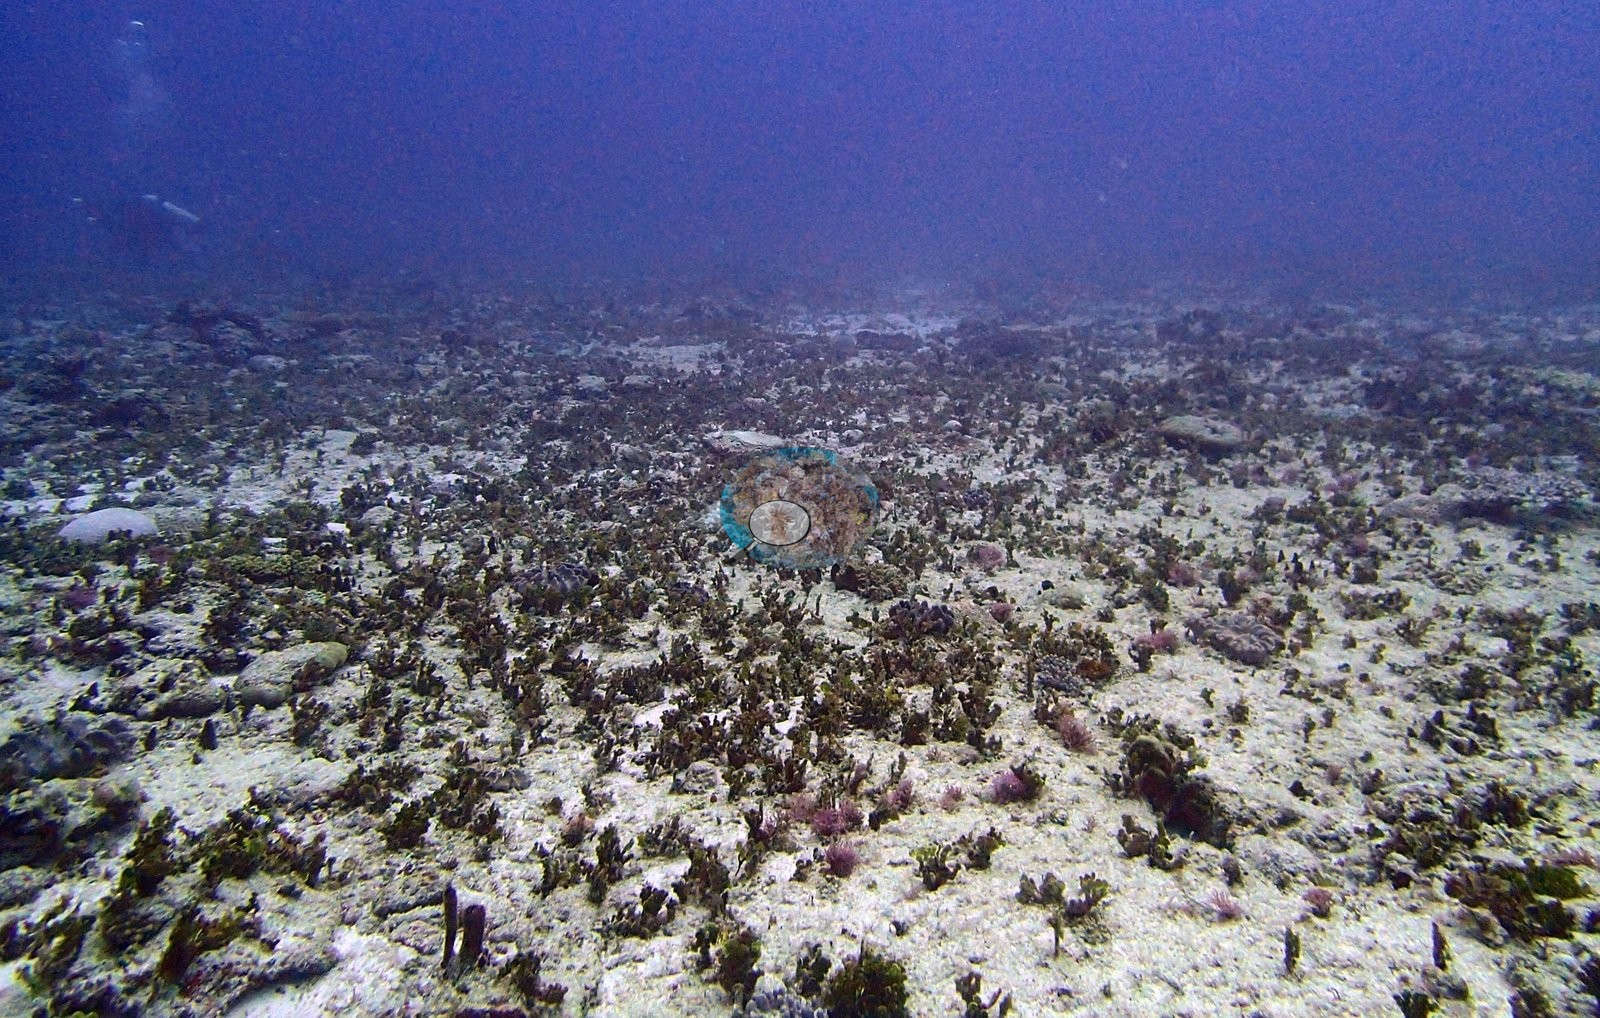
Coral cover ranged from 4.2% on the macroalgal meadow at BIDI12, the lowest of all 112 Chagos stations, and 4.8% at BIEA17, smothered by sediment-laden turf, to 61.1% at BITB34 and 67.0% at BITB58, fourth-highest in Chagos. The Three Brothers reefs are the richest. BITB58 has one depth band that is 93% blue coral (Heliopora) and the next 80% Acropora, and BITB34 is built around whorled plate-coral mounds two to three meters across. BITB39 and BITB54 each carry 34 coral genera, including the endemic Ctenella at BITB39. Eagle Island and the Central Chagos banks are sparser, more Porites-heavy and rubble-strewn, and BICC51 has the highest algal cover of any Chagos station, 70.0%. At Danger Island, BIDI08 reached 59% cover on large tabular plates, while BIDI12 and BIDI13 are dominated by fleshy macroalgal beds.
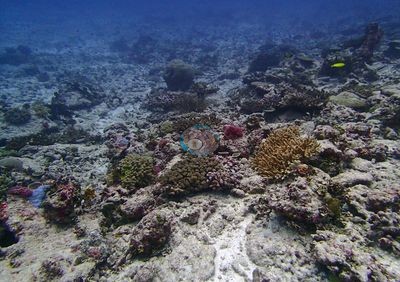
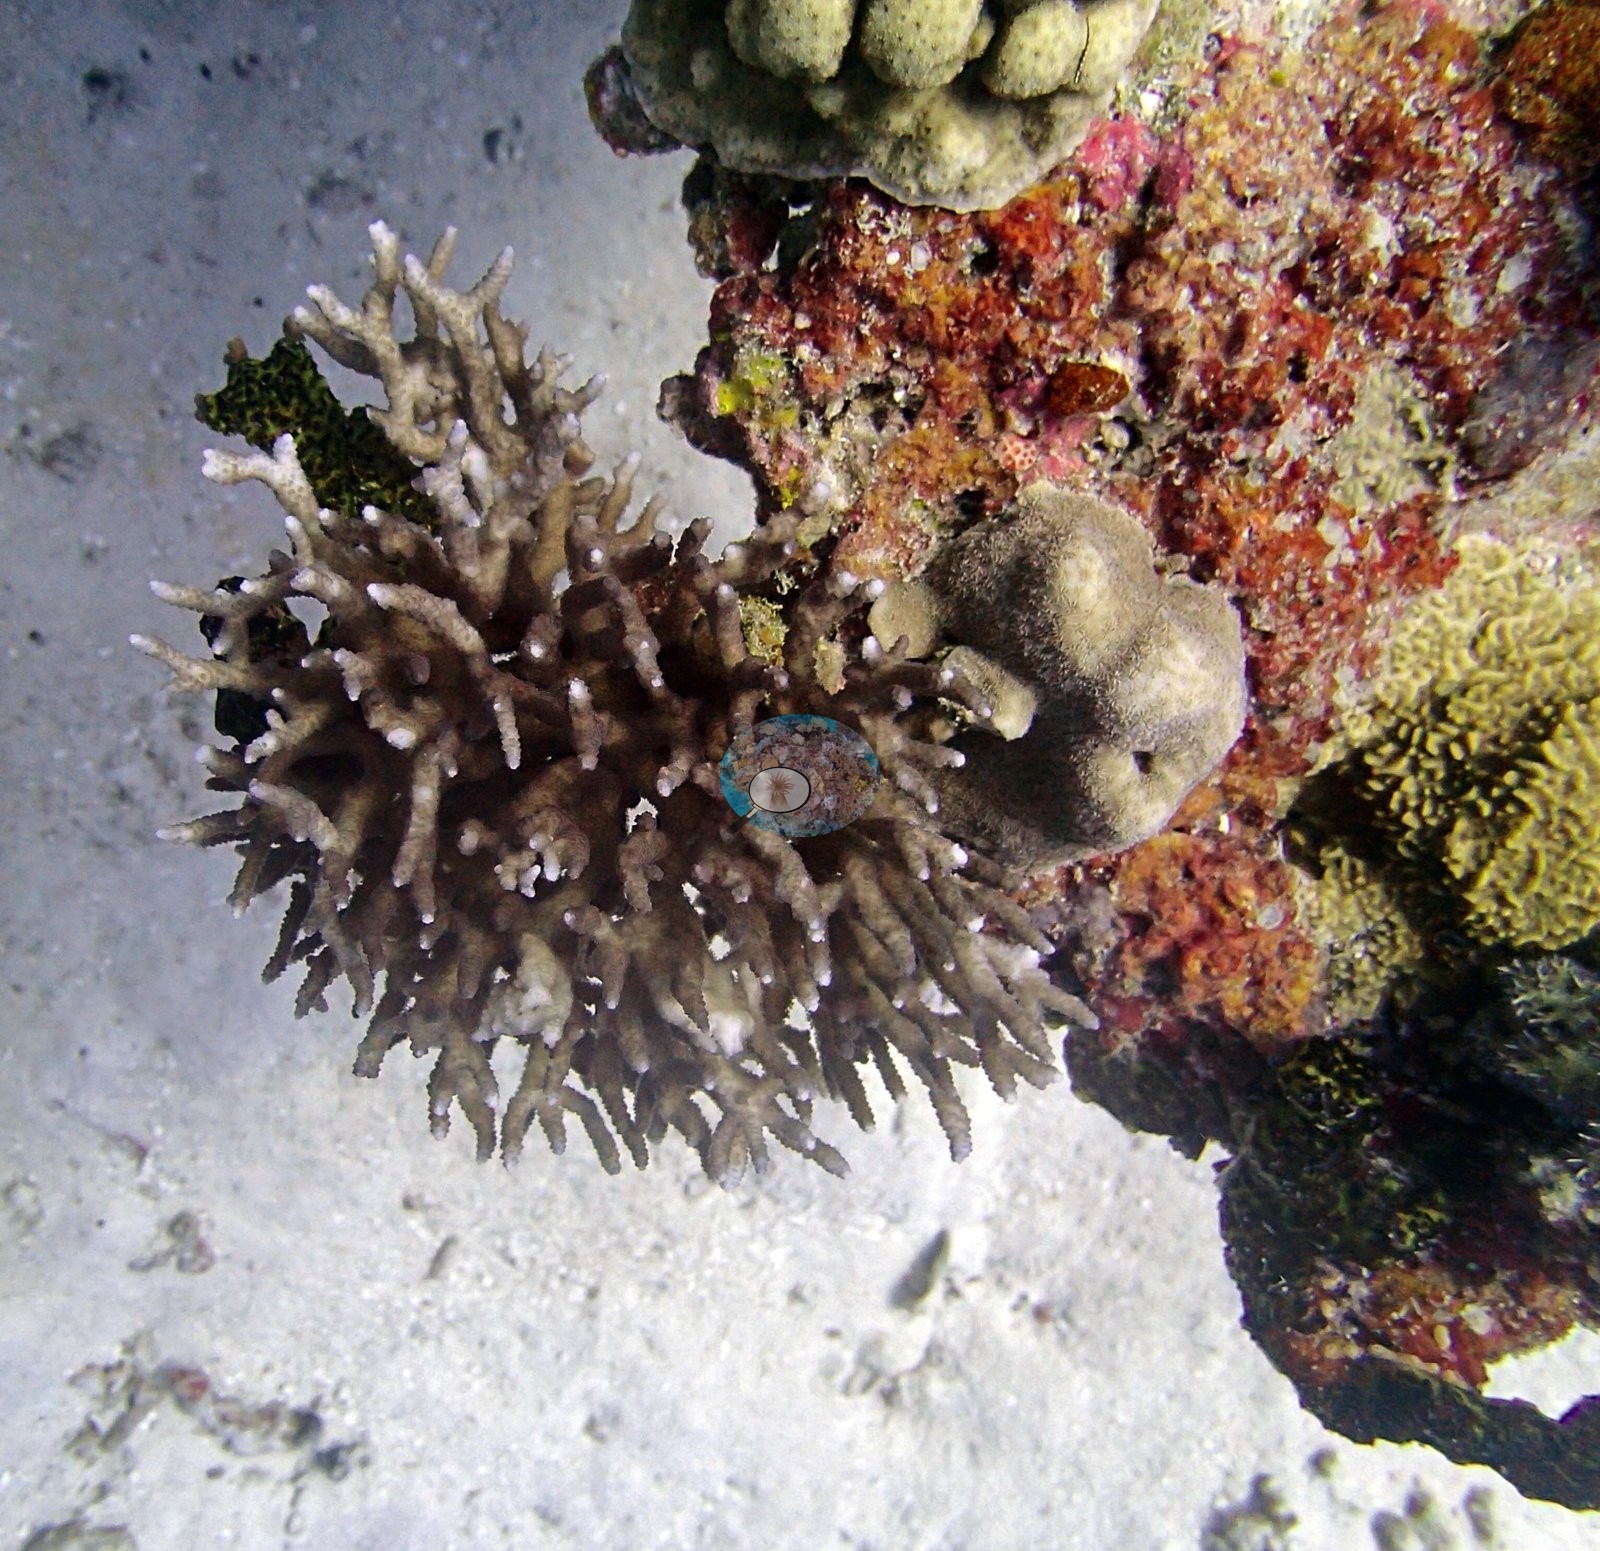
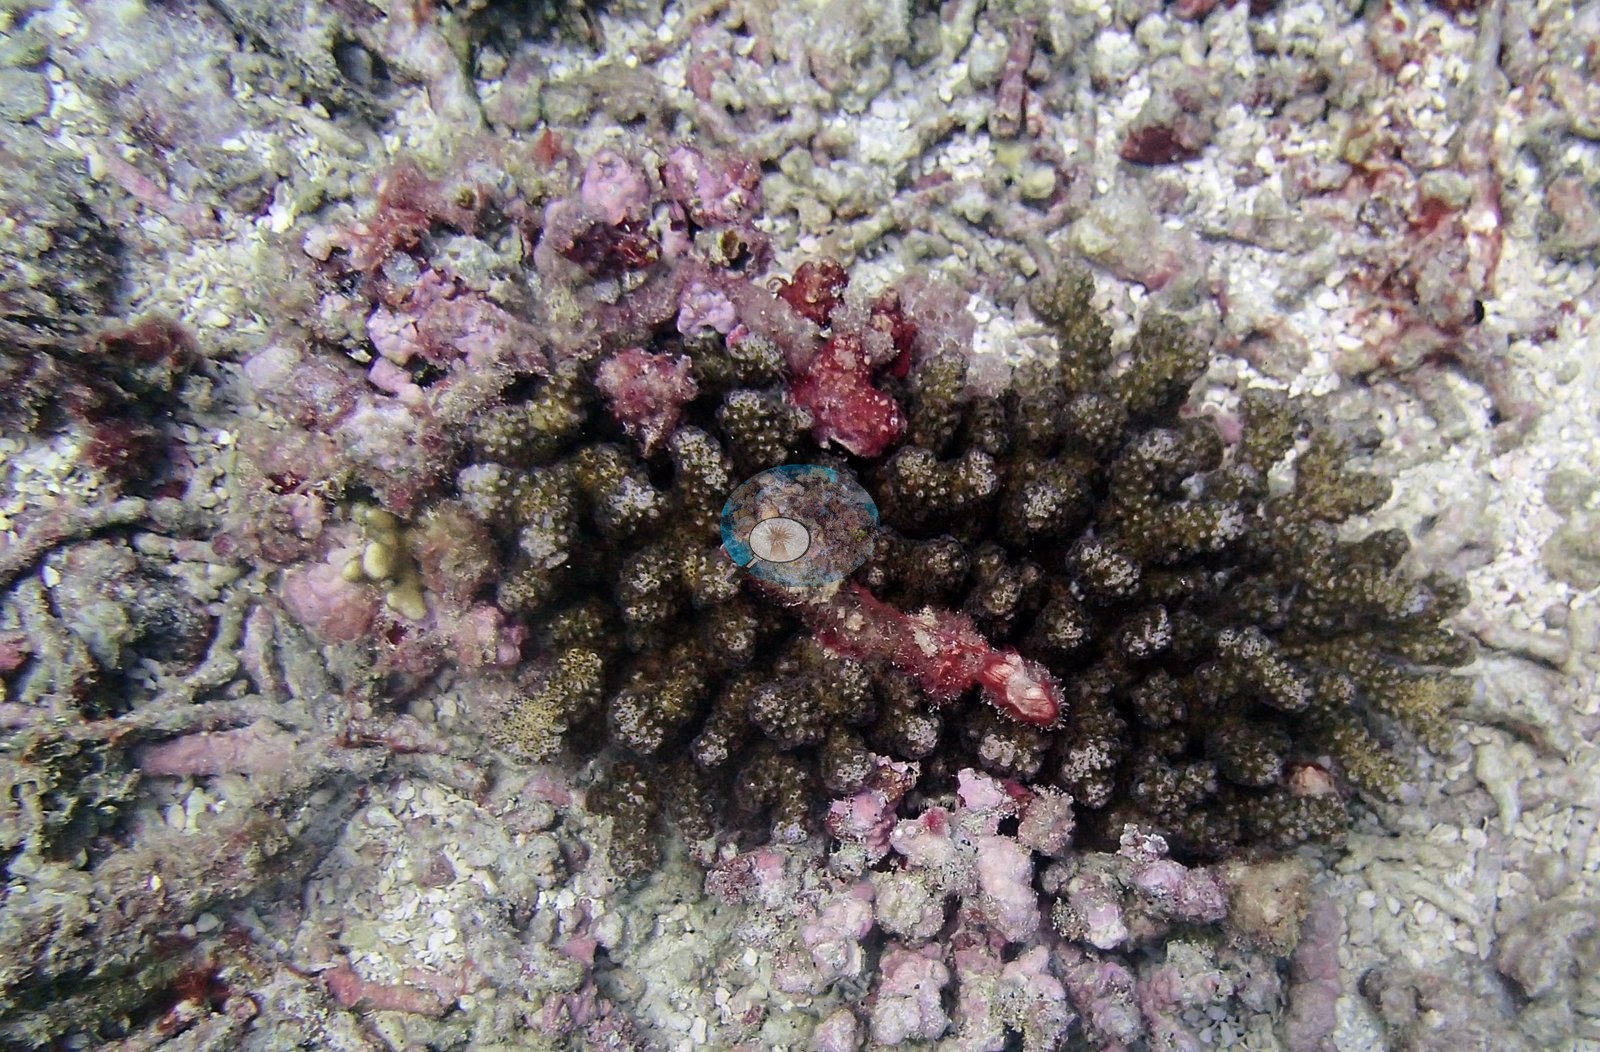
These were early-season dives, and Anderson's field record places the start of bleaching in May. Published values ranged from 0.0% at four sites to 27.8% at BIEA24.5, but the photographs do not bear out several of the higher figures, and the 24.2% at BICC50 is considered unreliable. Colony-scale bleaching was nonetheless photographed at BIEA19, BIDI14, and BITB44, and bone-white patches appear at BITB43 and BIDI16 despite their 0.0% figures. A crown-of-thorns starfish was photographed beside removal forceps at BIEA52 and a small one at BITB55. Lesioned brain or massive corals were noted at BIDI10, BIDI13 and BIDI14. At BITB44, dense young Acropora recruits on old dead pavement show the reef recolonizing.
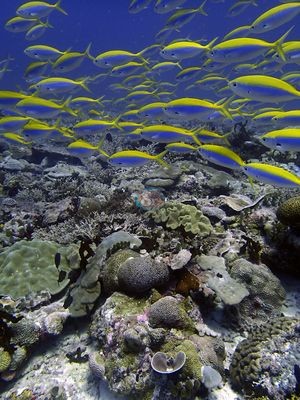
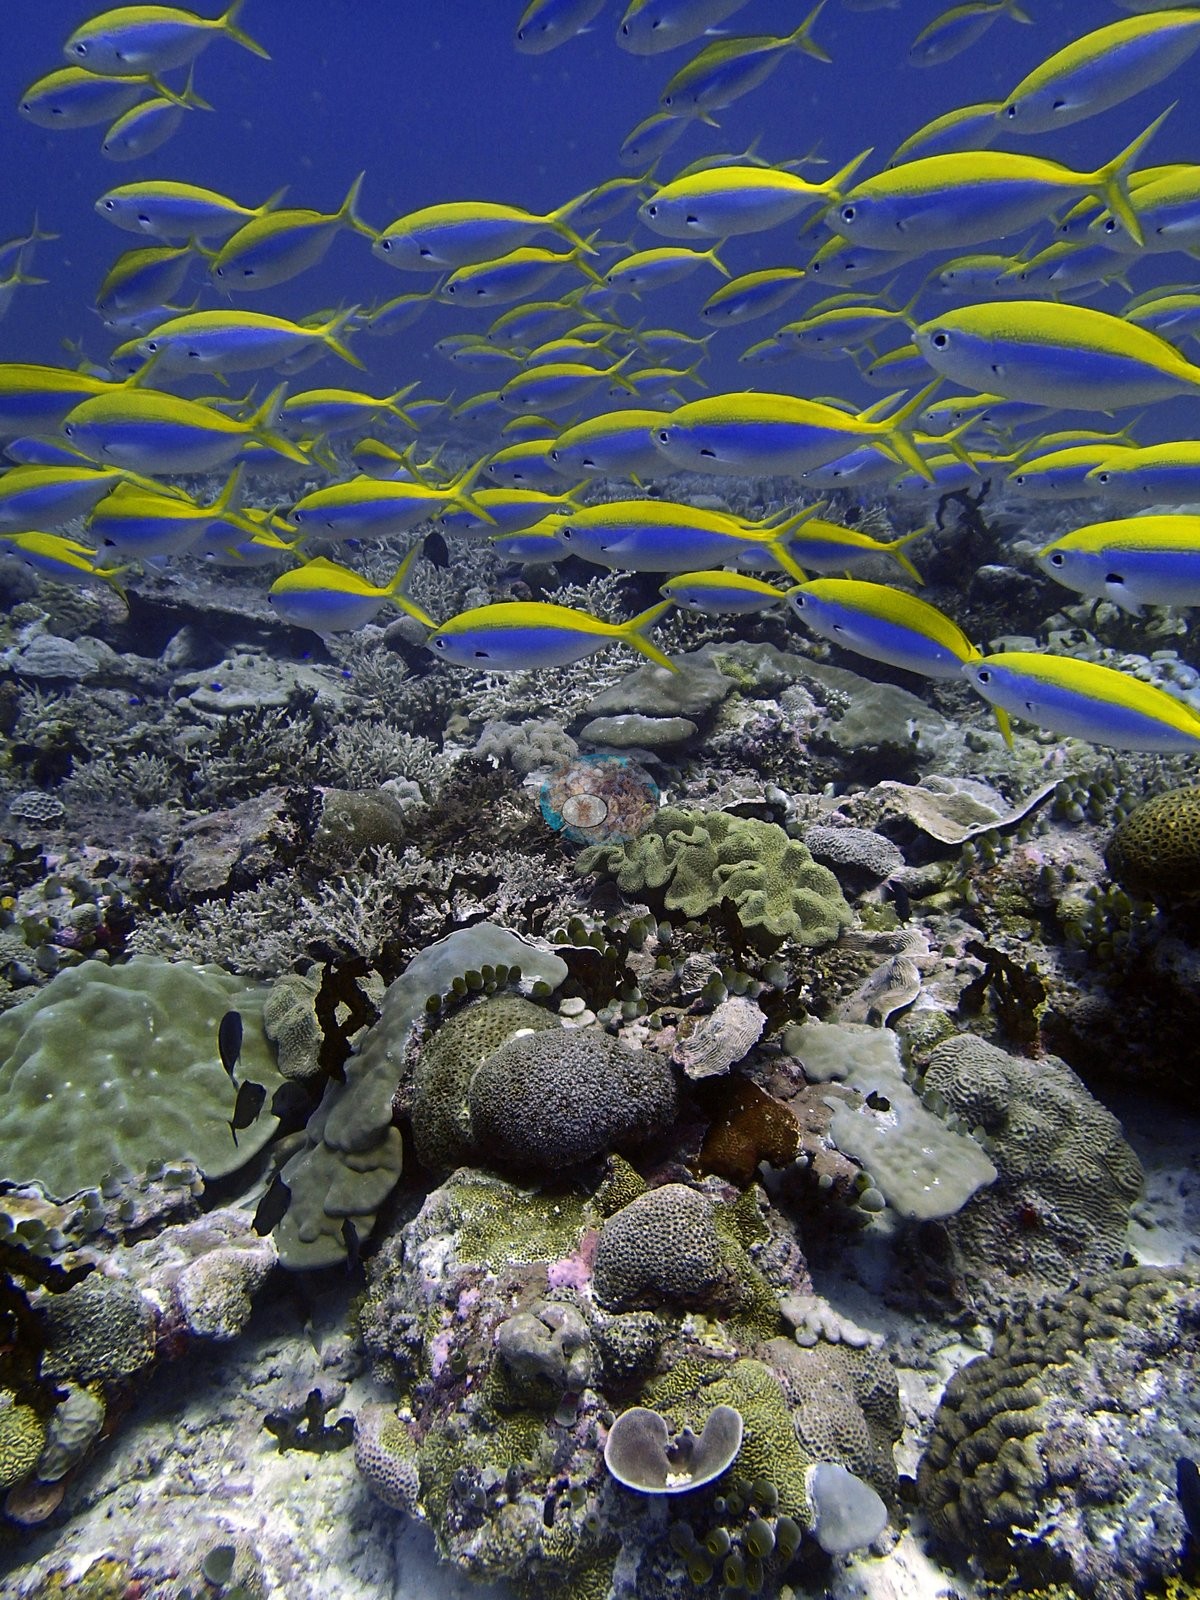
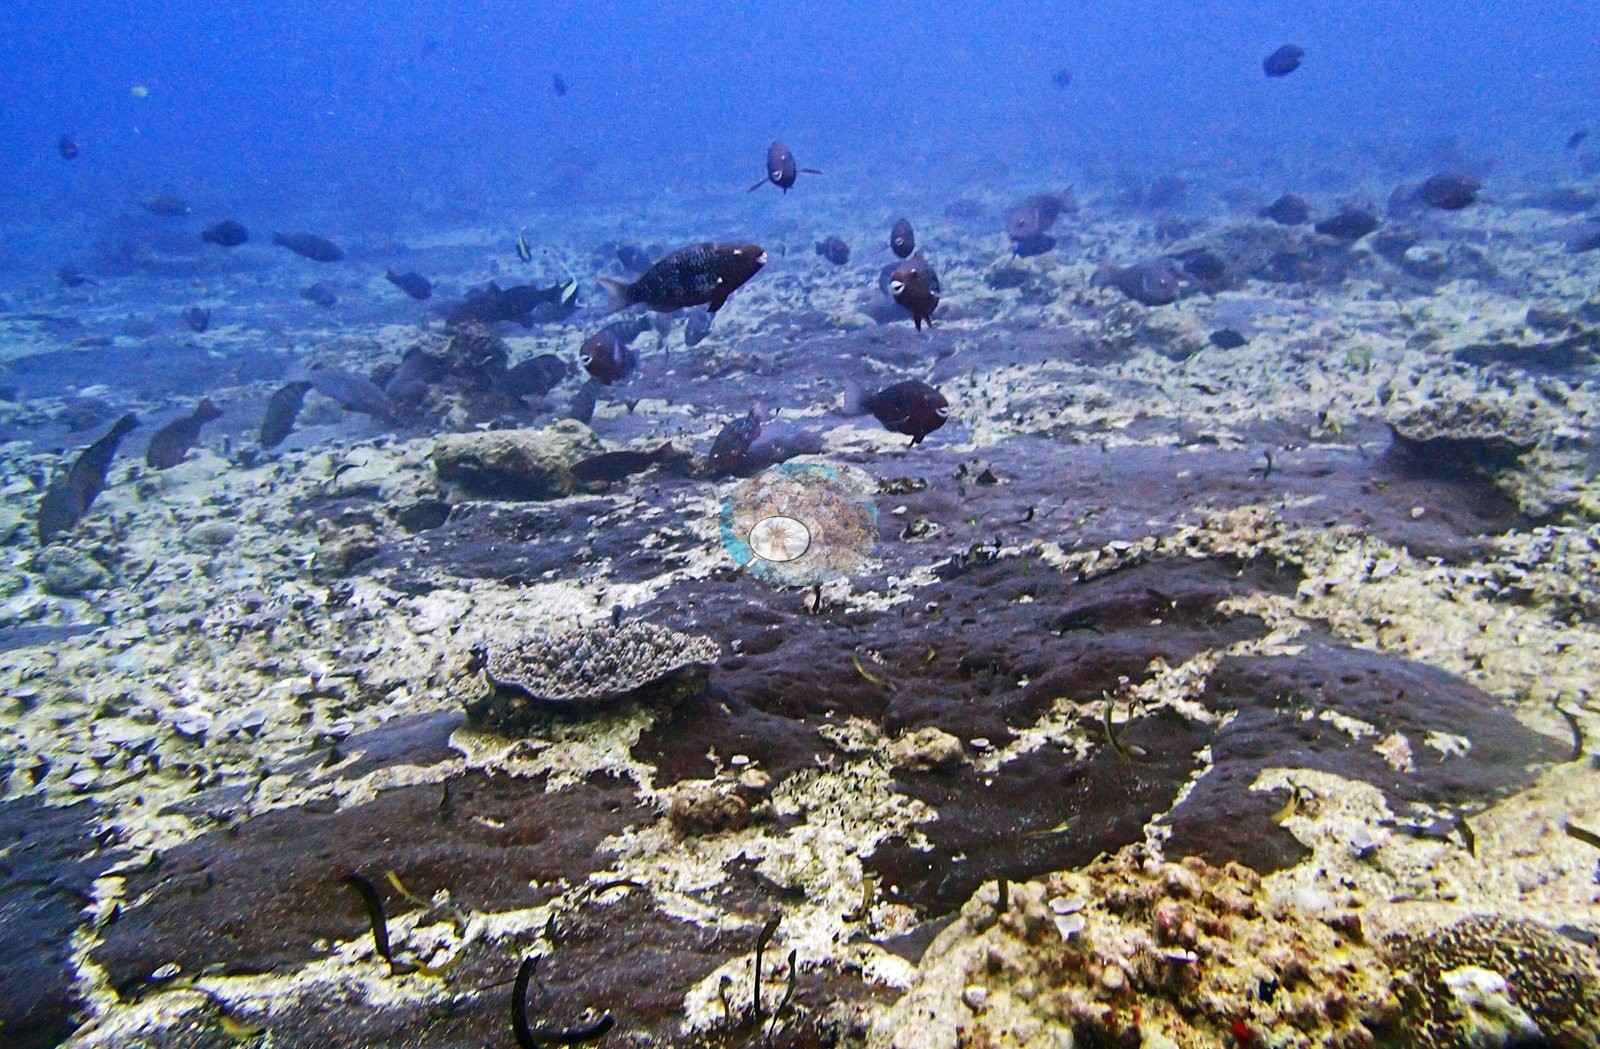
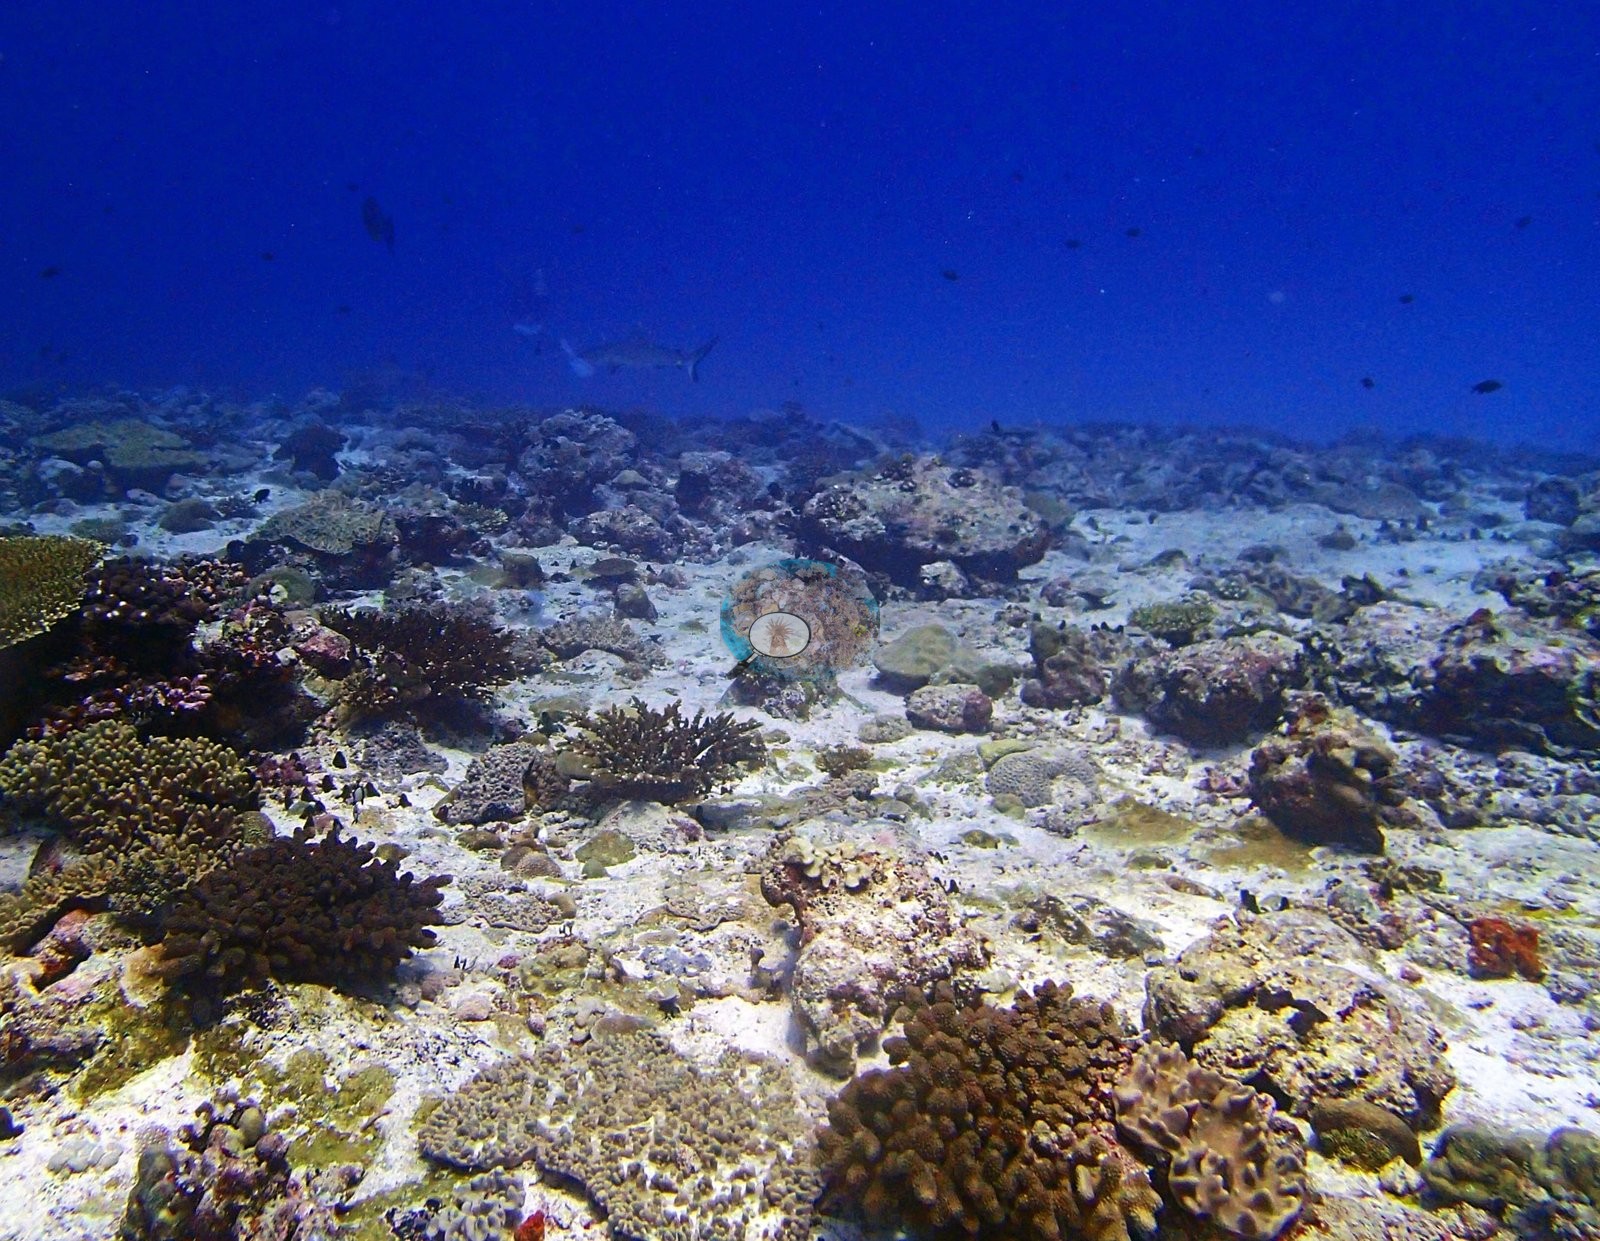
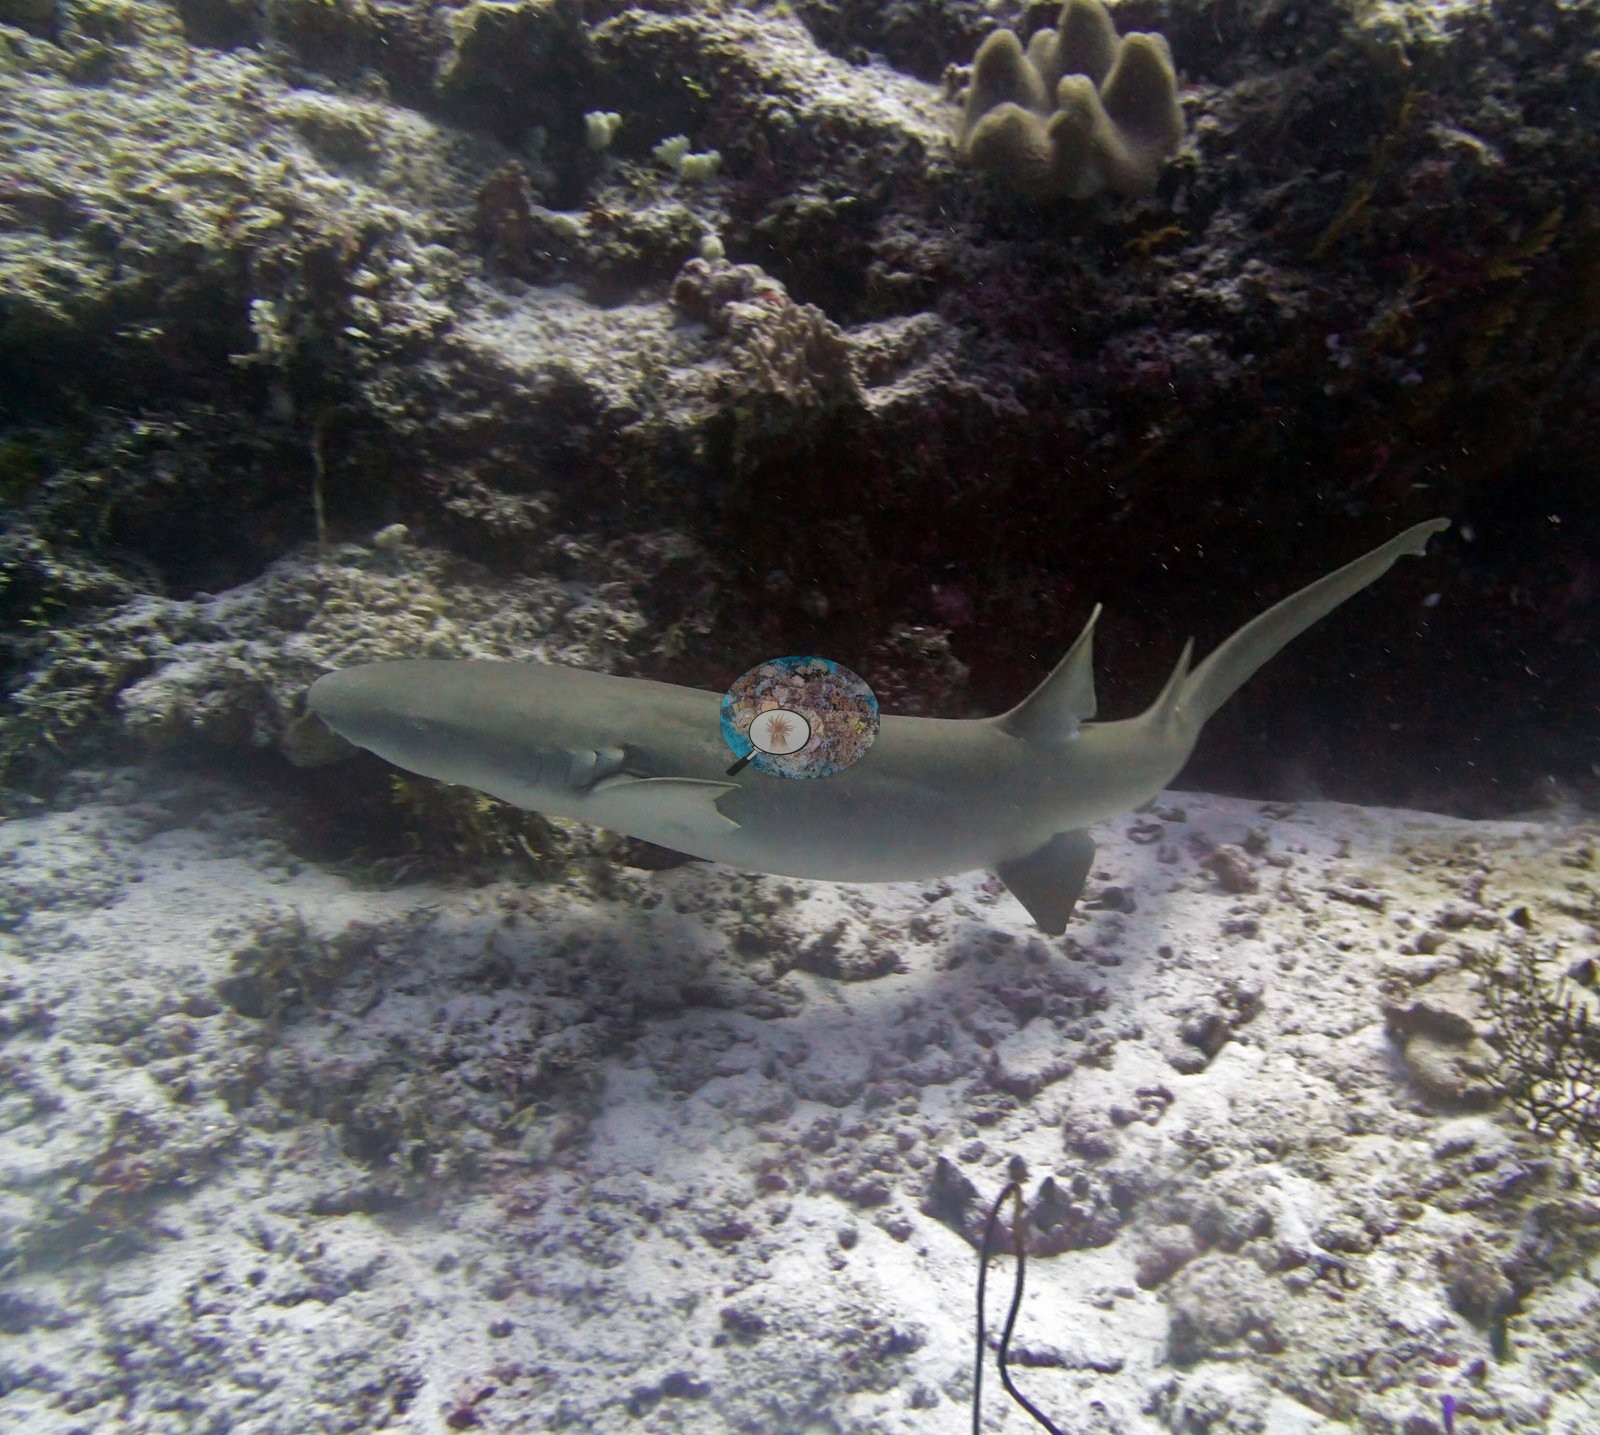
Sharks were seen throughout. Gray reef sharks cruised the algal meadow at BIDI12 in nine frames, whitetip reef sharks were recorded at many sites, and a tawny nurse shark appeared at BIEA26. Other sightings included three spotted eagle rays together at BITB34, giant clams at several sites, a hawksbill turtle at BICC35, and a school of several hundred trevally at BITB33.
Highlights
- BITB58: fourth-highest cover of the 112 Chagos stations (67.0%), with one depth band 93% blue coral (Heliopora)
- BITB39 and BITB54 each carry 34 coral genera
- BICC51 has the highest algal cover of any Chagos station (70.0%)
- Crown-of-thorns: one removed at BIEA52, a small one seen at BITB55
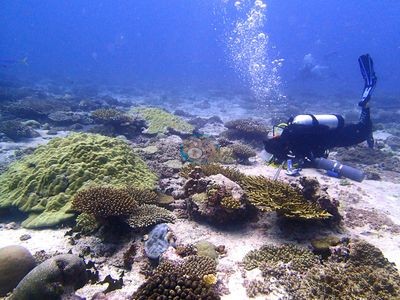
- Logged depths from 16.4 m (BIDI08, 59.0% cover on large tabular plates) to 31.1 m (BIEA24)
- Three spotted eagle rays photographed together at BITB34
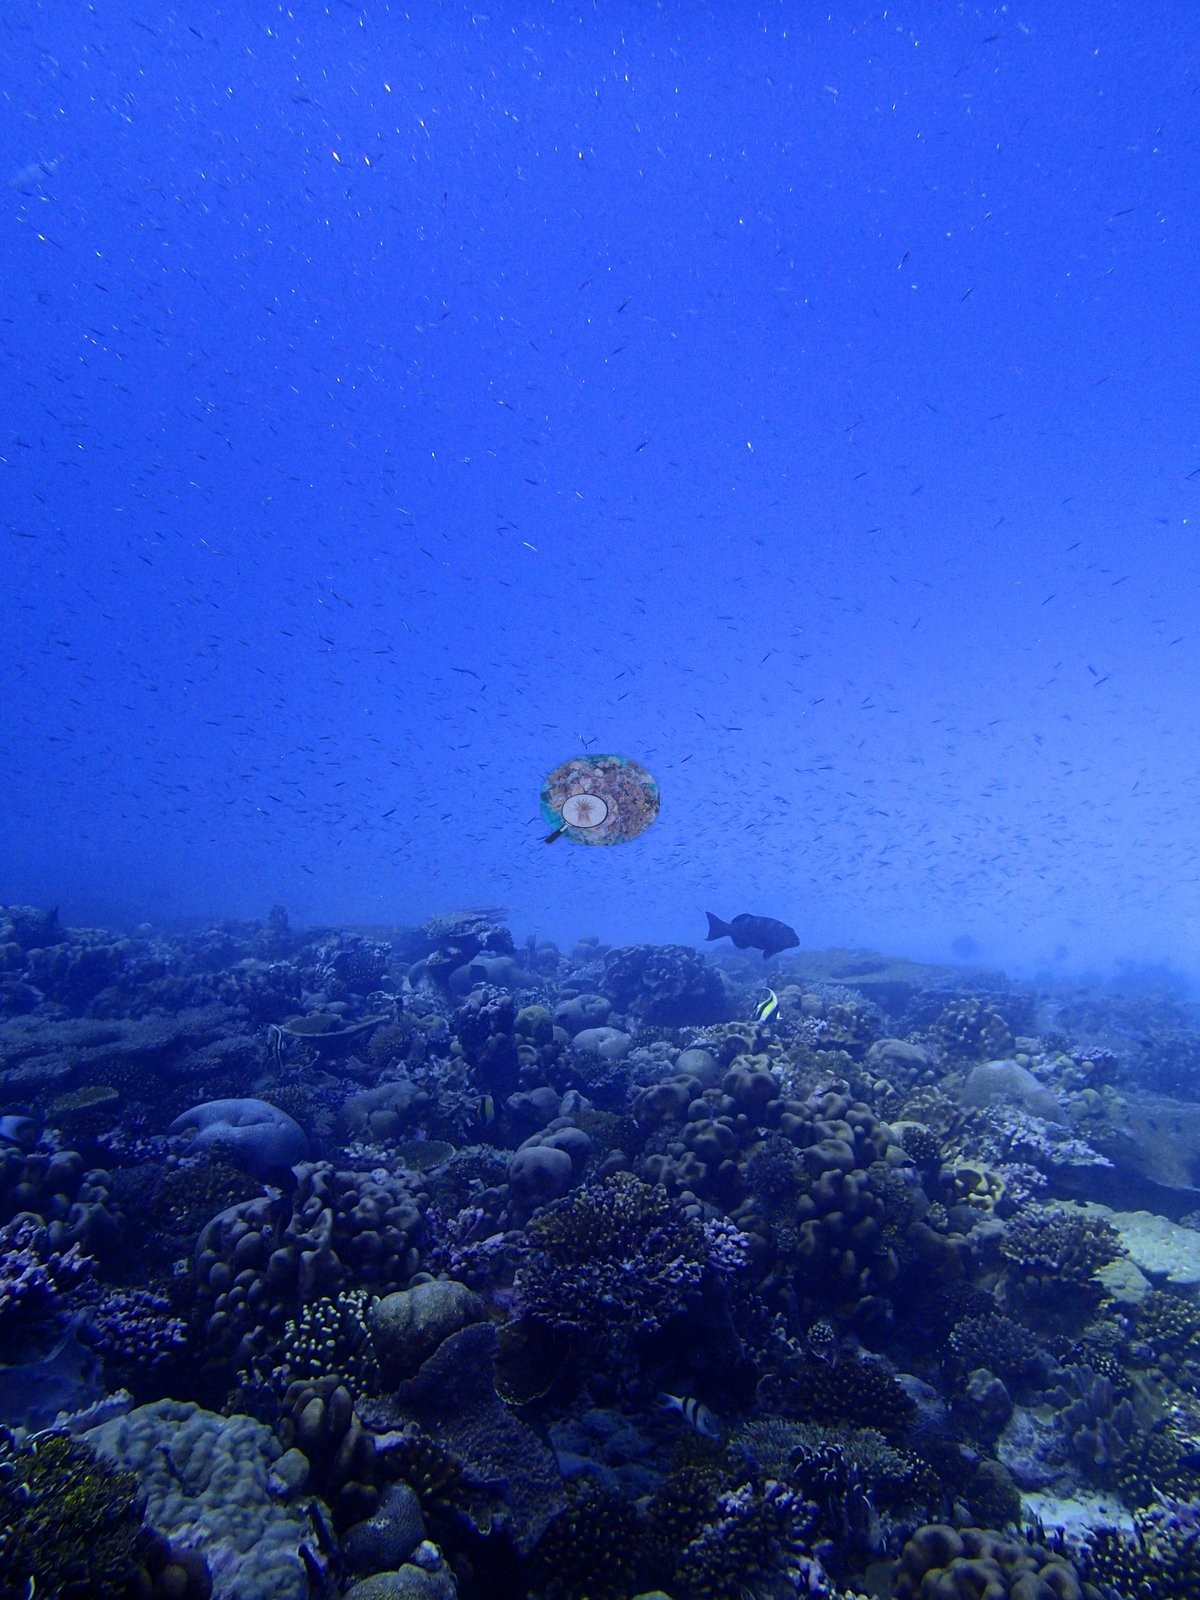
Notable observations (19)
- Chagos Archipelago - Great Chagos Bank West (BIEA52): Crown-of-thorns starfish photographed beside stainless-steel bone-cutting forceps, a deliberate removal; one individual, no aggregation. Published bleaching 0.00%, yet one frame shows a small intact bone-white colony.
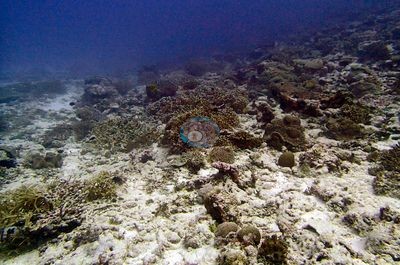
- Chagos Archipelago - Great Chagos Bank West (BITB55): A small crown-of-thorns sea star observed; reef otherwise well pigmented with no visible bleaching (8.1%).
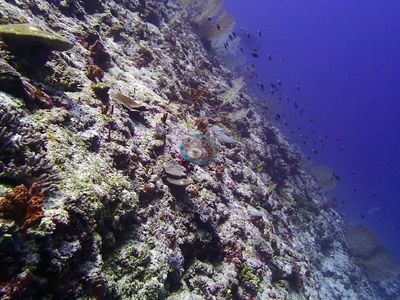
- Chagos Archipelago - Great Chagos Bank West (BIDI10): Disease/lesion: a clean white lesion across a brain coral, which could be disease, predation scarring, or physical damage (unresolved); a pale tiered plating colony read as older mortality.
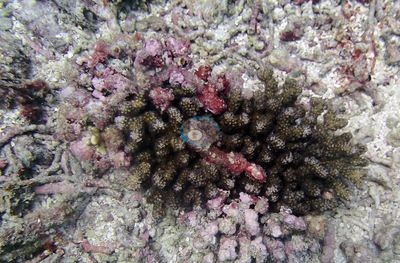
- Chagos Archipelago - Great Chagos Bank West (BIDI13): A lesioned massive coral, the site's one condition flag.
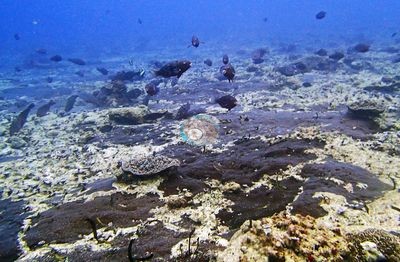
- Chagos Archipelago - Great Chagos Bank West (BIDI14): Bleaching 9.8%: cream-white branch tips on Acropora and a small Pocillopora-type colony wholly cream-white; a meandroid brain coral with a pink-and-white lesion patch.
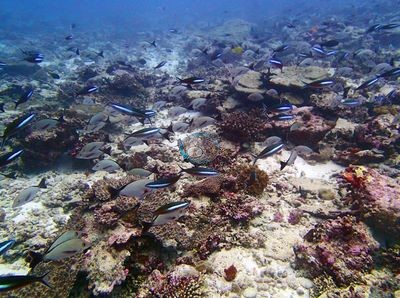
- Chagos Archipelago - Great Chagos Bank West (BIEA19): Bleaching: a thick-branched Pocillopora colony strongly mottled with bone-white patches (2.6%); dead and dying tabular Acropora nearby.
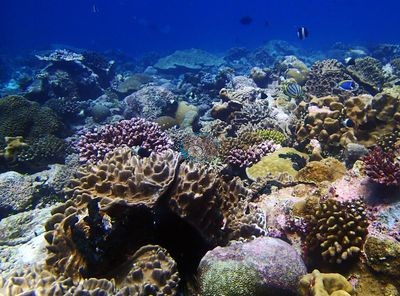
- Chagos Archipelago - Great Chagos Bank West (BITB44): Two colonies with textbook partial bleaching (5.98%). No crown-of-thorns, disease, or predation.
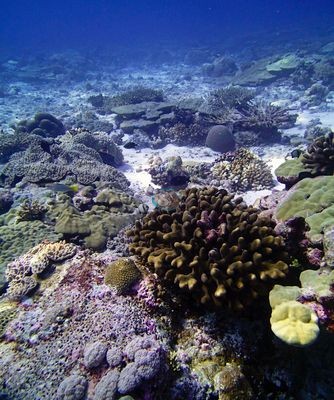
- Chagos Archipelago - Great Chagos Bank West (BITB43): Published bleaching 0.00%, but photos show a bone-white sector sharply demarcated on a cauliflower coral and elsewhere. No crown-of-thorns or disease.
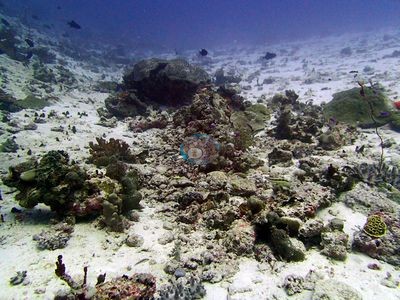
- Chagos Archipelago - Great Chagos Bank West (BIDI16): Logged at 0.0% bleached, but two small bright bone-white branching colonies visible.
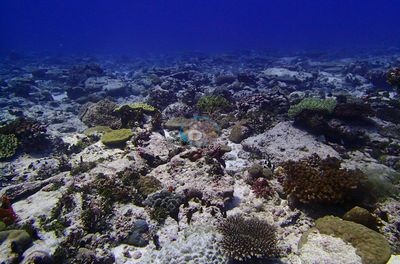
- Chagos Archipelago - Great Chagos Bank West (BITB42): Two colonies with clean bone-white skeleton; severe bleaching cannot be separated from very recent tissue loss (7.73%). No crown-of-thorns or disease.
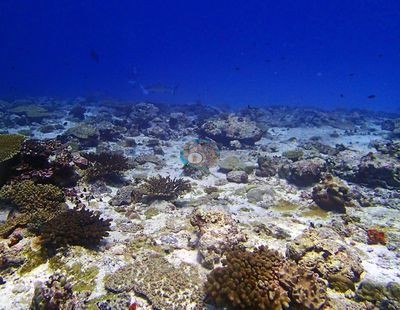
- Chagos Archipelago - Great Chagos Bank West (BITB41): Paling real but patchy: a stark-white branching colony partly overgrown by algae and white branch tips on a Pocillopora (7.65%). No crown-of-thorns.
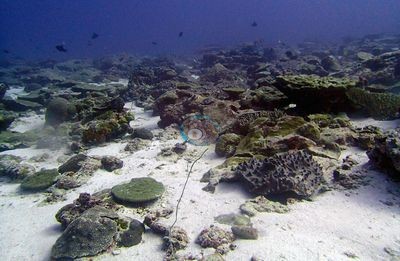
- Chagos Archipelago - Great Chagos Bank West (BIEA20): One branching colony chalky white with early algal film, a possible early mortality signal.
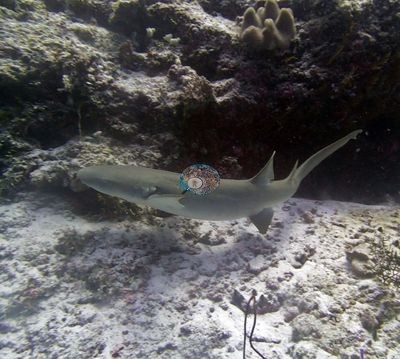
- Chagos Archipelago - Great Chagos Bank West (BIEA18): Sharply edged patches of recent partial mortality on a brown massive Porites.
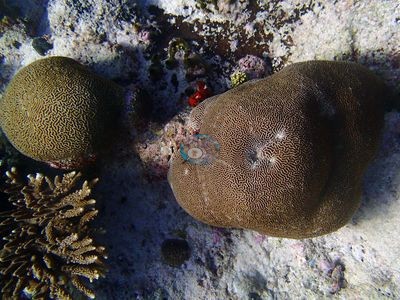
- Chagos Archipelago - Great Chagos Bank West (BIEA24): Sharply edged patches of recent partial mortality on the site's largest Porites dome (published bleaching 20.6%).
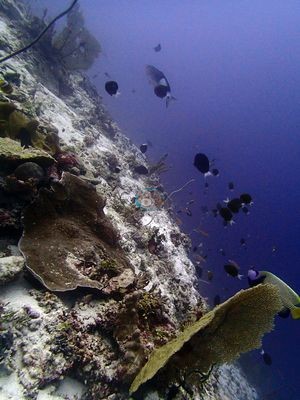
- Chagos Archipelago - Eagle Island (BIEA24.5): Bubblegum-pink and magenta Pocillopora, a pigment response that can signal stress; localized but severe coral death, including a branching colony in mid-collapse (27.8%).
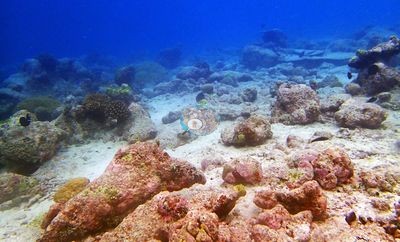
- Chagos Archipelago - Great Chagos Bank West (BICC50): Published bleaching 24.2% considered unreliable, apparently inflated by pale-mantled gastropods misread as bleached coral. No disease or crown-of-thorns.
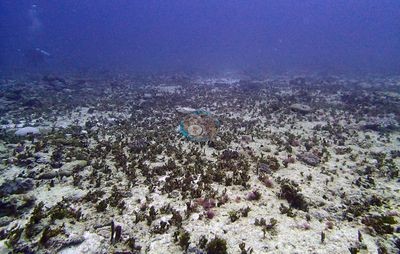
- Chagos Archipelago - Great Chagos Bank West (BITB56): Published bleaching 16.0%, but photos show no visibly bleached coral.
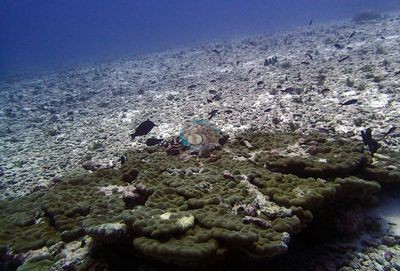
- Chagos Archipelago - South Brother (BITB34.5): Published bleaching 17.1% rests on two colonies, one possibly dead; photos do not corroborate it.
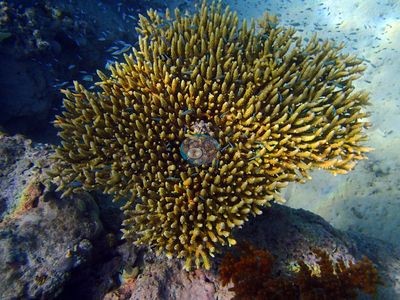
- Chagos Archipelago - Great Chagos Bank West (BITB46): One very large table with sharply bounded partial mortality across 40% of its plate, already colonized by coralline algae (older lesion). No crown-of-thorns, disease, or predation.
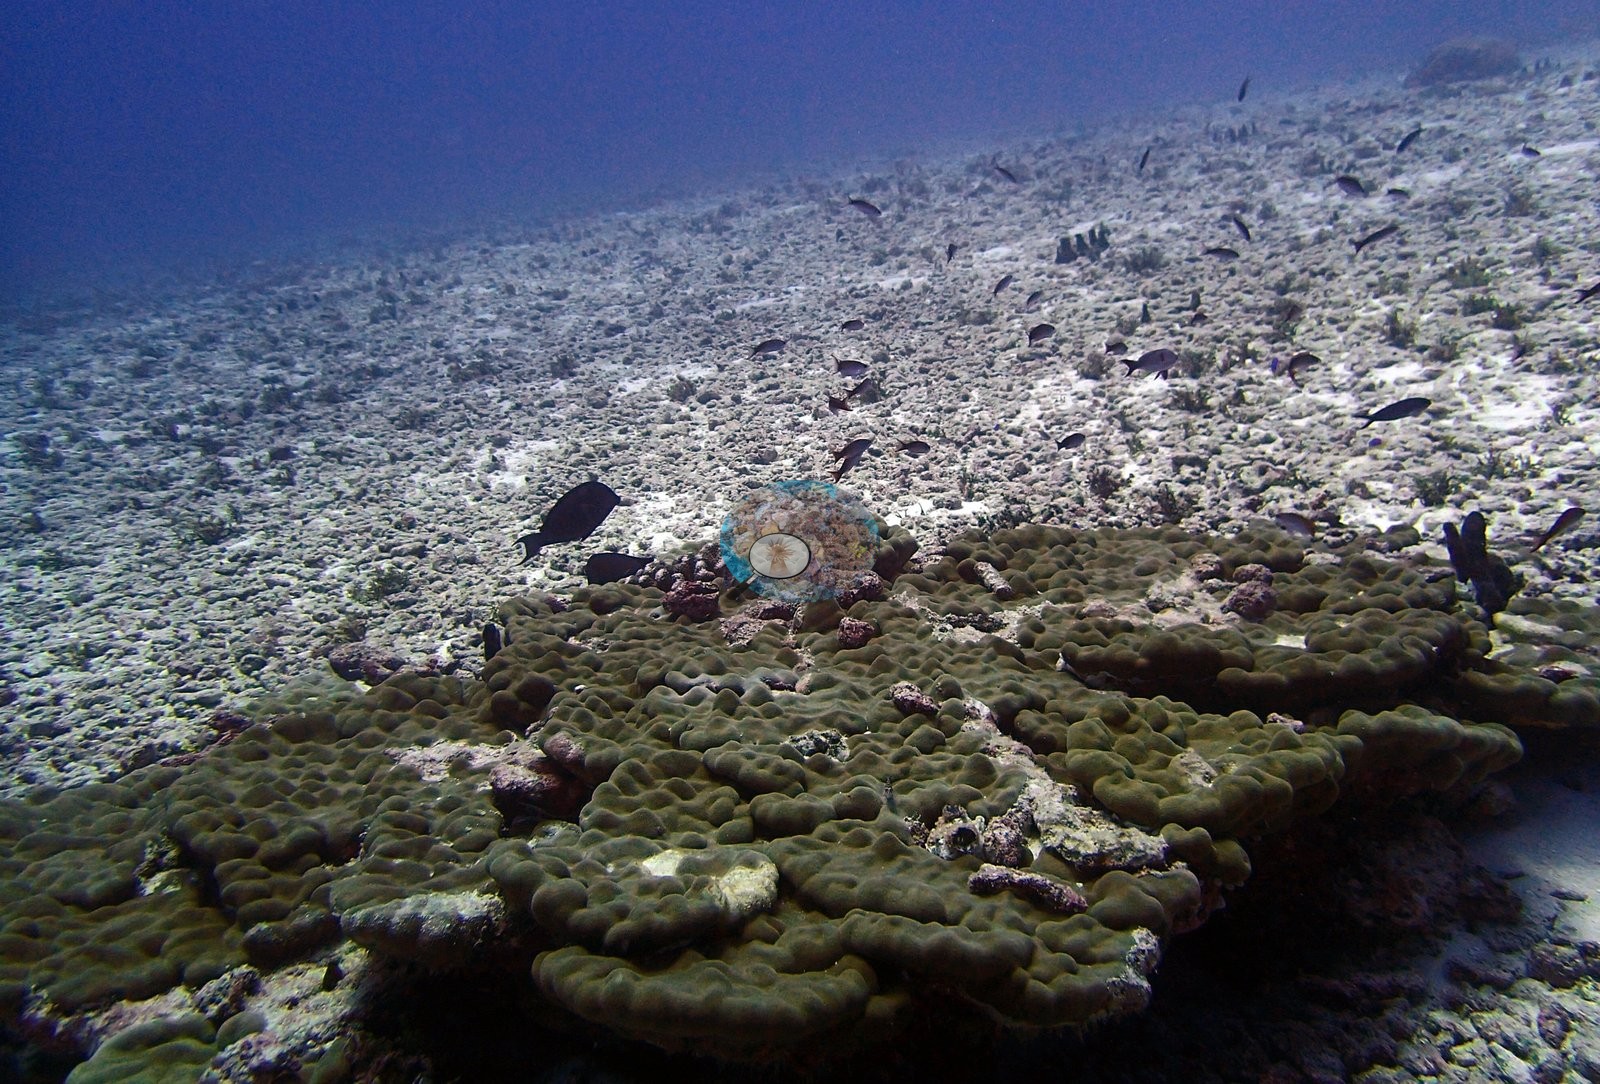
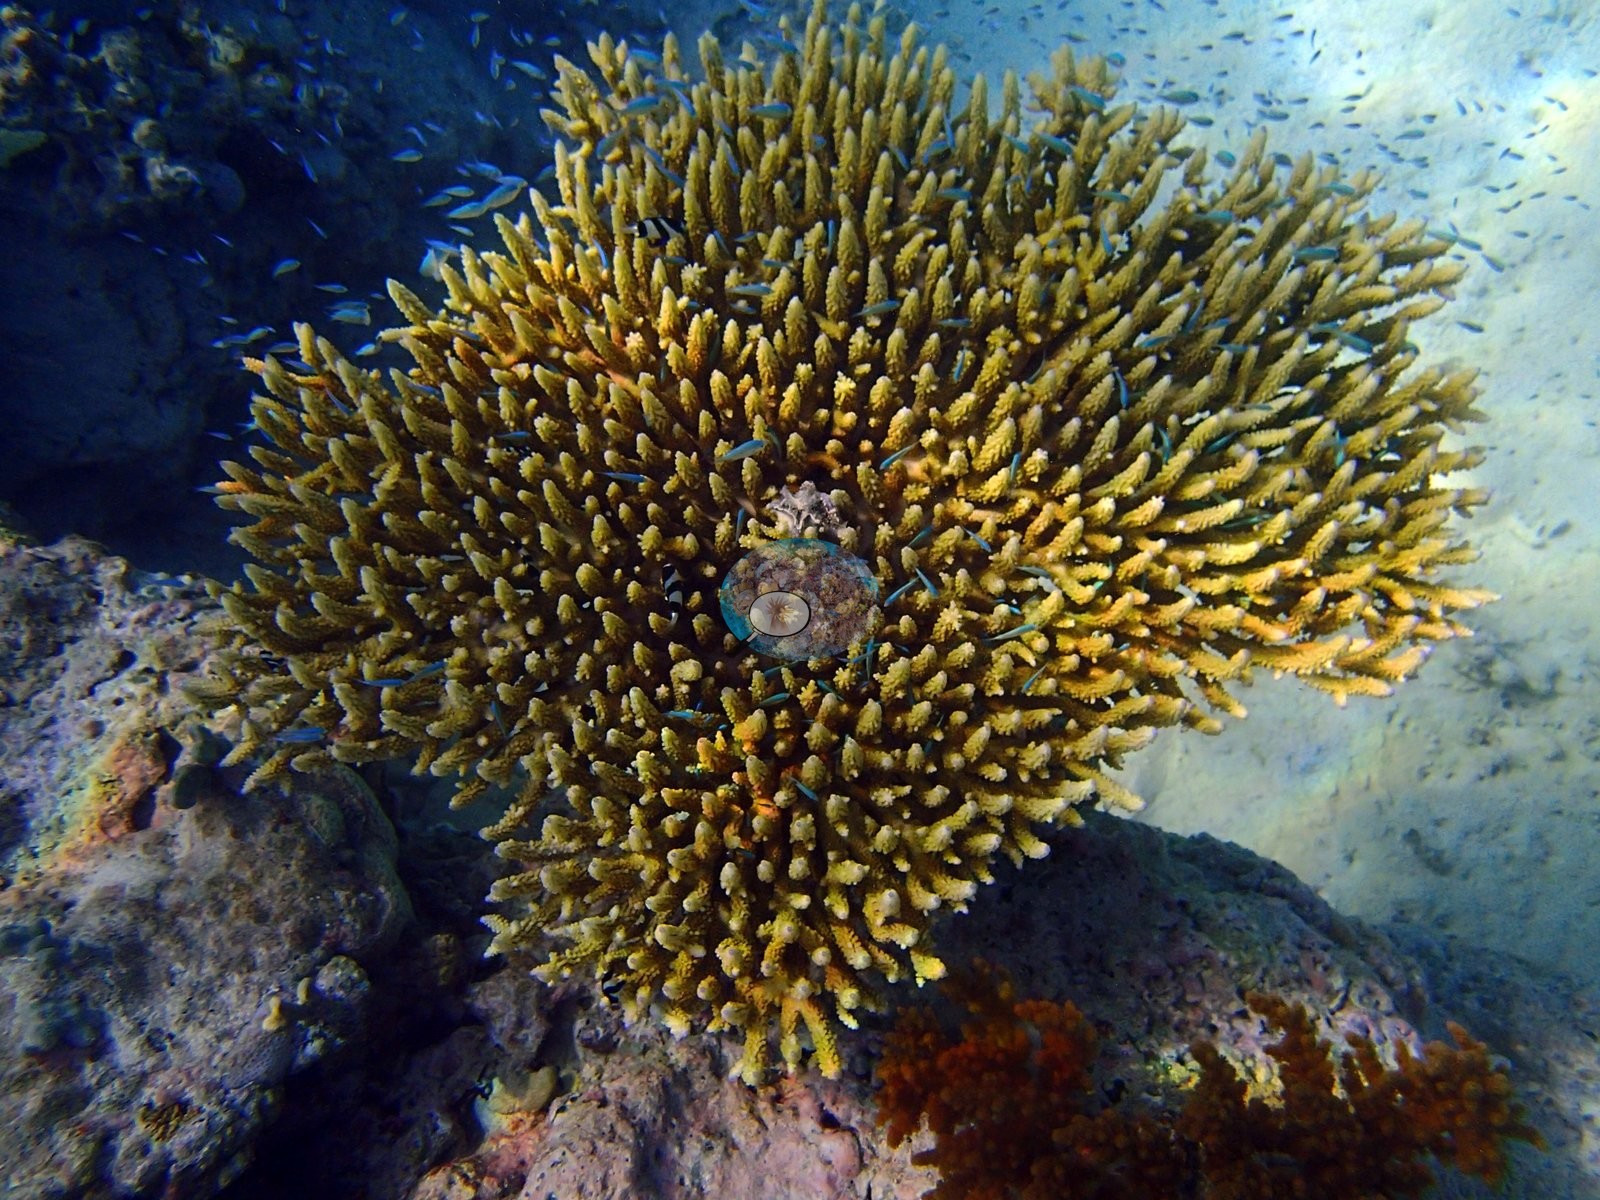
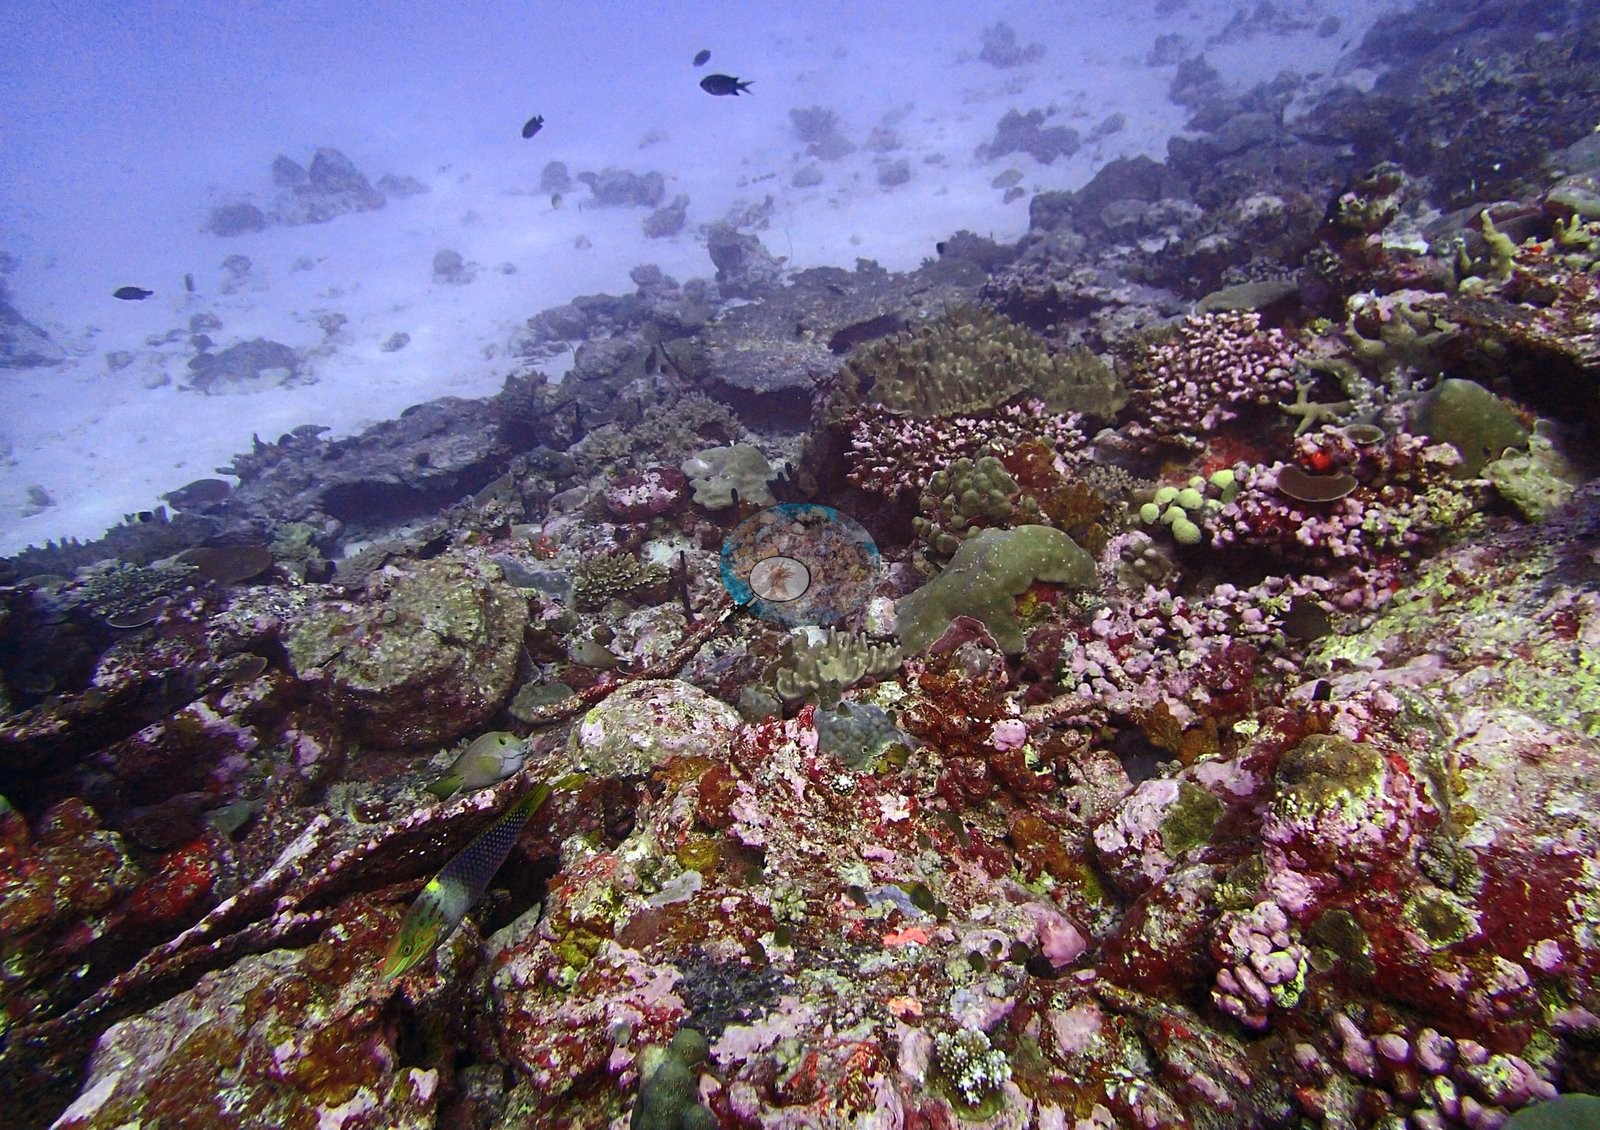
Coral cover over time (pooled)
 the year includes his Global Reef Expedition dives with the Khaled bin Sultan Living Oceans Foundation (CRD+LOF data).
Sites in this region (50)
- Chagos Archipelago - Eagle Island (BIEA24.5) — 20% coral cover
- Chagos Archipelago - Great Chagos Bank West (BICC35) — 14% coral cover
- Chagos Archipelago - Great Chagos Bank West (BICC36) — 5.8% coral cover
- Chagos Archipelago - Great Chagos Bank West (BICC50) — 12% coral cover
- Chagos Archipelago - Great Chagos Bank West (BICC51) — 15% coral cover
- Chagos Archipelago - Great Chagos Bank West (BIDI08) — 59% coral cover
- Chagos Archipelago - Great Chagos Bank West (BIDI09) — 38% coral cover
- Chagos Archipelago - Great Chagos Bank West (BIDI10) — 23% coral cover
- Chagos Archipelago - Great Chagos Bank West (BIDI12) — 4.2% coral cover
- Chagos Archipelago - Great Chagos Bank West (BIDI13) — 7.8% coral cover
- Chagos Archipelago - Great Chagos Bank West (BIDI14) — 15% coral cover
- Chagos Archipelago - Great Chagos Bank West (BIDI15) — 20% coral cover
- Chagos Archipelago - Great Chagos Bank West (BIDI16) — 30% coral cover
- Chagos Archipelago - Great Chagos Bank West (BIEA17) — 4.8% coral cover
- Chagos Archipelago - Great Chagos Bank West (BIEA18) — 21% coral cover
- Chagos Archipelago - Great Chagos Bank West (BIEA19) — 28% coral cover
- Chagos Archipelago - Great Chagos Bank West (BIEA20) — 11% coral cover
- Chagos Archipelago - Great Chagos Bank West (BIEA22) — 22% coral cover
- Chagos Archipelago - Great Chagos Bank West (BIEA23) — 25% coral cover
- Chagos Archipelago - Great Chagos Bank West (BIEA24) — 13% coral cover
- Chagos Archipelago - Great Chagos Bank West (BIEA25) — 16% coral cover
- Chagos Archipelago - Great Chagos Bank West (BIEA26) — 21% coral cover
- Chagos Archipelago - Great Chagos Bank West (BIEA52) — 34% coral cover
- Chagos Archipelago - Great Chagos Bank West (BITB27) — 37% coral cover
- Chagos Archipelago - Great Chagos Bank West (BITB28) — 29% coral cover
- Chagos Archipelago - Great Chagos Bank West (BITB29) — 30% coral cover
- Chagos Archipelago - Great Chagos Bank West (BITB30) — 43% coral cover
- Chagos Archipelago - Great Chagos Bank West (BITB32) — 30% coral cover
- Chagos Archipelago - Great Chagos Bank West (BITB33) — 19% coral cover
- Chagos Archipelago - Great Chagos Bank West (BITB34) — 61% coral cover
- Chagos Archipelago - Great Chagos Bank West (BITB37) — 39% coral cover
- Chagos Archipelago - Great Chagos Bank West (BITB38) — 56% coral cover
- Chagos Archipelago - Great Chagos Bank West (BITB39) — 50% coral cover
- Chagos Archipelago - Great Chagos Bank West (BITB40) — 45% coral cover
- Chagos Archipelago - Great Chagos Bank West (BITB41) — 42% coral cover
- Chagos Archipelago - Great Chagos Bank West (BITB42) — 36% coral cover
- Chagos Archipelago - Great Chagos Bank West (BITB43) — 29% coral cover
- Chagos Archipelago - Great Chagos Bank West (BITB44) — 41% coral cover
- Chagos Archipelago - Great Chagos Bank West (BITB45) — 46% coral cover
- Chagos Archipelago - Great Chagos Bank West (BITB46) — 26% coral cover
- Chagos Archipelago - Great Chagos Bank West (BITB47) — 54% coral cover
- Chagos Archipelago - Great Chagos Bank West (BITB48) — 32% coral cover
- Chagos Archipelago - Great Chagos Bank West (BITB49) — 27% coral cover
- Chagos Archipelago - Great Chagos Bank West (BITB53) — 37% coral cover
- Chagos Archipelago - Great Chagos Bank West (BITB54) — 50% coral cover
- Chagos Archipelago - Great Chagos Bank West (BITB55) — 48% coral cover
- Chagos Archipelago - Great Chagos Bank West (BITB56) — 21% coral cover
- Chagos Archipelago - Great Chagos Bank West (BITB57) — 40% coral cover
- Chagos Archipelago - Great Chagos Bank West (BITB58) — 67% coral cover
- Chagos Archipelago - South Brother (BITB34.5) — 47% coral cover
% coral cover by method
Pooled across 104 dive sites
| Method | Mean % coral cover | Std. dev. between dive sites | n dive sites | Note |
|---|---|---|---|---|
| Manual point count (author) | 34.0% | ±13 | 28 | frame-weighted 40.1% over 613 frames |
| CoralNet automated point classifier | 32.8% | ±11 | 89 | frame-weighted 34.0% over 1,895 frames |
| CoralSCOP (SAM-based mask-sum), edited photos | 32.2% | ±8.3 | 104 | frame-weighted 33.9% over 2,498 frames |
| Claude (Anthropic), blind point count | 26.5% | ±11 | 104 | frame-weighted 29.0% over 2,495 frames |
| In-house DINOv3 point classifier | 30.5% | ±11 | 104 | frame-weighted 31.2% over 2,500 frames |
| In-water diver transect (line/point intercept) | 37.7% | ±16 | 101 | — |
The mean is an UNWEIGHTED mean of the dive site values — each dive site counts once, whatever its photo count — which is the convention of the published tables and of every other figure on this page. The frame-weighted alternative is given per method in the Note column; where the two differ, the difference is a photo-count imbalance, not a coral-cover finding.
Closest to the reference
Over the dive sites where an independent reference exists, Manual point count (author) sits closest to it — a mean absolute deviation of 9.5 pp across 27 dive sites, then CoralNet automated point classifier 10.5 pp (n=86), Claude (Anthropic), blind point count 13.2 pp (n=101). A mean absolute deviation is not an accuracy score: a model with a consistent offset is correctable, while one with the same deviation scattered in both directions is not.
By dive site
| Dive site | Manual point count | CoralNet | CoralSCOP (edited) | Claude | DINOv3 | Diver transect | coralscapes_v1 | coralscapes |
|---|---|---|---|---|---|---|---|---|
| BIBL82 | 17.5% n=4 | 27.6% n=18 | 35.8% n=22 | 28.3% n=22 | 26.1% n=22 | 37.9% | 42.0% n=22 | 50.2% n=22 |
| BIBL83 | 20.8% n=9 | 25.6% n=6 | 40.7% n=15 | 23.8% n=15 | 24.7% n=15 | 33.1% | 42.2% n=15 | 45.2% n=15 |
| BIBL86 | — | 31.9% n=27 | 25.1% n=27 | 34.4% n=27 | 36.0% n=27 | 47.2% | 50.5% n=27 | 49.4% n=27 |
| BIBL87 | — | 27.9% n=35 | 29.5% n=35 | 30.3% n=35 | 34.0% n=35 | 40.6% | 41.5% n=35 | 48.0% n=35 |
| BICC35 | — | 17.0% n=15 | 20.5% n=15 | 6.7% n=15 | 13.1% n=15 | 13.8% | 21.0% n=15 | 23.9% n=15 |
| BICC36 | — | 19.4% n=15 | 24.7% n=15 | 6.4% n=15 | 18.2% n=15 | 5.8% | 21.0% n=15 | 26.5% n=15 |
| BICC50 | — | 29.4% n=11 | 28.8% n=11 | 15.7% n=11 | 30.0% n=11 | 12.1% | 36.9% n=11 | 48.0% n=11 |
| BICC51 | — | 21.9% n=17 | 27.5% n=17 | 20.7% n=17 | 24.1% n=17 | 15.4% | 26.9% n=17 | 28.4% n=17 |
| BIDI08 | — | 36.4% n=35 | 38.9% n=35 | 35.2% n=35 | 29.1% n=35 | 59.0% | 50.2% n=35 | 53.1% n=35 |
| BIDI09 | — | 38.0% n=30 | 32.2% n=30 | 33.6% n=30 | 23.6% n=30 | 37.7% | 56.2% n=30 | 61.0% n=30 |
| BIDI10 | — | 27.1% n=13 | 32.9% n=13 | 22.5% n=13 | 16.2% n=13 | 23.0% | 44.2% n=13 | 49.4% n=13 |
| BIDI12 | — | 10.4% n=14 | 17.9% n=14 | 2.9% n=14 | 11.0% n=14 | 4.2% | 8.2% n=14 | 10.0% n=14 |
| BIDI13 | — | 20.5% n=11 | 24.9% n=11 | 17.8% n=11 | 18.2% n=11 | 7.8% | 22.0% n=11 | 23.5% n=11 |
| BIDI14 | — | 23.5% n=9 | 30.3% n=9 | 19.2% n=9 | 21.9% n=9 | 15.2% | 26.7% n=9 | 26.2% n=9 |
| BIDI15 | — | 24.6% n=9 | 20.6% n=9 | 36.4% n=9 | 37.0% n=9 | 20.1% | 45.3% n=9 | 48.3% n=9 |
| BIDI16 | — | 25.6% n=13 | 30.9% n=13 | 24.4% n=13 | 22.3% n=13 | 30.4% | 32.2% n=13 | 35.6% n=13 |
| BIEA18 | — | 22.3% n=35 | 28.1% n=35 | 17.7% n=35 | 14.6% n=35 | 20.7% | 32.9% n=35 | 32.4% n=34 |
| BIEA19 | — | 27.2% n=14 | 39.2% n=14 | 30.8% n=14 | 25.5% n=14 | 27.5% | 41.9% n=14 | 44.8% n=14 |
| BIEA20 | — | 24.6% n=19 | 27.1% n=19 | 22.2% n=19 | 16.0% n=19 | 10.8% | 30.8% n=19 | 35.4% n=19 |
| BIEA22 | — | 49.2% n=23 | 50.0% n=23 | 30.8% n=23 | 44.8% n=23 | 21.6% | 44.0% n=23 | 46.1% n=23 |
| BIEA23 | — | 35.7% n=24 | 39.5% n=24 | 28.5% n=24 | 28.8% n=24 | 24.6% | 43.8% n=24 | 49.2% n=24 |
| BIEA24 | — | 40.6% n=11 | 39.2% n=11 | 37.4% n=11 | 41.2% n=11 | 12.7% | 48.5% n=11 | 49.3% n=11 |
| BIEA25 | — | 29.5% n=19 | 29.8% n=19 | 16.4% n=19 | 25.6% n=19 | 15.7% | 31.1% n=19 | 32.8% n=19 |
| BIEA26 | — | 21.0% n=30 | 27.2% n=30 | 14.5% n=30 | 14.1% n=30 | 21.0% | 23.3% n=30 | 28.4% n=30 |
| BIEA52 | — | 38.1% n=22 | 39.1% n=22 | 34.5% n=22 | 21.8% n=22 | 34.1% | 49.6% n=22 | 50.0% n=22 |
| BIEG02 | 25.5% n=21 | — | 23.7% n=21 | 18.2% n=21 | 23.7% n=21 | 31.8% | 31.1% n=21 | 34.5% n=21 |
| BIEG03 | 23.9% n=36 | — | 25.7% n=36 | 16.6% n=36 | 18.4% n=36 | 37.3% | 31.5% n=36 | 34.0% n=36 |
| BIEG04 | 33.9% n=19 | — | 28.2% n=19 | 25.9% n=19 | 35.1% n=19 | 29.2% | 36.4% n=19 | 38.7% n=19 |
| BIEG05 | 40.7% n=35 | 57.8% n=24 | 41.4% n=59 | 39.1% n=59 | 40.2% n=59 | 46.7% | 61.2% n=59 | 63.6% n=59 |
| BIEG06 | — | 44.2% n=30 | 22.6% n=30 | 31.6% n=30 | 34.0% n=30 | 43.5% | 46.0% n=30 | 46.5% n=30 |
| BIEG07 | 40.6% n=8 | — | 26.8% n=8 | 28.5% n=8 | 56.7% n=8 | 47.5% | 30.9% n=8 | 33.5% n=8 |
| BINI77 | — | 29.8% n=11 | 33.5% n=11 | 25.7% n=11 | 26.1% n=11 | 43.0% | 38.2% n=11 | 41.1% n=11 |
| BINI78 | — | 24.4% n=16 | 28.4% n=16 | 24.8% n=16 | 29.0% n=16 | 19.1% | 26.9% n=16 | 28.6% n=16 |
| BINI79 | — | 19.4% n=15 | 21.2% n=15 | 17.9% n=15 | 21.6% n=15 | 31.5% | 27.2% n=15 | 25.0% n=15 |
| BINI80 | 37.6% n=10 | 26.8% n=14 | 34.9% n=24 | 29.4% n=24 | 36.9% n=24 | 42.8% | 42.4% n=24 | 45.9% n=24 |
| BIPB110 | — | 36.6% n=45 | 36.7% n=44 | 29.5% n=45 | 36.6% n=45 | 39.3% | 44.3% n=43 | 49.6% n=43 |
| BIPB112 | 43.6% n=14 | — | 37.7% n=14 | 28.7% n=14 | 44.3% n=14 | 45.0% | 50.6% n=14 | 55.0% n=14 |
| BIPB114 | 29.0% n=22 | 34.4% n=7 | 35.2% n=29 | 20.0% n=29 | 31.7% n=29 | 39.6% | 37.0% n=29 | 38.5% n=29 |
| BIPB60 | 38.8% n=38 | — | 41.9% n=38 | 29.5% n=38 | 33.4% n=38 | 42.2% | 55.5% n=38 | 57.2% n=38 |
| BIPB61 | 17.9% n=14 | — | 32.5% n=14 | 17.0% n=14 | 22.1% n=14 | 20.0% | 41.0% n=14 | 43.0% n=14 |
| BIPB62 | 48.0% n=19 | — | 31.6% n=19 | 33.6% n=19 | 35.3% n=19 | 59.6% | 57.6% n=18 | 57.5% n=18 |
| BIPB63 | 46.9% n=29 | — | 38.4% n=29 | 35.0% n=29 | 33.3% n=29 | 56.0% | 66.2% n=29 | 66.7% n=29 |
| BIPB64 | 22.7% n=21 | — | 33.3% n=21 | 22.8% n=21 | 26.2% n=21 | 31.2% | 34.3% n=21 | 41.4% n=21 |
| BIPB65 | 32.9% n=19 | — | 27.5% n=19 | 30.3% n=19 | 32.3% n=19 | 41.4% | 52.3% n=19 | 54.9% n=19 |
| BIPB66 | 12.5% n=6 | — | 28.8% n=6 | 2.3% n=6 | 26.1% n=6 | 7.0% | 41.9% n=6 | 40.9% n=6 |
| BIPB67 | 36.4% n=41 | — | 29.5% n=41 | 26.1% n=41 | 33.8% n=41 | 41.9% | 49.3% n=41 | 52.2% n=41 |
| BIPB68 | 44.9% n=43 | — | 39.2% n=43 | 36.8% n=43 | 38.5% n=43 | 55.0% | 71.9% n=43 | 73.8% n=43 |
| BIPB69 | 54.2% n=110 | 56.1% n=6 | 42.6% n=116 | 39.1% n=116 | 47.4% n=116 | 64.7% | 74.4% n=116 | 75.4% n=116 |
| BIPB70 | 45.4% n=28 | 45.1% n=27 | 35.7% n=55 | 34.9% n=55 | 40.2% n=55 | 60.3% | 56.6% n=55 | 59.5% n=55 |
| BIPB72 | 50.5% n=41 | 56.1% n=34 | 39.9% n=75 | 44.3% n=75 | 49.2% n=75 | 72.4% | 64.4% n=75 | 69.0% n=75 |
| BIPB73 | — | 45.2% n=45 | 46.9% n=45 | 37.6% n=45 | 45.3% n=45 | 50.1% | 48.0% n=45 | 50.6% n=45 |
| BIPB74 | 39.3% n=8 | 56.0% n=13 | 47.1% n=21 | 51.1% n=21 | 48.9% n=21 | 62.4% | 64.5% n=21 | 65.9% n=21 |
| BIPB75 | — | 39.2% n=9 | 43.7% n=9 | 32.4% n=9 | 42.2% n=9 | 43.9% | 51.0% n=9 | 56.5% n=9 |
| BIPB76 | — | 29.9% n=20 | 29.0% n=20 | 20.9% n=20 | 31.5% n=20 | 35.9% | 34.7% n=20 | 39.8% n=20 |
| BISA102 | — | 31.1% n=27 | 34.4% n=27 | 21.5% n=27 | 30.1% n=27 | 30.9% | 33.2% n=27 | 34.7% n=27 |
| BISA103 | — | 28.4% n=19 | 36.1% n=19 | 30.1% n=19 | 37.2% n=19 | 32.5% | 40.5% n=19 | 44.5% n=19 |
| BISA104 | — | 44.2% n=16 | 41.0% n=16 | 35.7% n=16 | 45.6% n=16 | 36.2% | 46.0% n=16 | 50.6% n=16 |
| BISA105 | — | 23.8% n=19 | 23.4% n=19 | 27.8% n=19 | 36.0% n=19 | 50.3% | 41.8% n=19 | 47.0% n=19 |
| BISA107 | — | 18.0% n=12 | 21.7% n=12 | 18.5% n=12 | 20.6% n=12 | 24.6% | 32.1% n=12 | 41.2% n=12 |
| BISA84 | 25.8% n=2 | 16.7% n=5 | 40.1% n=7 | 17.5% n=7 | 28.6% n=7 | 48.8% | 35.3% n=7 | 34.3% n=7 |
| BISA88 | — | 45.8% n=13 | 43.4% n=13 | 42.7% n=13 | 54.1% n=13 | 56.7% | 55.3% n=13 | 59.9% n=13 |
| BISA91 | — | 46.7% n=13 | 44.0% n=13 | 40.3% n=13 | 55.6% n=13 | 52.4% | 58.0% n=13 | 64.8% n=13 |
| BISA92 | — | 29.4% n=39 | 29.0% n=39 | 18.8% n=39 | 25.6% n=39 | 24.5% | 33.1% n=39 | 34.3% n=39 |
| BISA93 | — | 38.7% n=27 | 26.4% n=28 | 33.0% n=27 | 26.4% n=28 | 39.1% | 58.3% n=26 | 61.0% n=27 |
| BISA94 | — | 47.4% n=2 | 21.4% n=2 | 23.1% n=2 | 56.7% n=2 | 40.3% | 43.5% n=2 | 63.2% n=2 |
| BISA97 | — | 51.1% n=12 | 29.4% n=12 | 51.1% n=12 | 49.7% n=12 | 54.4% | 67.8% n=12 | 69.3% n=12 |
| BISP100 | — | 21.7% n=7 | 27.0% n=7 | 31.9% n=7 | 34.8% n=7 | 53.9% | 42.2% n=7 | 43.2% n=7 |
| BISP101 | — | 39.1% n=13 | 32.6% n=13 | 23.0% n=13 | 32.1% n=13 | 50.0% | 42.2% n=13 | 43.5% n=13 |
| BISP89 | — | 17.2% n=13 | 27.6% n=13 | 19.9% n=13 | 21.5% n=13 | 33.2% | 28.6% n=13 | 29.9% n=13 |
| BISP90 | — | 27.6% n=8 | 37.9% n=8 | 24.7% n=8 | 30.8% n=8 | 39.8% | 41.6% n=8 | 43.2% n=8 |
| BISP95 | — | 21.9% n=26 | 23.1% n=25 | 17.8% n=26 | 20.4% n=26 | 56.9% | 28.0% n=26 | 27.6% n=26 |
| BISP96 | — | 55.6% n=18 | 48.2% n=18 | 51.5% n=18 | 49.3% n=18 | 86.0% | 69.0% n=18 | 72.7% n=18 |
| BITB27 | — | 34.5% n=16 | 37.5% n=16 | 23.8% n=16 | 24.4% n=16 | 36.6% | 45.9% n=16 | 47.8% n=16 |
| BITB28 | — | 26.9% n=43 | 29.0% n=43 | 18.5% n=43 | 20.2% n=43 | 28.5% | 33.5% n=43 | 37.5% n=43 |
| BITB29 | — | 29.6% n=49 | 25.9% n=49 | 18.5% n=49 | 23.7% n=49 | 30.2% | 39.5% n=49 | 42.1% n=49 |
| BITB30 | — | 29.9% n=12 | 30.3% n=12 | 14.0% n=12 | 18.3% n=12 | 42.5% | 33.9% n=12 | 38.2% n=12 |
| BITB32 | — | 16.7% n=19 | 19.9% n=19 | 11.7% n=19 | 11.8% n=19 | 30.3% | 17.9% n=19 | 19.8% n=19 |
| BITB33 | — | 20.3% n=27 | 22.3% n=27 | 7.9% n=27 | 11.5% n=27 | 18.5% | 18.4% n=26 | 17.5% n=26 |
| BITB34 | — | 41.4% n=11 | 46.6% n=11 | 37.0% n=11 | 34.5% n=11 | 61.1% | 56.5% n=11 | 66.7% n=10 |
| BITB37 | — | 37.3% n=56 | 42.4% n=57 | 29.0% n=56 | 29.6% n=57 | 38.8% | 51.2% n=55 | 54.5% n=55 |
| BITB38 | — | 33.7% n=44 | 31.5% n=44 | 26.3% n=44 | 28.1% n=44 | 56.0% | 54.1% n=44 | 56.3% n=44 |
| BITB39 | — | 40.1% n=60 | 44.4% n=61 | 36.7% n=60 | 31.7% n=61 | 50.3% | 53.3% n=59 | 57.5% n=59 |
| BITB40 | — | 28.5% n=5 | 30.8% n=5 | 23.6% n=5 | 22.7% n=5 | 44.9% | 39.7% n=5 | 45.7% n=5 |
| BITB41 | — | 31.8% n=13 | 39.5% n=13 | 24.9% n=13 | 31.8% n=13 | 41.9% | 40.3% n=13 | 42.0% n=13 |
| BITB42 | — | 31.1% n=49 | 35.4% n=51 | 22.6% n=49 | 24.4% n=51 | 36.2% | 39.5% n=50 | 42.8% n=51 |
| BITB43 | — | 35.9% n=12 | 36.6% n=12 | 22.3% n=12 | 14.7% n=12 | 28.7% | 46.7% n=12 | 50.3% n=12 |
| BITB44 | — | 33.2% n=36 | 38.7% n=36 | 26.9% n=36 | 29.4% n=36 | 40.5% | 44.2% n=36 | 47.0% n=36 |
| BITB45 | — | 44.5% n=13 | 36.1% n=13 | 33.3% n=13 | 39.2% n=13 | 45.6% | 50.5% n=13 | 51.9% n=13 |
| BITB46 | — | 27.5% n=11 | 31.3% n=11 | 18.4% n=11 | 15.2% n=11 | 25.8% | 34.5% n=10 | 37.7% n=10 |
| BITB47 | — | 43.0% n=2 | 33.2% n=2 | 25.5% n=2 | 35.0% n=2 | 53.7% | 46.0% n=2 | 45.2% n=2 |
| BITB53 | — | 35.2% n=22 | 27.4% n=22 | 23.4% n=22 | 30.8% n=22 | 36.7% | 40.7% n=22 | 42.0% n=22 |
| BITB54 | — | 34.3% n=99 | 30.9% n=99 | 29.8% n=99 | 20.8% n=99 | 49.5% | 50.0% n=97 | 53.9% n=97 |
| BITB55 | — | 43.3% n=14 | 38.3% n=14 | 33.2% n=14 | 33.8% n=14 | 47.6% | 47.1% n=14 | 51.0% n=14 |
| BITB56 | — | 19.9% n=13 | 18.0% n=13 | 19.4% n=13 | 20.3% n=13 | 21.3% | 25.0% n=13 | 26.2% n=13 |
| BITB57 | — | 44.0% n=111 | 36.4% n=111 | 43.4% n=111 | 33.2% n=111 | 40.1% | 65.6% n=111 | 67.8% n=111 |
| BITB58 | — | 31.0% n=1 | 29.9% n=1 | 31.0% n=1 | 40.0% n=1 | 67.0% | 28.1% n=1 | 32.6% n=1 |
| BIVB108 | 40.0% n=1 | 25.1% n=10 | 28.2% n=11 | 11.7% n=11 | 23.9% n=11 | 45.7% | 23.2% n=10 | 18.1% n=11 |
| BIVB109 | 36.7% n=1 | 35.0% n=32 | 24.9% n=33 | 35.0% n=33 | 39.0% n=33 | 34.7% | 67.3% n=33 | 66.1% n=33 |
| BIVB81 | — | 37.8% n=5 | 49.2% n=5 | 56.7% n=5 | 44.7% n=5 | 51.7% | 60.9% n=5 | 63.4% n=5 |
| BIVB99 | — | 20.8% n=11 | 18.5% n=11 | 35.4% n=11 | 24.5% n=11 | 55.6% | 64.2% n=11 | 62.9% n=11 |
| BICA01 | 0.0% n=1 | — | 0.3% n=1 | 0.0% n=1 | 3.3% n=1 | 4.6% | 1.3% n=1 | 0.4% n=1 |
| BIDI16.5 | 45.6% n=13 | 38.7% n=11 | 29.7% n=11 | 26.3% n=11 | 41.8% n=11 | — | 37.2% n=11 | 39.4% n=11 |
| BIEA24.5 | — | 19.6% n=5 | 21.2% n=5 | 15.2% n=5 | 20.7% n=5 | — | 20.3% n=5 | 22.0% n=5 |
| BITB34.5 | — | 47.2% n=3 | 33.4% n=3 | 21.9% n=3 | 53.3% n=3 | — | 29.2% n=3 | 28.6% n=3 |
n under each value is the number of photographs that method scored at that dive site. ⚠ marks a cell that is not an independent check.
Reference: IN-WATER DIVER TRANSECT, independent of the imagery (Mayfield & Dempsey 2026, Oceans 7:1). Denominator: line/point intercept along the transect; not a photo-point denominator. Source: published (Mayfield & Dempsey 2026, Oceans 7:1, suppl. S1); formal 38.7% cover / 30.5% bleaching, tourist-diver 35.1% / 31.8% ⚠ The reference here is NOT the same instrument as at Mauritius, Oman, Kenya or the Red Sea. Those are point counts on the photographs; this is a diver swimming a transect. The models and the reference never saw the same thing. ⚠ SITE-LEVEL ONLY. The 2,500 frames were not associated with any transect taken within 200 m of them, so transect-vs-image comparisons are site means, never frames. The transect value is already in the pin `cover` field (109 of 112 pins, sourced to the paper's suppl. S1) and is read from there, never re-imported.
Nearby external survey stations
6 independent survey records within 5 km of a site in this region (deduplicated across sites).
- Sheppard et al. (2008) — Great Chagos Bank (2006): 41% hard coral cover, 0.42 km from Chagos Archipelago - Great Chagos Bank West (BITB27)
- Spalding et al. 2025 (Chagos 2024 bleaching report) — Great Chagos Bank - Middle Brother, lagoon (E aspect, 1-3 m) (2024): 50% hard coral cover, 0.80 km from Chagos Archipelago - Great Chagos Bank West (BITB57)
- XL Catlin Seaview Survey — transect 36001 (2015): 6.3% hard coral cover, 1.05 km from Chagos Archipelago - Great Chagos Bank West (BIDI14)
- XL Catlin Seaview Survey — transect 36002 (2015): 25% hard coral cover, 0.26 km from Chagos Archipelago - Great Chagos Bank West (BIDI09)
- XL Catlin Seaview Survey — transect 36003 (2015): 13% hard coral cover, 0.14 km from Chagos Archipelago - Eagle Island (BIEA24.5)
- XL Catlin Seaview Survey — transect 36004 (2015): 21% hard coral cover, 0.26 km from Chagos Archipelago - Great Chagos Bank West (BITB40)
All images from Coral Reef Diagnostics. Data are from Coral Reef Diagnostics and XL Catlin Seaview Survey (University of Queensland).
© Coral Reef Diagnostics.
References
- Souter D, et al. (eds) (2021) Status of Coral Reefs of the World: 2020. International Coral Reef Initiative / Global Coral Reef Monitoring Network. [PDF]
- Spalding MD, et al. (2001) World Atlas of Coral Reefs. University of California Press, Berkeley. [PDF]
- Wilkinson C (2006) Status of coral reefs of the world: summary of threats and remedial action. In: Côté IM, Reynolds JD (eds) Coral Reef Conservation. Cambridge University Press, Cambridge. [PDF]
- Mayfield AB, Dempsey AC (2026). Using tourist diver images to estimate coral cover and bleaching prevalence in a remote Indian Ocean coral reef system. Oceans 7(1):1. PDF
- Sheppard C, Harris A, Sheppard A (2008). Archipelago-wide coral recovery patterns since 1998 in the Chagos Archipelago, central Indian Ocean. Marine Ecology Progress Series 362:109-117. PDF
- Spalding M, Bourasseau M, et al. (2025). Coral bleaching and mortality in the Chagos Archipelago, 2024. British Indian Ocean Territory Administration report (gray literature). PDF