
Chagos Archipelago - Eagle Island (BIEA24.5)

Part of the regional summaries: Chagos Archipelago - Great Chagos Bank West / Brothers / Eagle and Chagos Archipelago
More info
Chagos (NOAA CRW virtual station)An Eagle Island reef set apart by its color, with Pocillopora colonies in bubblegum pink and deep magenta, a pigment response that can signal stress. Coral death is localized but severe where it occurs, including a branching colony in mid-collapse with a large dead center under sediment-laden turf, and the dive also featured parrotfish and an octopus. Surveyed on the Living Oceans Foundation's Global Reef Expedition.
One independent survey station shown with the program’s logo — click one to see how far it is from this site.
Four other CRD dive sites within 5 km shown in orange — click a marker to open its page.
🗺 Detailed map of the Global Reef Expedition dive sites, Eagle Island, Chagos (Khaled bin Sultan Living Oceans Foundation; opens in a new window)
2 of these 4 photographs are shown beside the text that discusses them under "Site description" below.
Site description
General benthic features
Non-coral cover is dominated by crustose coralline algae 16.7%, turf 35.3% of all points.
Coral cover
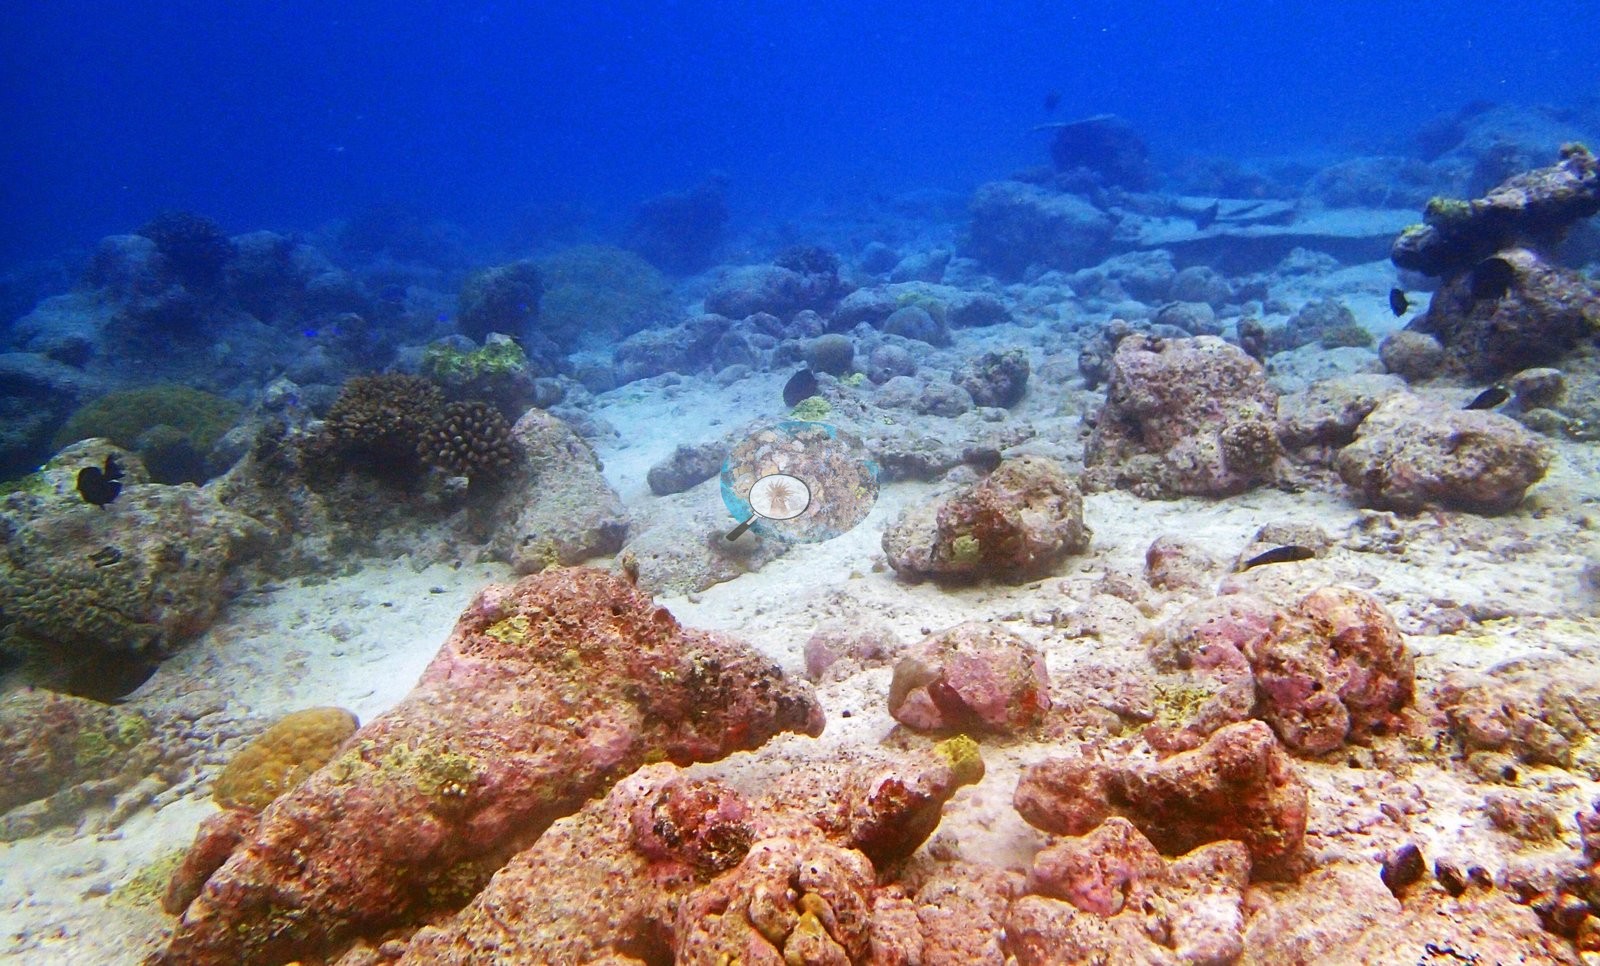
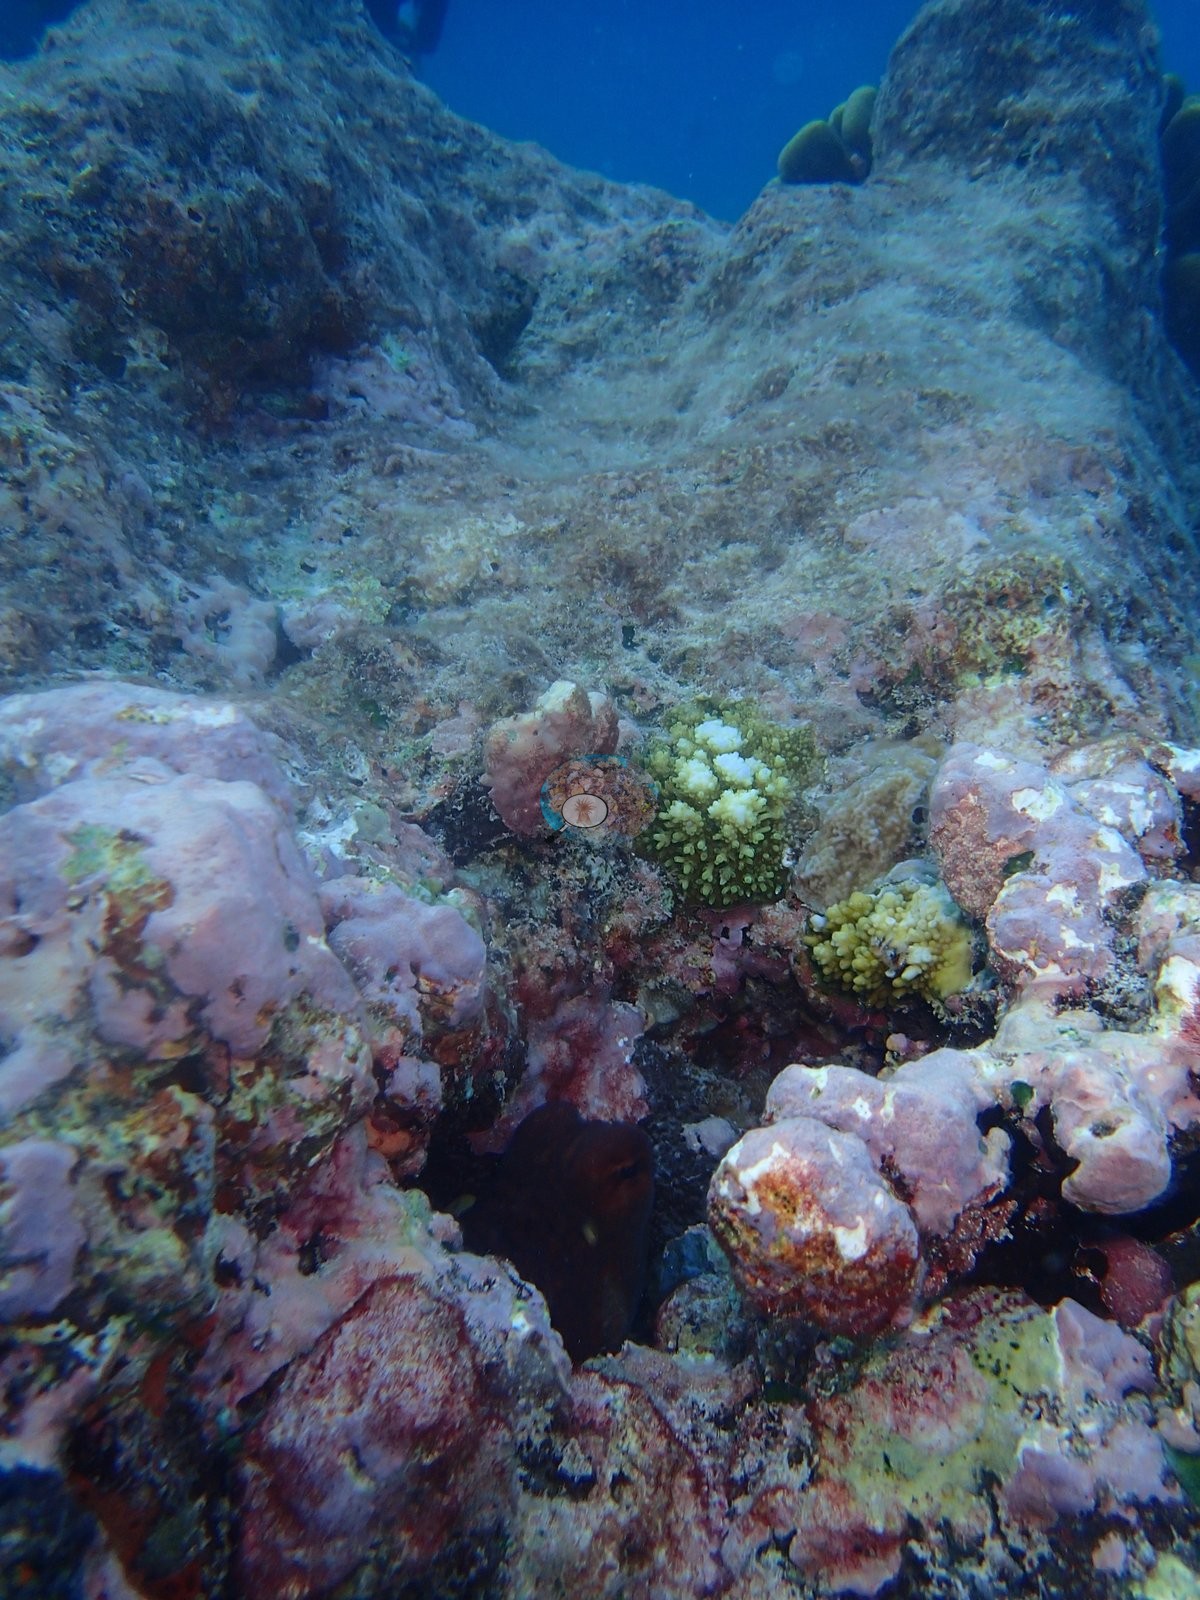
The 30-point annotation reads it correctly (6.7% live, 13.3% bleached, 63.3% turf); Coralscapes reads the same frame as 22.1% live, 0.15% bleached and 0.10% dead — it scores the skeleton as coral. Assemblage composition. Every number below rests on the 5 analyzed frames. Across 5 analyzed frames the Coralscapes masks put live hard coral at 17.4% of image area, of which massive and meandroid is the largest component at 40.5%; the rest breaks down as Acropora (non-tabular) 20.8%, other hard coral 19.5%, Pocillopora 18.4% of live cover. The independent 30-point human annotation of the same frames (150 points) gives live hard coral as 12.7% of all points and apportions it Porites 42.1%, Acropora 26.3%, Pocillopora 21.1%, other hard coral 10.5% of live coral. Across all 23 frames reviewed my own read is a site mean in the low-to-mid teens: the six reef-scene frames sit at 20–30%, but a third of the set is fauna portraiture and macros over near-bare sand. 19.6% is credible for the coral-bearing pavement, not as a mean over this photo set (e.g., Image 1, Image 4).
Coral cover: 20% — from imagery only, with no transect behind it. This is a ".5" site: informal survey images were annotated in CoralNet, but no formal benthic transect was ever run here. The figure describes the frames that were photographed, not a surveyed reef, and it is not comparable with the transect-derived cover quoted at the numbered sites nearby — it must never be pooled or averaged with them.
Stressors
The color is what distinguishes this reef, and it may be a stress signal. Four macro frames are Pocillopora-type colonies in a striking pigment range — bubblegum-pink (two frames), a wholly cream-and-tan mottled colony with white branch tips, and the best frame at the site: a deep magenta colony and a cream-tan colony growing shoulder to shoulder on the same head. Deep pink and magenta pigmentation in pocilloporids is a documented chromoprotein stress response, not simply a color morph, so these may belong with the stress evidence rather than beside it — Anderson's call, not mine, as at BIDI16.5. Mortality is localized, severe where it occurs, and largely invisible to the models. The reference frame: a branching colony in mid-collapse — bone-white branch clusters at the periphery with corallite texture still sharp, pigmented olive-brown branches among them, and a large central mass wholly dead under gray-green sediment-laden turf. A second frame repeats it unannotated; a third is the erosion frame. Structural loss registers as dead coral 3.3% of image area and rubble 1.5%. Bleaching stands at 5.3% of annotated points, concentrated in other hard coral 4%, Acropora 1.3% of points. No crown-of-thorns starfish (COTS) or other corallivores evident.
Fish and other fauna
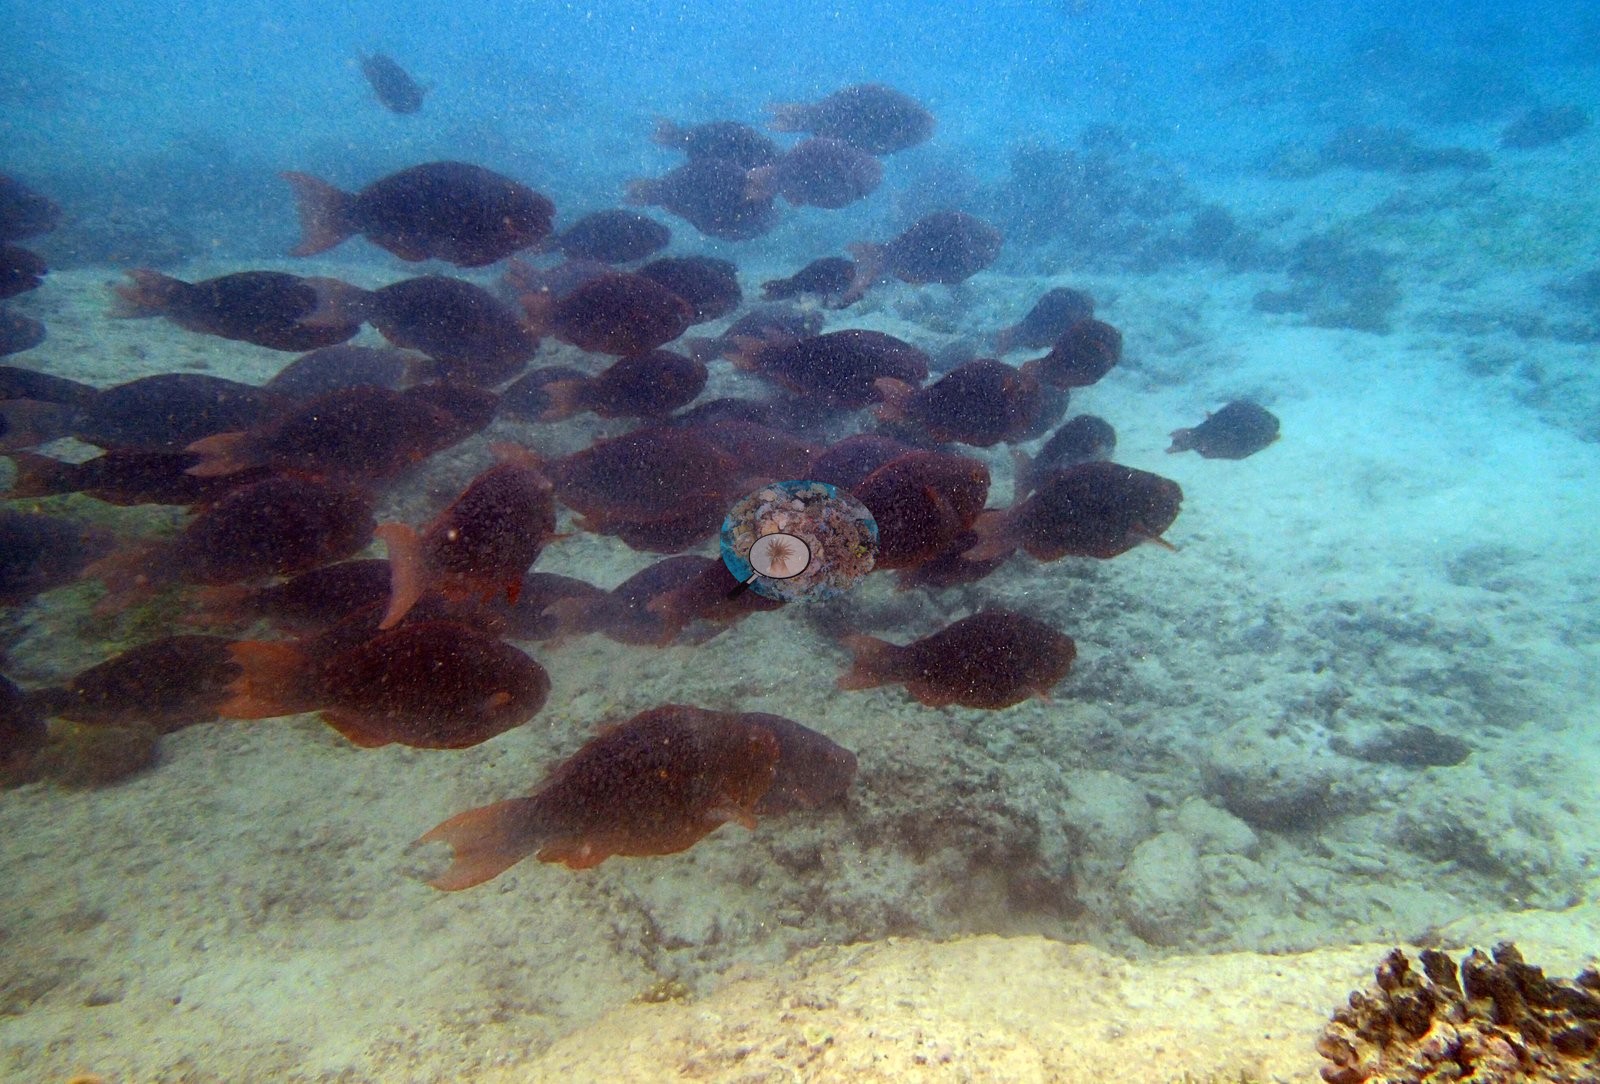
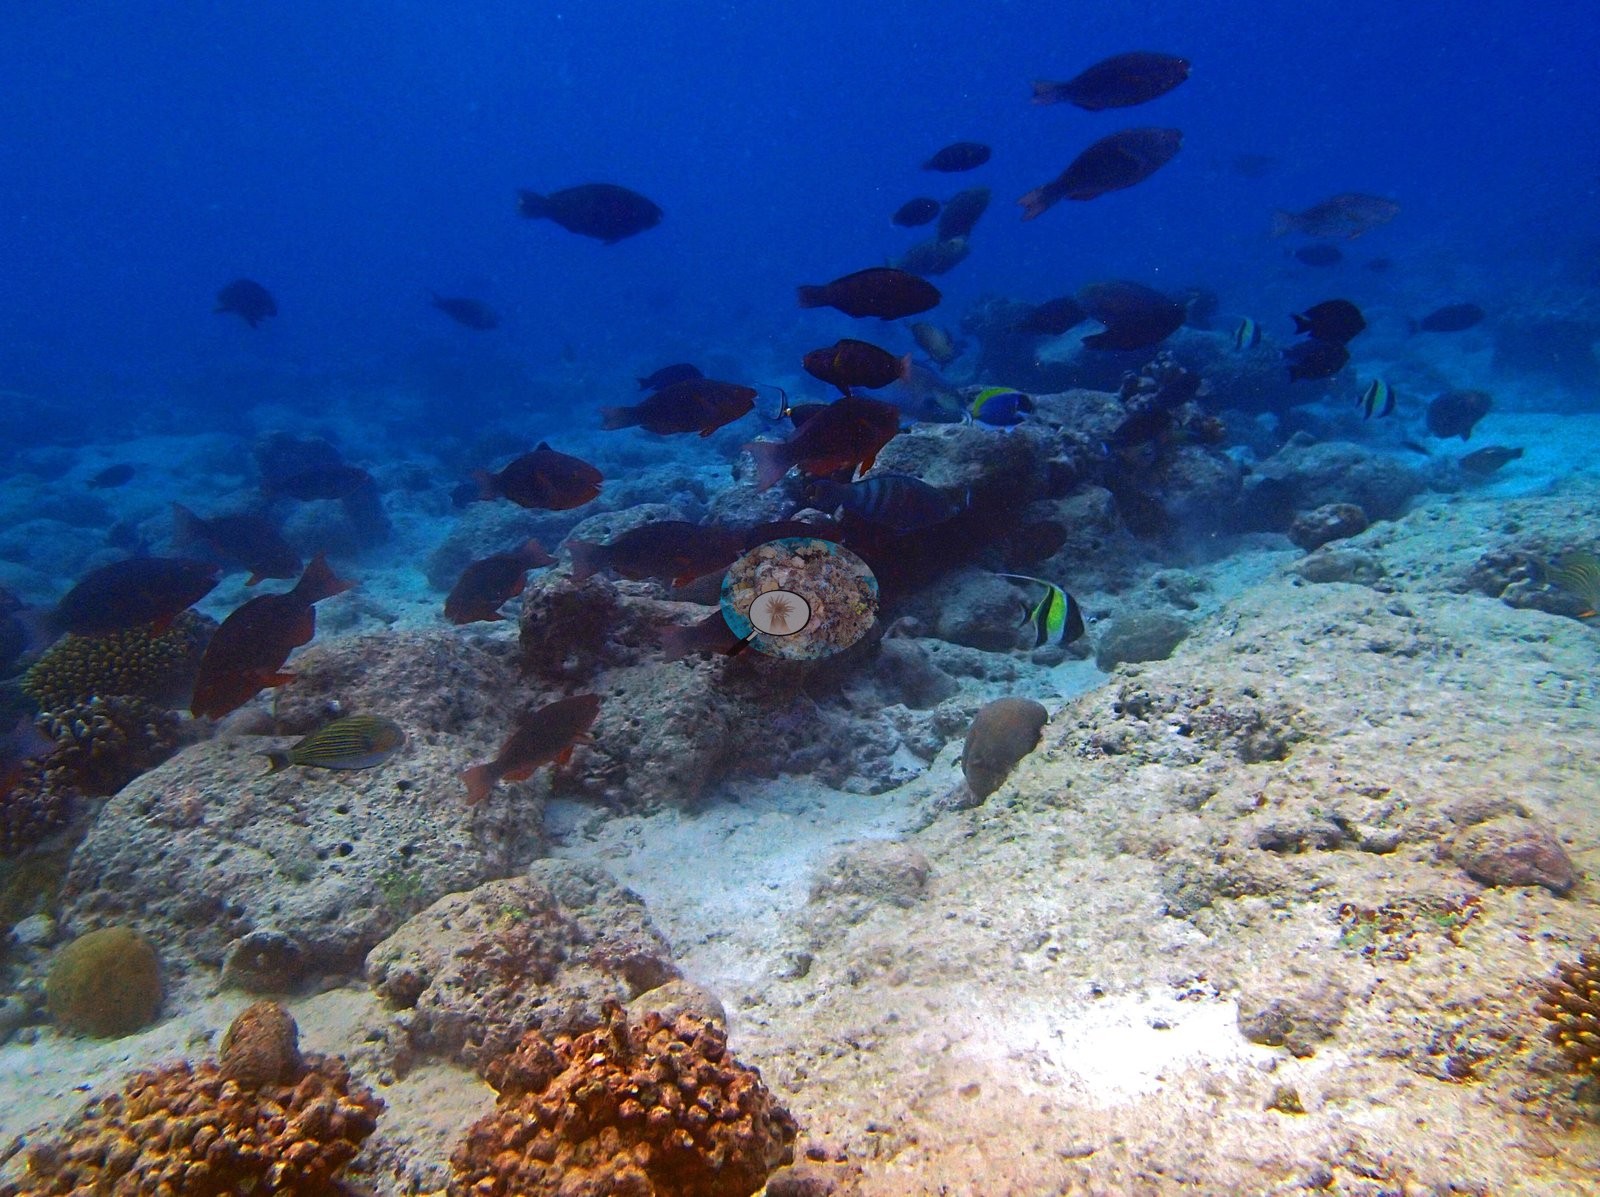
Faunally the dive is two things: parrotfish and one octopus. Three consecutive frames capture a large parrotfish school (compatible with Chlorurus/Scarus) over near-bare sand, the middle one holding a green-and-pink terminal-phase male; the school returns in a later frame with two Moorish idols (Zanclus cornutus), a bannerfish compatible with Heniochus, and lined surgeonfish compatible with Acanthurus lineatus; powder-blue surgeonfish, electric-blue damselfish, and cleaner wrasse fill out the rest. The site's best animal is misidentified in the existing record: there are three frames of an octopus, compatible with Octopus cyanea — wedged in a crevice with its ribbed pale mantle out, then a portrait with eye and sucker plainly visible, then out on open pavement. Conspicuous fauna appear as sponges in 2 frames, sea cucumbers in 1, anemones in 1; frame-to-frame live cover runs 6.7% to 23.3%.
Comparisons with other data
No independent survey was made at this exact site; the nearest ones are listed in the table below.
Other notes
The current text calls this a gray moray eel across three frames. It is not a moray, and one of those three is not one of its frames.
CV model comparison
More info
Every other row is a method run on this site's own photographs (mean ± SD across photos), listed for comparison only; nothing is averaged with the headline. As of September 2026 no computer-vision method estimates coral cover accurately on new images, so treat these as indicative.| Method | Hard-coral cover (%) |
|---|---|
| CoralNet | 19.6 |
| In-house DINOv3 | 20.7 |
| CoralSCOP edited | 21.2 |
| Claude | 15.2 |
Independent surveys nearby
Within 5 km, 1 independent survey station recorded hard coral cover in 2015. The most recent nearby survey is from 2015, so these values predate recent heat stress. This site's own estimate (20%) is indistinguishable from the range of these surveys (13%): the 6.6-point gap is inside the ±7 percentage-point noise between methods; the methods differ, so the comparison is context, not a like-for-like test.
Collected by other programs using different methods (the XL Catlin Seaview Survey uses photo-transects with automated image annotation), so these are context for the figures above, not a like-for-like comparison. Where a station was surveyed more than once the range is shown. Station names are not dive-site names.
| Agency | Site / location | Date | Hard coral cover (%) | Distance | Link |
|---|---|---|---|---|---|
| XL Catlin Seaview Survey | transect 36003 | 2015 | 13% | 0.14 km | — |
Data & links
- Download all LOF-GRE data (933 sites) ↗
- CoralNet image repository for this region ↗
- HeatCRD database ↗
- (reference) ↗
- Photo portfolio ↗
- Coral Reef Diagnostics page for this area ↗
All images from Coral Reef Diagnostics. Data are from Coral Reef Diagnostics and the organizations named in the data-sources table above.
© Coral Reef Diagnostics.