
Part of the regional summaries: Chagos Archipelago - Great Chagos Bank West / Brothers / Eagle and Chagos Archipelago

More info
Chagos (NOAA CRW virtual station)One of the most dramatic depth changes in Chagos: Acropora shallows and an algae-heavy middle band give way to deep fields of plate-forming Echinopora and Turbinaria corals, with two deep transects reaching 88-94% coral. The site averages 56% cover but is patchy, from dense plate fields to open rubble. Surveyed on the Living Oceans Foundation's Global Reef Expedition.
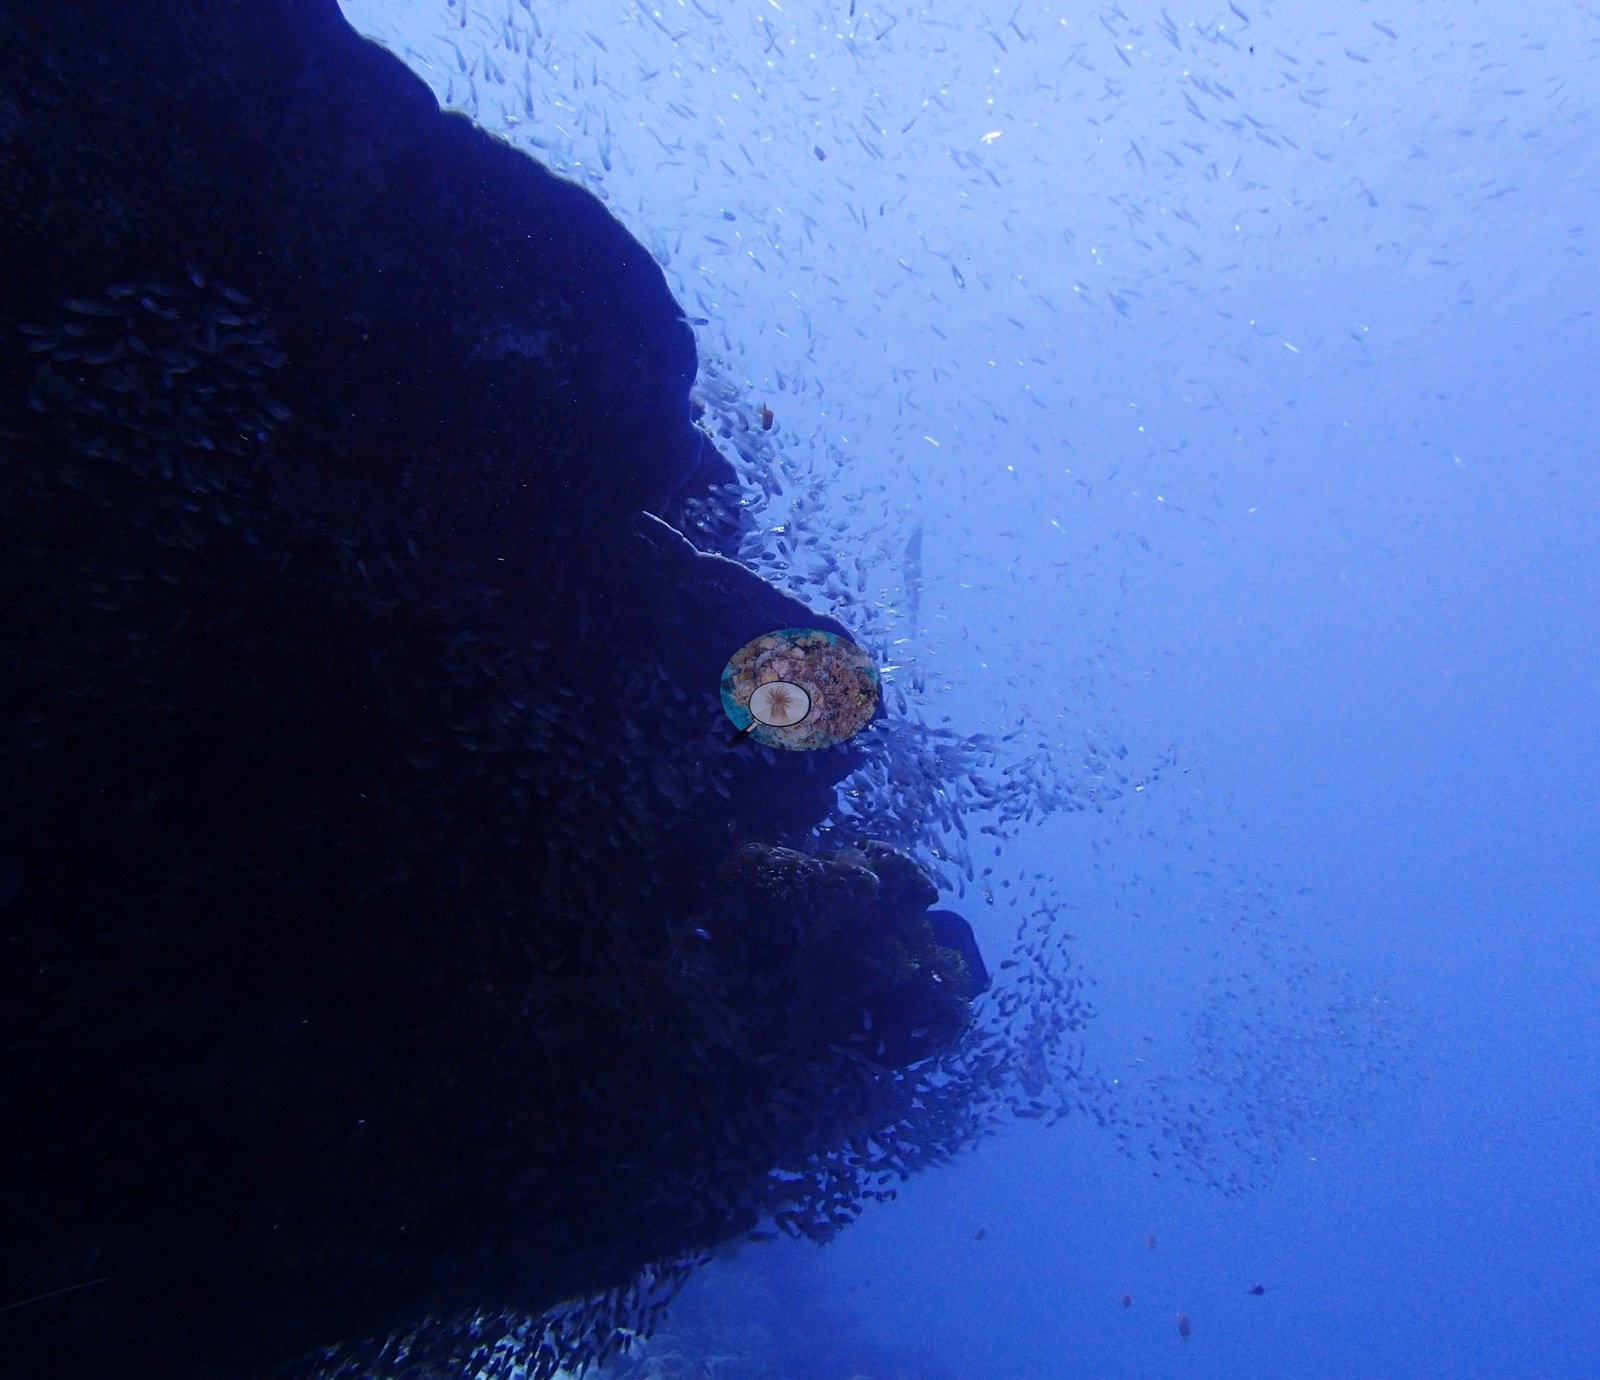
Three independent survey stations shown with the program’s logo — click one to see how far it is from this site.
Fourteen other CRD dive sites within 5 km shown in orange — click a marker to open its page.
🗺 Detailed map of the Global Reef Expedition dive sites, Three Brothers, Chagos (Khaled bin Sultan Living Oceans Foundation; opens in a new window)
Site description
General benthic features
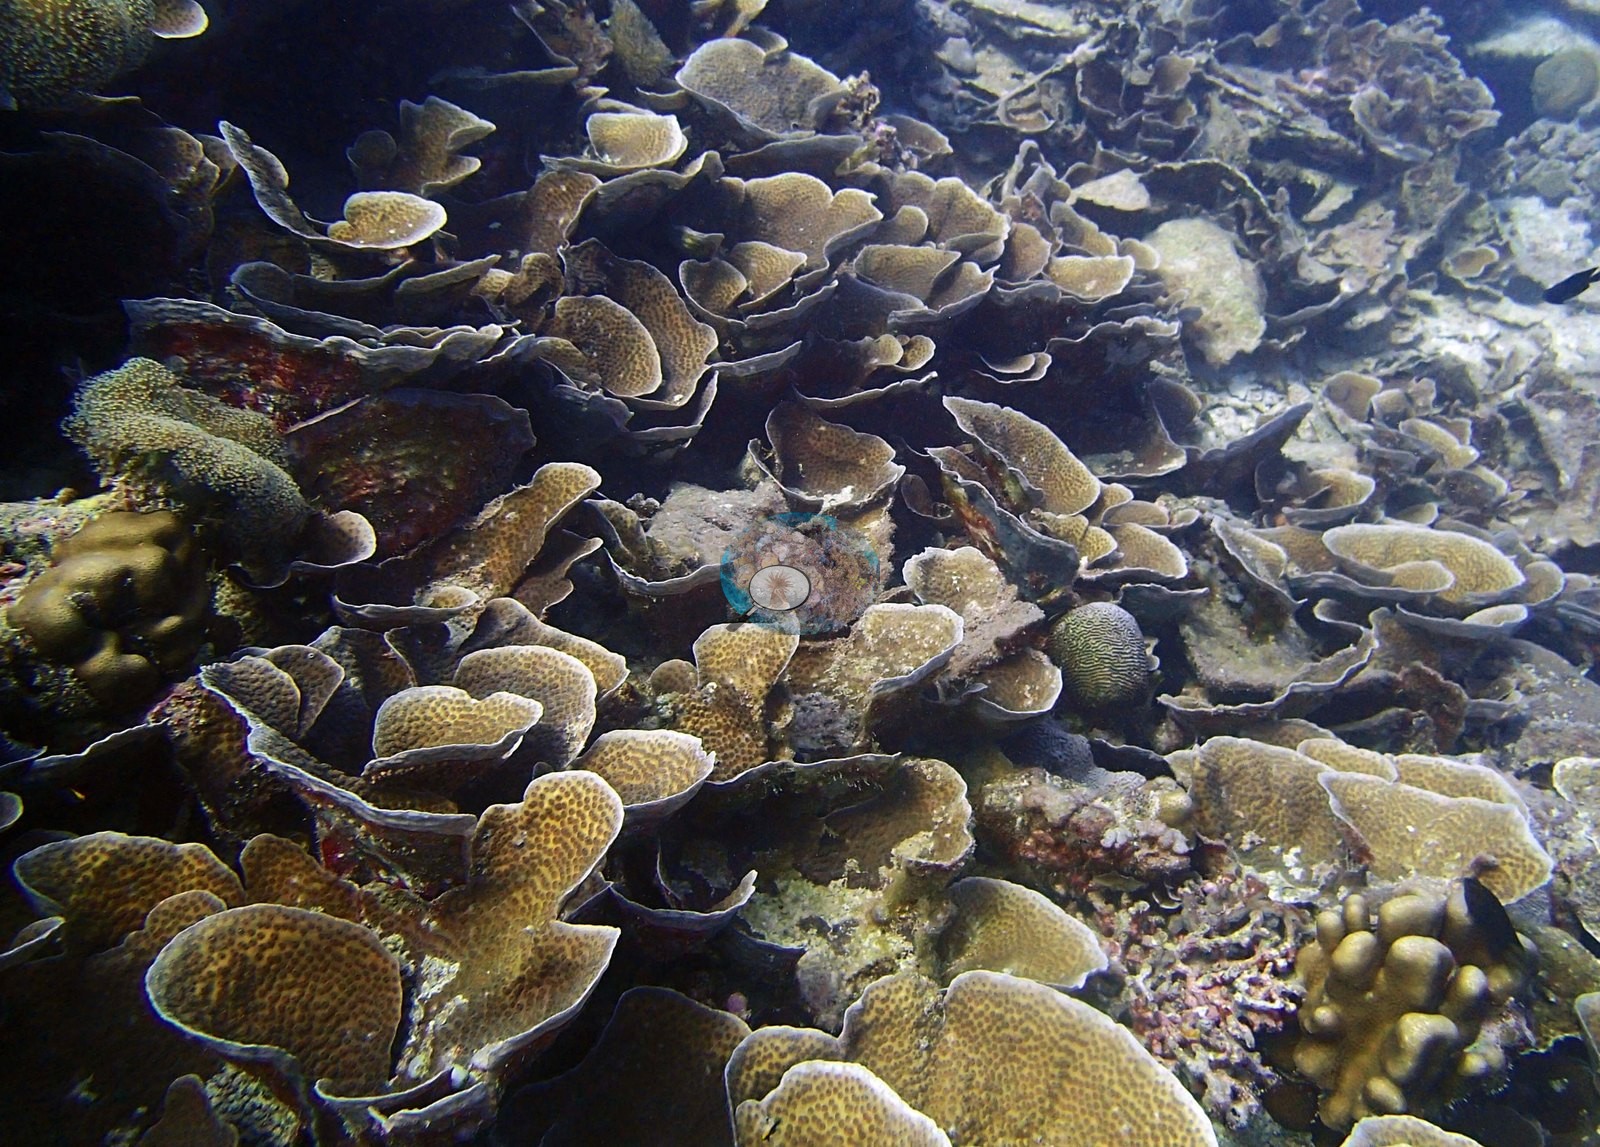
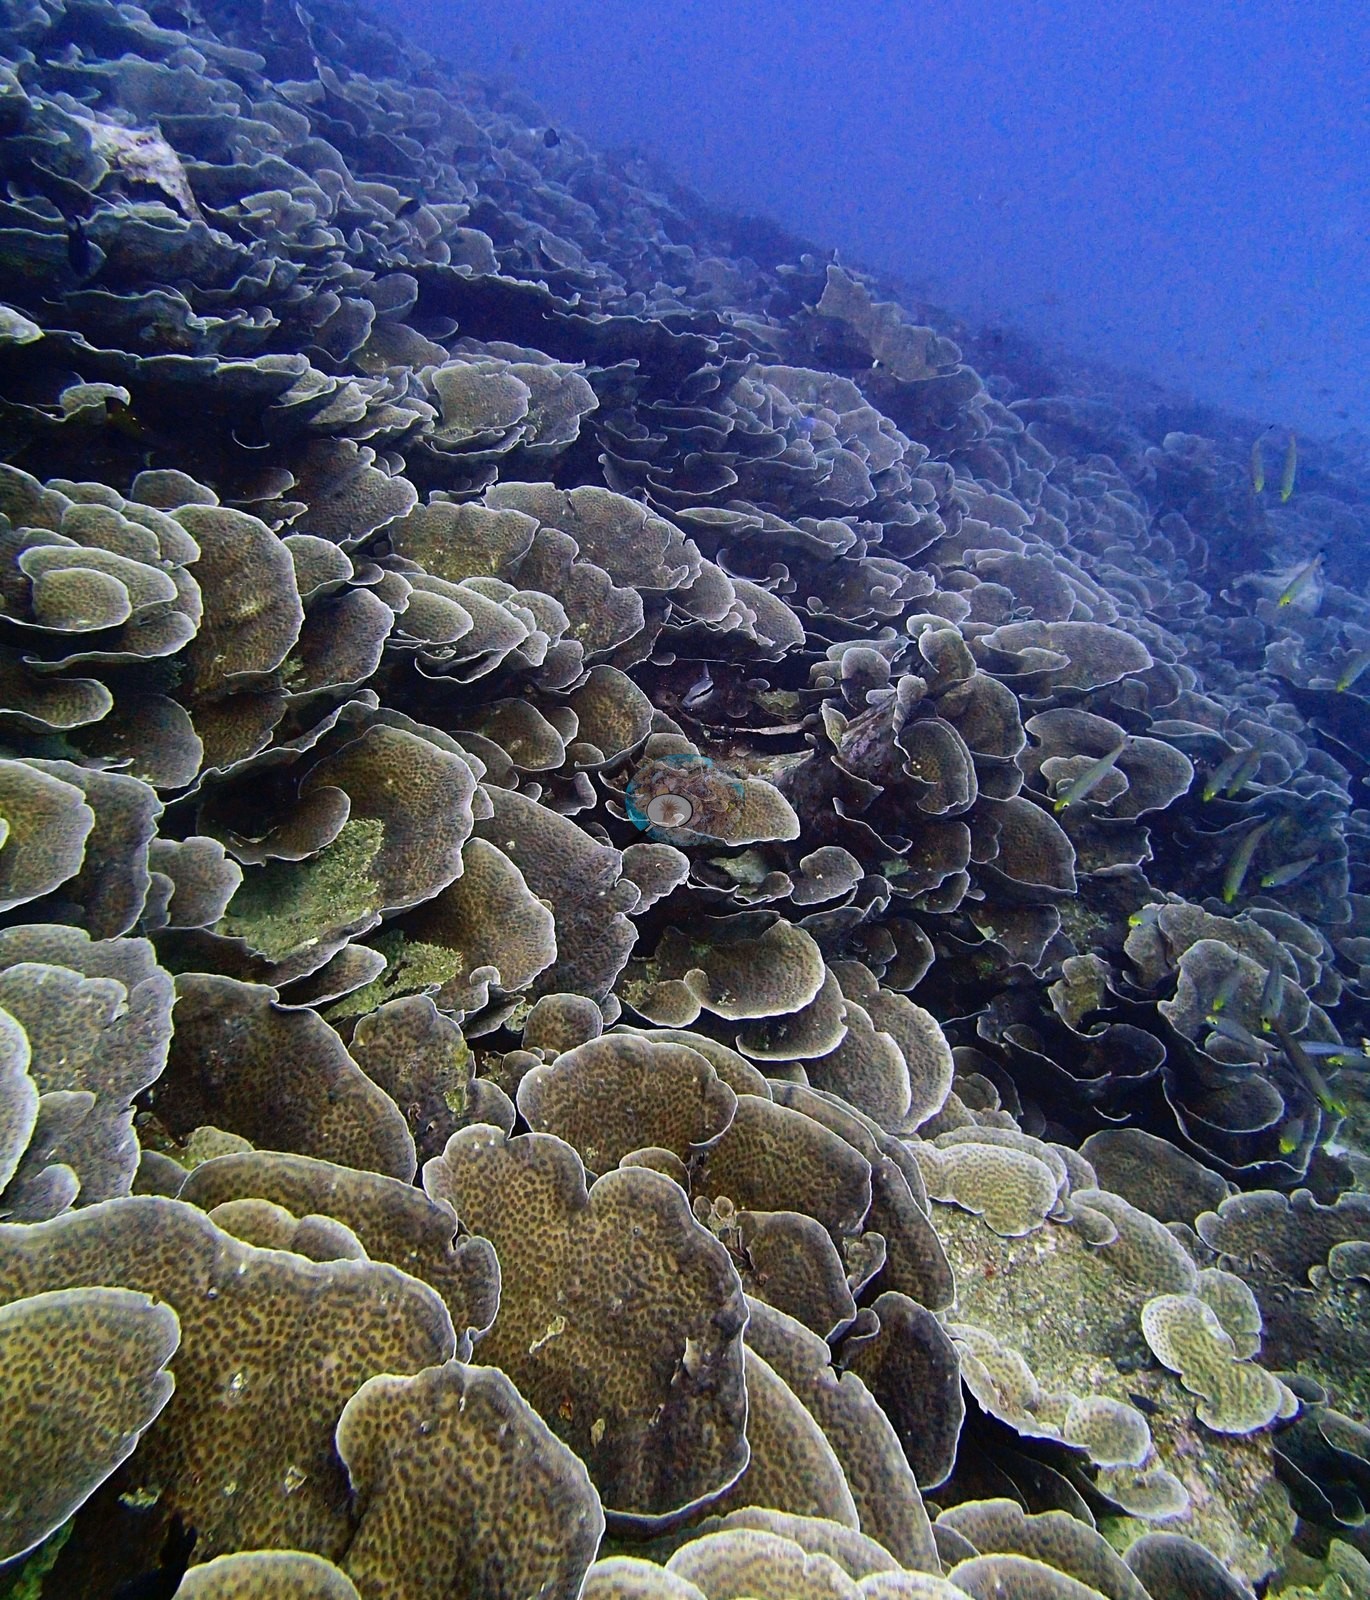
The assemblage is led almost equally by Echinopora (13.77%) and Acropora (13.54%), followed by Heliopora (6.65%) and Turbinaria (6.05%). D2 is the low-cover, algae-dominated interval: 34.3% coral against 57.27% algae, with Heliopora at 17.5%, turf at 36.43% and Acropora down to only 2.43%. D3 rises to 69.33% coral, split among Echinopora 13.13%, Acropora 12.68%, Heliopora 8.6% and Turbinaria 4.55%. D4 reaches 74.9% coral and is a different reef again – Echinopora 41.65% and Turbinaria 19.6%, with Acropora at only 4.65% and algae down to 12.25%. Two D4 transects are extraordinary: 88% and 94% coral, composed almost entirely of Echinopora (88% and 78%, with 16% Acropora in the latter). The site therefore runs a pronounced D1-to-D4 transition from Acropora dominance, through a Heliopora-and-algae interval, to an Echinopora/Turbinaria-dominated deep stratum.
First, the coral-form point and mask classes are too coarse to resolve this assemblage. On the 34 paired frames the point set attributes 54.7% of live coral points to Acropora, 20.9% to Porites, 1.4% to Pocillopora and 23% to ‘other hard coral’. Coralscapes makes ‘other hard coral’ its largest live form at 40.5%, ahead of tabular Acropora 18.9%, massive/meandroid 16%, non-tabular Acropora 12.8% and Pocillopora 6.3%. The formal transect data explain the disagreement outright: Echinopora, Heliopora and Turbinaria together make up 26.47 percentage points – 47% of all formal coral cover – and none of the three has a dedicated point or mask class. Much of the image models' ‘other hard coral’, and probably some of what they call ‘tabular Acropora’, is this site's defining non-Acropora plate fauna. That is a limitation of the label vocabularies, and it is exactly why the transect genus values – not the image subset – carry the assemblage.
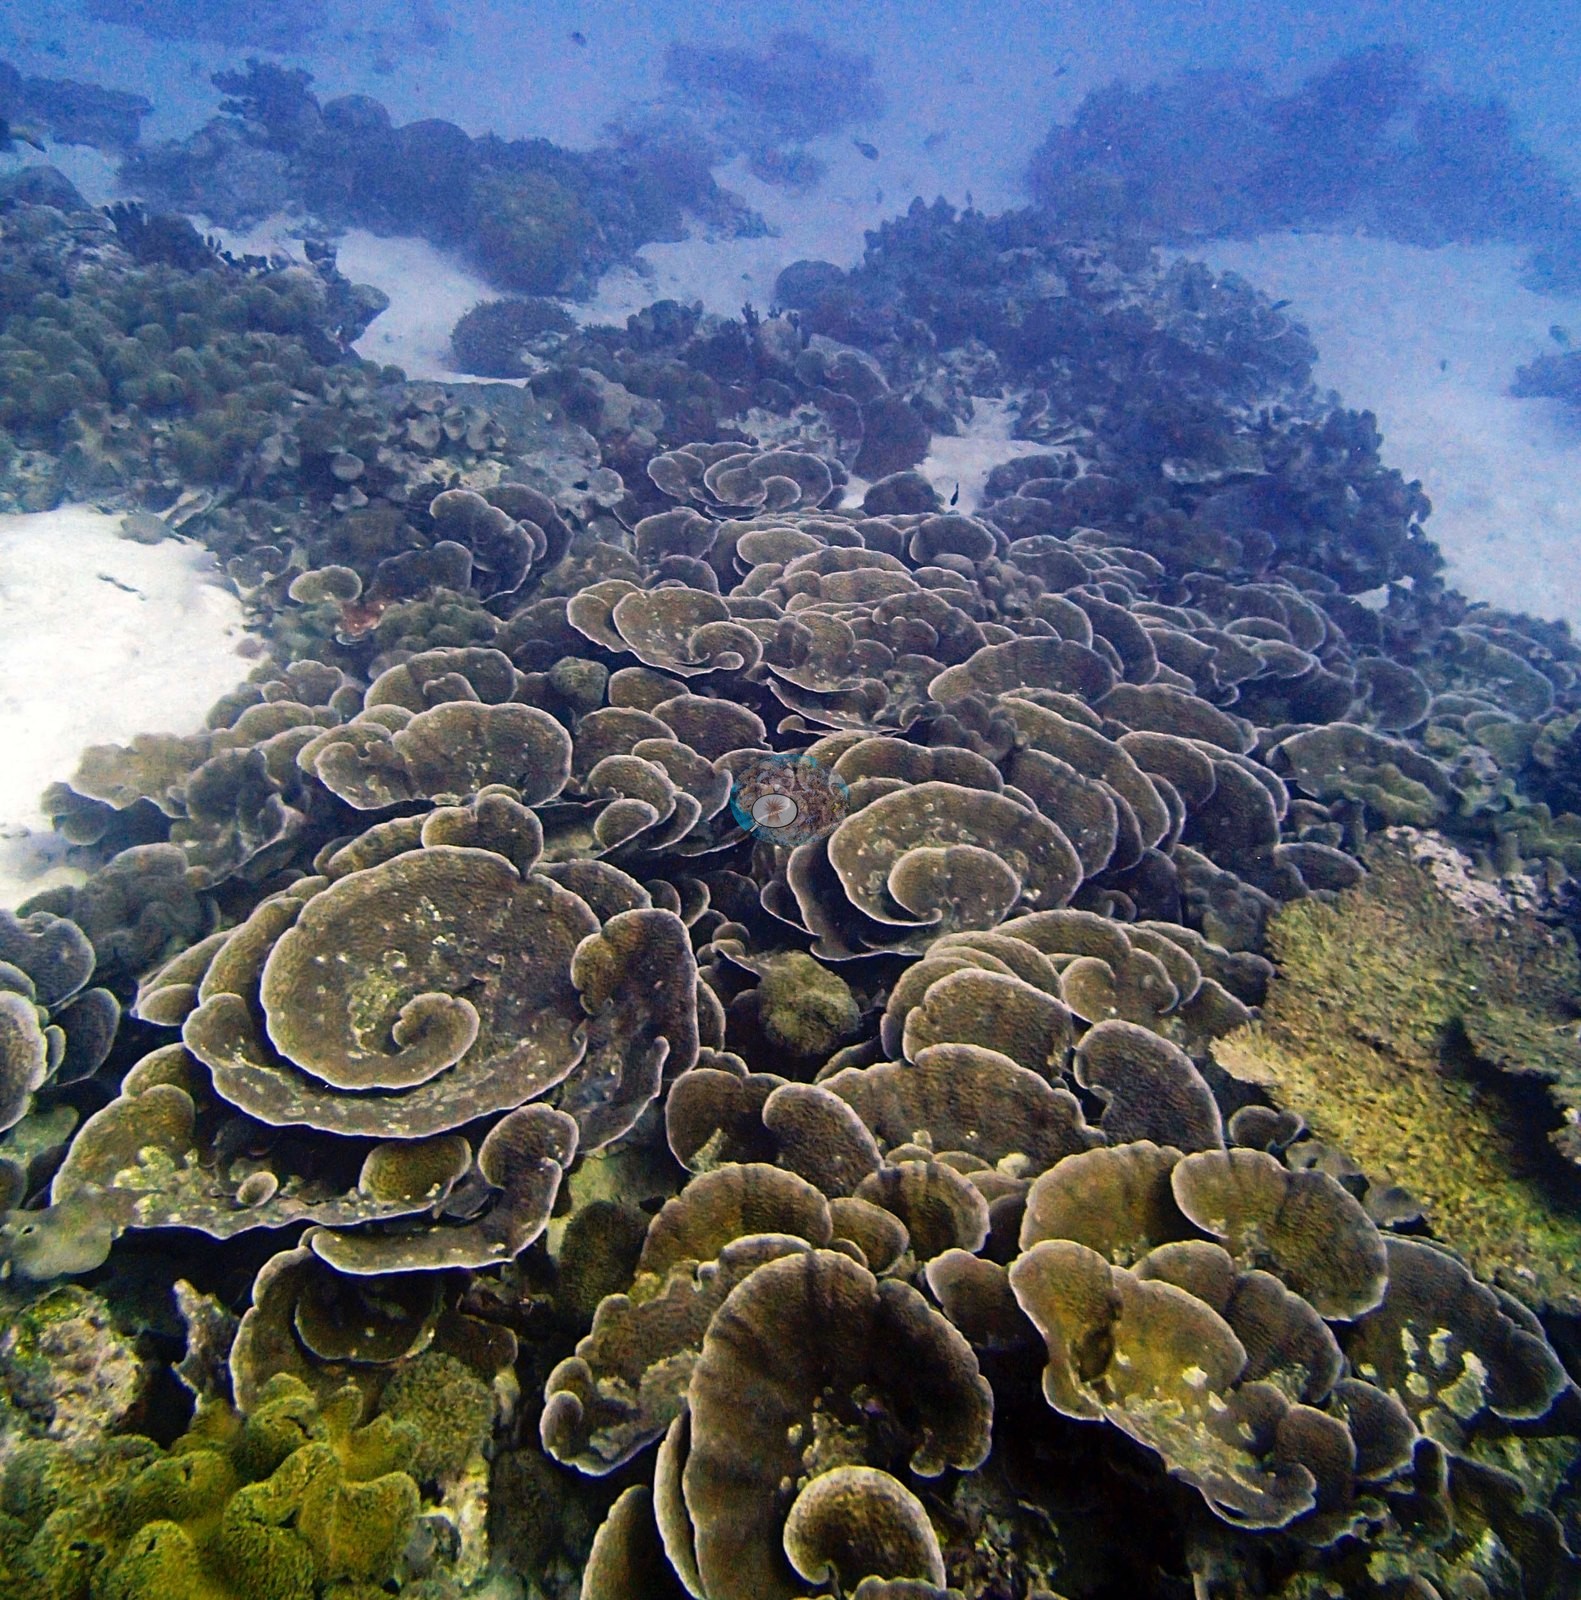
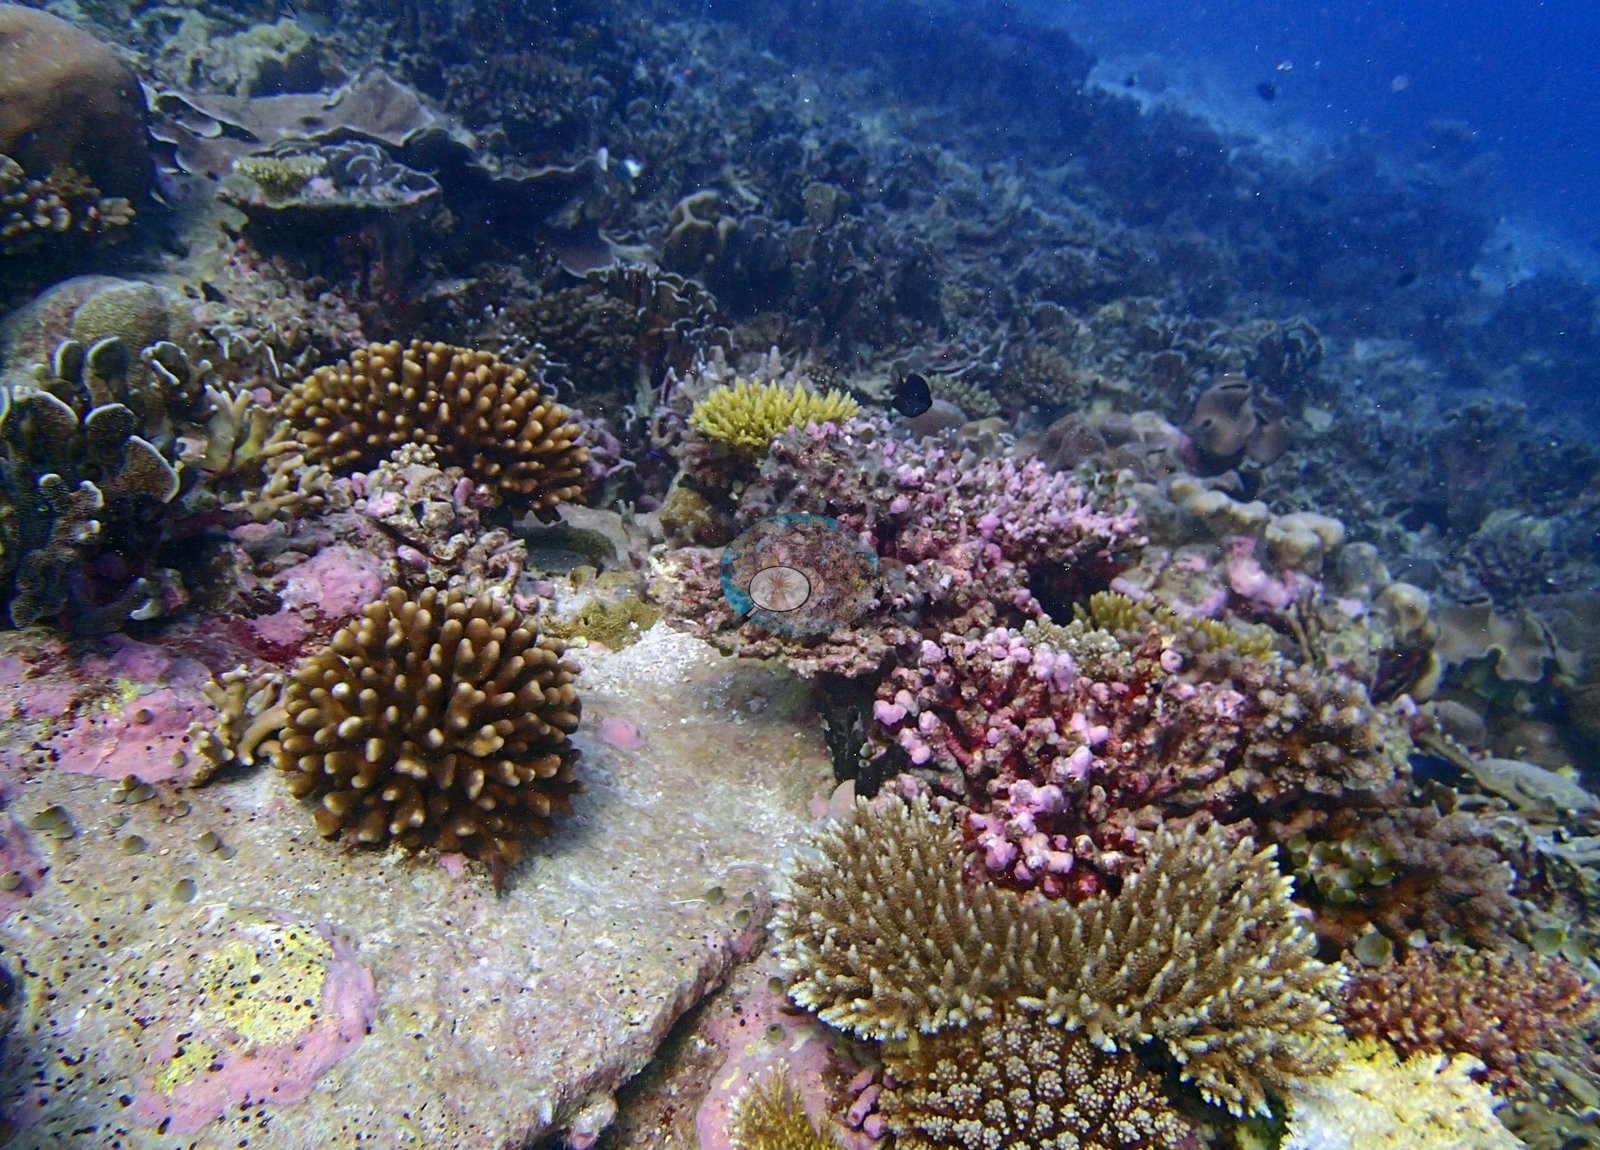
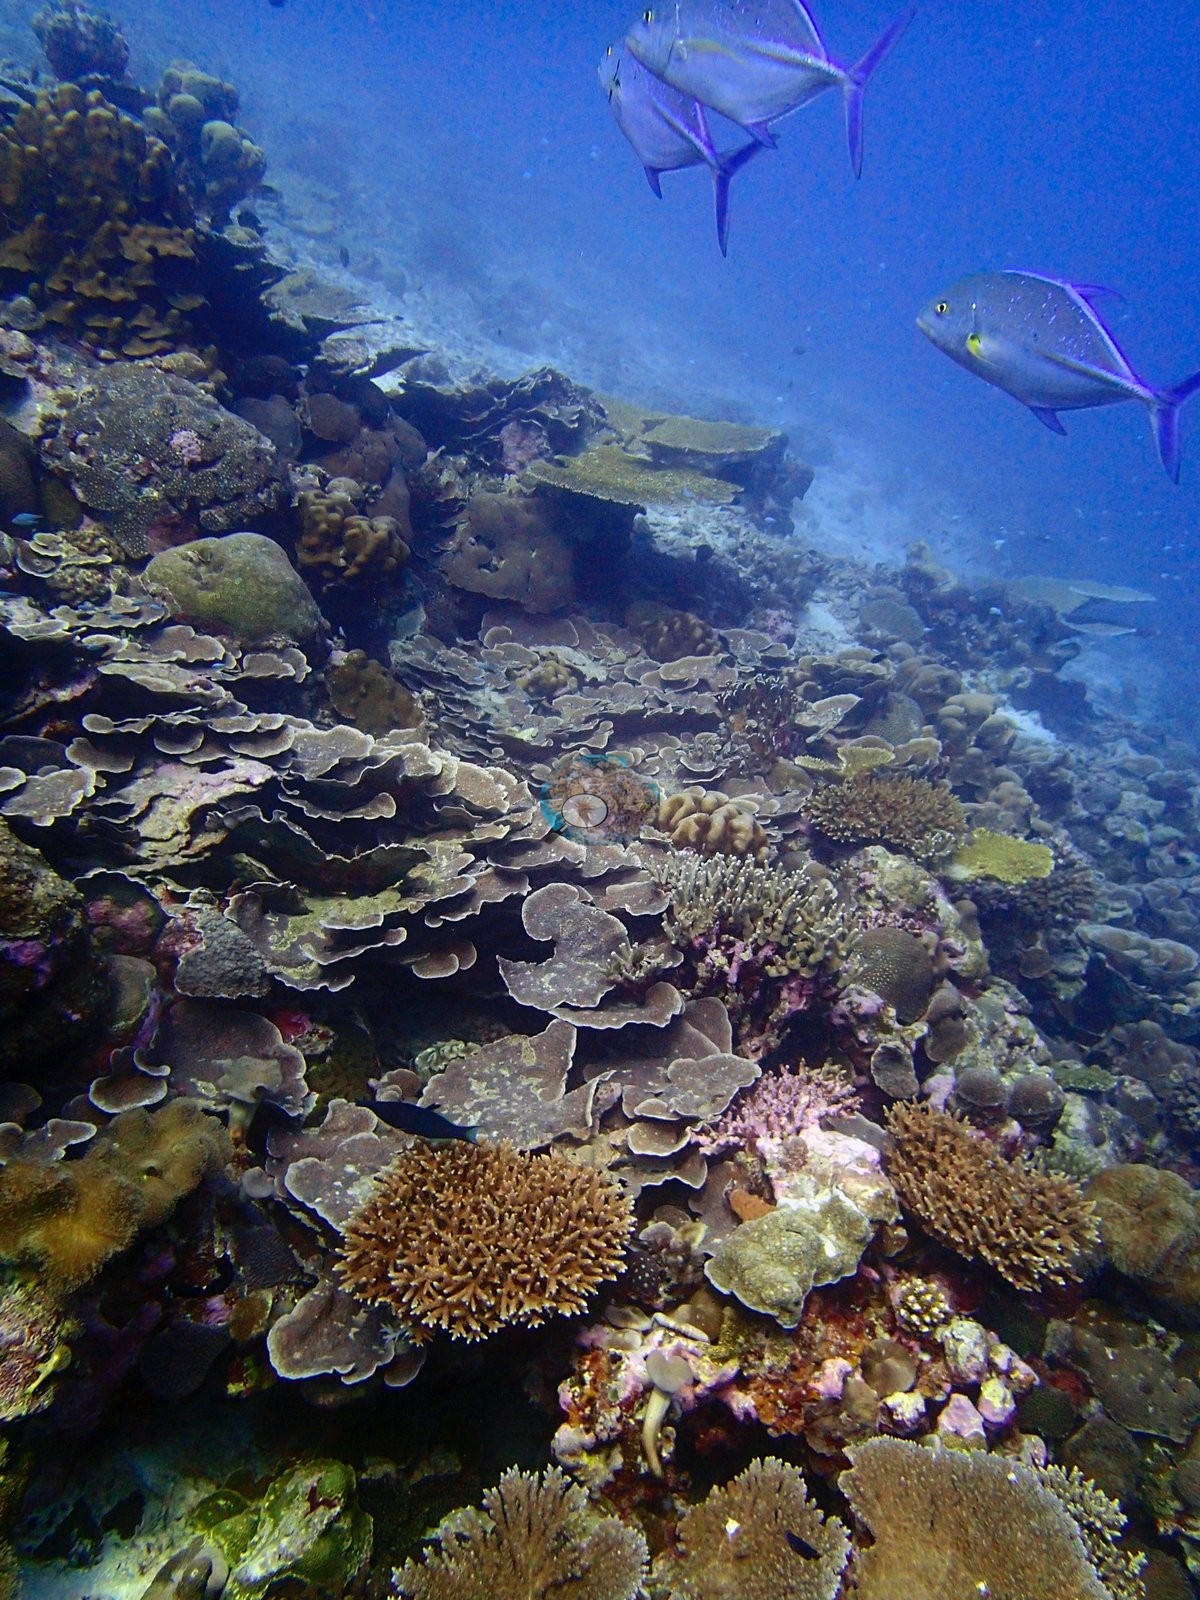
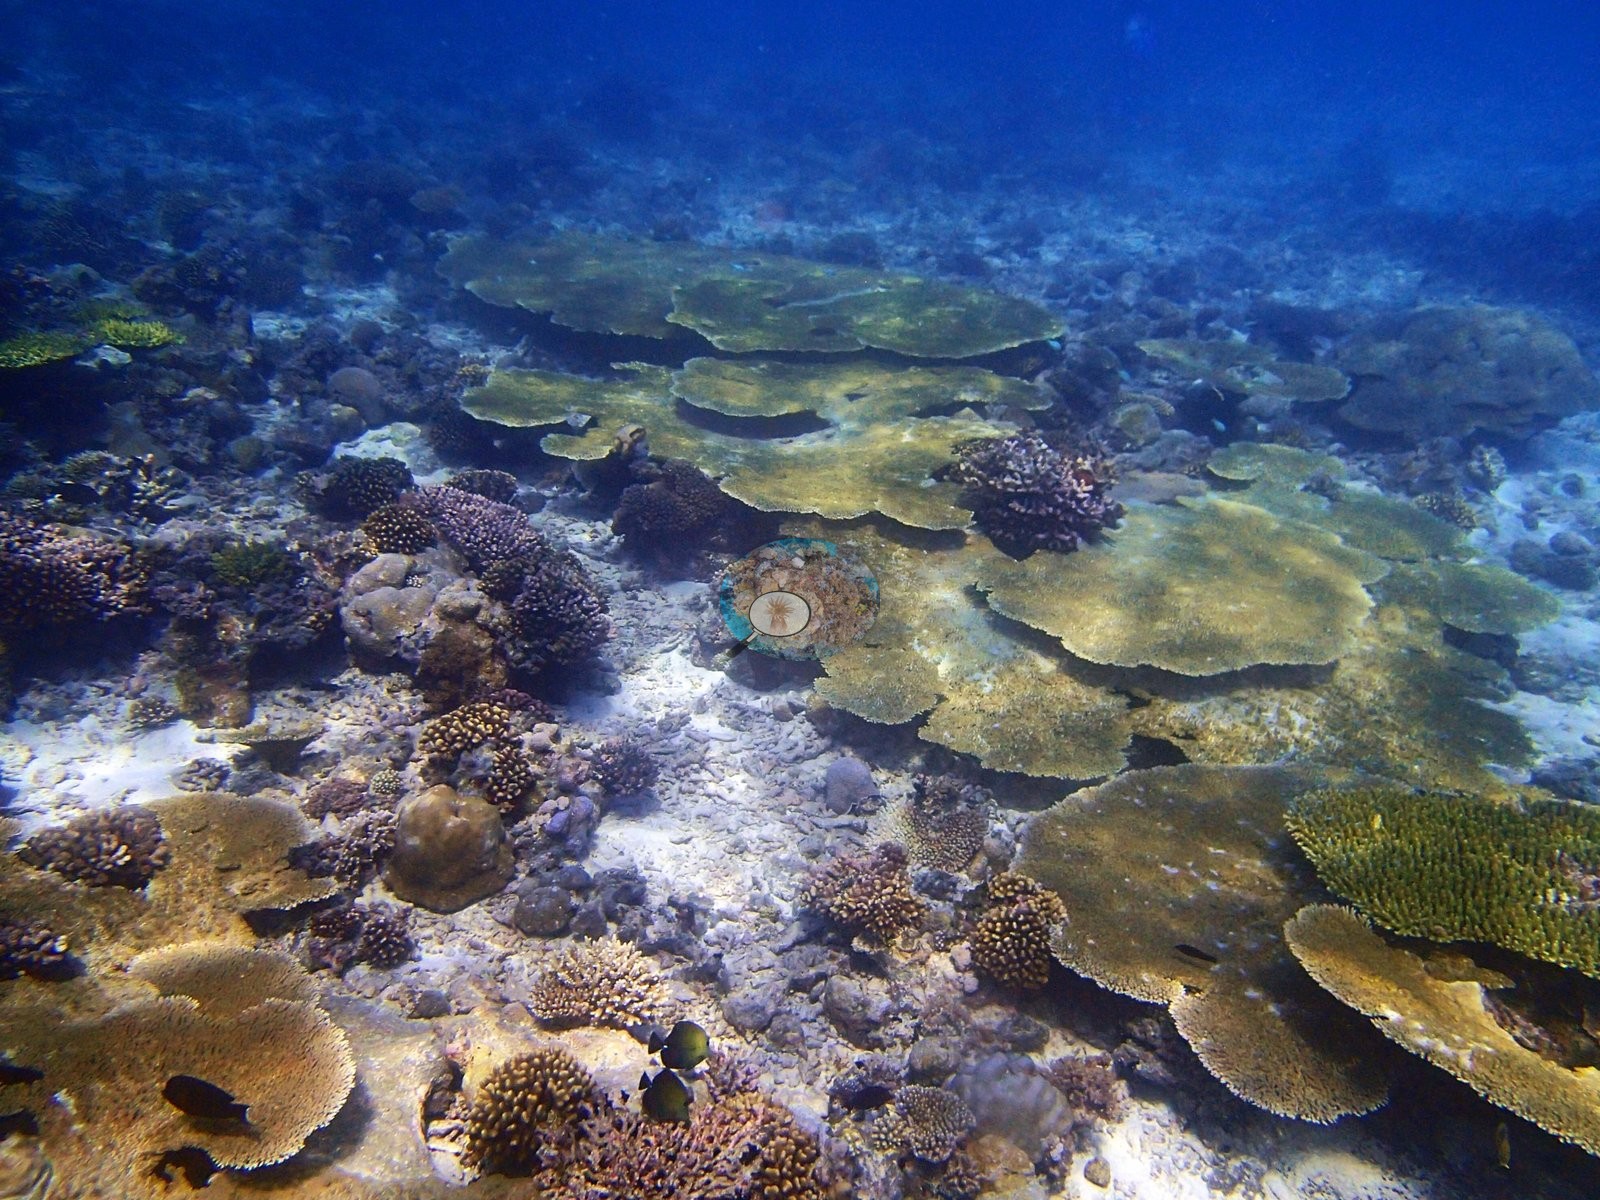
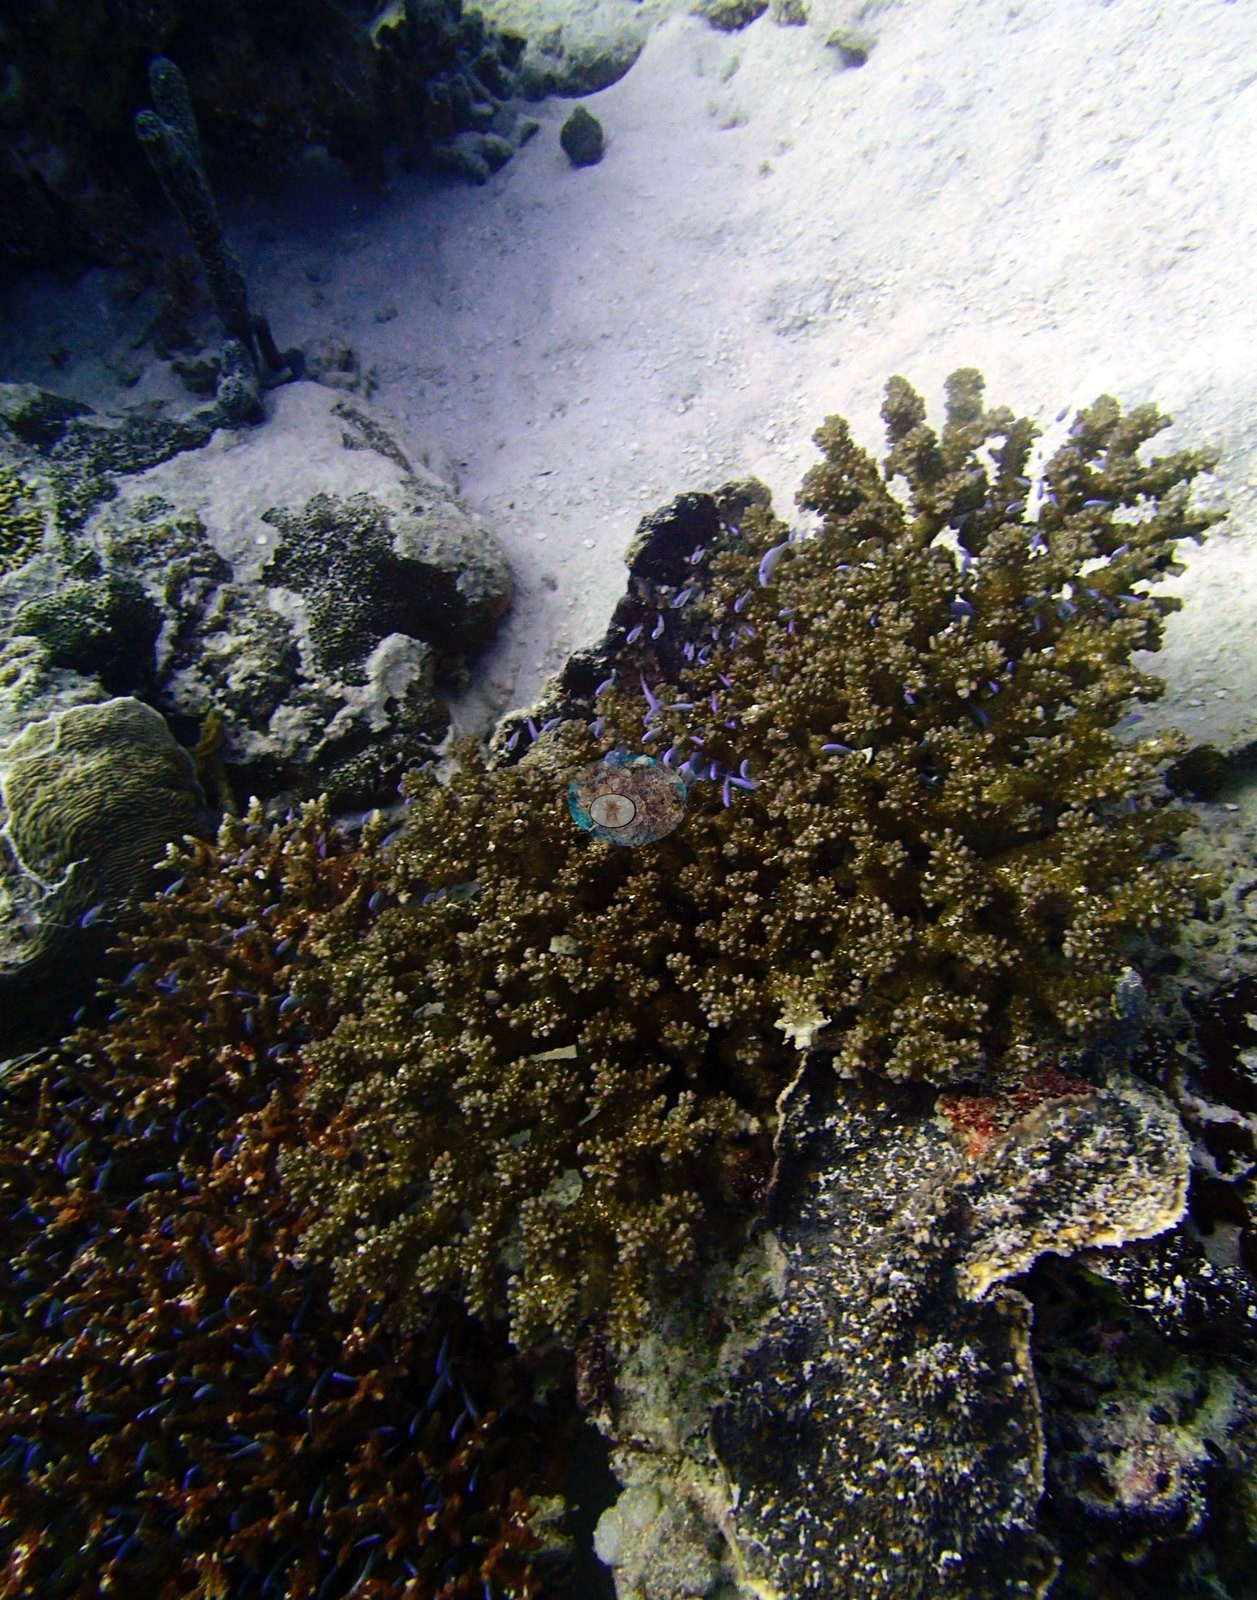
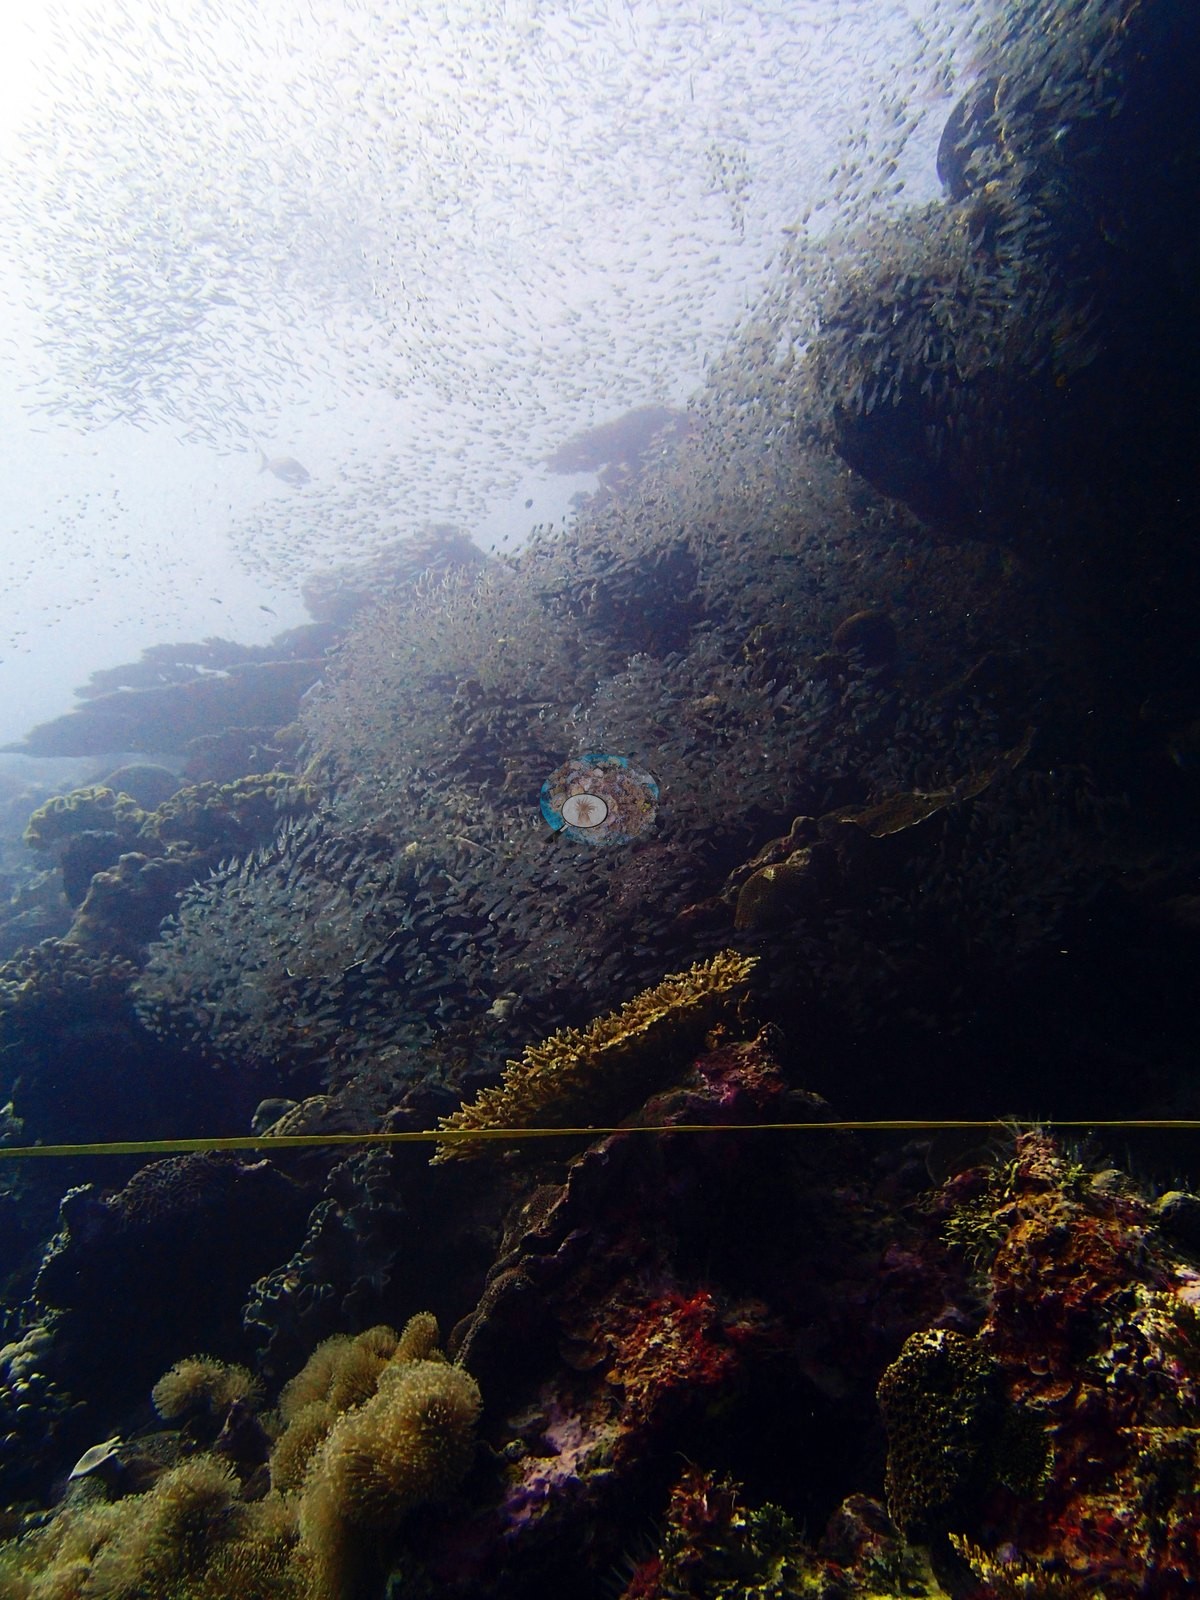
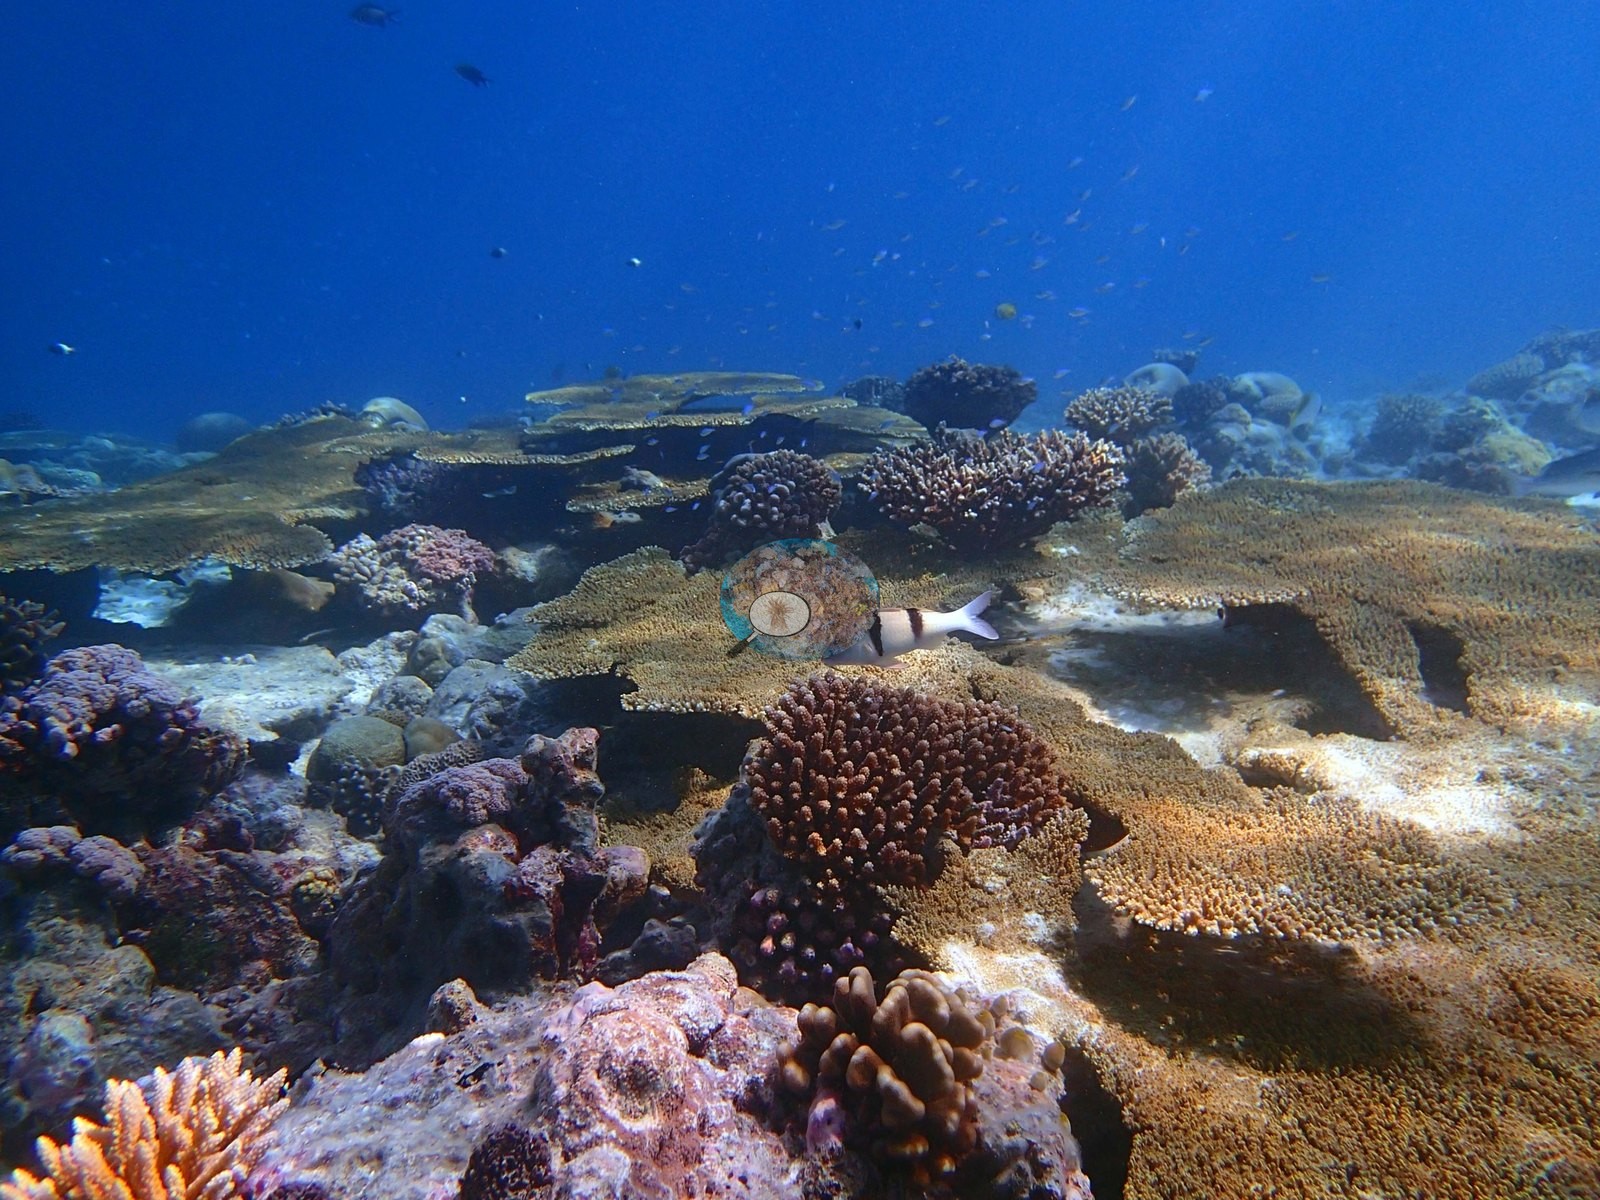
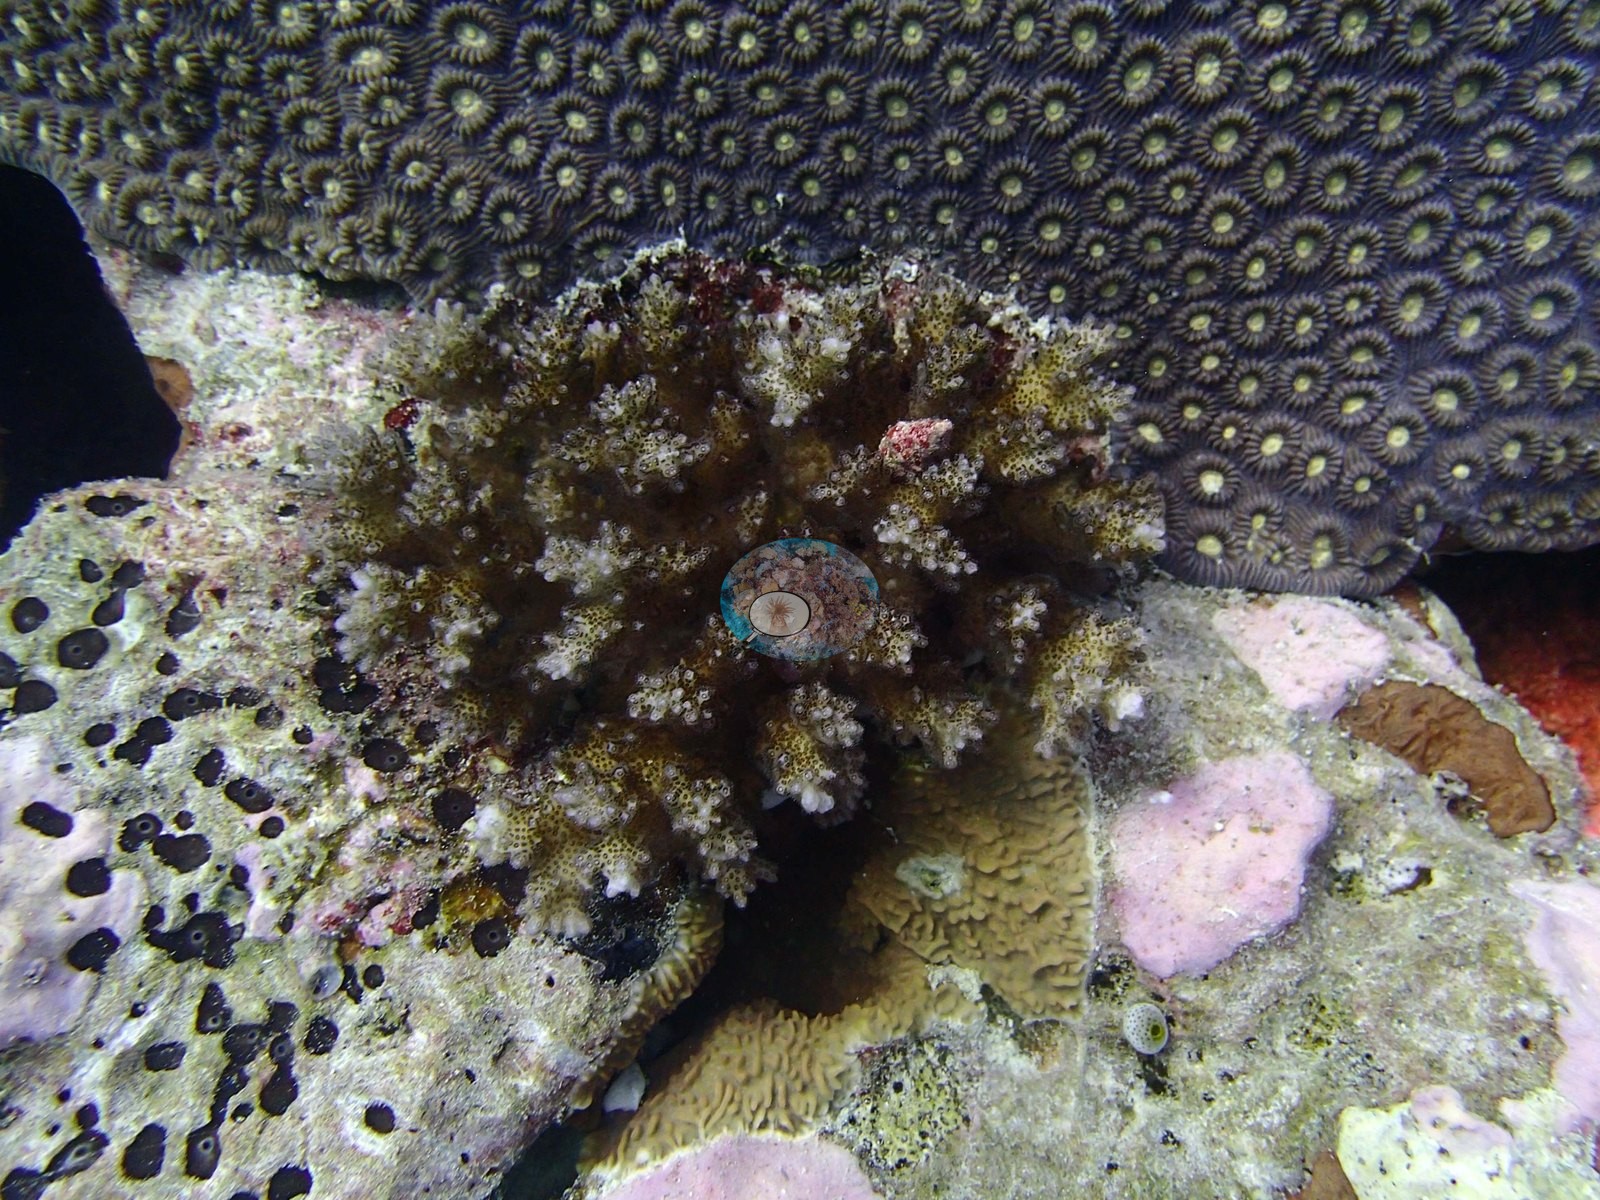
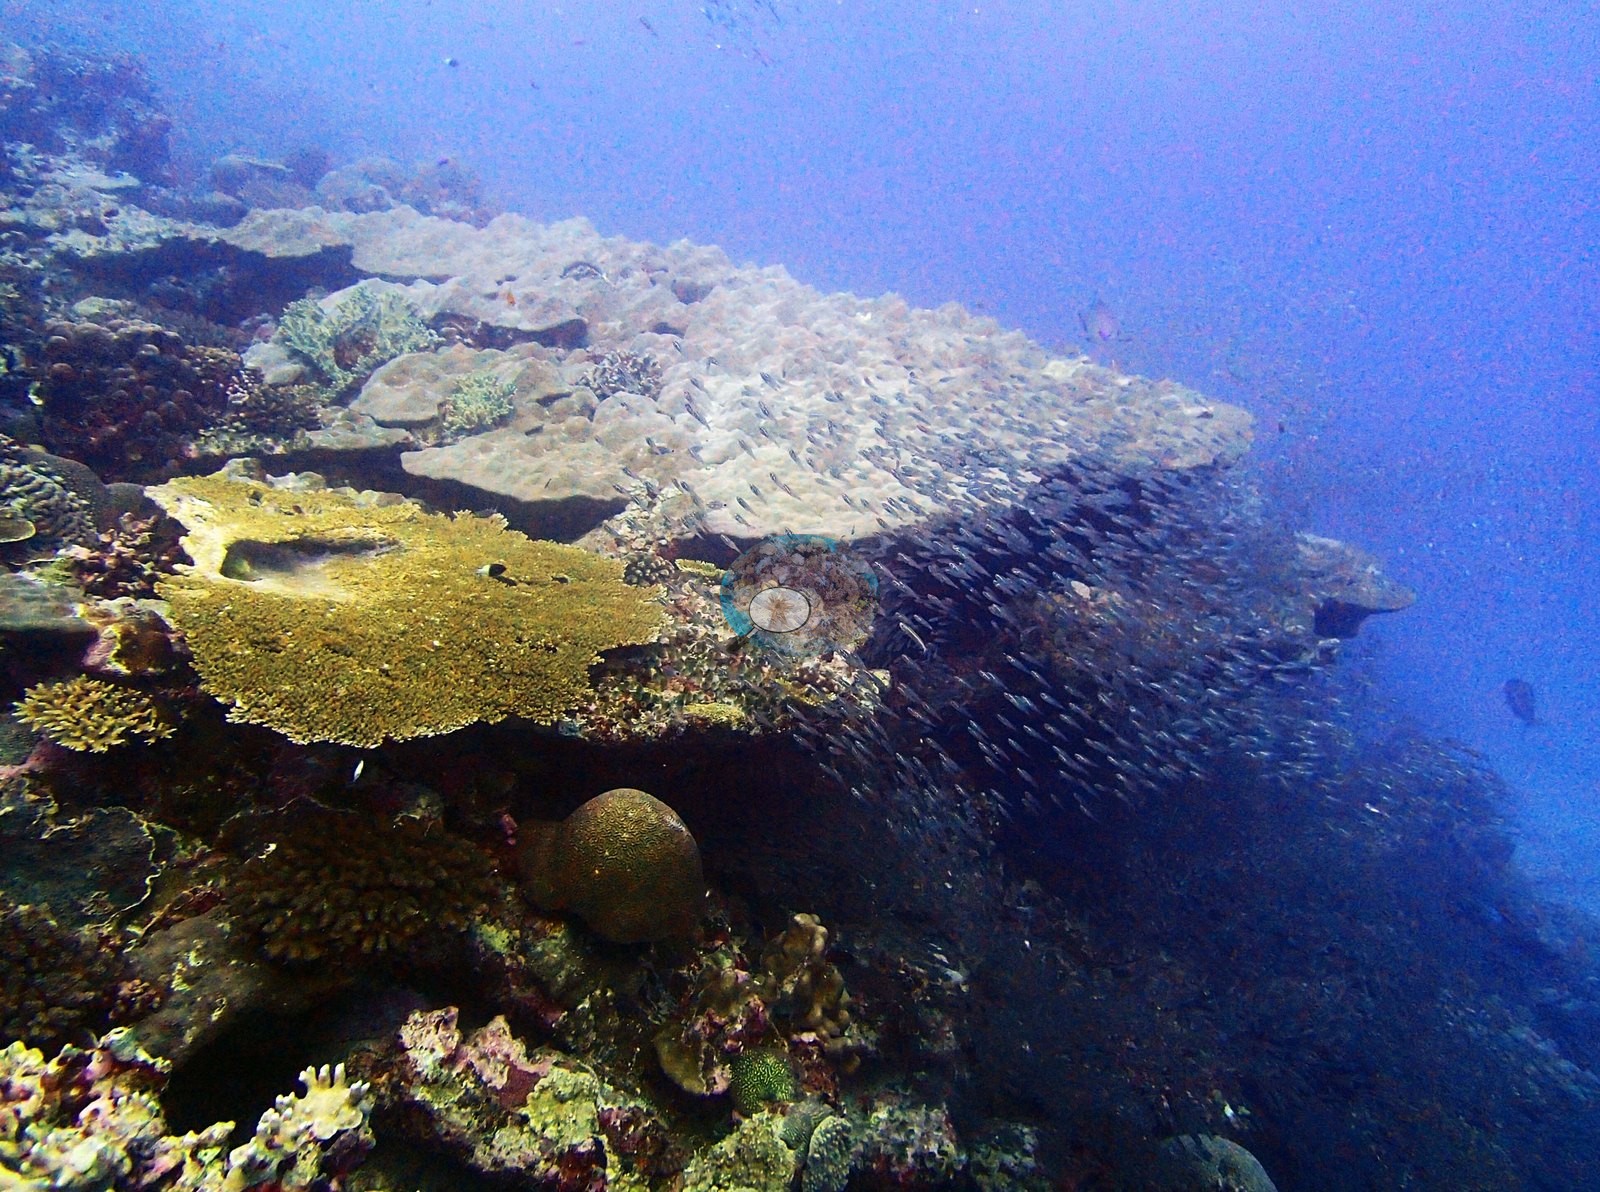
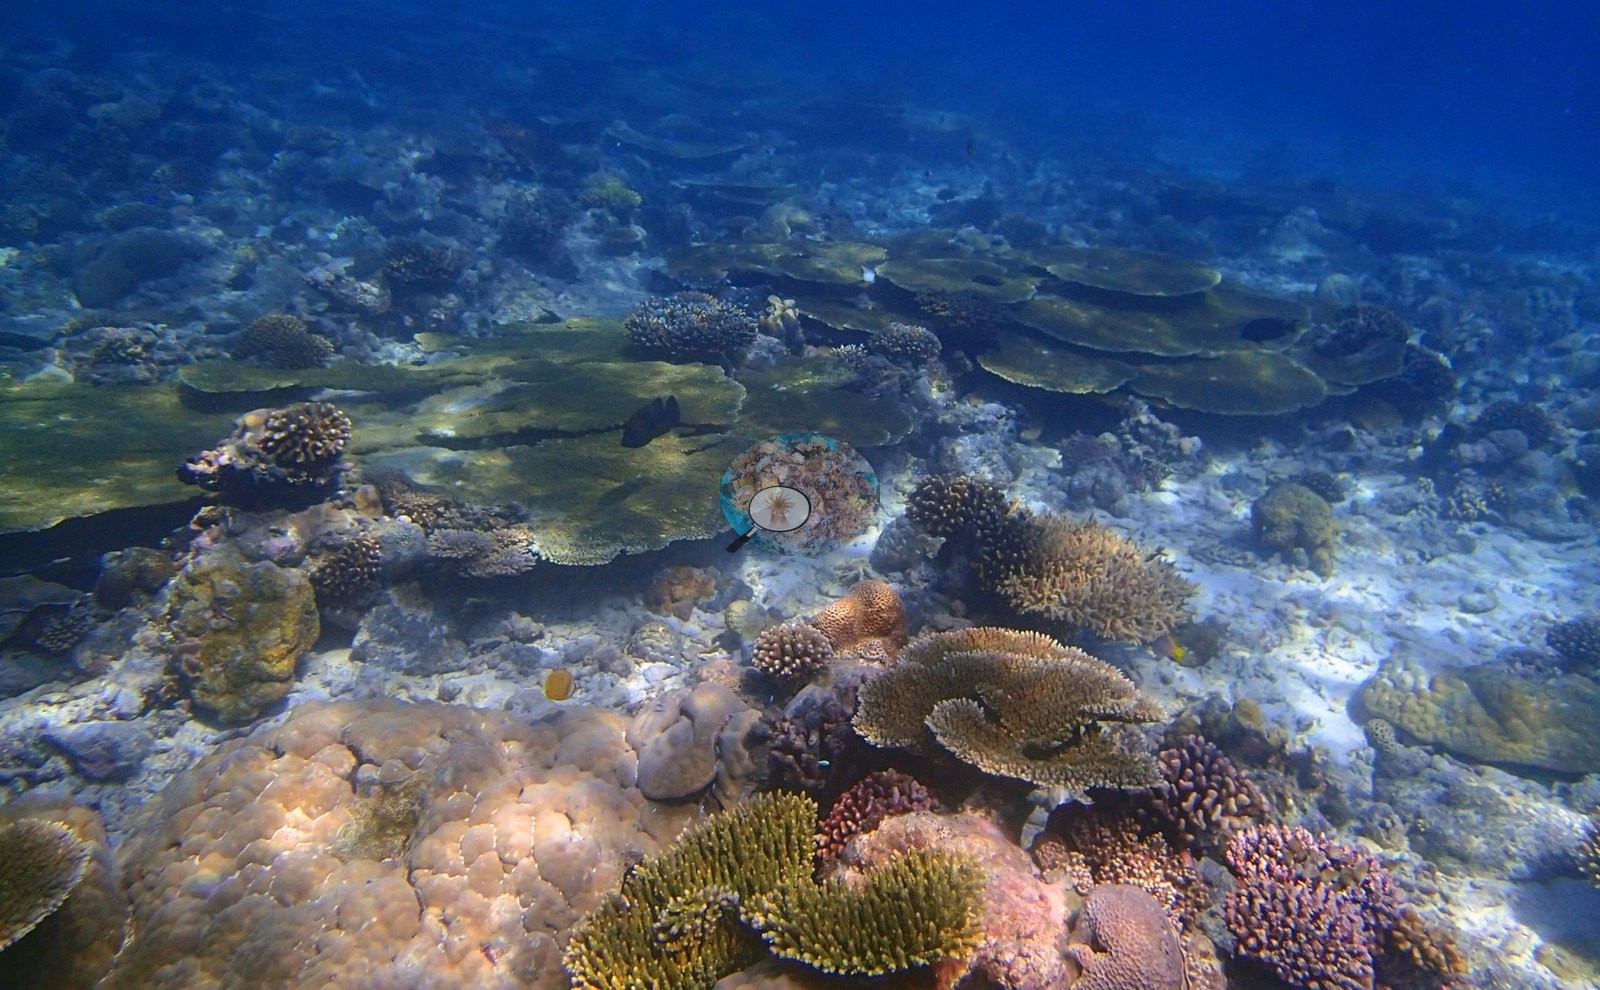
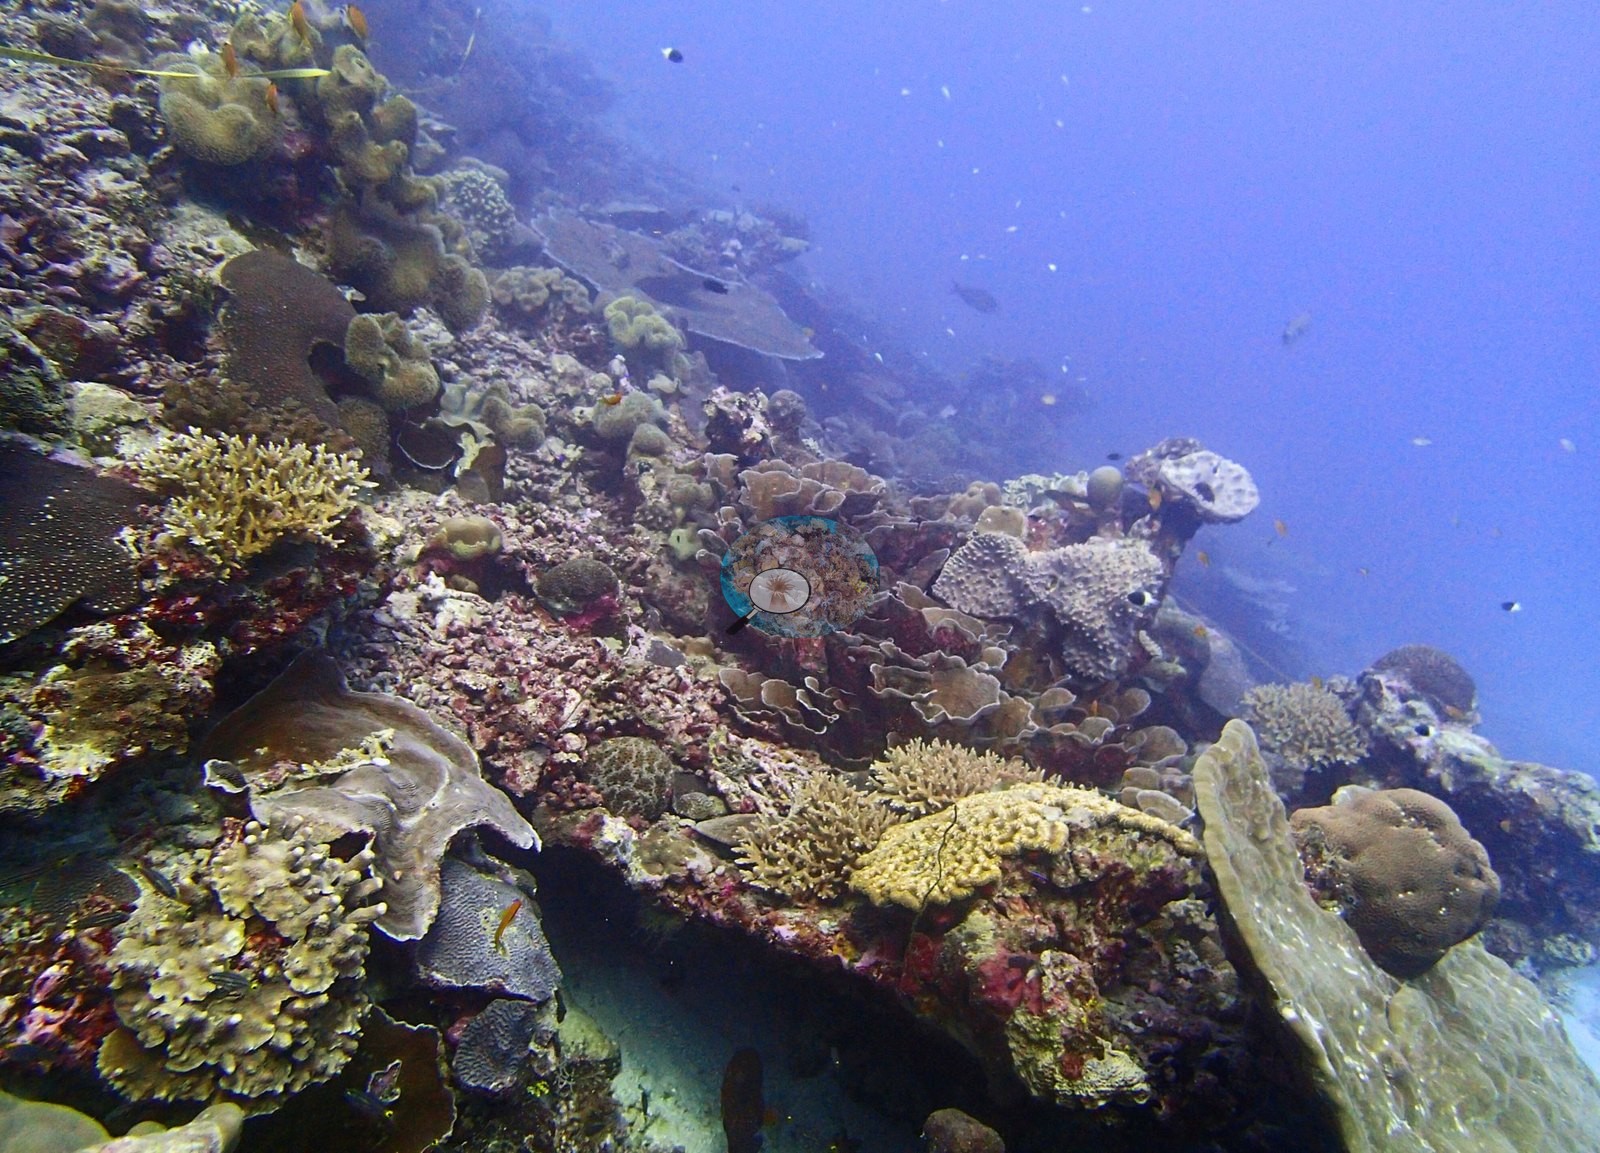
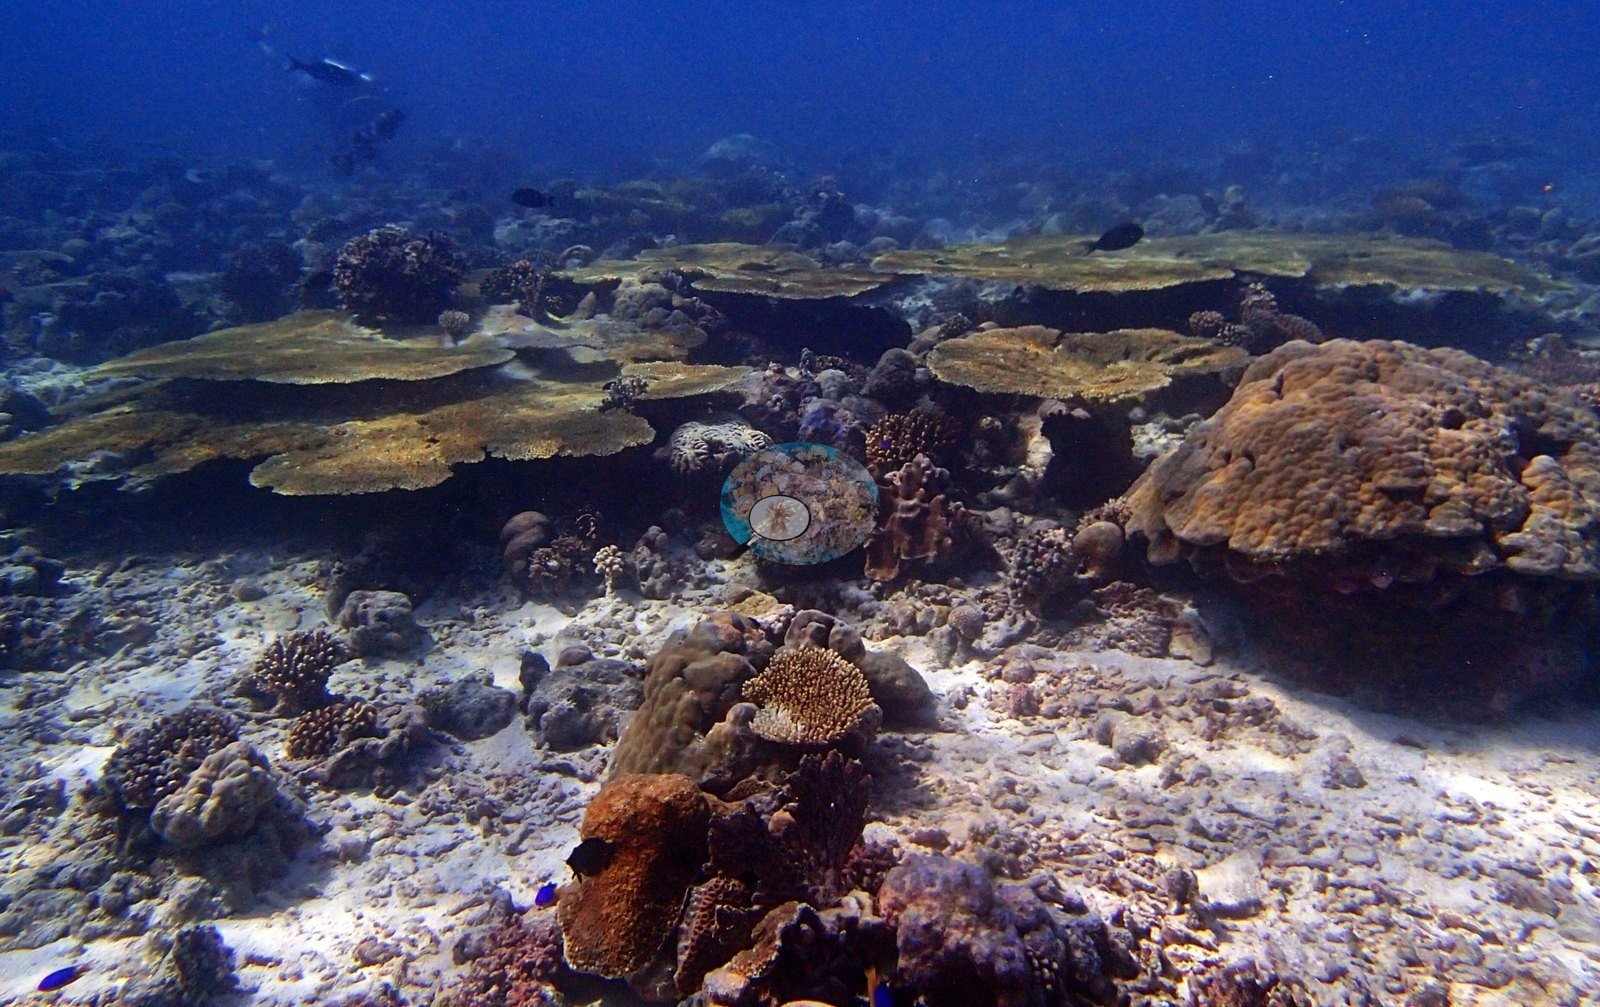
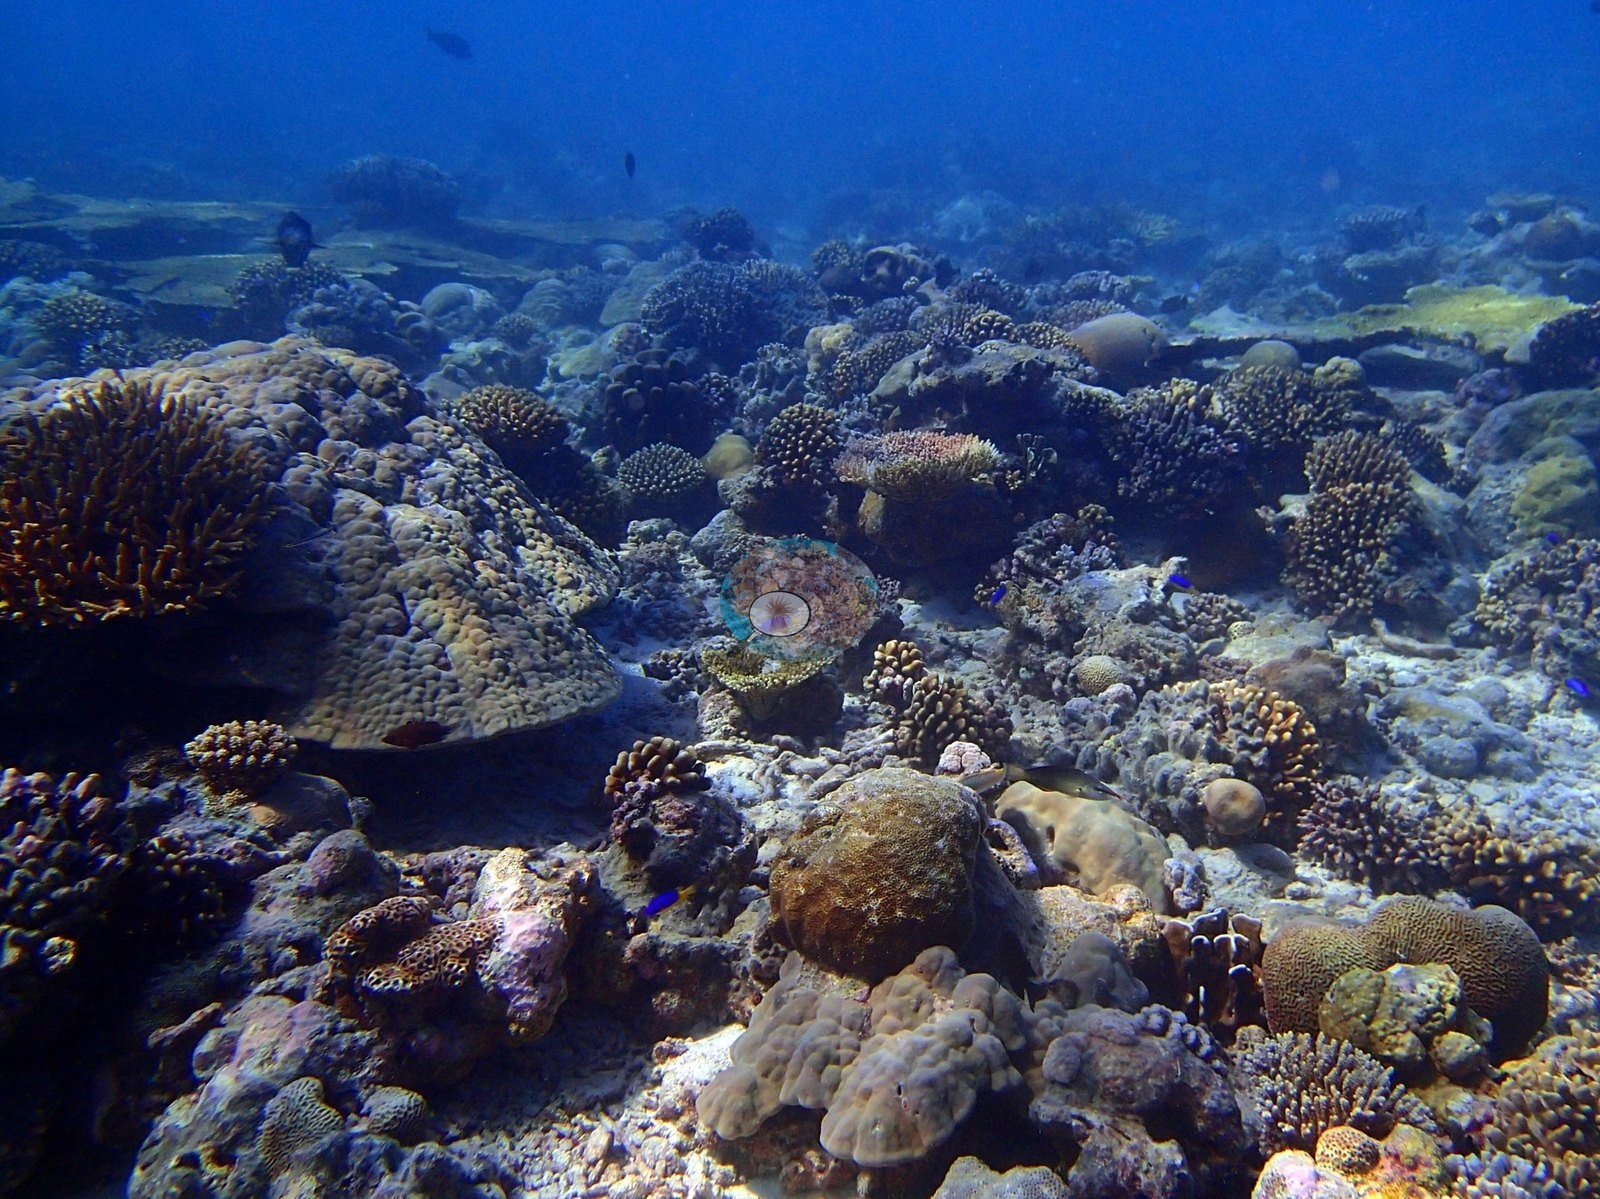
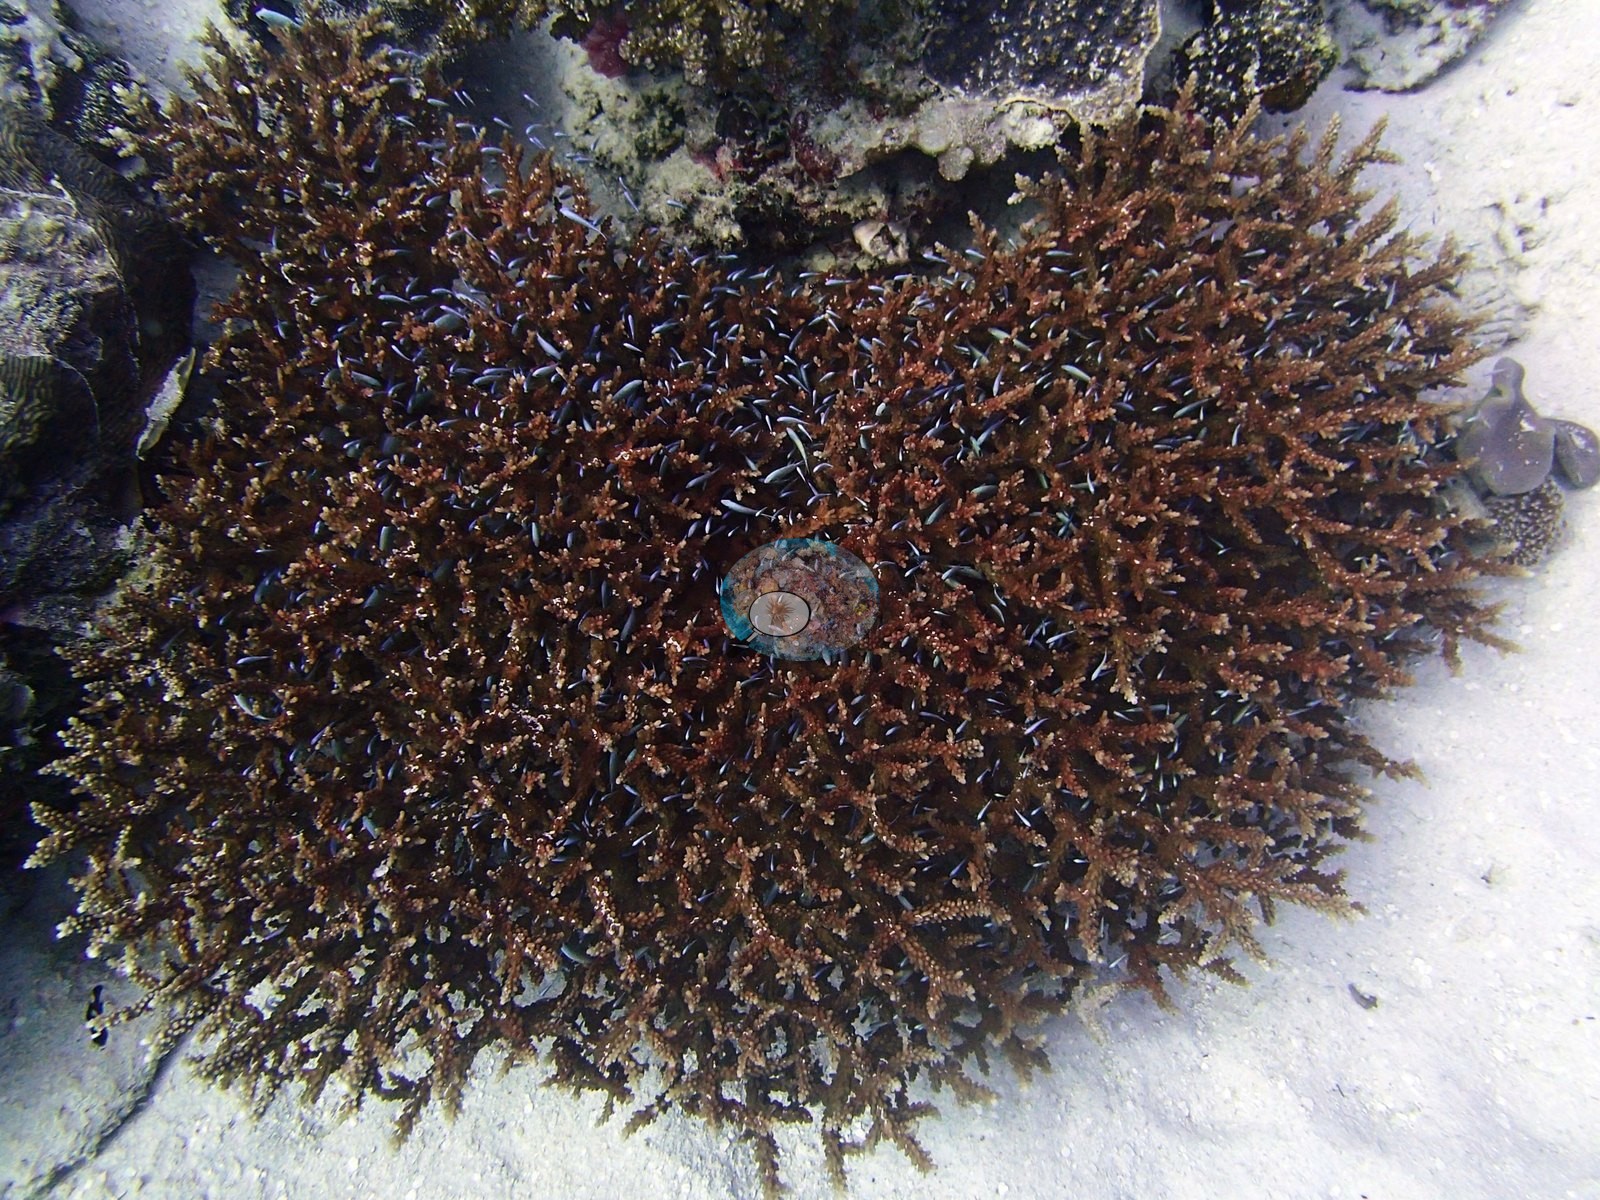
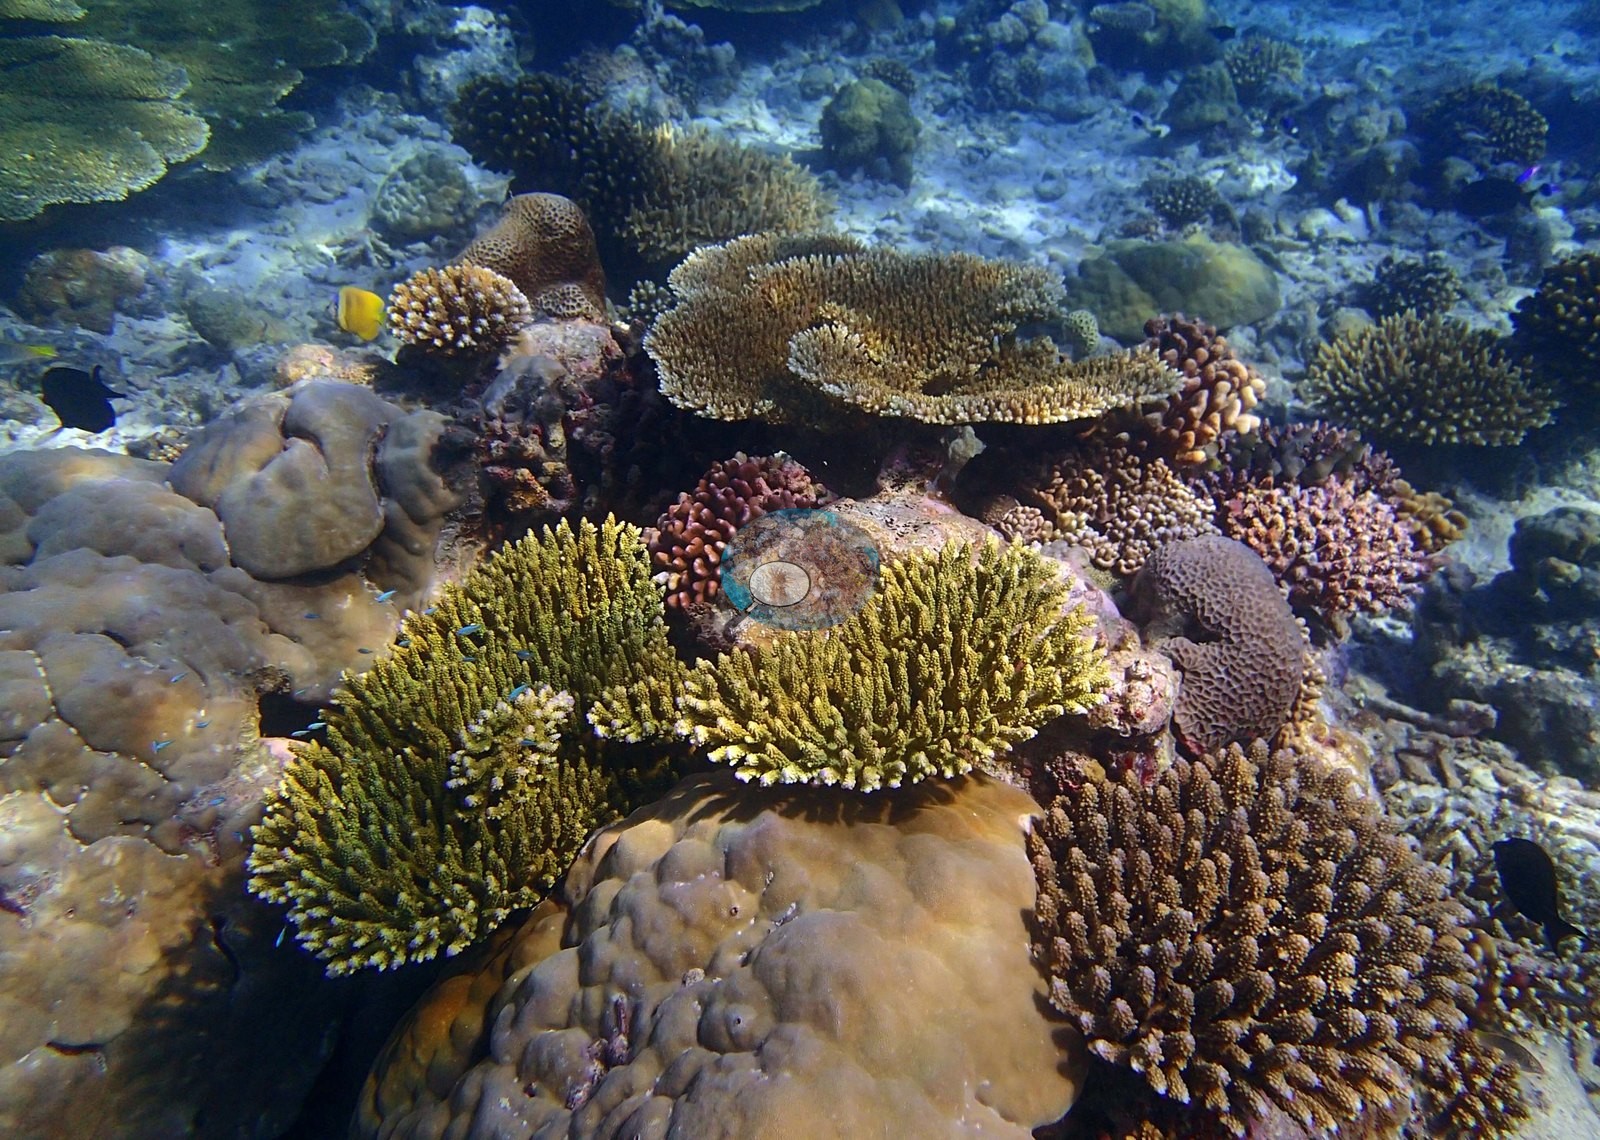
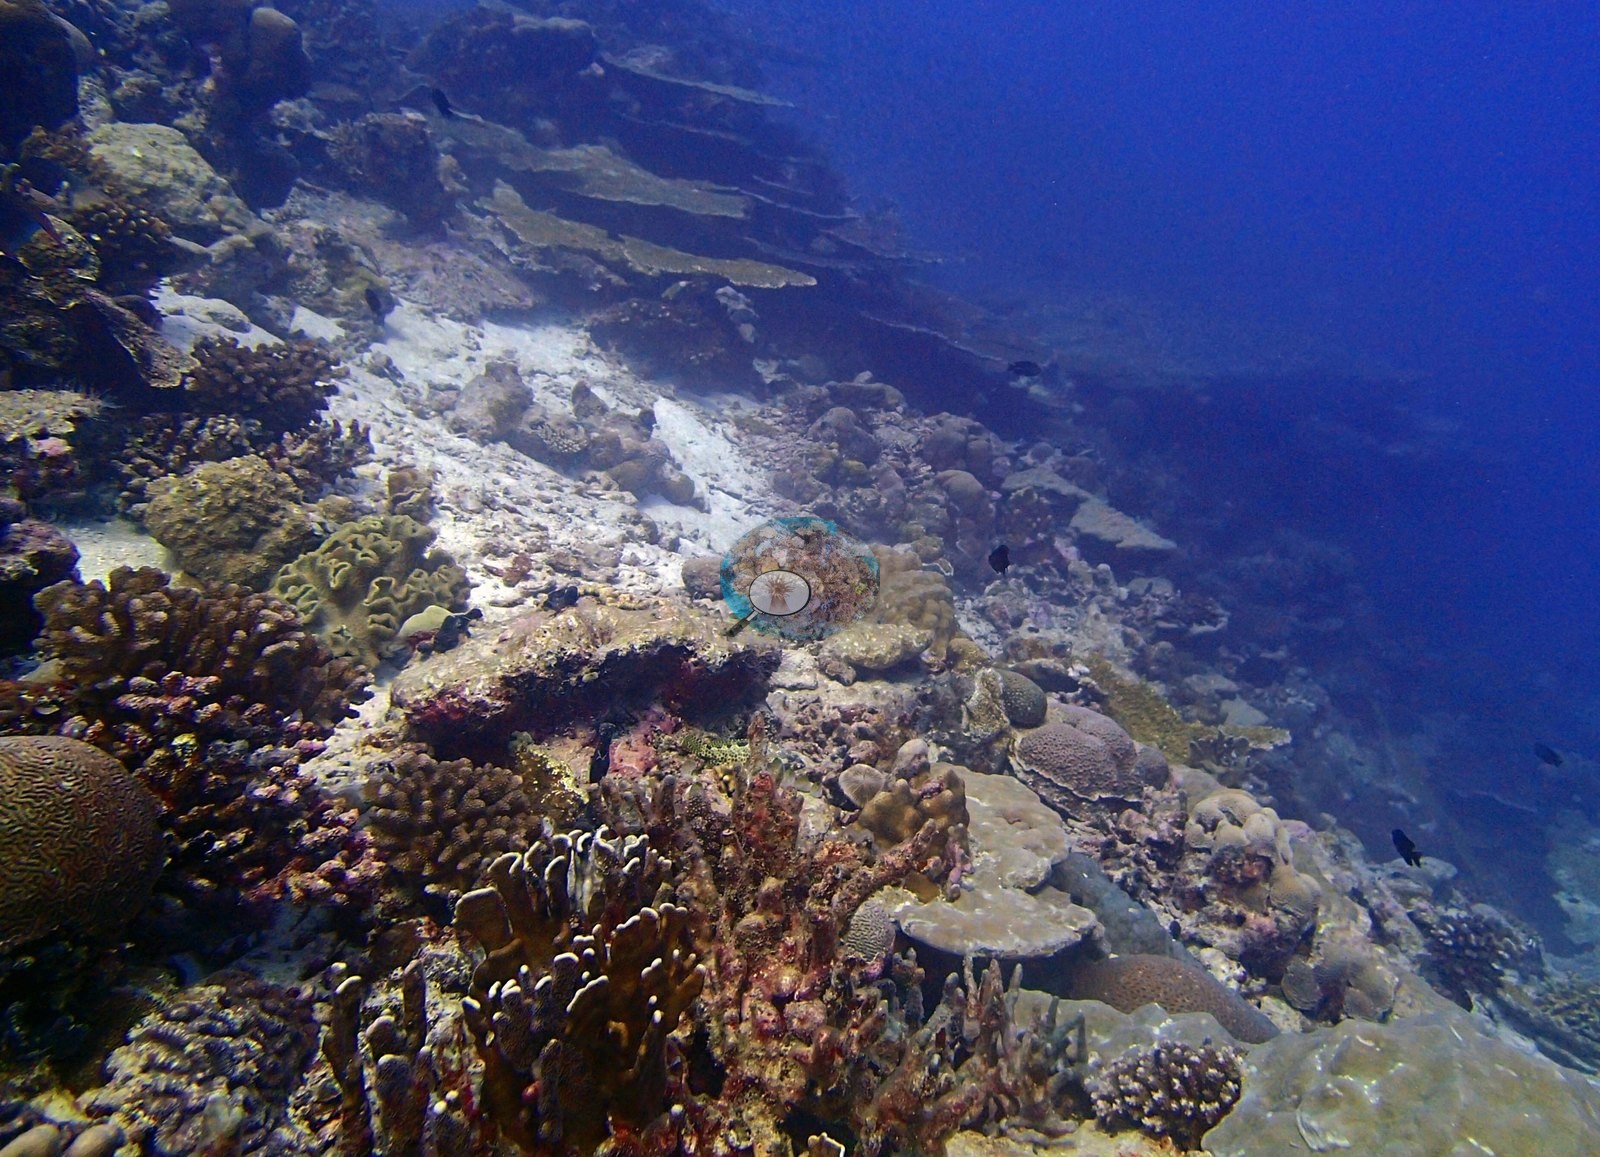
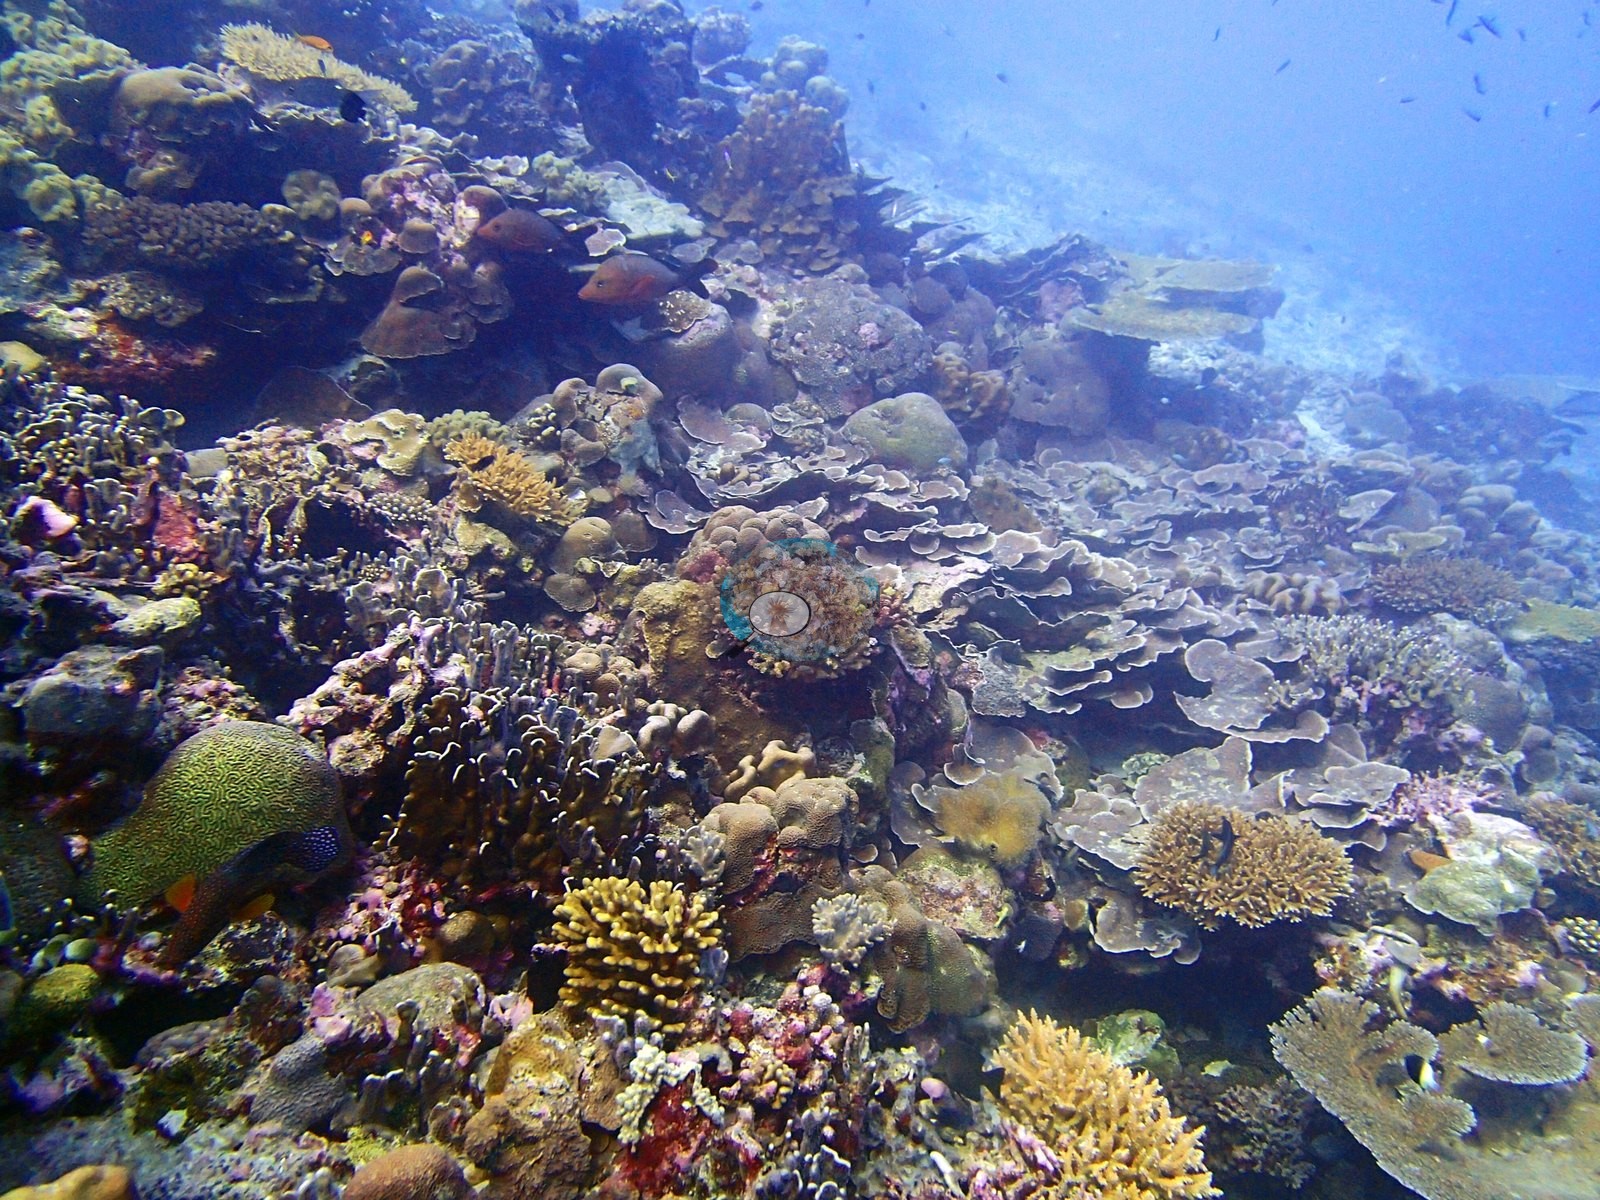
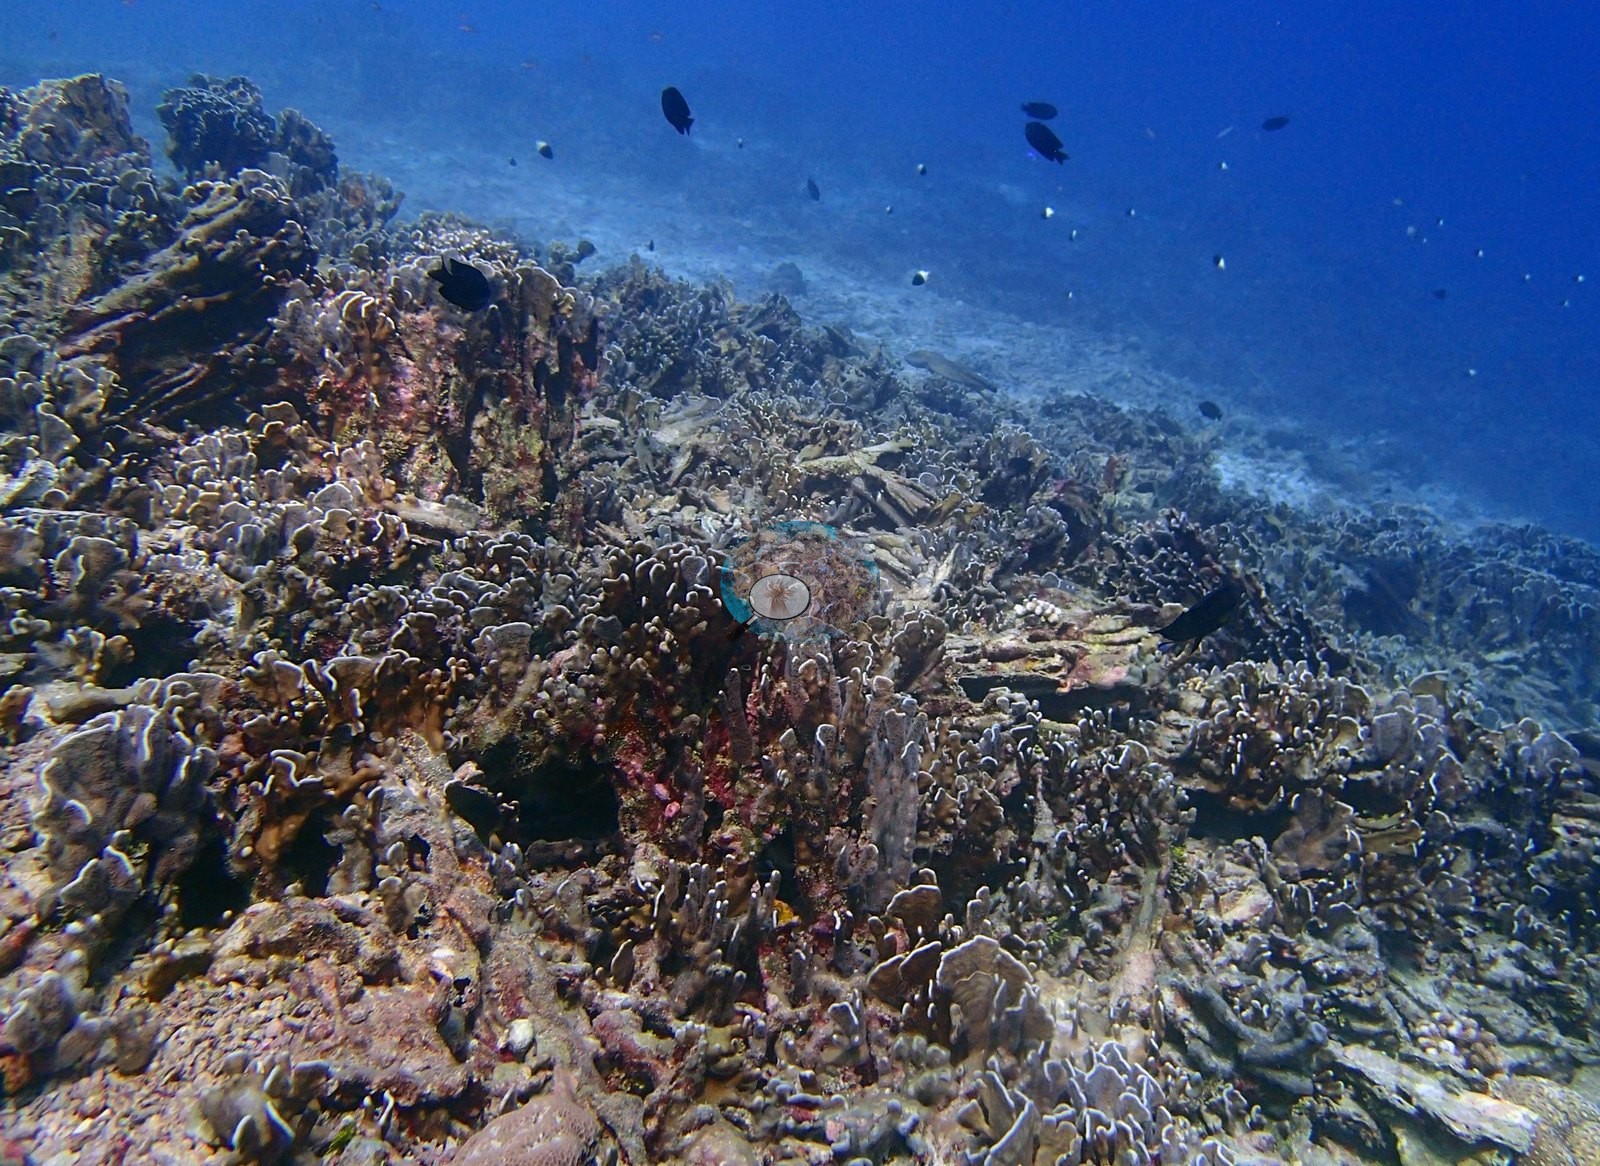
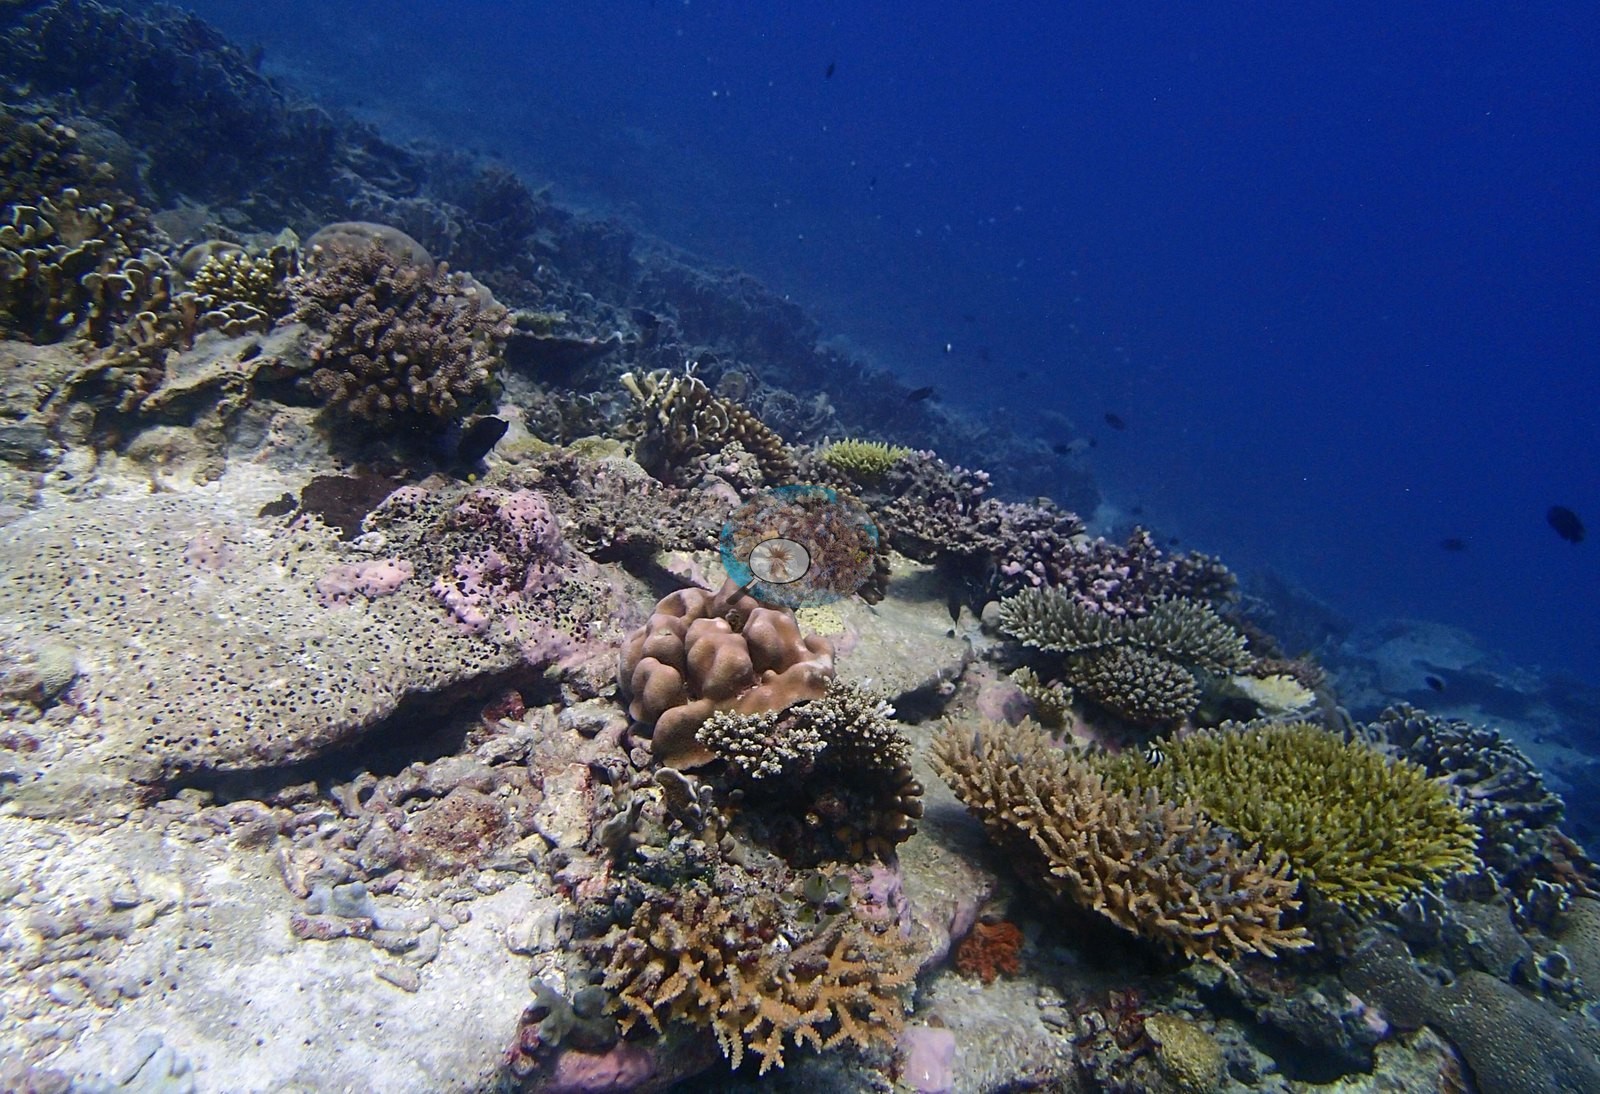
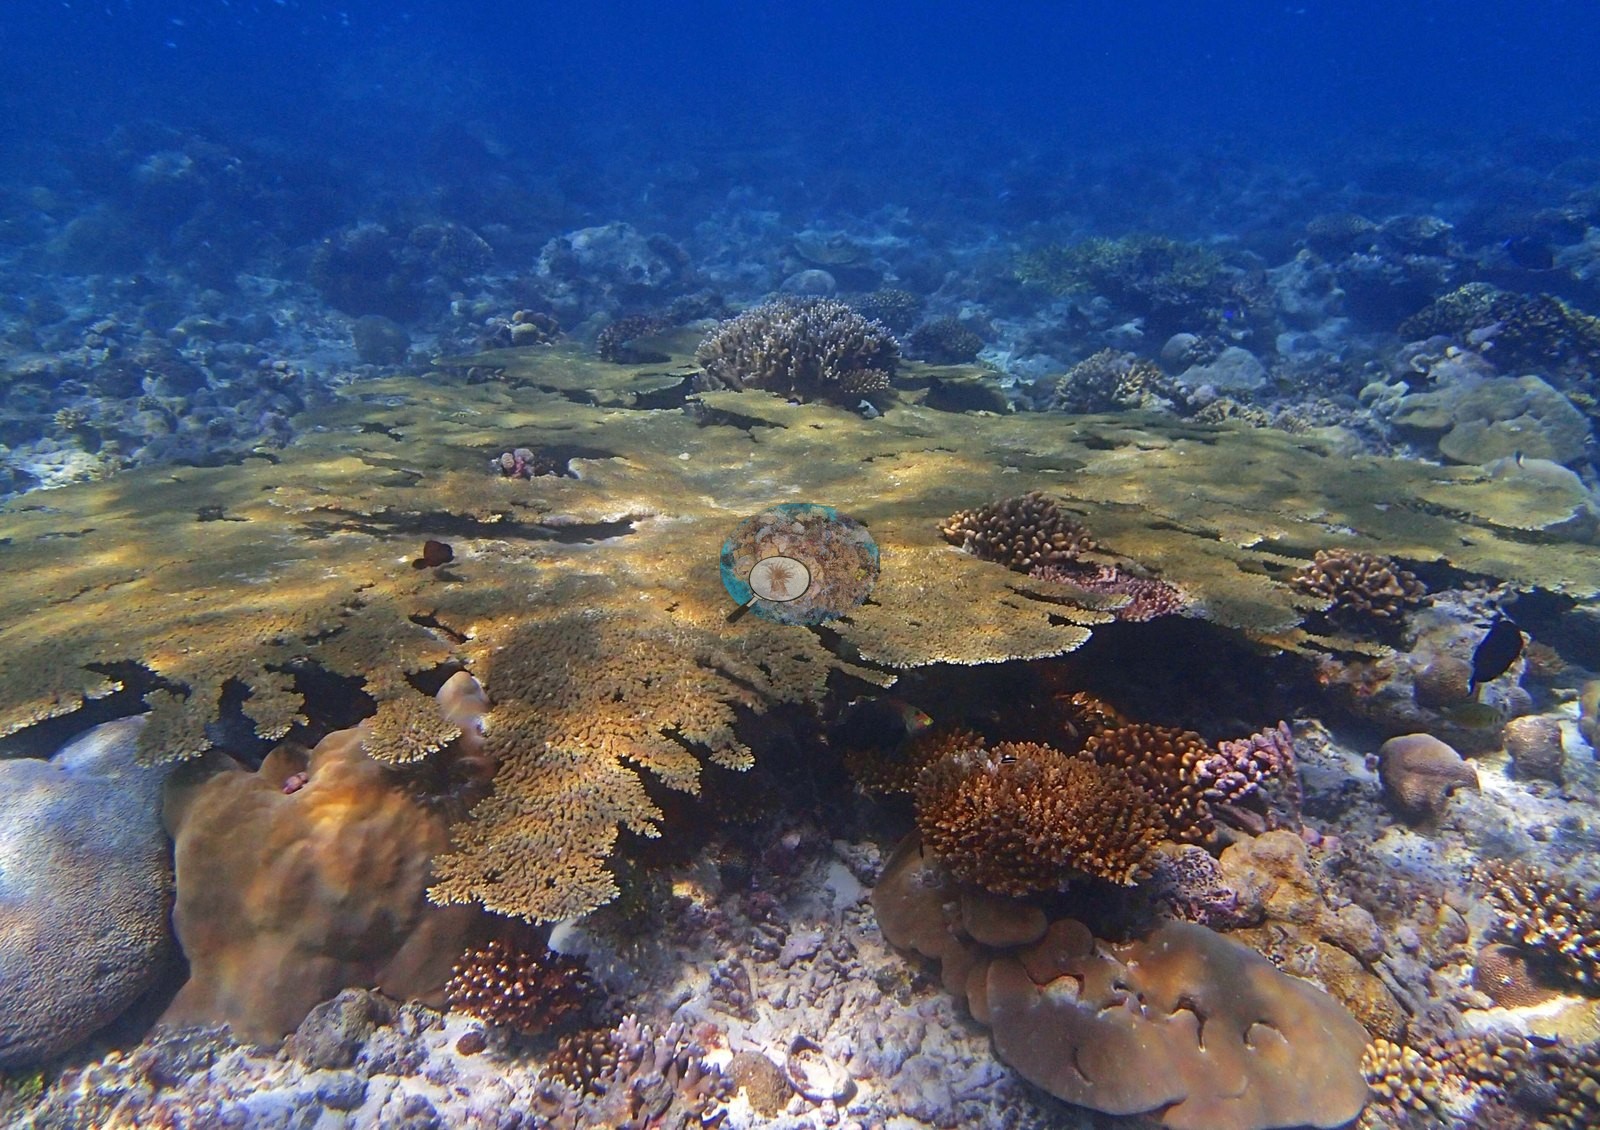
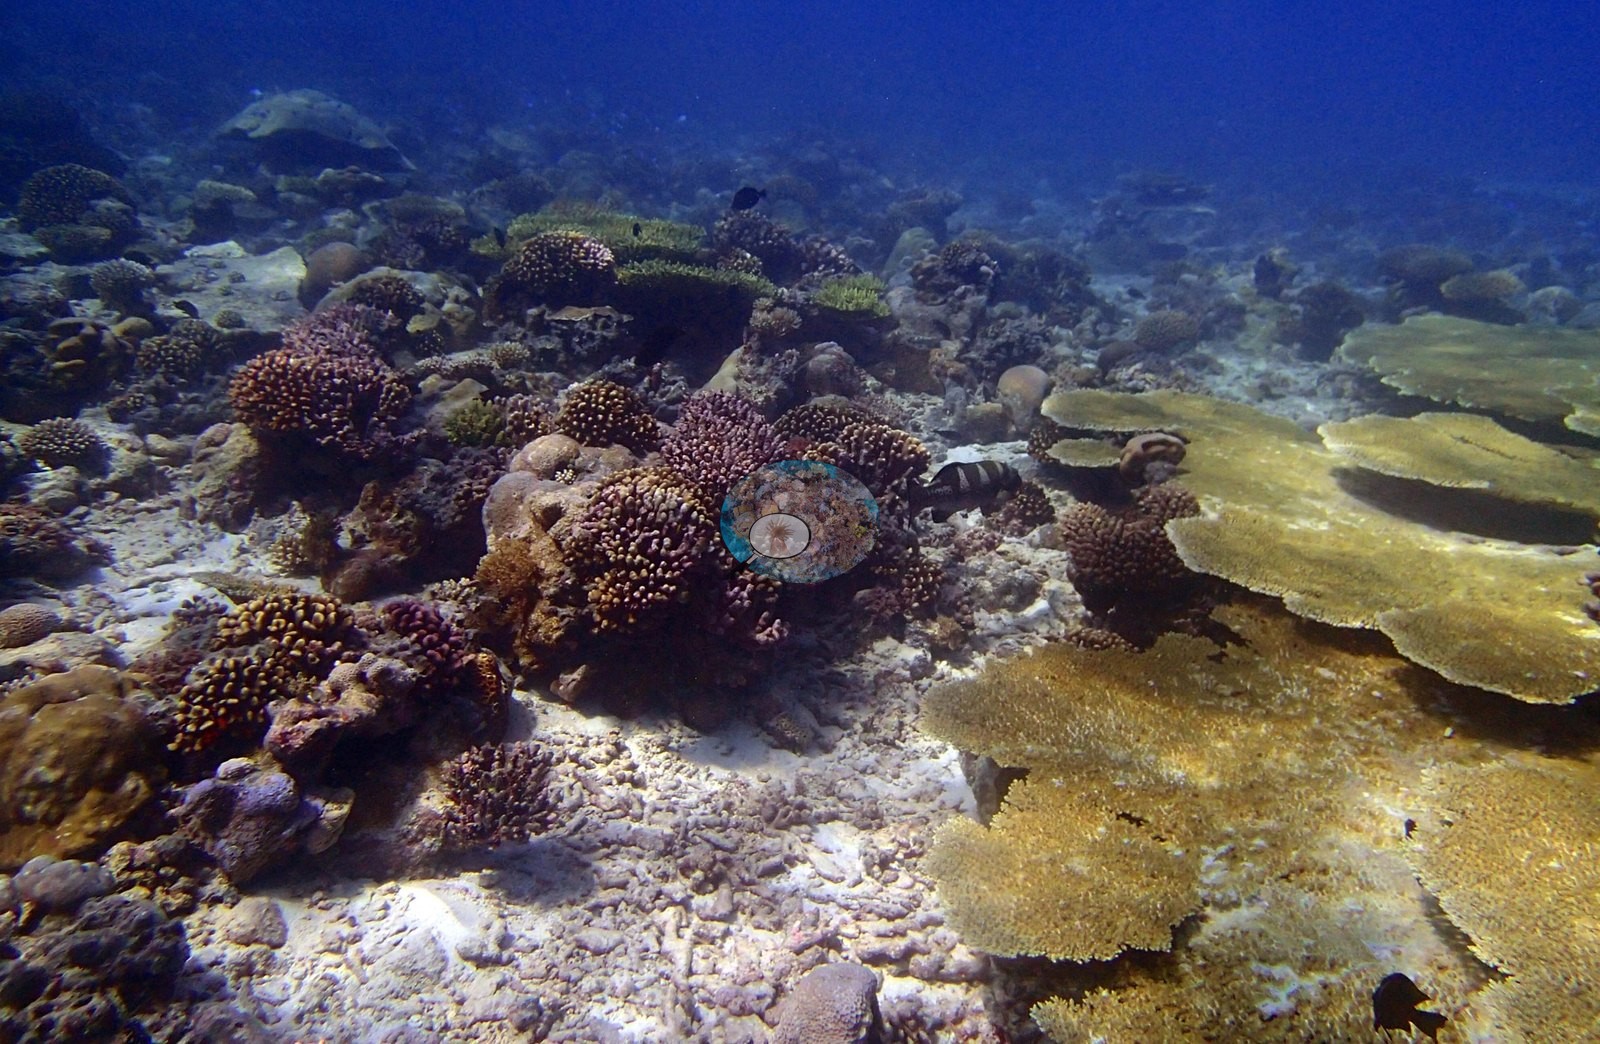
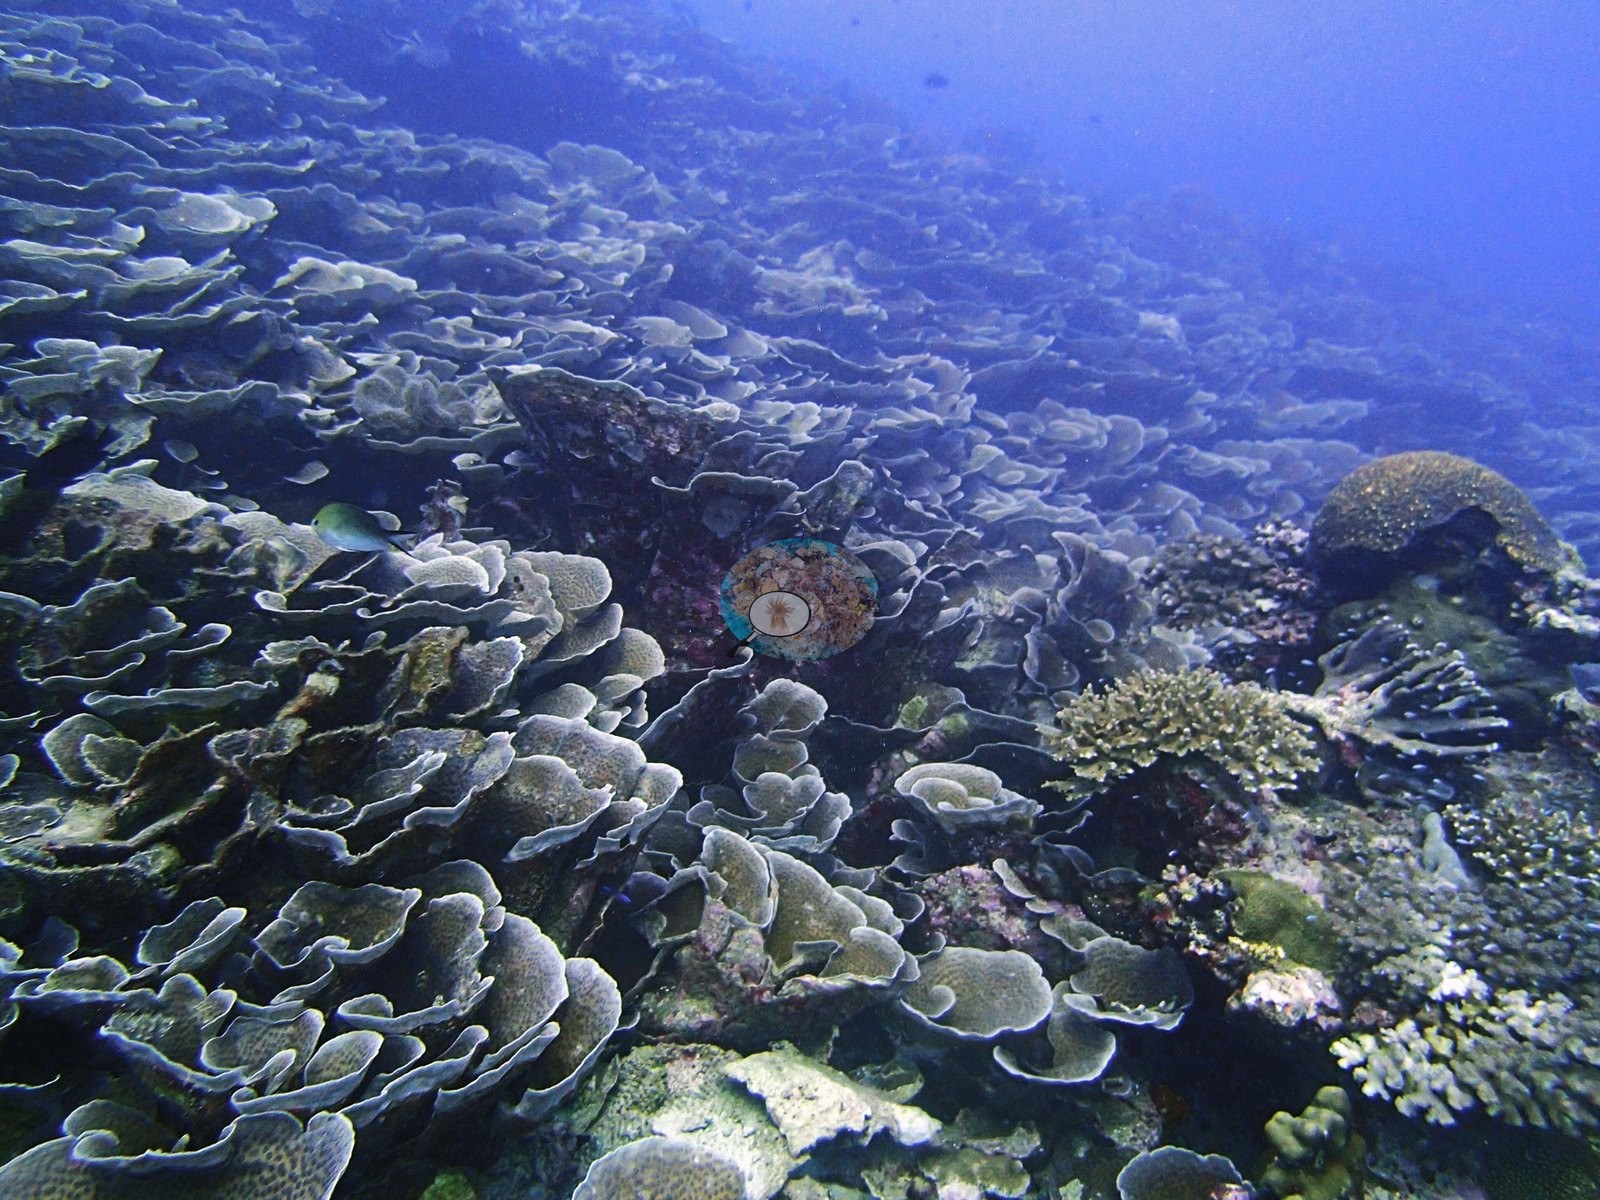
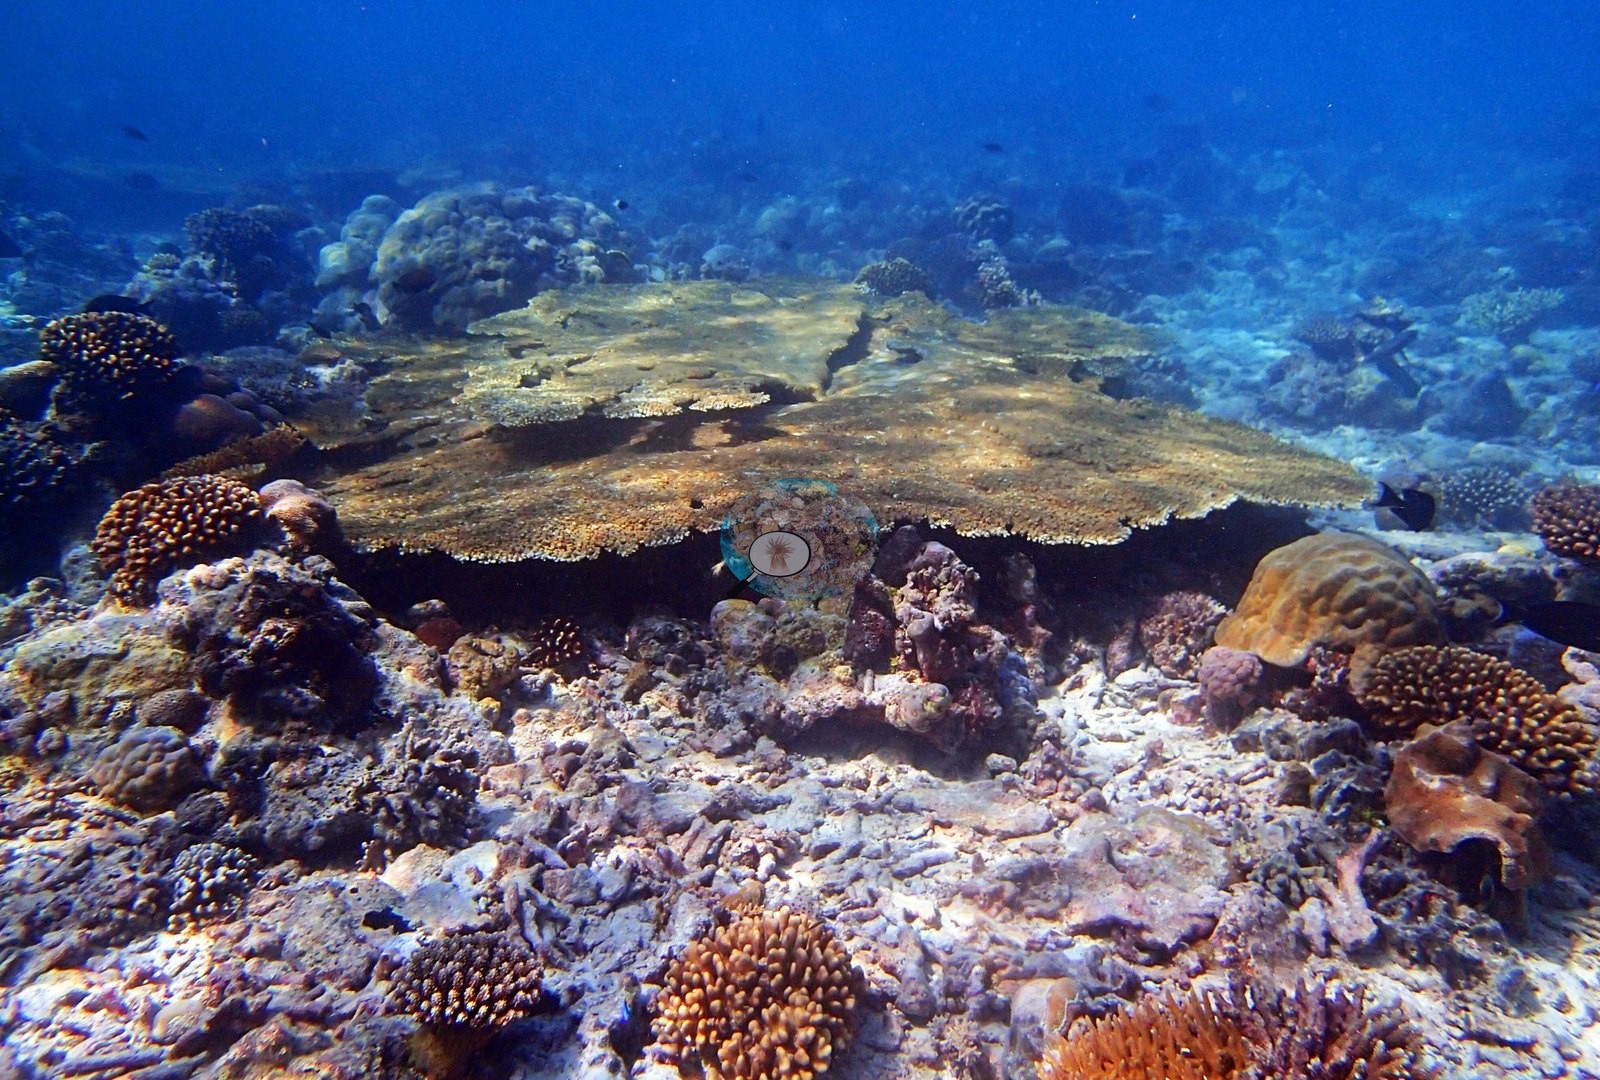
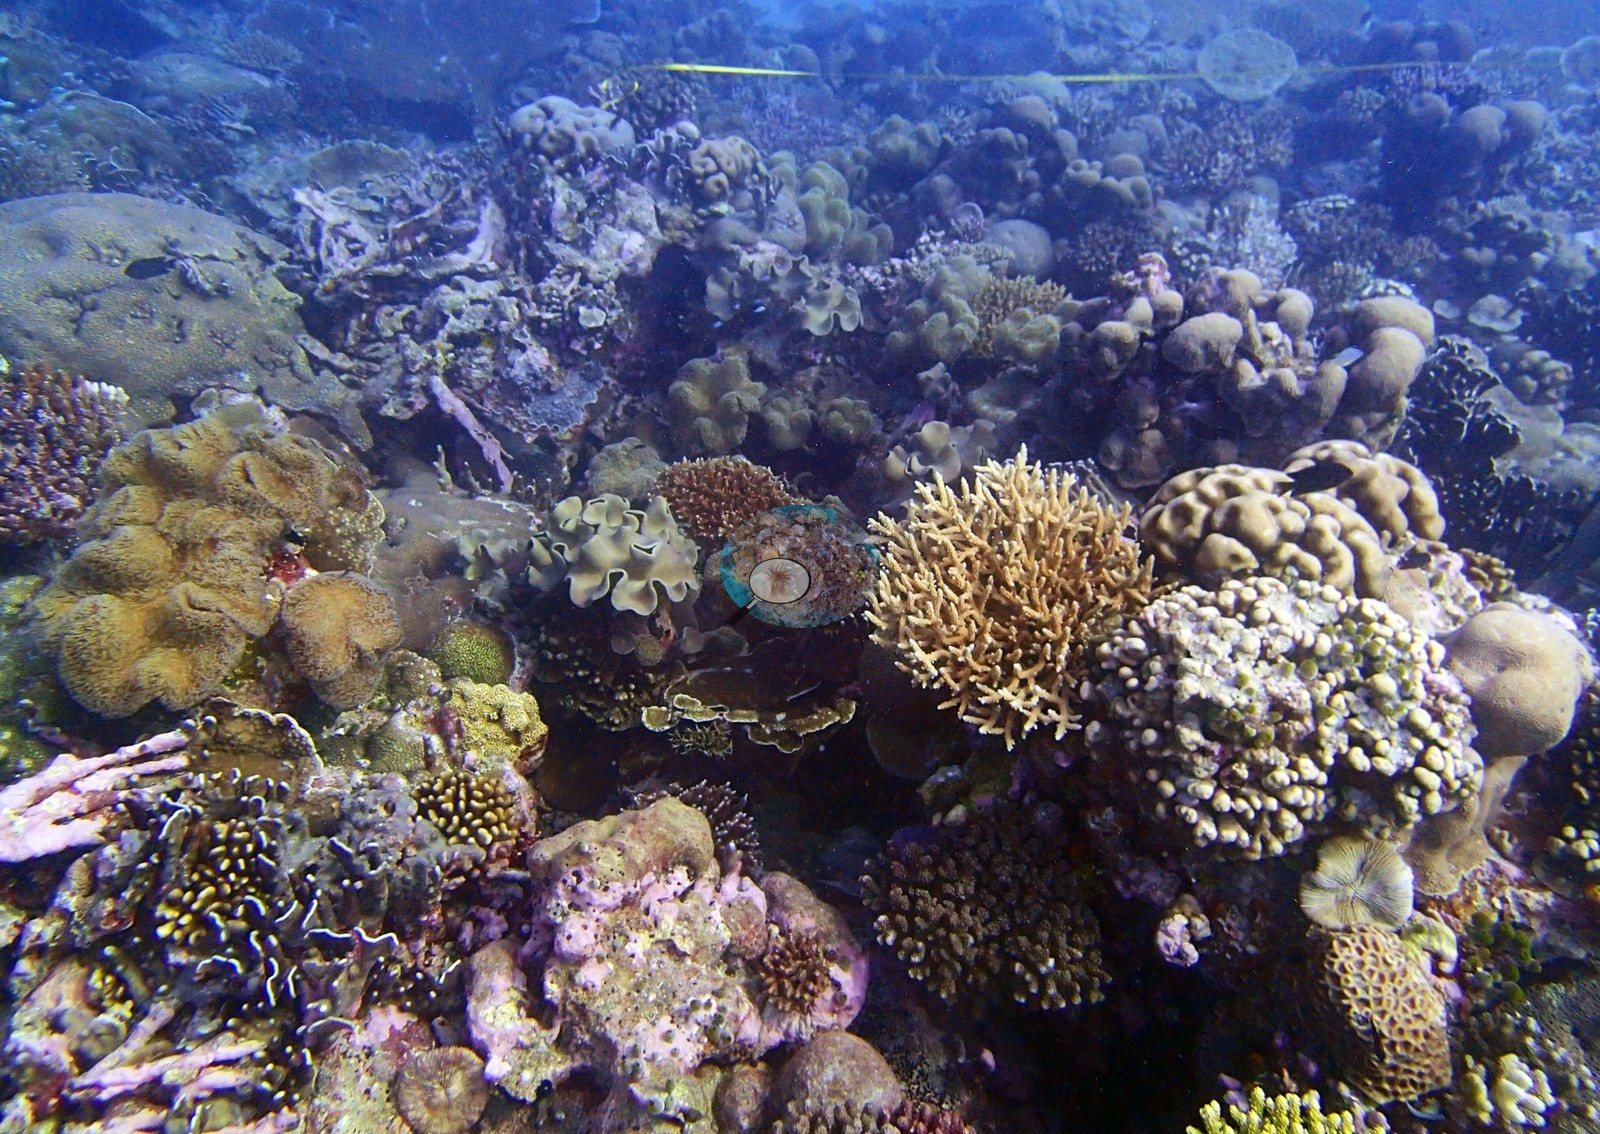
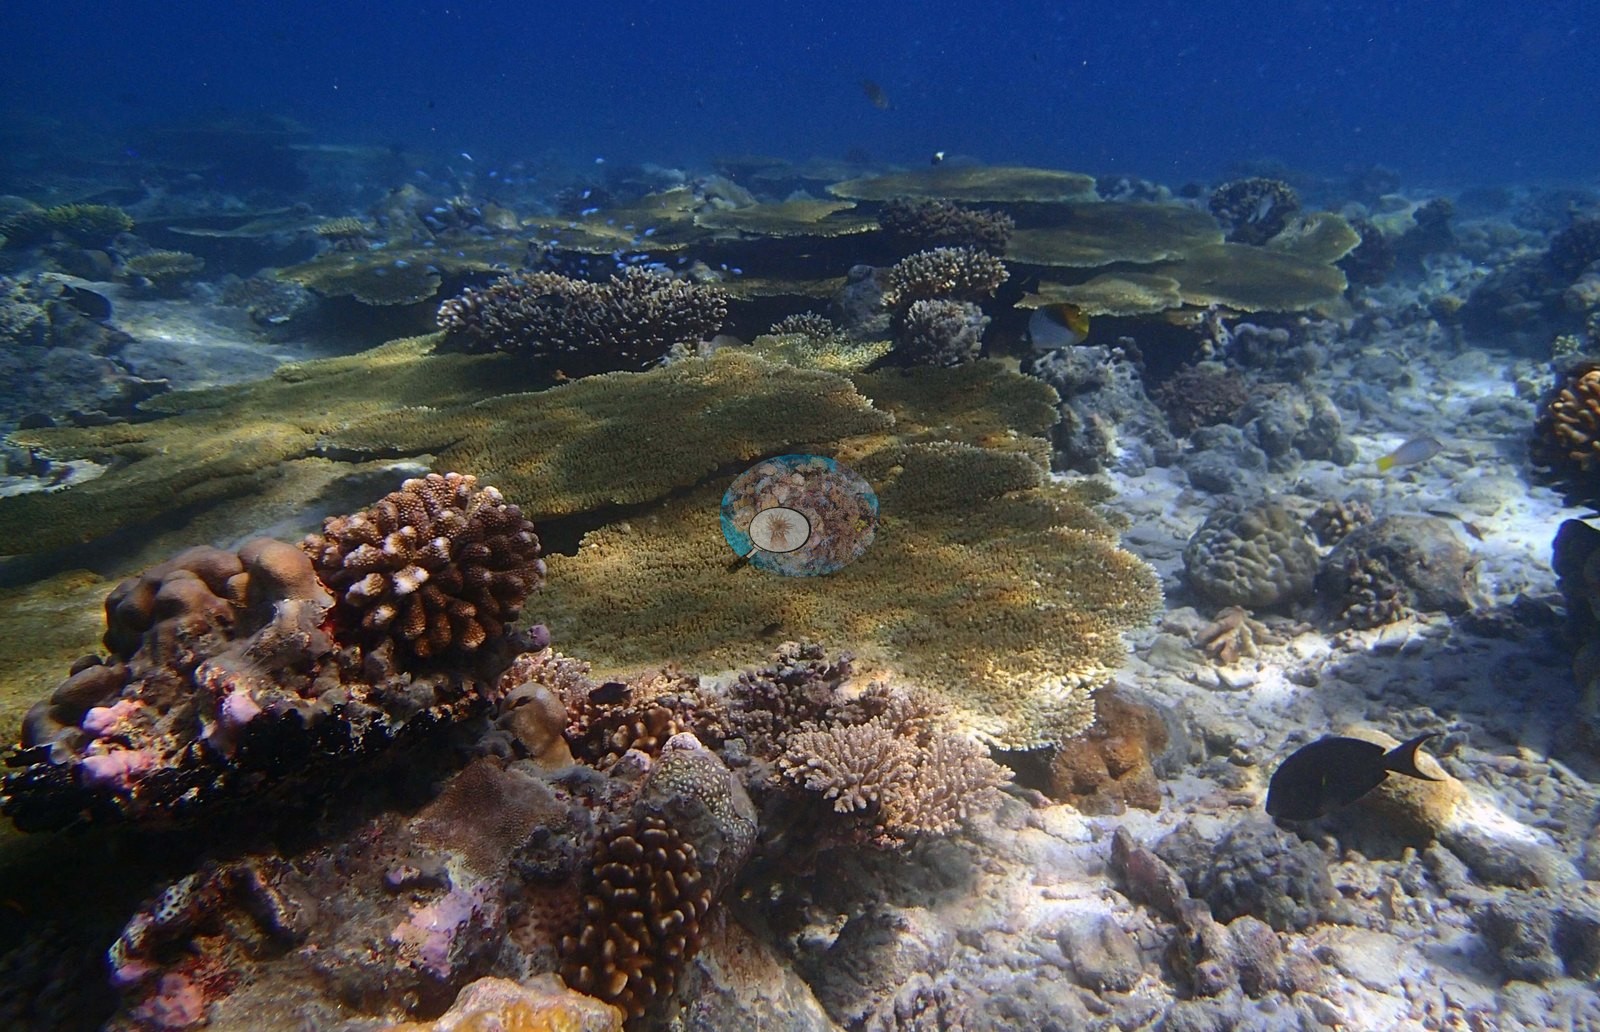
The reef photographs as a plate reef, and the photographic plate fields are the visible expression of the deep Echinopora/Turbinaria-dominated stratum in the transect data. Frame after frame – P3210408, P3210417, P3210418, P3210446, P3210457, and P3210477 – shows the substrate carpeted edge to edge in large overlapping foliose and whorled plate colonies, gray-green to tan, imbricated like roof tiles down the slope with almost no bare rock between them; P3210408 and P3210418 are near-continuous plate fields. Separately and just as consistently, the shallower reef top is a table-Acropora reef: P3210481, P3210482, P3210484, P3210485, P3210486, and P3210488 show broad flat tables and plating sheets, singly and in overlapping ranks, over pale pavement and sand. Mixed through the set are branching and corymbose Acropora in mauve, cream and gold (P3210401, P3210479, P3210483, P3210486), digitate and bushy colonies (P3210415, P3210416), tan and yellow massive domes including large smooth Porites-type heads (P3210448, P3210453, P3210454, P3210478, P3210483), yellow-green leathery soft corals (P3210402, P3210457), a large-corallite massive with regular pale calices in P3210426, and a Lobophyllia-type brain in P3210485. Pink and maroon coralline crusts, red and orange encrusting sponges and dark boring-sponge-pitted pavement fill the gaps. P3210402 is the single densest benthic frame in the folder – leathery soft corals, ruffled plates, cream corymbose Acropora, and small branching colonies packed together with essentially no open substrate visible.
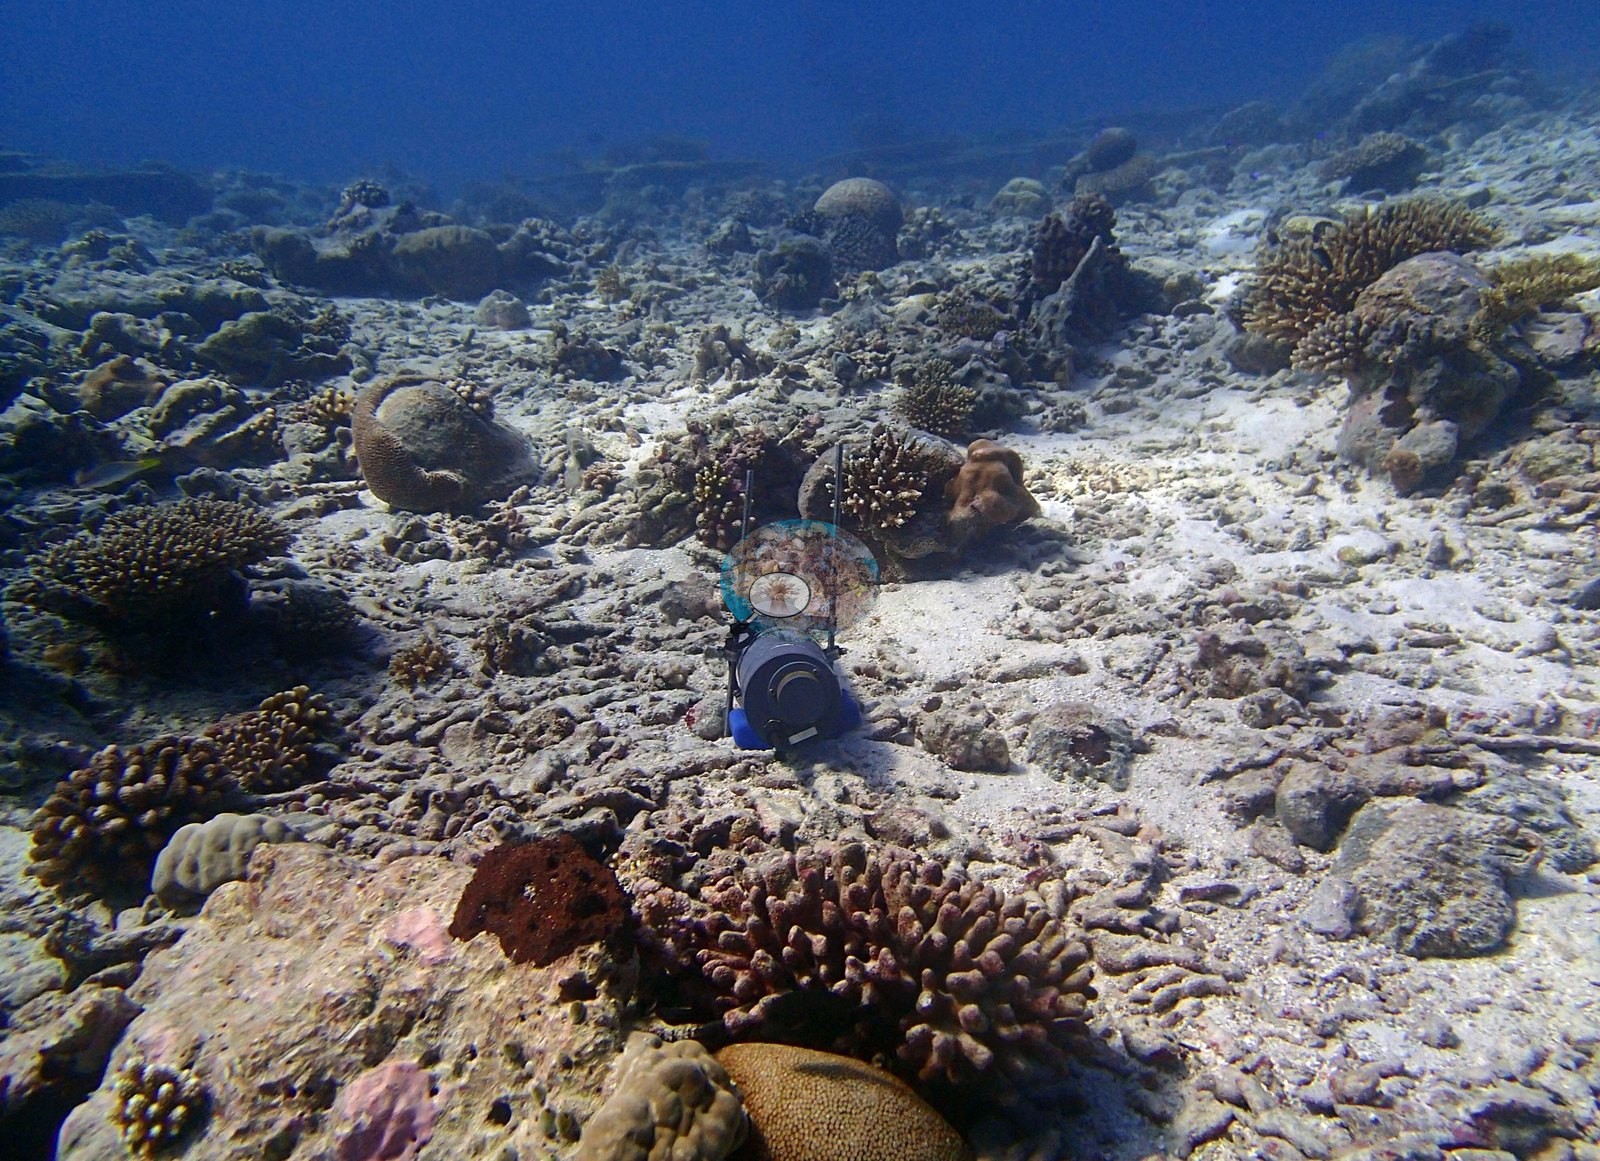
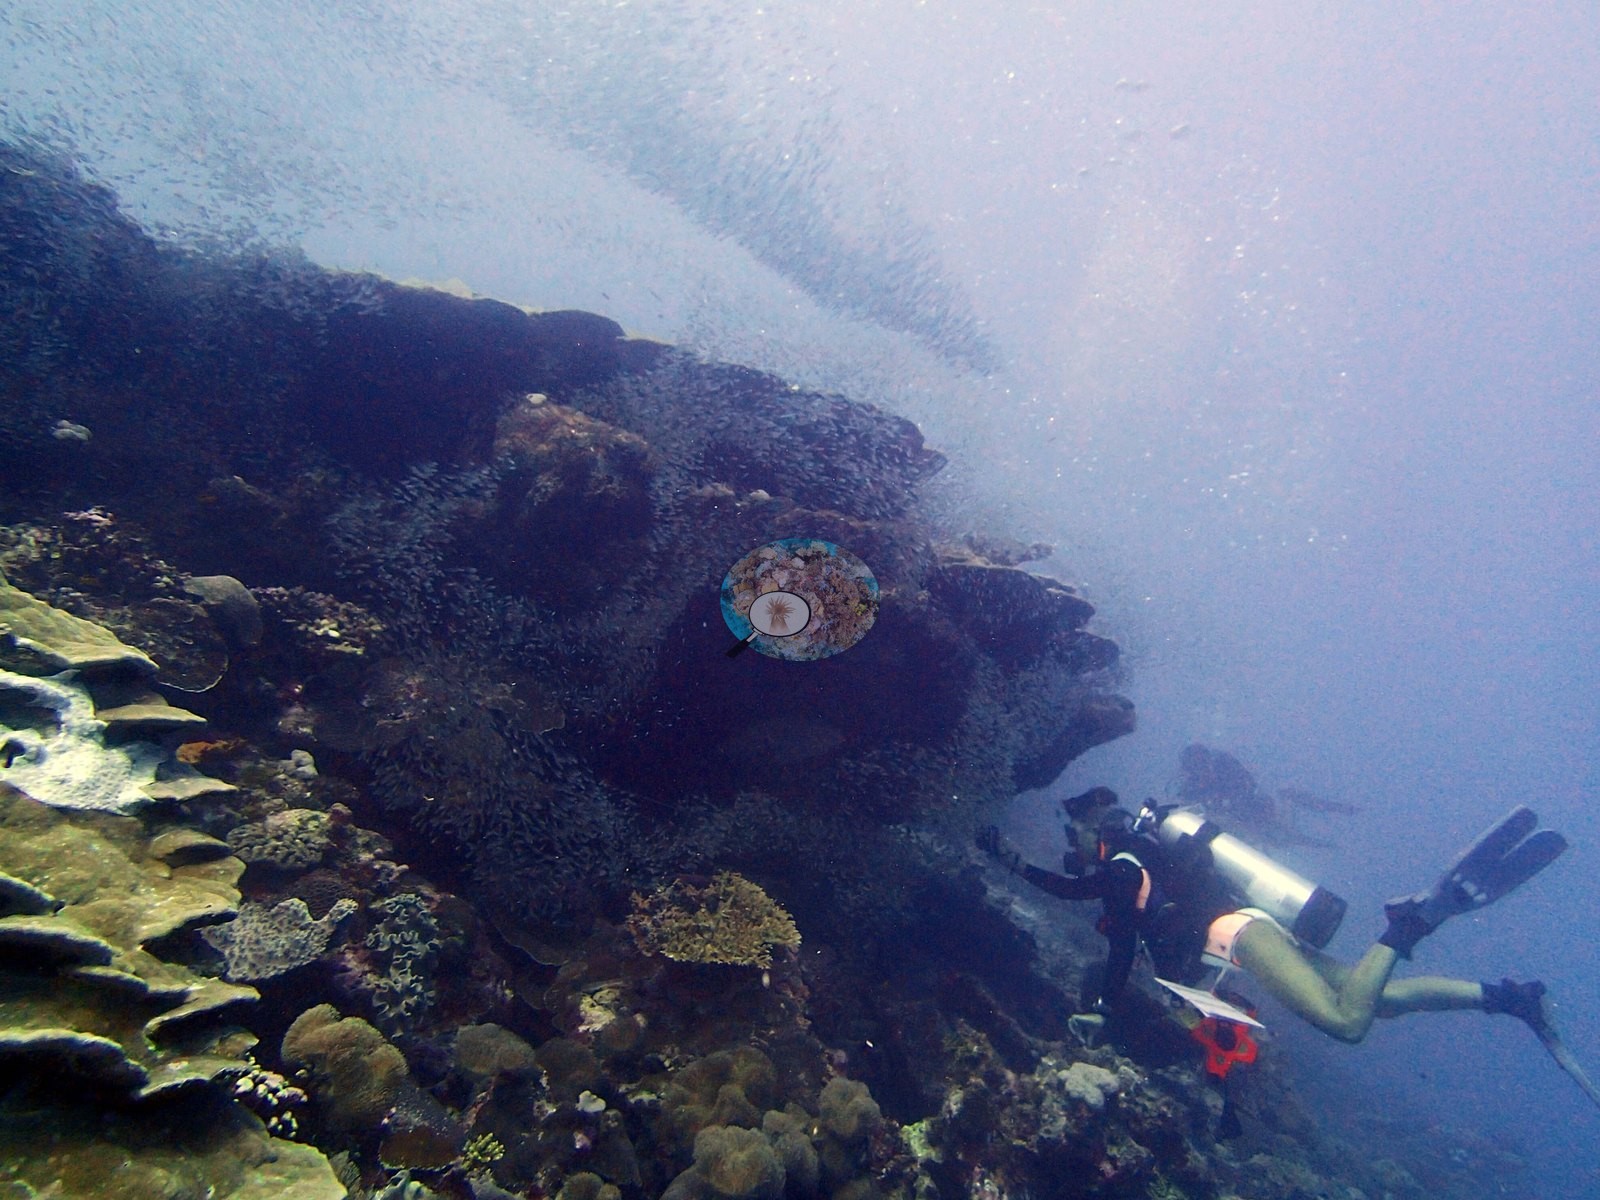
The reef is not uniform, and the folder is honest about it. P3210476 is the counter-frame: camera equipment resting on its tray on pale rubble and sand among widely spaced coral heads. P3210475 and P3210447 are similarly open frames of pale rubble and sand carrying only scattered colonies, and P3210478 and P3210482 set their tables on broad sand. Structure includes a substantial overhang or ledge system – P3210431, P3210432, P3210437, and P3210445 work its dark face, with P3210445 placing a diver against it for scale. The assemblage is led almost equally by Echinopora (13.77%) and Acropora (13.54%), followed by Heliopora (6.65%) and Turbinaria (6.05%), with a pronounced D1-to-D4 transition from Acropora through Heliopora to Echinopora/Turbinaria dominance.
Coral cover
The LOF benthic transect is this site's measurement, and at BITB38 it is also the richest thing on the page. Coral cover is 56.0% live hard coral, from the LOF BIOT-1 in situ transects (Mayfield & Dempsey 2026, Oceans, suppl. S1), against algal cover of 33.8% of the benthos – one of the highest-cover sites in the Chagos series (Great Chagos Bank – West, dived 21 March 2015). Twenty formal transects give the site estimate: 56.03% coral, 33.78% algae, 7.35% barren substrate and 2.84% non-coral invertebrates. That survey is the authoritative record of cover and community here; the computer-vision products and the photographs supplement it and never revise it.
The 56.03% site mean hides one of the strongest depth turnovers in the Chagos set, and the depth-stratum breakdown is the most important detail at this site. D1 averages 45.6% coral and is Acropora-led at 34.4%.
Replication is sufficient to treat that turnover as real, and the same data show the reef is patchy within strata. There are 20 transects here, not a single low-effort snapshot. Individual D2 transects nevertheless range from 8% to 60.8% coral, and D3 from 32.6% to 92%; two D4 transects are at or above 88% coral while the other two are 57–60%. The single 56% mean legitimately describes the total survey, and the within-stratum range is what tells you the reef is a mosaic rather than a uniform plate carpet. Neither the dense plate fields nor the open rubble plain should be corrected away.
Method comparison – transects, points and masks. Across the 34 paired frames the point annotation gives 27.25% live hard coral and the Coralscapes masks 29.33%, against the 56.0% transect figure. Both image products read at roughly half the transect value, which is the strongly negative photo-versus-transect gap the archipelago-wide comparison predicts above 40% cover. Two site-specific reasons compound it here, and both are about the image products, not the survey.
Second, coverage and provenance. The supplement contains all 44 BITB38 image rows and reports 34% coral cover for them, whereas the paired audit retains only 34 frames. The missing run P3210426–P3210437 is not a random ten-frame slice: it includes a coral macro, three baitfish and wall frames, the approach to the overhang and the complete lobster-den sequence. Within the retained set, about 308 of 1,020 points (30.2%) are ‘Unknown’, and the Chagos point set is predominantly unconfirmed CoralNet robot output. This is an image-analysis provenance problem, not a human annotator's error, and it is one more reason the paired image subset is a supplement here rather than a measurement. These products have different sampling footprints and denominators and should not be averaged. Many of the point calls are demonstrably off-target: P3210419 is a lionfish macro; P3210445 is mostly baitfish, diver and open water; P3210448 and P3210456 are trevally frames; P3210476 is camera equipment on rubble. Coralscapes assigns zero or near-zero bleaching to most of them. That is a useful, checkable diagnostic of the point set's behavior on non-benthic frames, and it belongs with the method comparison above rather than with any statement about how much of this reef was bleached.
Also on record for this site: Assemblage composition. Twenty formal transects give the preferred site estimate: 56.03% coral, 33.78% algae, 7.35% barren substrate and 2.84% non-coral invertebrates. Across the 34 paired images, CoralNet points give 27.25% live hard coral and Coralscapes 29.33%; those products omit ten annotated folder frames and cannot resolve the formal plate-coral genera. The photographs strongly corroborate the reef's high structural complexity and plate dominance, but the formal transects—not the paired image subset—support the site-level cover and genus values. Coral cover: 56%. Live hard coral measured on the in situ benthic transects of the LOF BIOT-1 expedition (Mayfield & Dempsey 2026, Oceans, supplemental S1), against algal cover of 33.8% of the benthos. The transect figure is this site's authoritative cover value; no image-derived product overrides it. Across methods the same reef reads: transects 56% · CoralNet points 27.3% · Coralscapes masks 29.3% (34 frames). These products have different sampling footprints and denominators and should not be averaged.
Stressors
Worth confirming at full resolution.
Condition. No crown-of-thorns starfish, disease lesion or clear corallivore predation scar is visible in any of the 44 frames. The 3.89% mean dead-coral mask and 5.06% rubble estimate are consistent with old exposed framework and the open rubble and sand patches, not an acute mortality front.
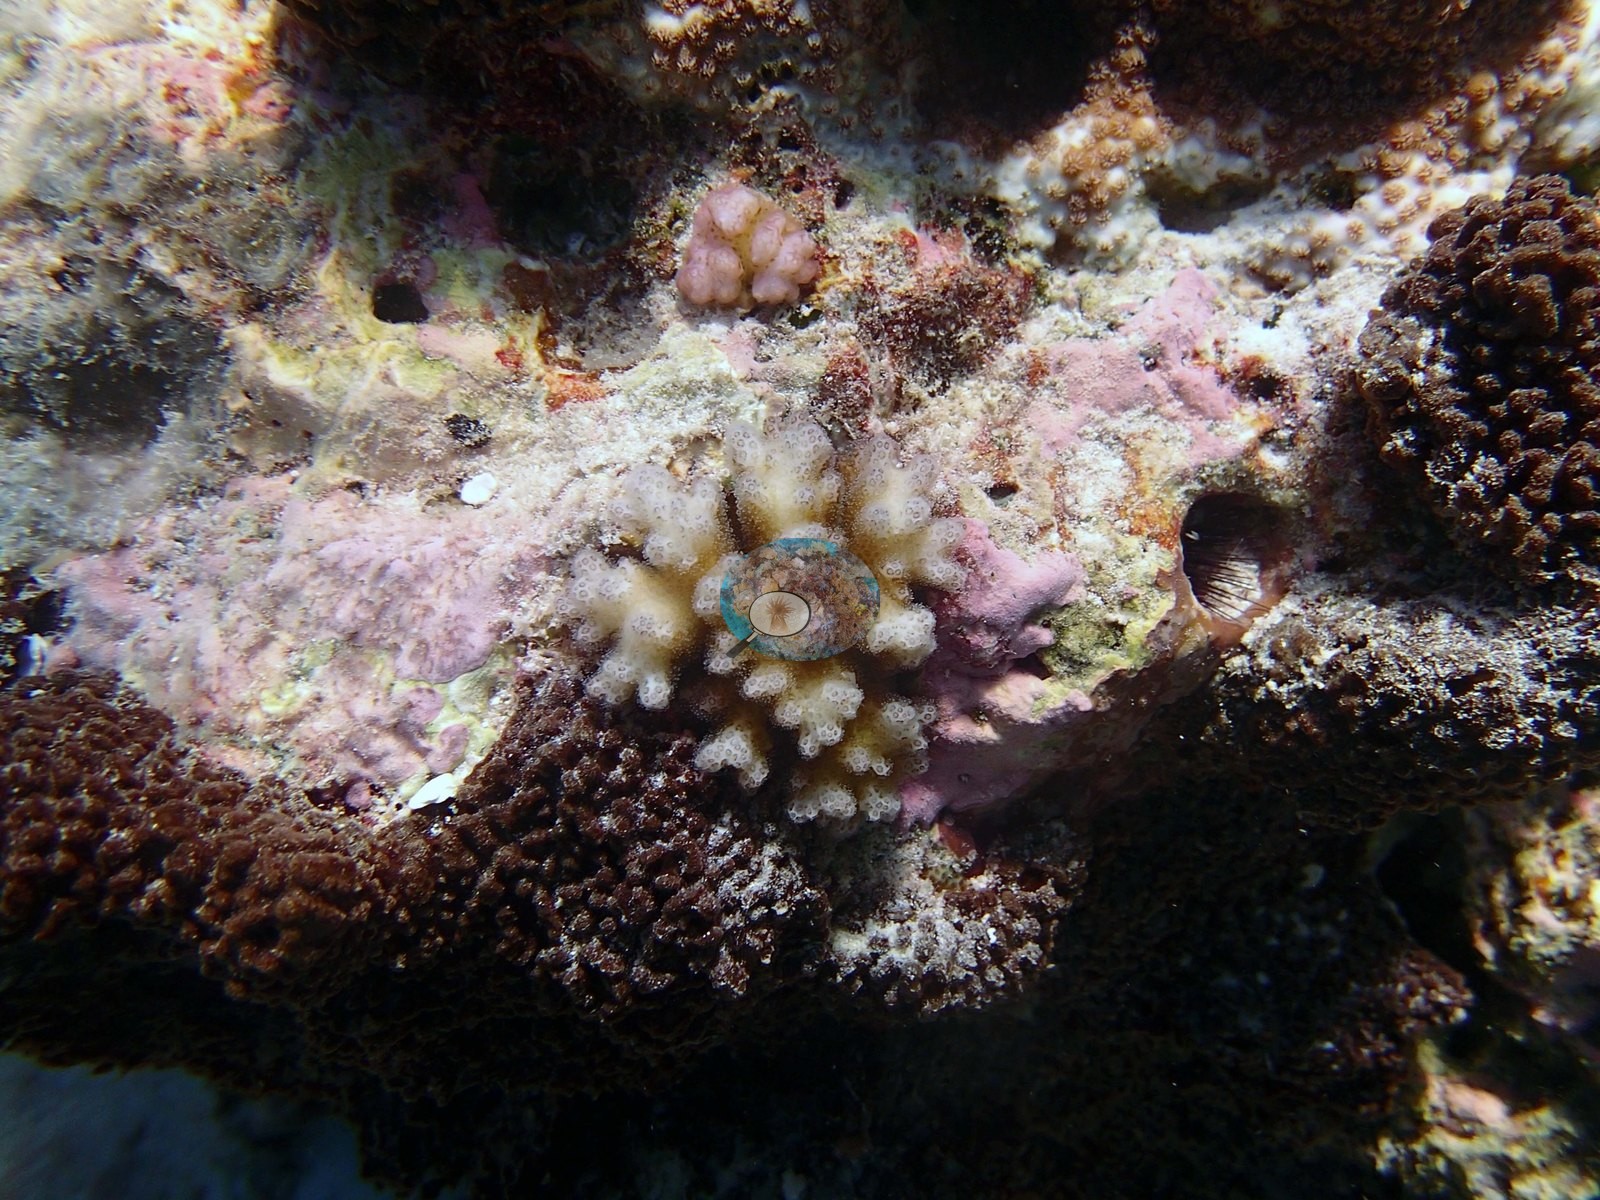
Bleaching – described qualitatively; the published figure is the authority. Anderson's field record for this expedition is no bleaching on the March or April dives, with bleaching first observed in May, and this is a 21 March dive. Across all 44 photographs the overwhelming plate, branching and massive assemblage is pigmented brown, olive, green, blue-gray, cream, and mauve. Pale plate rims and pale branch tips recur throughout, but they follow colony margins and growing tips on otherwise pigmented colonies, which is what active growth looks like, and their regularity is also compatible with image lighting. Two frames deserve a narrower note without being generalised. P3210402 contains several pale or partly white branching colonies amid a dense, otherwise pigmented assemblage; recent branch mortality, local paling, natural pale color, and flash cannot be separated confidently. P3210487 is a close small branching colony with cream-white distal branches over darker brown inner tissue; three bleached points and 1.59% mask bleaching agree that it is pale, but growth tips, partial bleaching, and recent tissue loss remain competing explanations from one image. P3210475 and P3210447 include chalky pale patches on the rubble plain that read as old exposed framework rather than as an acute front. These are individual, local observations. No bleaching percentage is estimated from these frames, and none is derived from or tested against them – Anderson's published per-site percentage bleached is the authoritative figure for this reef.
What the bleaching point calls do tell you is about the annotation, not the reef. The point audit assigns 15 of 1,020 paired points (1.47% of all points) to bleached coral across ten frames, while the mask estimates only 0.099% bleached area – a fifteen-fold disagreement between the two image products.
Fish and other fauna
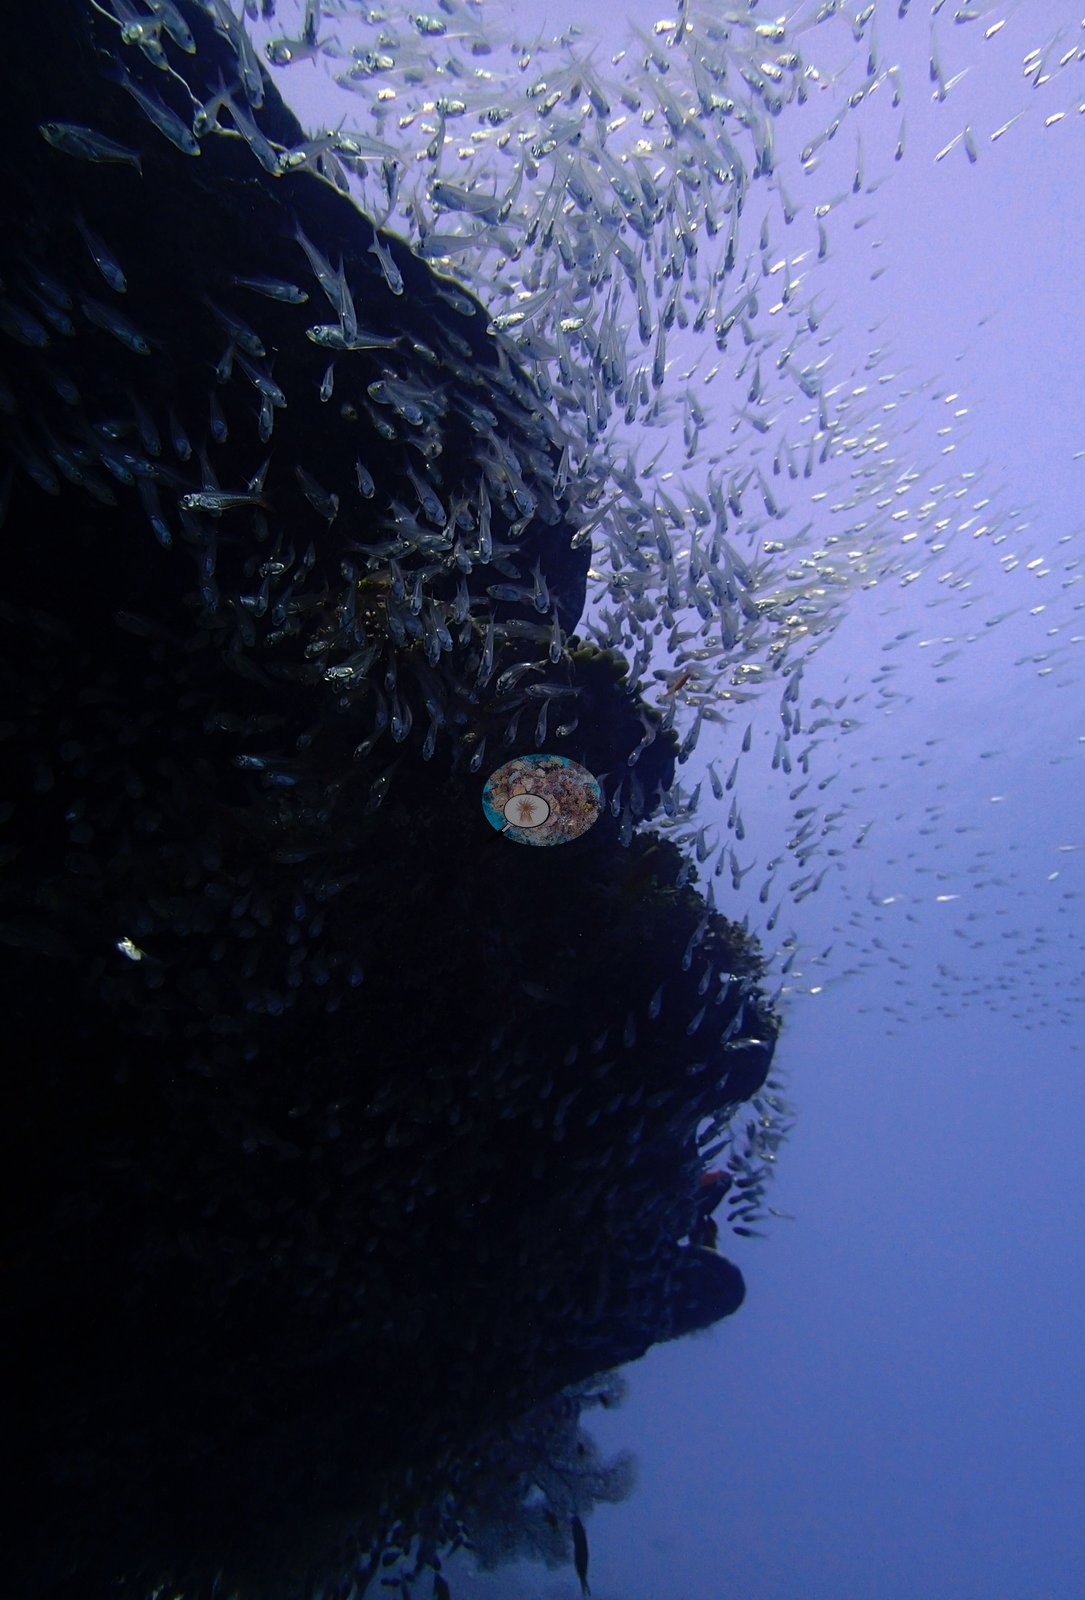
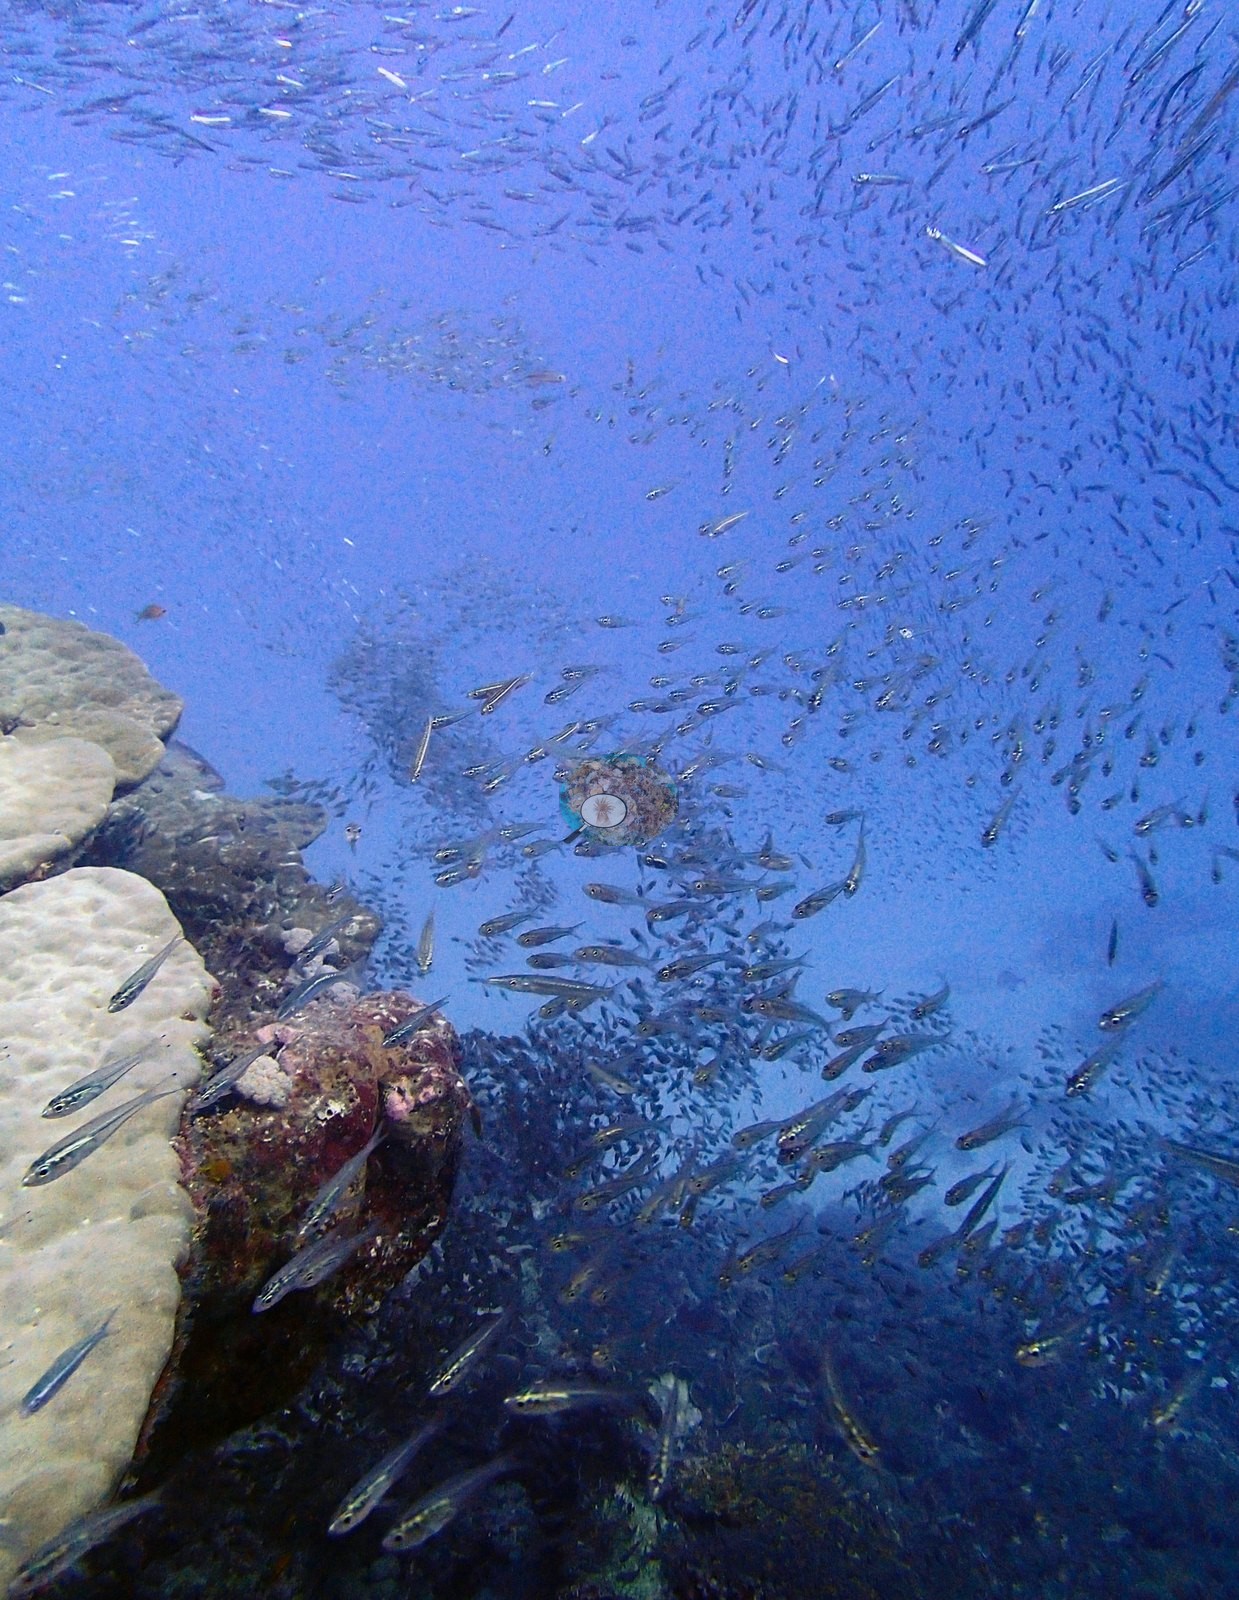
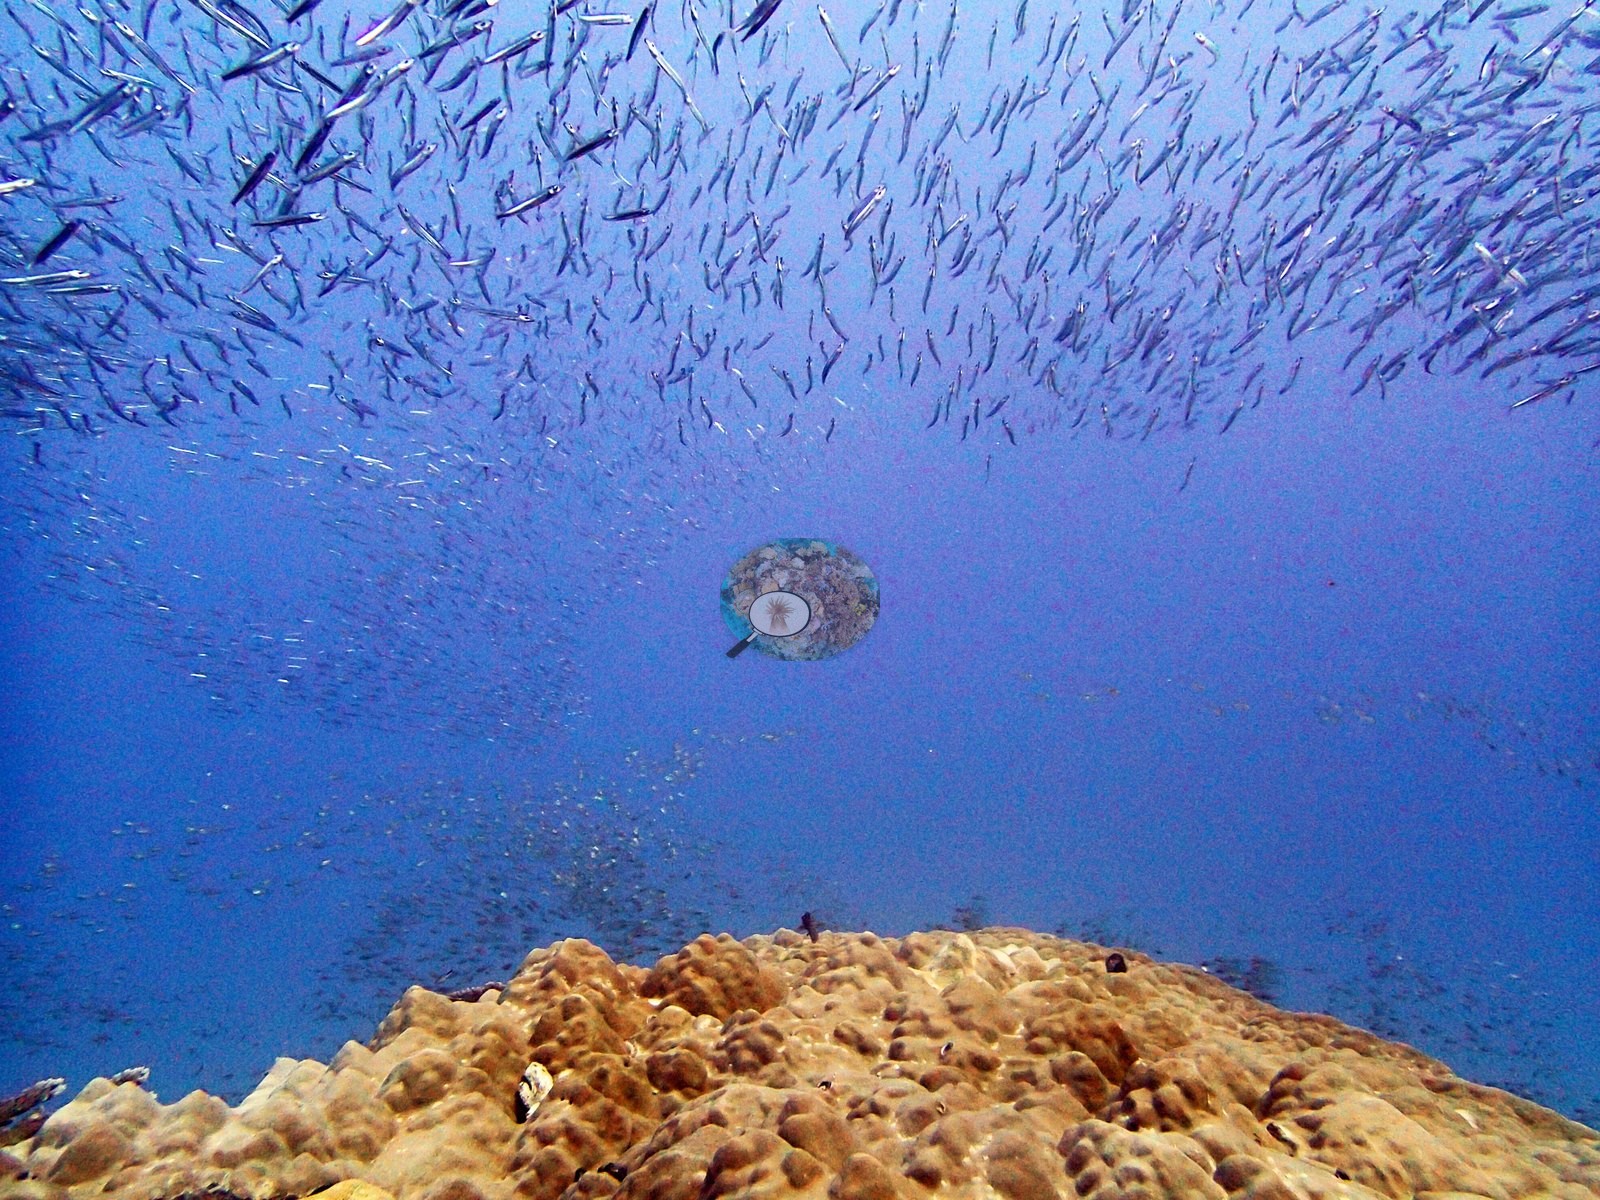
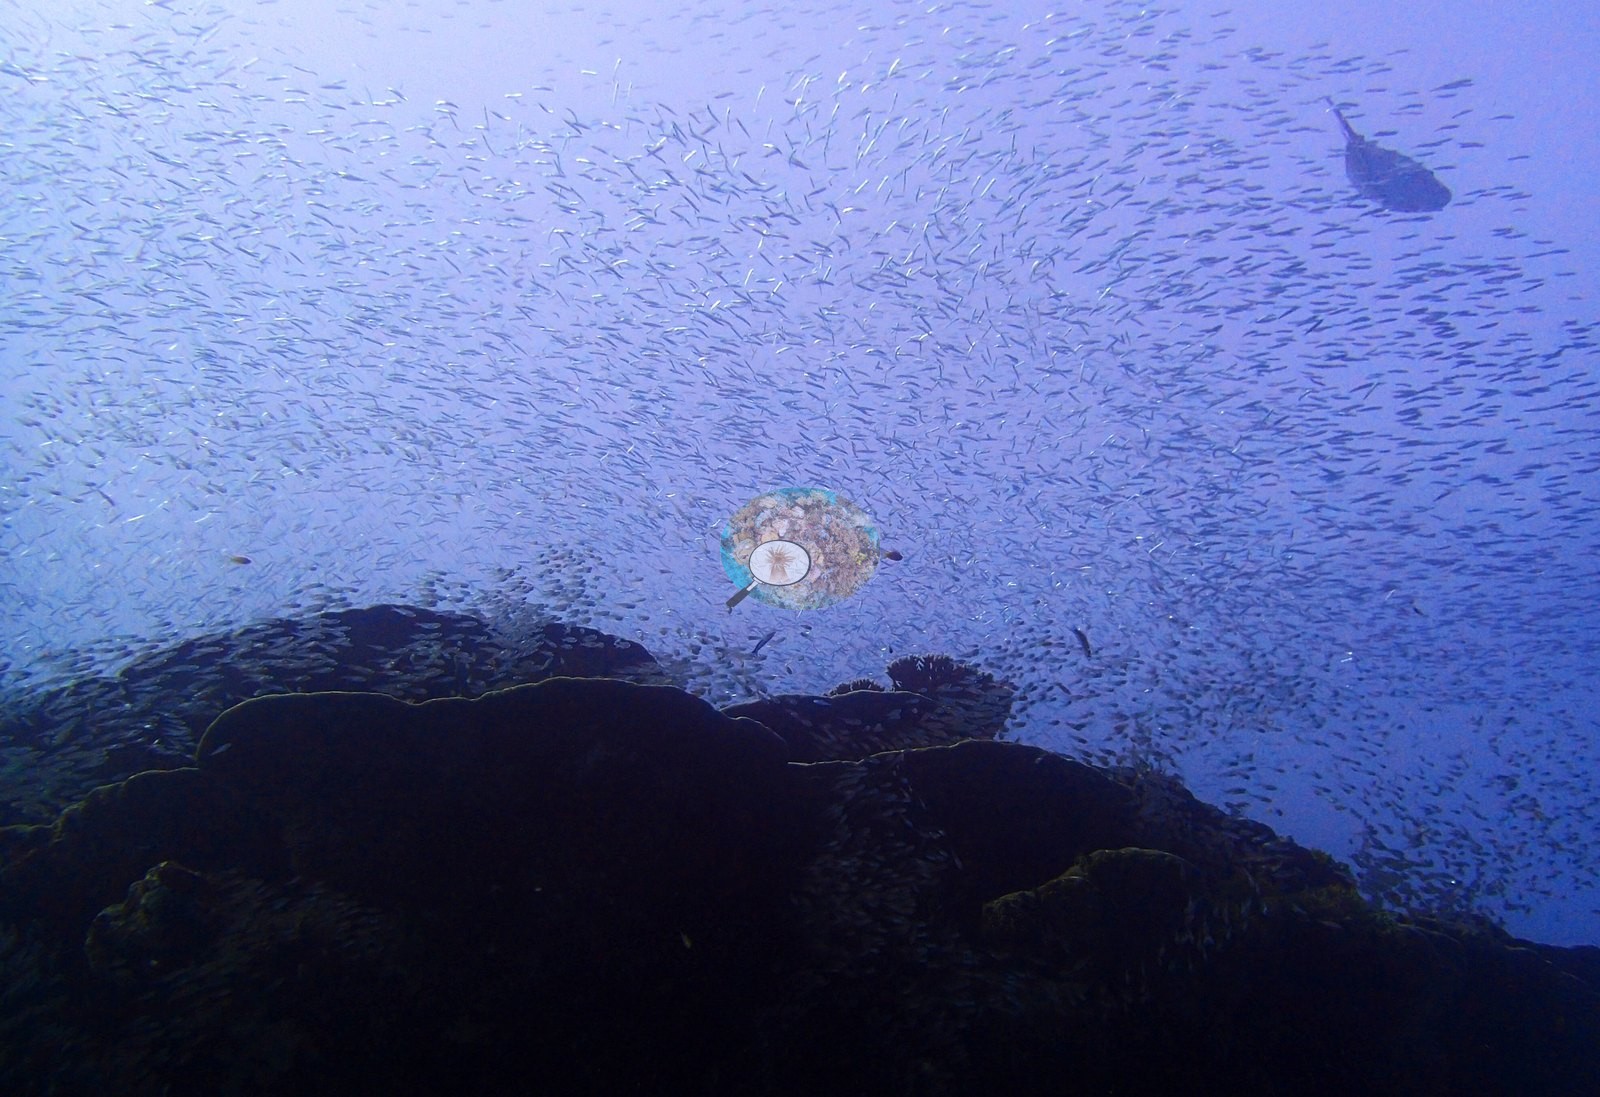
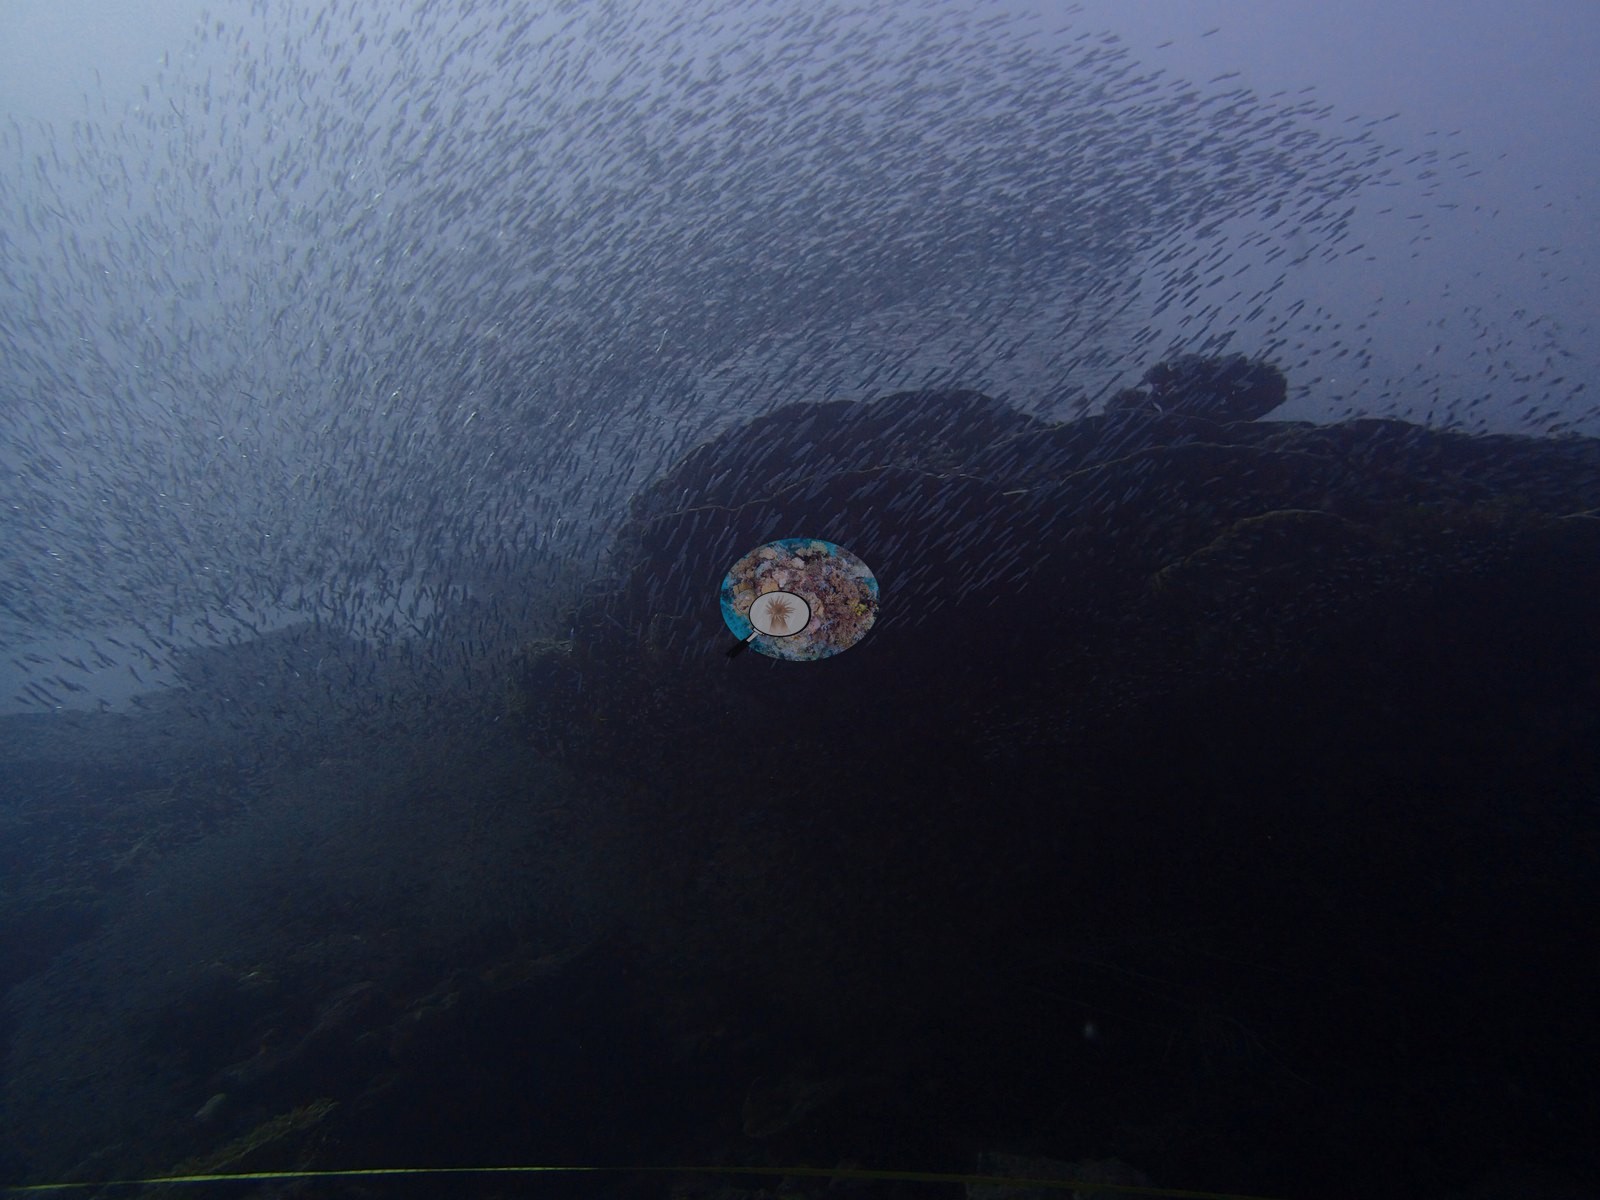
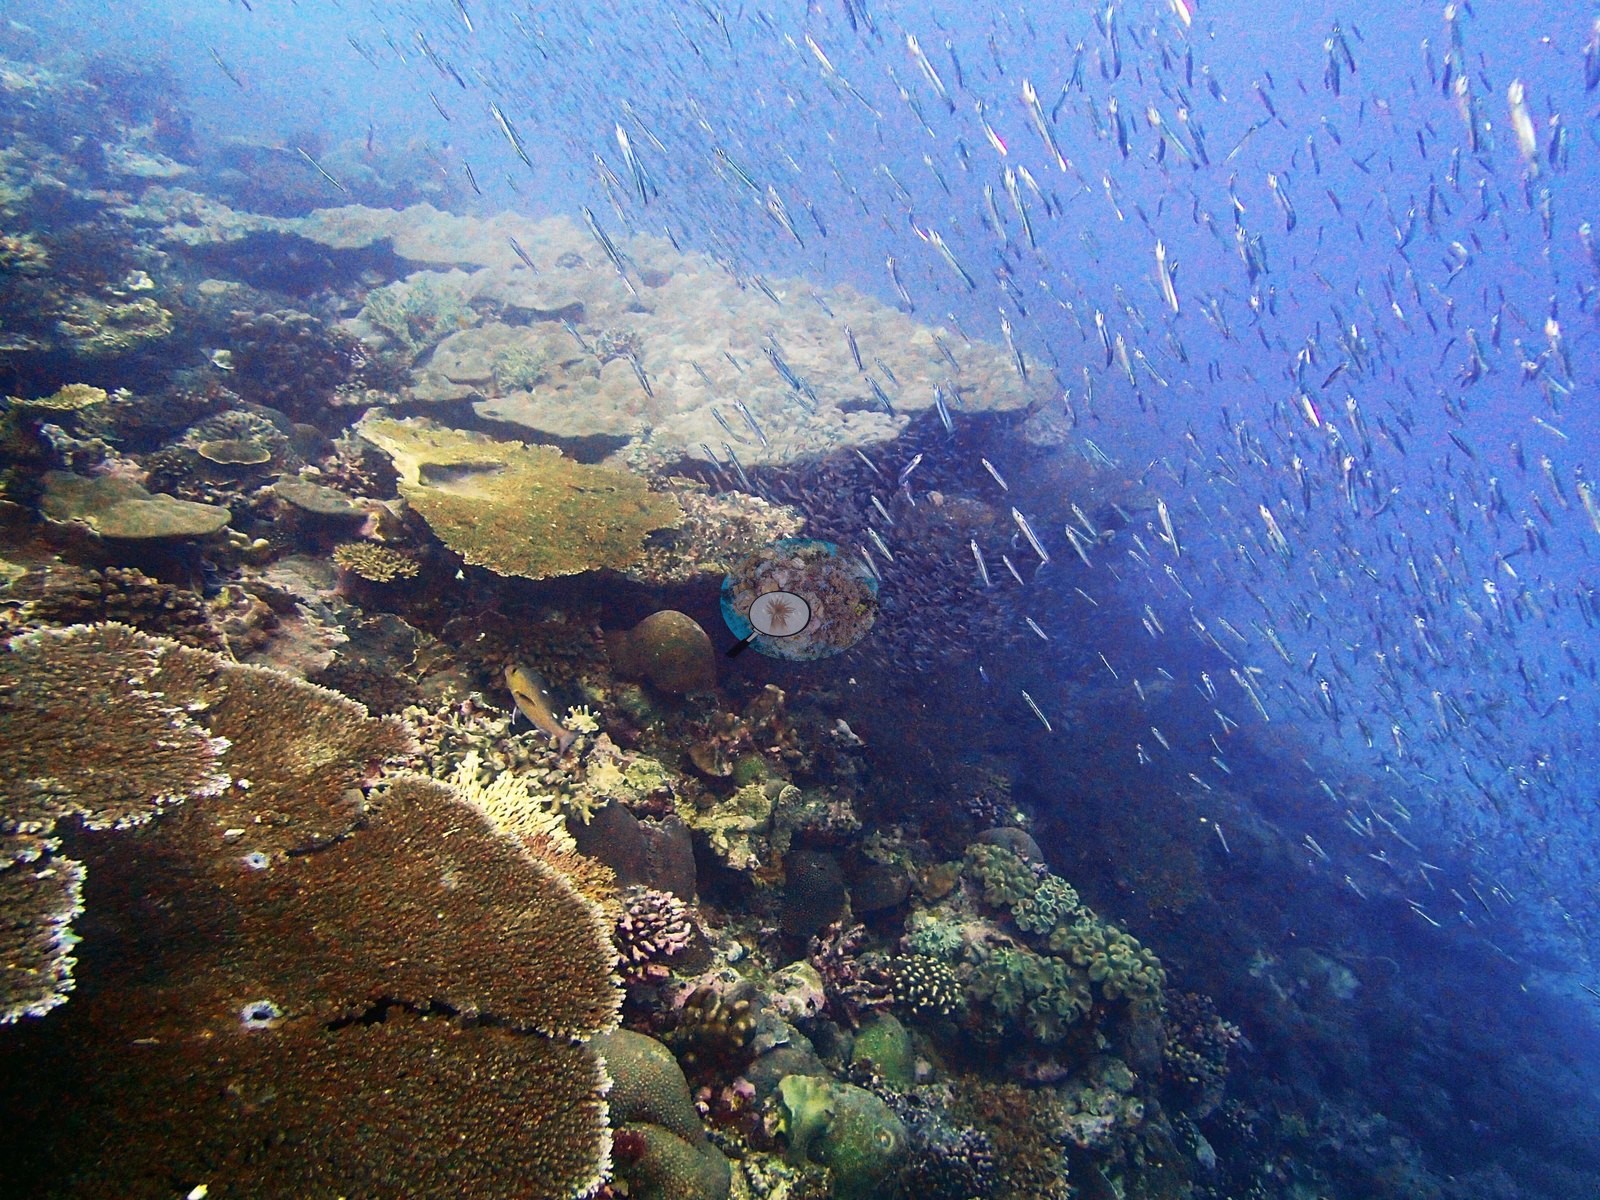
About ten frames (P3210427, P3210428, P3210429, P3210432, P3210437, P3210445, P3210449, P3210450, P3210453, P3210454) are dominated by baitfish or fusilier schools and give only partial substrate; P3210419, P3210431, P3210434, and P3210435 are close ledge and fauna frames.
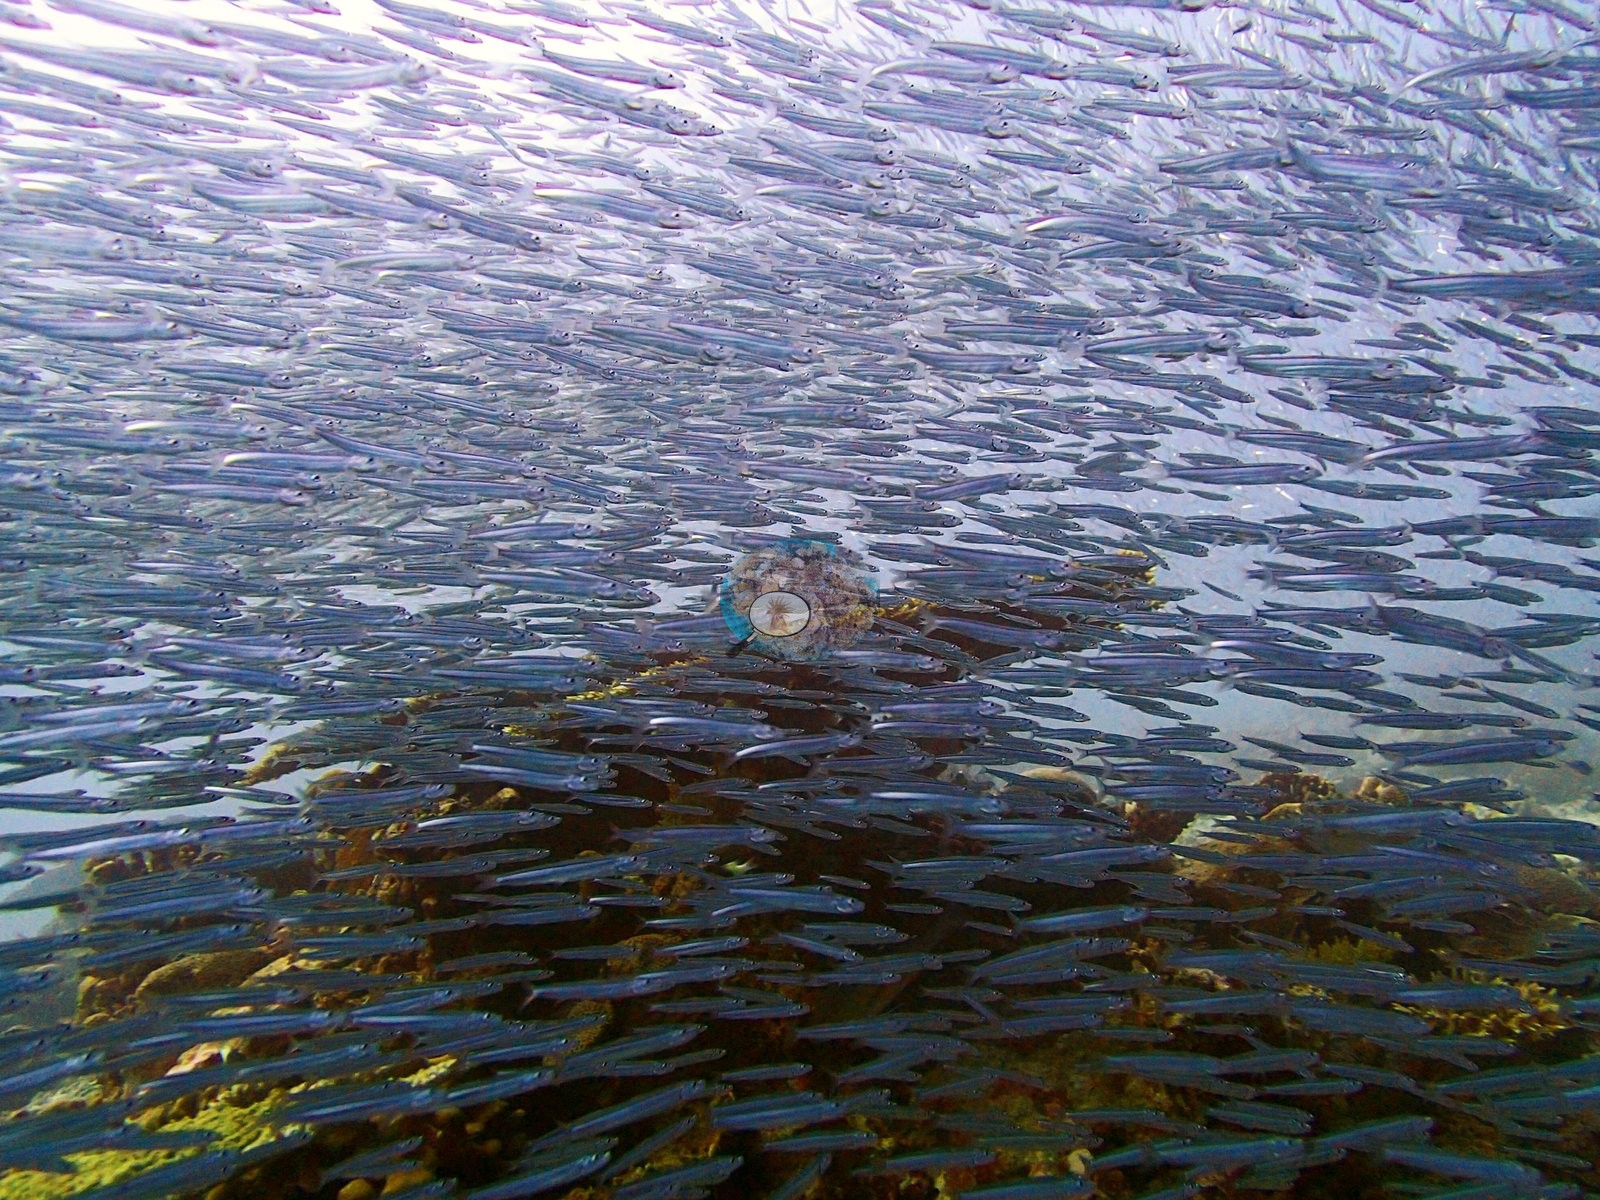
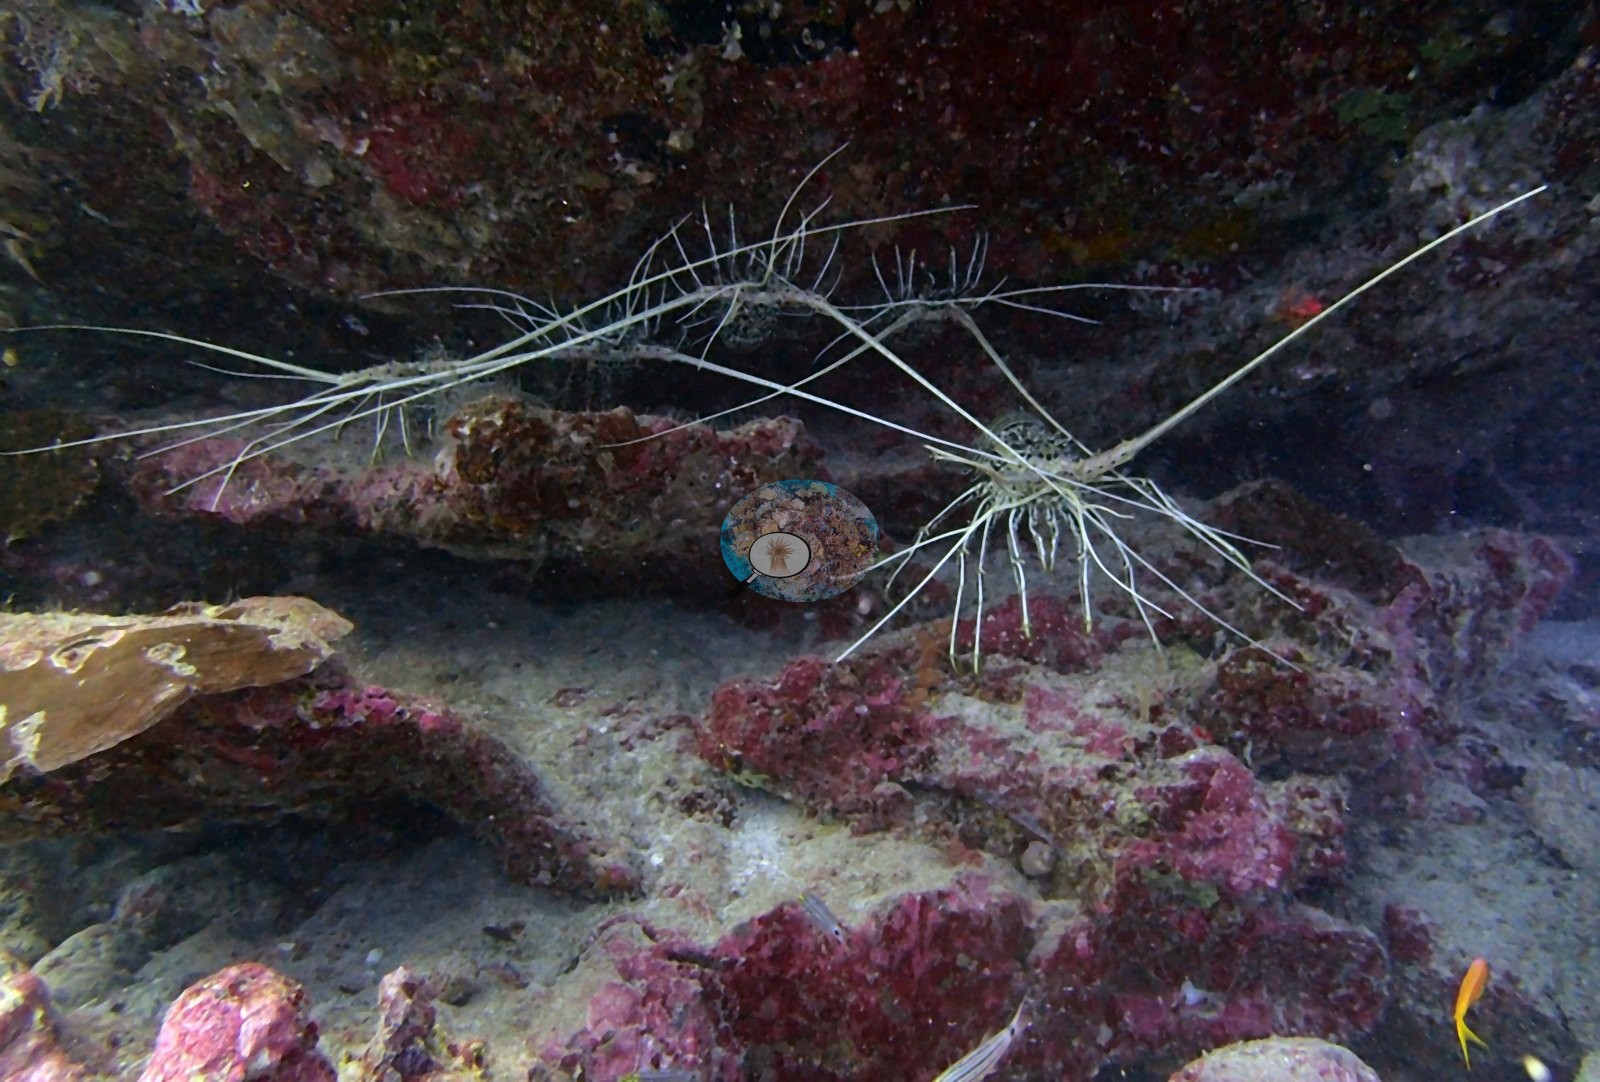
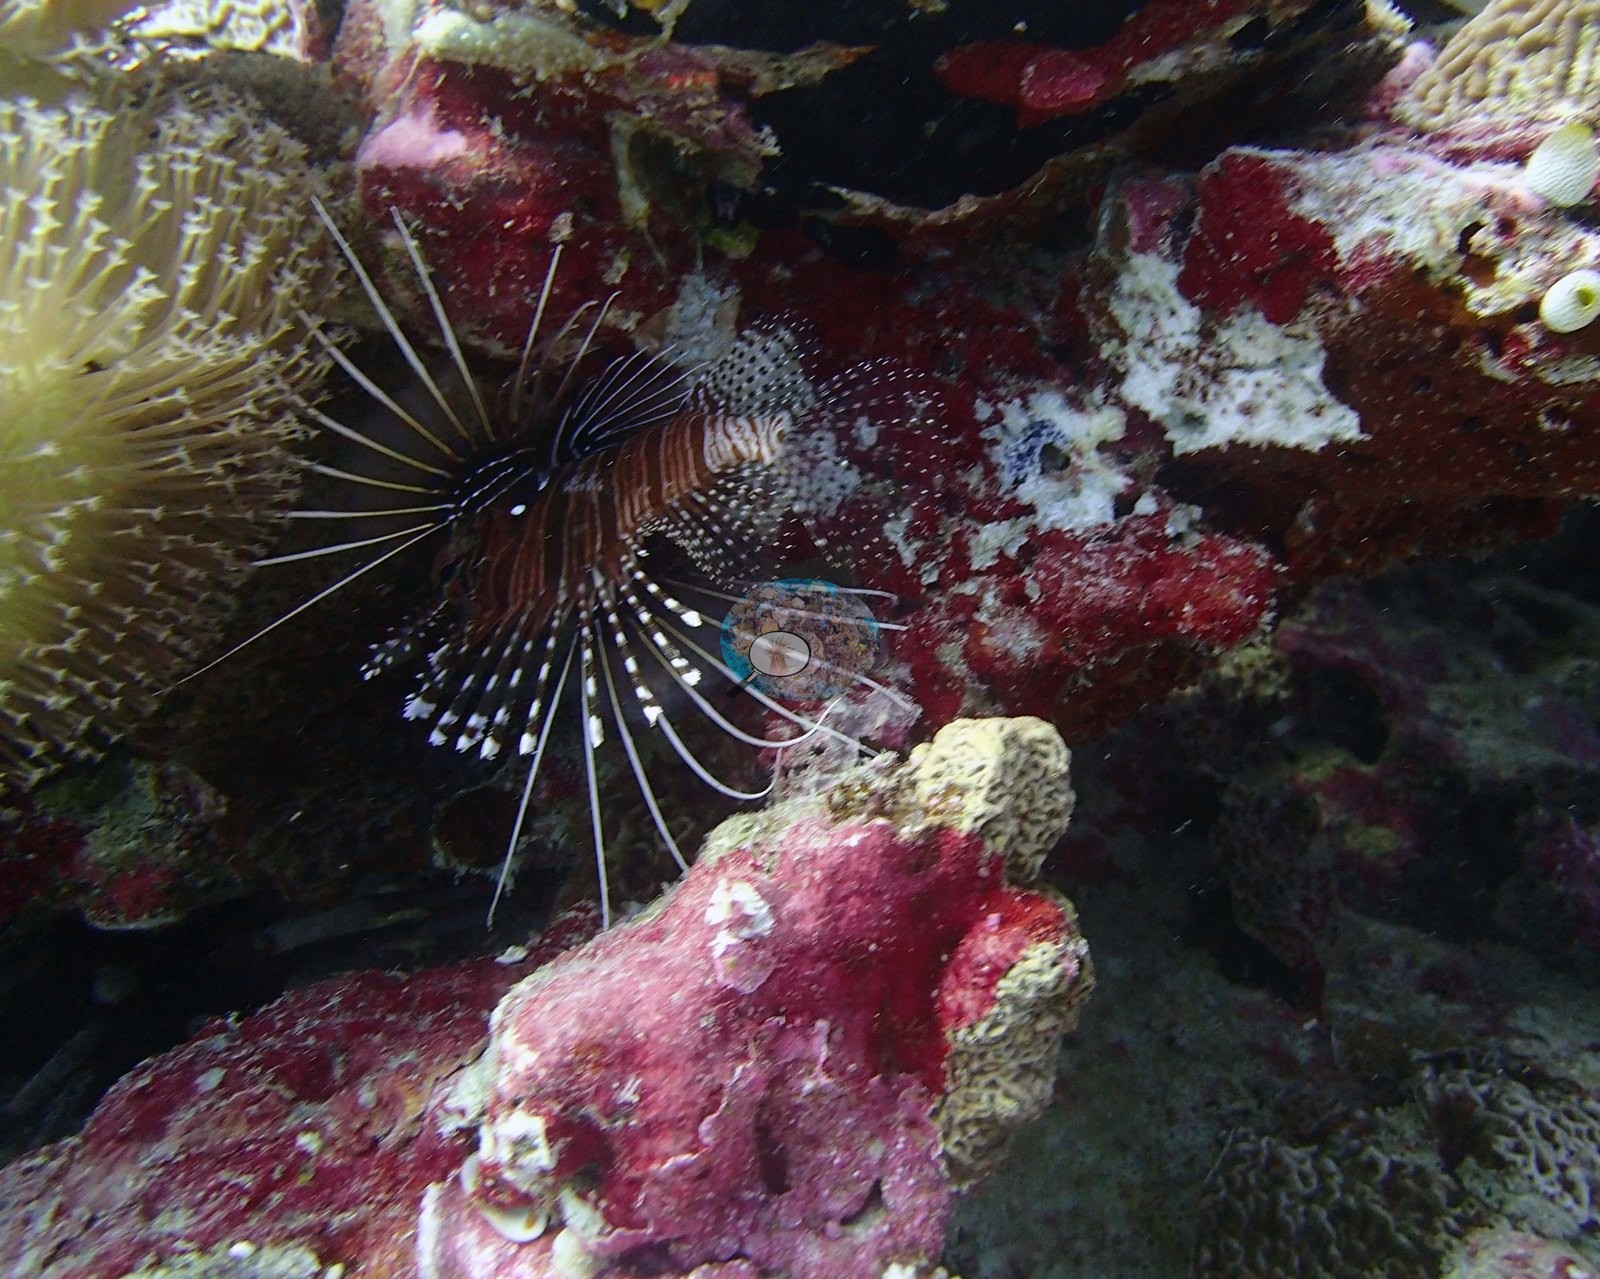
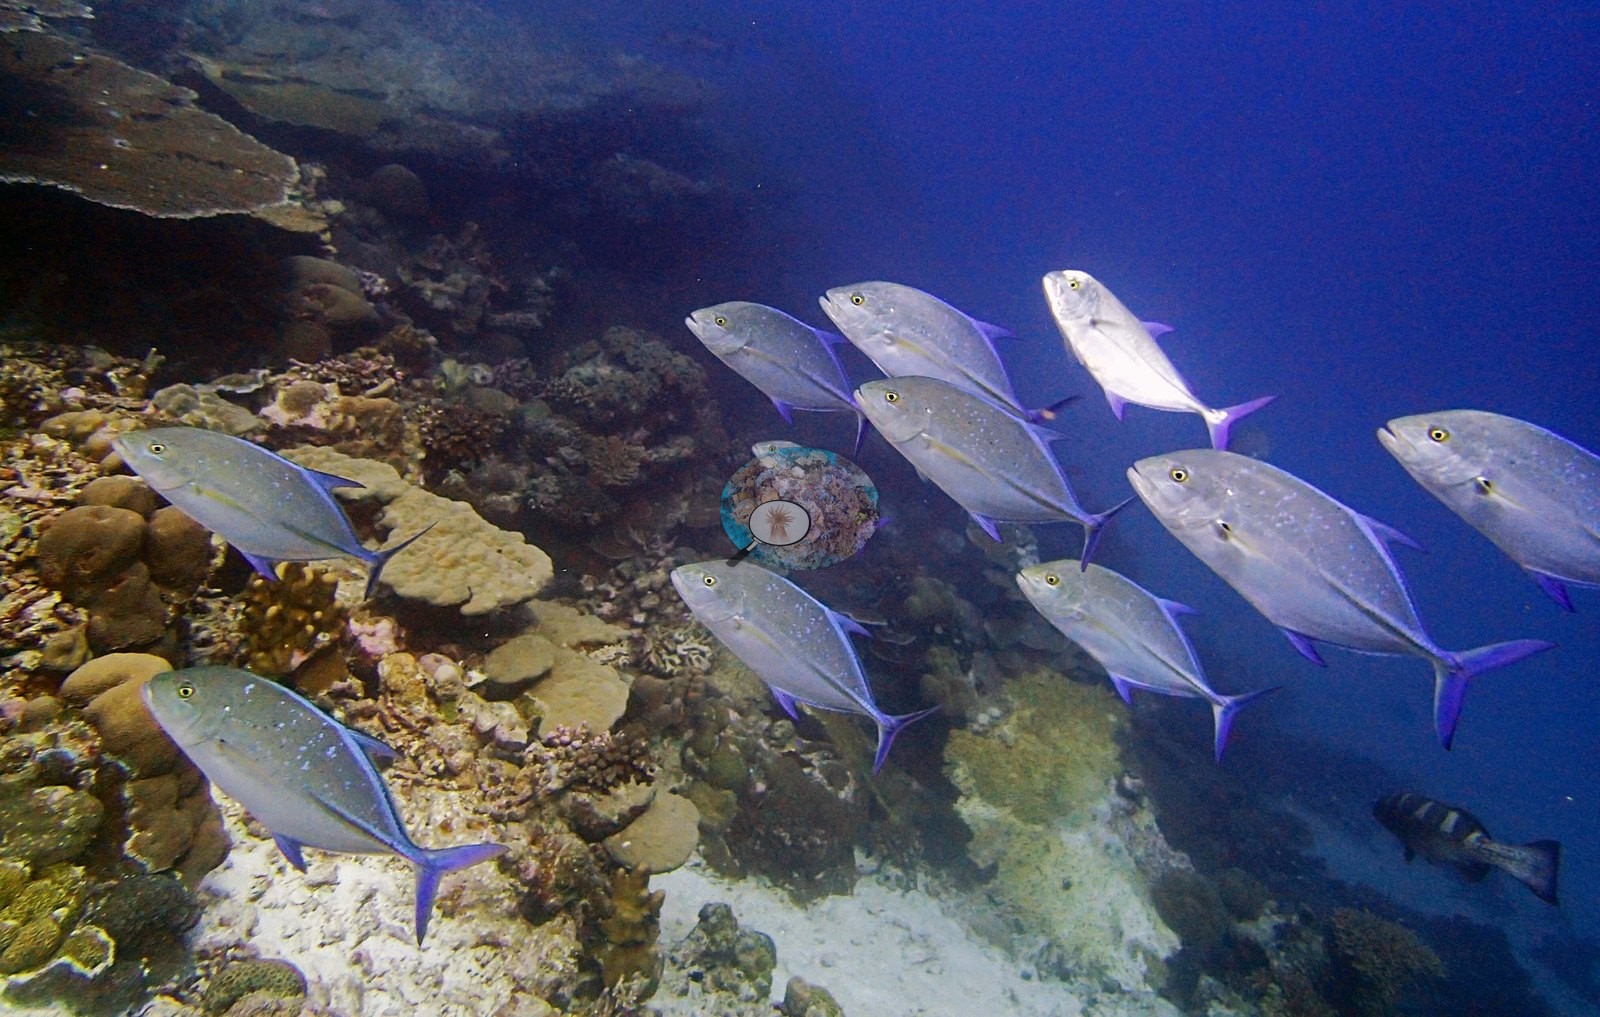
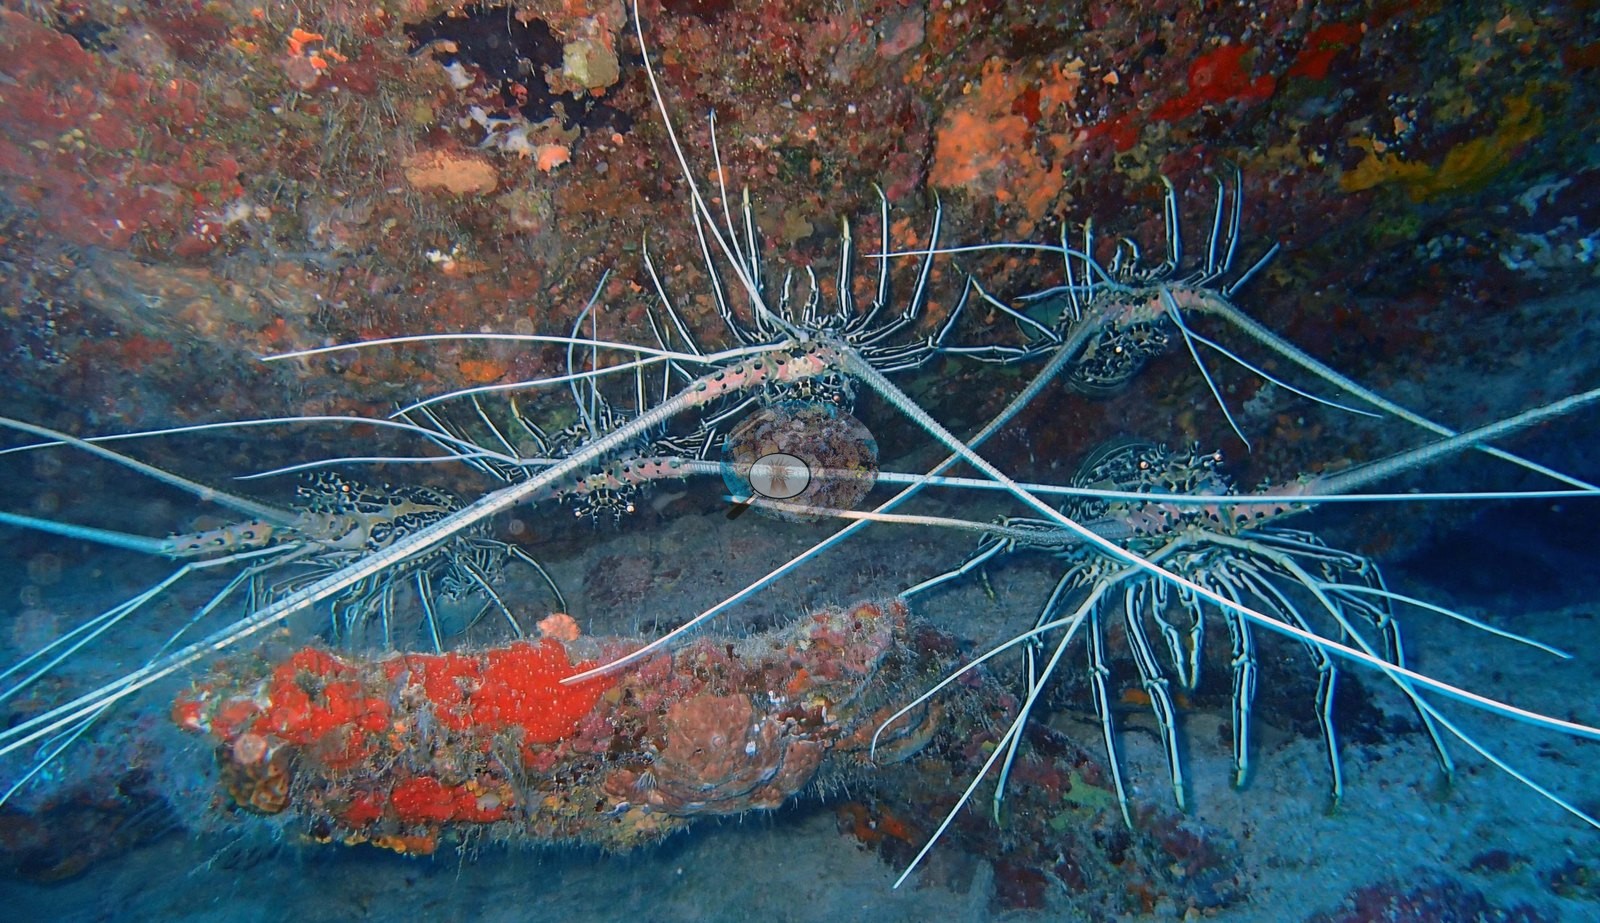
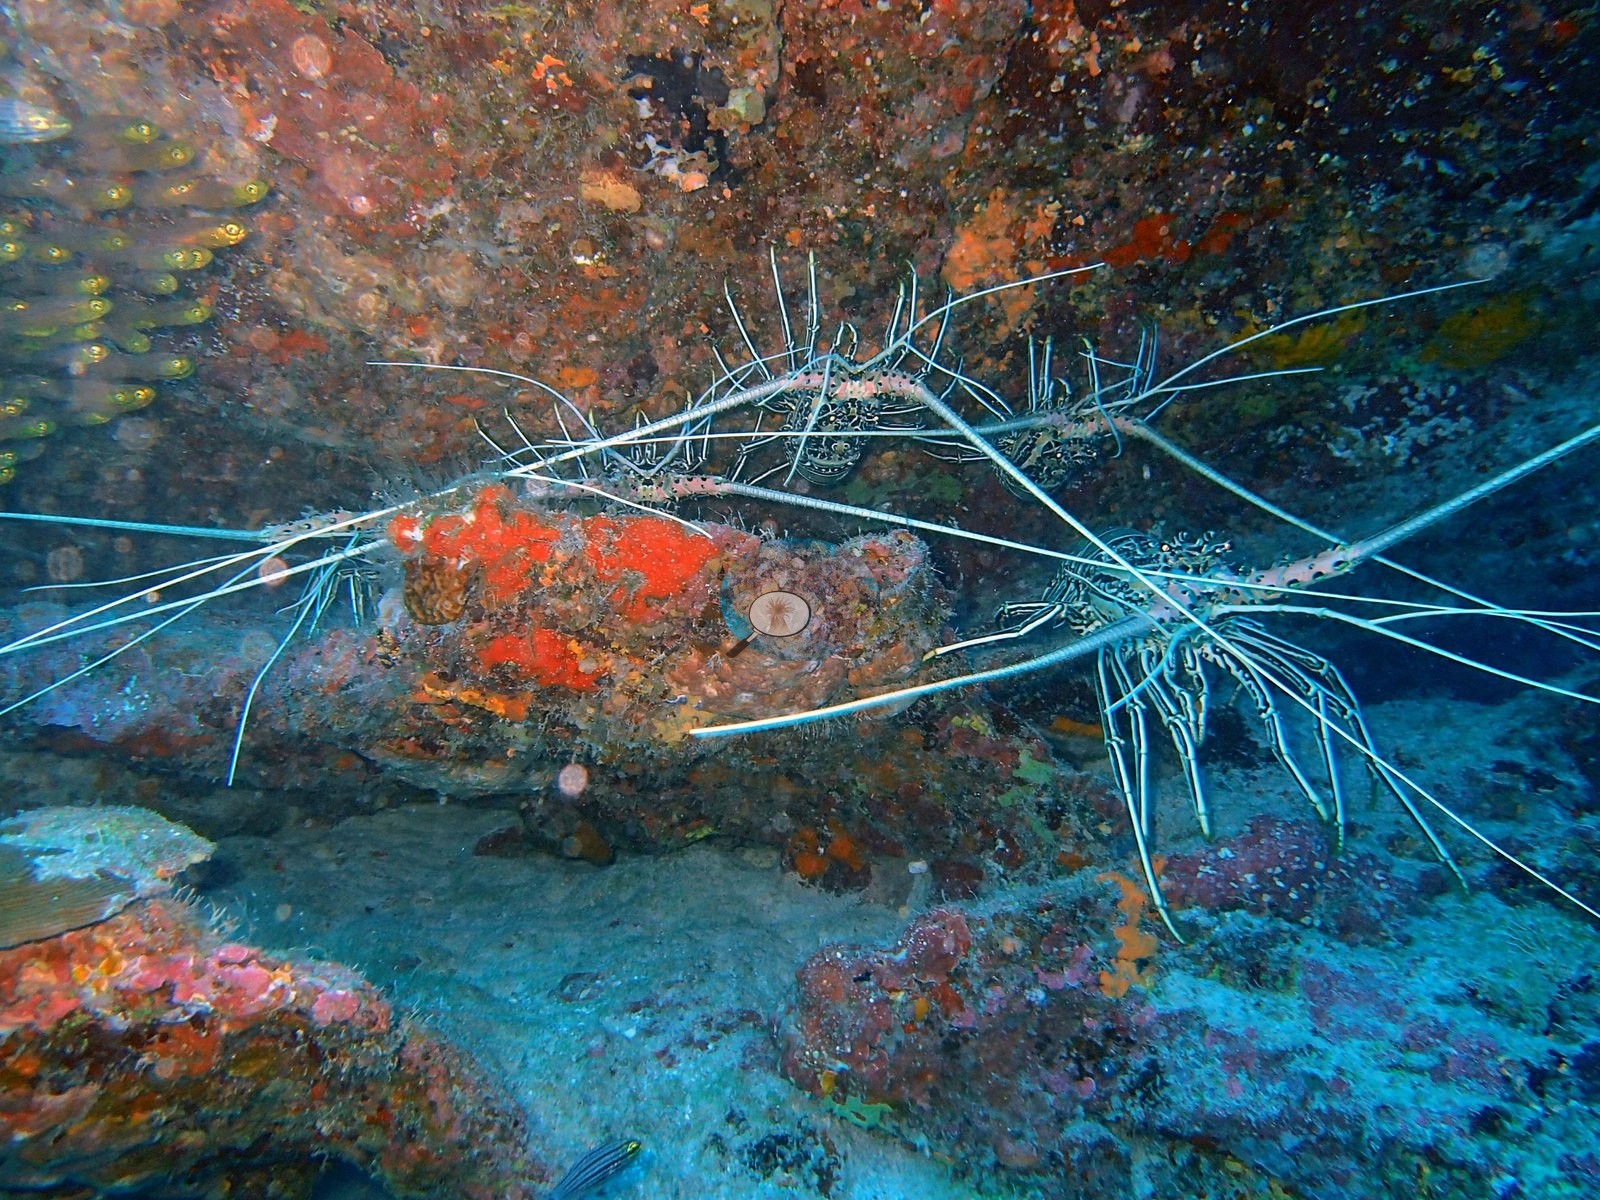
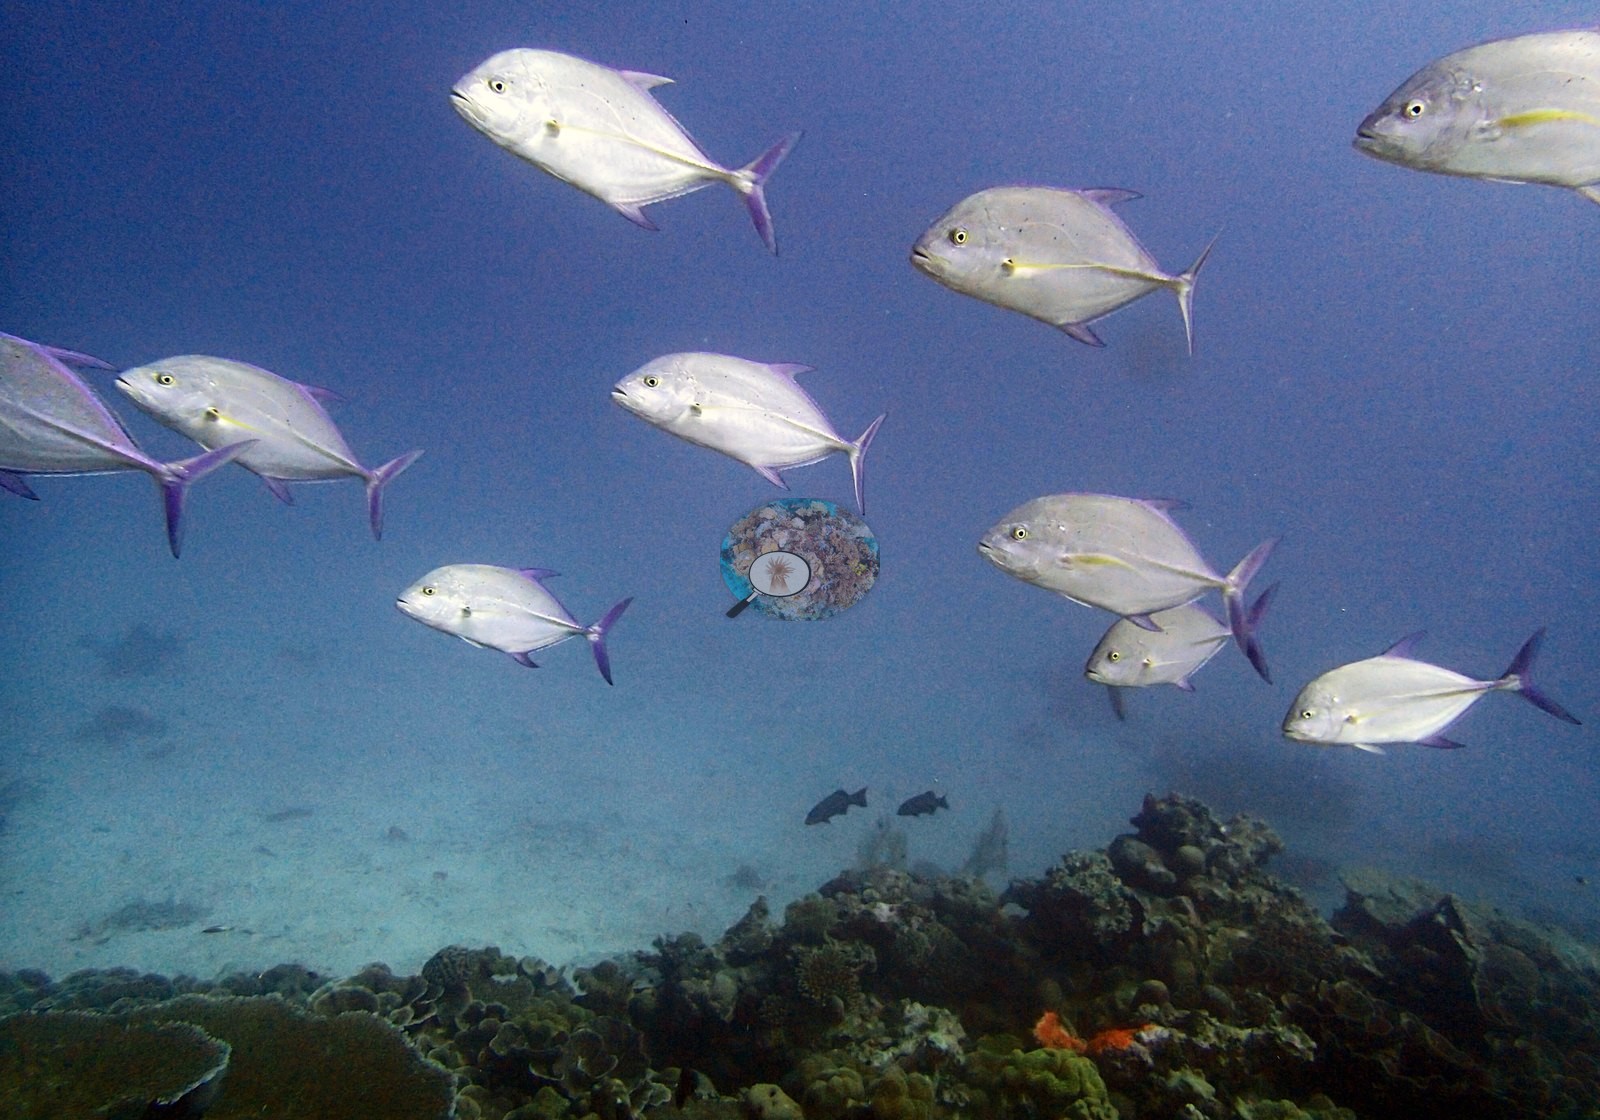
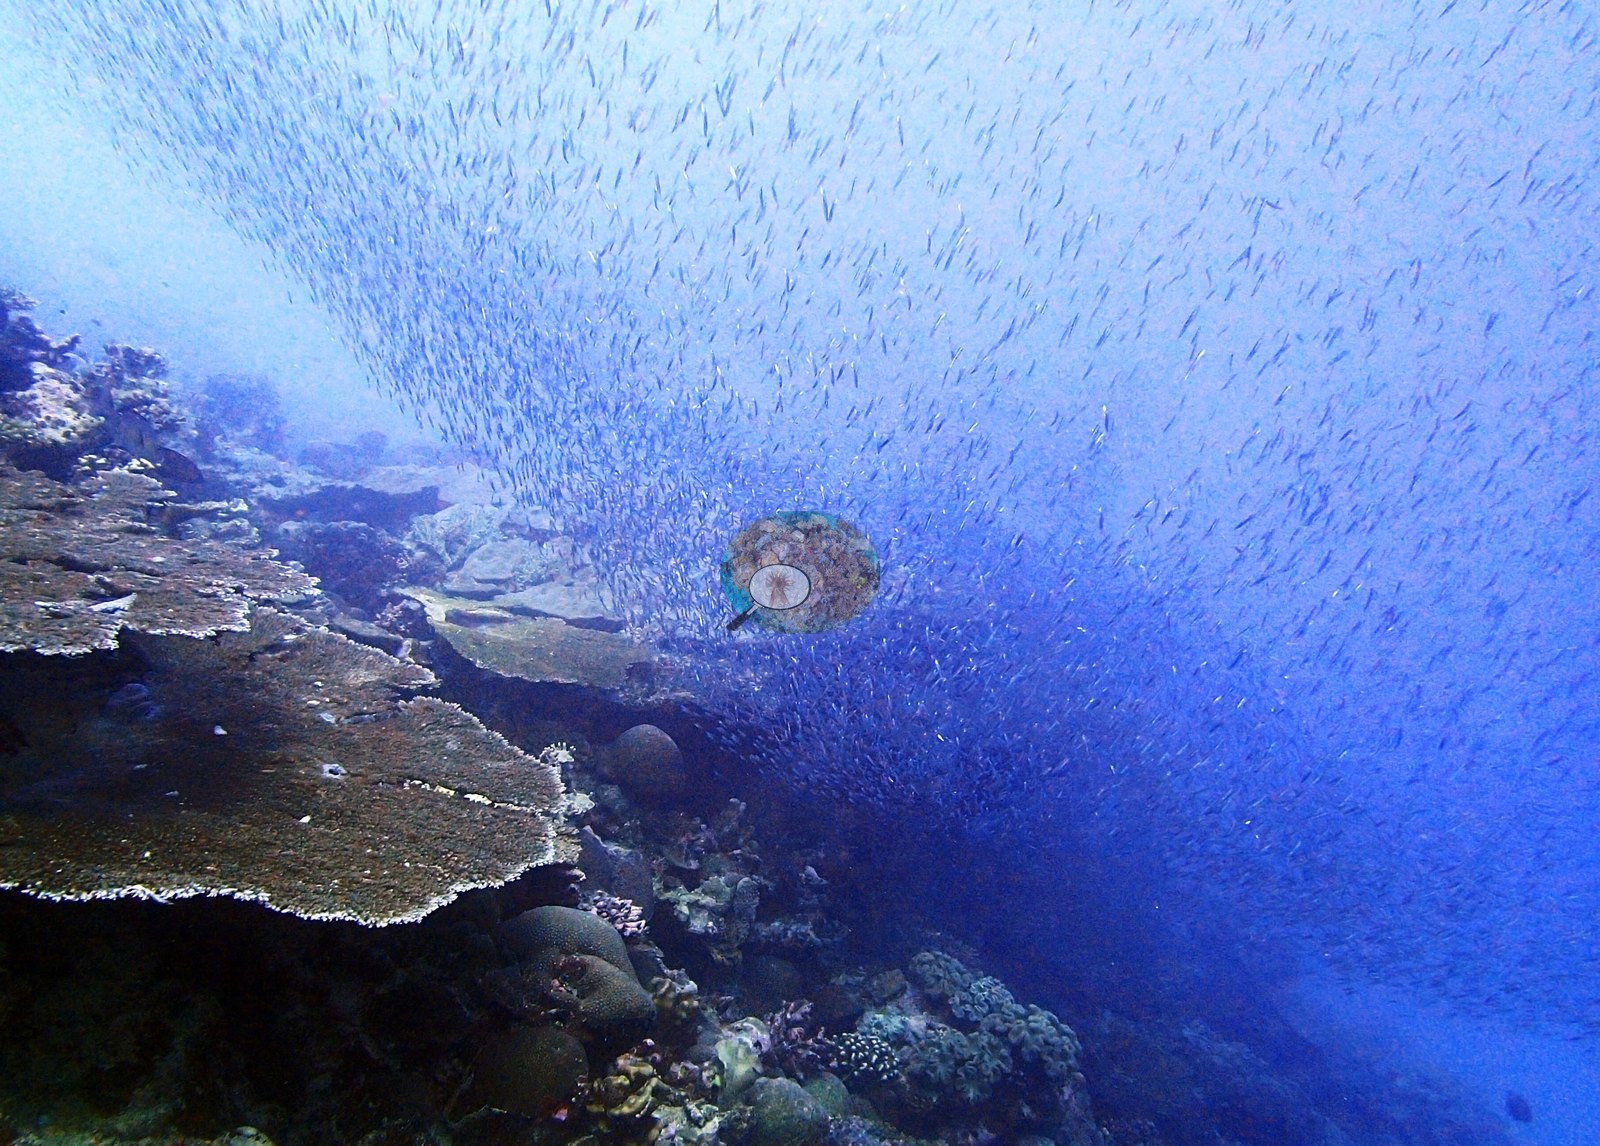
The animal record is exceptional, even though ten of its best frames are absent from the paired audit. P3210419 is a fine close frame of a lionfish compatible with Pterois, fins fully spread against a crimson sponge- and coralline-crusted crevice beside a feather-duster worm crown; species is not asserted. P3210434 and P3210435 show a den containing at least six large spiny lobsters – striped legs, long pale antennae and patterned carapaces, with orange sponges and glassfish around them – compatible with painted spiny lobster (Panulirus versicolor) but retained as a morphological compatibility; P3210430, P3210431 and P3210432 establish the overhang and the approach to it. The water column repeatedly becomes a moving wall of small silversides or baitfish: P3210427–P3210429, P3210432, P3210437, P3210445, P3210449–P3210450 and P3210453–P3210454, thick enough in several frames to obscure the reef behind them. P3210448 and P3210456–P3210457 add close, sharply lit schools of silver and blue-finned trevallies (Caranx-type) over the reef. A red-orange grouper (Cephalopholis-type) sits in the rich reef top of P3210455, and butterflyfishes, damselfishes, anthias, and a banded damselfish appear through P3210483, P3210486 and P3210416. These are conspicuous-fauna observations, not abundance estimates.
Comparisons with other data
No independent survey was made at this exact site; the nearest ones are listed in the table below.
Other notes
Their correct paired pixel-level outputs are unavailable because of basename collisions, so merely changing a site key in the joined table would not reconstruct the analysis.
Image-by-image. Forty-four habitat frames, P3210401 to P3210488. Anderson's folder is named BiTb38-great site-finished, and the imagery earns the annotation – this is the best-quality folder in the batch, mostly well-lit, sharp mid-range, and wide benthic views with good color. That still leaves roughly 28 genuinely informative benthic frames, far more than most sites in the series. No scale bar appears in any frame, so no colony dimension here is measured.
Survey apparatus is visible, which ties the photo folder to the transect archive. A yellow transect tape runs across three frames – P3210402 (across the top), P3210427 (along the bottom) and P3210429 (across mid-frame) – and P3210476 shows a camera housing on its tray standing on the rubble.
CV model comparison
More info
Those are point counts on the photographs; this is a diver swimming a transect. The models and the reference never saw the same thing. ⚠ SITE-LEVEL ONLY. The 2,500 frames were not associated with any transect taken within 200 m of them, so transect-vs-image comparisons are site means, never frames. The transect value is already in the pin `cover` field (109 of 112 pins, sourced to the paper's suppl. S1) and is read from there, never re-imported. The transect is THE coral-cover value for this site and stands alone. The rows below it are a methods comparison only: no computer-vision value is averaged with it, feeds the headline, or carries over to the site's cover figure (Anderson, 2026-09-22).| Method | Hard-coral cover (%) |
|---|---|
| Transect (published) | 56.0 |
| CoralNet | 33.7 |
| In-house DINOv3 | 28.1 |
| CoralSCOP edited | 31.5 |
| Claude | 26.3 |
Independent surveys nearby
| Agency / program | Year(s) | Stations / distance | Link |
|---|---|---|---|
| Sheppard et al. (2008) | 2006 | 1 station, 3.49 km | Records ↓ |
| Spalding et al. 2025 (Chagos 2024 bleaching report) | 2024 | 1 station, 2.54 km | Records ↓ |
| XL Catlin Seaview Survey | 2015 | 1 station, 2.45 km | Records ↓ |
 Dr. Coral (CRD)Year-average (no detectable trend)
Within 5 km, 3 independent survey stations recorded hard coral cover in 7 records between 2006 and 2024. One survey since 2021 recorded 50%. This site's own estimate (56%) is indistinguishable from the recent value (50%): the 6.0-point gap is inside the ±7 percentage-point noise between methods; the methods differ, so the comparison is context, not a like-for-like test.
Collected by other programs using different methods (the XL Catlin Seaview Survey uses photo-transects with automated image annotation), so these are context for the figures above, not a like-for-like comparison. Where a station was surveyed more than once the range is shown. Station names are not dive-site names.
| Agency | Site / location | Date | Hard coral cover (%) | Distance | Link |
|---|---|---|---|---|---|
| Sheppard et al. (2008) | Great Chagos Bank | 2006 | 41% (5 surveys) | 3.49 km | HeatCRD database |
| XL Catlin Seaview Survey | transect 36004 | 2015 | 21% | 2.45 km | — |
| Spalding et al. 2025 (Chagos 2024 bleaching report) | Great Chagos Bank - Middle Brother, lagoon (E aspect, 1-3 m) | 2024 | 50% | 2.54 km | — |
Data & links
- Read the full site report ↗
- Download benthic survey data (CSV) ↗
- Download all LOF-GRE data (933 sites) ↗
- CoralNet image repository for this region ↗
- HeatCRD database ↗
- (reference) ↗
- Photo portfolio ↗
- Coral Reef Diagnostics page for this area ↗
All images from Coral Reef Diagnostics. Data are from Coral Reef Diagnostics and the organizations named in the data-sources table above.
© Coral Reef Diagnostics.
References
- Mayfield AB, Dempsey AC (2026). Using tourist diver images to estimate coral cover and bleaching prevalence in a remote Indian Ocean coral reef system. Oceans 7(1):1. PDF
- Sheppard C, Harris A, Sheppard A (2008). Archipelago-wide coral recovery patterns since 1998 in the Chagos Archipelago, central Indian Ocean. Marine Ecology Progress Series 362:109-117. PDF
- Spalding M, Bourasseau M, et al. (2025). Coral bleaching and mortality in the Chagos Archipelago, 2024. British Indian Ocean Territory Administration report (gray literature). PDF