
Part of the regional summaries: Chagos Archipelago - Great Chagos Bank West / Brothers / Eagle and Chagos Archipelago
More info
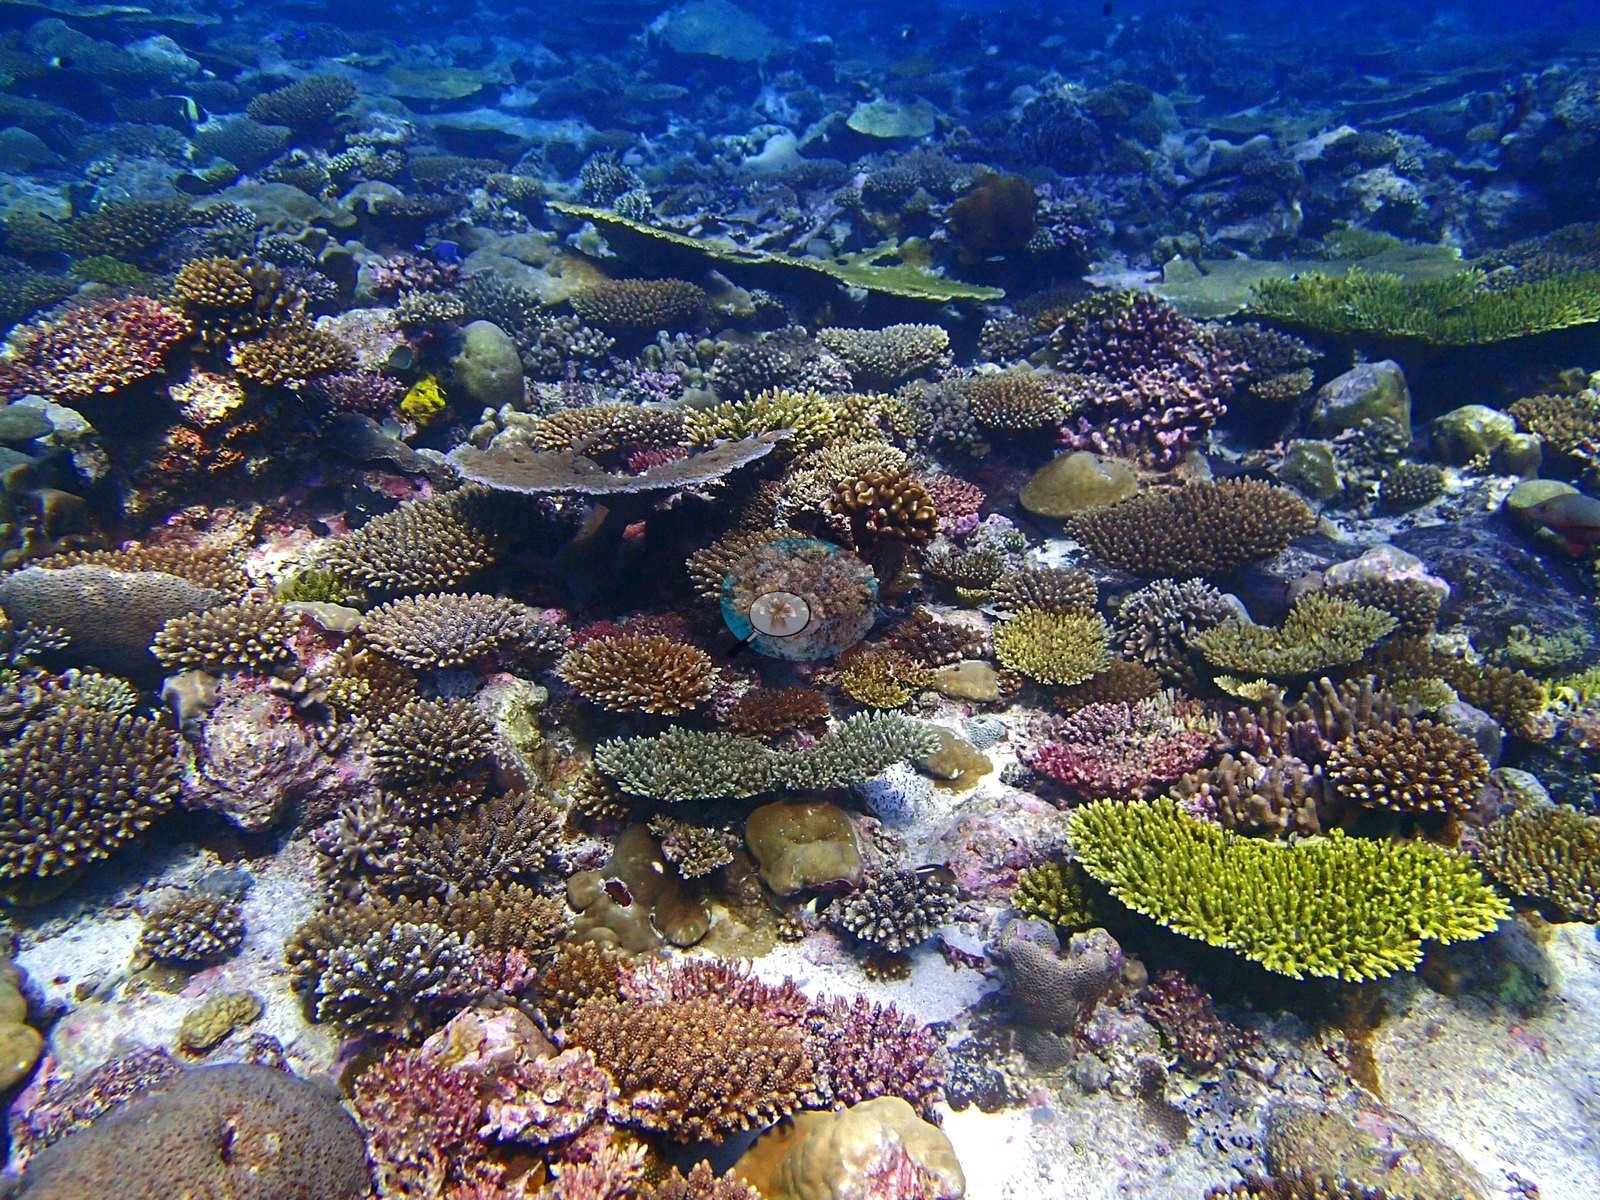
Chagos (NOAA CRW virtual station)A 38.8%-cover Great Chagos Bank reef with a sharp change in character with depth: Acropora-dominated shallows (one transect hit 79% coral) give way to a more open, silty, Porites-led deeper zone where Acropora nearly disappears. Surveyed on the Living Oceans Foundation's Global Reef Expedition.
Three independent survey stations shown with the program’s logo — click one to see how far it is from this site.
Thirteen other CRD dive sites within 5 km shown in orange — click a marker to open its page.
🗺 Detailed map of the Global Reef Expedition dive sites, Three Brothers, Chagos (Khaled bin Sultan Living Oceans Foundation; opens in a new window)
Site description
General benthic features
In the opposite direction, Porites rises from 5.4% in D1 and 6.31% in D2 to 12.33% in D4. The deepest stratum is also more open: barren substrate rises to 14.87% and sediment-laden turf to 10.6%, against 1–2.4% barren in D1–D3. Thus “38.8% coral” averages an Acropora-dominated shallow/mid-depth terrace and a more Porites-led, sediment-retaining deeper surface. D1 and D4 rest on one and three transects respectively, so the direction is strong but the endpoints should not be over-generalised, and the four-stratum structure should be retained whenever the single 38.77% mean is interpreted.
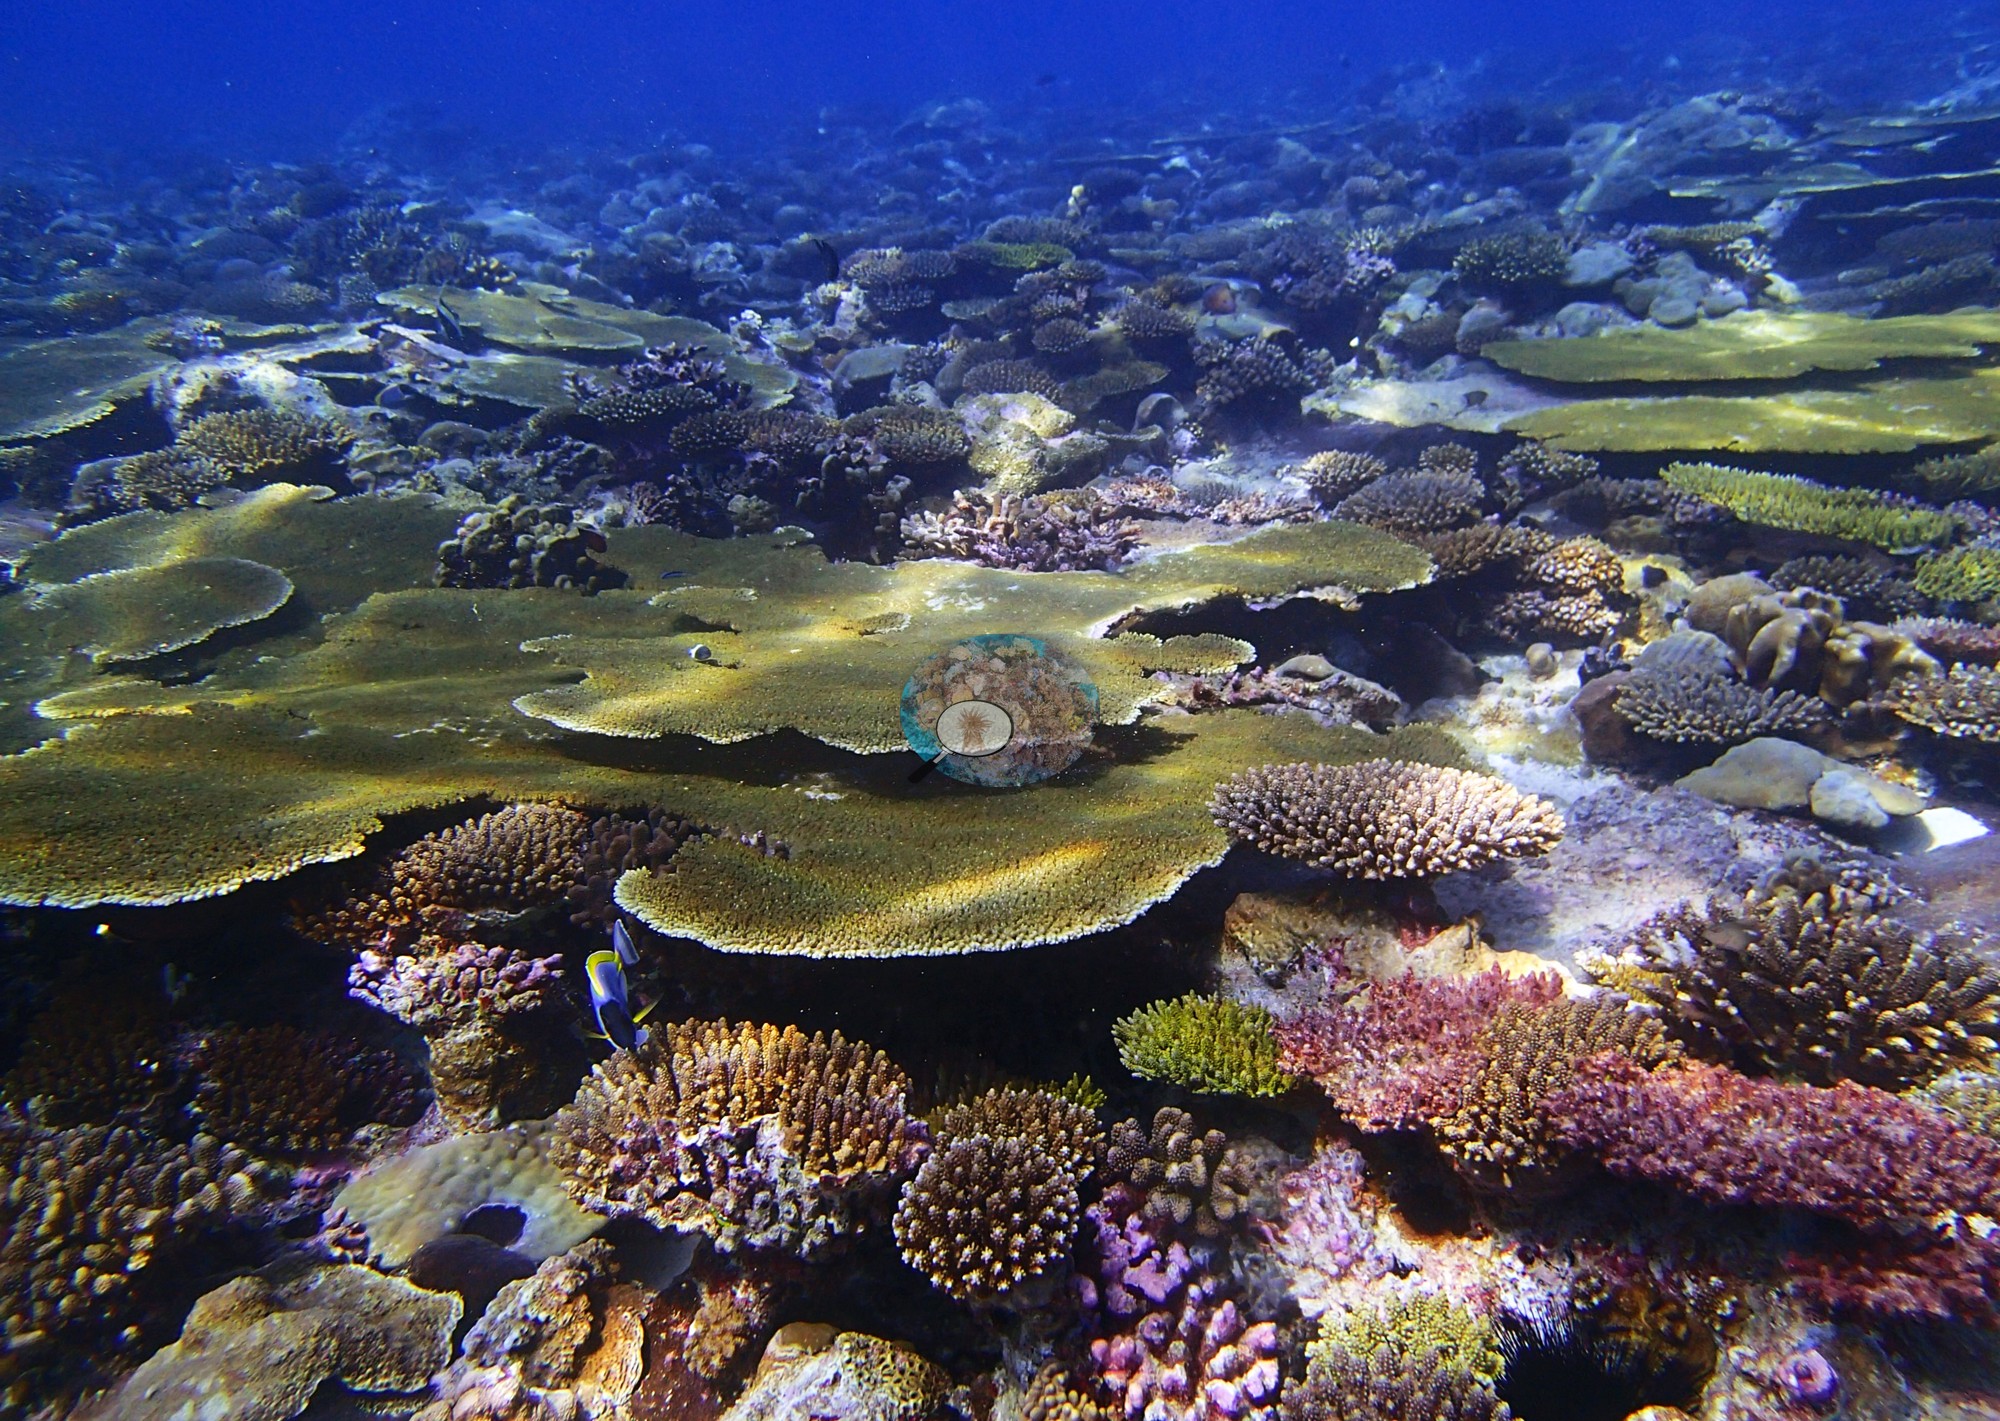
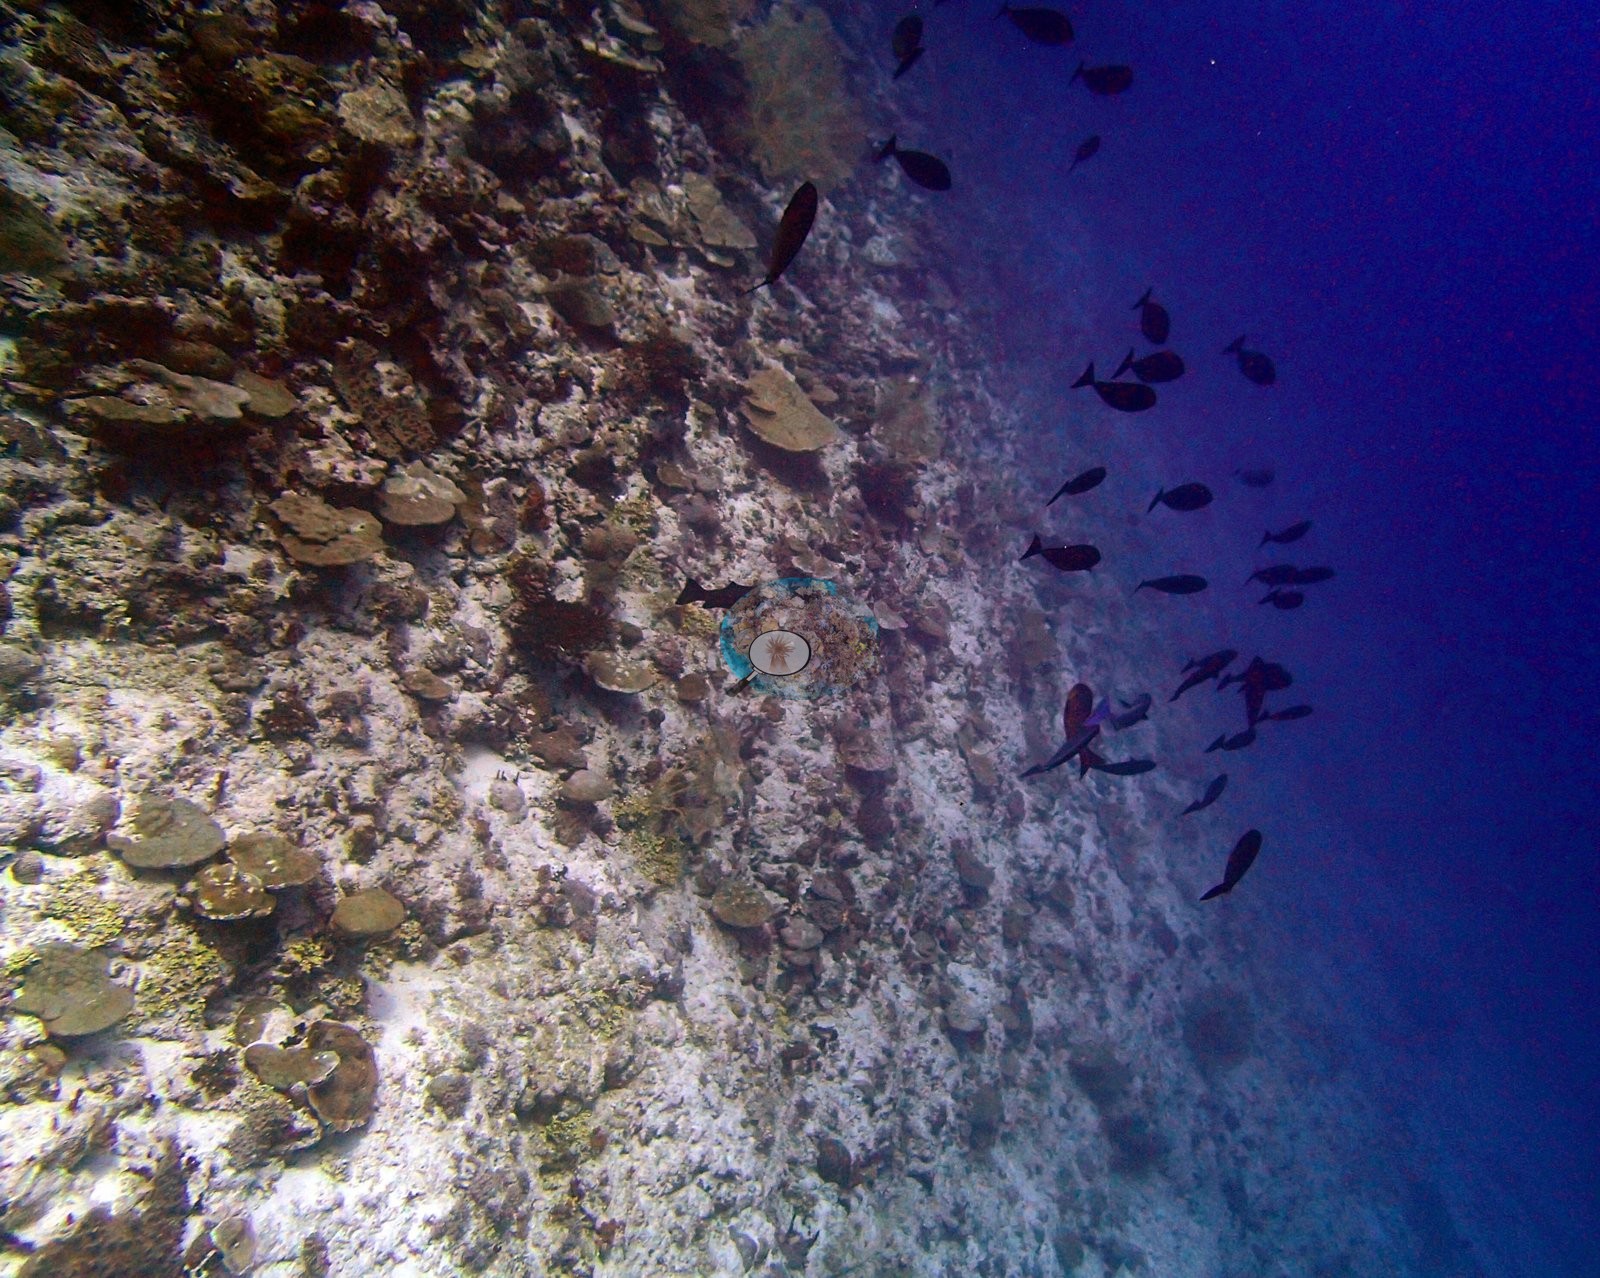
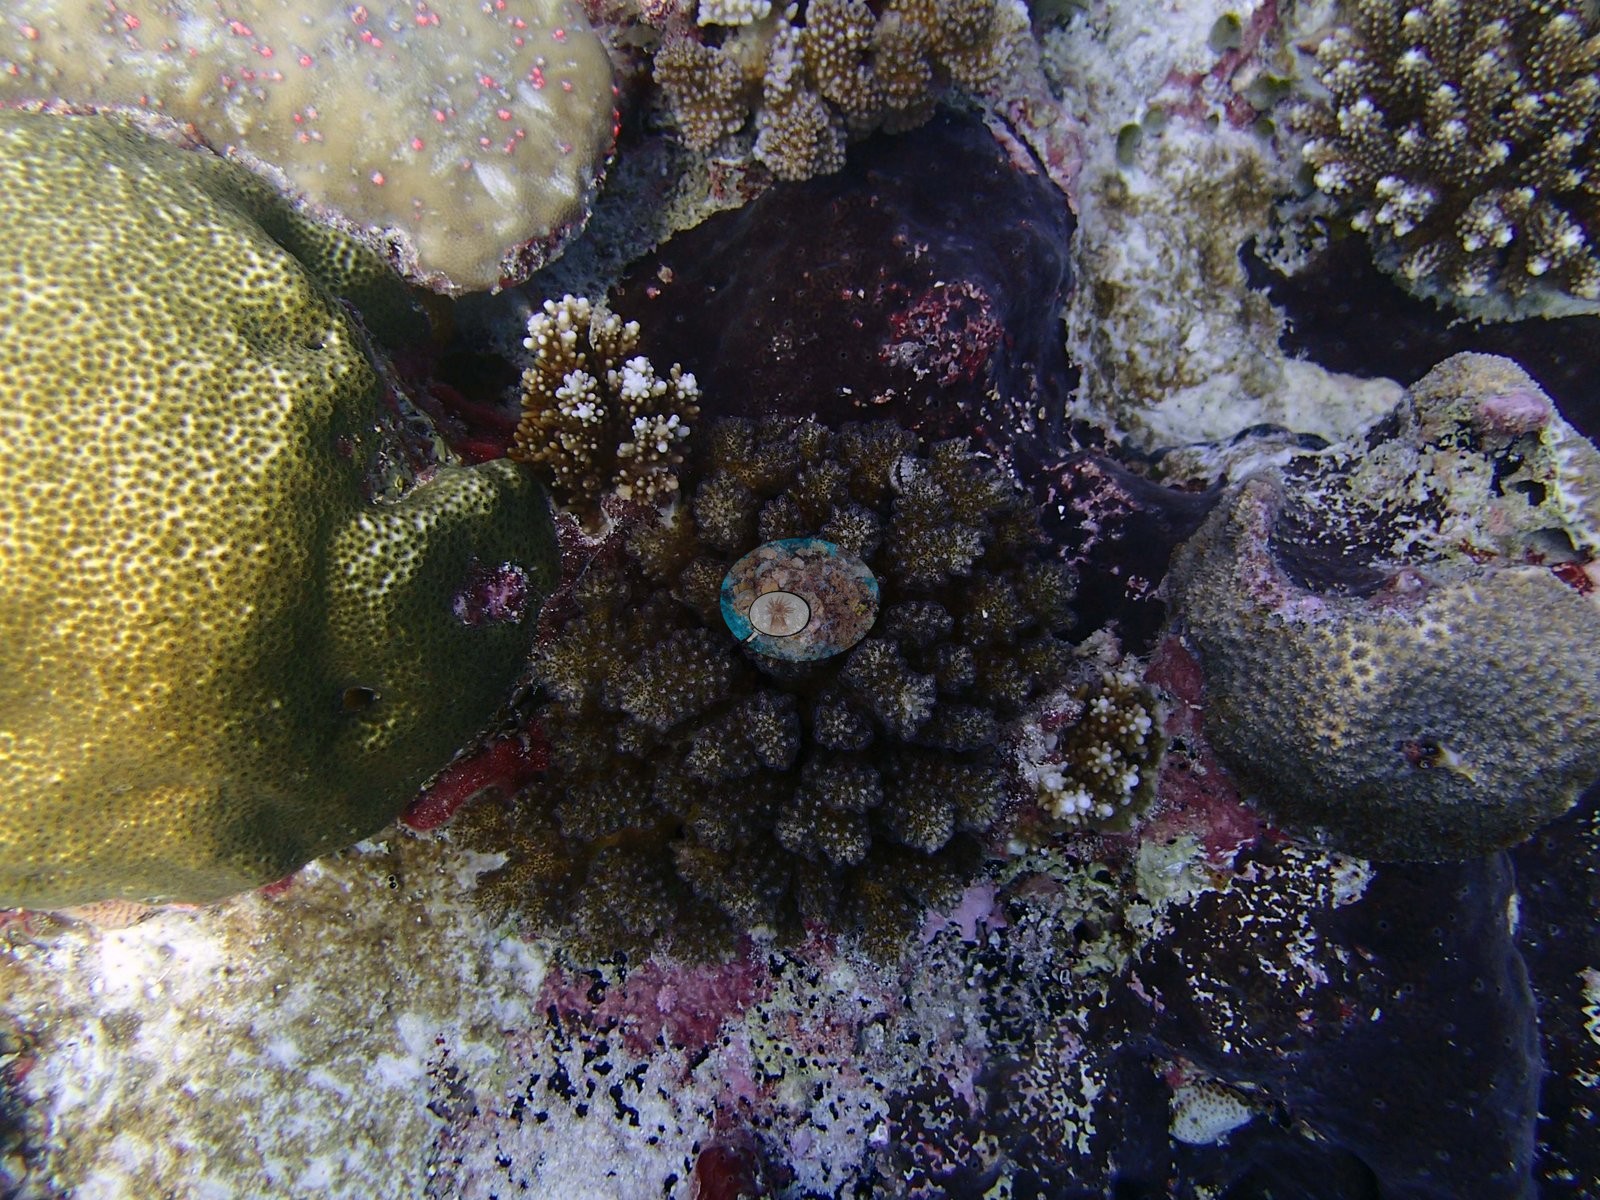
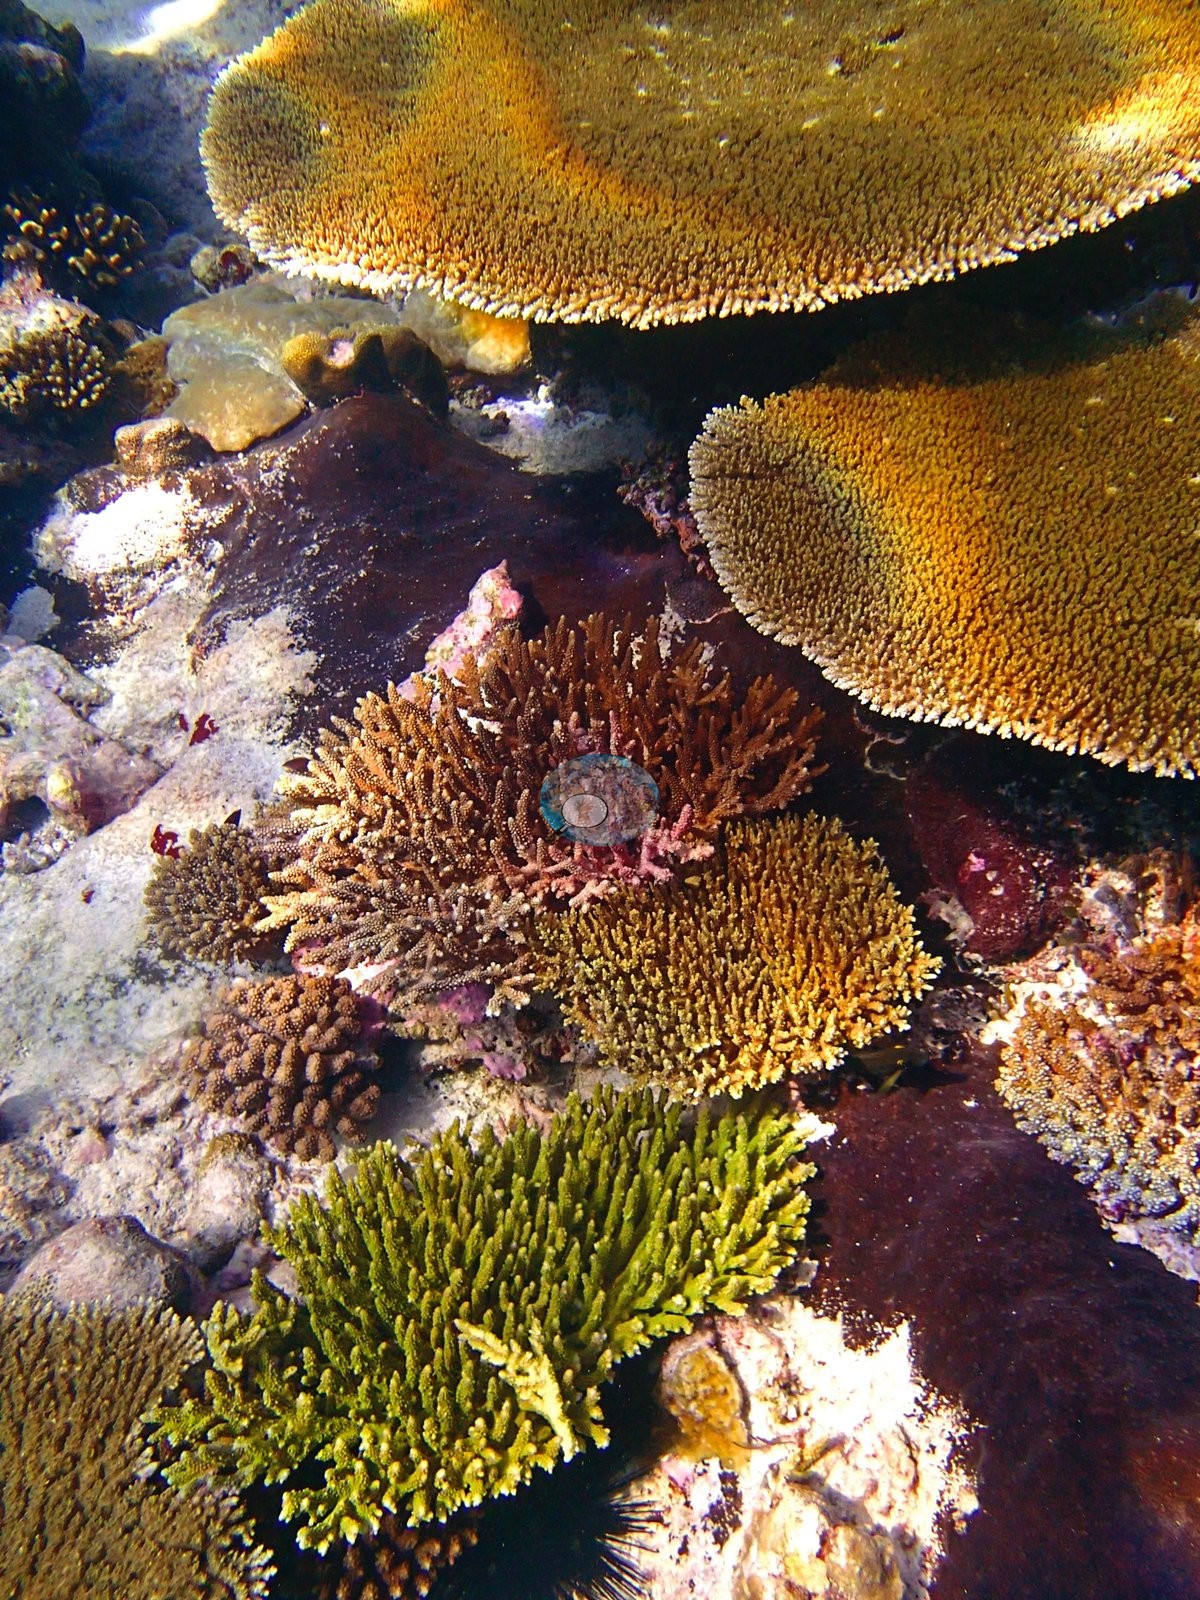
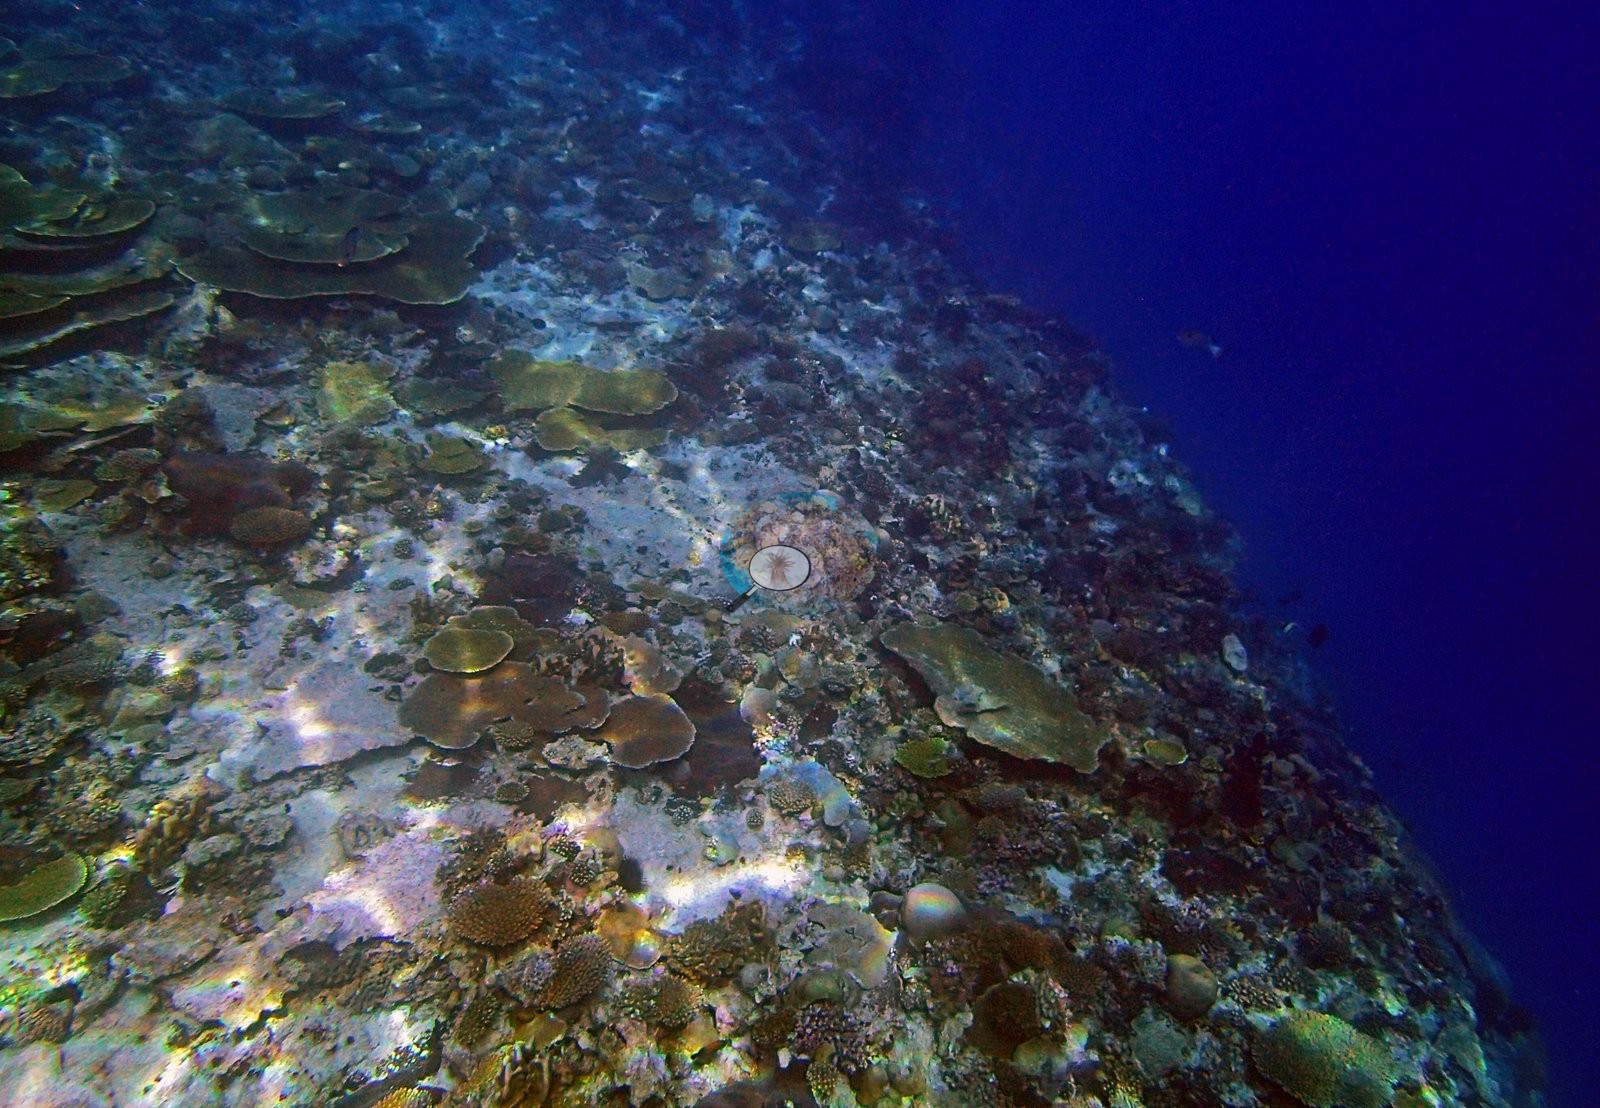
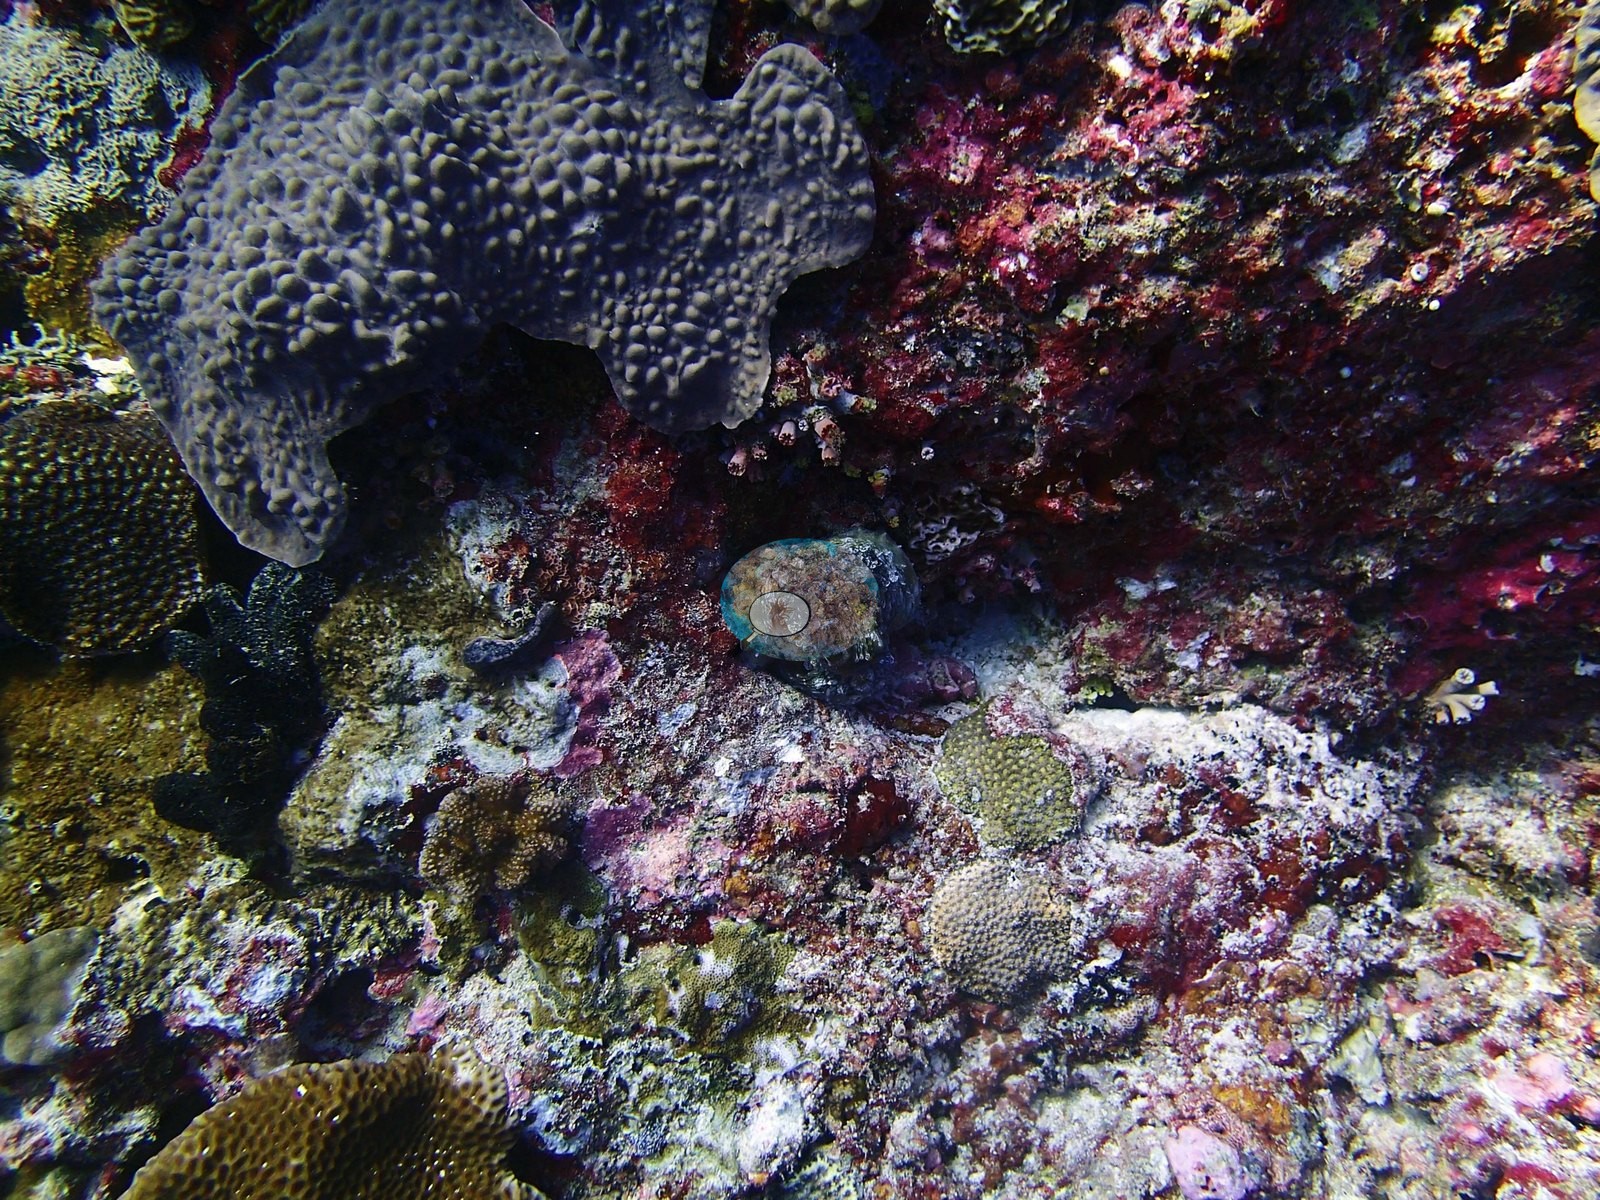
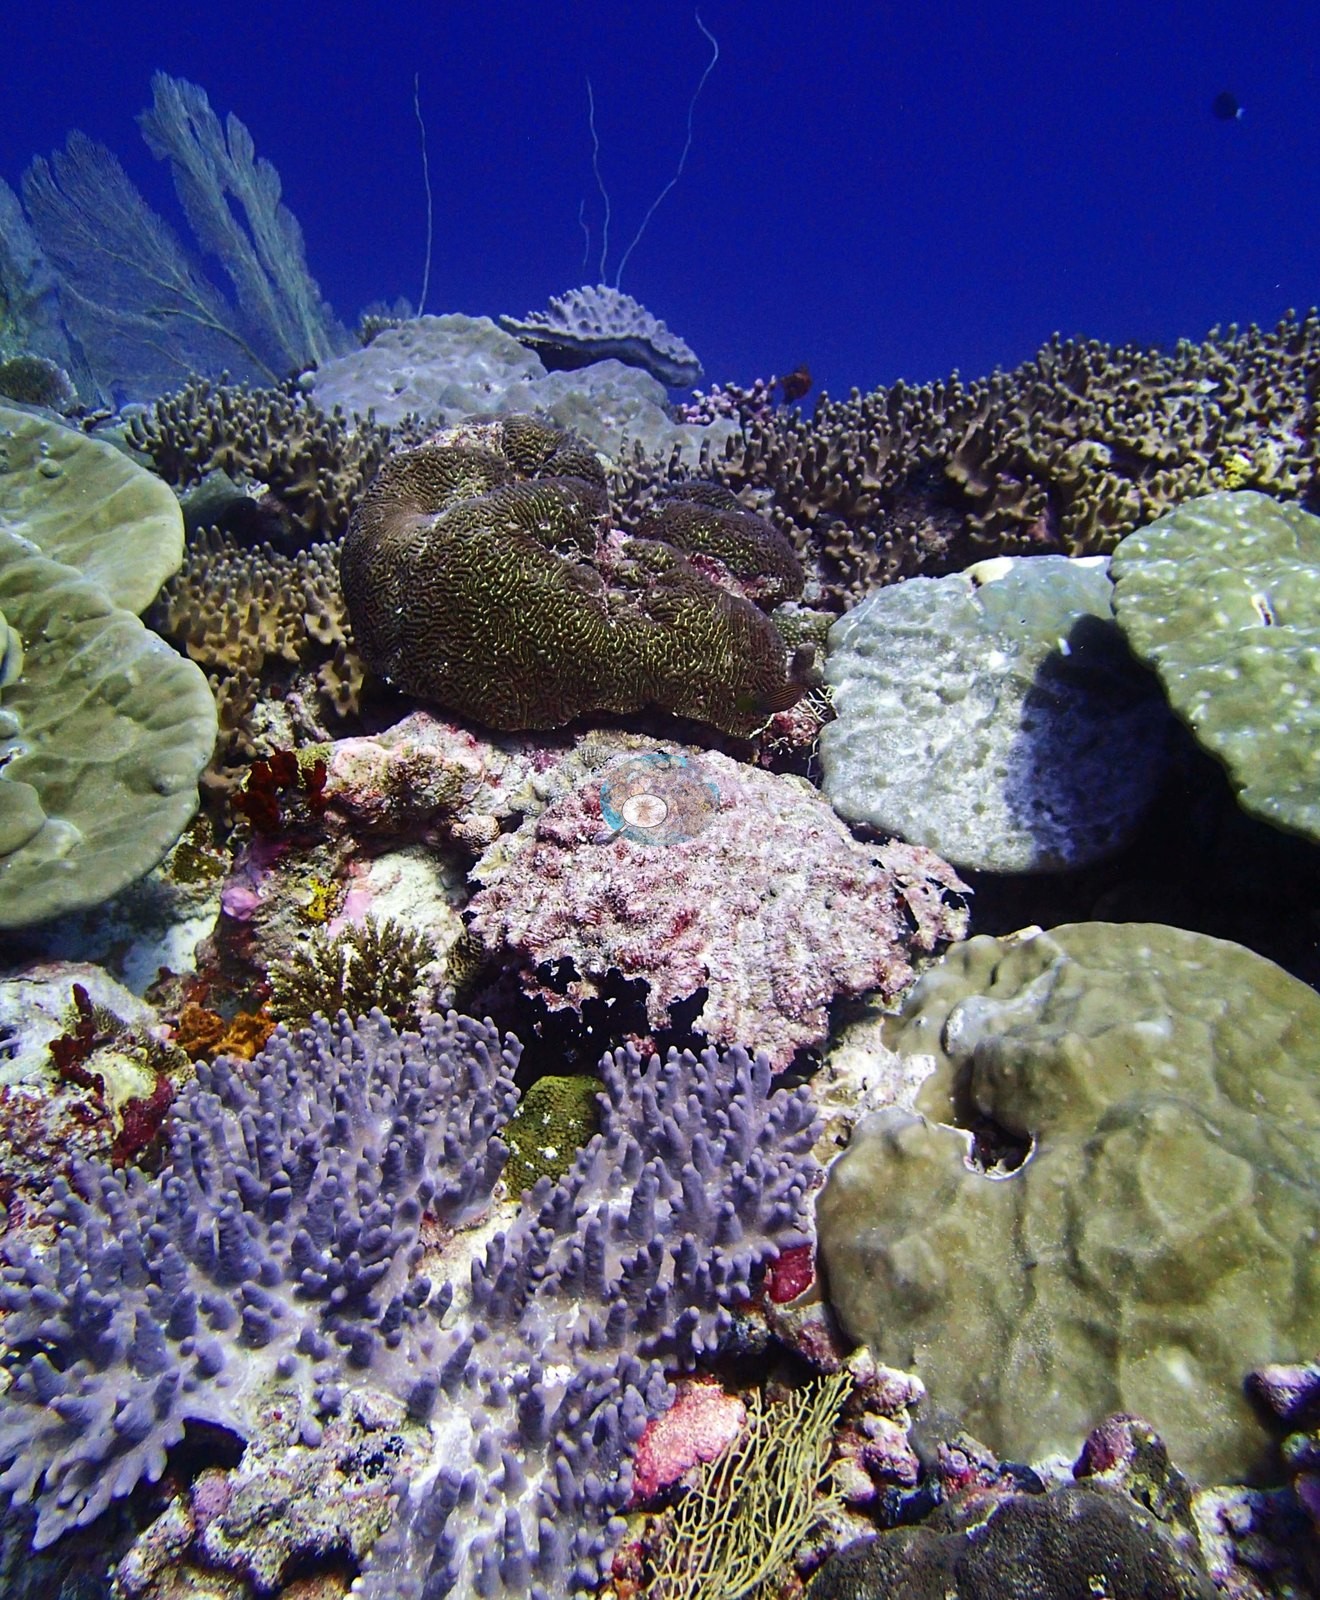
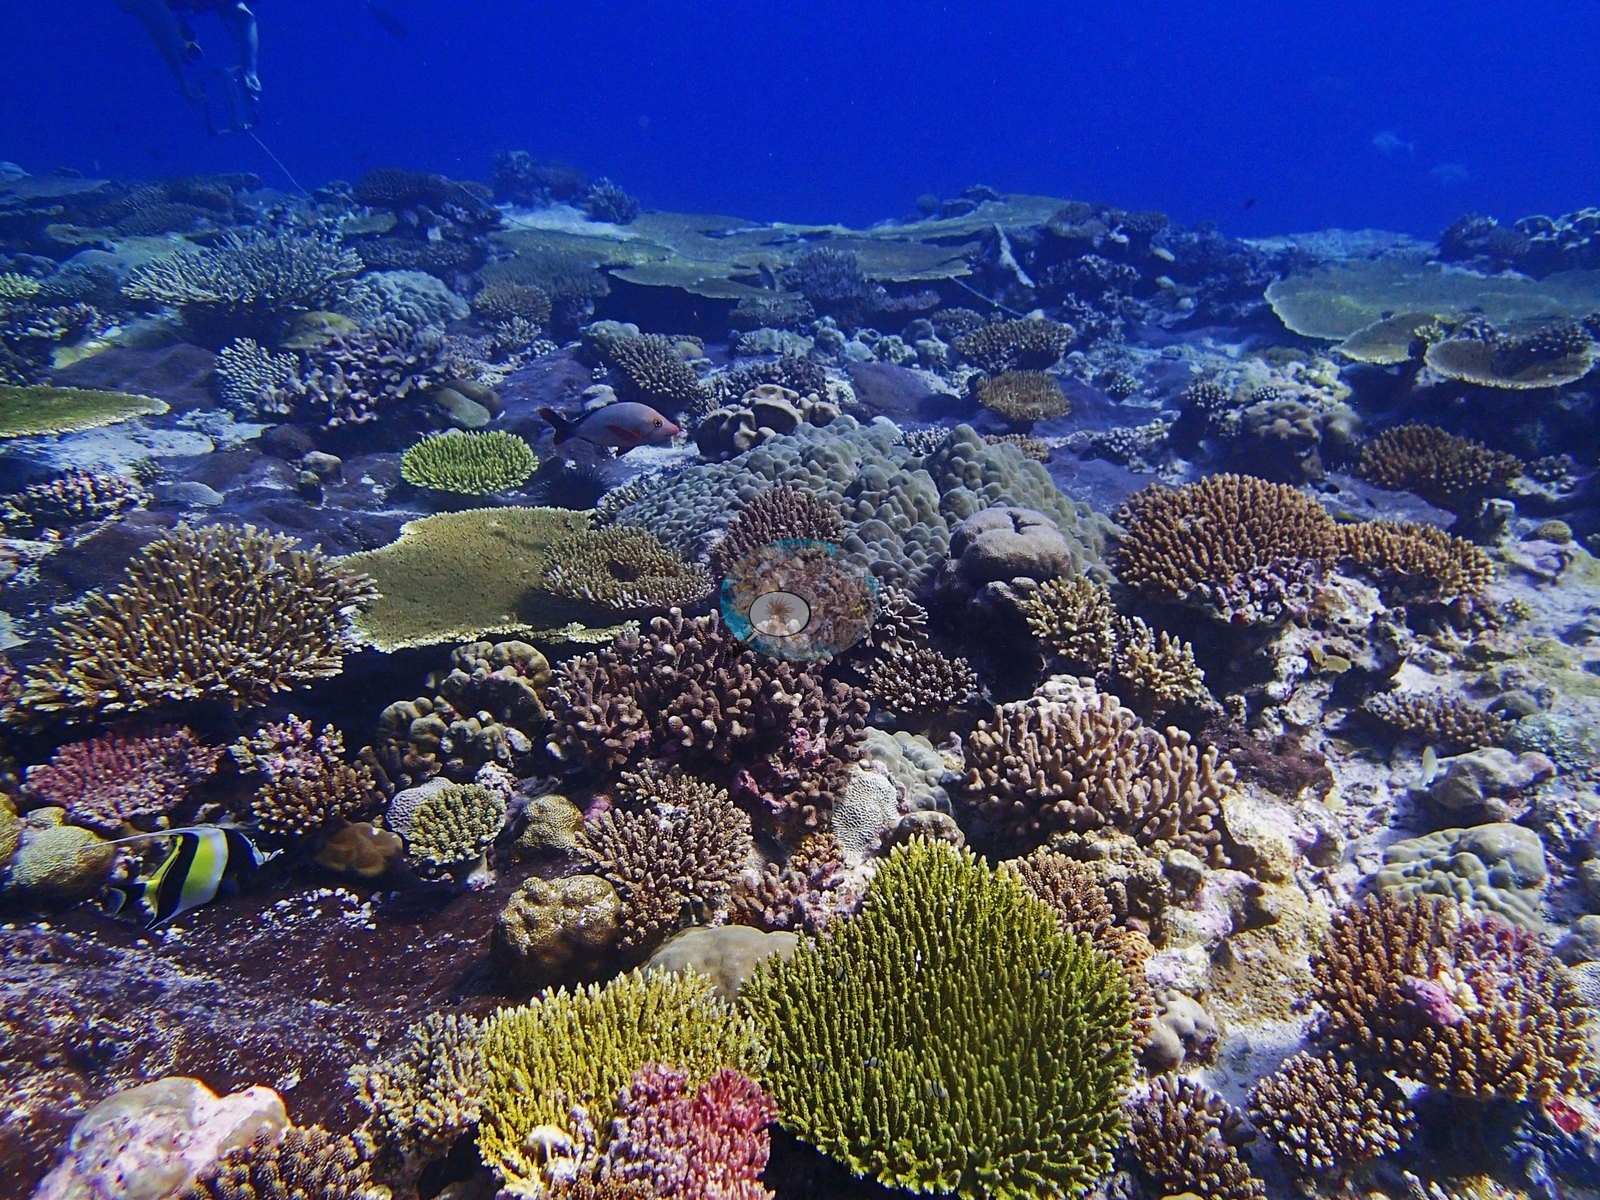
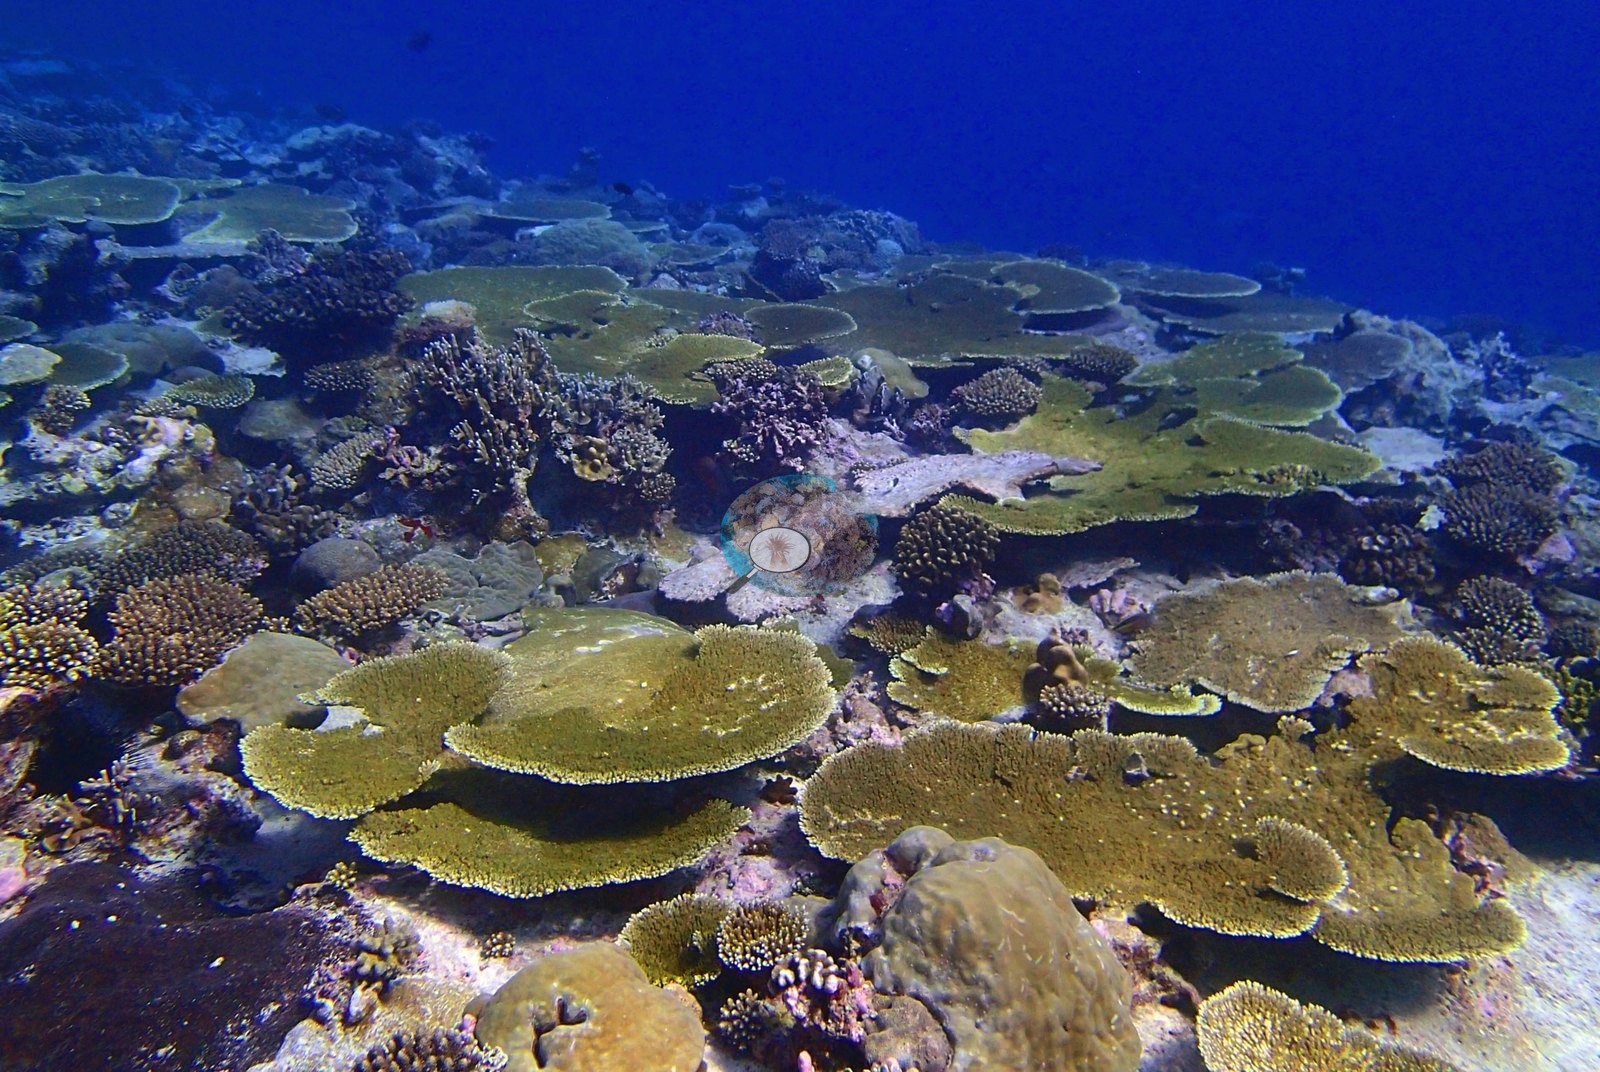
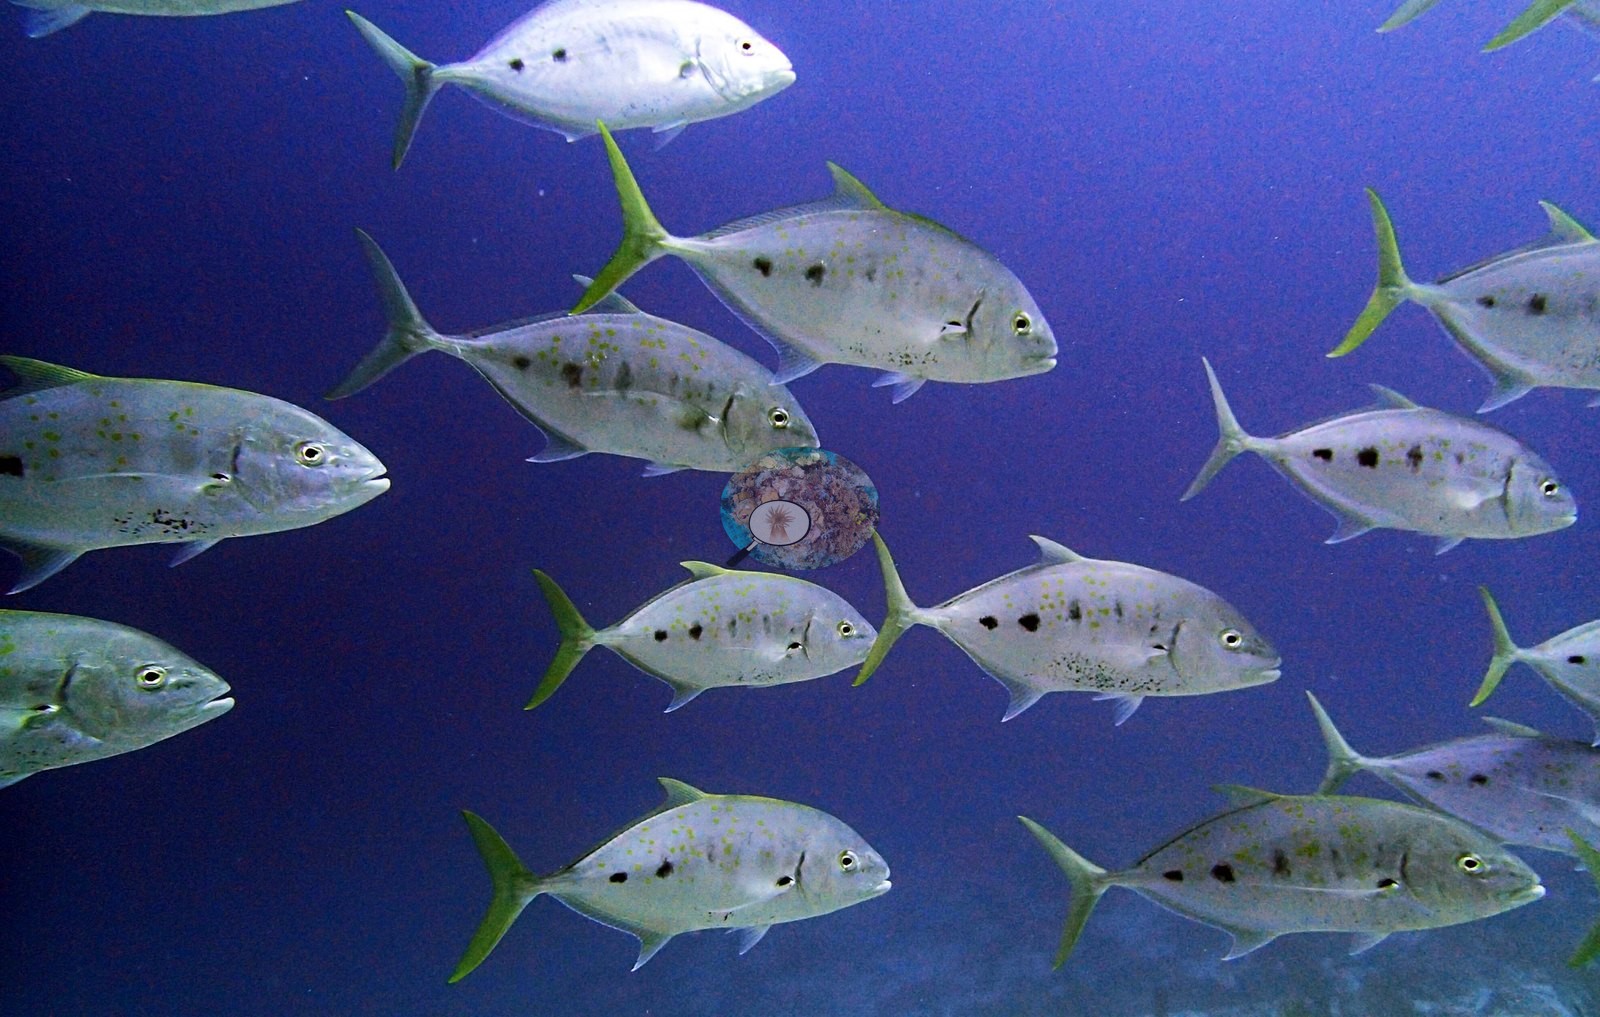
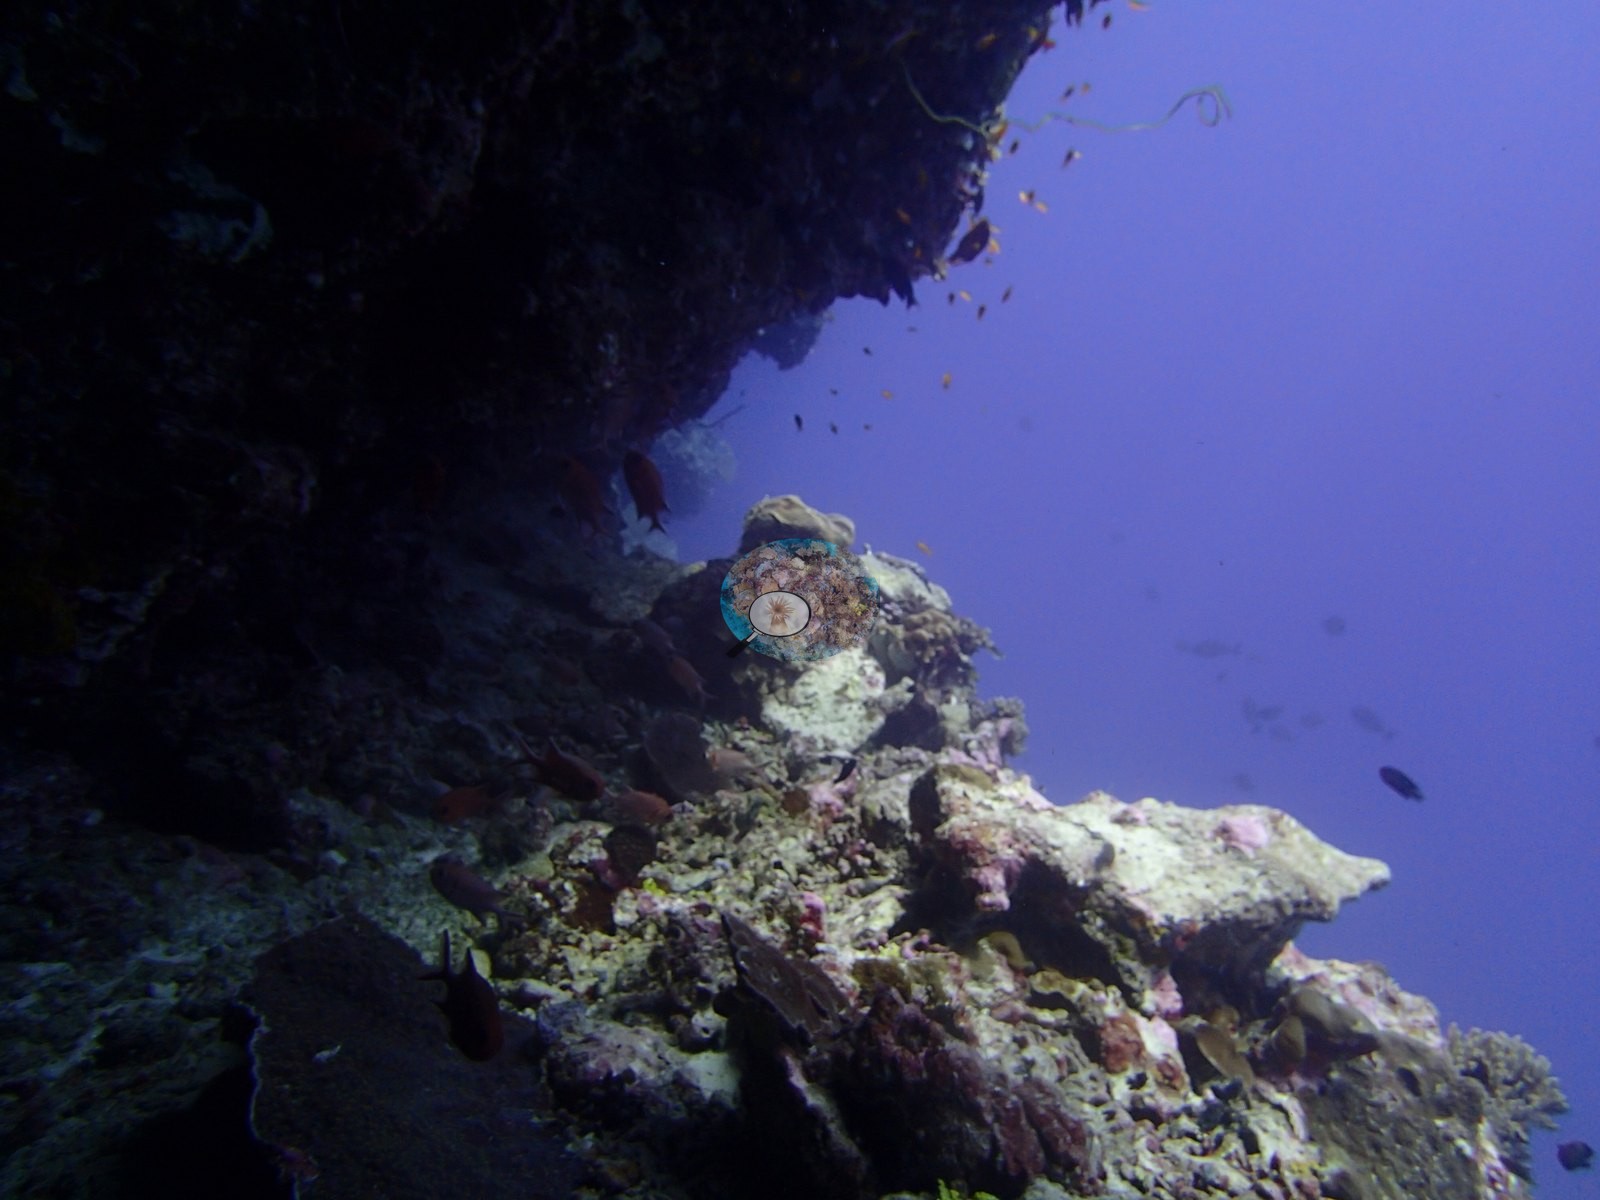
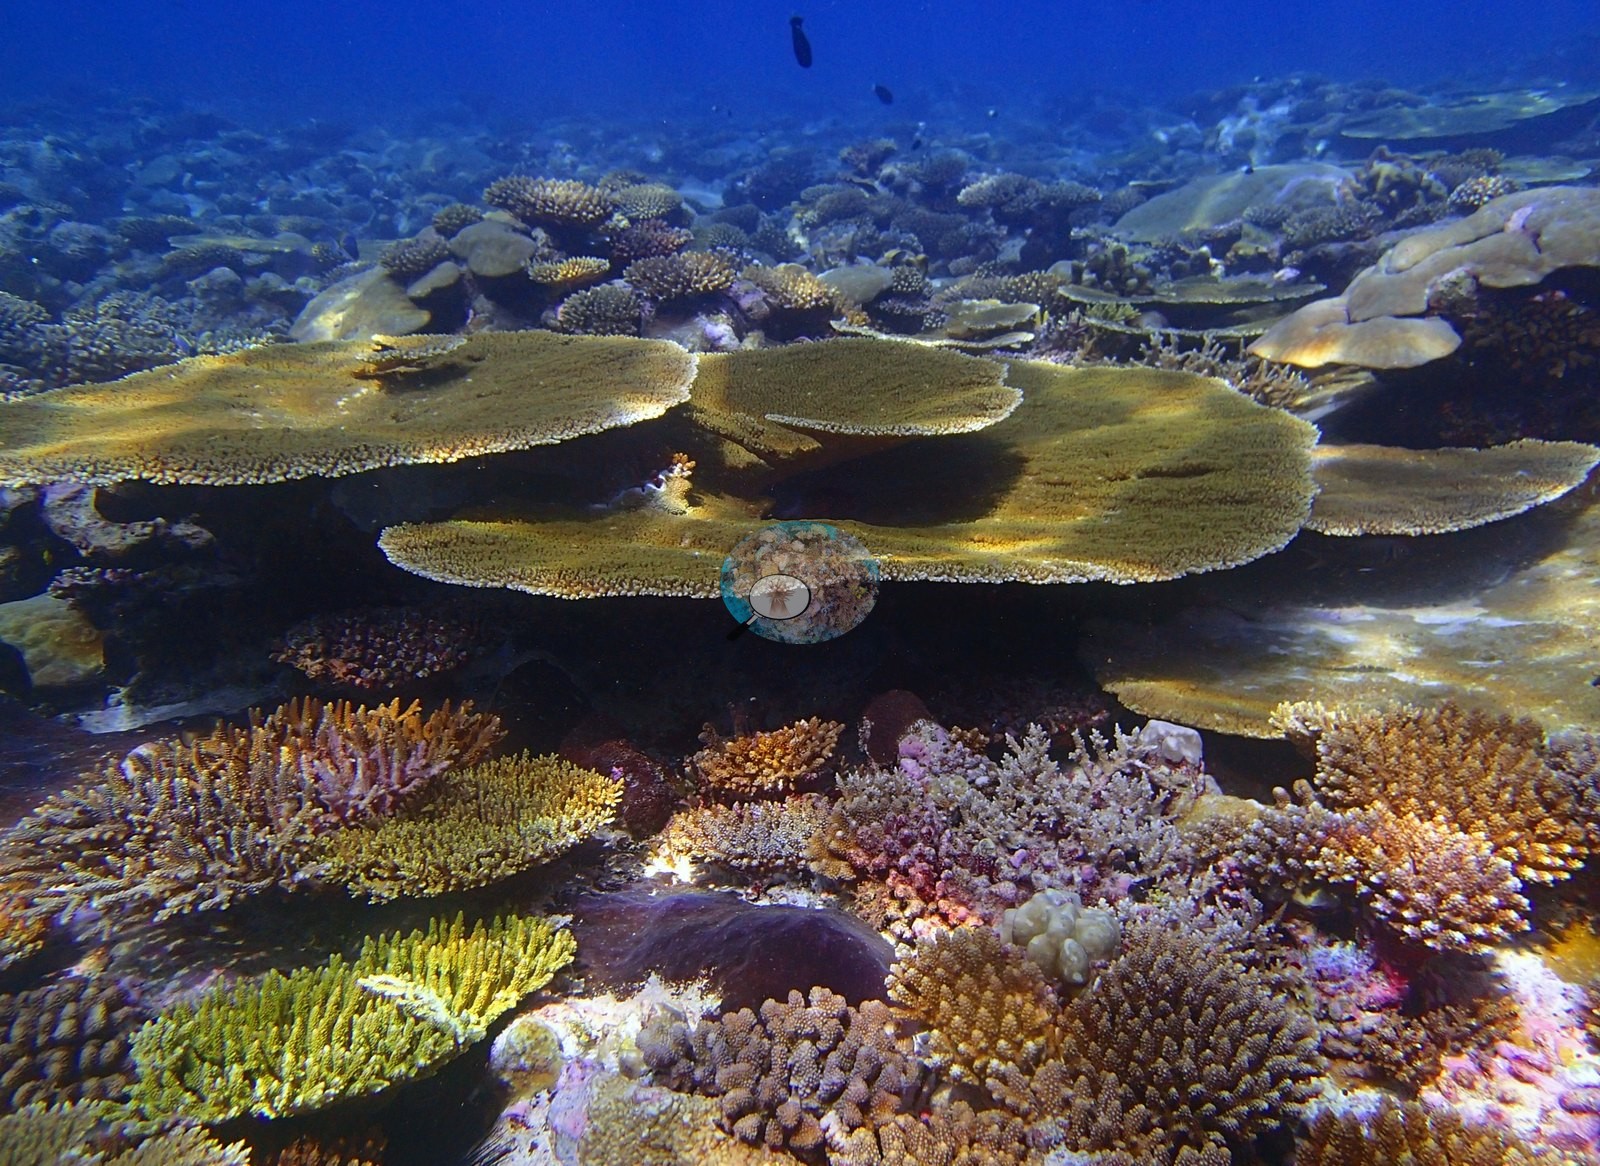
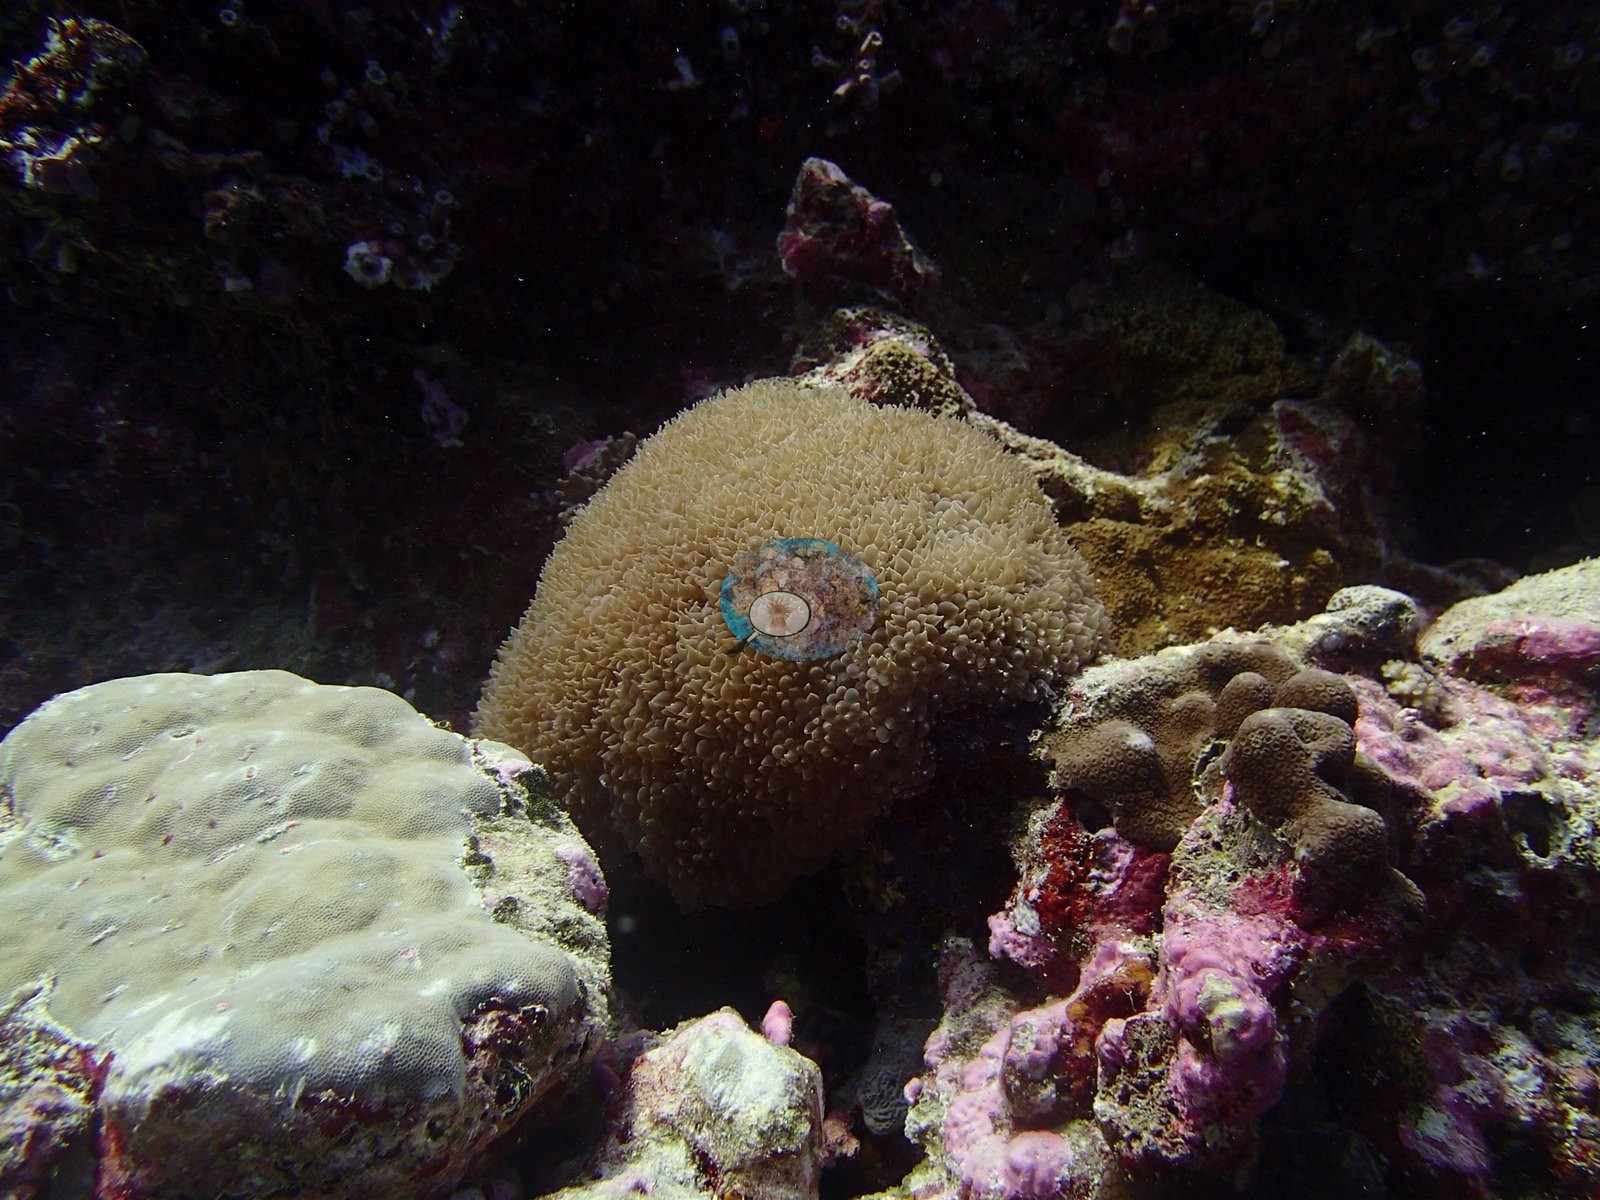
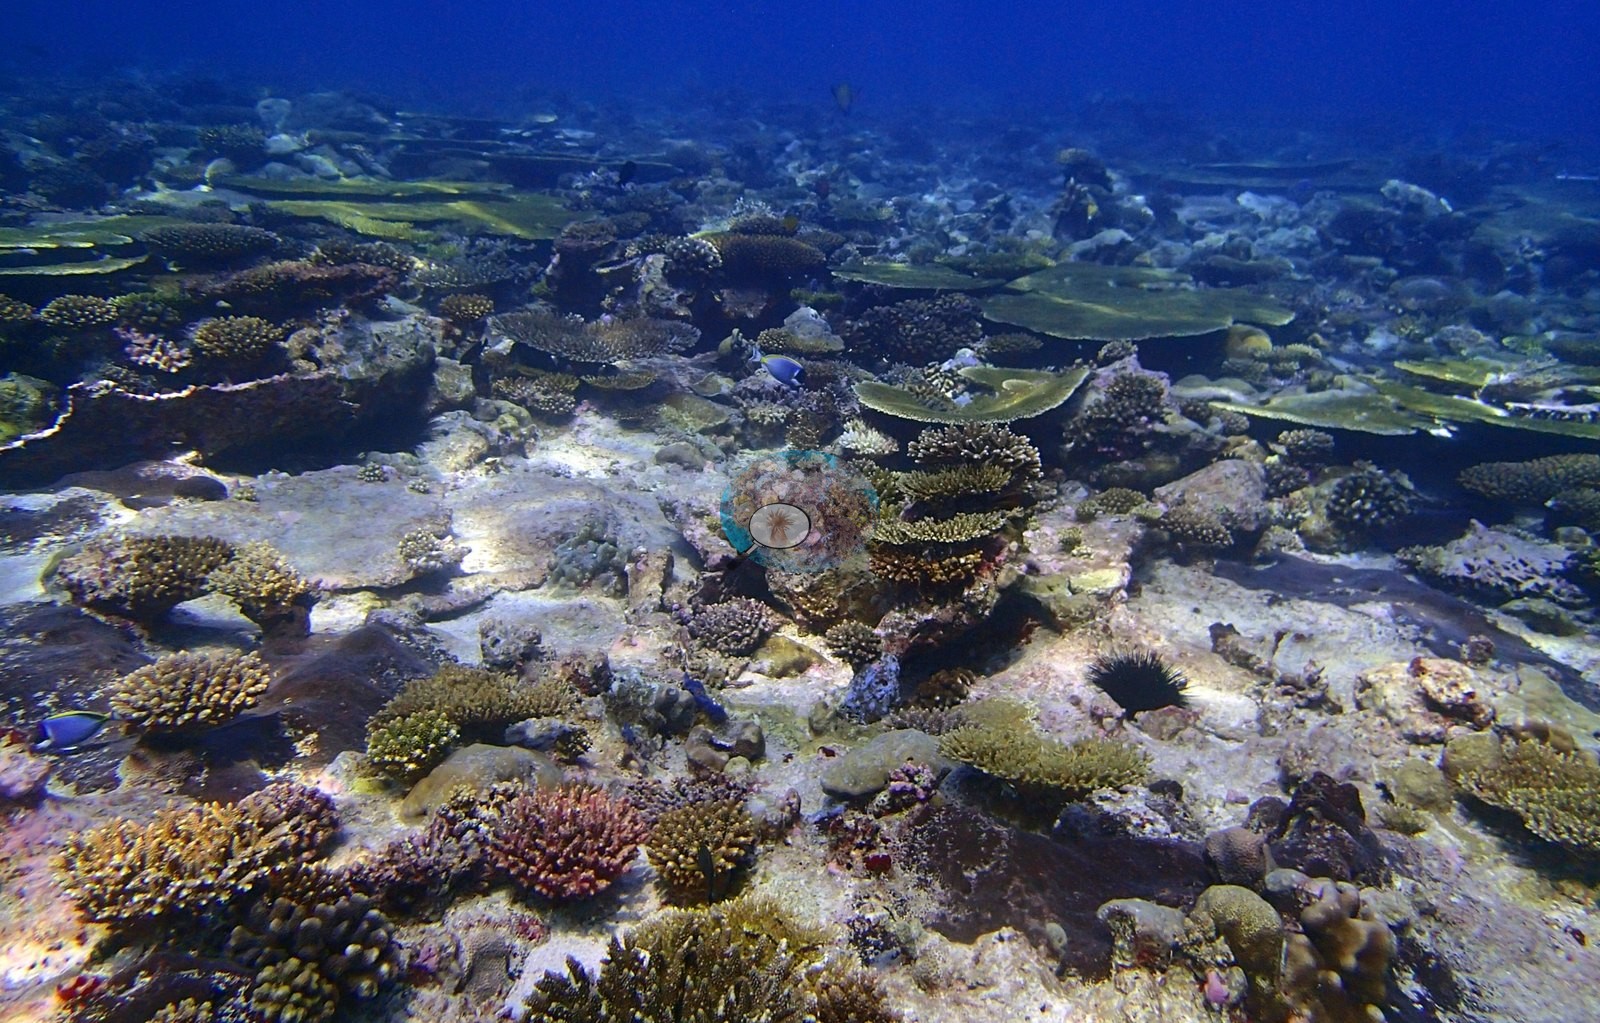
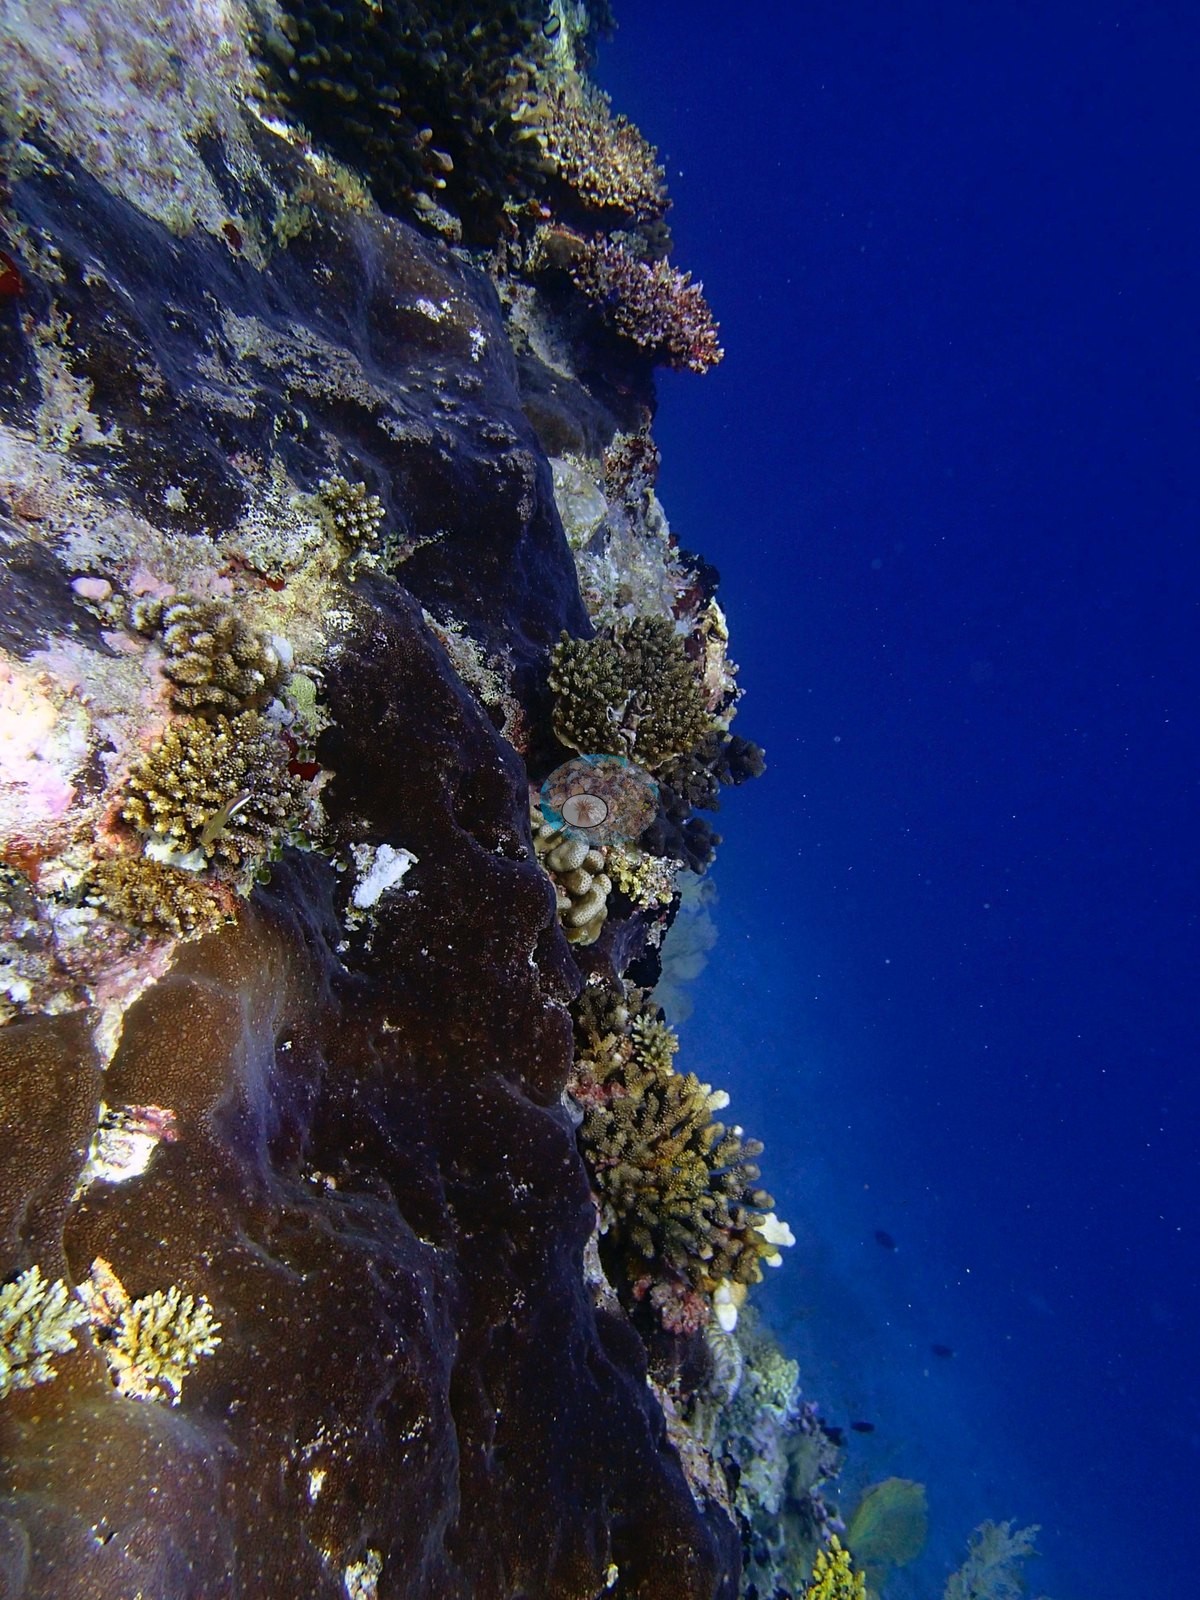
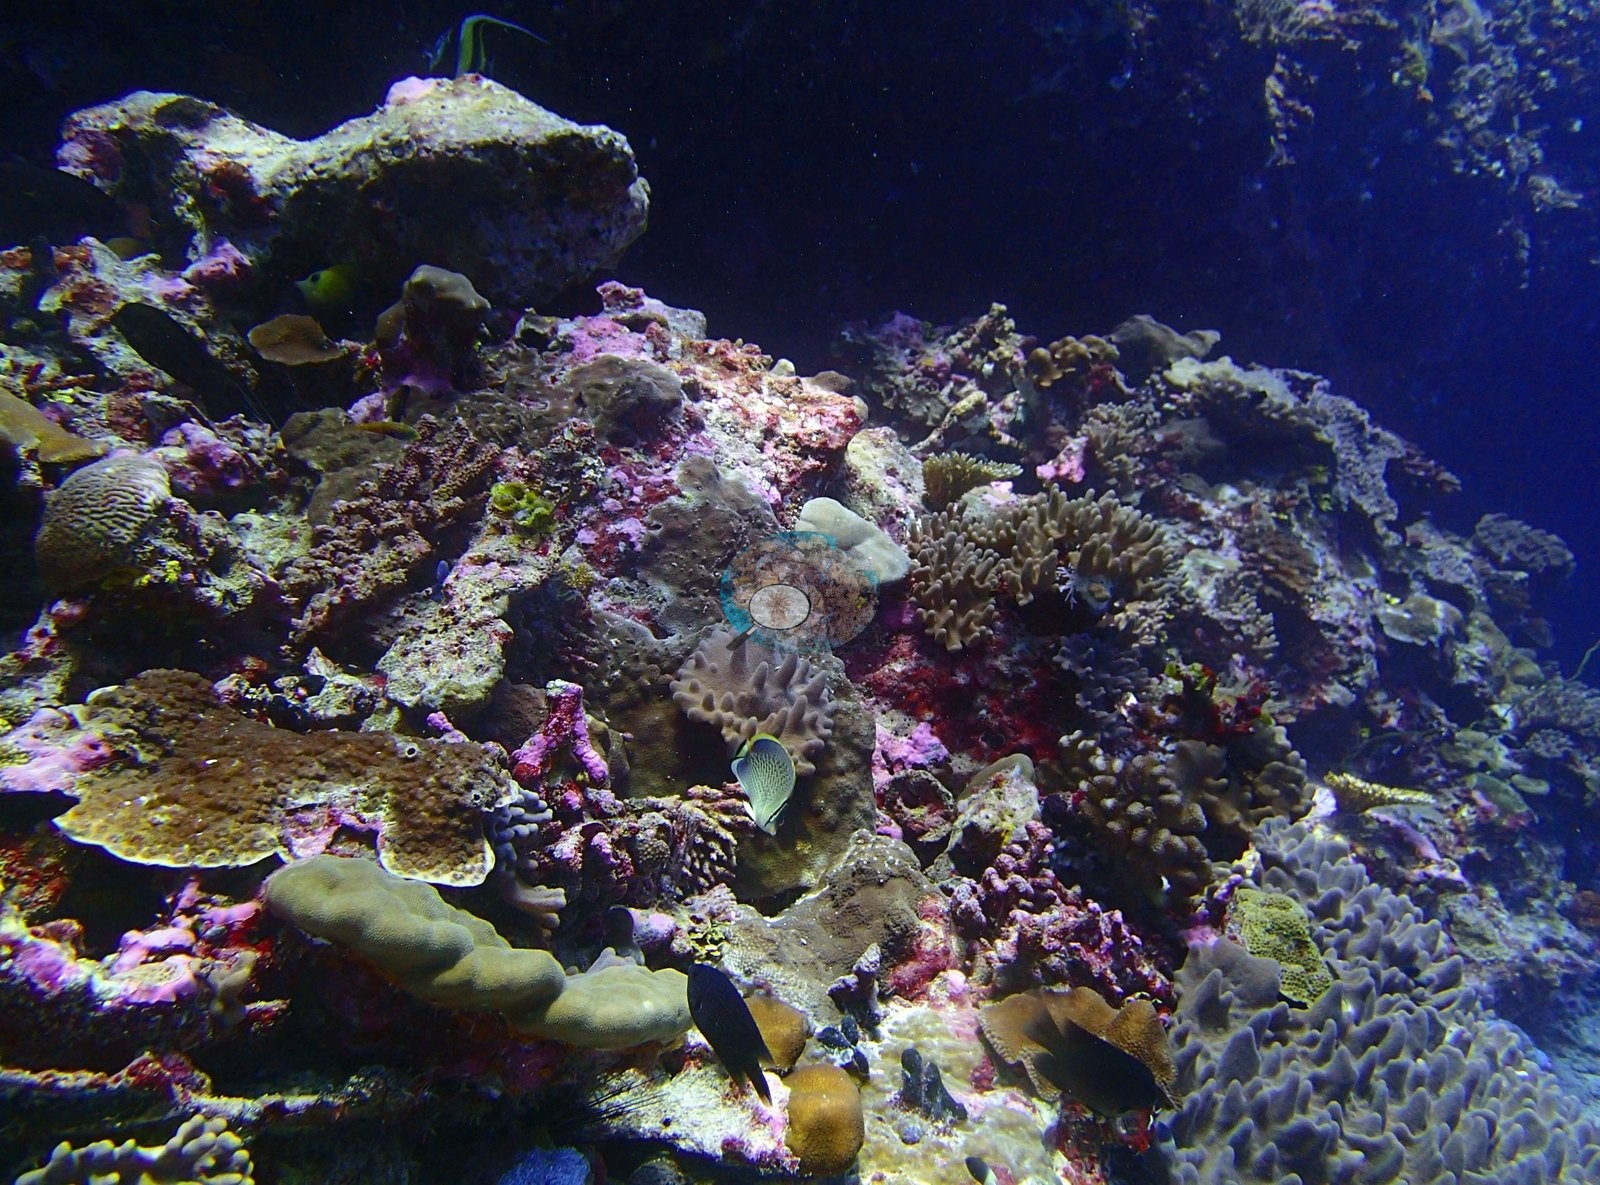
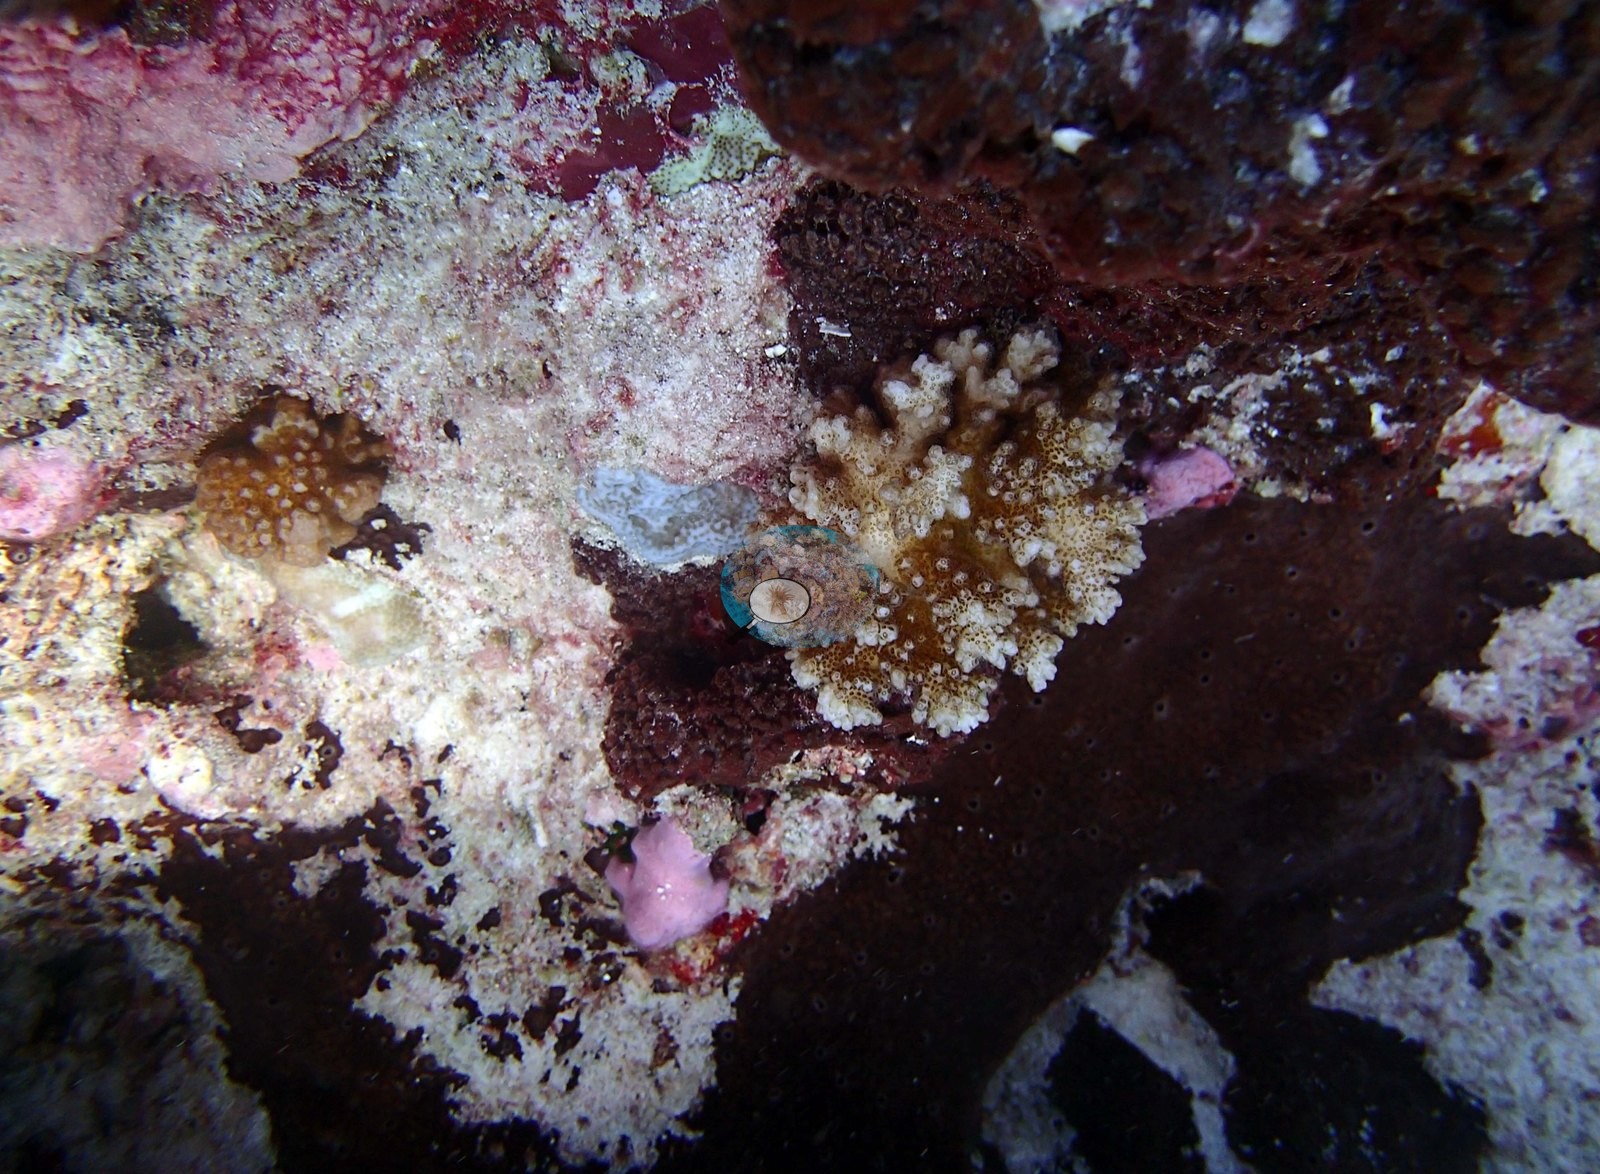
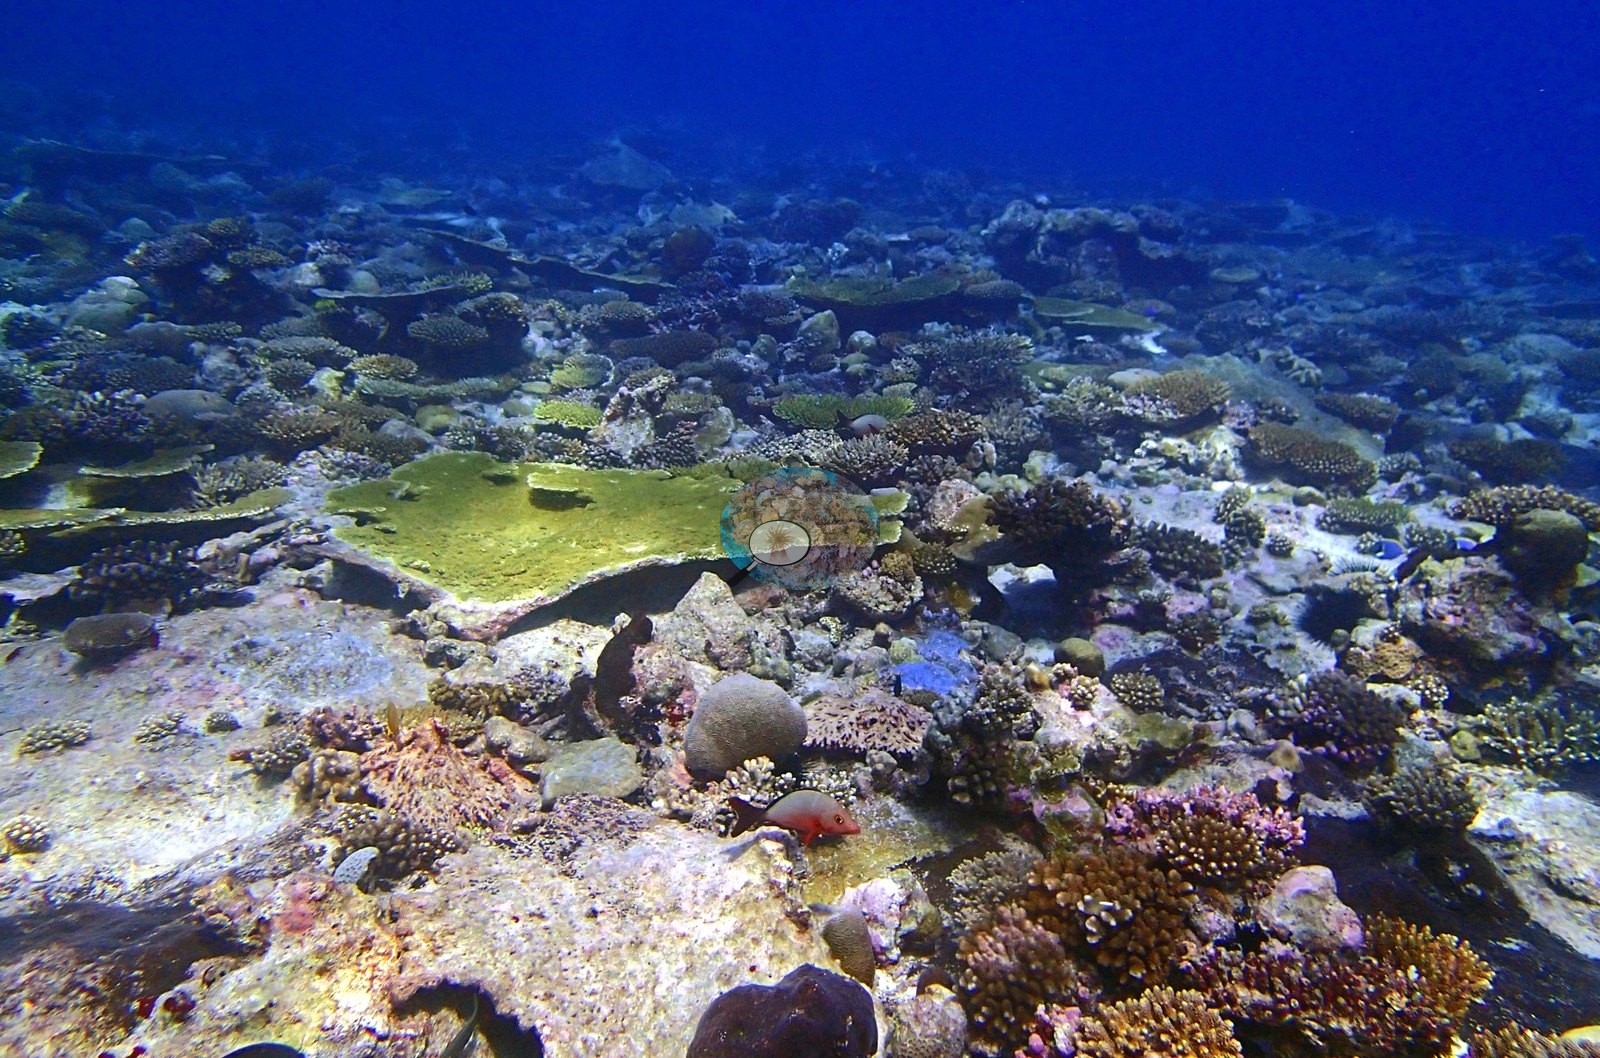
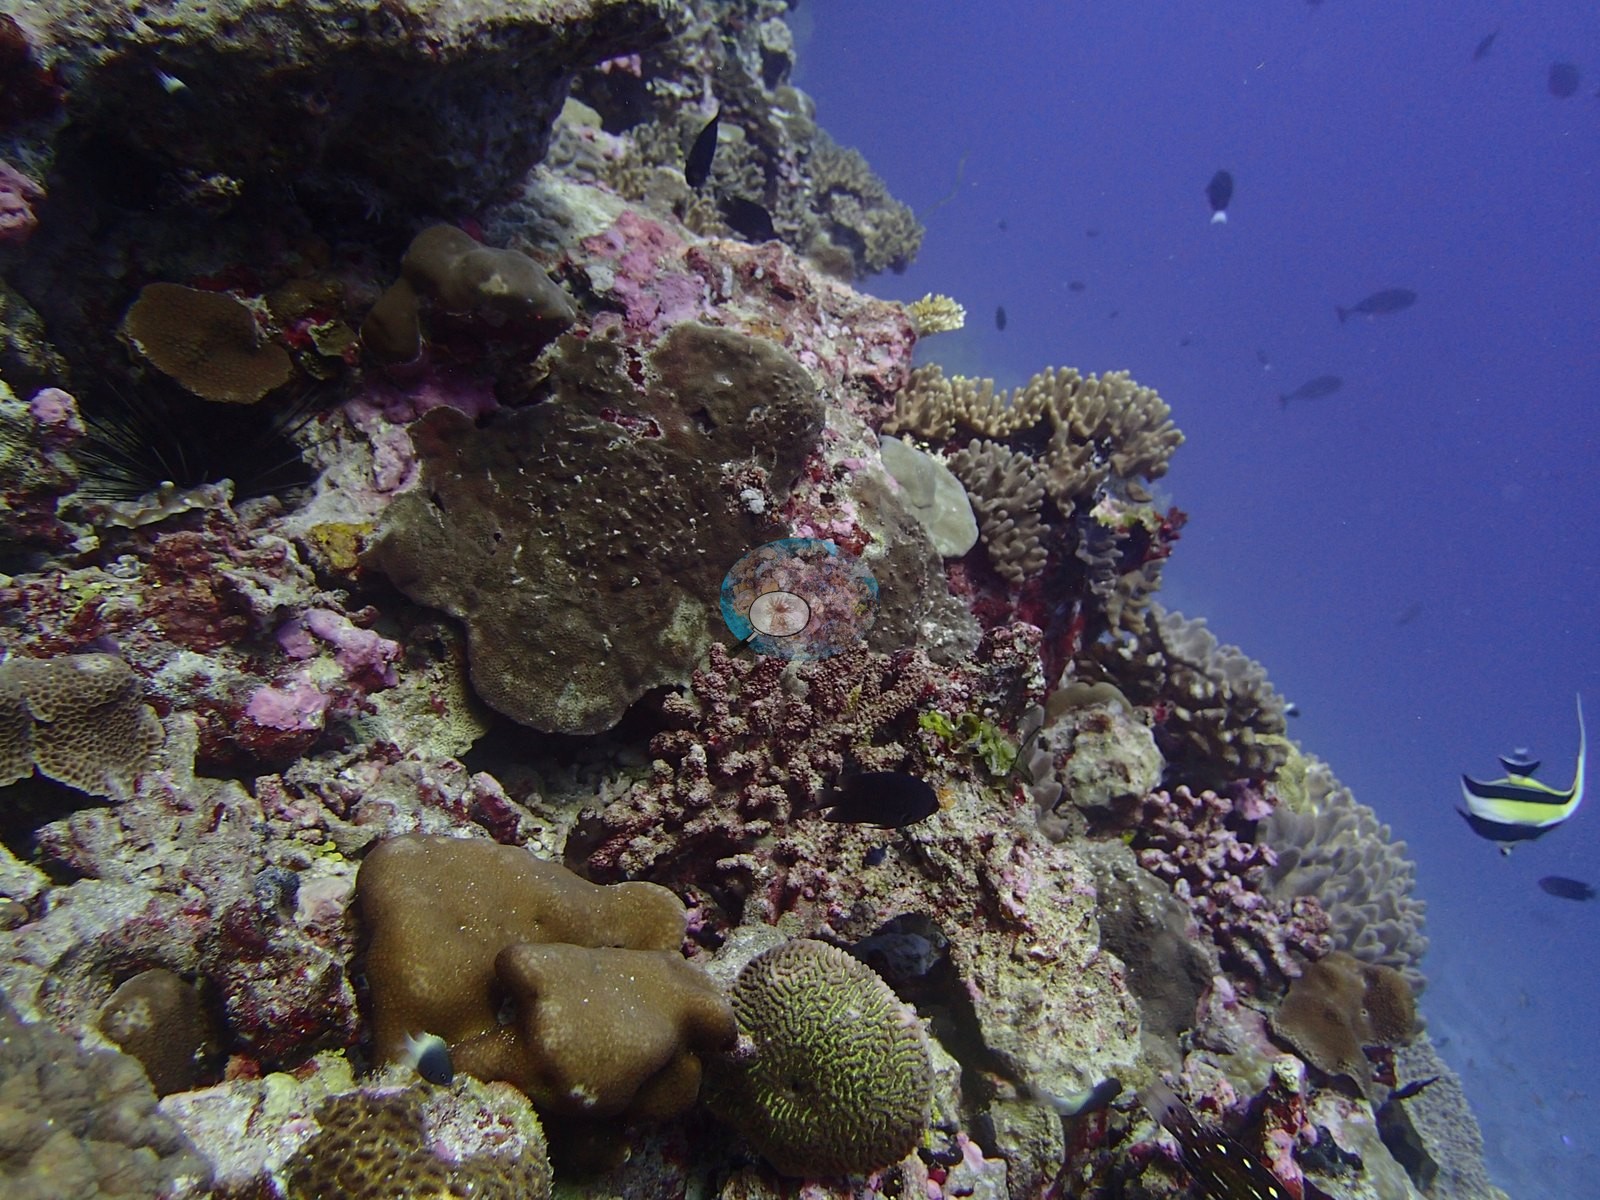
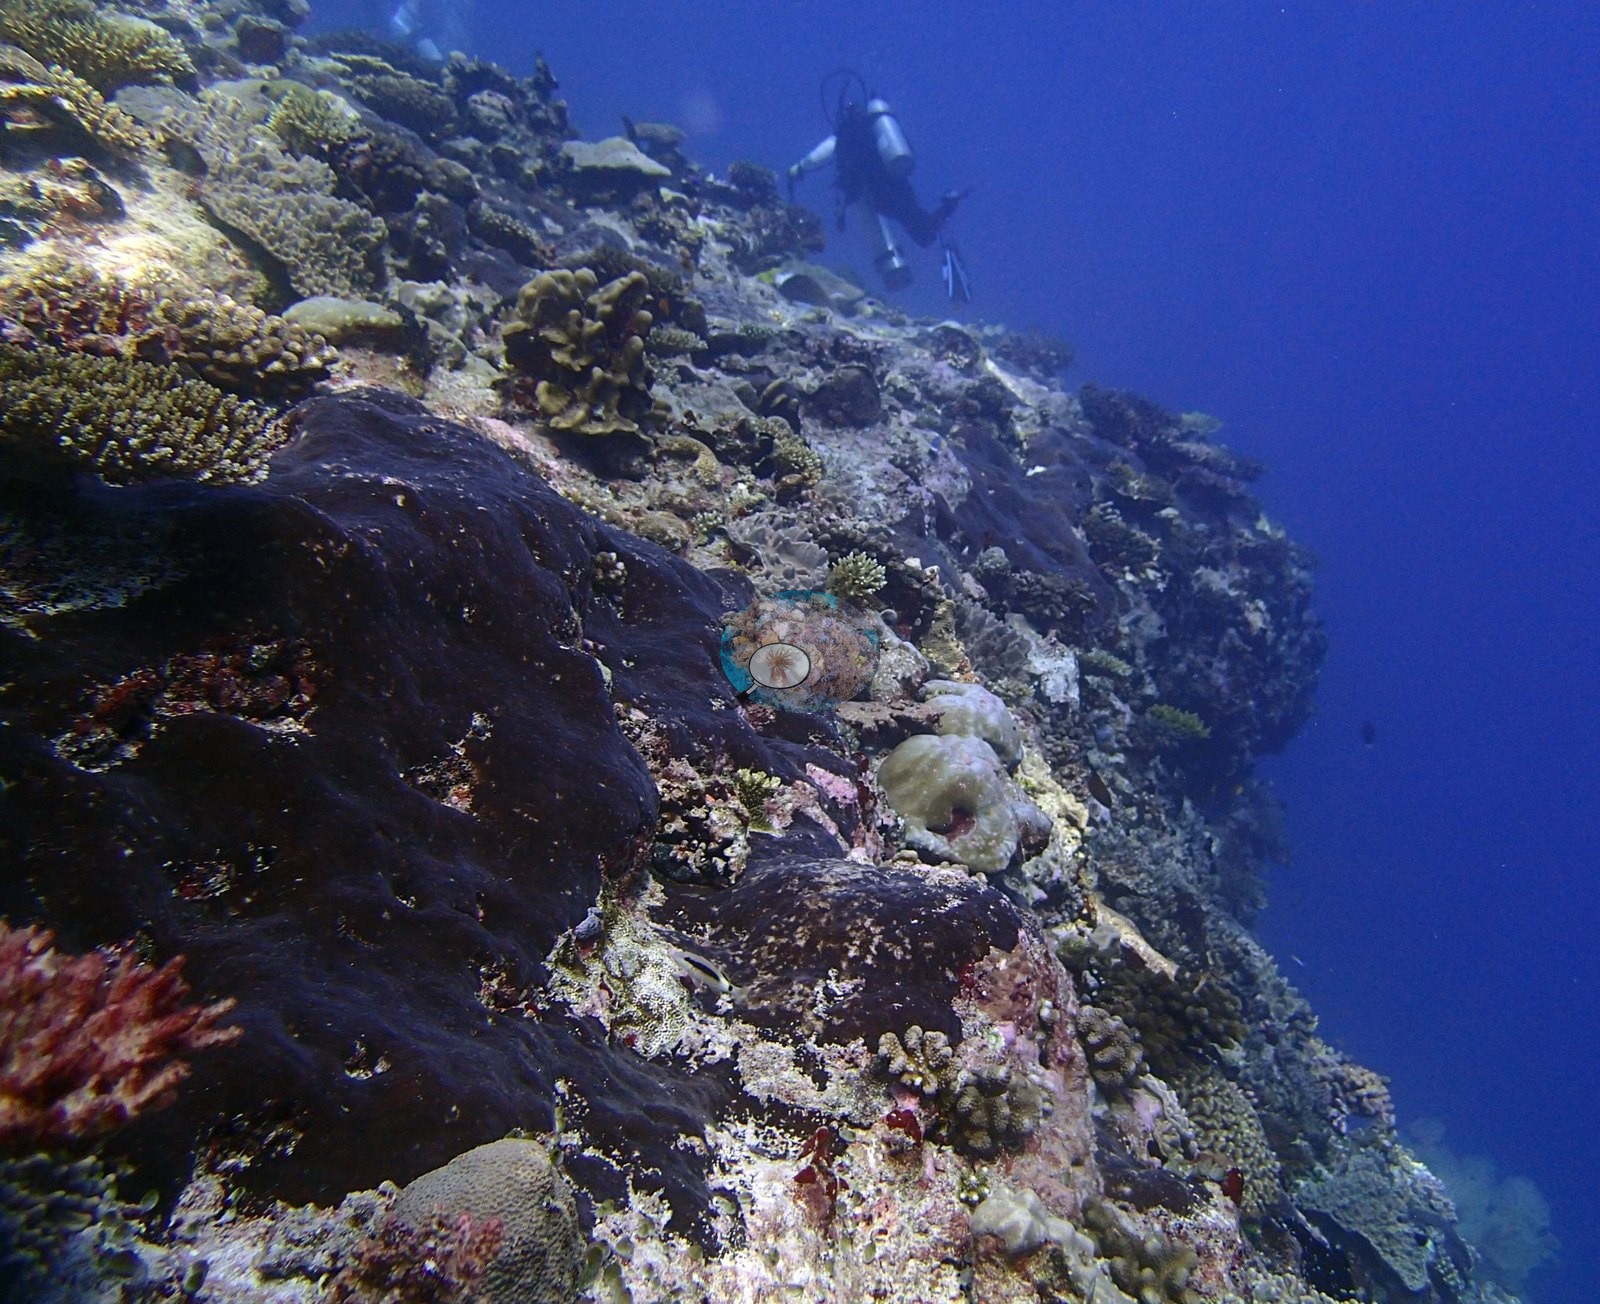
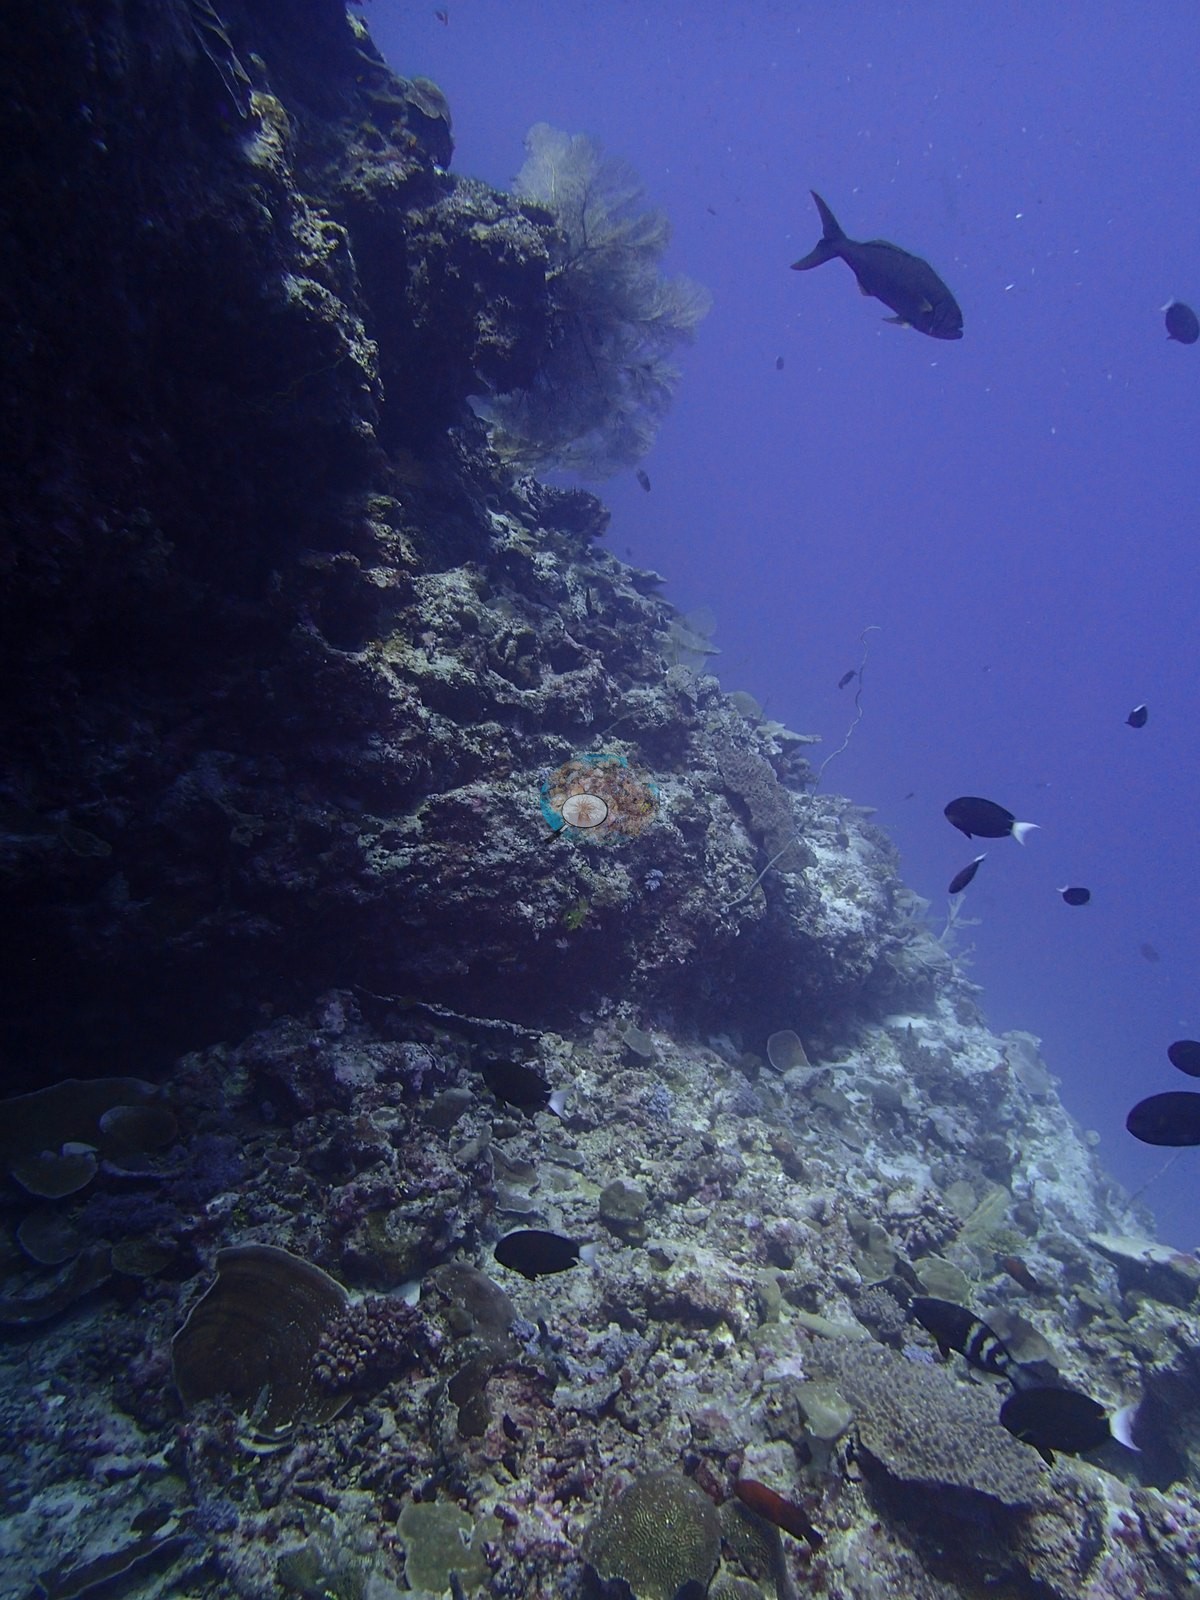
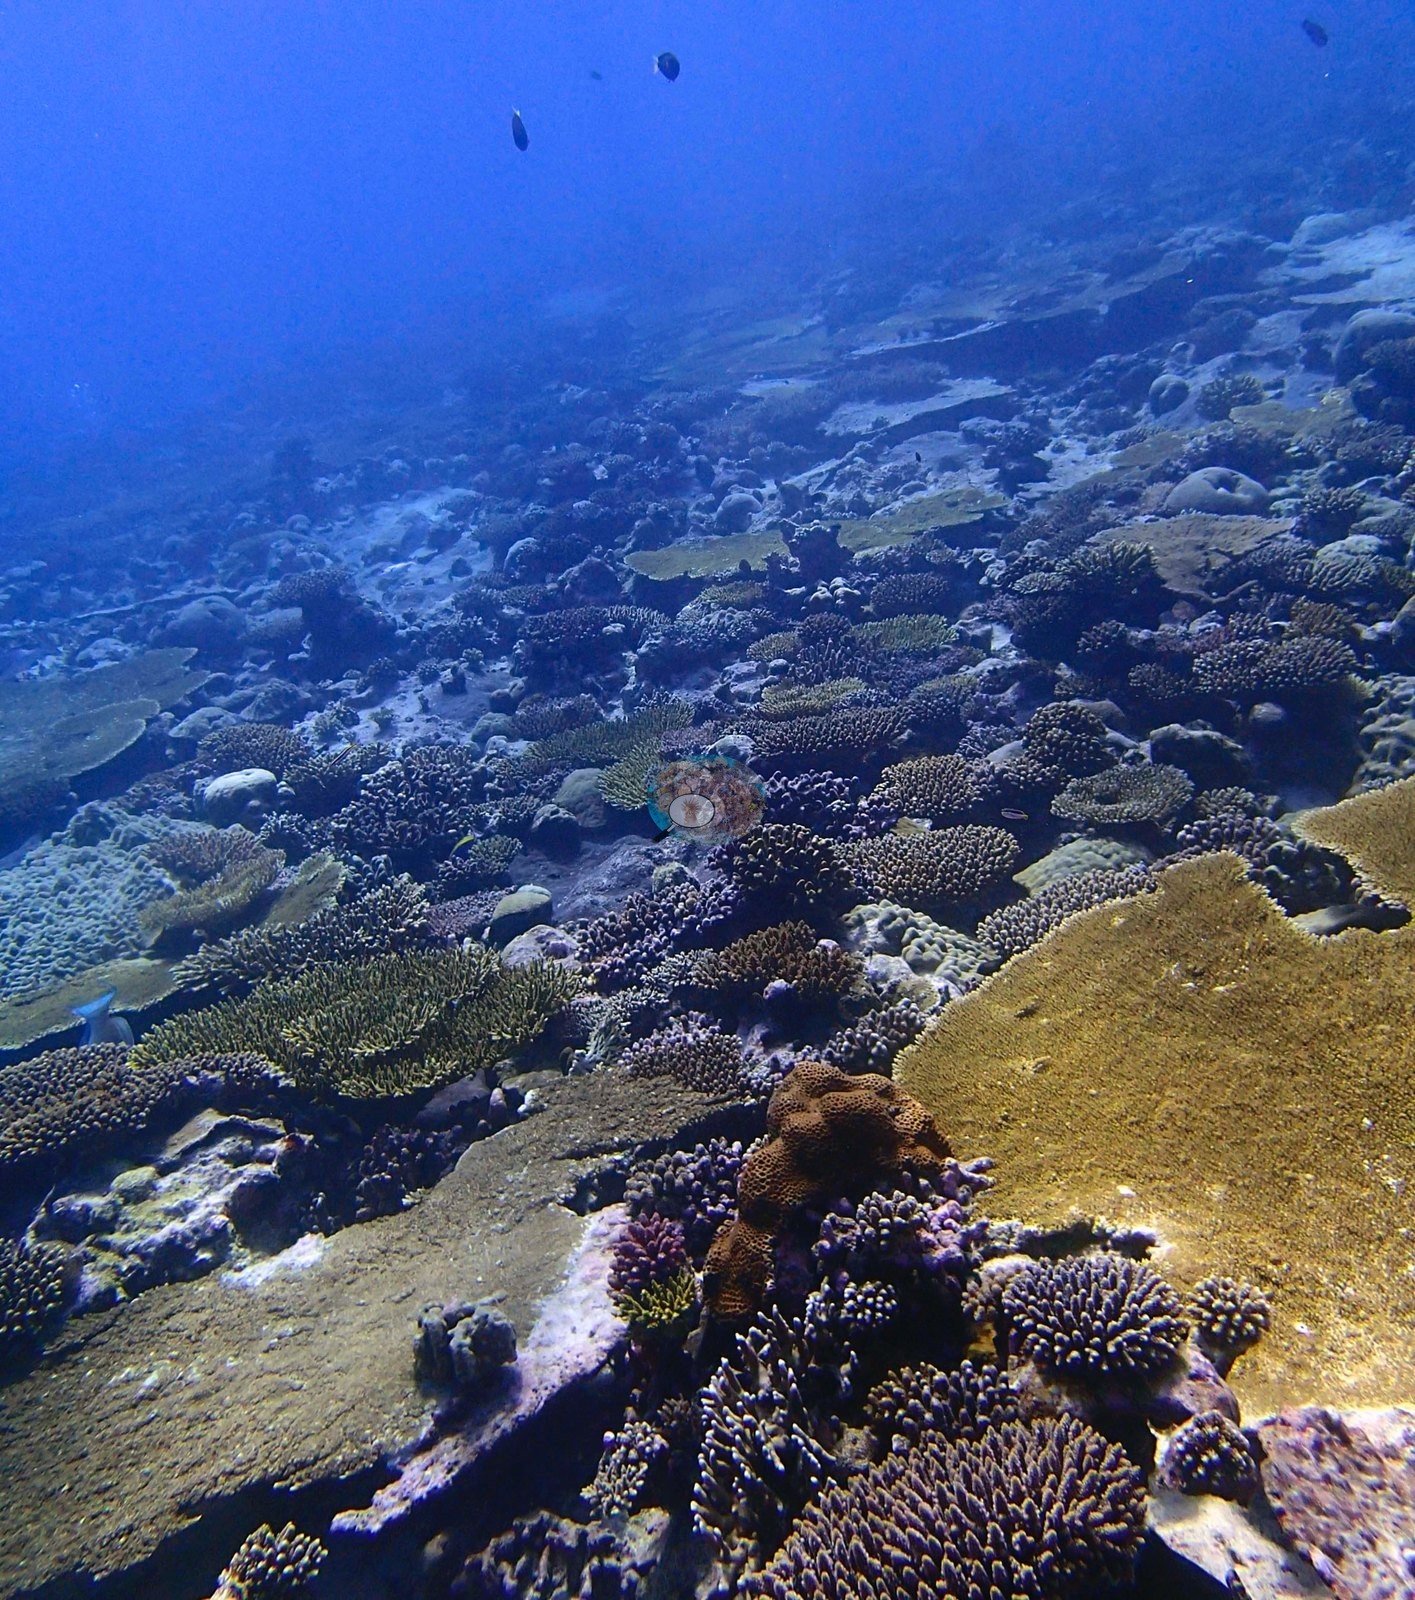
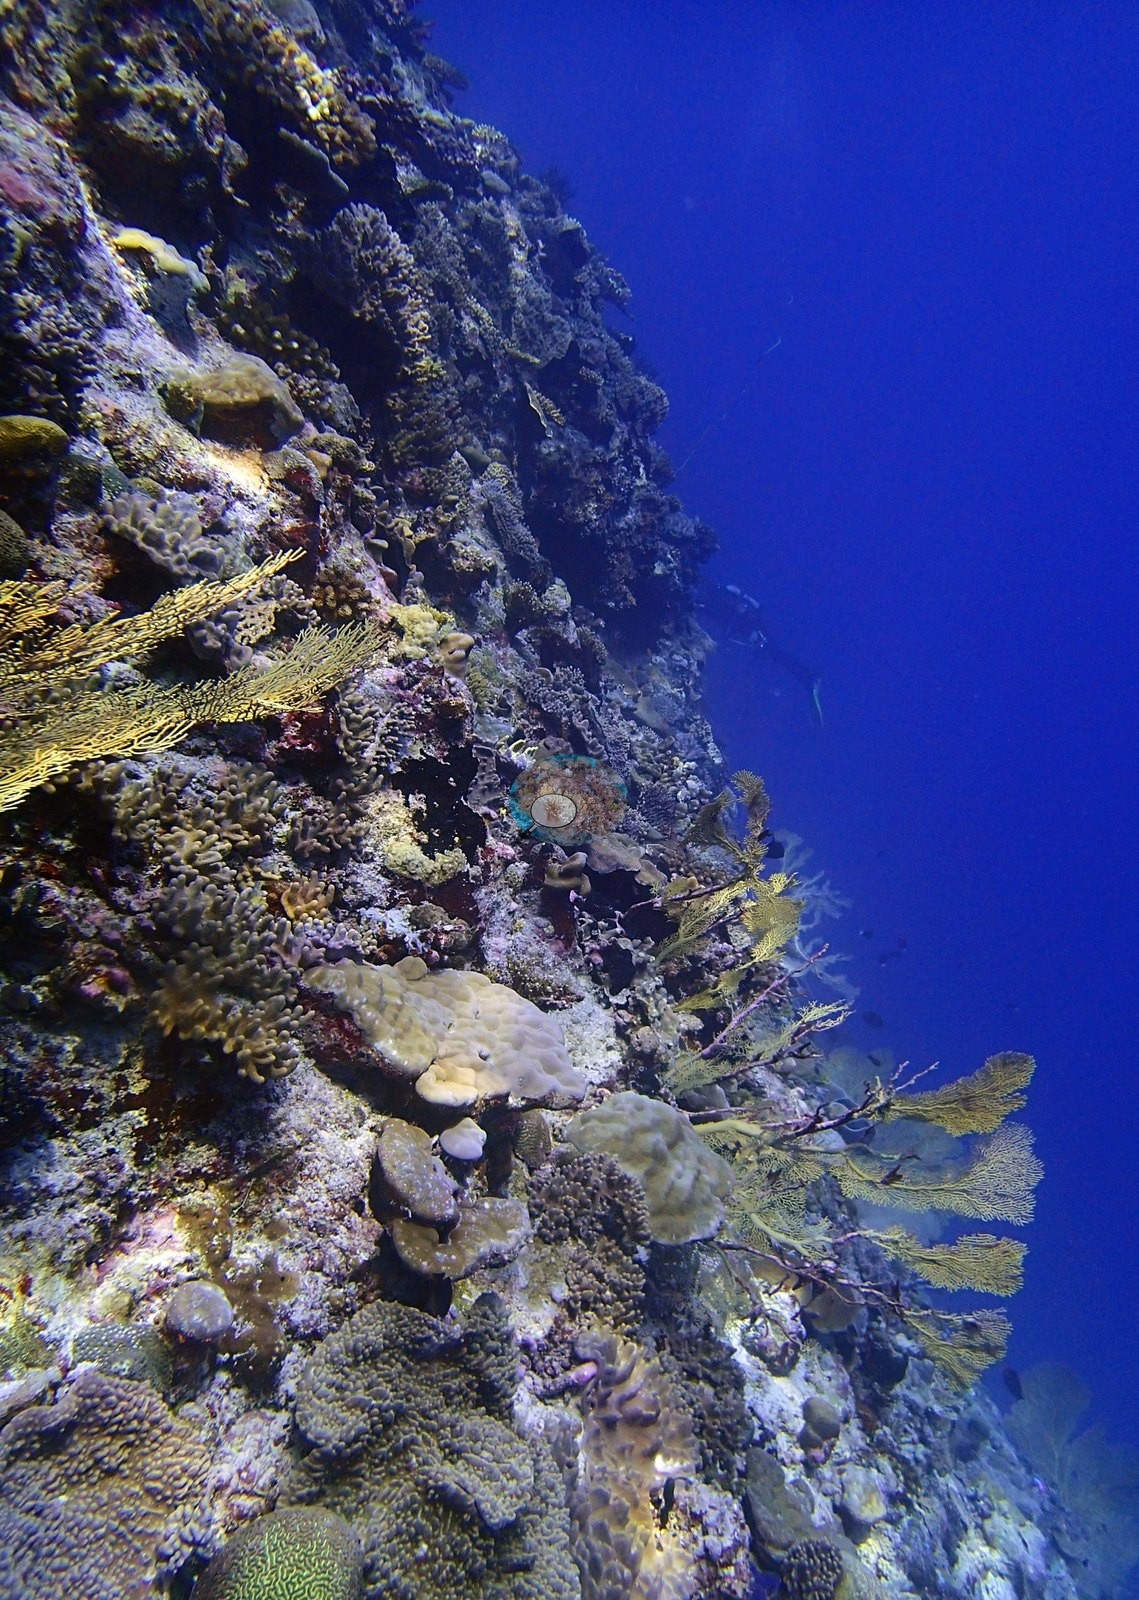
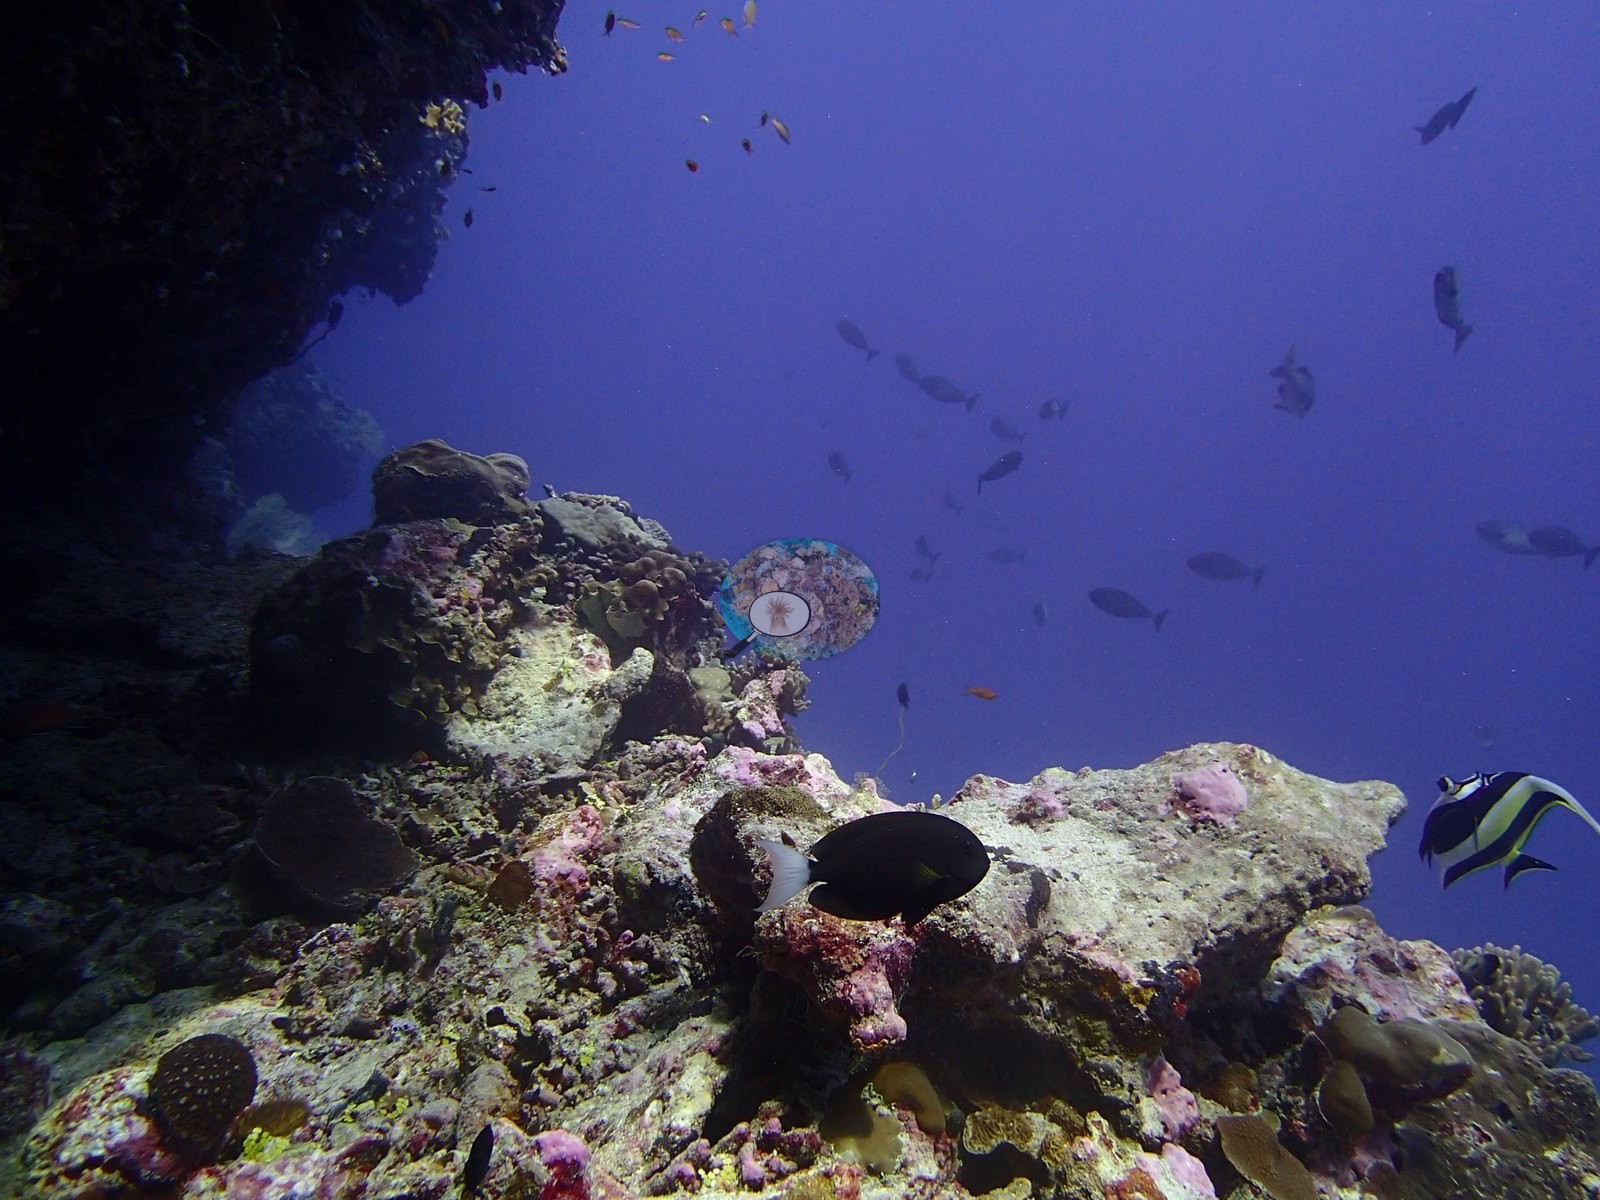
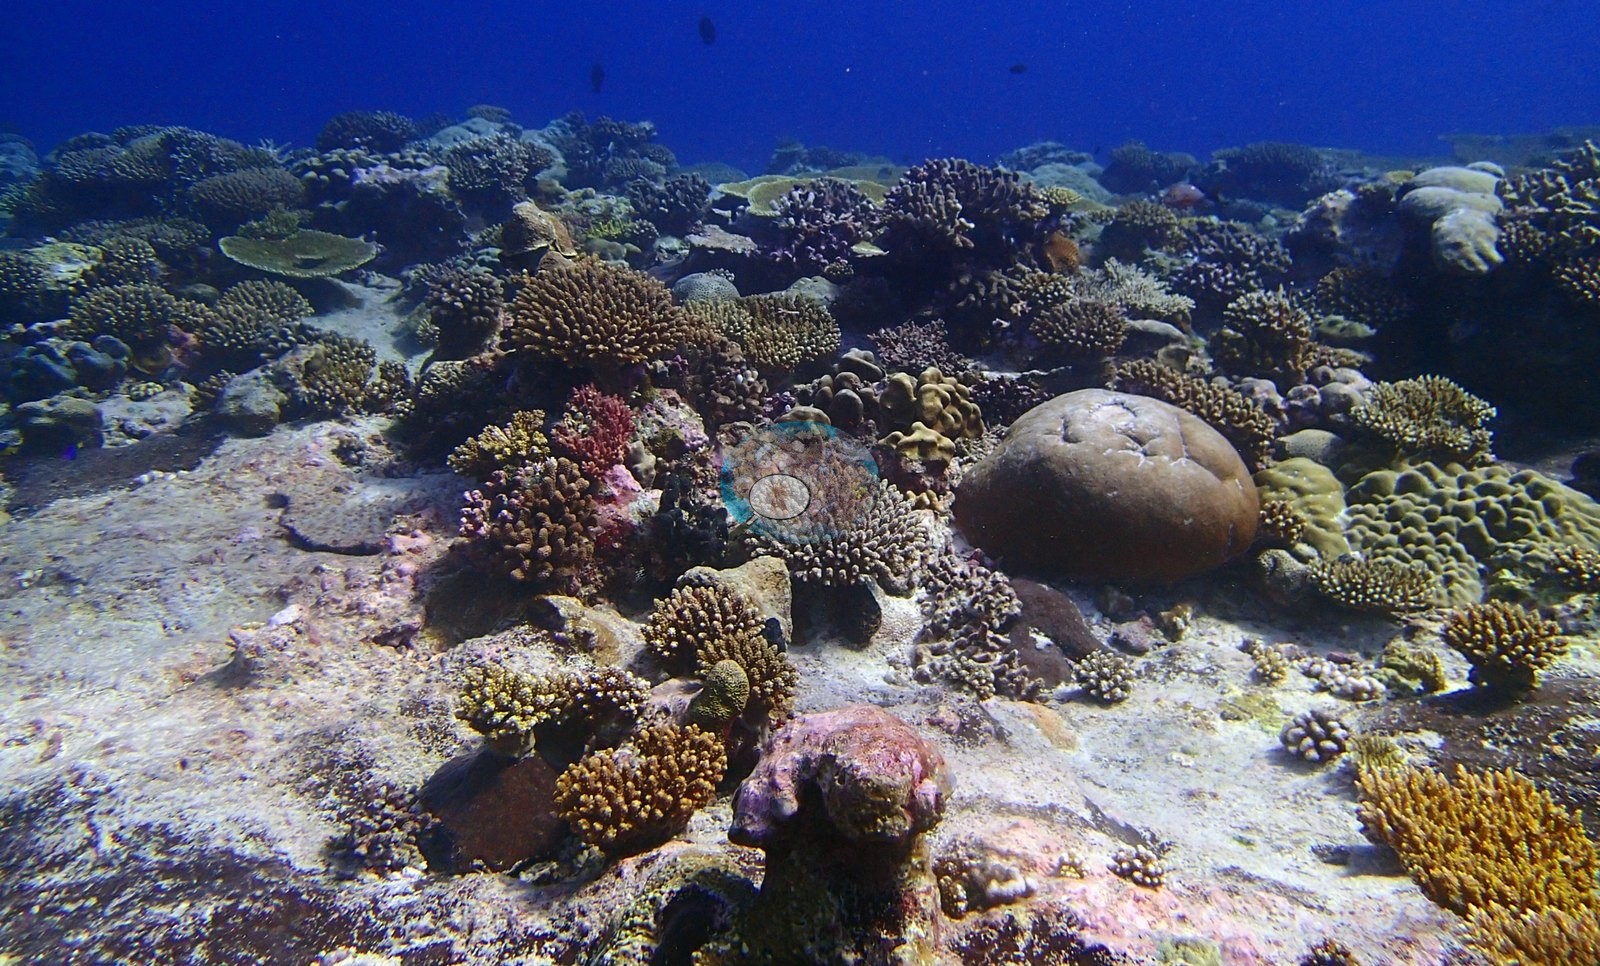
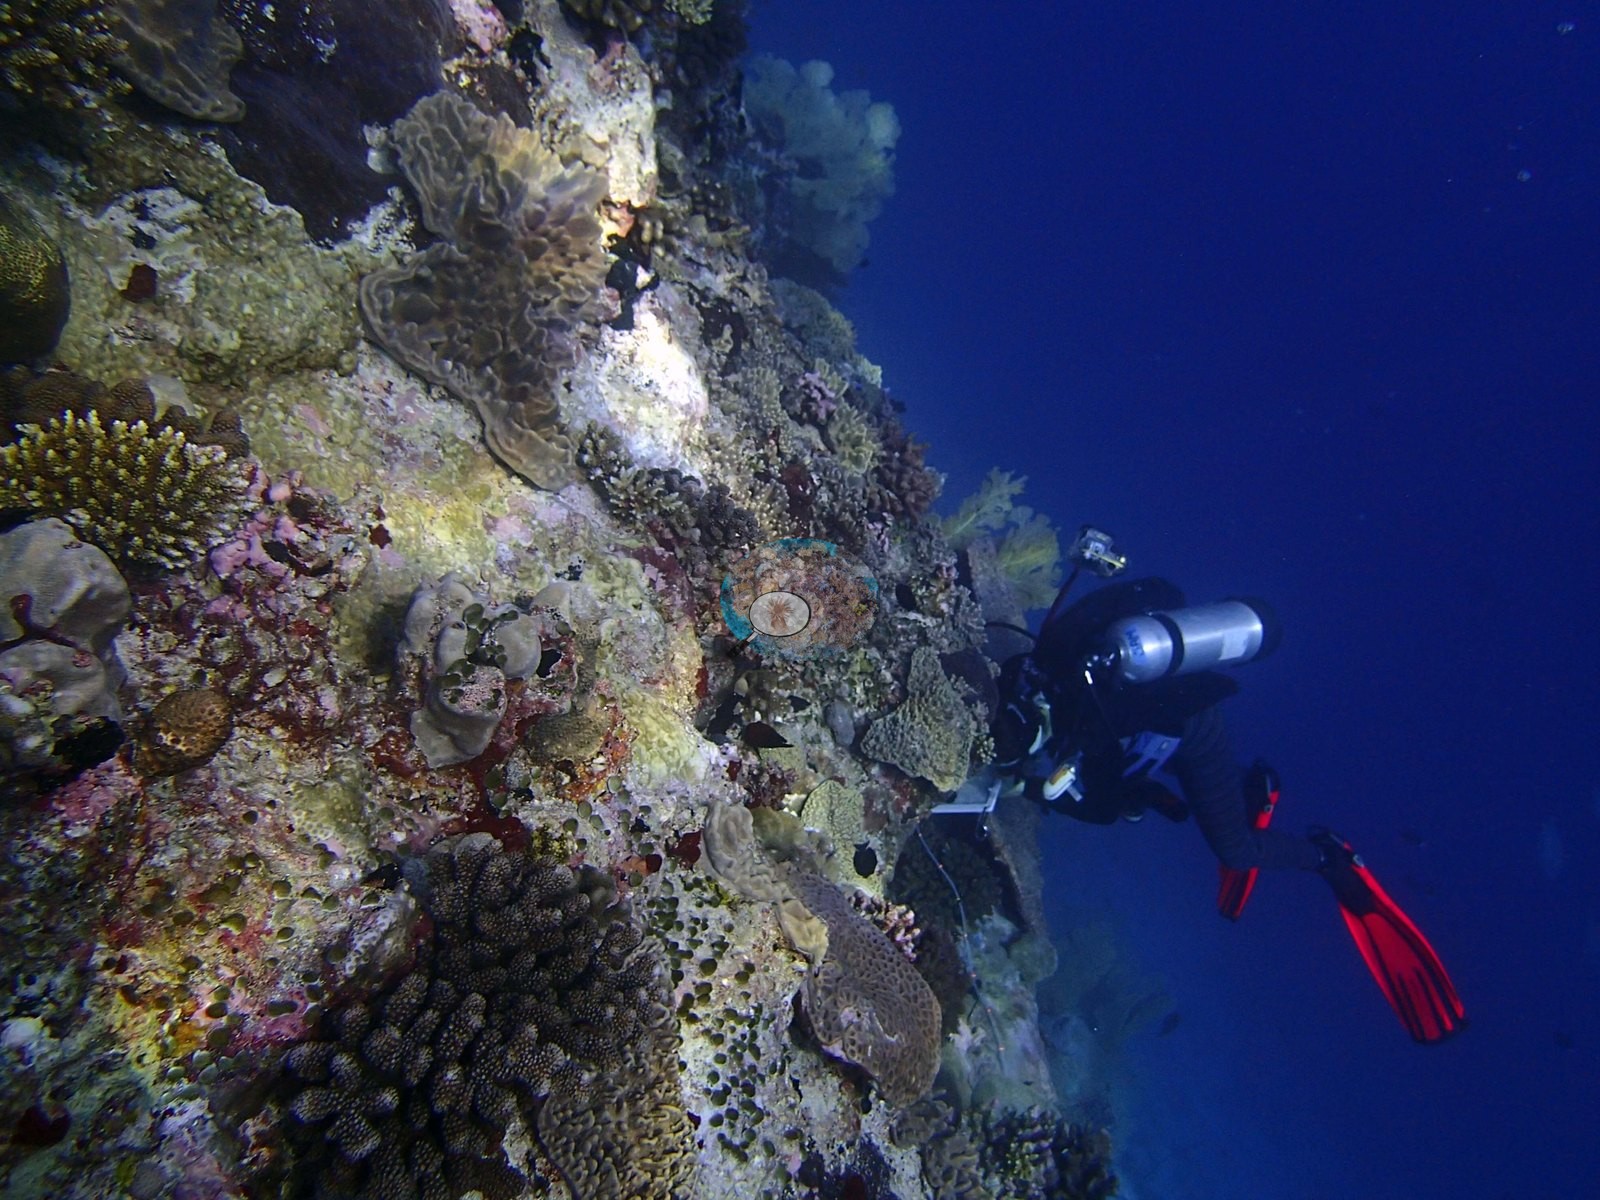
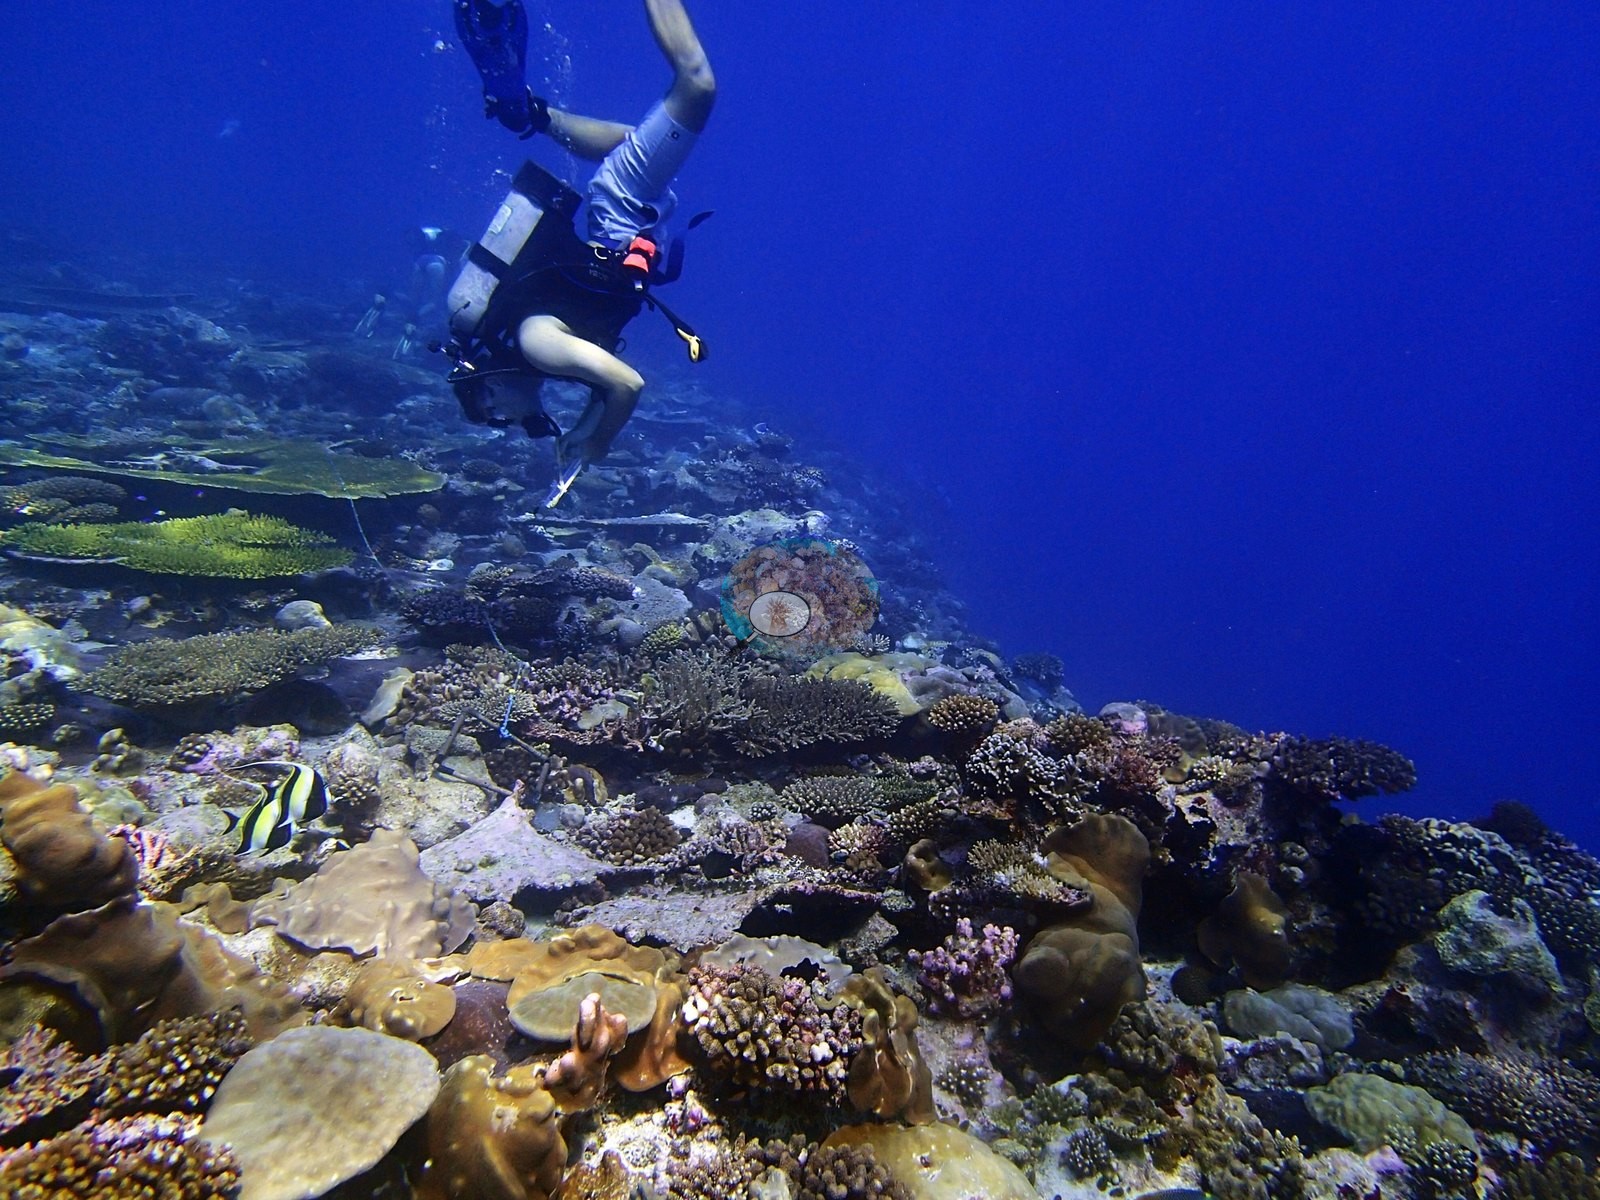
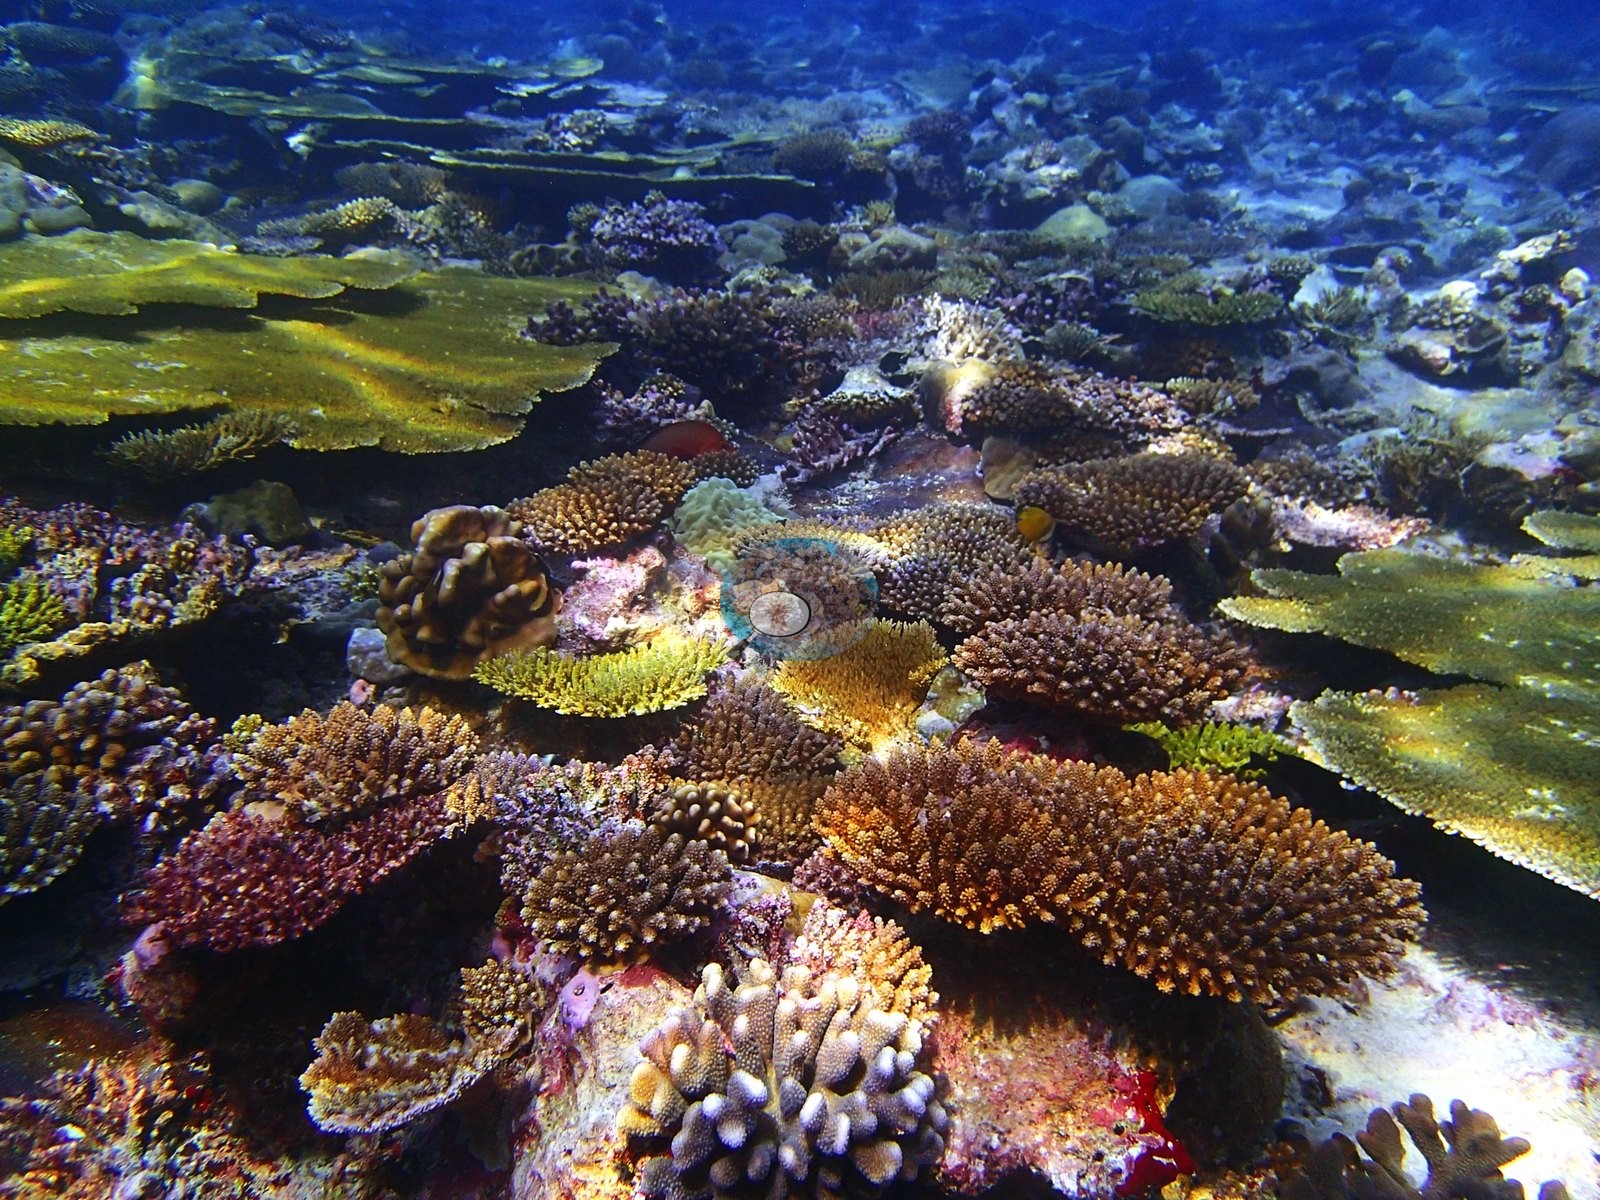
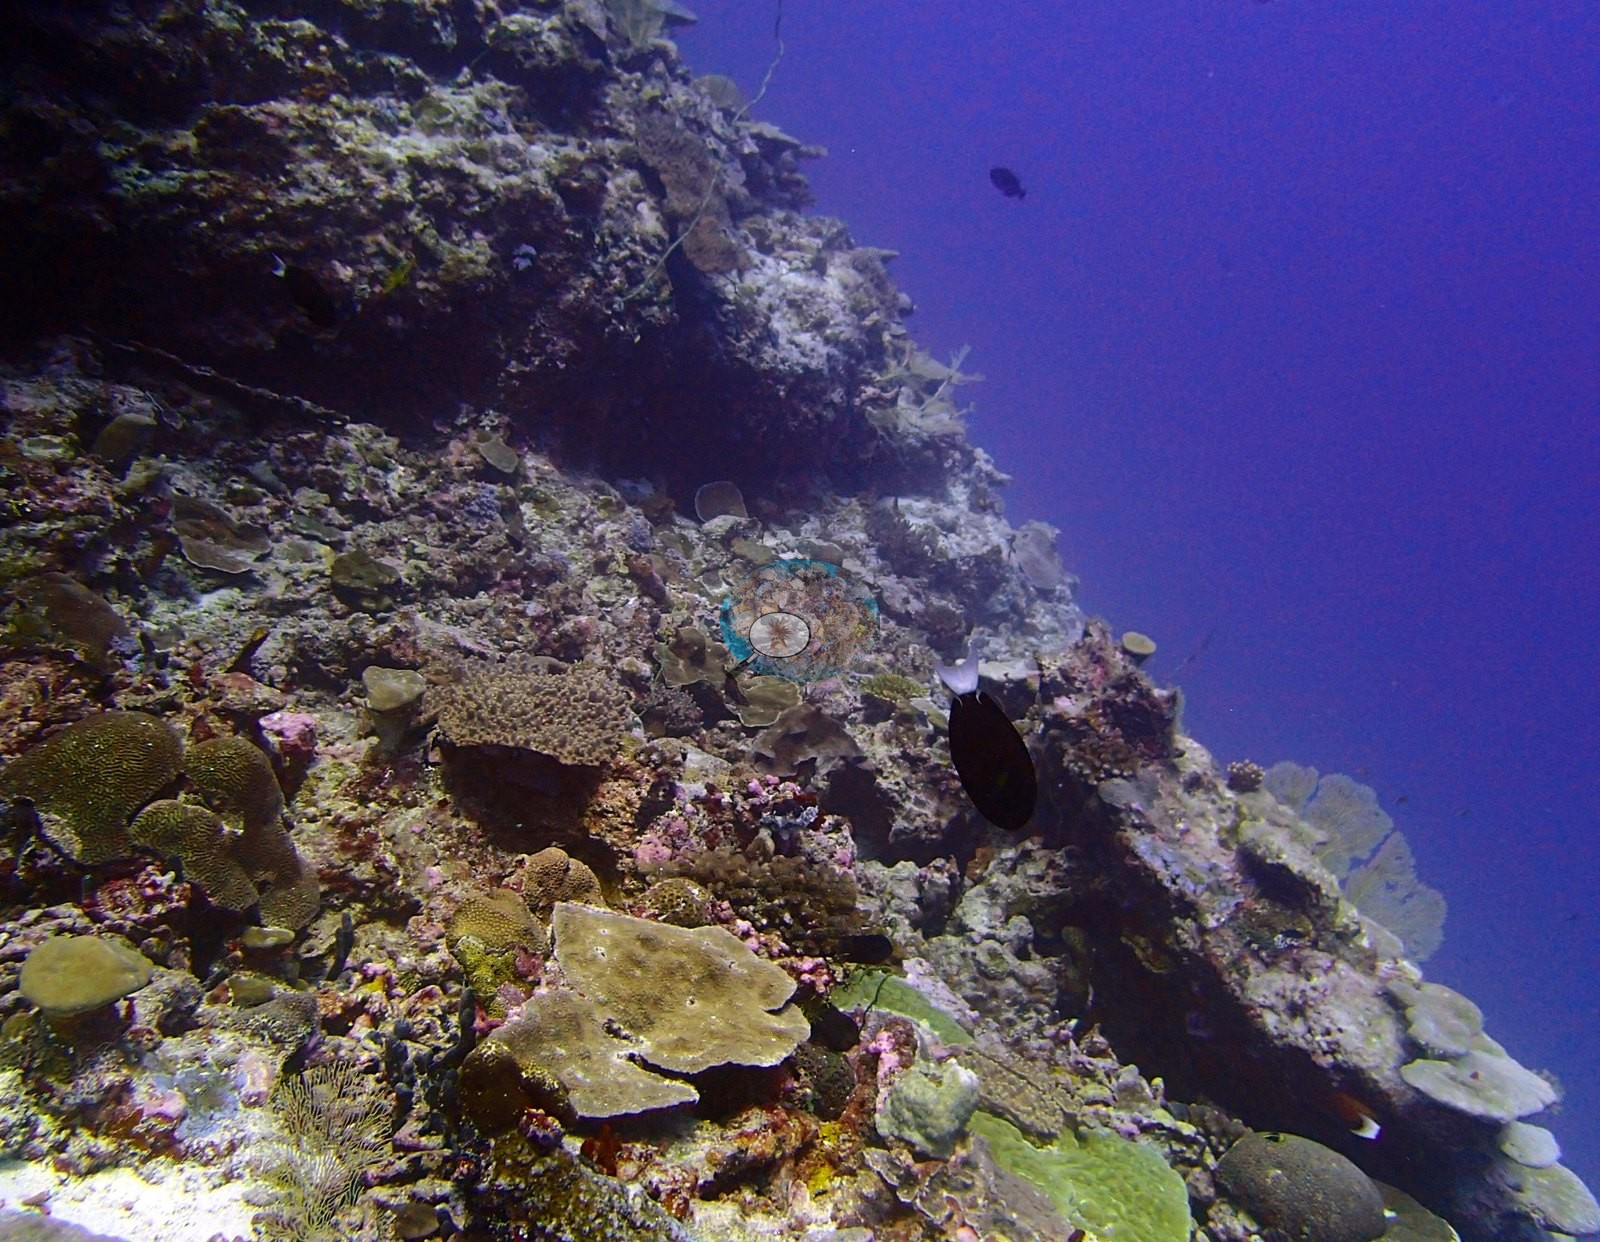
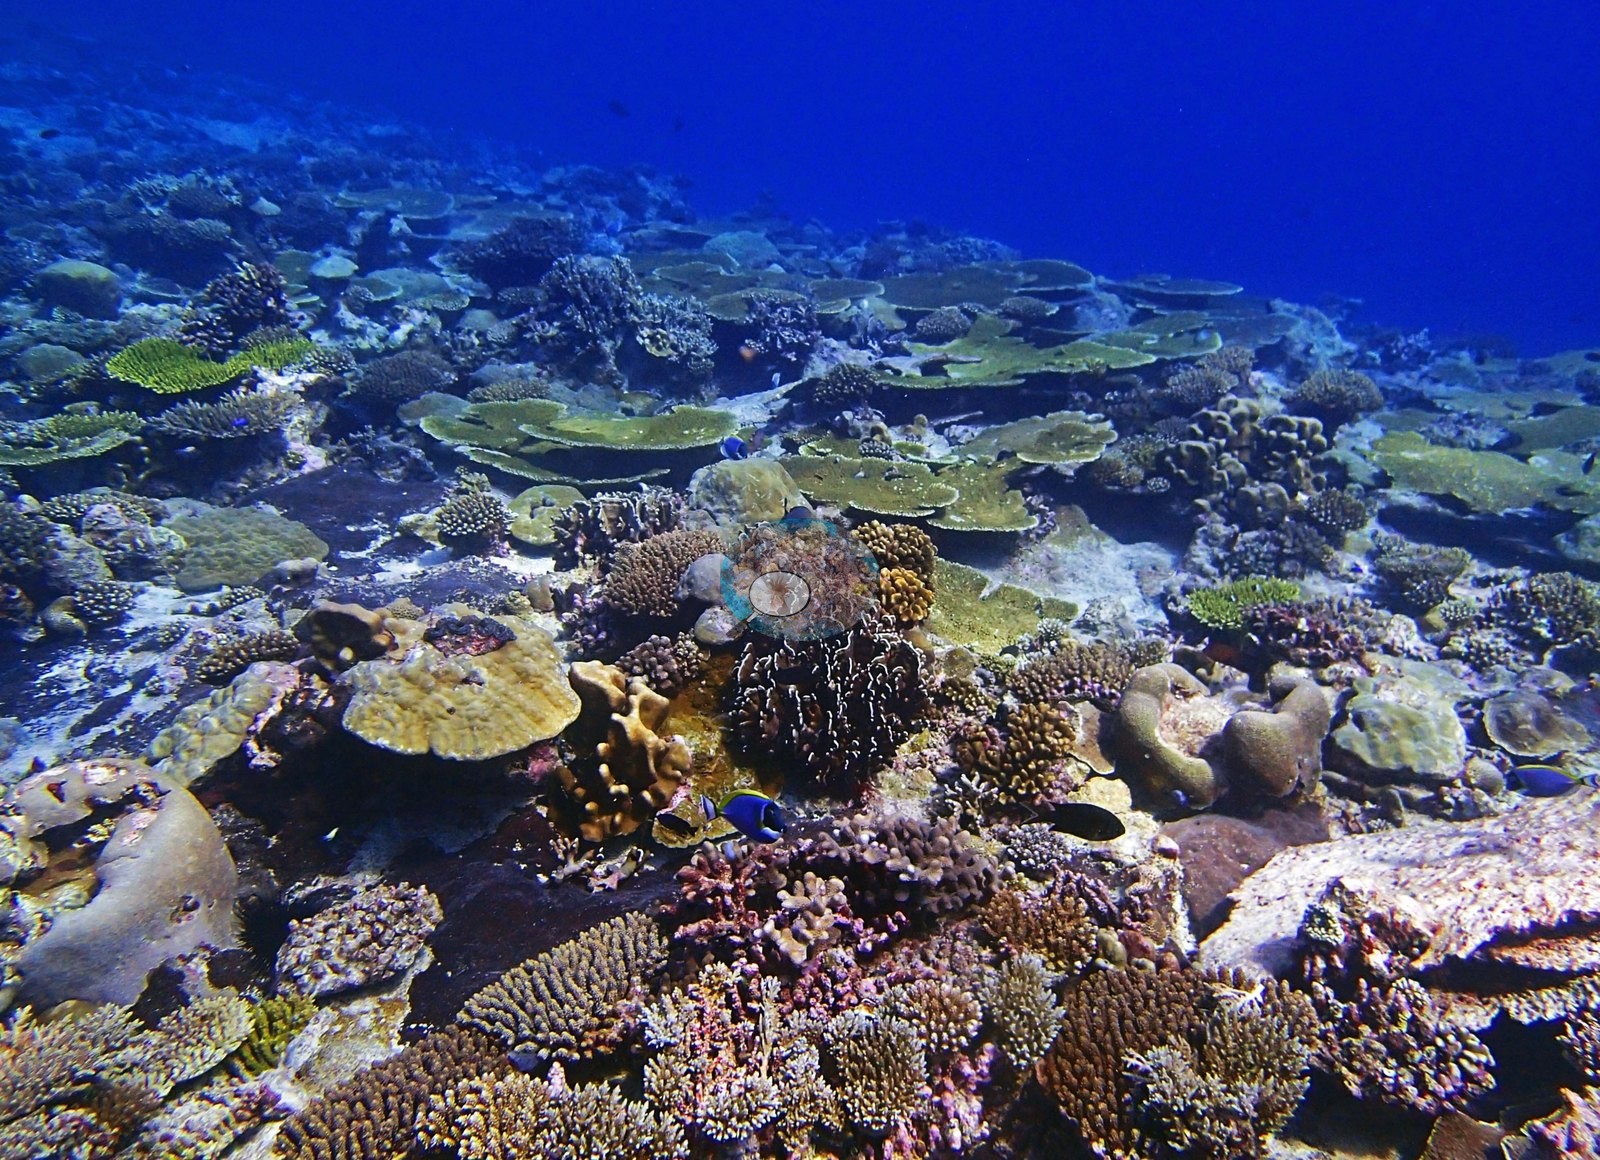
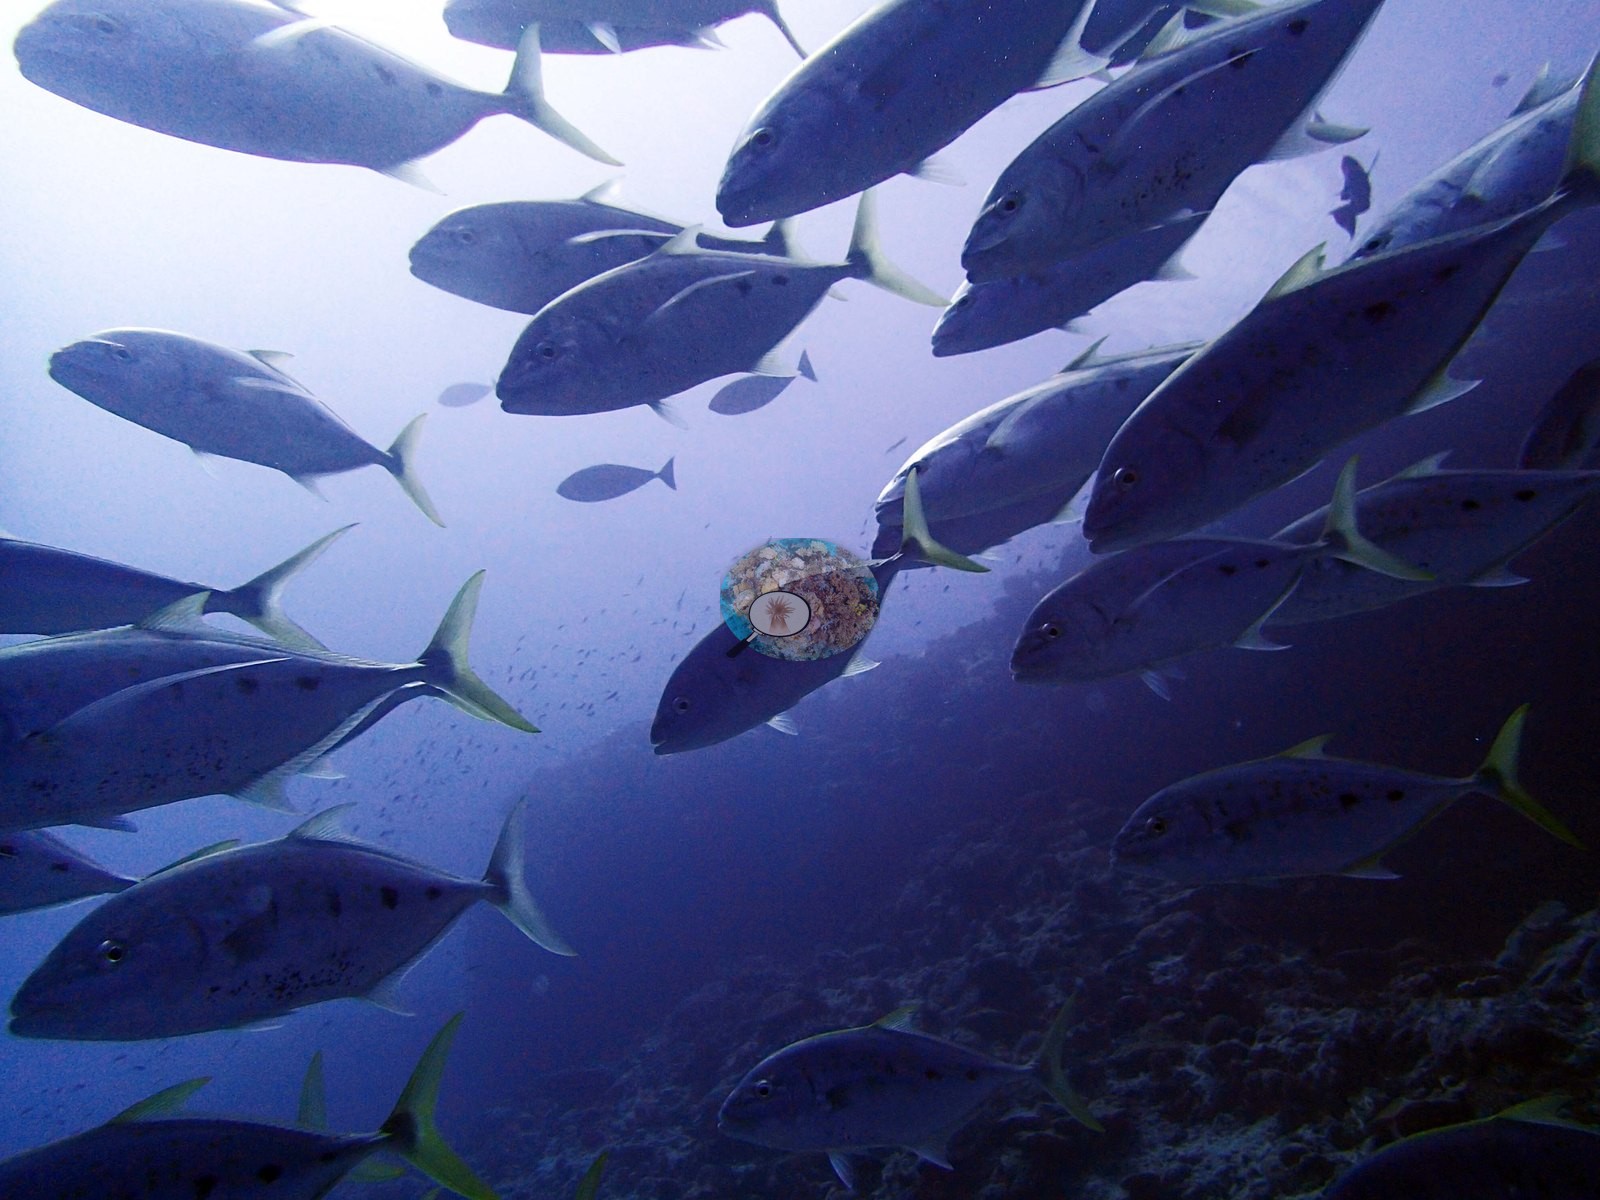
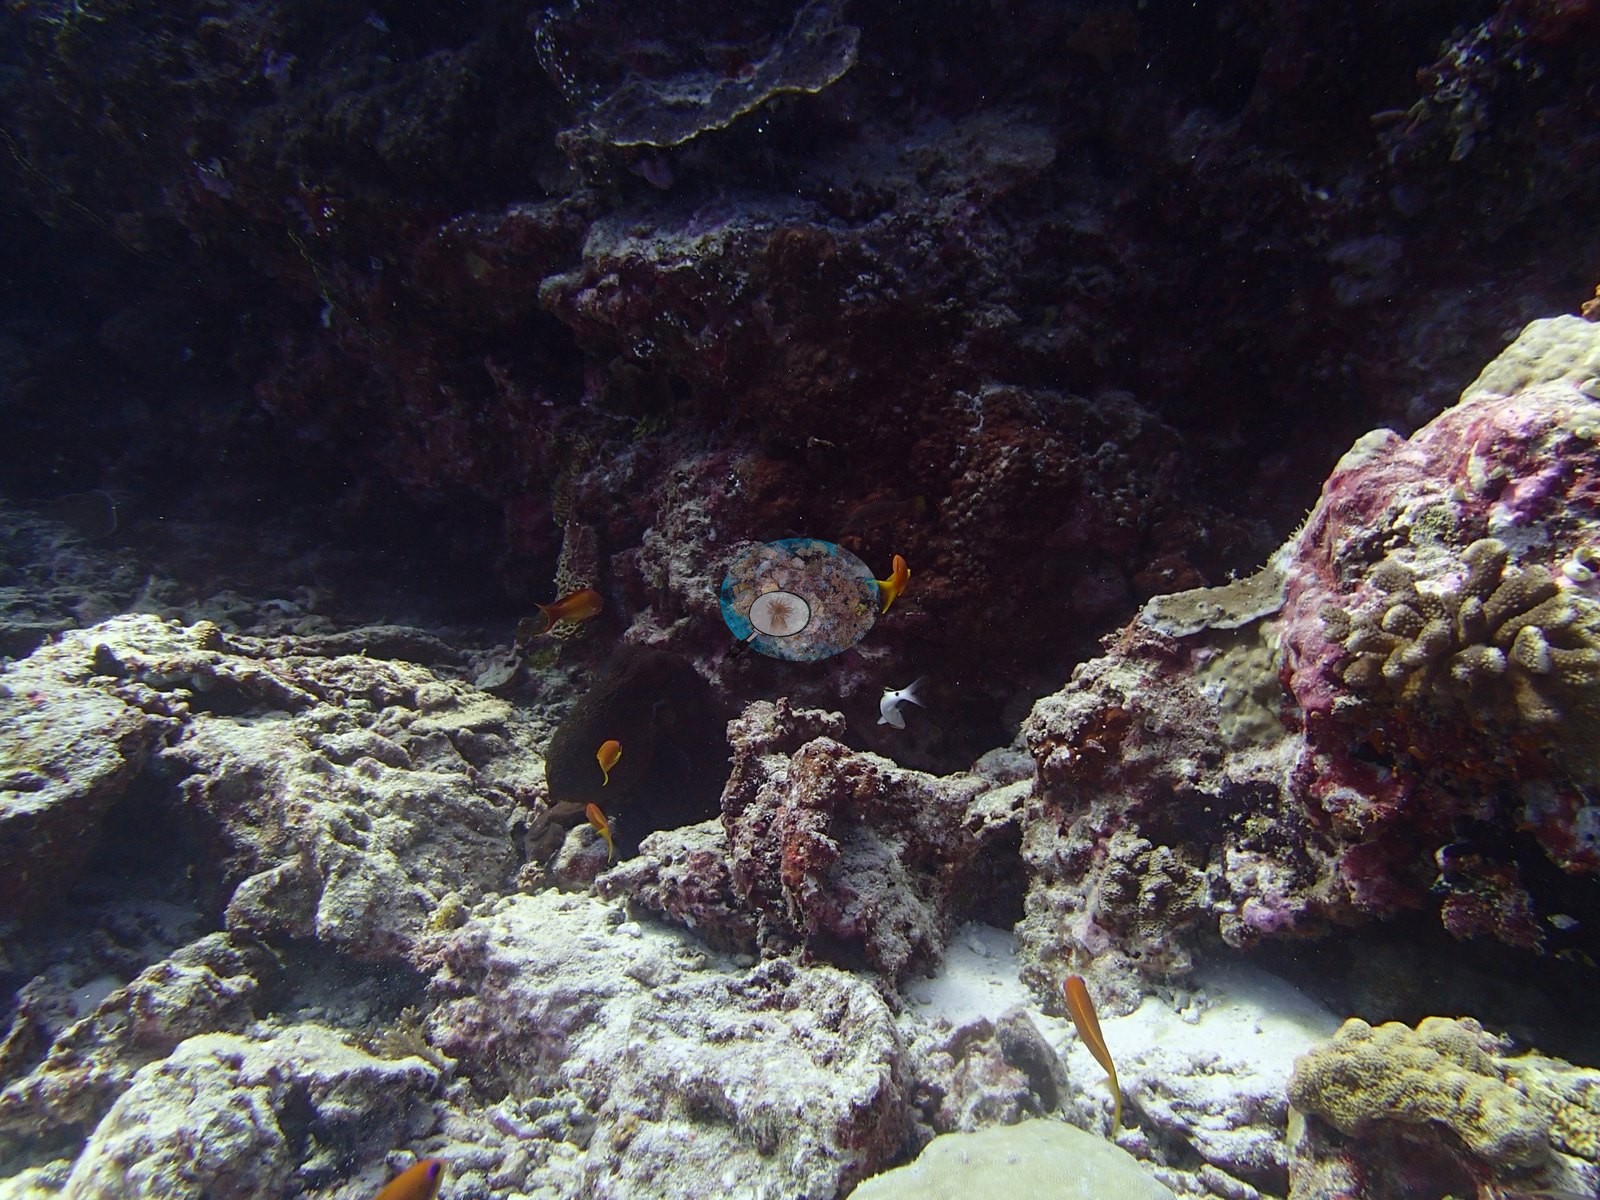
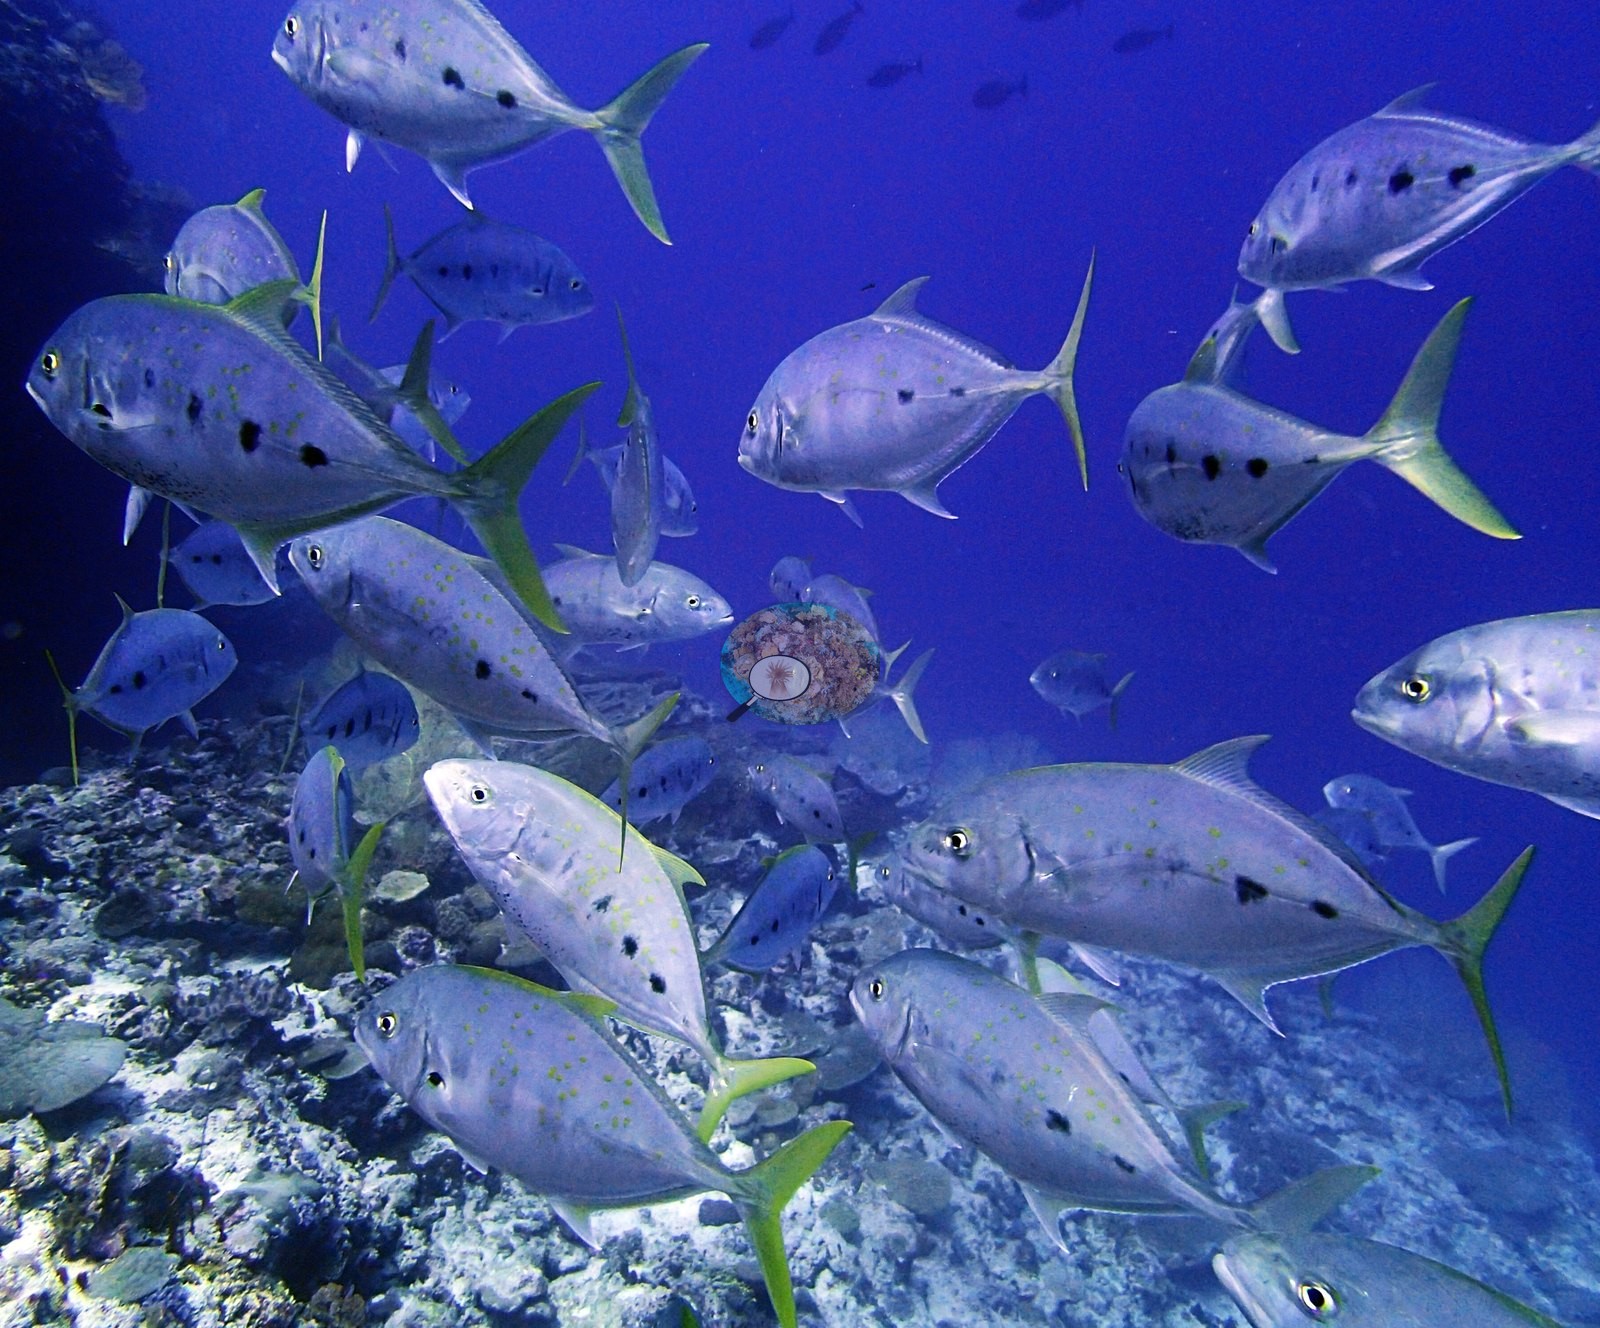
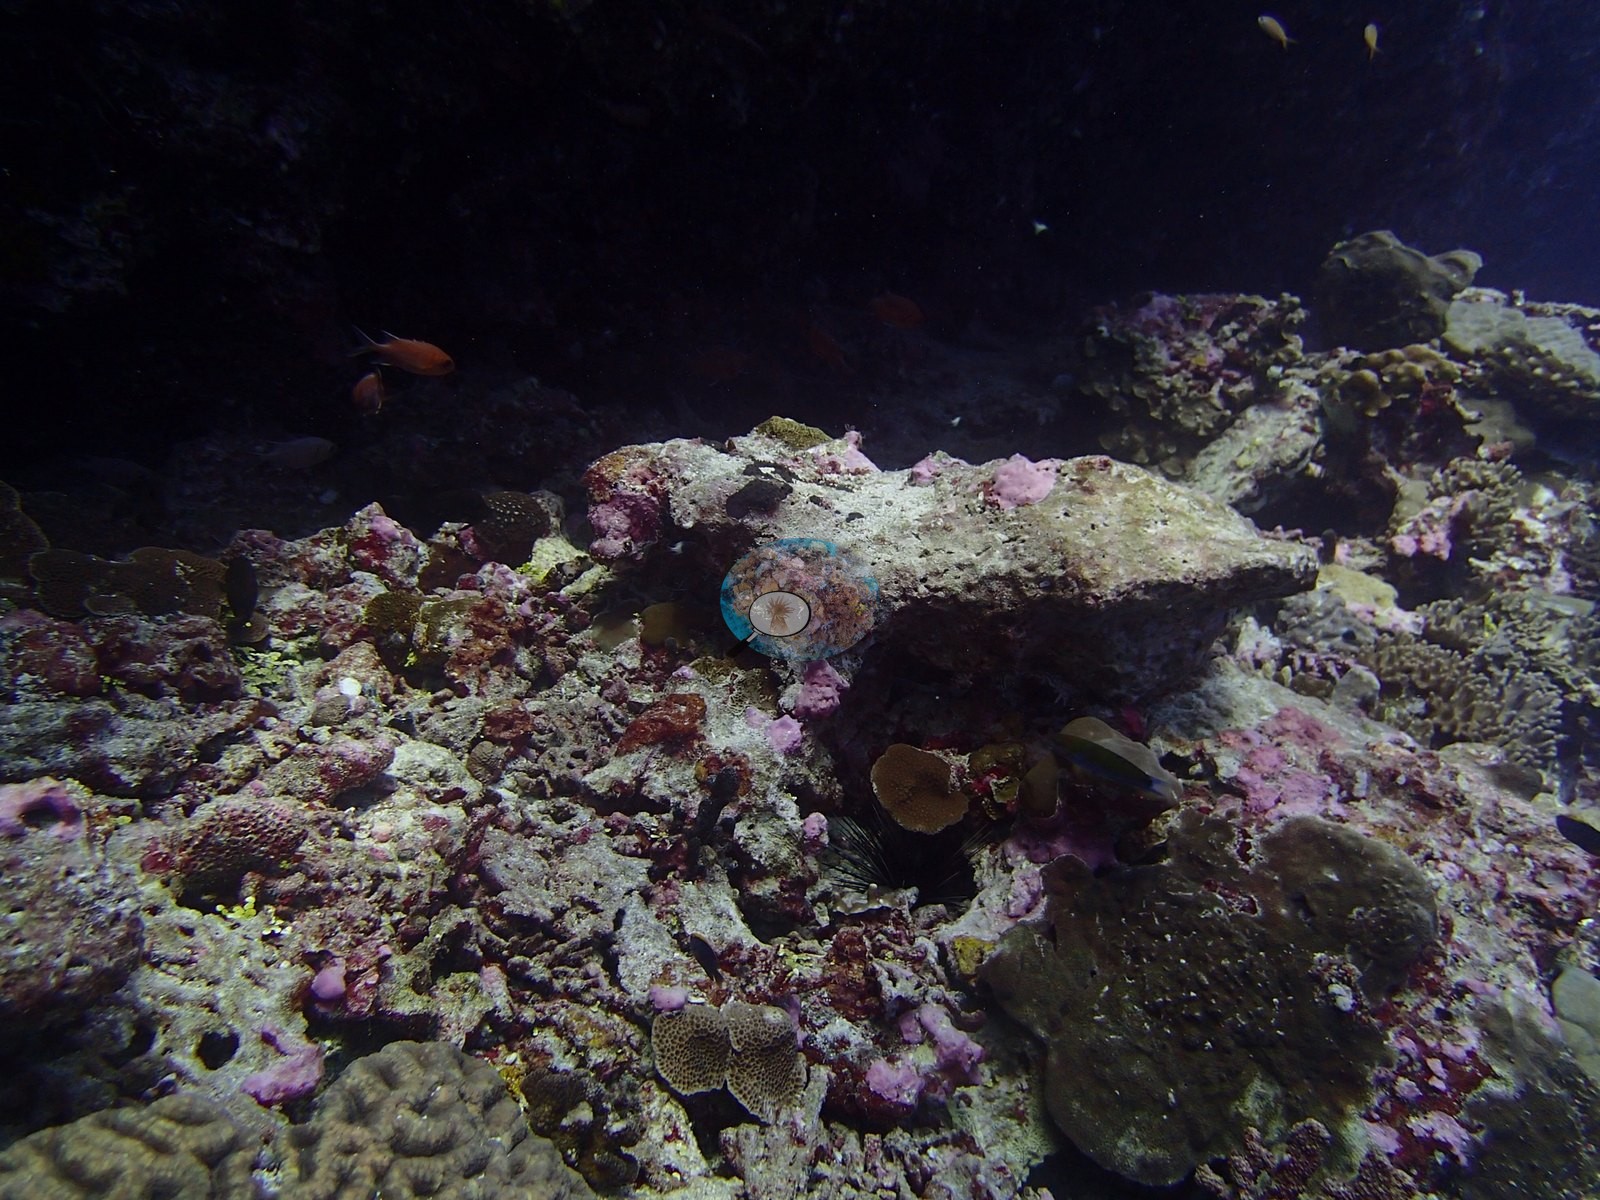
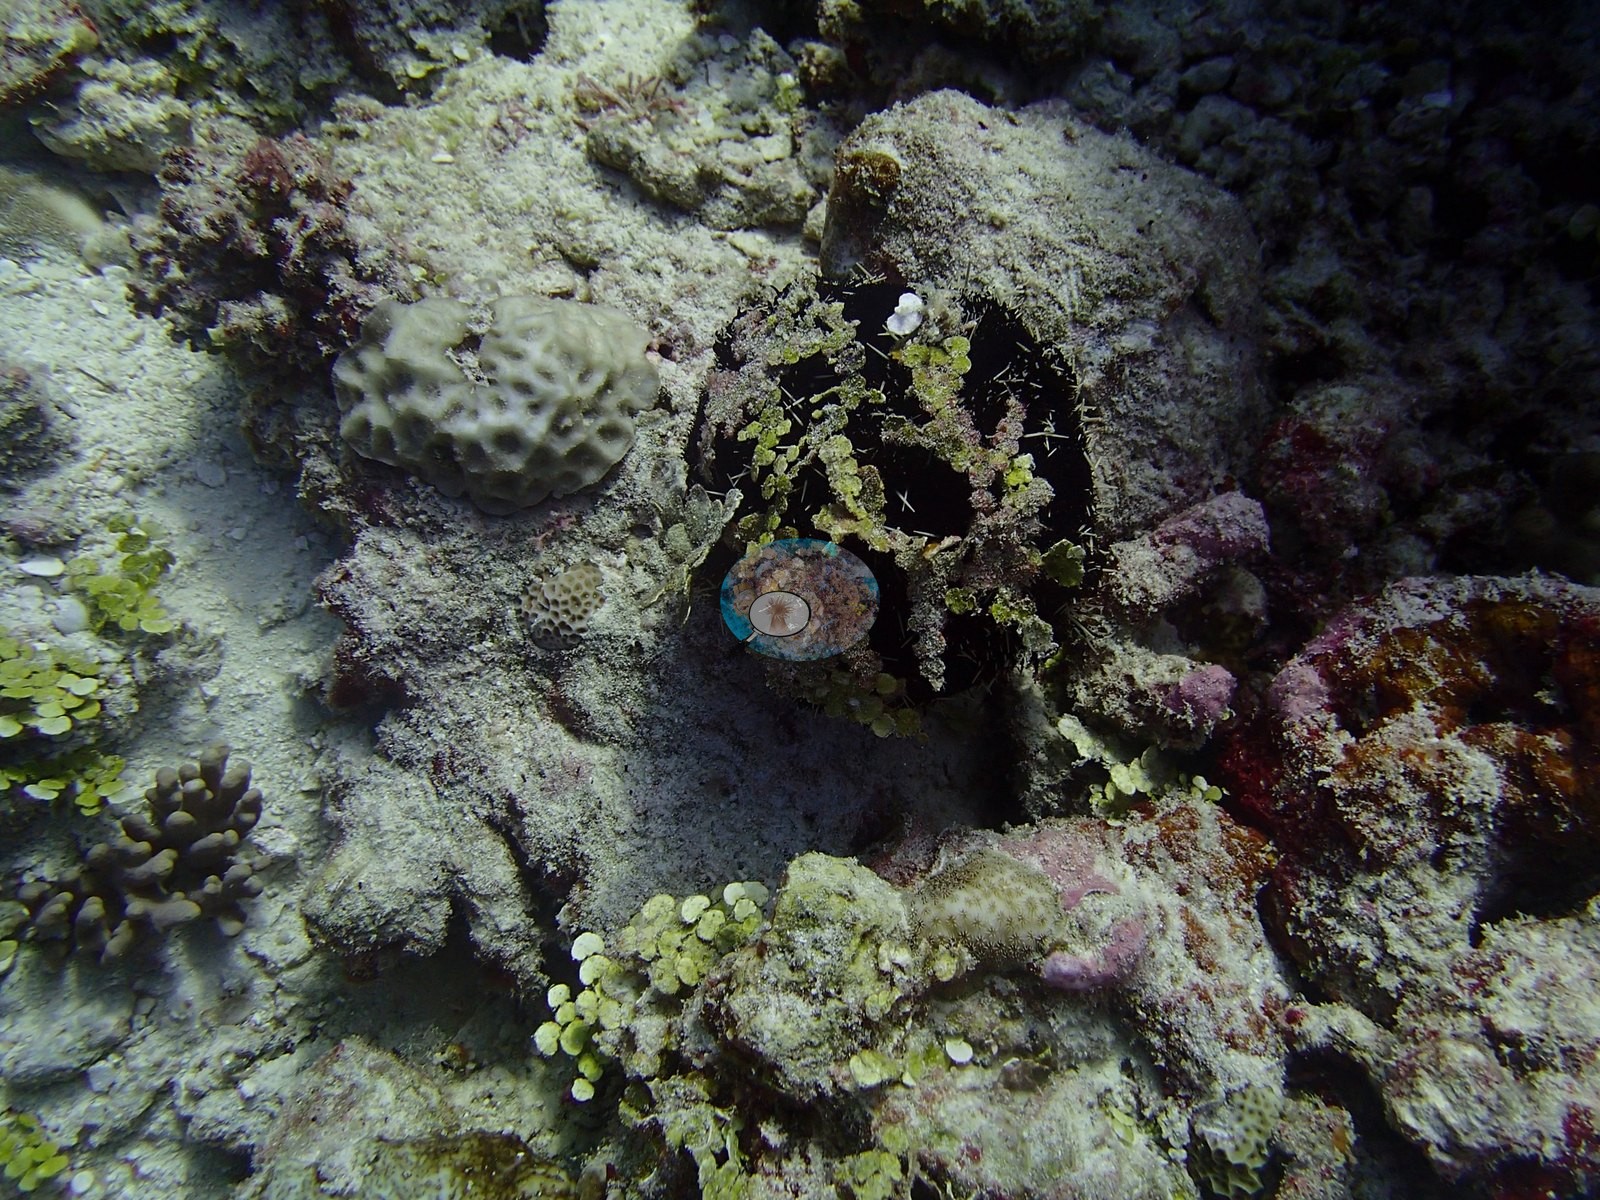
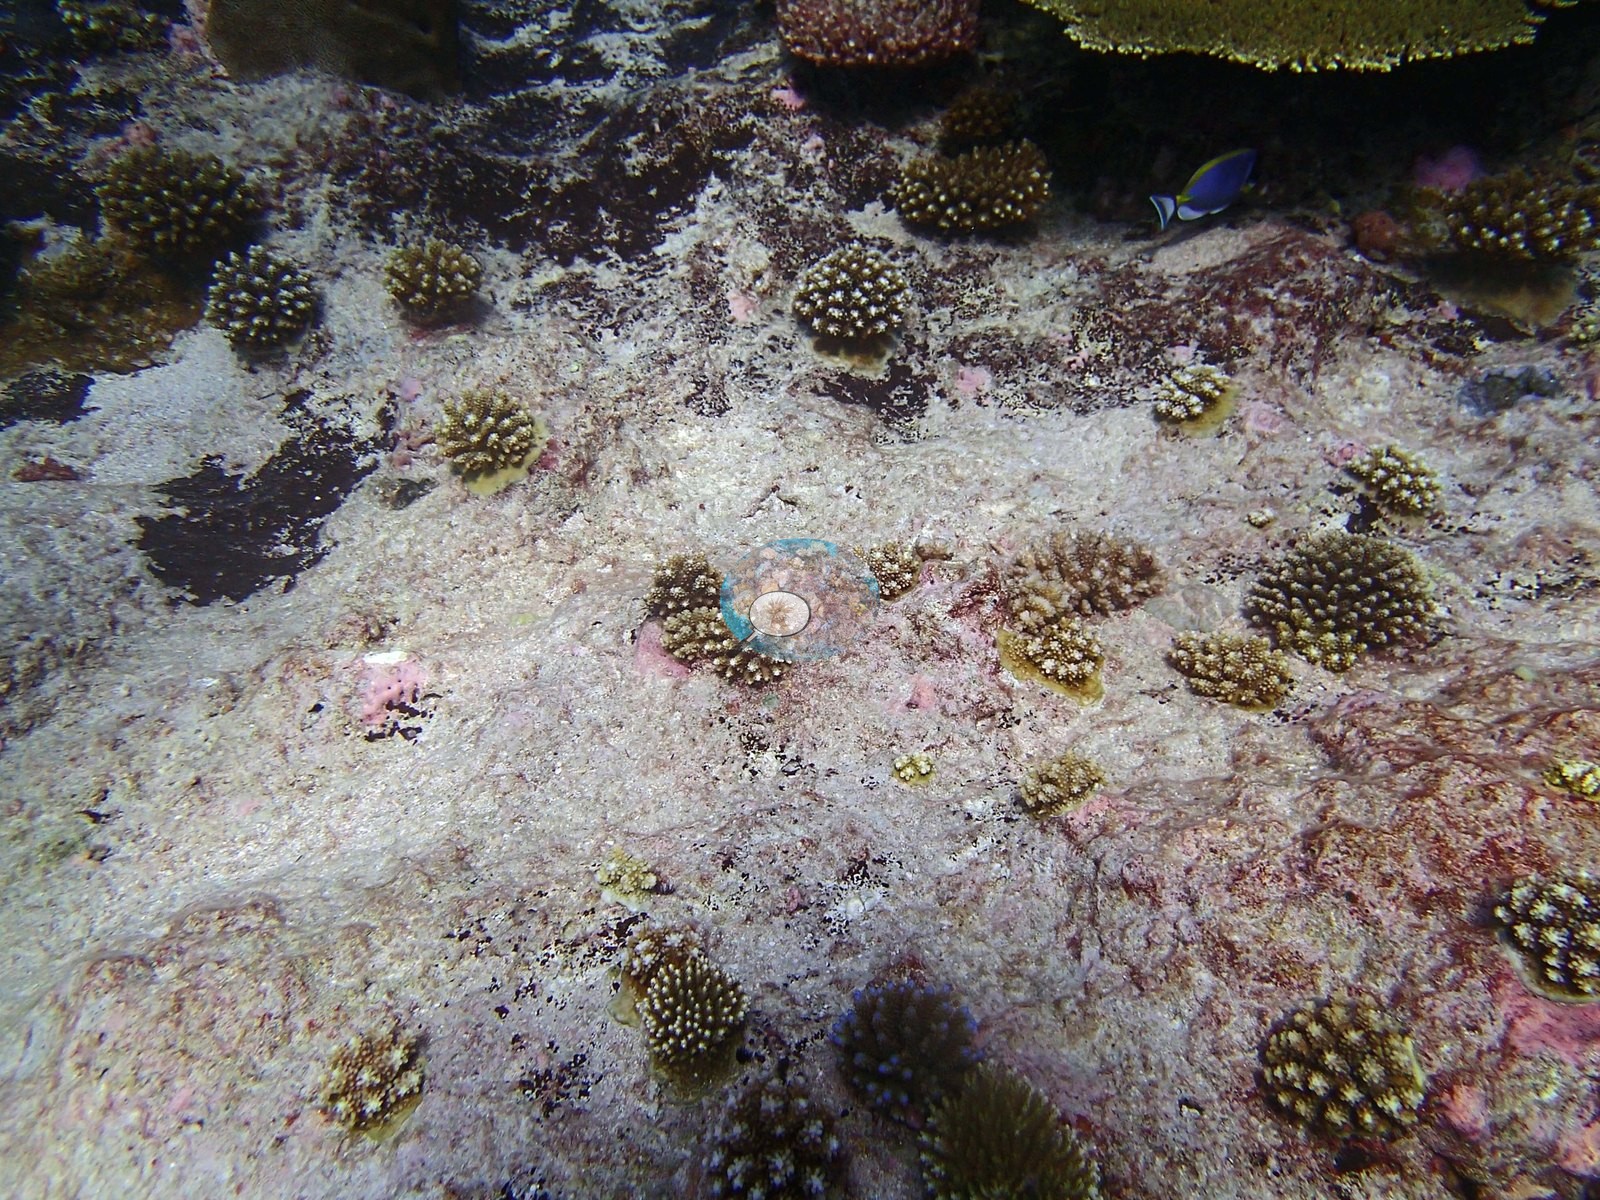
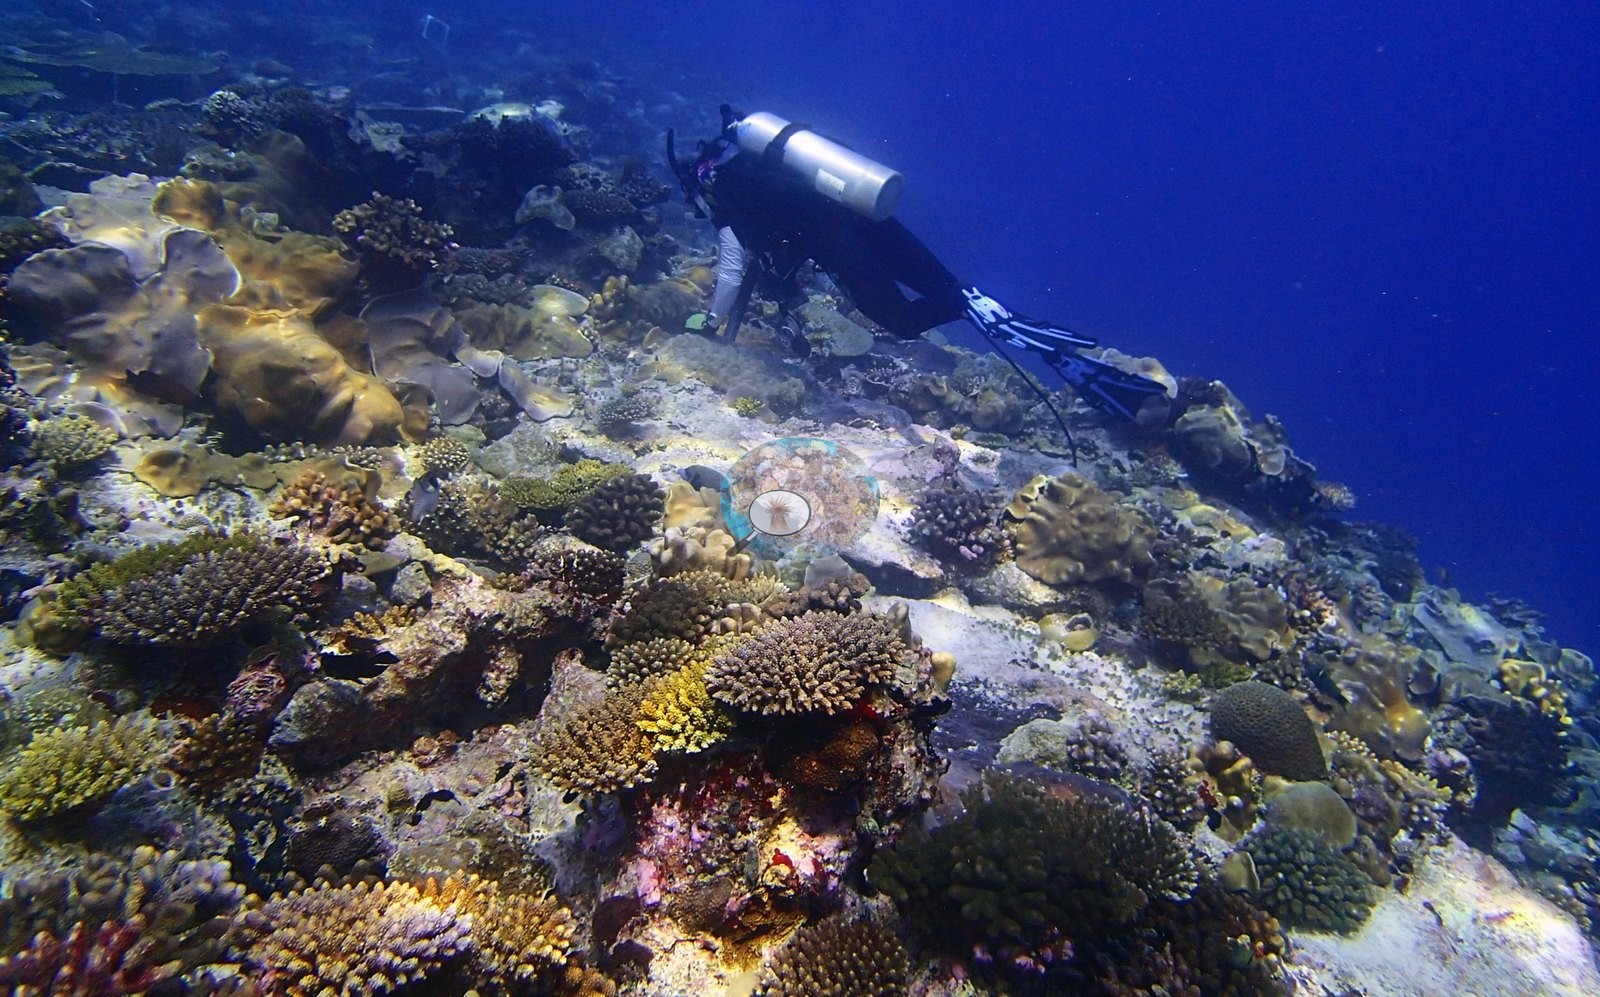
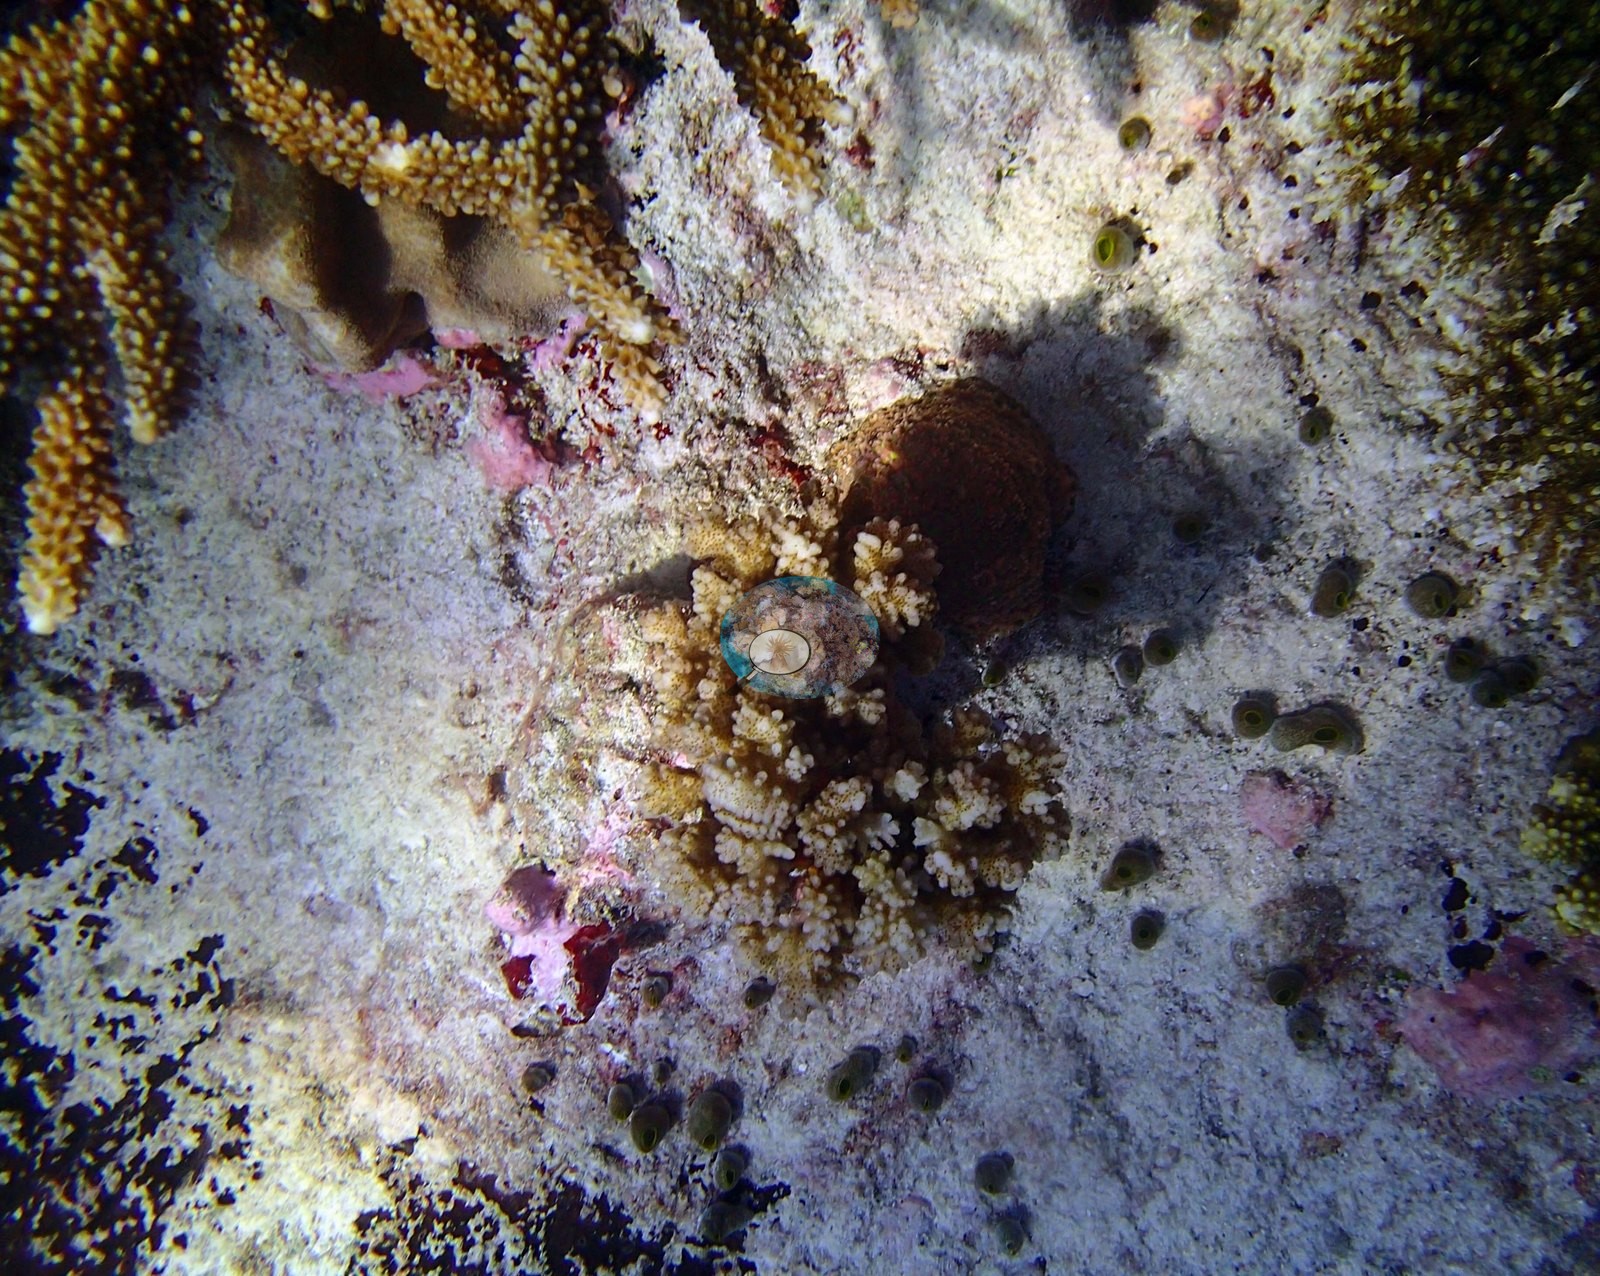
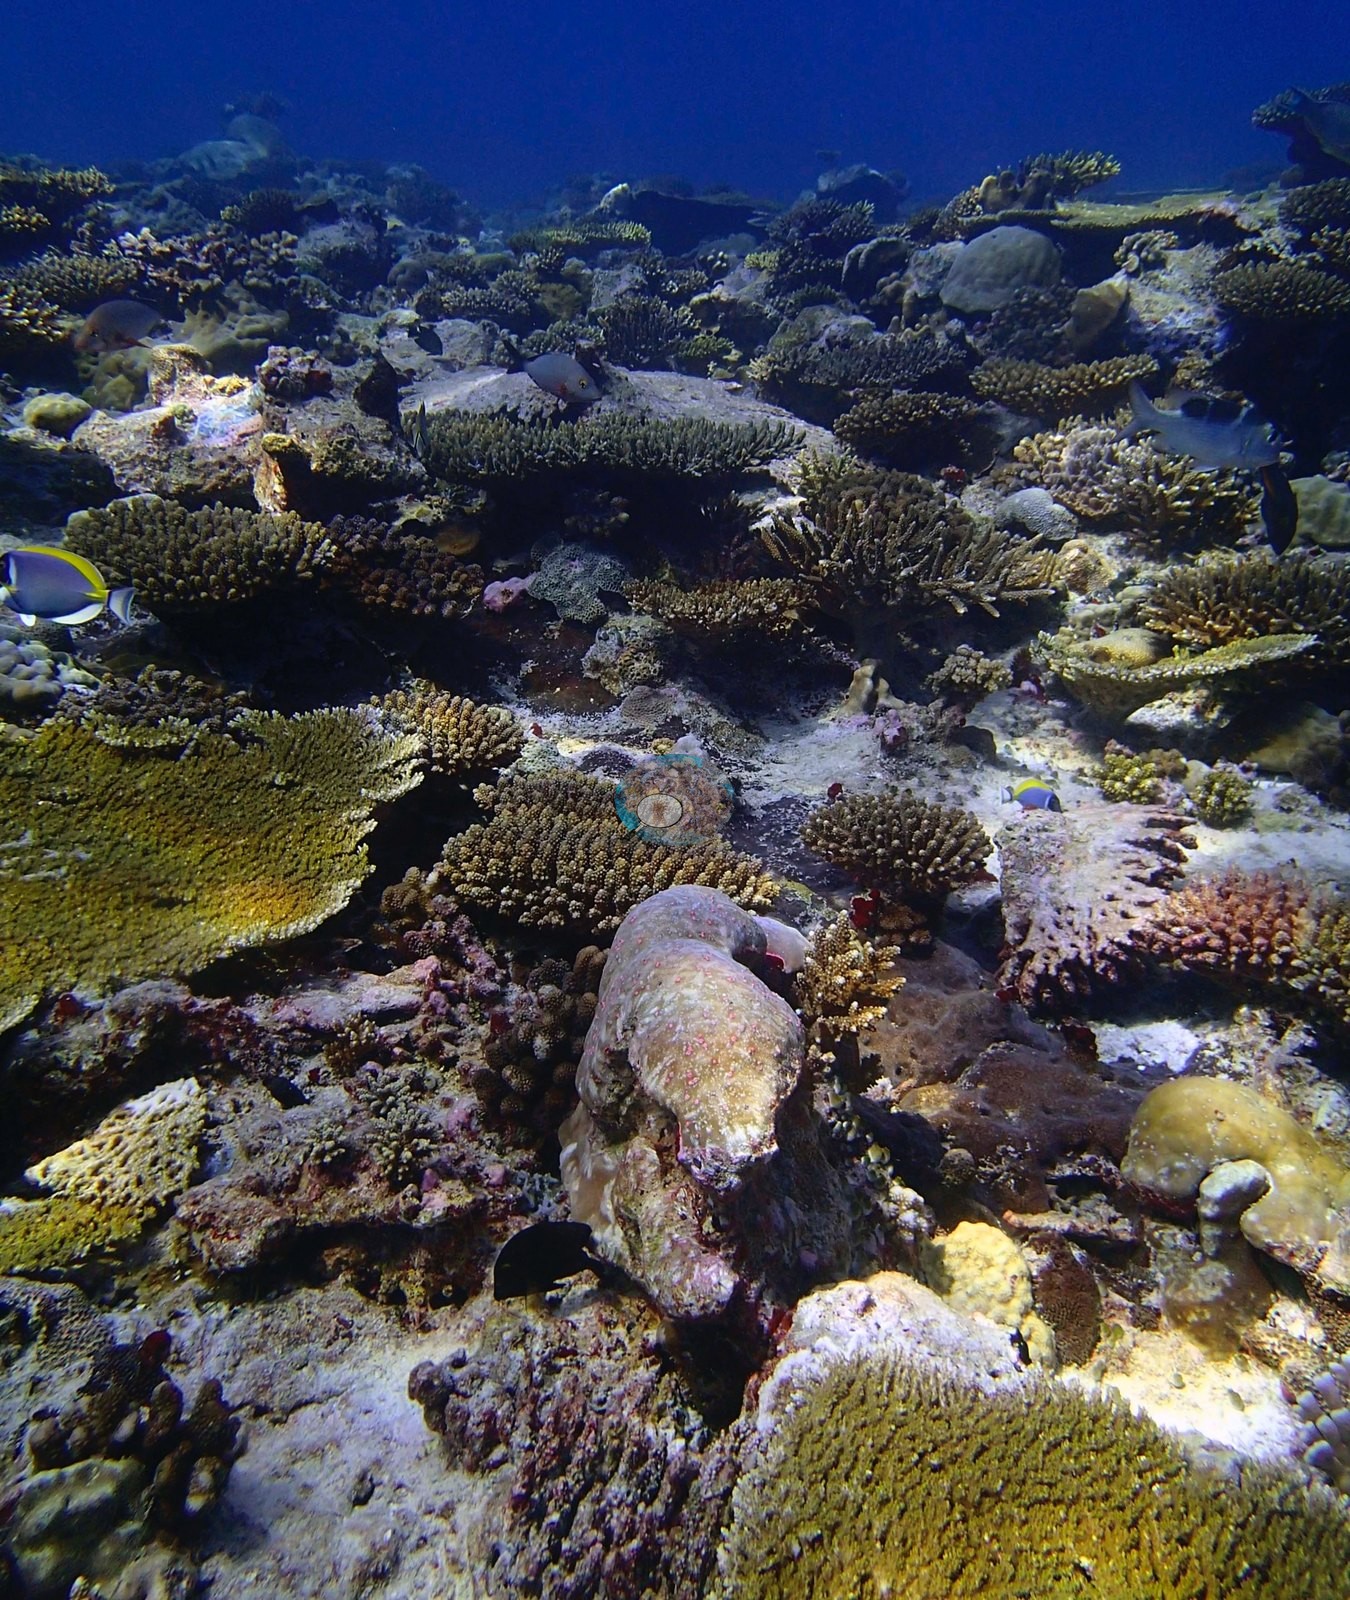
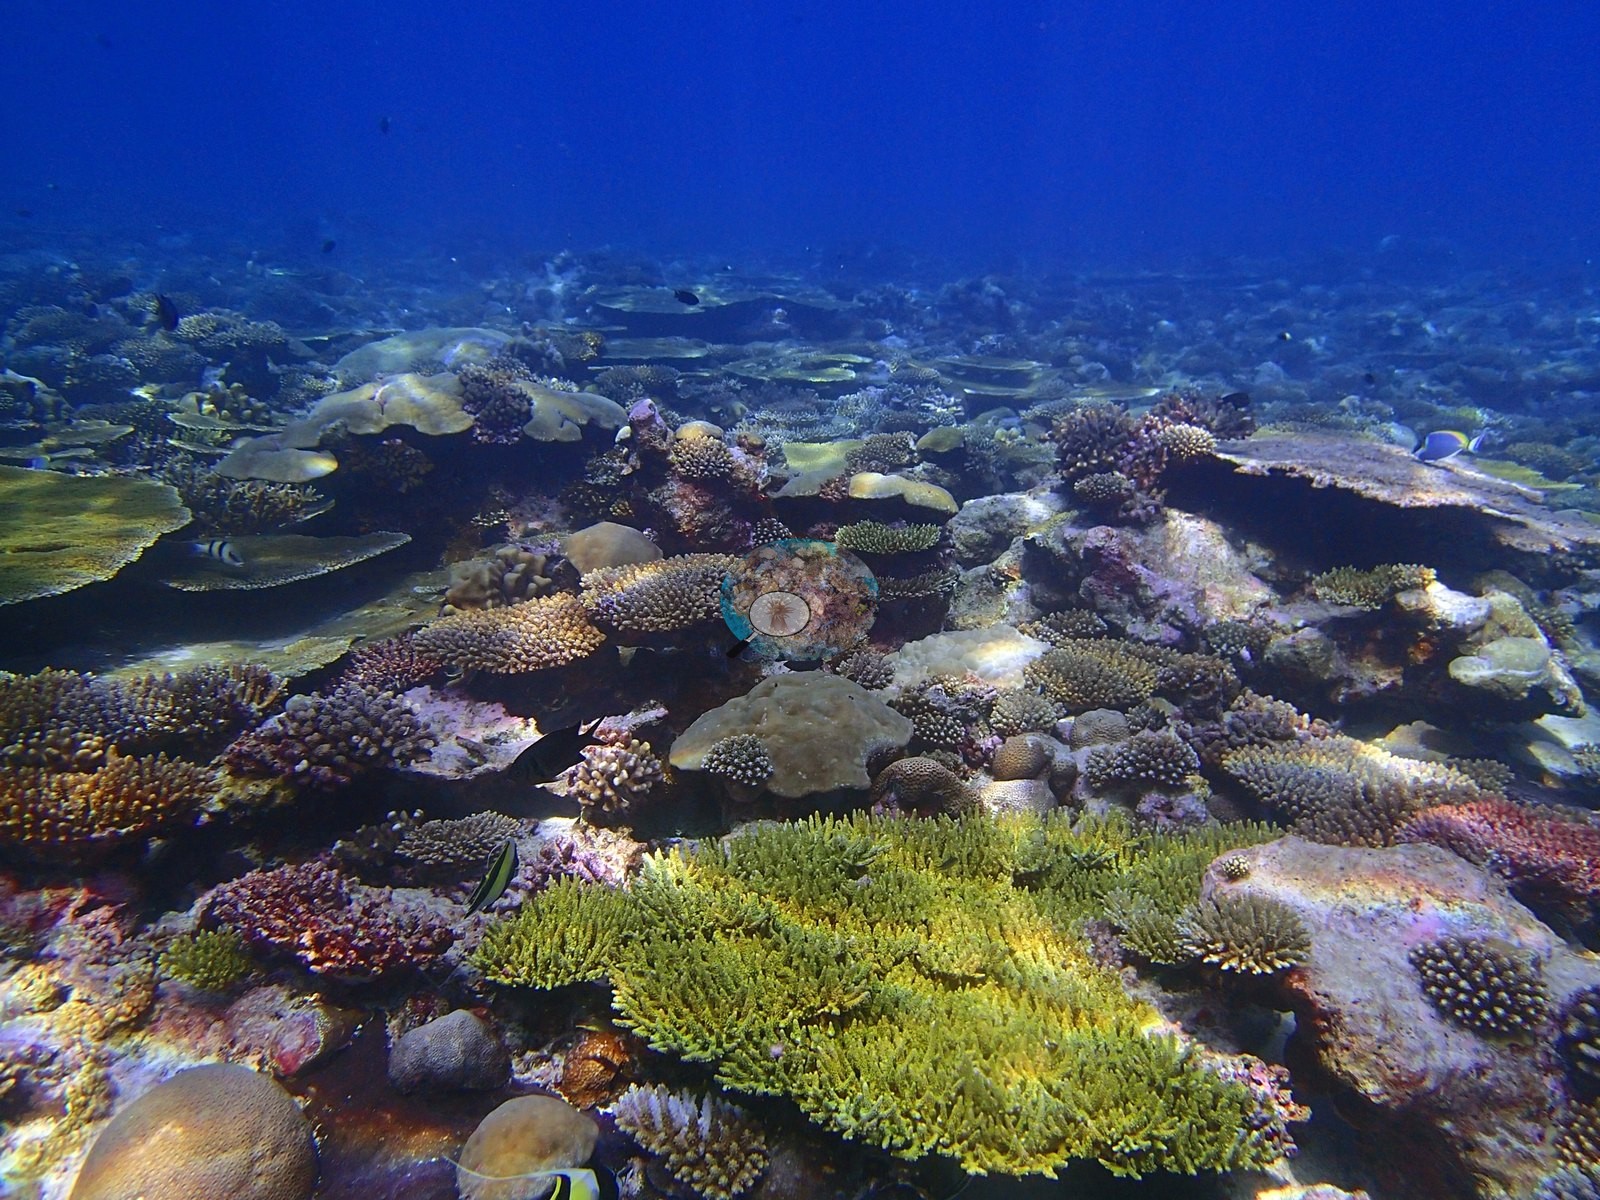
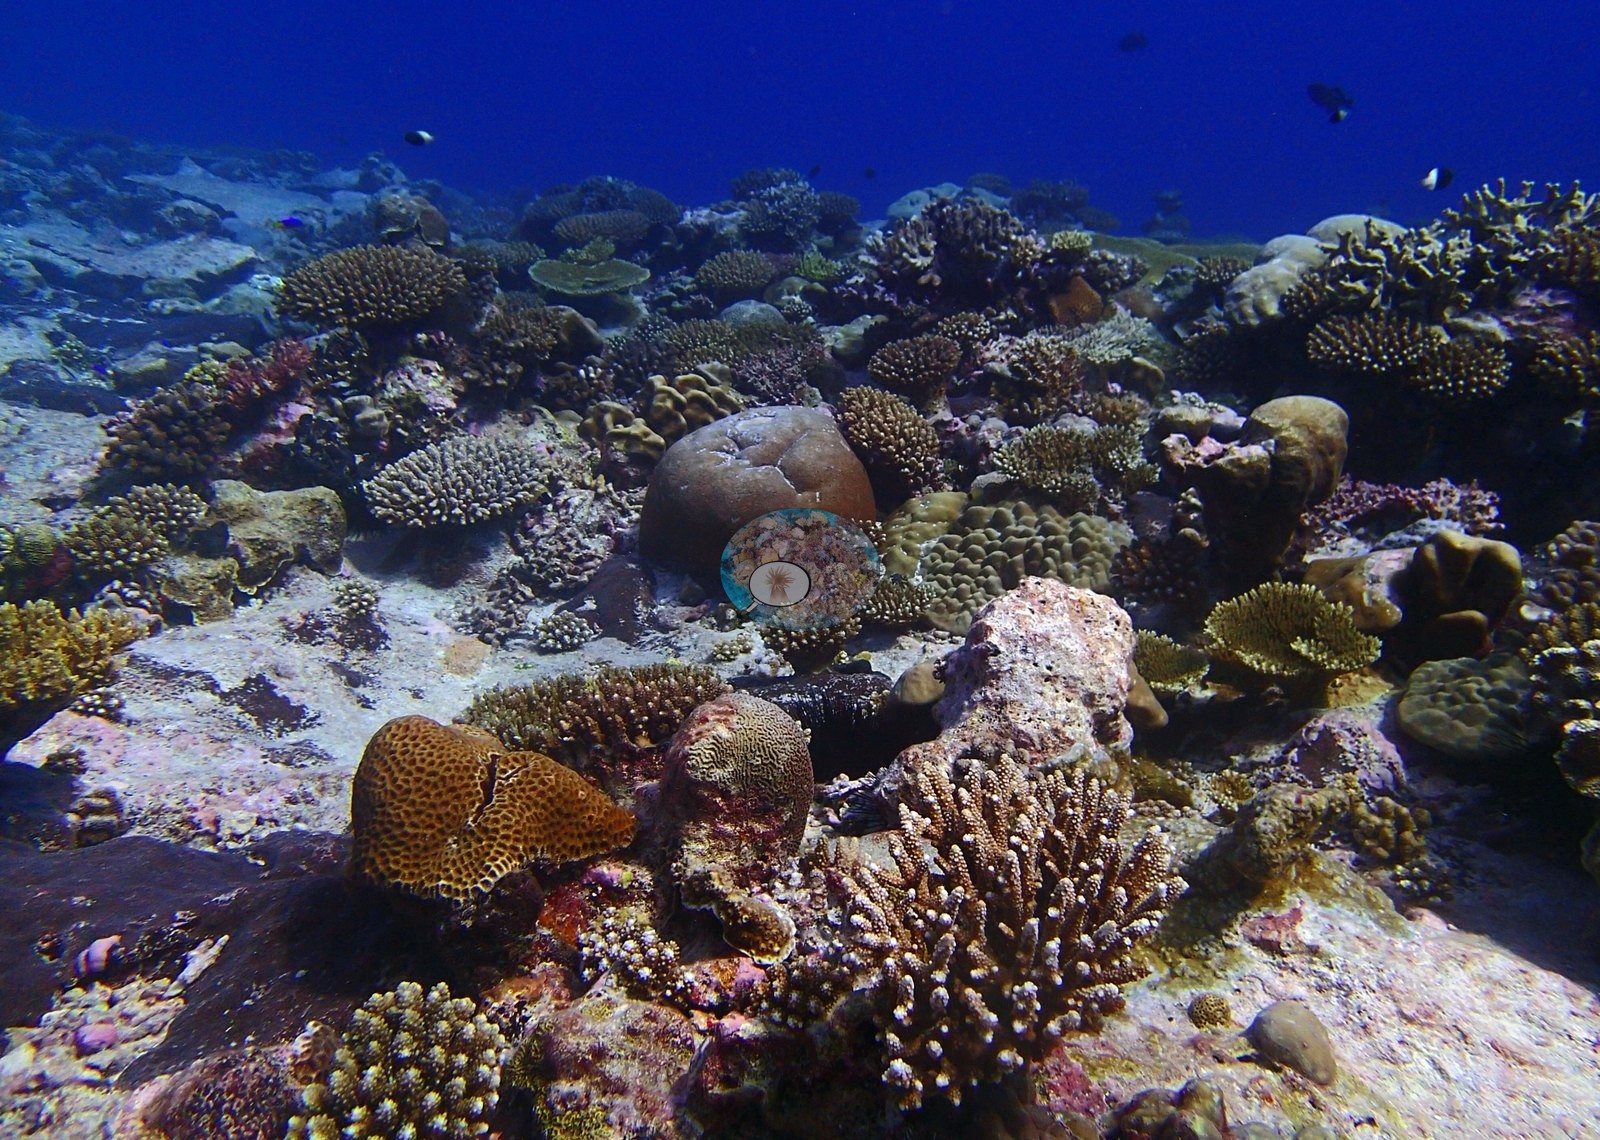
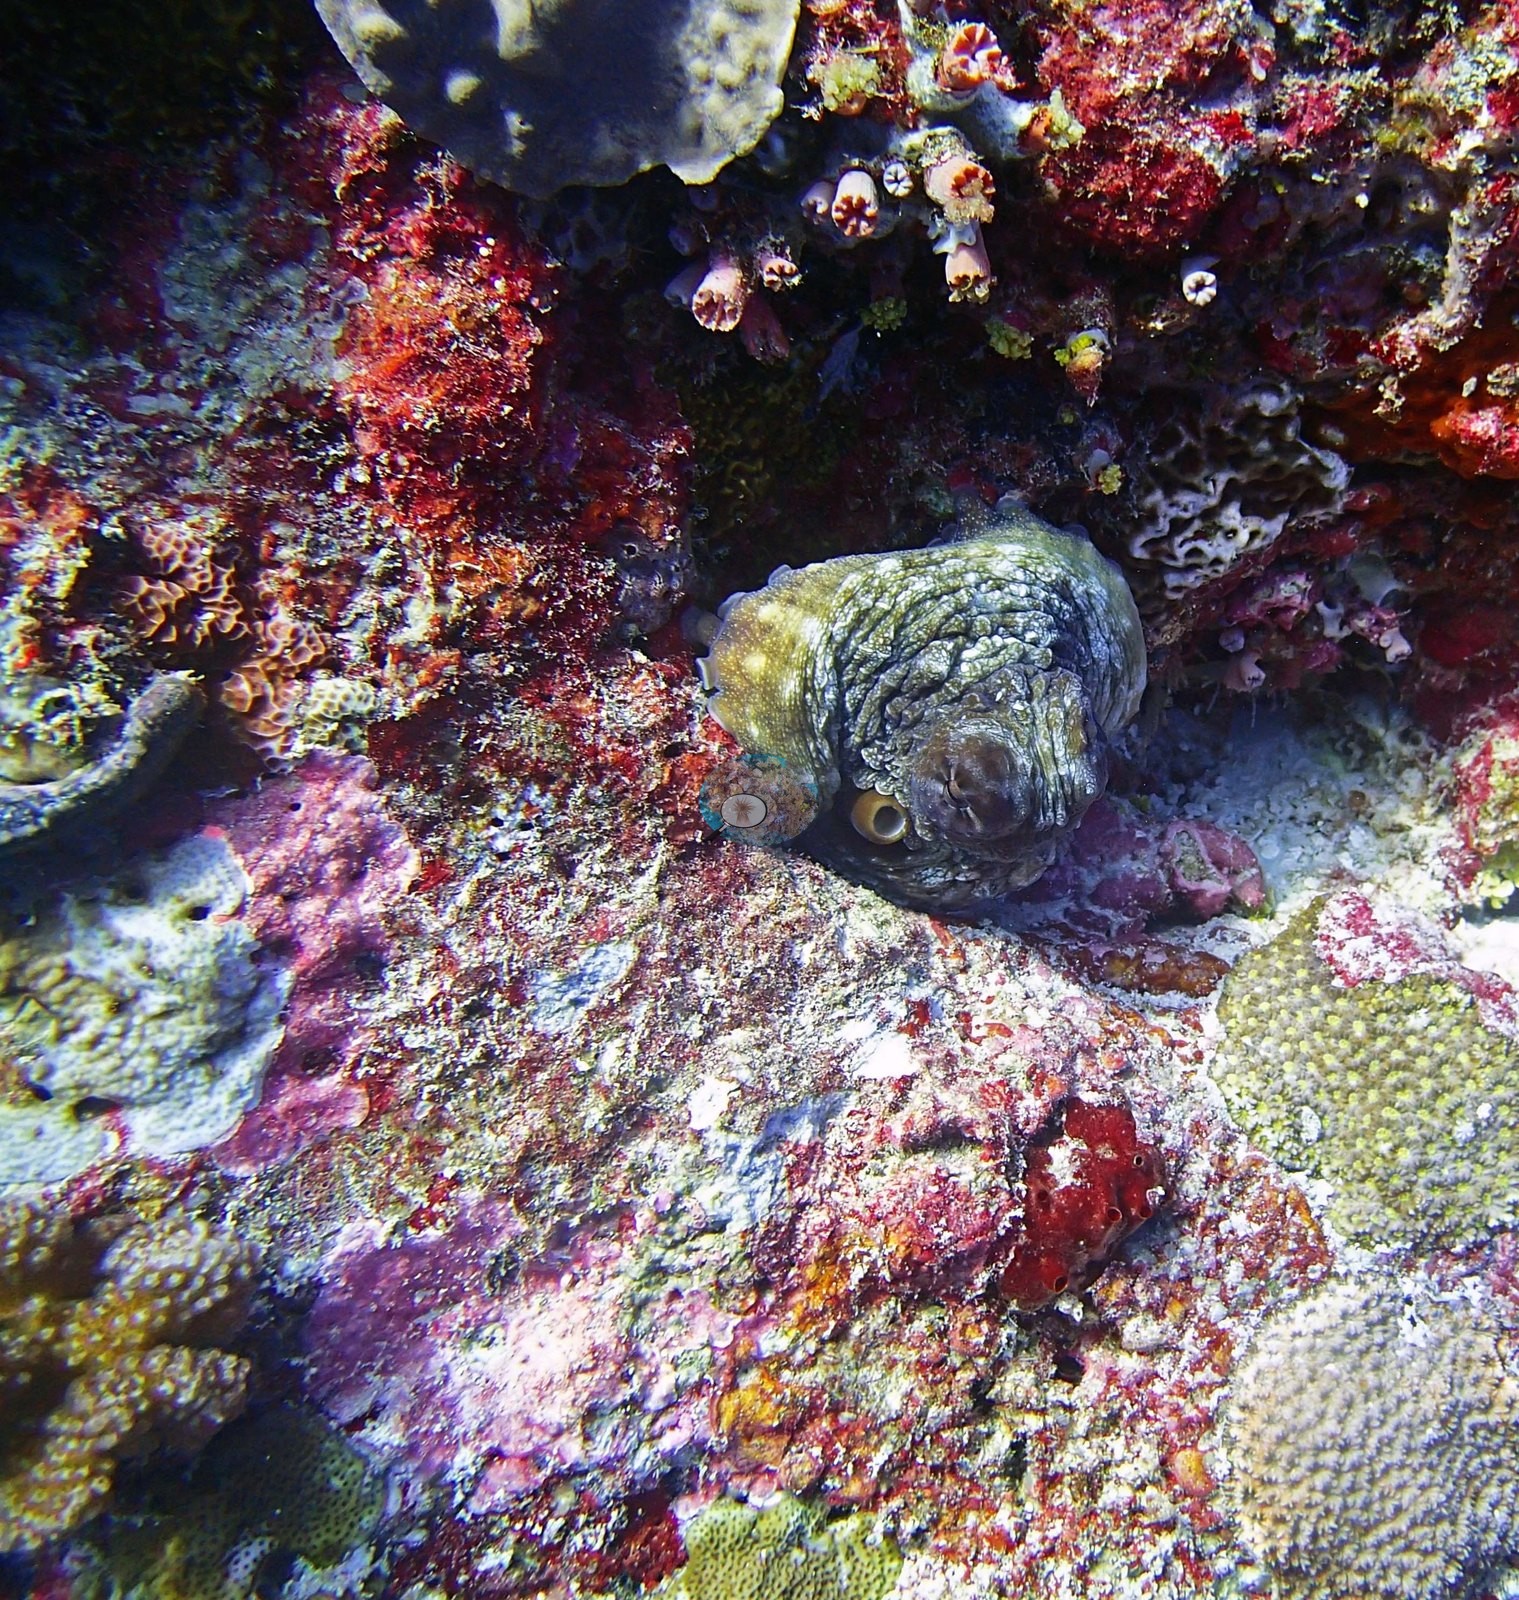
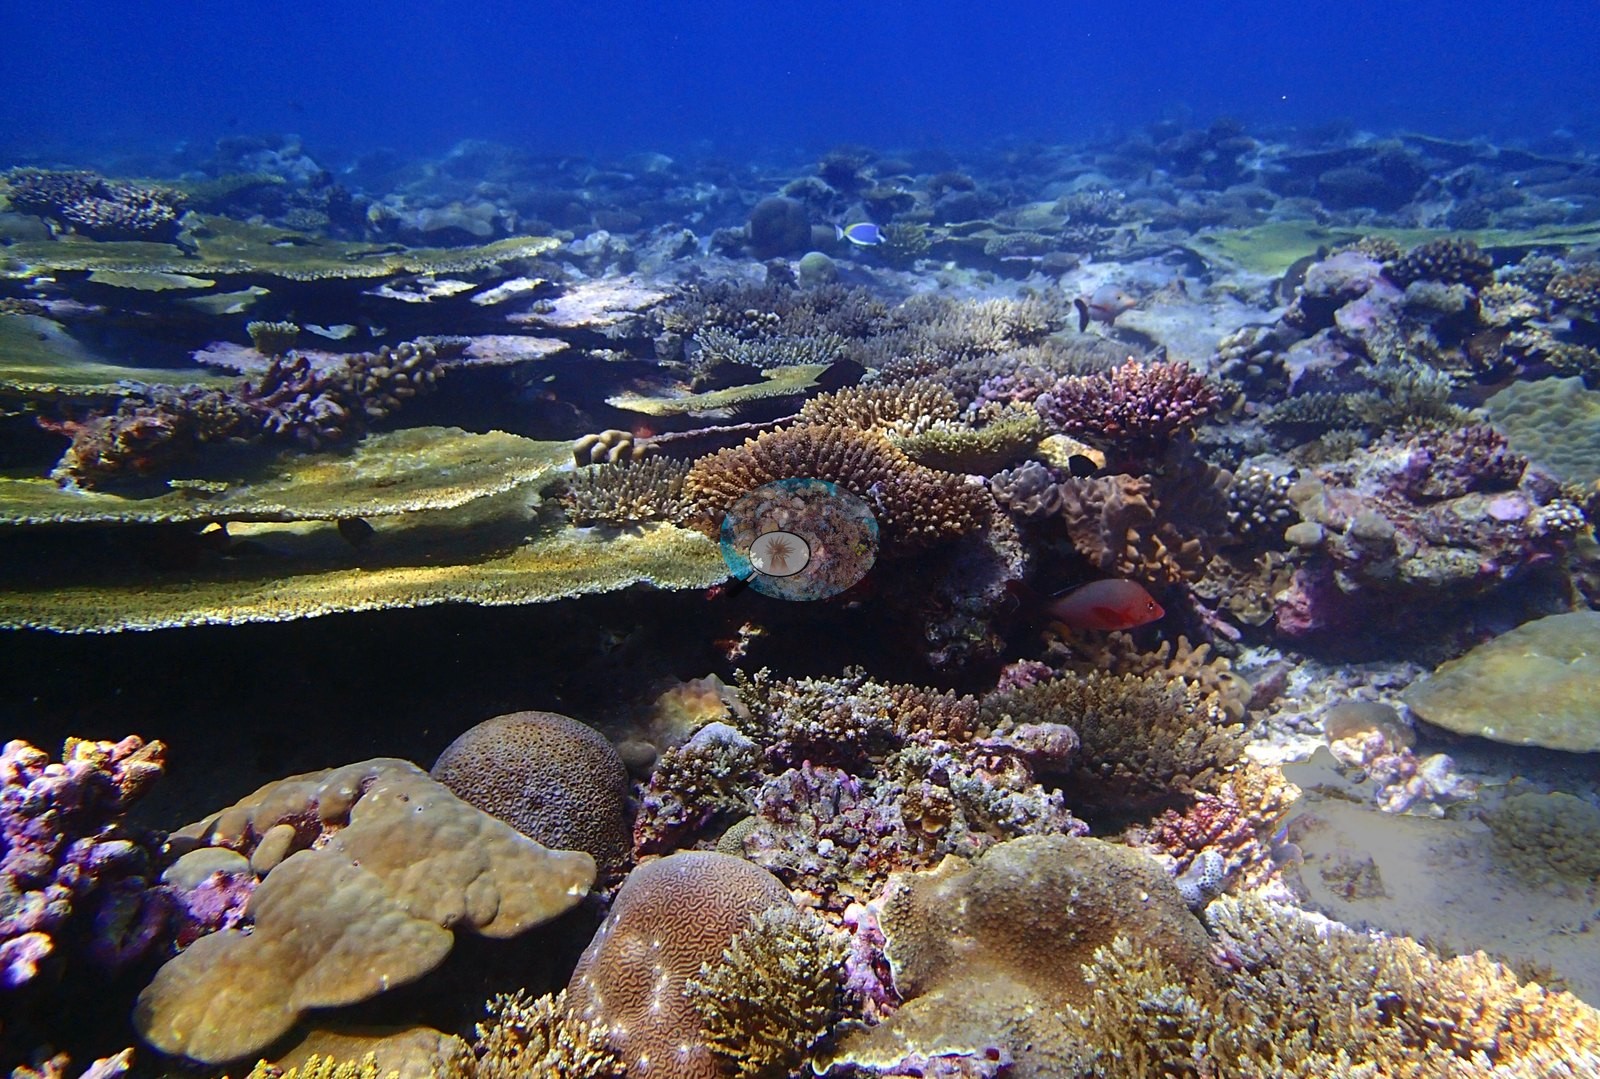
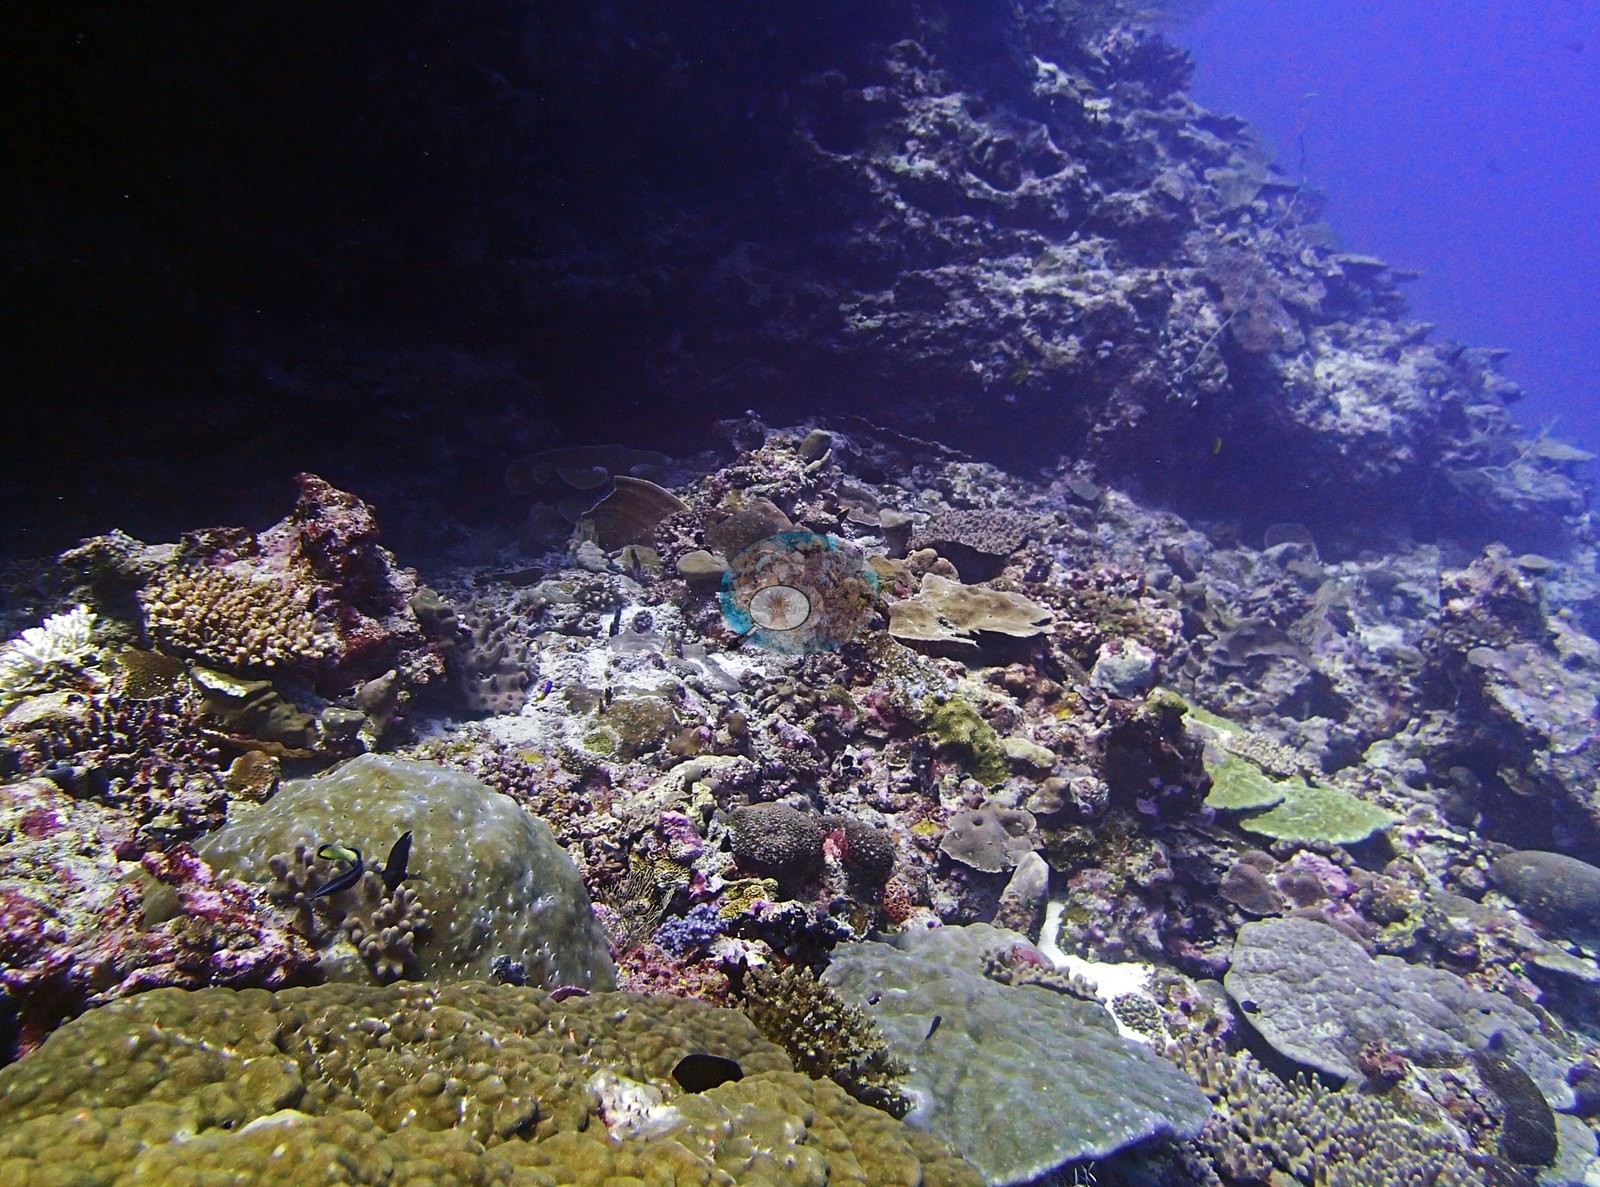
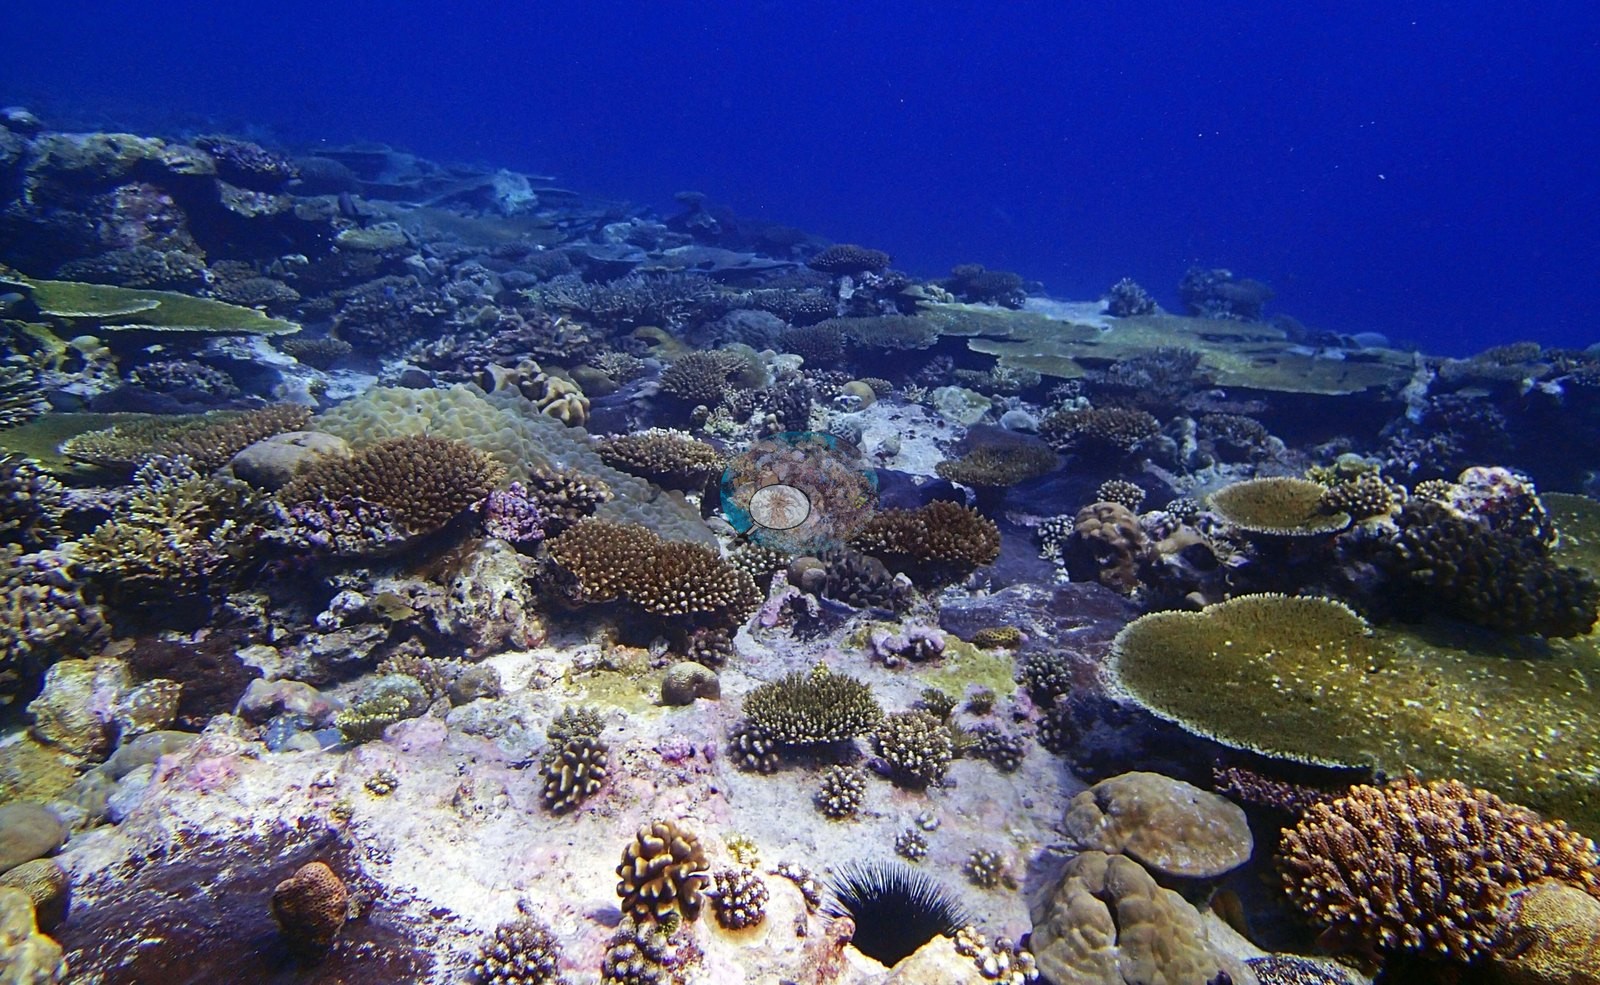
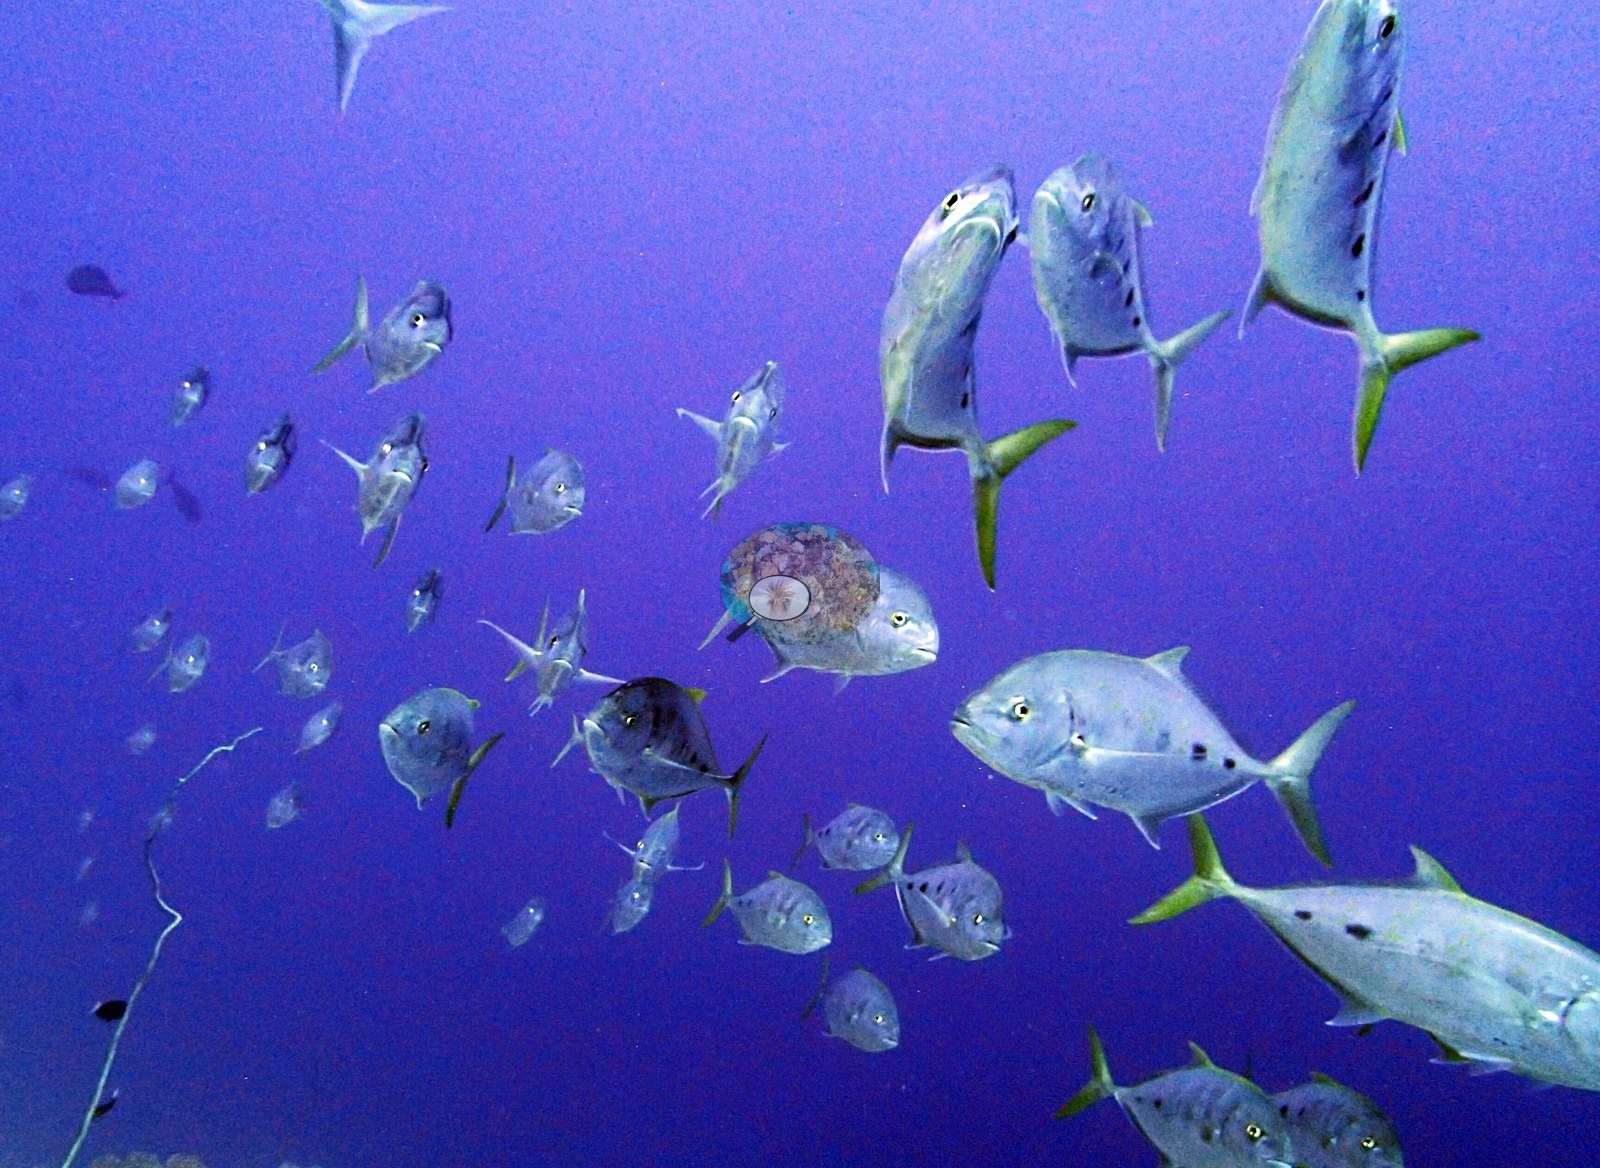
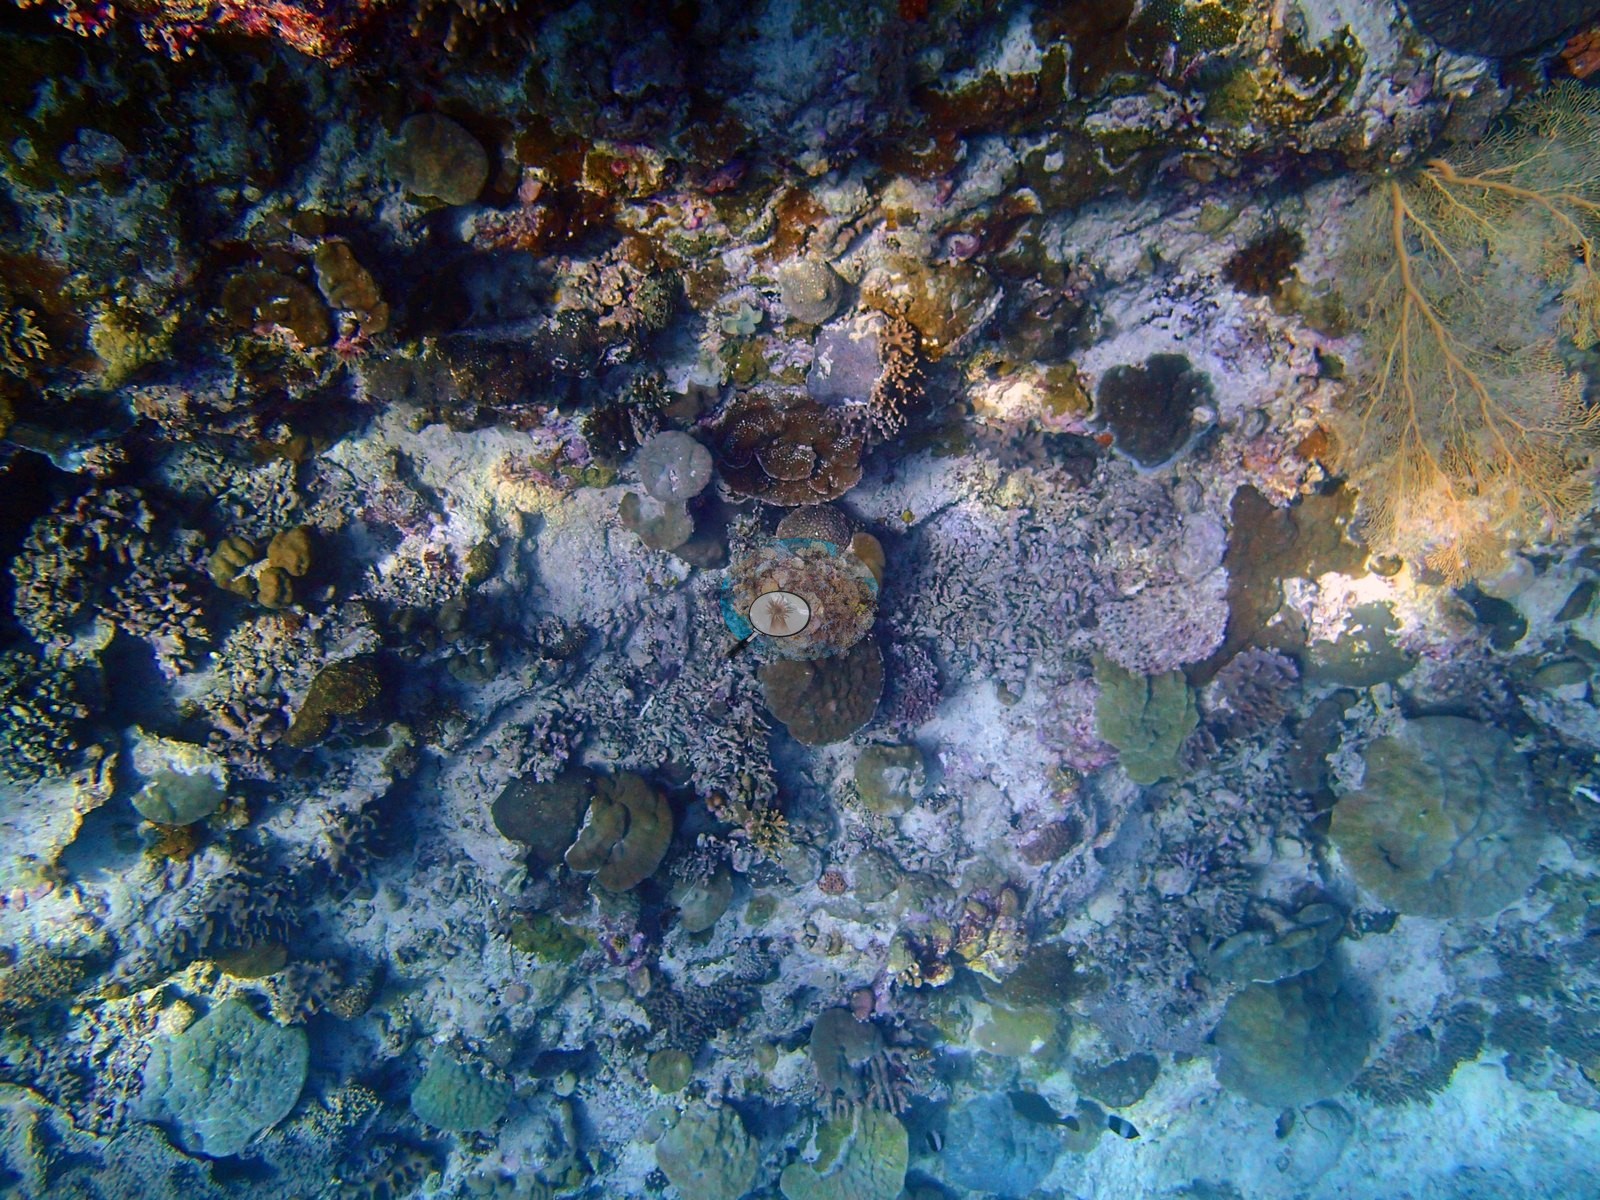
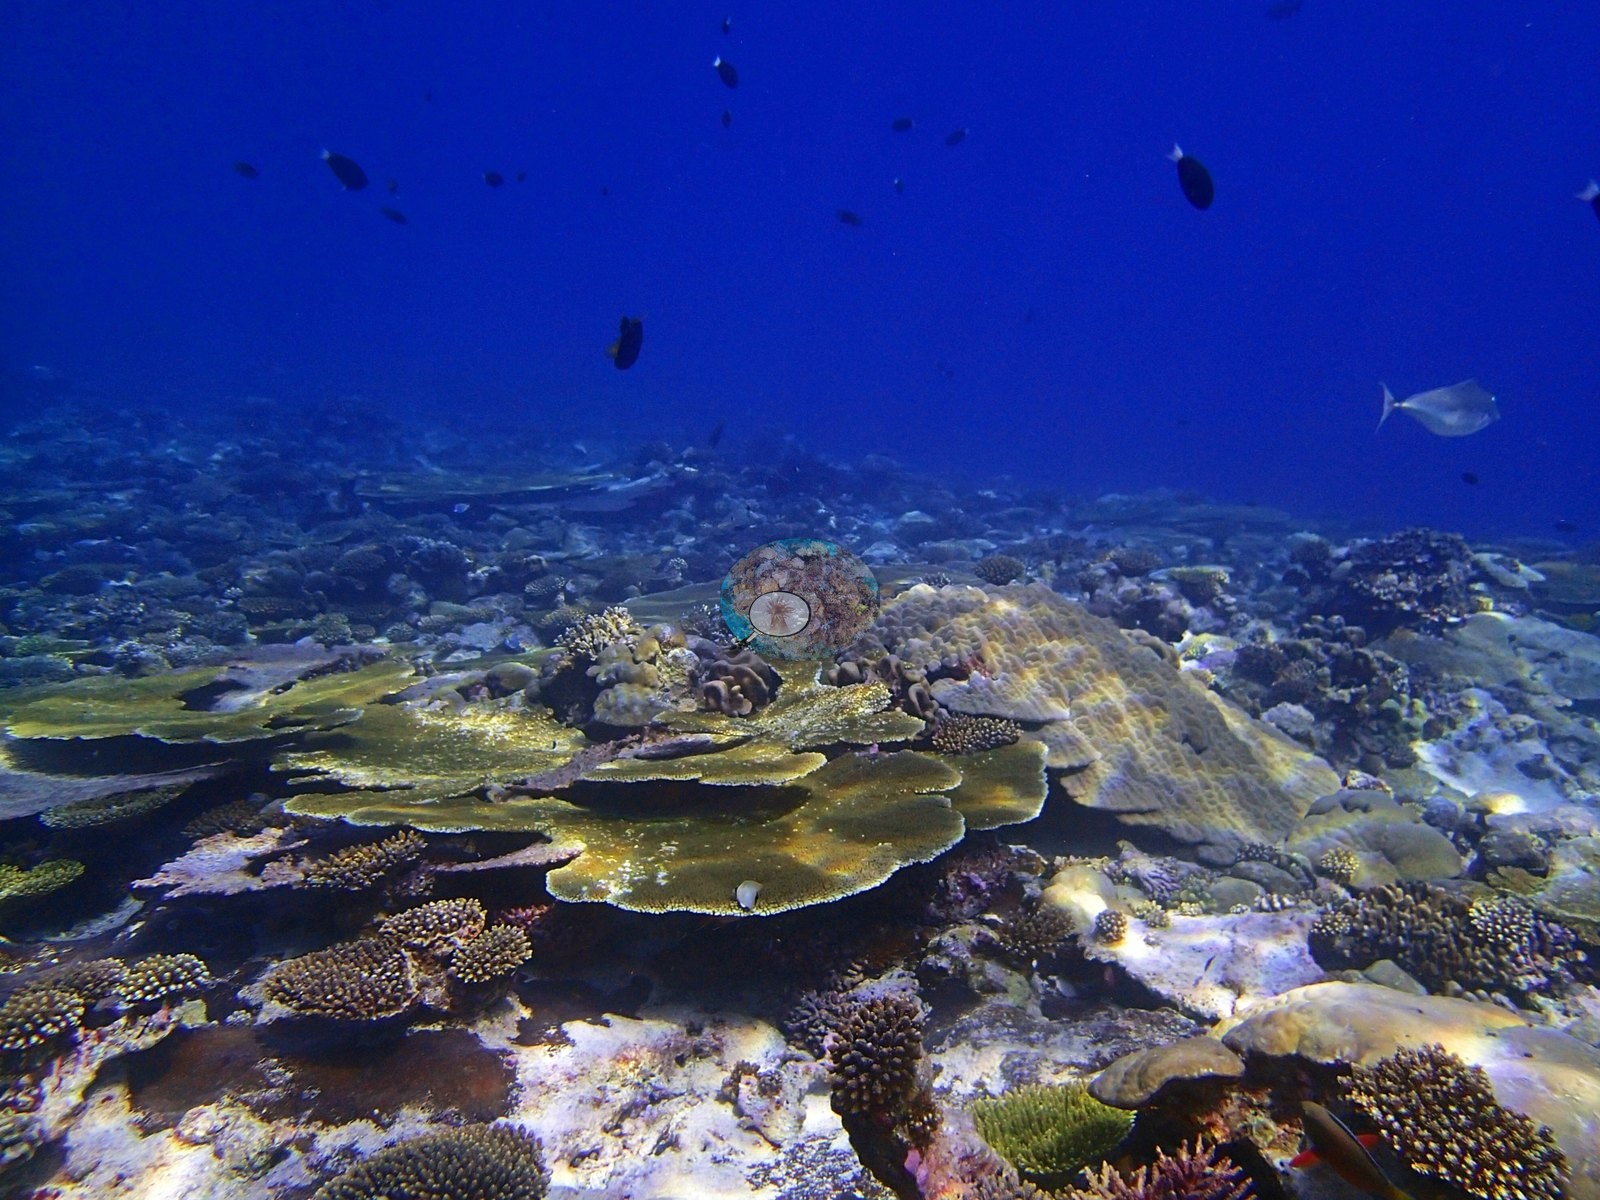
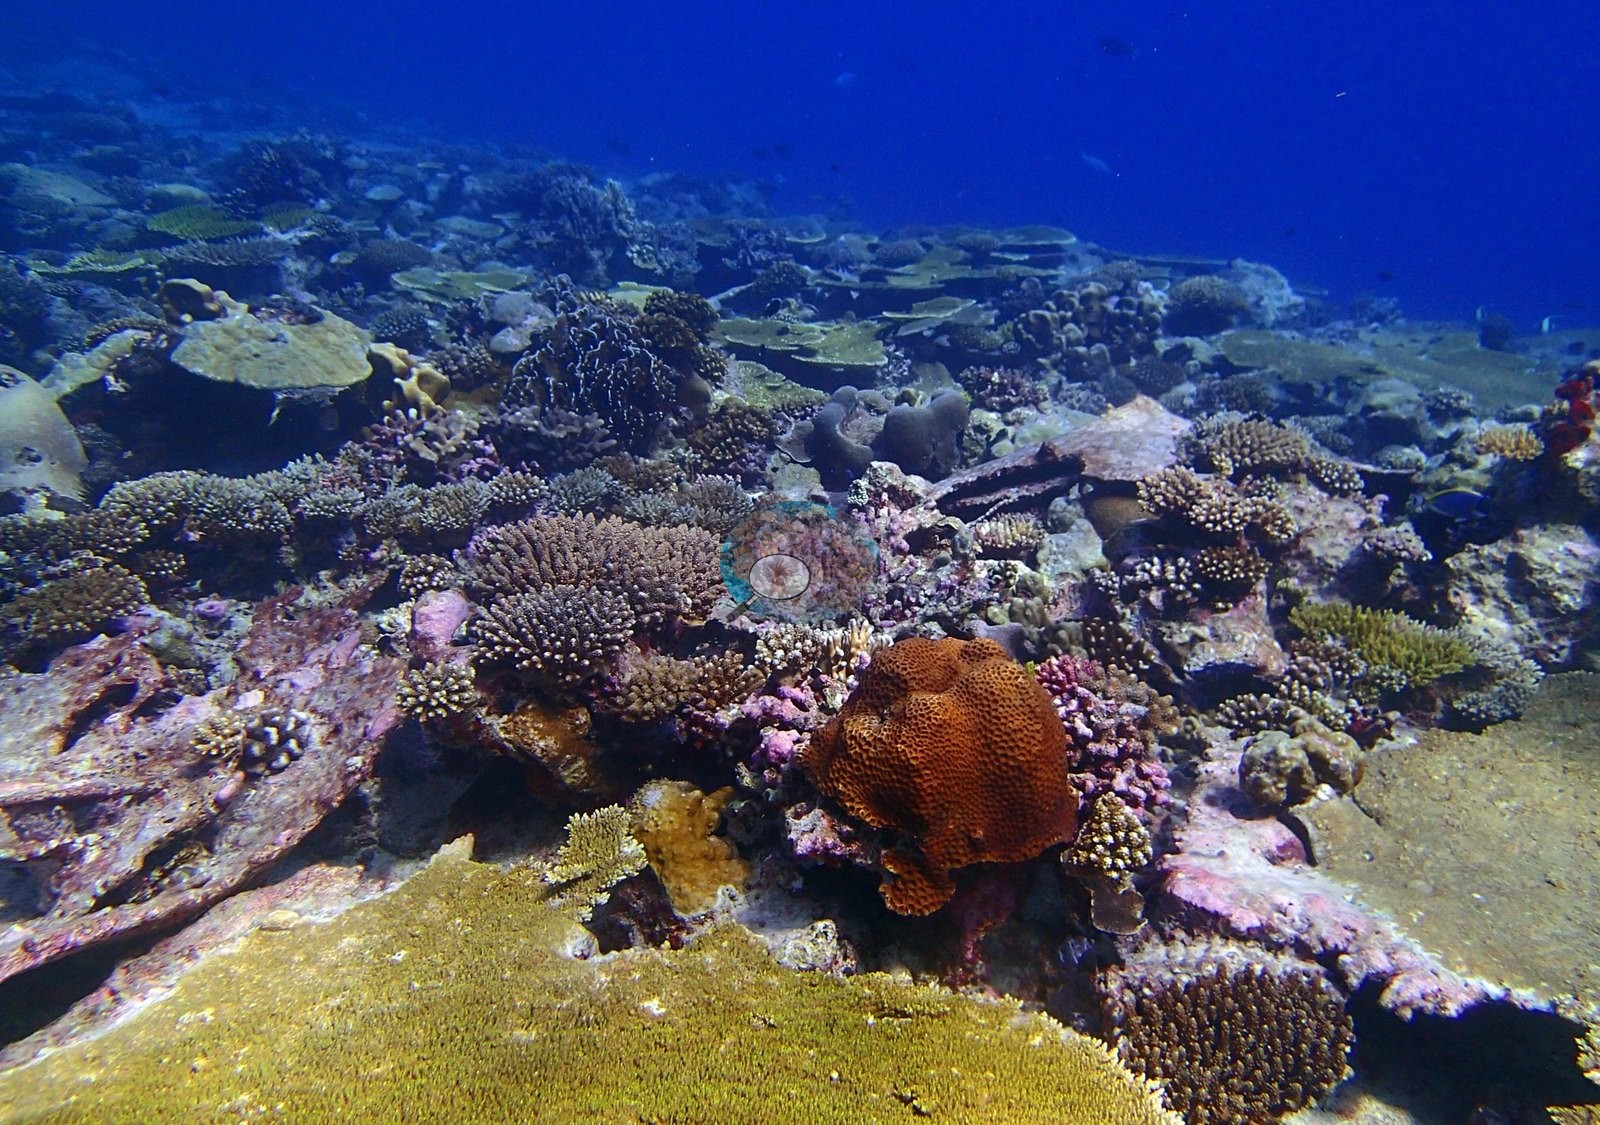
The site-level genus list is the broadest of this batch — 29 non-zero genera (LOF BIOT-1 survey, supplemental file S1): Acropora 13.97%, Porites 7.95%, Pocillopora 3.81%, Montipora 3.15%, Leptastrea 1.05%, Favites 1.02%, Pavona 0.84%, Astreopora 0.84%, Goniastrea 0.71%, Favia 0.70%, Millepora 0.66%, Echinopora 0.64%, Stylophora 0.55%, Gardineroseris 0.47%, Psammocora 0.44%, Symphyllia 0.39%, Leptoseris 0.38%, Heliopora 0.23%, Montastrea 0.20%, Cyphastrea 0.18%, Platygyra 0.15%, Pachyseris 0.13%, Coscinarea 0.11%, Hydnophora 0.09%, Cantharellus 0.05%, Galaxea 0.04%, Oulophyllia 0.02%, and Lobophyllia and Plesiastrea at 0.008% each. The blue coral is Anderson's own determination: the LOF codebook reads the HELI code as Heliofungia, but the field data are Heliopora, determined by A. Mayfield (expedition coral-physiology lead) on 2026-08-25. Algae is mostly crustose coralline algae 19.93%, turf 8.29% and sediment-laden turf 4.40%, with erect algae 1.61% and macroalgae 1.24%; barren substrate is only 5.08%, and non-coral invertebrate cover (PITS) is 20.69%. The photographs and the transects agree on the major coral groups. The point set assigns 66.7% of live coral points to Acropora, 15.0% to Porites, 2.3% to Pocillopora and 16.0% to other hard coral. Coralscapes divides live area among non-tabular Acropora (32.4%), tabular Acropora (19.9%), massive and meandroid forms (21.4%), other hard coral (14.2%) and Pocillopora (7.5%). Those image classes are coarser than the 29 non-zero formal genera and should not be treated as genus identifications, but they independently recover the same Acropora-led architecture the transects record. The set moves through two distinct settings. Roughly the first third (P3200386–P3200442) works a steep outer wall and its upper flank: near-vertical rock stepping down into blue water, shaded overhangs and recesses, and a veneer community of encrusting and small plating stony corals, mauve and lavender branching colonies, pink and maroon crustose coralline algae, red and orange encrusting sponges, cup corals along an undercut lip (P3200437), and slender pale-yellow gorgonian sea fans standing off the wall (P3200405, P3200406, P3200435, P3200438). P3200403 is the cleanest wall view: overlapping tan and green plates, small digitate and corymbose colonies, massive and meandroid heads and vivid pink CCA descending along an exposed face. From about P3200443 onward the camera is on the reef top and terrace and the character changes completely: a near-continuous, structurally complex carpet of stony coral, dominated frame after frame by Acropora-compatible forms — broad flat tables, stacked and overlapping plates, dense corymbose and digitate thickets in olive, tan, mauve-pink, and a distinctive chartreuse green — interspersed with rounded massive Porites-compatible domes, a large yellow-green massive with coarse separated corallites compatible with Diploastrea (P3200441), bushy Pocillopora-type colonies, foliose and encrusting forms, and open patches of bare carbonate and turf-covered pavement between colony clusters. P3200466, P3200469 and P3200471 are the defining wide views, with P3200460, P3200468, and P3200470 the strongest tabular-Acropora frames and P3200451, P3200469 and P3200487 the strongest thicket frames. Photographic genus calls remain morphological compatibilities: plates compatible with Acropora/Montipora/Pavona, massive and lobate colonies compatible with Porites, verrucose bushes compatible with Pocillopora, and meandroid or honeycomb colonies compatible with several faviid lineages. The photographs are illustrative rather than a fish census. Two frames are effectively empty of benthos — P3200493, an upward view to the surface, and P3200473, three trevally in open blue — and P3200461, P3200496 and P3200497 are hazy or heavily color-cast distance views.
Coral cover
The measurement at BITB37 is the LOF BIOT-1 benthic transect survey, and here it is depth-stratified. Coral cover 39%, from LOF BIOT-1 in situ transects (Mayfield & Dempsey 2026, Oceans, suppl. S1) — a diver transect measurement, published by Anderson himself, and the authoritative record of cover and community at this site. The survey effort behind it is 17 transects across four depth strata (D1 n=1, D2 n=7, D3 n=6, D4 n=3), and the formal benthic breakdown reads 38.77% coral, 35.46% algae, 5.08% barren substrate and 20.69% non-coral invertebrates. The formal transects resolve a real depth turnover hidden by the site mean. D2 is the coral maximum at 47.77%, with Acropora alone at 27.46%; one 100-point D2 transect reaches 79% coral and 64% Acropora. D3 falls to 35.97% coral, and D4 to 31.33%, while Acropora declines to just 0.67% in D4. Everything below — the computer-vision products and the frame-by-frame account — supplements that transect; no cover value may be read off any photograph, and where imagery and transect appear to differ, the transect governs. The computer-vision comparison. Across the 56 paired frames the 30-point set reads 28.93% live hard coral and the Coralscapes masks 27.73% of image area, against the transect's 38.8% — deviations of −9.9 and −11.1 pp, mean of three methods 31.8% ± 6.1. The supplement's differently normalized image estimate is 37.27%, only 1.49 points below the transect, which is the clearest demonstration available that the apparent shortfall is largely a denominator question. These numbers must not be used to claim that imagery inherently under-read Three Brothers: the methods use different and partly undocumented denominators, 30.1% of paired points are Unknown (roughly 506 of 1,680), 22 of the 78 available frames are absent from the paired audit, and the formal transects and the edited photographs do not share a documented sampling footprint. Coverage and provenance limit every photo-derived percentage here. All 78 photographs were reviewed by eye, but only 57 filenames occur in simplified image data and only 56 are usable in the paired point/mask table. The 30-point set gives 28.93% live hard coral, 1.25% bleached hard coral, 12.7% turf and 6.8% CCA, with 30.1% Unknown. The formal transects—17 replicates across four depth strata—give the preferred benthic-cover estimate: 38.77% coral, 35.46% algae, 5.08% barren substrate and 20.69% non-coral invertebrates. The formal and photographic records agree qualitatively on an Acropora-led, structurally complex reef, but only the formal dataset supports the site-level cover value.
Stressors
Coralscapes' paired-frame means of 2.25% dead coral and 1.11% rubble are compatible with scattered old exposed framework rather than an acute disturbance pulse; its bleached-area mean is 0.255%, and the point set's turf and CCA read 12.7% and 6.8%. P3200427 shows a collector urchin heavily covered with algae and debris — not a crown-of-thorns starfish, and long-spined urchins appear on the pavement in P3200455 and P3200469. No crown-of-thorns starfish, disease lesion or clear corallivore predation scar is visible in any of the 78 frames. The sole COTS line inherited from the automated summary is P3200403 at a rounded 0.00% of frame area; full-resolution review shows an ordinary coral-covered wall and no starfish, so that entry is a threshold/rounding artifact and should be removed as a biological observation. Condition and bleaching. Anderson's published percentage bleached for this site is 5.82% (% bleaching (2nd training), Mayfield & Dempsey 2026 supplement), and that published figure is the authority; no bleached fraction is estimated from these photographs and none should be. Separately, and in his own record, Anderson's field observation is that no bleaching was seen on the March or April dives, with bleaching beginning in May — his field annotation, which stands as written. What the frames themselves show is this: across the terrace the great majority of colonies are normally pigmented through brown, olive, chartreuse, cream, tan, mauve, and blue-gray. Pale branch tips are common on branching colonies and, at this framing, cannot be separated from ordinary growth tips, flash response and natural pigment; a handful of close frames, especially P3200462 and P3200445, carry small mottled or pale patches that could be local paling or older tissue loss. P3200483 is a specimen frame, not a reef view: a hand holds a small pale coral fragment close to the lens, and it must not be read as habitat or as evidence of site condition. That single frame also dominates both image products' bleaching signal, which is a CV-provenance problem in its own right: the point audit assigns 21 of 1,680 points (1.25% of all points) to bleached coral across nine frames, and ten of those 21 sit on P3200483, where Coralscapes likewise assigns 11.91% of the frame to bleached coral — 83.5% of the site's entire mask-bleaching signal. Removing only P3200483 lowers mean point bleaching from 1.25% to 0.67% of points and mean mask bleaching from 0.255% to 0.043% of image area. Those are statements about the annotation, not about the reef's bleached fraction, which the published figure carries.
Fish and other fauna
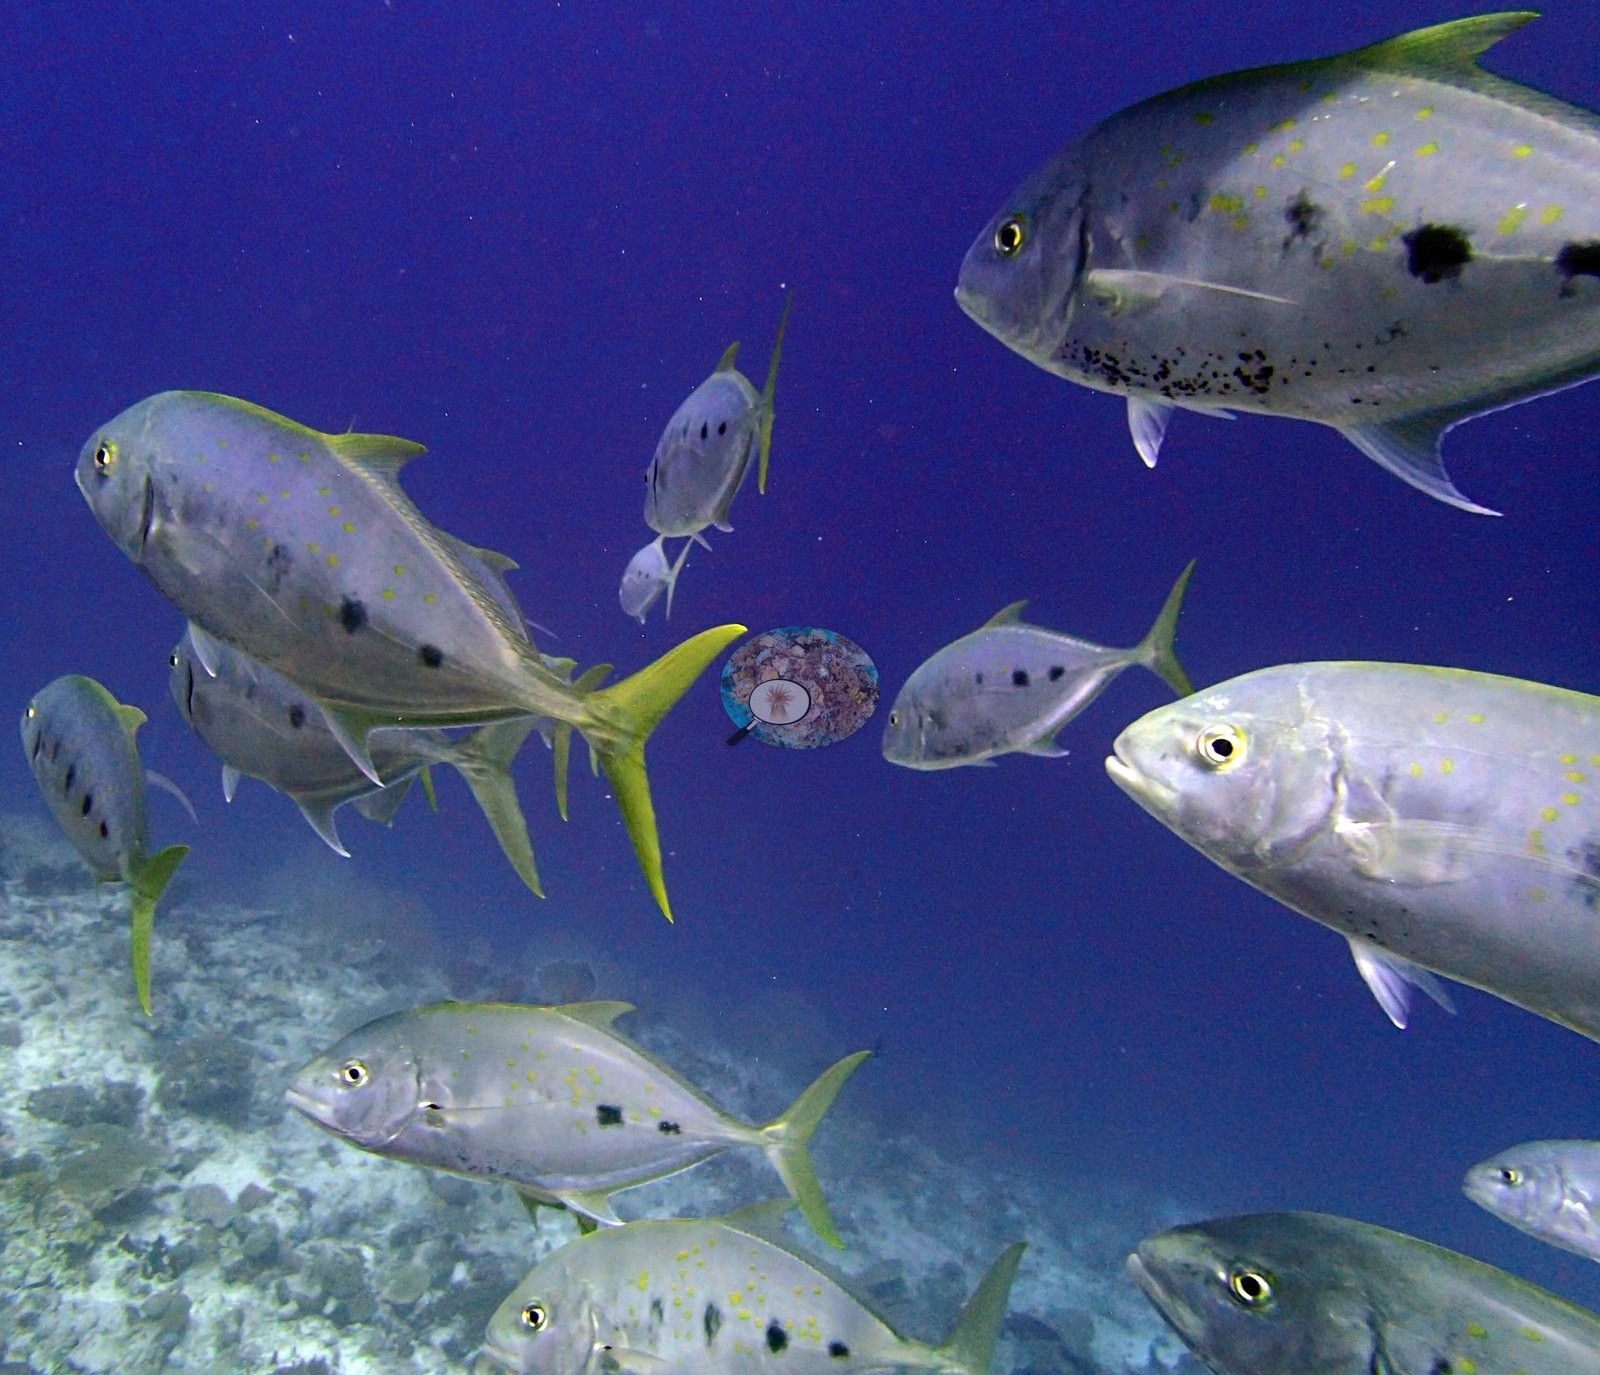
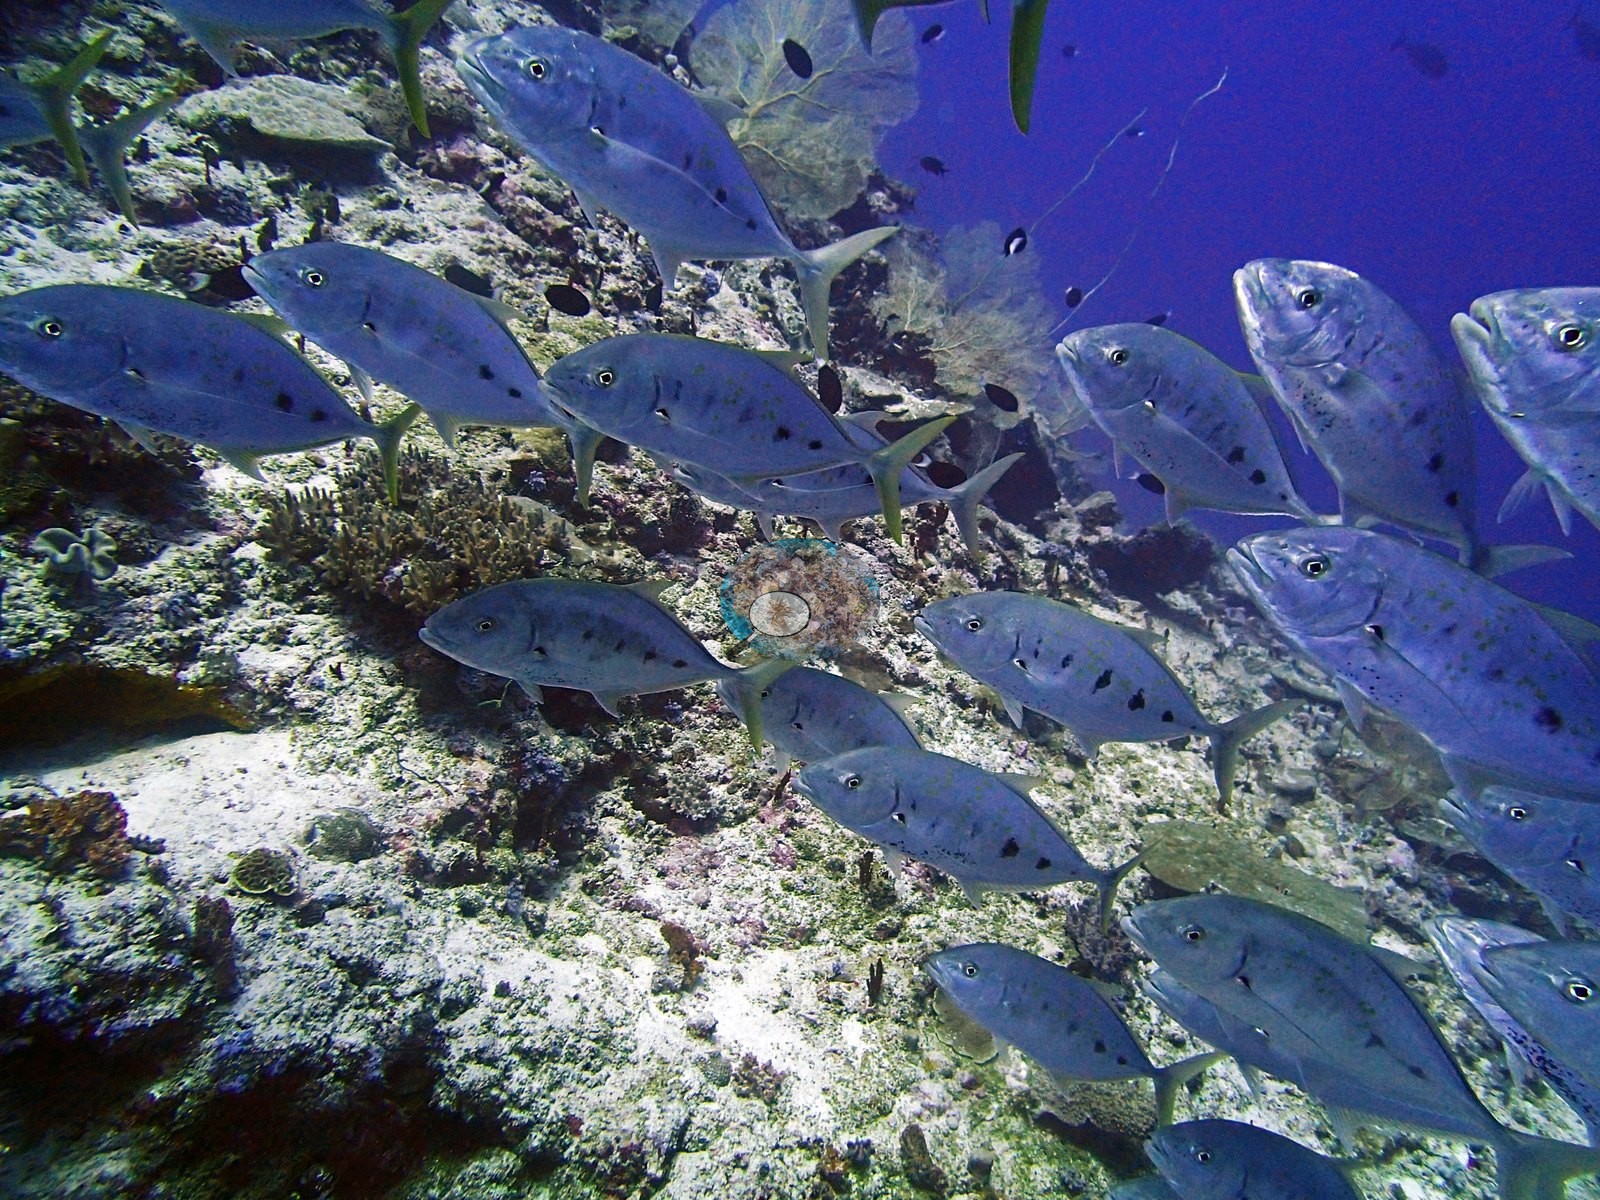
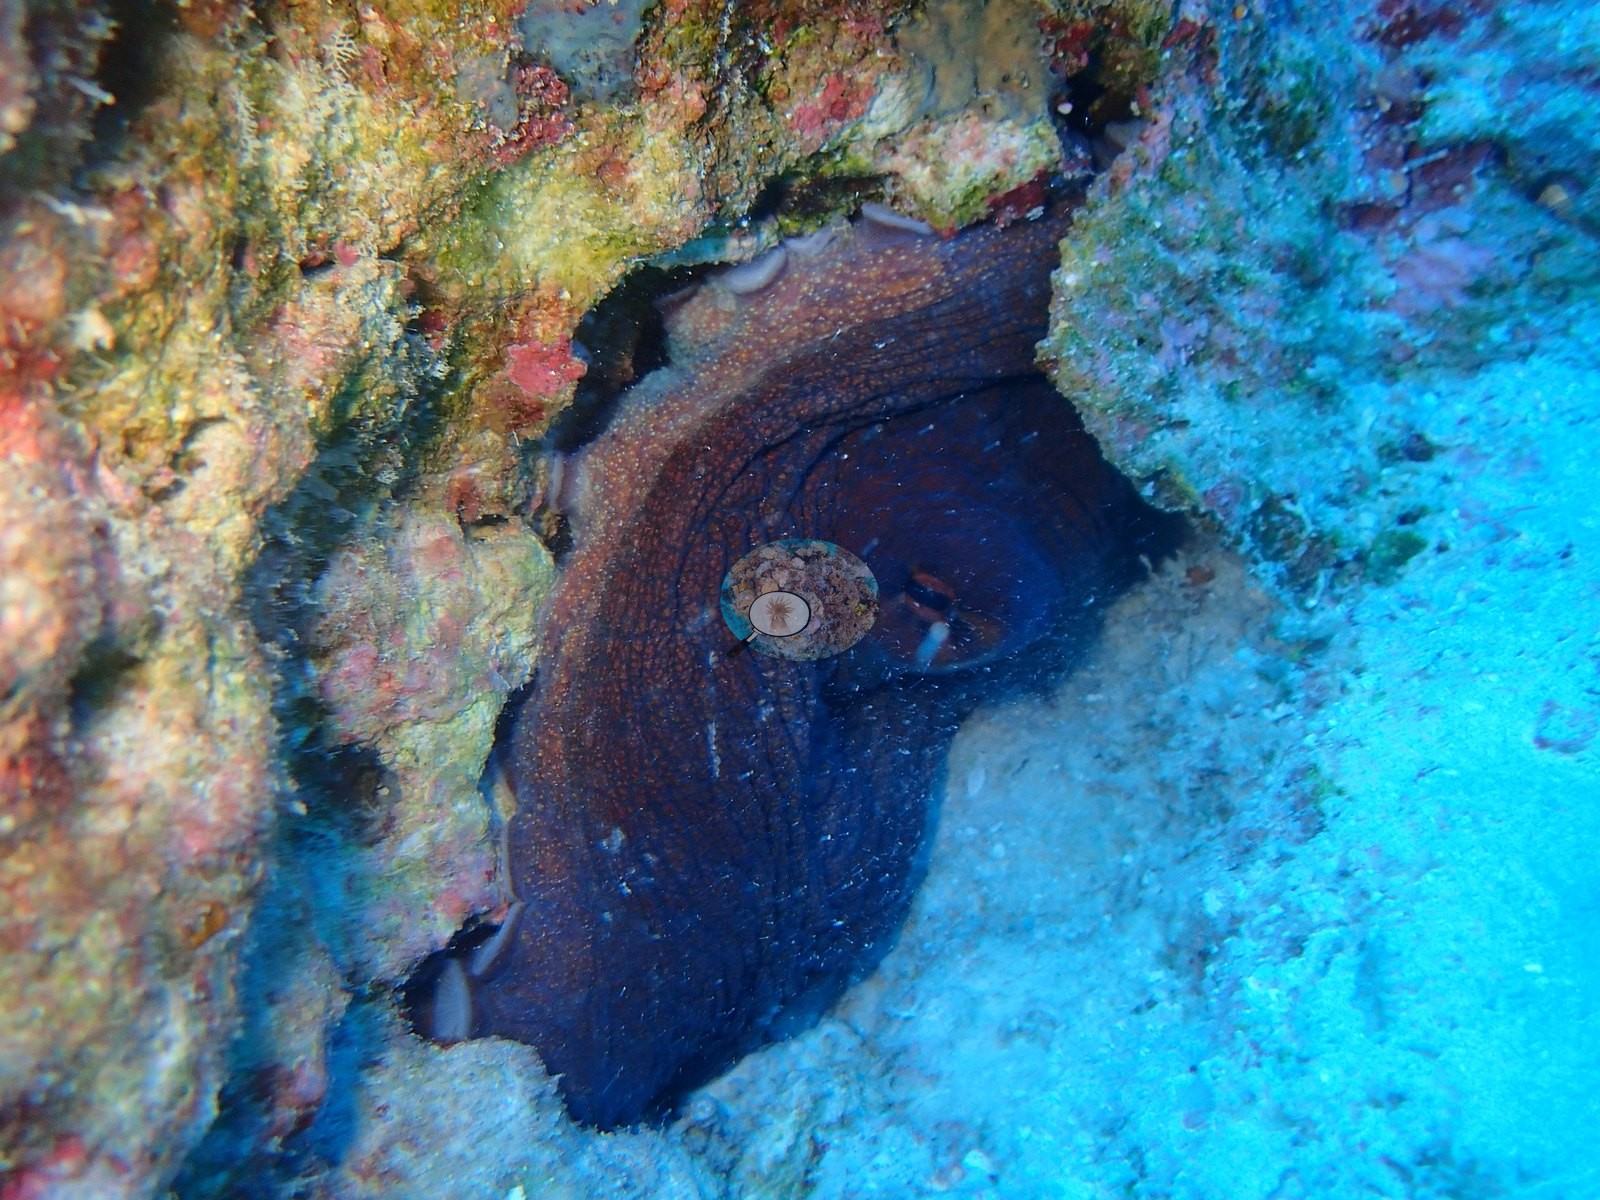
The site also carries unusually memorable mobile fauna. The headline in these photographs is a large, sustained aggregation of yellow-spotted trevally-type carangids working the reef edge — they fill P3200387, P3200391, P3200392, P3200393, P3200416, P3200417, and P3200473, at times a hundred or more animals in a single frame, and return close enough in P3200491 and P3200492 to fill the foreground over the coral terrace. Several show dark flank blotches and yellow-green spotting; the frames are good enough to say Carangidae confidently, but no species call is made from these angles. Two separate octopus encounters are recorded: P3200425 is a close, well-lit animal resting in a wall crevice among encrusting sponges, ascidians and small corals, and P3200437 is a second out on open rock in full mottled camouflage. Reef fish are steady rather than dense: powder-blue surgeonfish, Moorish idols (P3200420, P3200422, P3200447, P3200480), orange anthias in the wall shadows (P3200423), blue damselfishes over the terrace (P3200480, P3200482), and butterflyfishes, wrasses and parrotfishes scattered through the reef-top frames. Other point calls are visibly misplaced: P3200437 is an octopus macro with bright carbonate and flash highlights, P3200466 and P3200471 are normally pigmented wide reef views, and P3200491 is dominated by fish and open water.
Comparisons with other data
Reef type: exposed, emergent fringing fore reef, outside the lagoon. Survey conditions on 20 Mar 2015 at 6.17699°S, 71.54402°E: in situ temperature 29.6°C, salinity 34.3.
Also on record for this site: Assemblage composition. Across 56 paired frames, Coralscapes estimates live hard coral at 27.73% of image area, dead coral at 2.25%, rubble at 1.11% and bleached coral at 0.255%; its live-area morphology is led by non-tabular and tabular Acropora-type forms.
Other notes
The 21 never-scored files include ecologically important frames — the trevallies, the octopus, the collector urchin, and several wall and terrace views — so the quantitative photo subset is not equivalent to the folder. P3200393 is additionally misjoined to an unrelated 2015-3-20 topside sunset because both folders contain that filename; the BITB37 copy is in fact a close trevally school. That is a genuine filename-collision loss and cannot be recovered by relabelling the joined row. Finally, the Chagos point set is predominantly unconfirmed CoralNet robot output: treat the point table as an imperfect image-analysis product, never as a complete human re-annotation of the dive. Image-by-image. All 78 habitat frames were reviewed, from Anderson's own folder for this site, which he named BiTb37-great site-finished — his field annotation, and the frames bear it out. There are no sampled-colony frames, and no quadrat, scale bar or transect line appears in any frame, so nothing in the photographic set is a measurement. Divers appear at the wall edge for scale in P3200439, P3200440, P3200444, and P3200447.
CV model comparison
More info
Those are point counts on the photographs; this is a diver swimming a transect. The models and the reference never saw the same thing. ⚠ SITE-LEVEL ONLY. The 2,500 frames were not associated with any transect taken within 200 m of them, so transect-vs-image comparisons are site means, never frames. The transect value is already in the pin `cover` field (109 of 112 pins, sourced to the paper's suppl. S1) and is read from there, never re-imported. The transect is THE coral-cover value for this site and stands alone. The rows below it are a methods comparison only: no computer-vision value is averaged with it, feeds the headline, or carries over to the site's cover figure (Anderson, 2026-09-22).| Method | Hard-coral cover (%) |
|---|---|
| Transect (published) | 38.8 |
| CoralNet | 37.3 |
| In-house DINOv3 | 29.6 |
| CoralSCOP edited | 42.4 |
| Claude | 29.0 |
Independent surveys nearby
| Agency / program | Year(s) | Stations / distance | Link |
|---|---|---|---|
| Sheppard et al. (2008) | 2006 | 1 station, 4.21 km | Records ↓ |
| Spalding et al. 2025 (Chagos 2024 bleaching report) | 2024 | 1 station, 3.45 km | Records ↓ |
| XL Catlin Seaview Survey | 2015 | 1 station, 3.48 km | Records ↓ |
 Dr. Coral (CRD)Year-average (no detectable trend)
Within 5 km, 3 independent survey stations recorded hard coral cover in 7 records between 2006 and 2024. One survey since 2021 recorded 50%. This site's own estimate (39%) sits 11.2 points below the recent value (50%); the methods differ, so the comparison is context, not a like-for-like test.
Collected by other programs using different methods (the XL Catlin Seaview Survey uses photo-transects with automated image annotation), so these are context for the figures above, not a like-for-like comparison. Where a station was surveyed more than once the range is shown. Station names are not dive-site names.
| Agency | Site / location | Date | Hard coral cover (%) | Distance | Link |
|---|---|---|---|---|---|
| Sheppard et al. (2008) | Great Chagos Bank | 2006 | 41% (5 surveys) | 4.21 km | HeatCRD database |
| XL Catlin Seaview Survey | transect 36004 | 2015 | 21% | 3.48 km | — |
| Spalding et al. 2025 (Chagos 2024 bleaching report) | Great Chagos Bank - Middle Brother, lagoon (E aspect, 1-3 m) | 2024 | 50% | 3.45 km | — |
Data & links
- Read the full site report ↗
- Download benthic survey data (CSV) ↗
- Download all LOF-GRE data (933 sites) ↗
- CoralNet image repository for this region ↗
- HeatCRD database ↗
- (reference) ↗
- Photo portfolio ↗
- Coral Reef Diagnostics page for this area ↗
All images from Coral Reef Diagnostics. Data are from Coral Reef Diagnostics and the organizations named in the data-sources table above.
 © Coral Reef Diagnostics.
References
- Mayfield AB, Dempsey AC (2026). Using tourist diver images to estimate coral cover and bleaching prevalence in a remote Indian Ocean coral reef system. Oceans 7(1):1. PDF
- Sheppard C, Harris A, Sheppard A (2008). Archipelago-wide coral recovery patterns since 1998 in the Chagos Archipelago, central Indian Ocean. Marine Ecology Progress Series 362:109-117. PDF
- Spalding M, Bourasseau M, et al. (2025). Coral bleaching and mortality in the Chagos Archipelago, 2024. British Indian Ocean Territory Administration report (gray literature). PDF