
Overview of 40 dive sites. Figures are averages across the sites that report them (n = sites with a value); each site's own page has its individual values. Regional summaries: Halmahera, Banda, Ambon.
⬇ Download this overview as a report card

Heat stress, 1985–2025
40 sites in this region — click a marker to open that site.
Overview
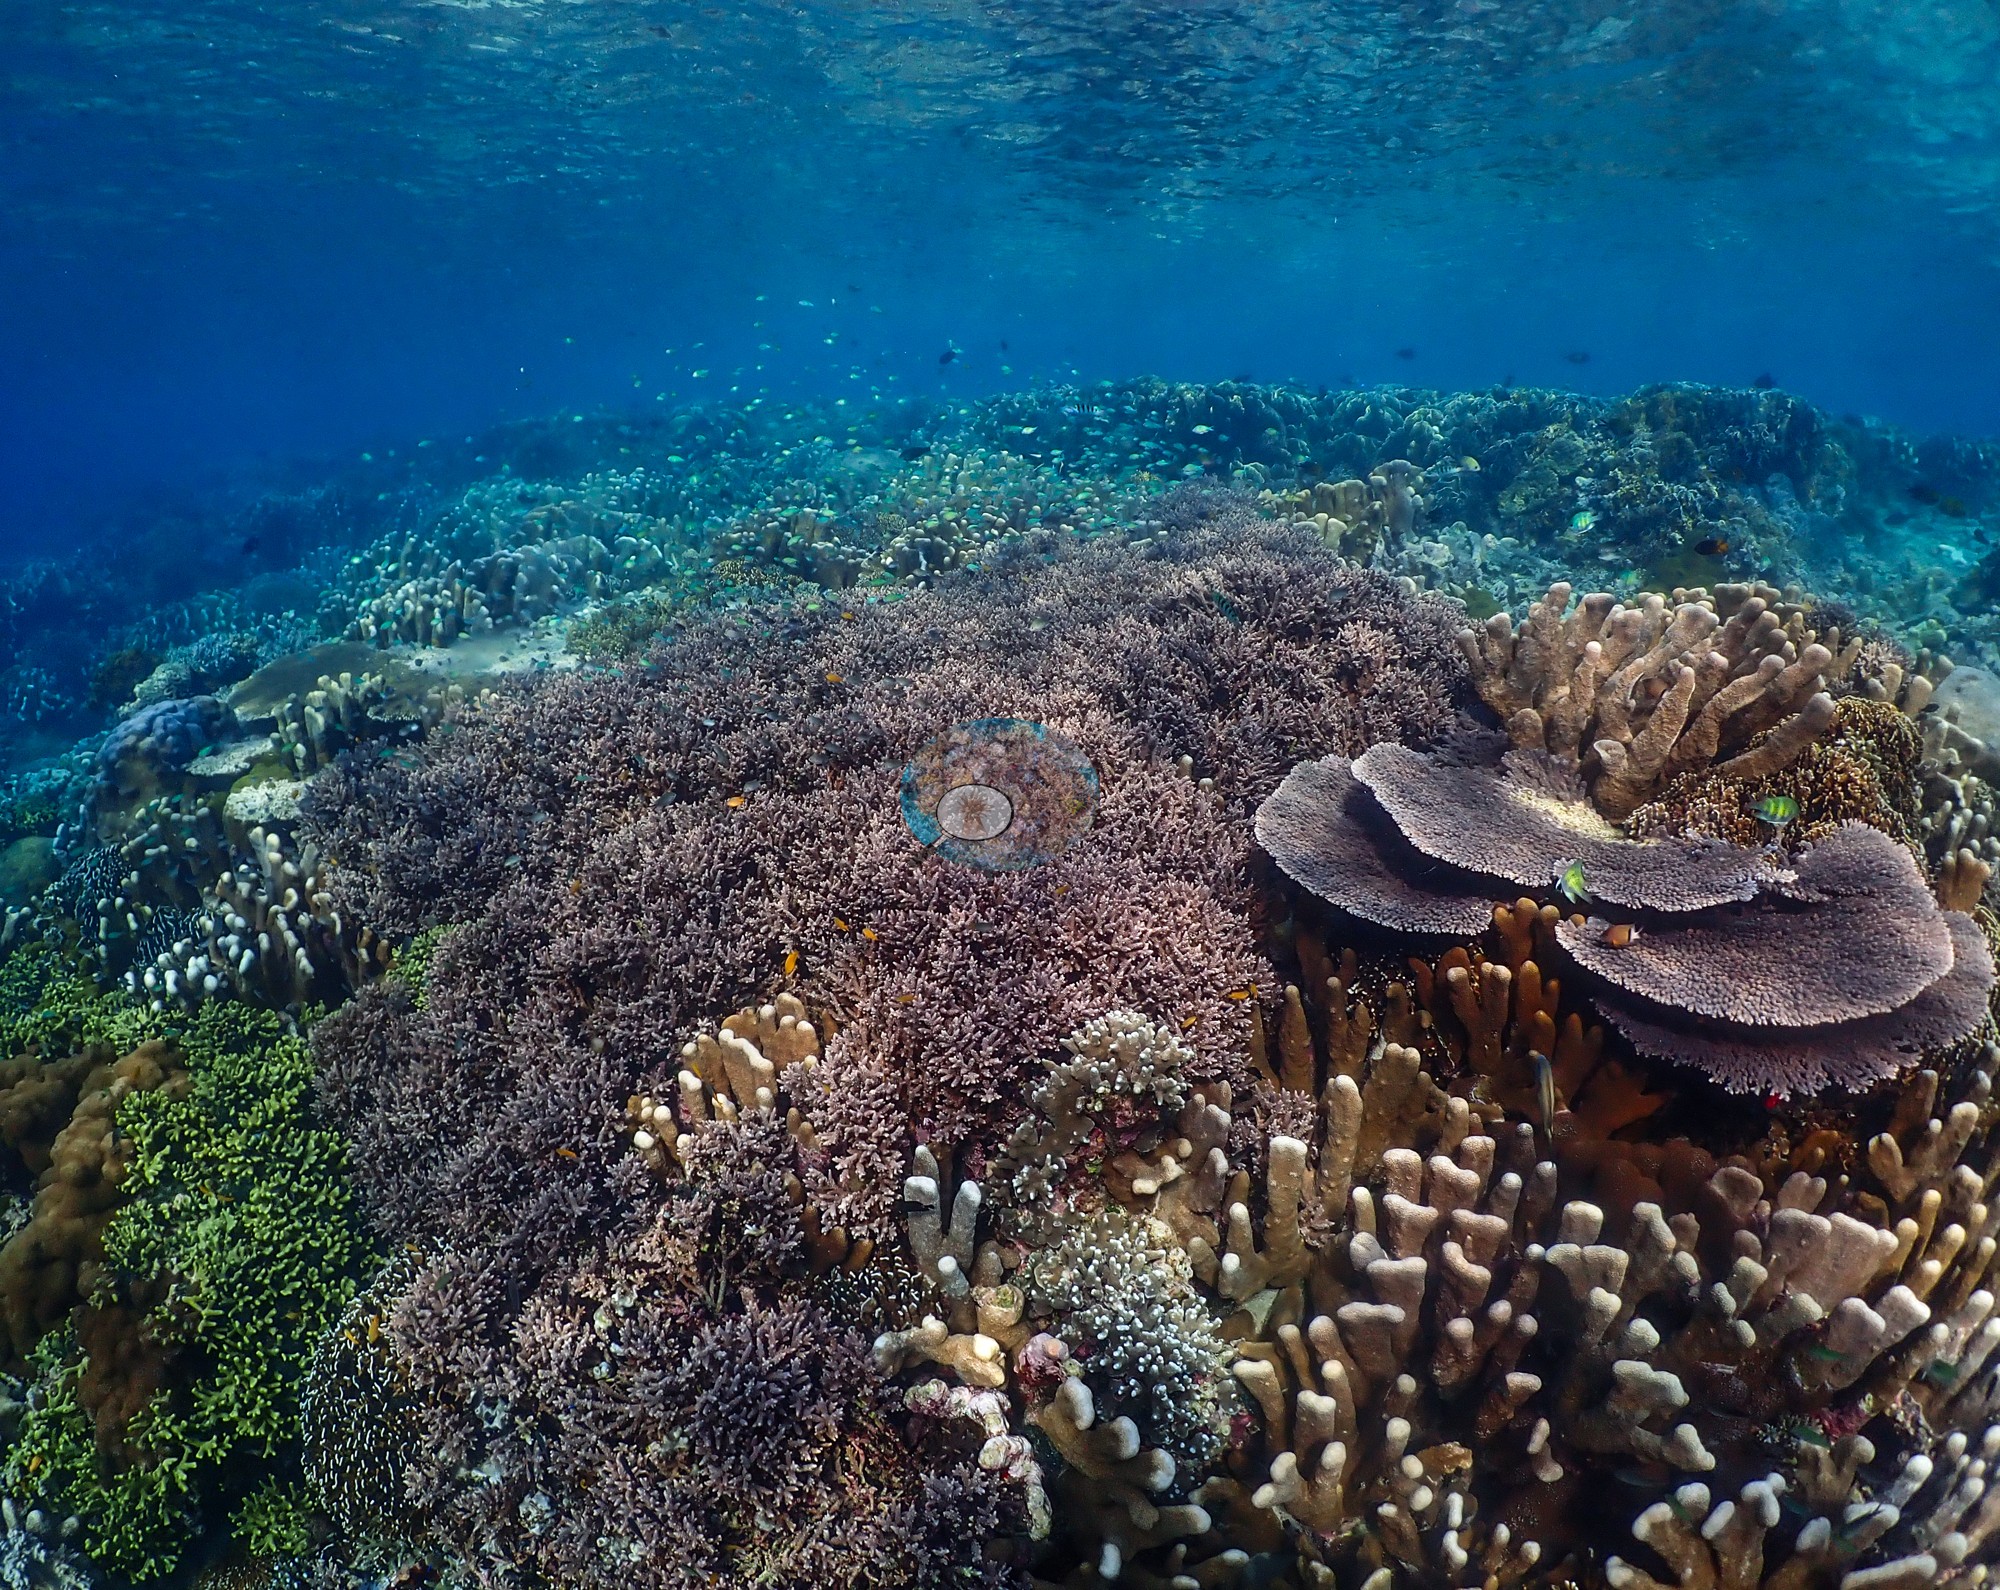
This page brings together Anderson Mayfield's own dives in the Maluku and North Maluku provinces of eastern Indonesia: the Banda Islands and Ambon in April 2018, and a liveaboard crossing around Halmahera, Ternate and Tidore in August 2026 aboard the Ambai (Wallacea Dive Cruises). They are not part of the Global Reef Expedition. Spalding et al. (2001) place the Moluccas in a deep-water sub-region of complex bathymetry where islands only tens of kilometers apart can be separated by more than 1,000 m of mostly clear, oceanic water, in a country that spans the region with the highest reef biodiversity on Earth. The Banda Islands include the young volcano Gunung Api, whose 1988 lava flow now carries reef, and two protected areas, the Taman Laut Banda and Gunung Api Banda recreation parks.
The area has 41 members. Ambon has four: three muck dives near Laha on 22 April 2018 (Air Manis, Rhino City and Laha-2) and an Ambon / Seram marker with no survey of its own. Banda has seven, dived from 25 to 28 April 2018 at Batu Kapal, Lava Flow (Gunung Api), Lighthouse, Airport (Banda Ara), Tanjung Pisang (Banana Island), and Shark Point and Goat Hall on Pulau Ai. Halmahera has 30, dived from 8 to 16 August 2026: night dives off the Ternate waterfront, reefs in the Ternate-Tidore strait such as Maitara North and Failonga, current-swept points and drifts such as Pulau Sebatang, Kusu Drift, Tower Corner, Proco, and Jerot, and offshore seamounts and boulder fields such as Batu Mandi, Batu Balong, Siko Pinnacle, and Reene's Rock, plus three area markers. Recorded maximum depths exist only for the 2018 dives, from 13.7 m at Lava Flow and Lighthouse to 30.5 m at Airport; the 2.4 m logged at Tanjung Pisang is a snorkel over the flat. The typical profile, in both Banda and Halmahera, is a steep wall or slope held by sponges, sea fans and soft corals, rising to a shallow crest of near-continuous staghorn and tabular Acropora.
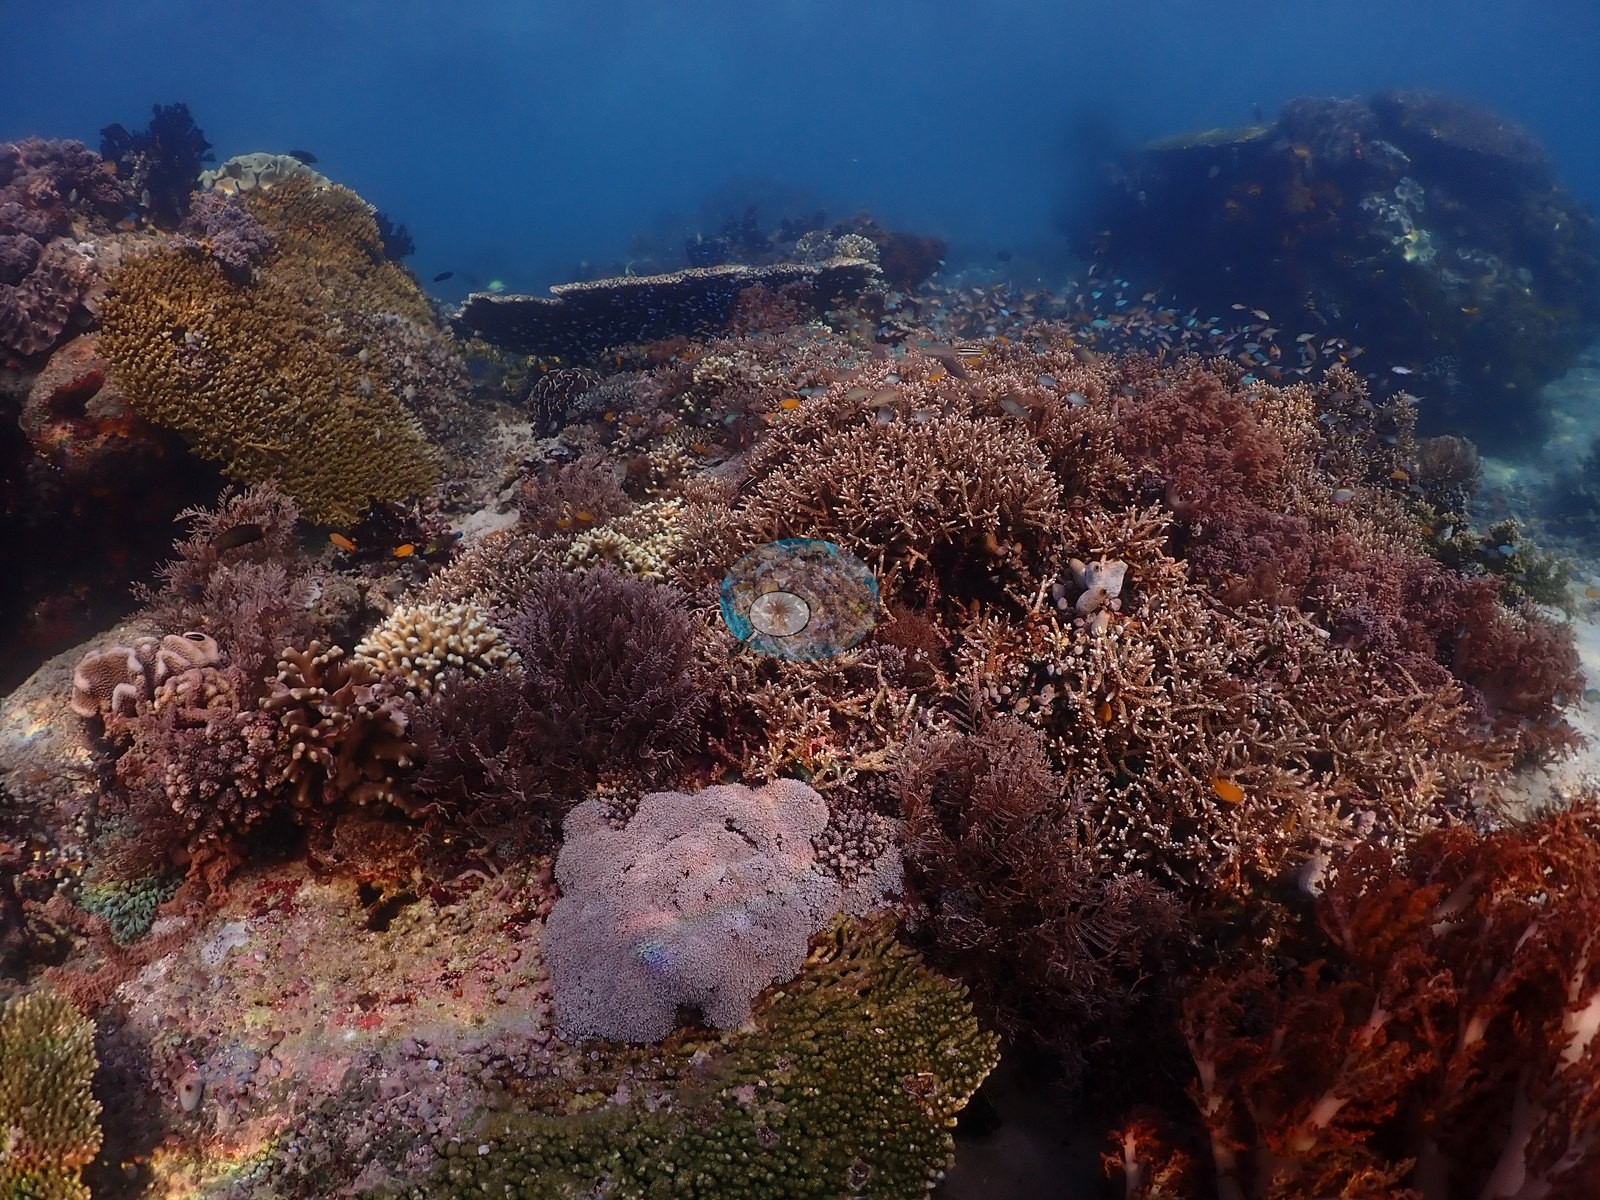
Cover here is a photo-derived index from computer vision (CoralSCOP), not a transect survey, and it counts soft coral as well as hard coral. It averaged 31.3% across the 36 members with an index: 36.2% at Banda (n = 7), 30.2% at Halmahera (n = 26) and 29.2% at Ambon (n = 3). The highest was 44.8% at Airport (Banda Ara), and on Halmahera 41.4% at Jerot, where Anderson logged 22-25°C and thermoclines, the coldest water of the crossing. The lowest was 8.4% at Mugia, a Halmahera night dive scored from only six frames, which Anderson's own field note calls "amazing coral cover"; among Halmahera's daytime reef dives the index ran from 22.9% at Reene's Rock, a boulder community rather than a true reef, to 41.4% at Jerot. Anderson ranked Pulau Sebatang among the best coral dives he has done, and at Lava Flow the 1988 lava channel now carries essentially complete plate-coral cover beside unbroken staghorn thickets. Ambon's muck sites are largely sand, silt and rubble, with coral in patches on bommies and ridges.
Condition differed between the two trips. In Banda in April 2018, localized bleaching was photographed at Tanjung Pisang, Lighthouse, Lava Flow, and Airport, where one table also carried a sharply bounded bare patch consistent with white syndrome or a healed predation scar; no crown-of-thorns starfish were seen on any Banda or Ambon dive. On Halmahera in August 2026, most dives recorded no bleaching, disease or crown-of-thorns, but crown-of-thorns were photographed at Merida Cavern, beside fresh feeding scars, and at Mugia, Lelay Utara showed active partial bleaching on part of its shallow plateau, and single white colonies turned up at several other sites. Old, coralline-bound mortality, standing dead staghorn, and rubble aprons are common on Halmahera. Human impacts were photographed at Ambon, where a gillnet with trapped fish was draped over bommies at Air Manis and bottles, fishing line and PVC were woven into the rubble at Laha-2. No Coral Health Index has been scored for these sites.
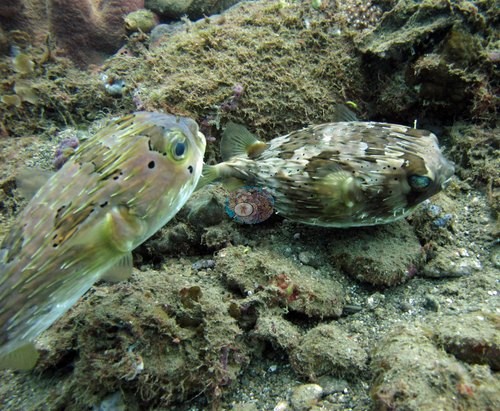
What stands out is the life beyond the coral. Night dives off Ternate produced walking sharks (Hemiscyllium halmahera) at Pantai Falajawa and ornate ghost pipefish at Cimitero, Tanjung Naraka had the biggest school of devil rays Anderson has seen, Rhino City at Ambon had a Rhinopias and a ribbon eel, Laha-2 had harlequin shrimp, frogfish and seahorses, and hawksbill turtles were photographed at Shark Point and Goat Hall on Pulau Ai.
Highlights
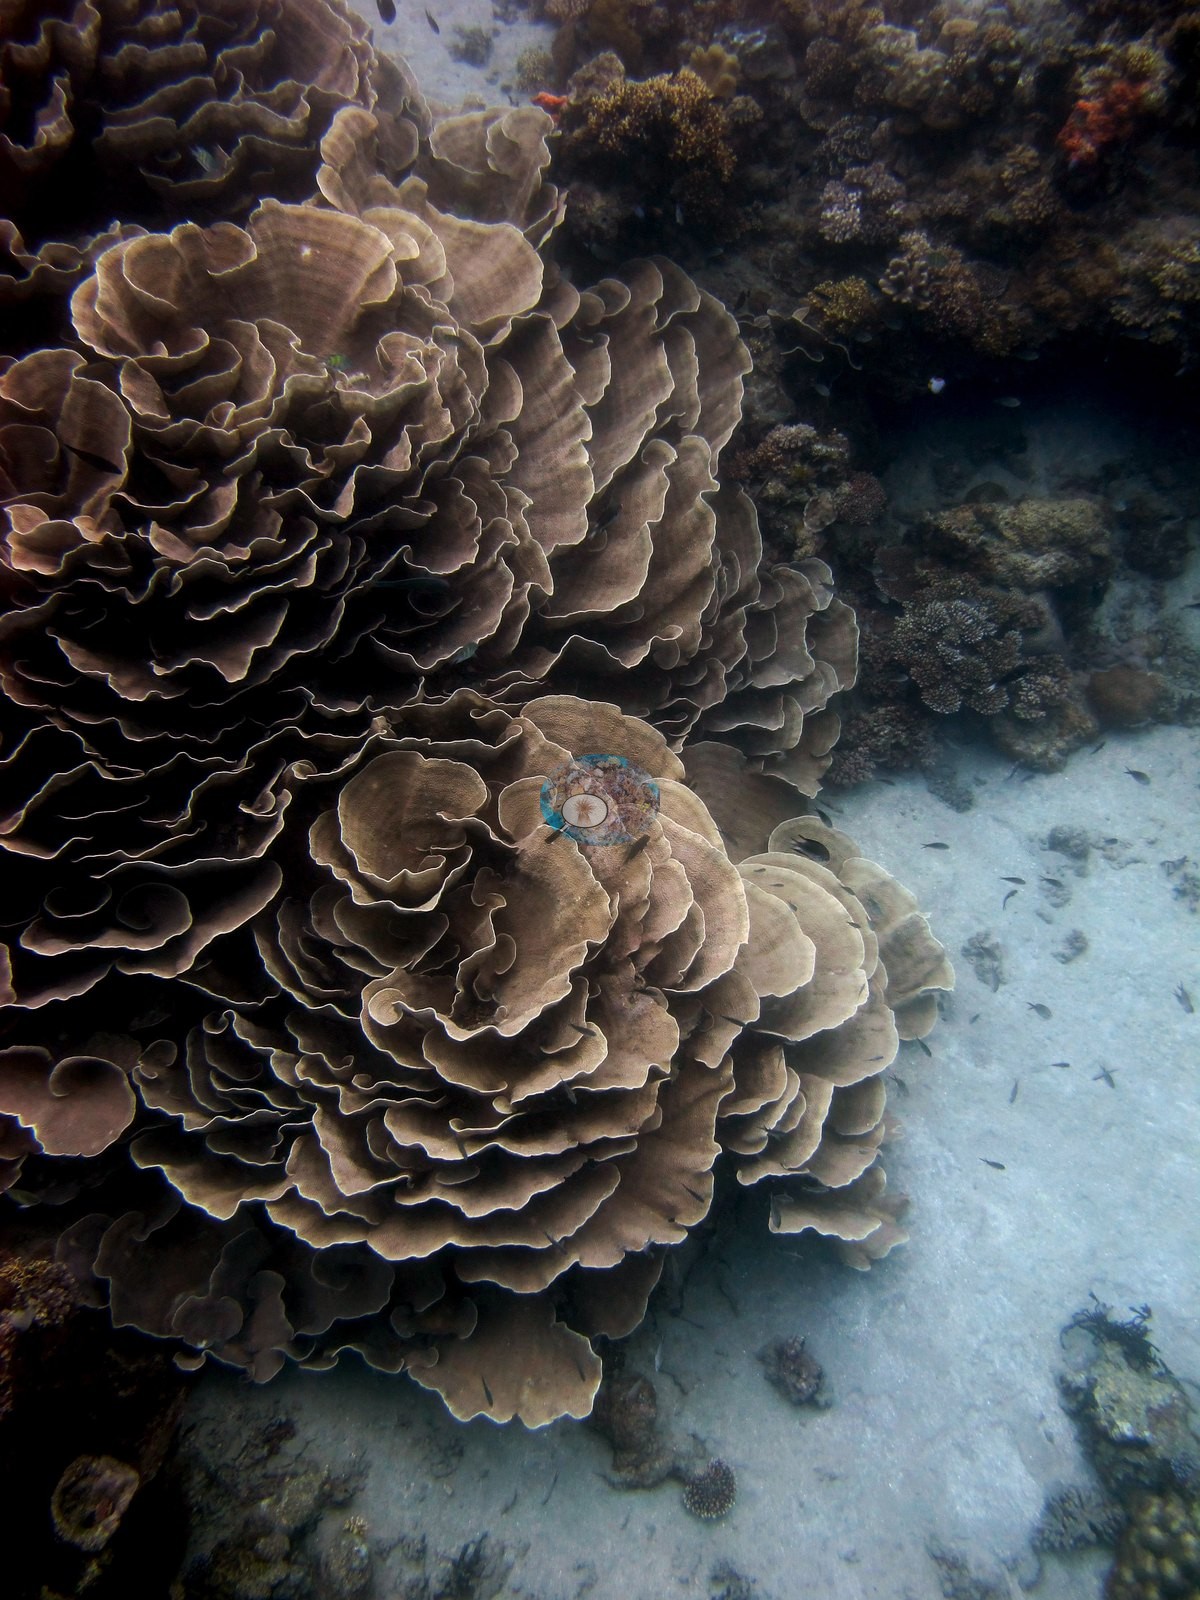
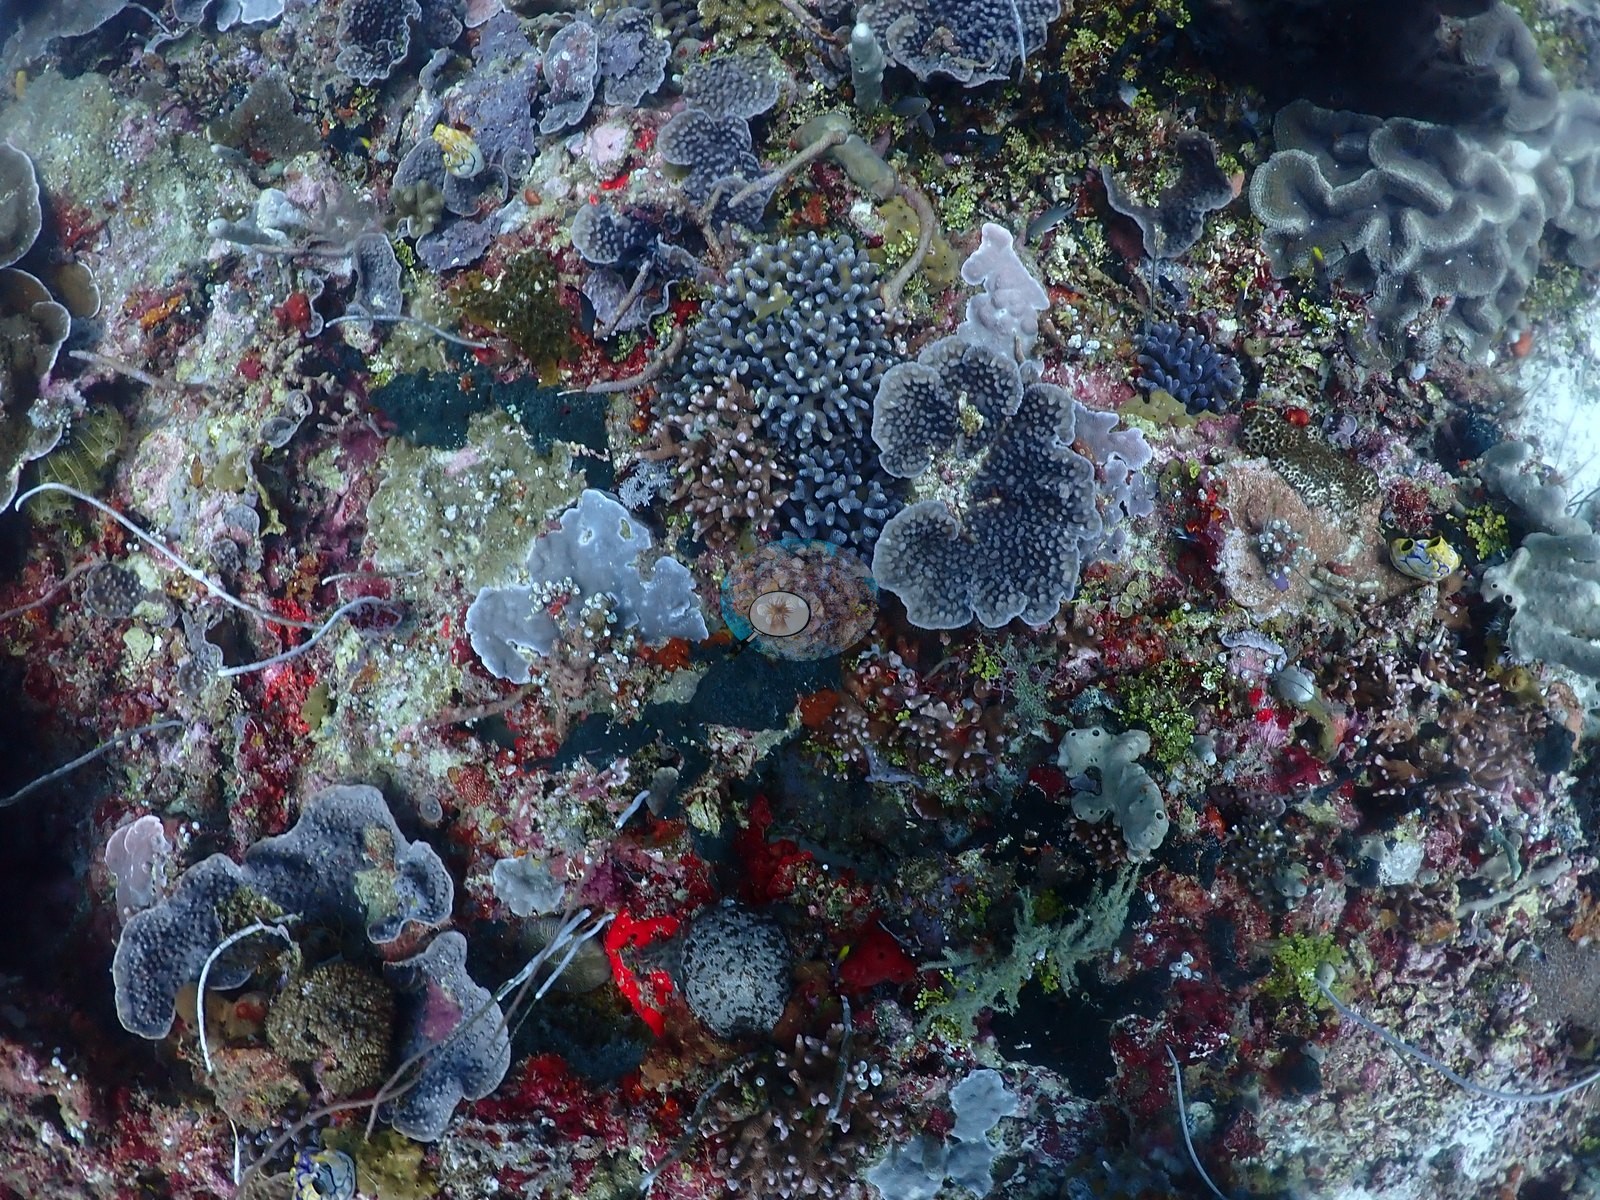
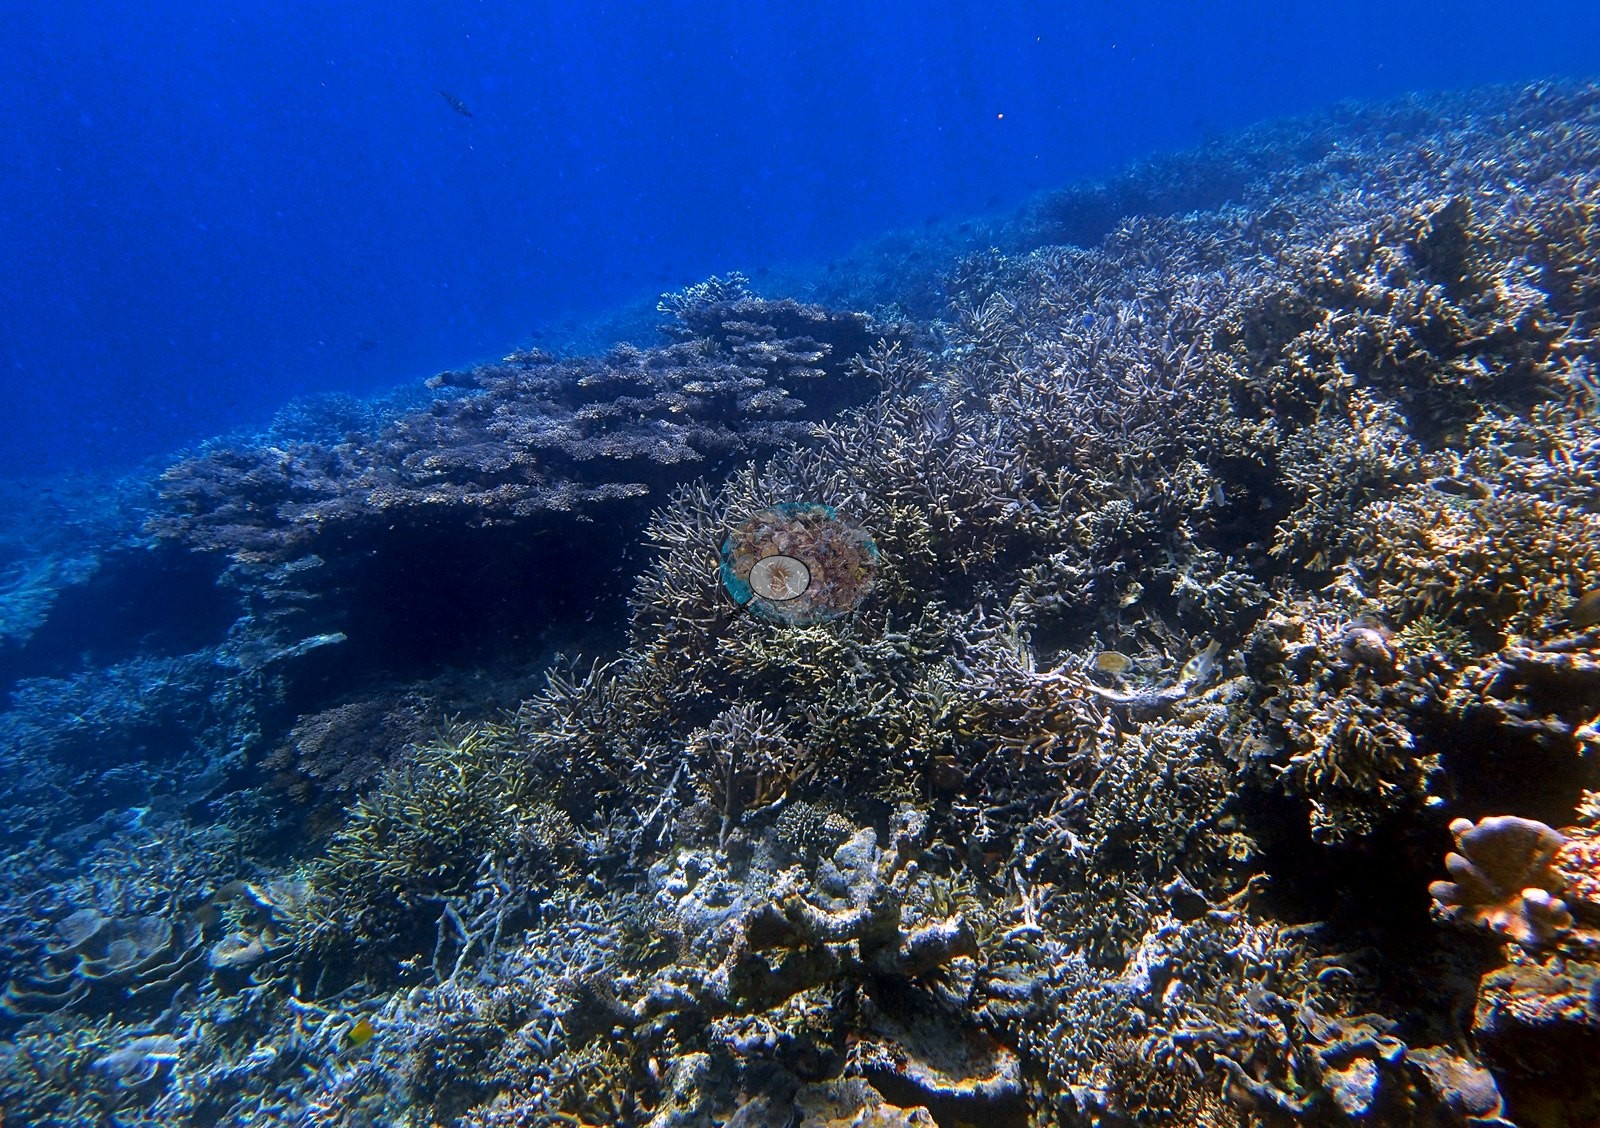
- Near-continuous shallow Acropora at Pulau Sebatang, which Anderson ranked among the best coral dives he has done.
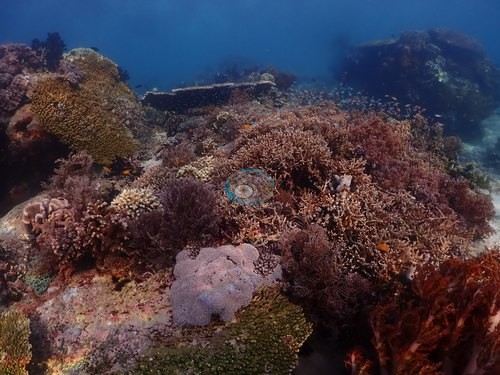 photo: Indonesia - Halmahera: Pulau Sebatang
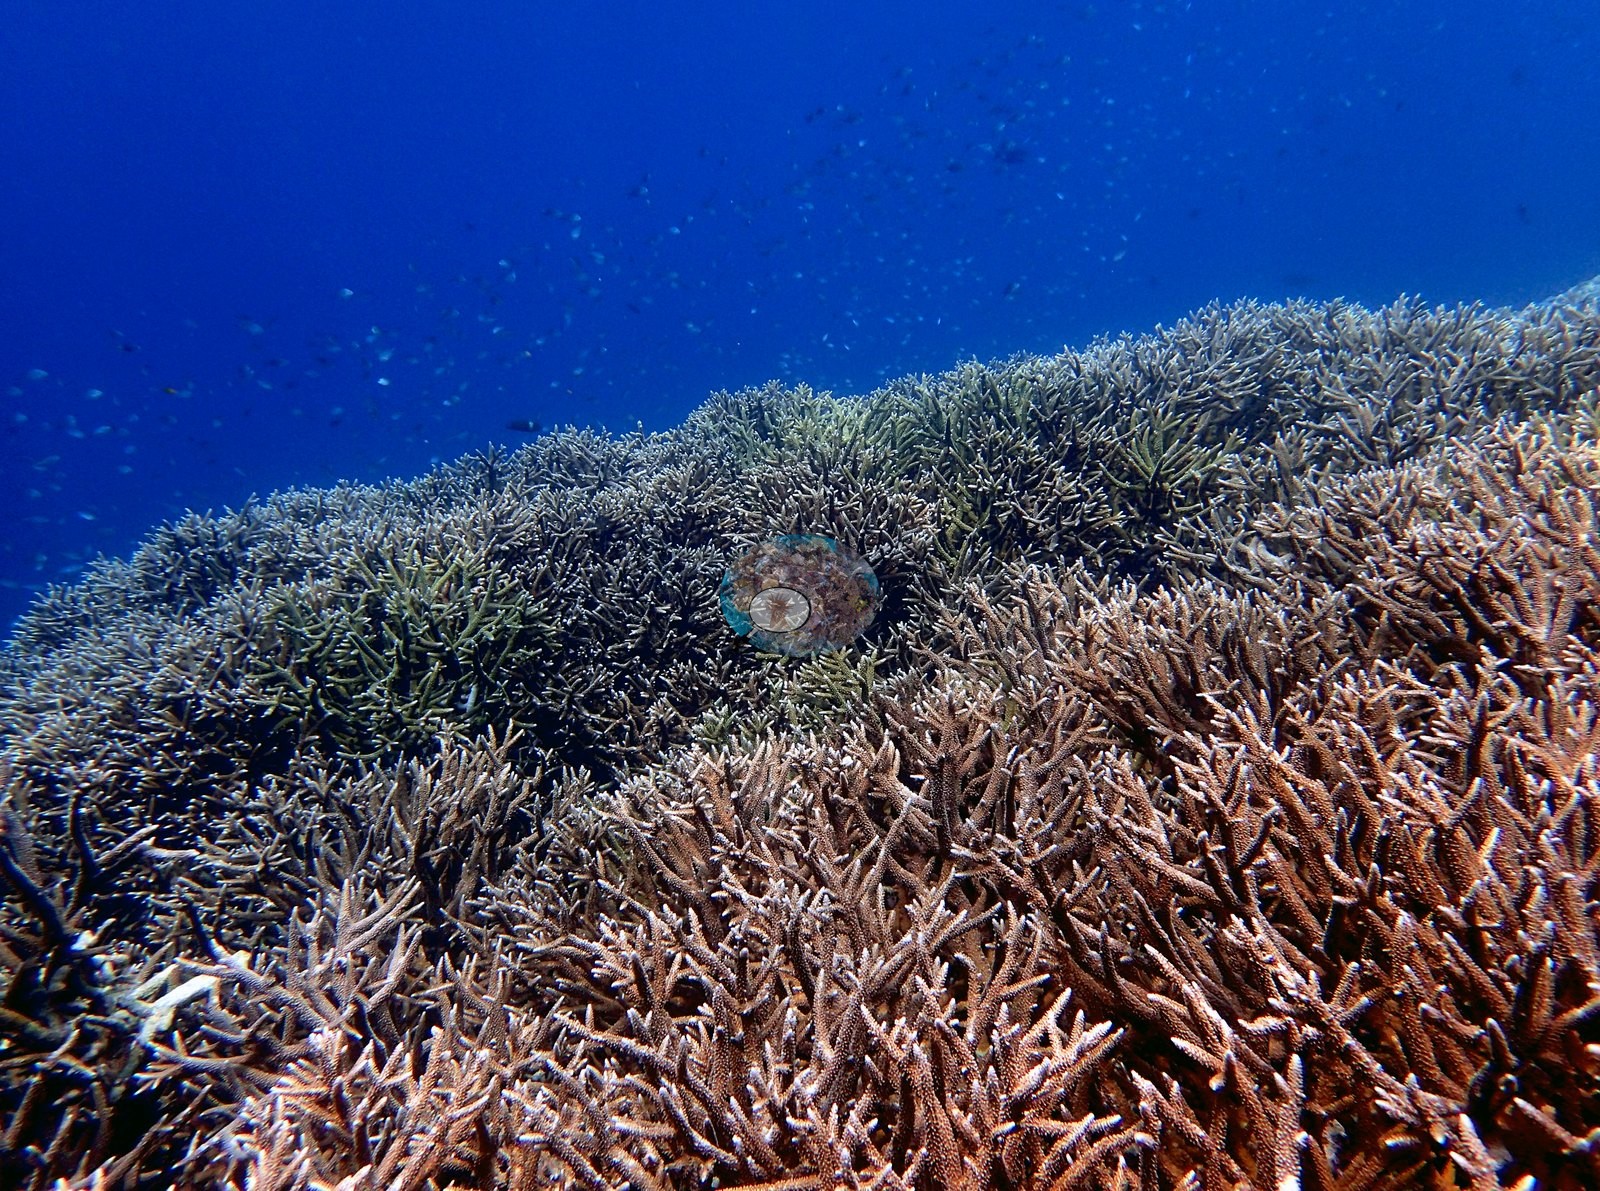
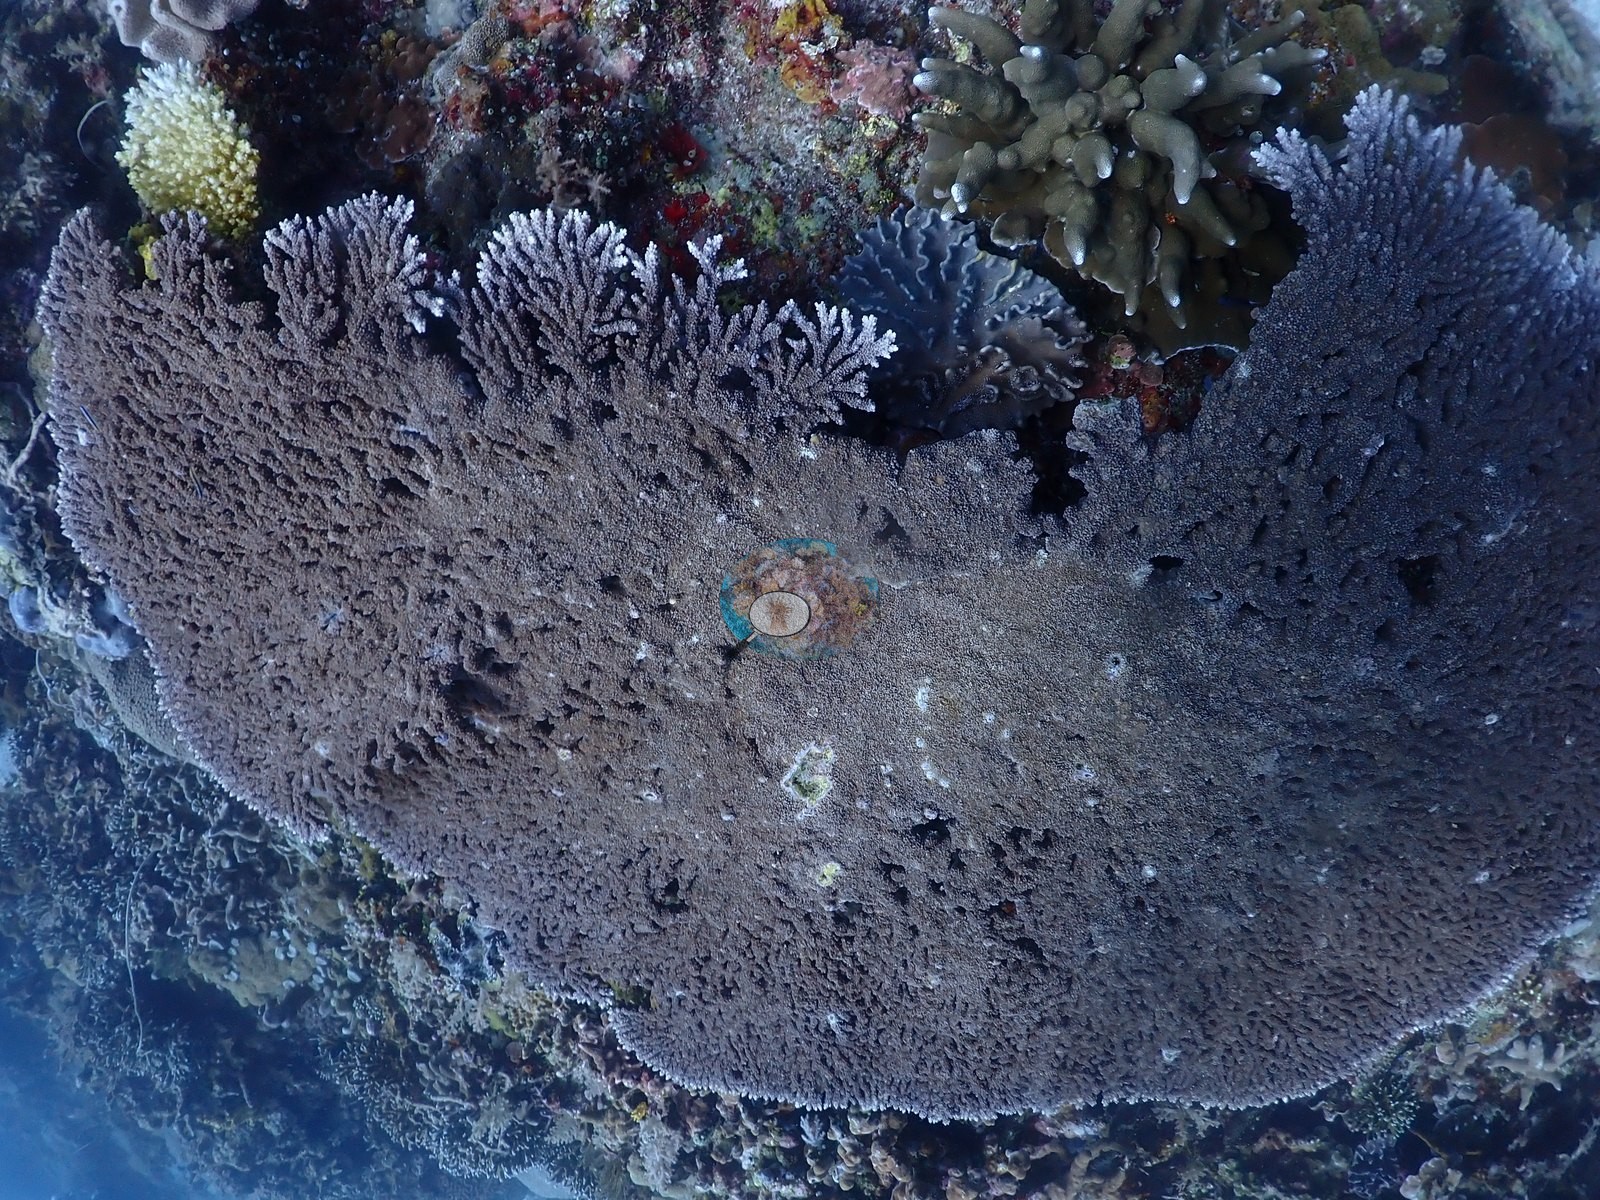
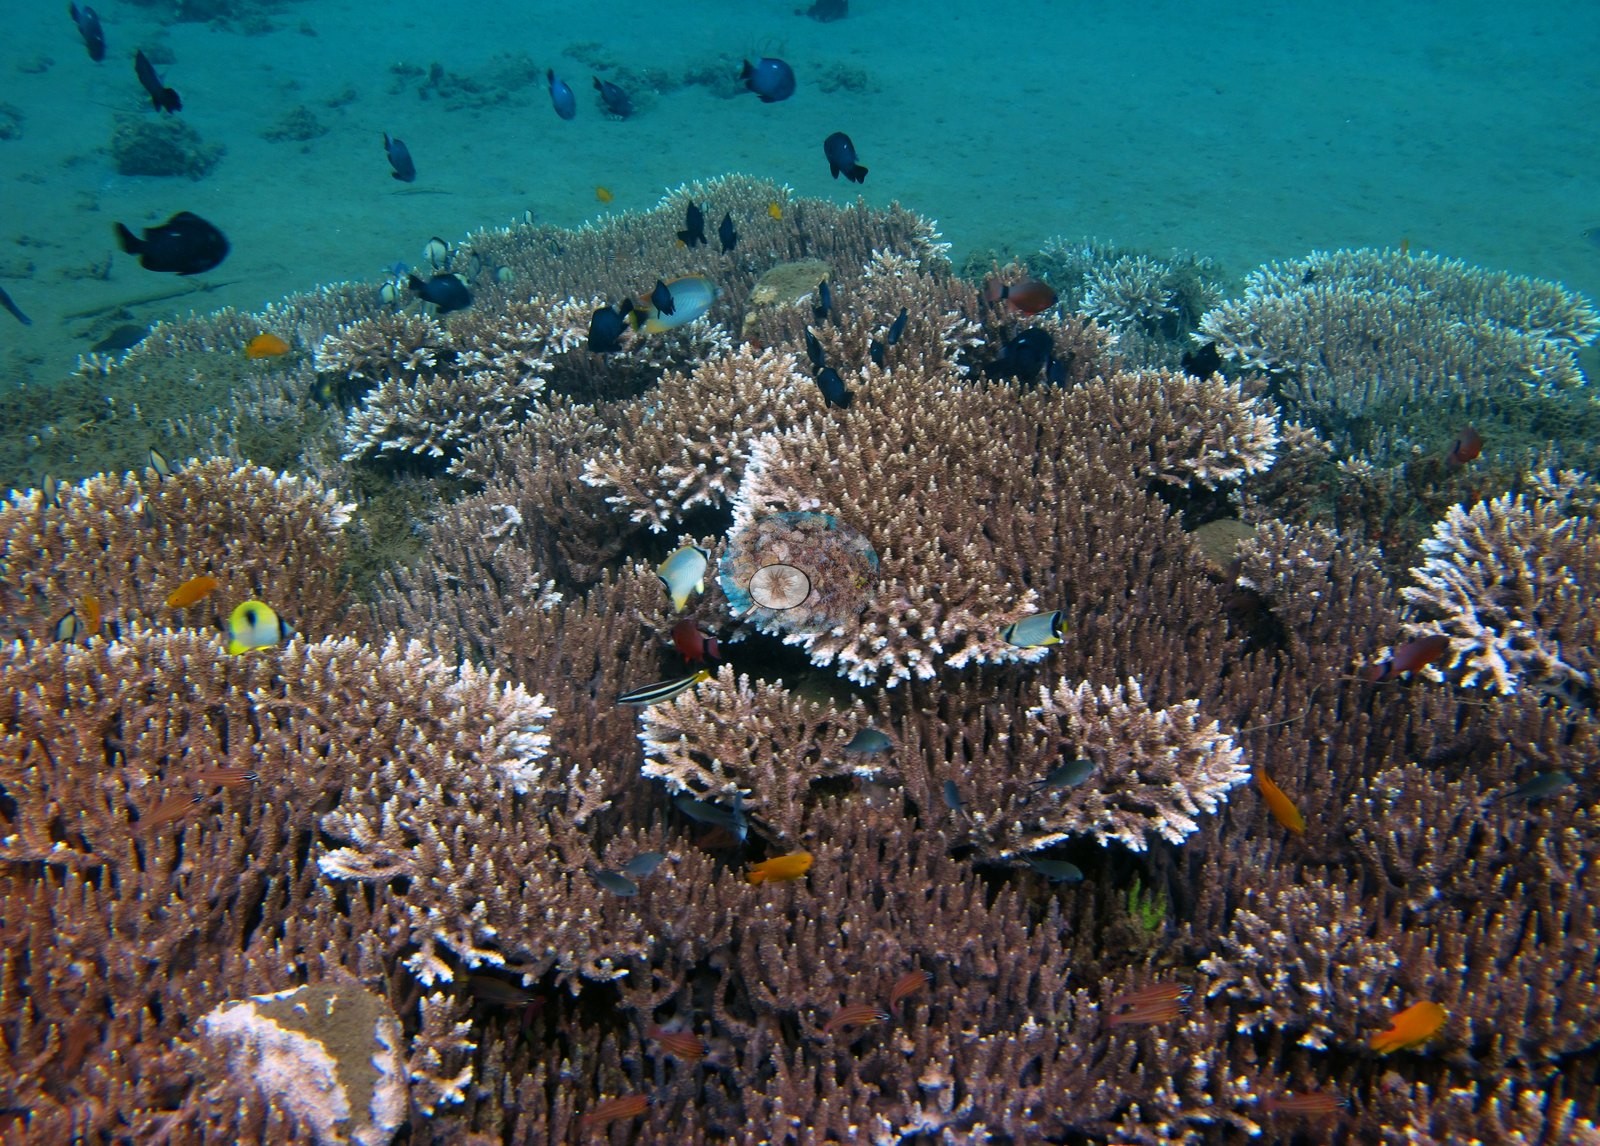
 - A sunlit shallow crest of lavender staghorn and stacked tabular Acropora at Kusu Drift (round 2).
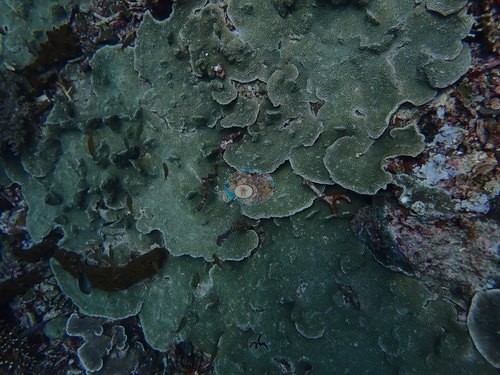 photo: Indonesia - Halmahera: Kusu Drift
 - Jerot held the highest Halmahera cover index, 41.4%, in 22-25°C water with thermoclines, the coldest of the crossing.
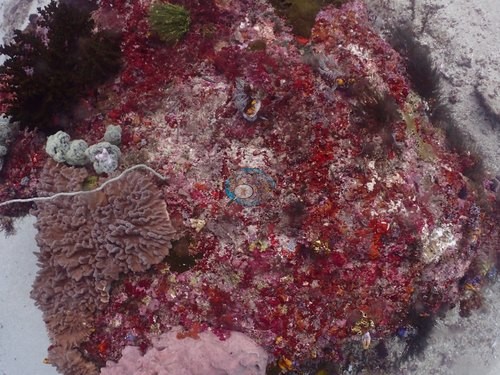 photo: Indonesia - Halmahera: Jerot
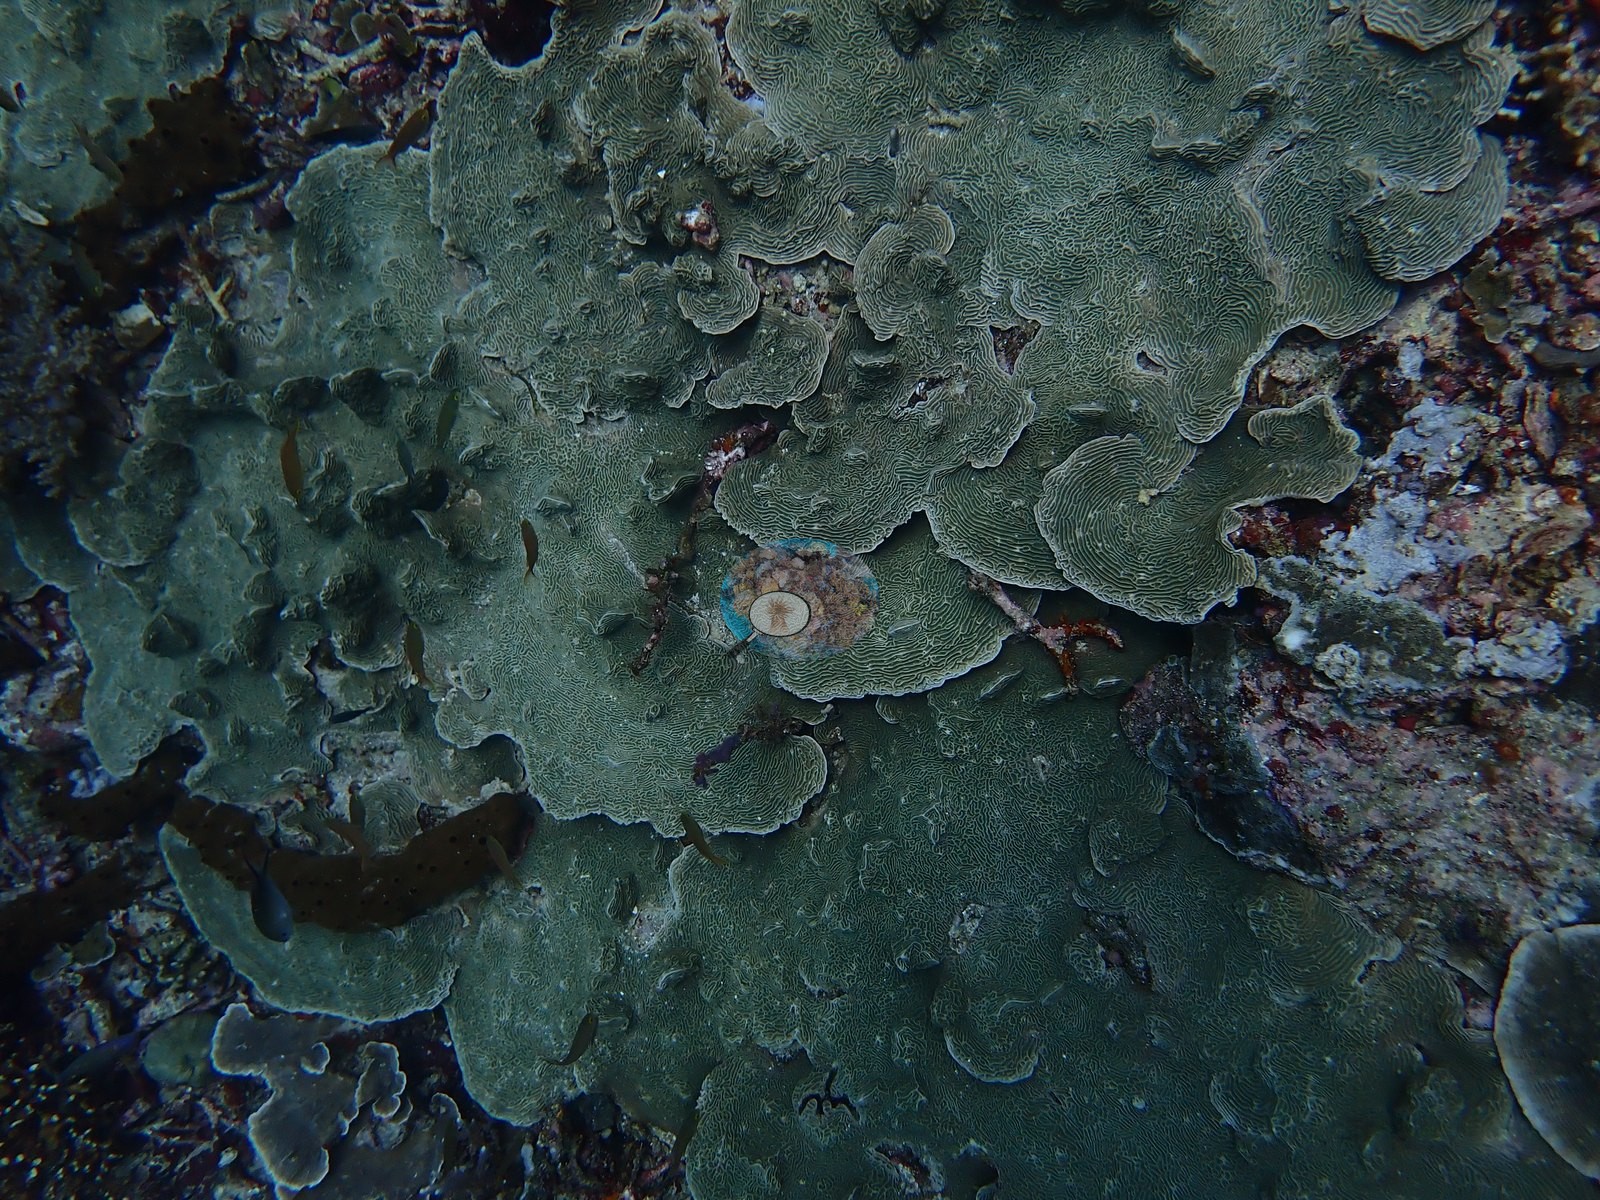
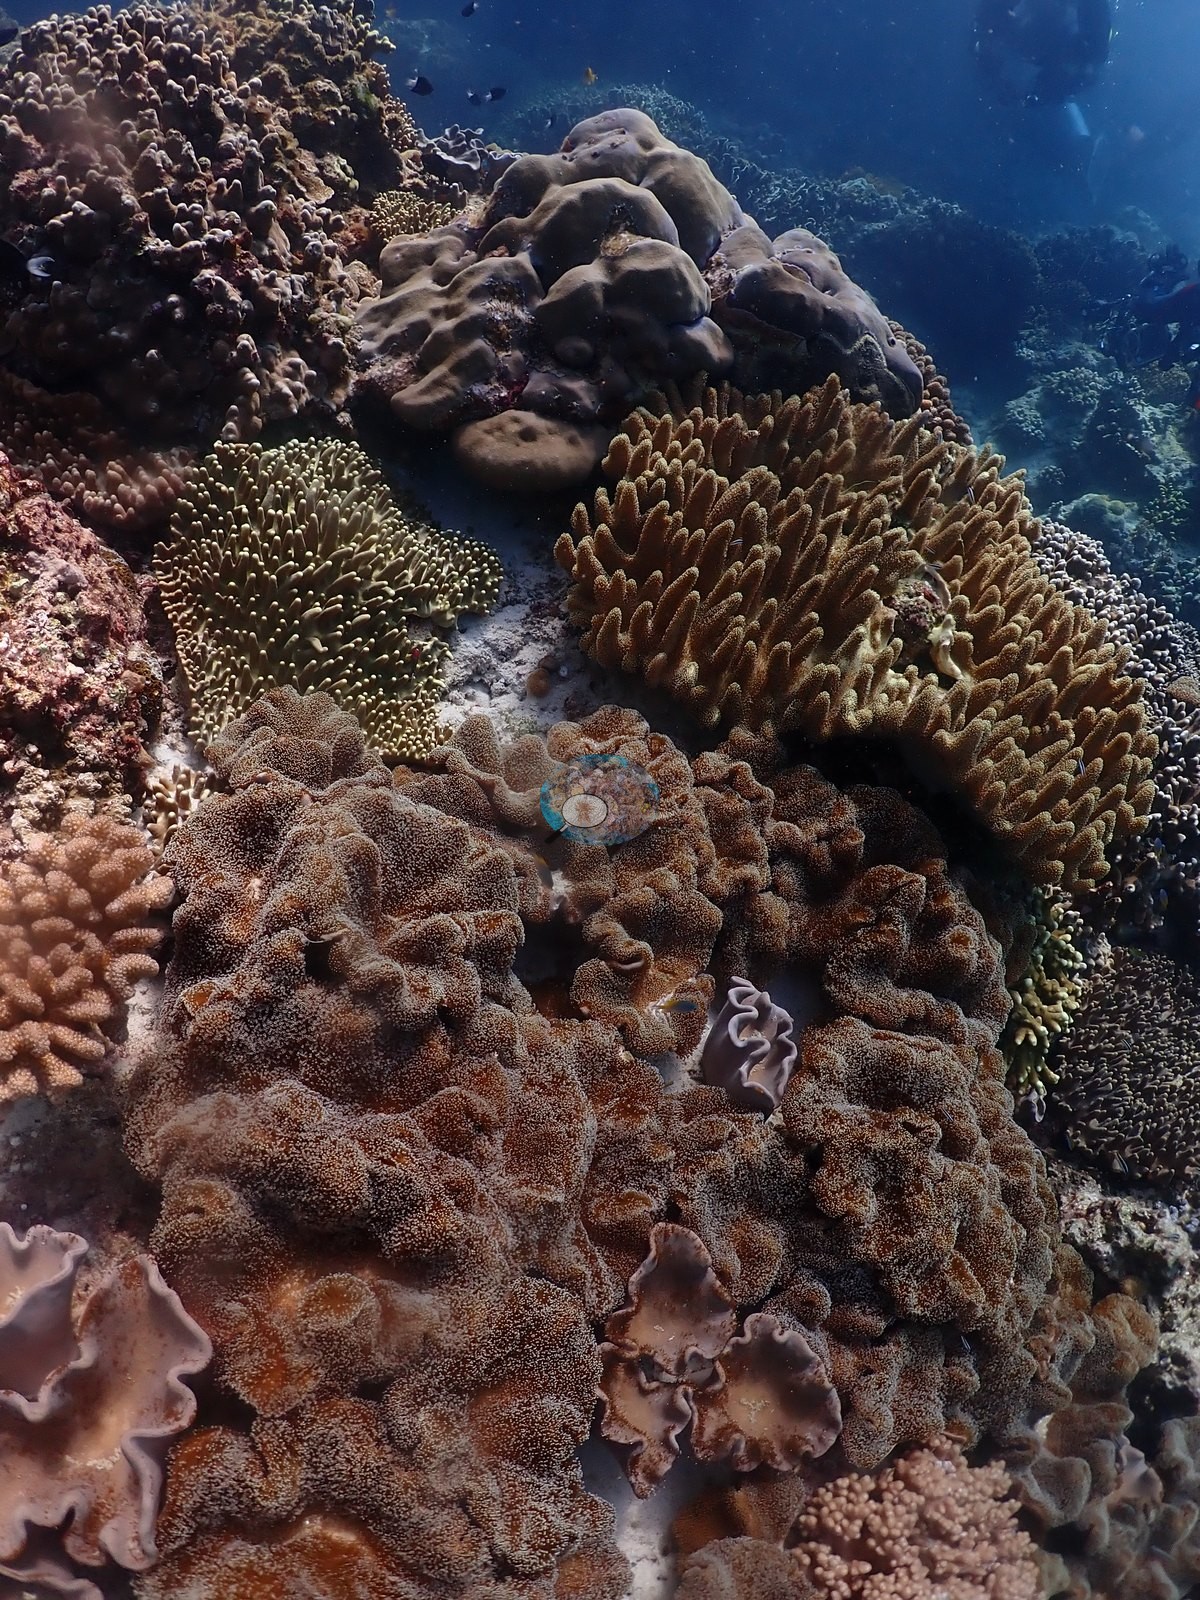
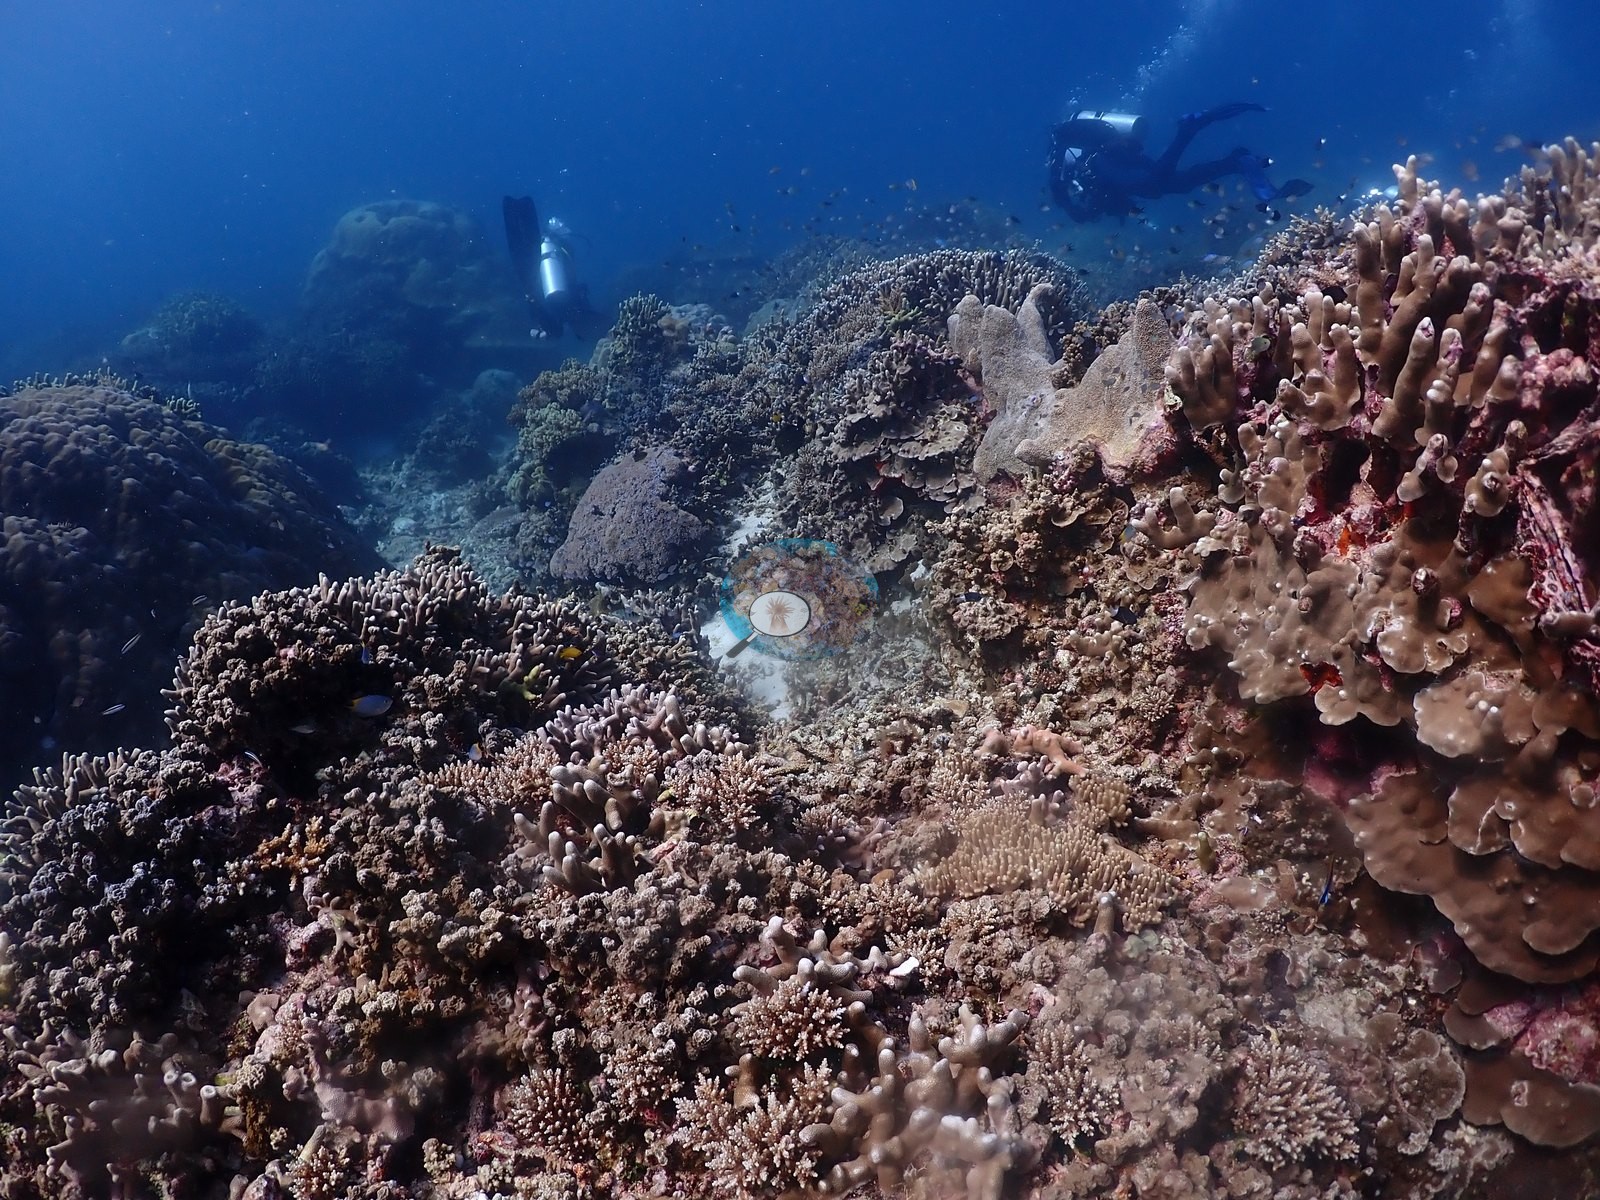
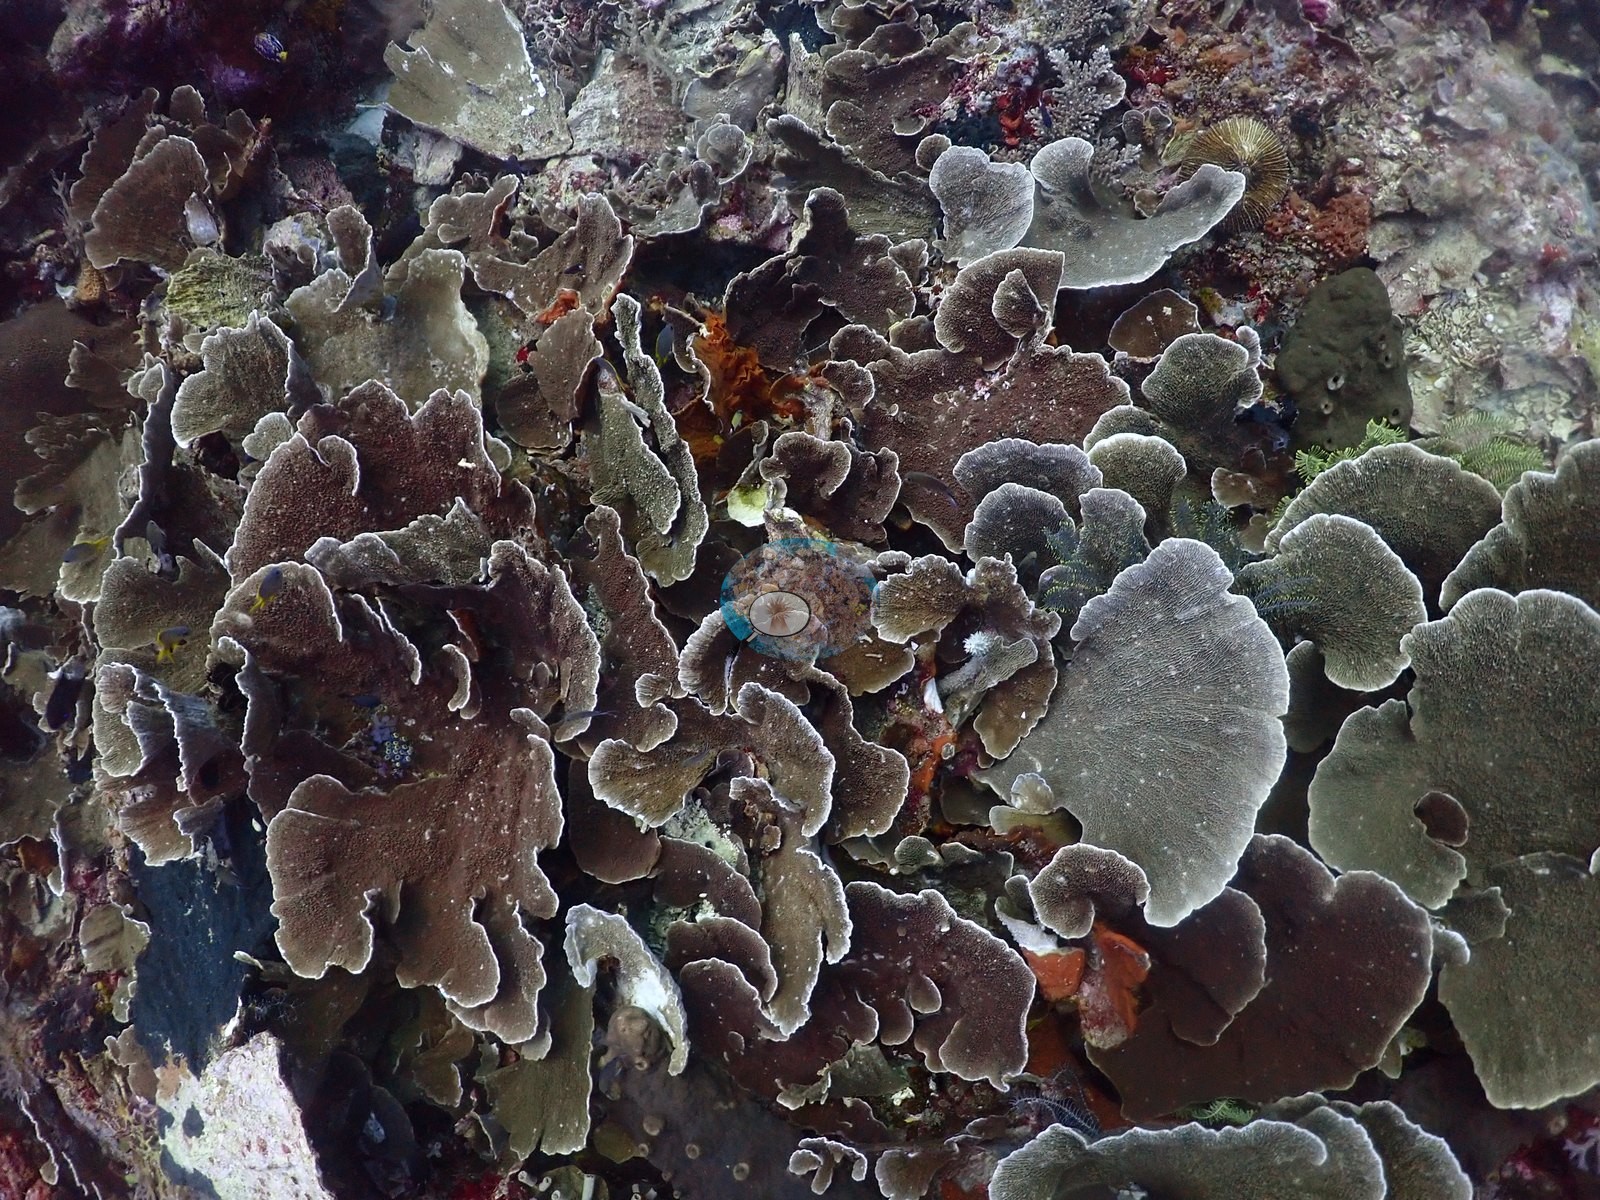
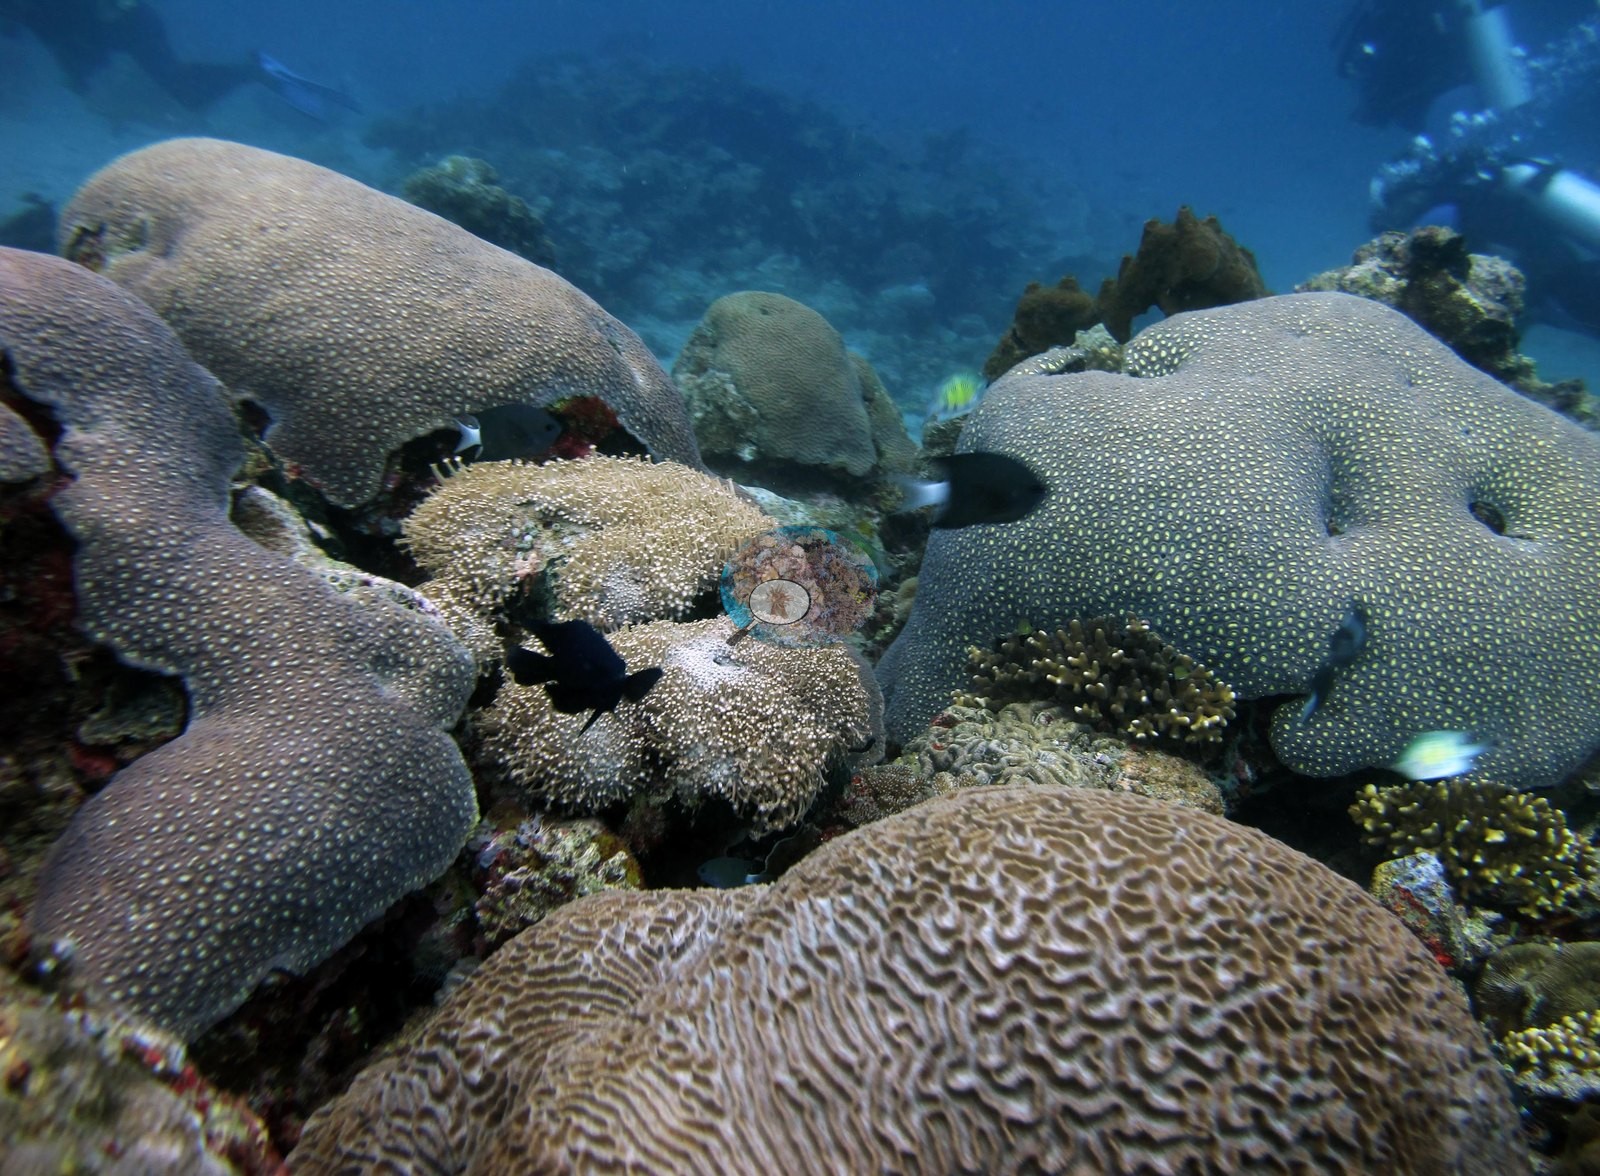
 - The 1988 lava channel at Lava Flow (Gunung Api) now carries essentially complete plate-coral cover beside unbroken staghorn and 20-plus hard coral genera.
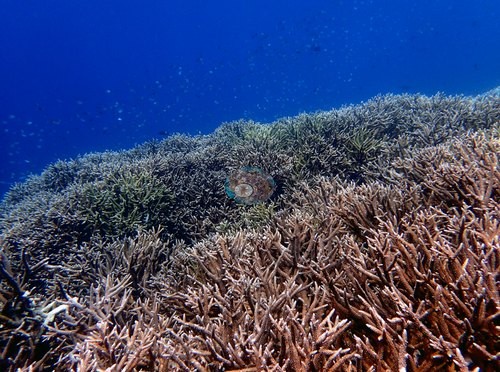 photo: Indonesia - Banda Islands: Lava Flow (Gunung Api)
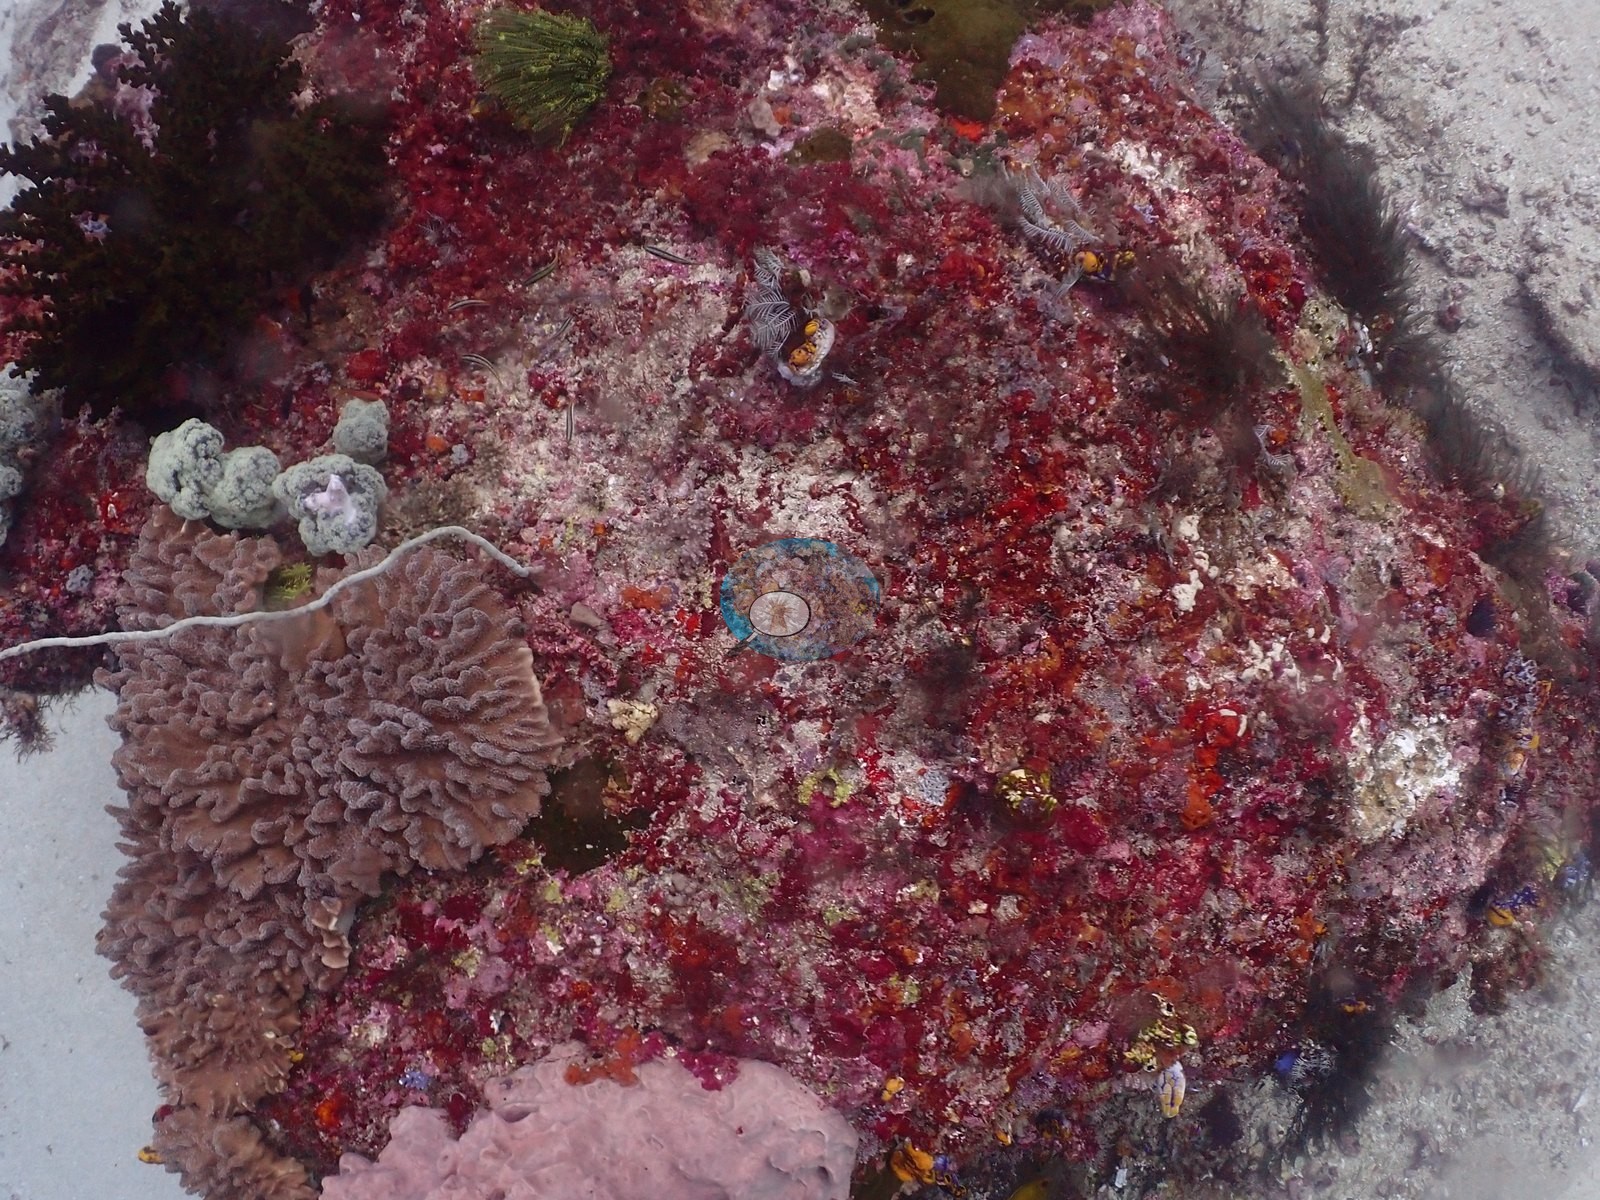
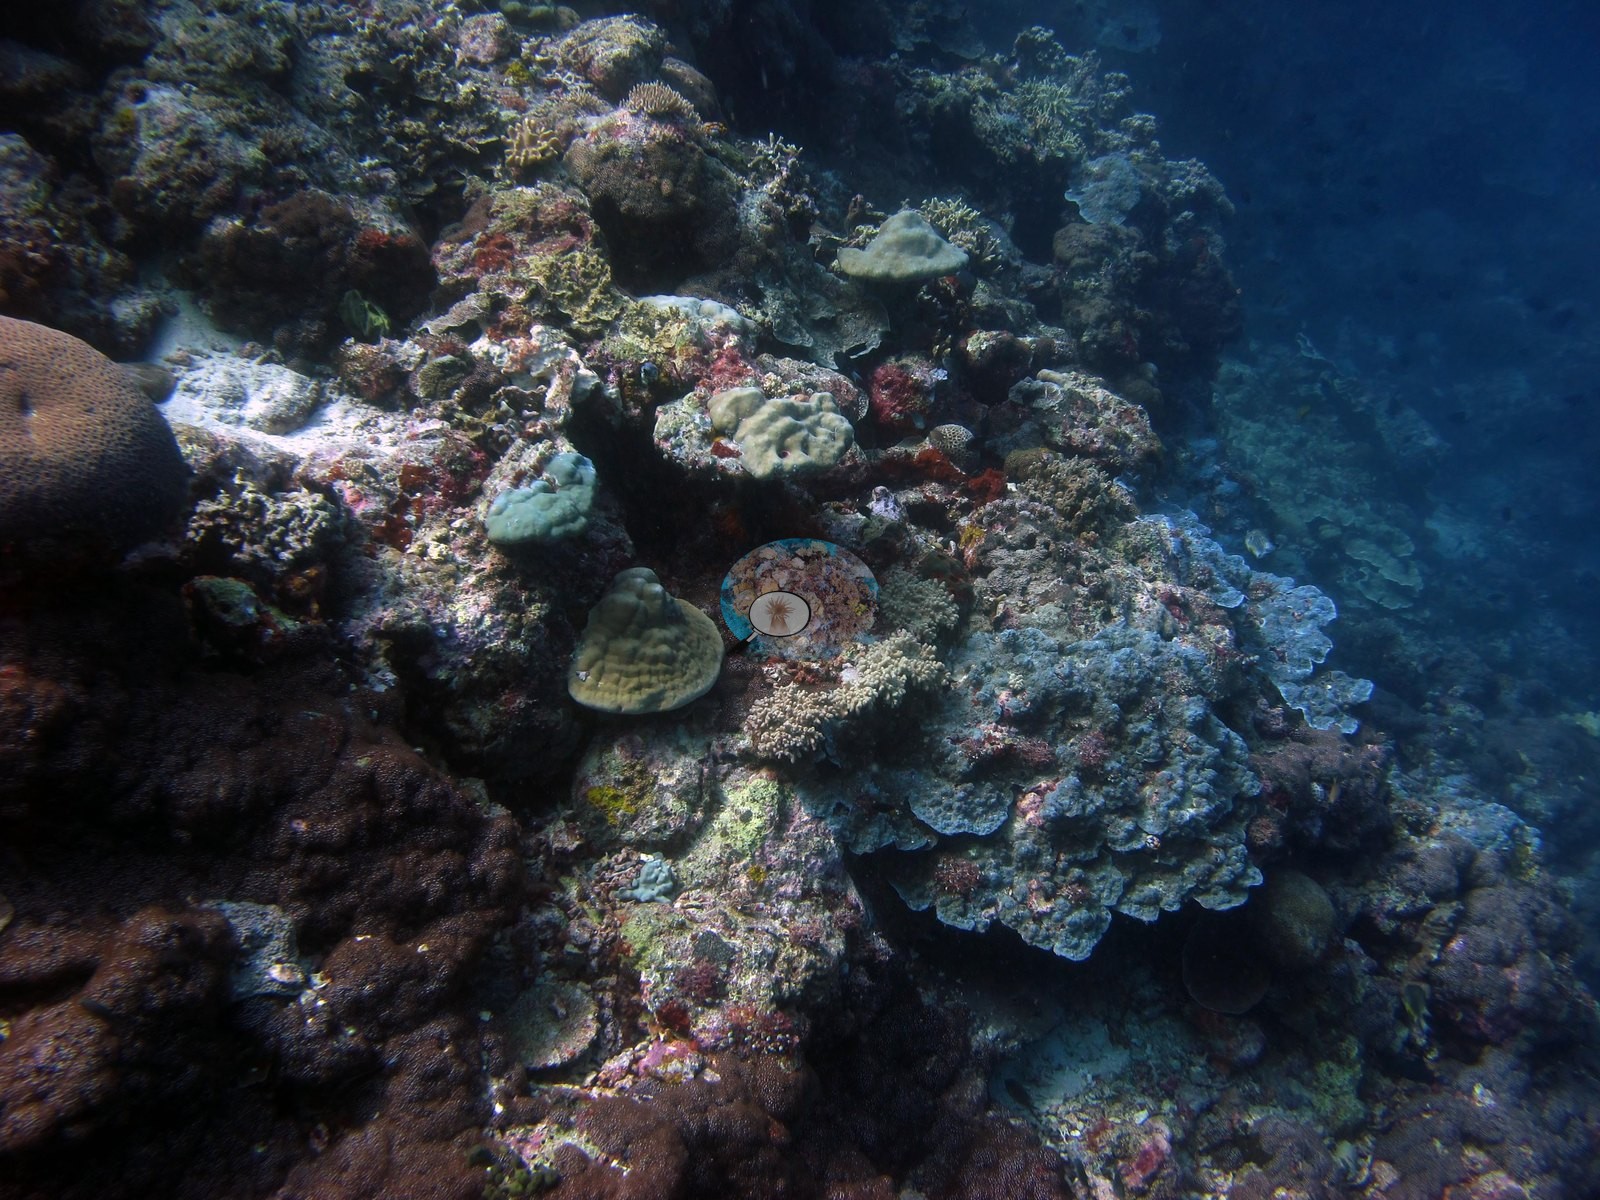
 - The highest cover index in Maluku, 44.8%, at Airport (Banda Ara), including a long thicket of Turbinaria- and Pachyseris-type plates.
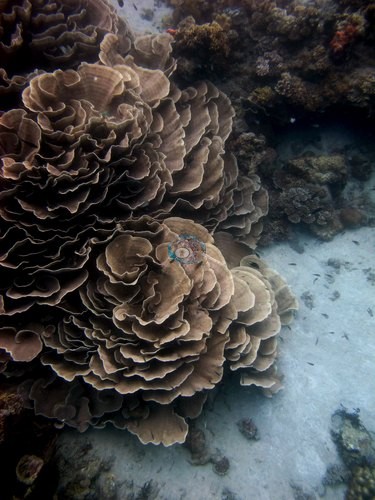 photo: Indonesia - Banda Islands: Airport (Banda Ara)
 - A crown-of-thorns starfish under an overhang beside a freshly grazed massive coral at Merida Cavern, which pairs a limestone swim-through with meter-wide tabular Acropora.
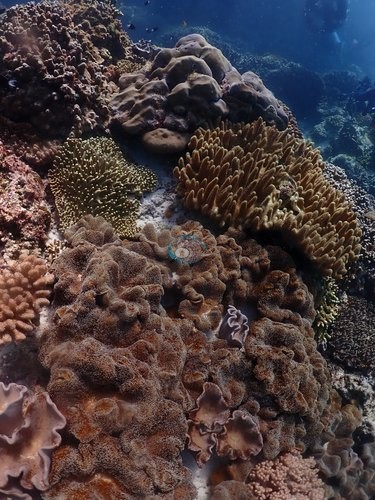 photo: Indonesia - Halmahera: Merida Cavern
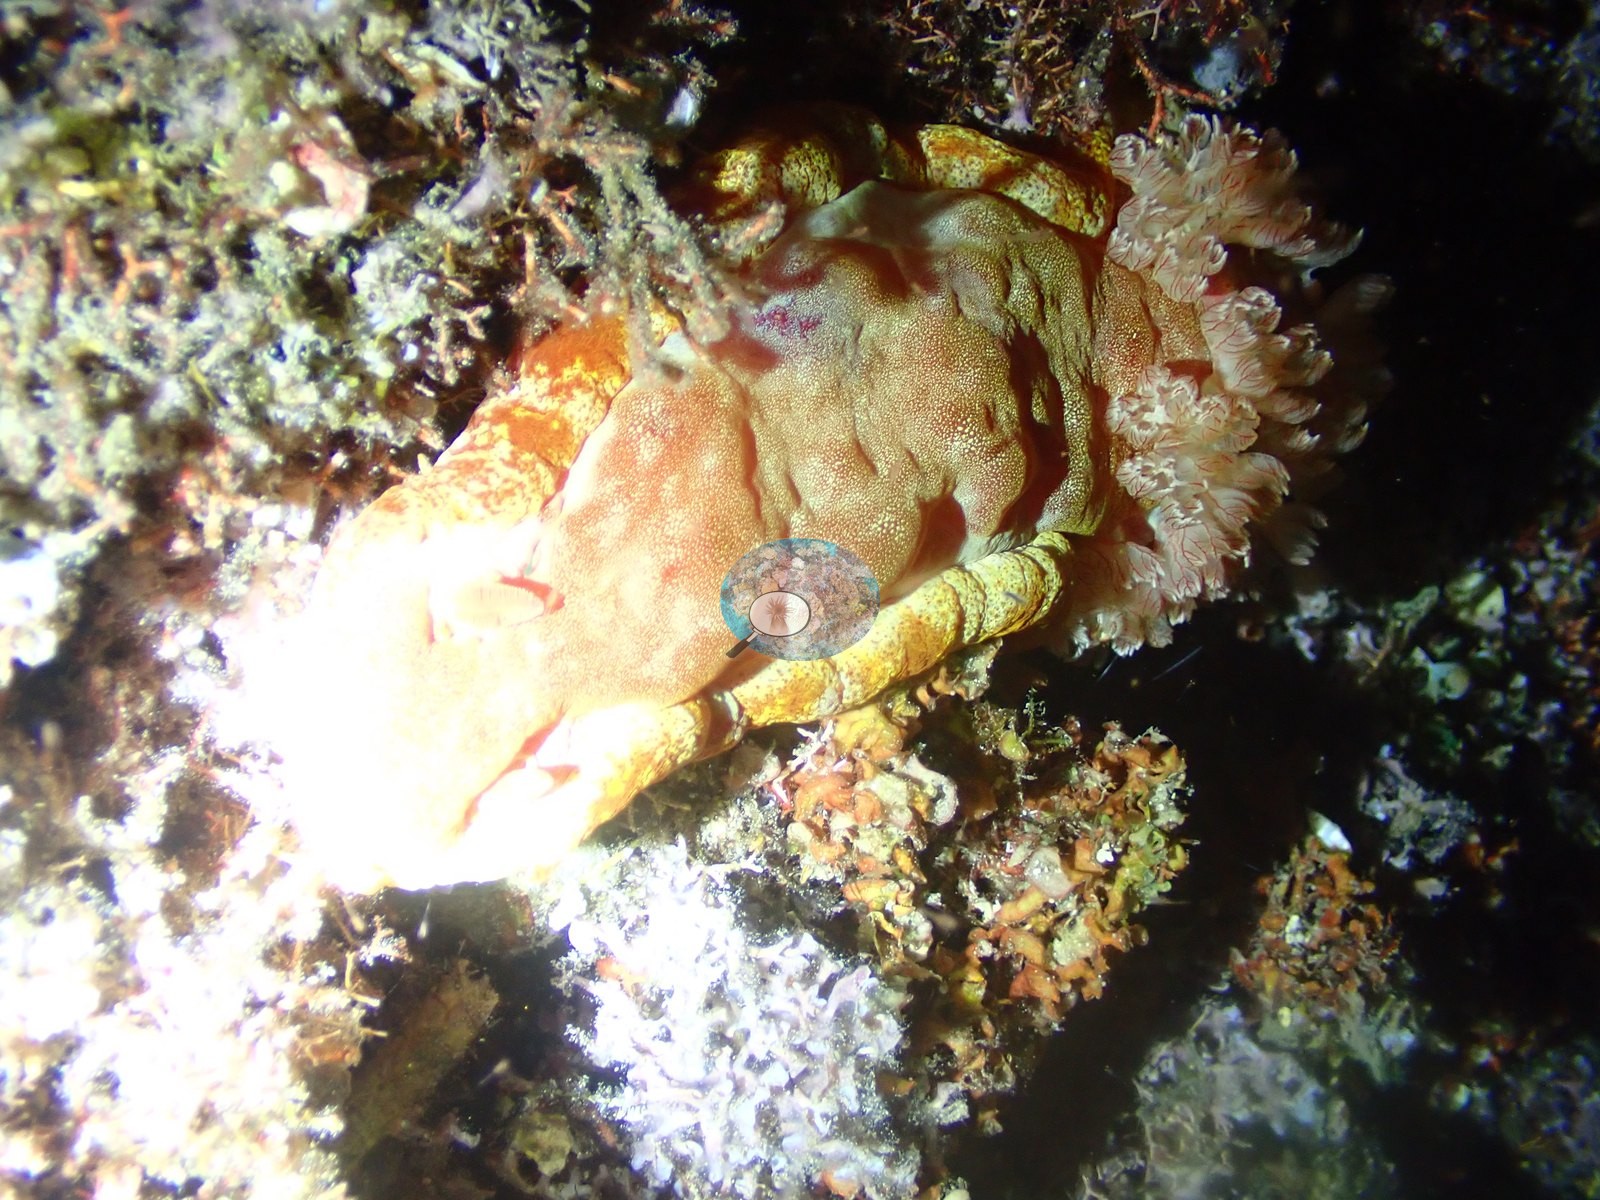
 - Walking sharks on a Ternate waterfront night dive at Pantai Falajawa.
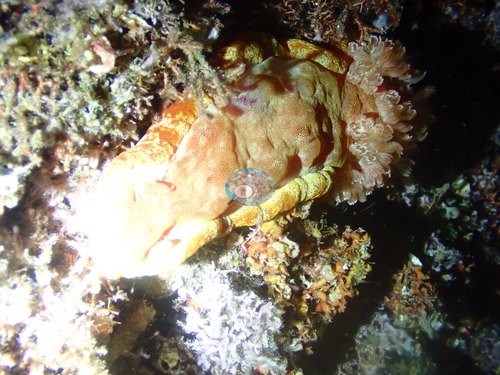 photo: Indonesia - Halmahera: Pantai Falajawa
Notable observations (11)
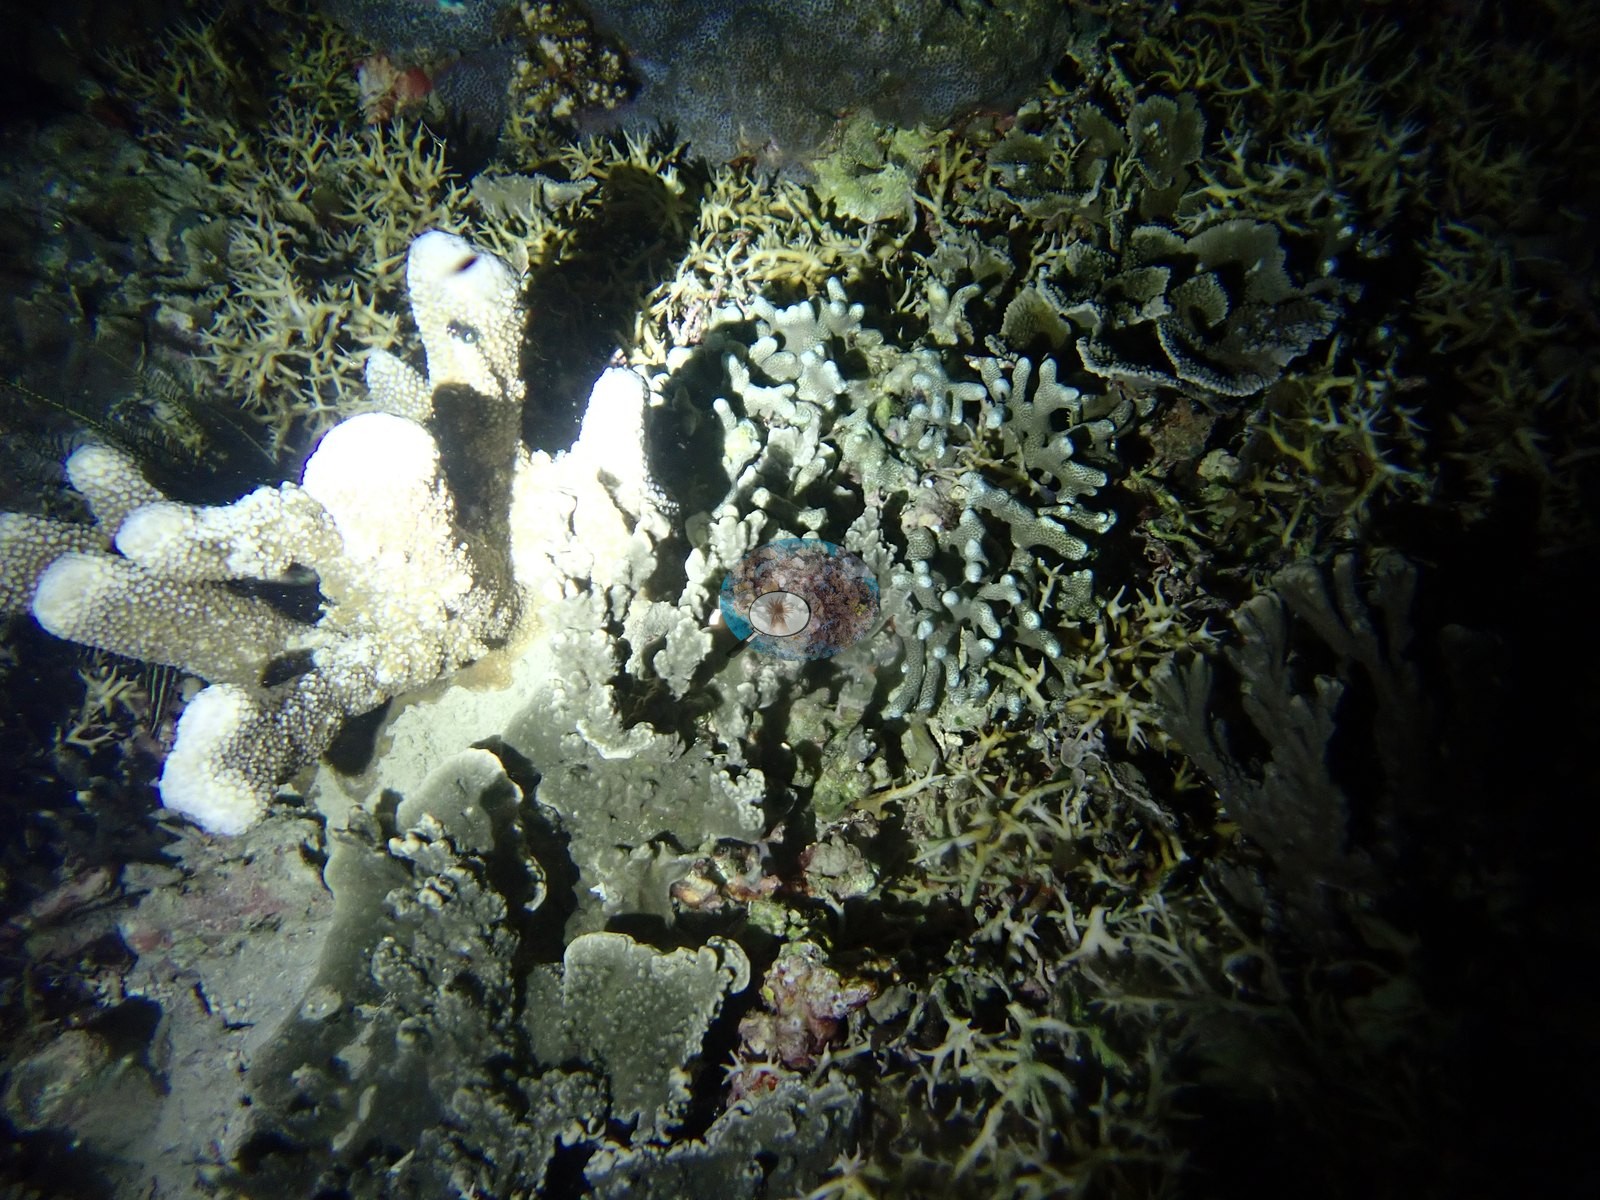
- Indonesia - Halmahera: Merida Cavern: crown-of-thorns starfish (COTS): a crown-of-thorns starfish under an overhang with a stark-white, freshly grazed massive coral above it, plus further clean white feeding scars on neighboring colonies.
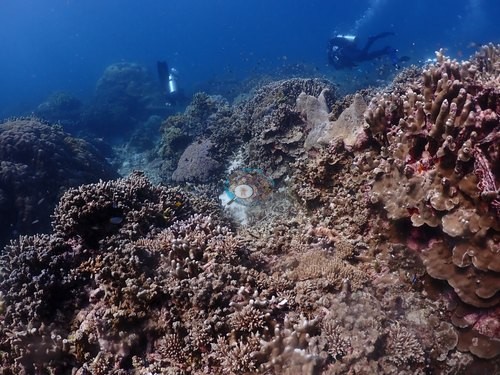
- Indonesia - Halmahera: Mugia: COTS: a large Acanthaster-type crown-of-thorns starfish in two frames (possibly one animal), amid turf-covered dead branching rubble; no feeding scar caught on living coral.
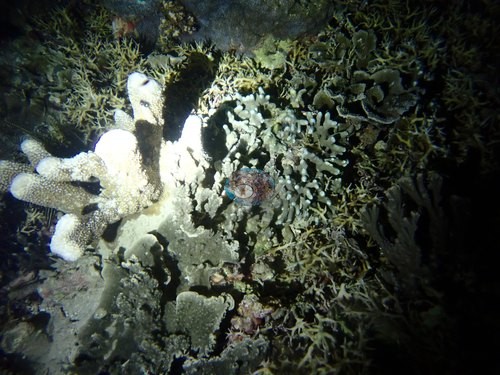
- Indonesia - Halmahera: Lelay Utara (north): Bleaching: real, hedged partial bleaching on the shallow plateau; one discrete colony bone-white beside pigmented neighbors and widespread paling across that section; read as active, recent, and partial.
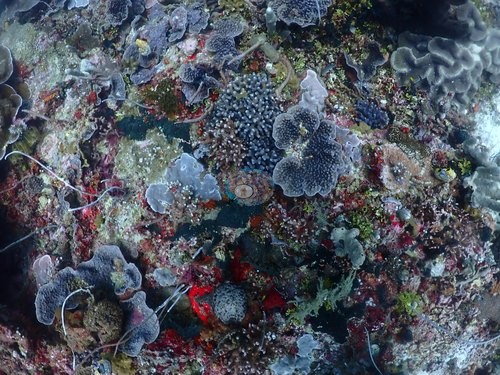
- Indonesia - Halmahera: Siko Tanjung: Bleaching (photographic call): a handful of massive colonies stark chalk-white while neighbors hold normal color; bleached-alive cannot be separated from very recently dead.
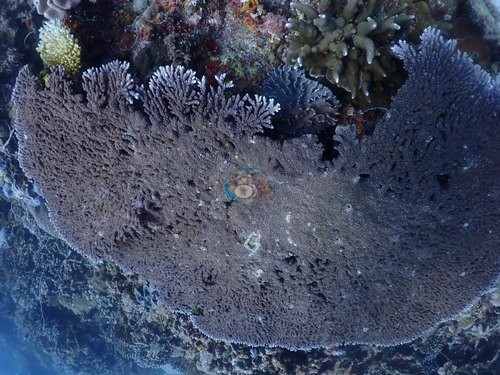
- Indonesia - Halmahera: Kusu Ridge: Bleaching or recent mortality: one plating colony about 1.5 m across stark white over its entire surface, neighbors normally pigmented; isolated single-colony event.
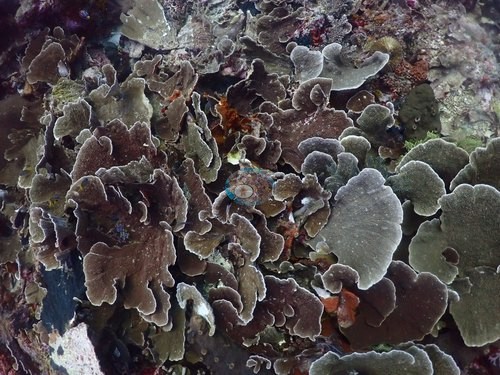
- Indonesia - Banda Islands: Tanjung Pisang (Banana Island): Bleaching confirmed in four frames: a cluster of roughly five large laminar/plating colonies (Turbinaria/Echinopora) stark white with tissue still present; a separate pair of pale Porites-type colonies suggests low-incidence paling scattered across the reef. No COTS, Drupella, or disease.
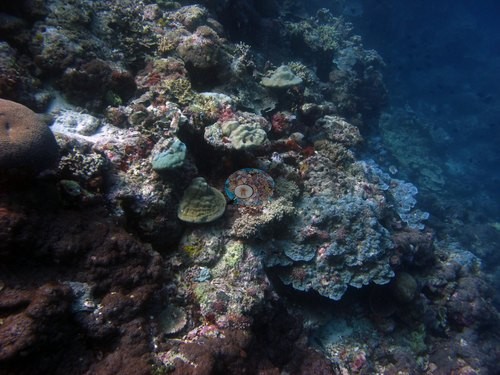
- Indonesia - Banda Islands: Lava Flow (Gunung Api): Eighteen frames with stark-white colonies among pigmented neighbors (low-level, colony-scale bleaching in Acropora, Pocillopora acuta-type, Seriatopora, massive Porites); 11 frames of recent-mortality ground. No Acanthaster or Drupella; cause not asserted.
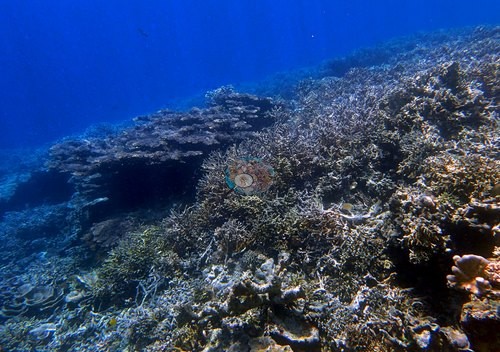
- Indonesia - Banda Islands: Airport (Banda Ara): One Stylophora-type colony stark white to pale green over roughly half its surface (partial bleaching); a ~2 m tabulate Acropora with a sharply bounded bare white patch, consistent with white syndrome or a healed predation scar (the photograph cannot separate them). No COTS.
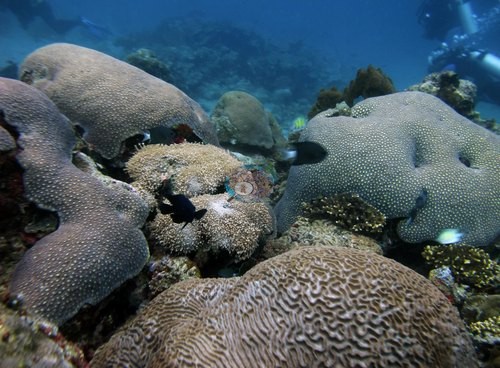
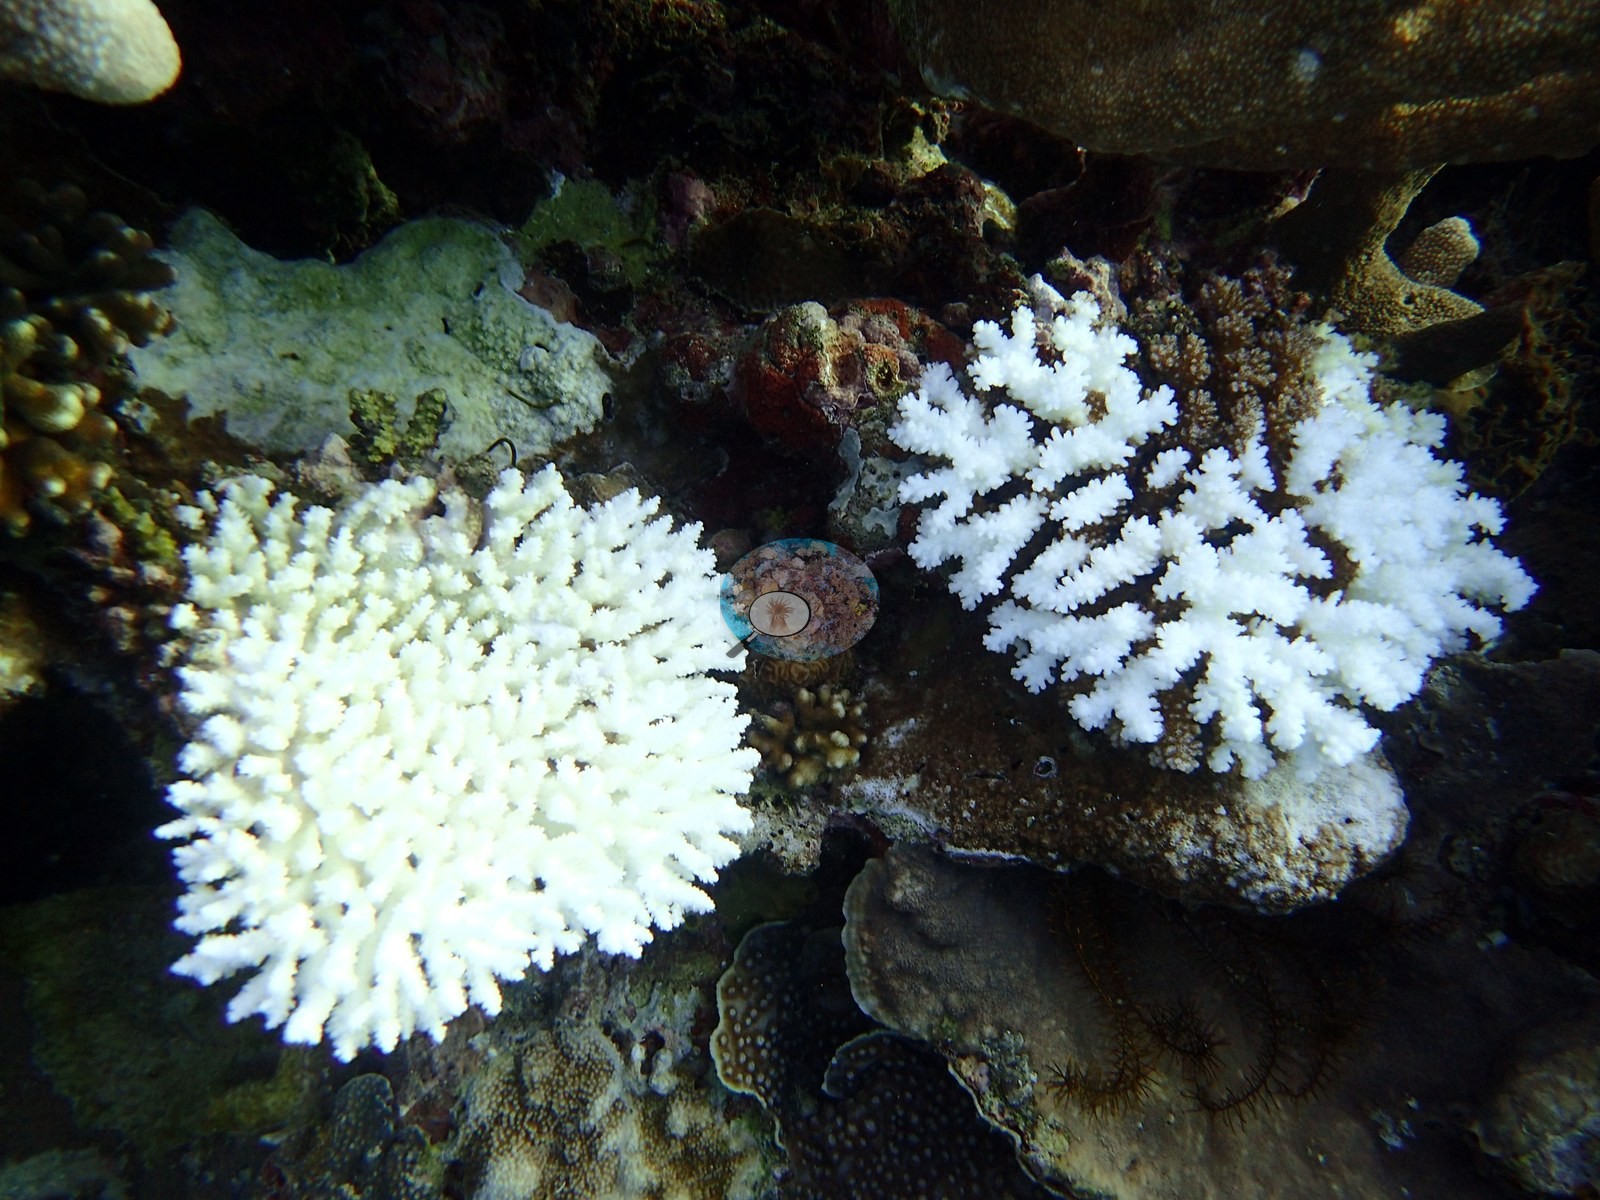
- Indonesia - Banda Islands: Lighthouse: Two corymbose Acropora colonies fully bleached bone-white among normally pigmented neighbors; colony-scale and localized, not a whole-reef event. No COTS or disease seen.
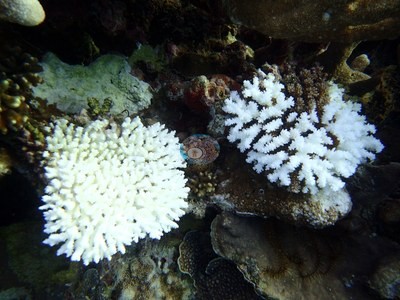
- Indonesia - Ambon: Air Manis (Laha): Fishing gear and localized bleaching: at least five frames show a fine monofilament gillnet draped across coral bommies and the water column, with small fish visibly trapped in it. Separately, one leather coral colony has a single lobe sharply bleached bright white. No crown-of-thorns starfish or disease seen.
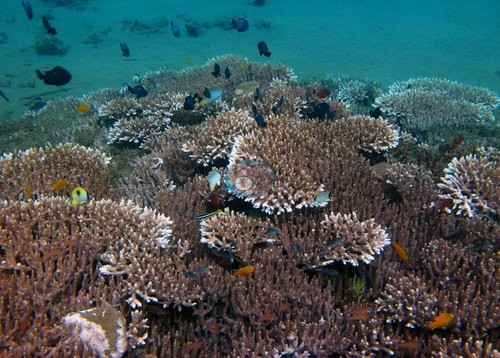
- Indonesia - Ambon: Laha-2: A glass bottle and jar embedded in the shell rubble, tangled monofilament fishing line through several frames, a PVC pipe fragment, and a fabric scrap: debris woven into the substrate used as habitat. No bleaching, disease, or crown-of-thorns starfish seen.
Coral cover over time (pooled)
Sites in this region (40)
- Indonesia - Ambon: Air Manis (Laha) — 31% coral cover
- Indonesia - Ambon: Laha-2 — 24% coral cover
- Indonesia - Ambon: Rhino City (Laha) — 33% coral cover
- Indonesia - Banda Islands: Airport (Banda Ara) — 38% coral cover
- Indonesia - Banda Islands: Batu Kapal — 16% coral cover
- Indonesia - Banda Islands: Goat Hall (Pulau Ai) — 37% coral cover
- Indonesia - Banda Islands: Lava Flow (Gunung Api) — 55% coral cover
- Indonesia - Banda Islands: Lighthouse — 29% coral cover
- Indonesia - Banda Islands: Shark Point (Pulau Ai) — 33% coral cover
- Indonesia - Banda Islands: Tanjung Pisang (Banana Island) — 36% coral cover
- Indonesia - Halmahera S (Bacan strait)
- Indonesia - Halmahera SW (Guraici Is.)
- Indonesia - Halmahera W (Ternate/Tidore strait)
- Indonesia - Halmahera: AM Point 2 — 40% coral cover
- Indonesia - Halmahera: Batu Balong — 39% coral cover
- Indonesia - Halmahera: Batu Balong shallows-near anchorage — 57% coral cover
- Indonesia - Halmahera: Batu Mandi — 12% coral cover
- Indonesia - Halmahera: Batu Mangga — 21% coral cover
- Indonesia - Halmahera: Cimitero
- Indonesia - Halmahera: Failonga — 33% coral cover
- Indonesia - Halmahera: Ferry Jetty
- Indonesia - Halmahera: Jerot — 23% coral cover
- Indonesia - Halmahera: Kusu Drift — 26% coral cover
- Indonesia - Halmahera: Kusu Drift (round 2) — 43% coral cover
- Indonesia - Halmahera: Kusu Ridge — 45% coral cover
- Indonesia - Halmahera: Lelay Utara (north) — 48% coral cover
- Indonesia - Halmahera: Maitara North — 33% coral cover
- Indonesia - Halmahera: Merida Cavern — 27% coral cover
- Indonesia - Halmahera: Mugia
- Indonesia - Halmahera: Pantai Falajawa
- Indonesia - Halmahera: Pretty Shallow — 32% coral cover
- Indonesia - Halmahera: Proco — 32% coral cover
- Indonesia - Halmahera: Pulau Sebatang — 41% coral cover
- Indonesia - Halmahera: Reene's Rock (Pulau Gewang) — 13% coral cover
- Indonesia - Halmahera: Sali Bay-Batu Mangga — 29% coral cover
- Indonesia - Halmahera: Siko Pinnacle — 12% coral cover
- Indonesia - Halmahera: Siko Tanjung — 41% coral cover
- Indonesia - Halmahera: Tanjung Dehebra — 25% coral cover
- Indonesia - Halmahera: Tanjung Naraka — 30% coral cover
- Indonesia - Halmahera: Tower Corner — 34% coral cover
Nearby external survey stations
139 independent survey records within 5 km of a site in this region (deduplicated across sites).
Show all 139 records
- Coral Triangle Center (CTC) — Ay Barat (03) (2012): 61% hard coral cover, 1.02 km from Indonesia - Banda Islands: Goat Hall (Pulau Ai)
- Coral Triangle Center (CTC) — Ay Barat (03) (2019): 60% hard coral cover, 1.02 km from Indonesia - Banda Islands: Goat Hall (Pulau Ai)
- Coral Triangle Center (CTC) — Ay Barat (03) (mean of 2 surveys, 2012–2019) (2019): 60% hard coral cover, 1.02 km from Indonesia - Banda Islands: Goat Hall (Pulau Ai)
- Coral Triangle Center (CTC) — Ay Selatan (22) (2015): 64% hard coral cover, 1.33 km from Indonesia - Banda Islands: Goat Hall (Pulau Ai)
- Coral Triangle Center (CTC) — Ay Selatan (22) (2016): 58% hard coral cover, 1.33 km from Indonesia - Banda Islands: Goat Hall (Pulau Ai)
- Coral Triangle Center (CTC) — Ay Selatan (22) (2017): 49% hard coral cover, 1.33 km from Indonesia - Banda Islands: Goat Hall (Pulau Ai)
- Coral Triangle Center (CTC) — Ay Selatan (22) (2018): 52% hard coral cover, 1.33 km from Indonesia - Banda Islands: Goat Hall (Pulau Ai)
- Coral Triangle Center (CTC) — Ay Selatan (22) (2019): 45% hard coral cover, 1.33 km from Indonesia - Banda Islands: Goat Hall (Pulau Ai)
- Coral Triangle Center (CTC) — Ay Selatan (22) (mean of 5 surveys, 2015–2019) (2019): 54% hard coral cover, 1.33 km from Indonesia - Banda Islands: Goat Hall (Pulau Ai)
- Coral Triangle Center (CTC) — Ay Timur (04) (2012): 44% hard coral cover, 0.32 km from Indonesia - Banda Islands: Shark Point (Pulau Ai)
- Coral Triangle Center (CTC) — Ay Timur (04) (2015): 24% hard coral cover, 0.32 km from Indonesia - Banda Islands: Shark Point (Pulau Ai)
- Coral Triangle Center (CTC) — Ay Timur (04) (2016): 24% hard coral cover, 0.32 km from Indonesia - Banda Islands: Shark Point (Pulau Ai)
- Coral Triangle Center (CTC) — Ay Timur (04) (2017): 19% hard coral cover, 0.32 km from Indonesia - Banda Islands: Shark Point (Pulau Ai)
- Coral Triangle Center (CTC) — Ay Timur (04) (2018): 38% hard coral cover, 0.32 km from Indonesia - Banda Islands: Shark Point (Pulau Ai)
- Coral Triangle Center (CTC) — Ay Timur (04) (2019): 55% hard coral cover, 0.32 km from Indonesia - Banda Islands: Shark Point (Pulau Ai)
- Coral Triangle Center (CTC) — Ay Timur (04) (mean of 6 surveys, 2012–2019) (2019): 34% hard coral cover, 0.32 km from Indonesia - Banda Islands: Shark Point (Pulau Ai)
- Coral Triangle Center (CTC) — Batu Belanda (19) (2019): 23% hard coral cover, 4.36 km from Indonesia - Banda Islands: Lava Flow (Gunung Api)
- Coral Triangle Center (CTC) — Batu Kapal (10) (2019): 31% hard coral cover, 1.85 km from Indonesia - Banda Islands: Batu Kapal
- Coral Triangle Center (CTC) — Gunung Api Selatan (08) (2019): 11% hard coral cover, 2.06 km from Indonesia - Banda Islands: Lava Flow (Gunung Api)
- Coral Triangle Center (CTC) — Gunung Api Timur (07) (2019): 39% hard coral cover, 1.35 km from Indonesia - Banda Islands: Airport (Banda Ara)
- Coral Triangle Center (CTC) — Karaka (06) (2019): 67% hard coral cover, 2.18 km from Indonesia - Banda Islands: Lighthouse
- Coral Triangle Center (CTC) — Lava Flow (09) (2019): 69% hard coral cover, 1.96 km from Indonesia - Banda Islands: Lava Flow (Gunung Api)
- Coral Triangle Center (CTC) — Mangku Batu (20) (2014): 43% hard coral cover, 1.22 km from Indonesia - Banda Islands: Lighthouse
- Coral Triangle Center (CTC) — Mangku Batu (20) (2015): 27% hard coral cover, 1.22 km from Indonesia - Banda Islands: Lighthouse
- Coral Triangle Center (CTC) — Mangku Batu (20) (2016): 33% hard coral cover, 1.22 km from Indonesia - Banda Islands: Lighthouse
- Coral Triangle Center (CTC) — Mangku Batu (20) (2017): 28% hard coral cover, 1.22 km from Indonesia - Banda Islands: Lighthouse
- Coral Triangle Center (CTC) — Mangku Batu (20) (2018): 39% hard coral cover, 1.22 km from Indonesia - Banda Islands: Lighthouse
- Coral Triangle Center (CTC) — Mangku Batu (20) (2019): 34% hard coral cover, 1.22 km from Indonesia - Banda Islands: Lighthouse
- Coral Triangle Center (CTC) — Mangku Batu (20) (mean of 6 surveys, 2014–2019) (2019): 34% hard coral cover, 1.22 km from Indonesia - Banda Islands: Lighthouse
- Coral Triangle Center (CTC) — Pohon Miring (16) (2019): 65% hard coral cover, 3.11 km from Indonesia - Banda Islands: Batu Kapal
- Coral Triangle Center (CTC) — Syahrir Timur (11) (2014): 49% hard coral cover, 1.89 km from Indonesia - Banda Islands: Batu Kapal
- Coral Triangle Center (CTC) — Syahrir Timur (11) (2015): 35% hard coral cover, 1.89 km from Indonesia - Banda Islands: Batu Kapal
- Coral Triangle Center (CTC) — Syahrir Timur (11) (2016): 47% hard coral cover, 1.89 km from Indonesia - Banda Islands: Batu Kapal
- Coral Triangle Center (CTC) — Syahrir Timur (11) (2017): 48% hard coral cover, 1.89 km from Indonesia - Banda Islands: Batu Kapal
- Coral Triangle Center (CTC) — Syahrir Timur (11) (2018): 47% hard coral cover, 1.89 km from Indonesia - Banda Islands: Batu Kapal
- Coral Triangle Center (CTC) — Syahrir Timur (11) (2019): 53% hard coral cover, 1.89 km from Indonesia - Banda Islands: Batu Kapal
- Coral Triangle Center (CTC) — Syahrir Timur (11) (mean of 6 surveys, 2014–2019) (2019): 47% hard coral cover, 1.89 km from Indonesia - Banda Islands: Batu Kapal
- Coral Triangle Center (CTC) — Uring (18) (2019): 44% hard coral cover, 2.95 km from Indonesia - Banda Islands: Tanjung Pisang (Banana Island)
- Coral Triangle Center (CTC) — Waer (17) (2019): 46% hard coral cover, 4.63 km from Indonesia - Banda Islands: Tanjung Pisang (Banana Island)
- Coral Triangle Center (CTC) — Wali (12) (2014): 40% hard coral cover, 2.93 km from Indonesia - Banda Islands: Batu Kapal
- Coral Triangle Center (CTC) — Wali (12) (2015): 37% hard coral cover, 2.93 km from Indonesia - Banda Islands: Batu Kapal
- Coral Triangle Center (CTC) — Wali (12) (2016): 42% hard coral cover, 2.93 km from Indonesia - Banda Islands: Batu Kapal
- Coral Triangle Center (CTC) — Wali (12) (2017): 43% hard coral cover, 2.93 km from Indonesia - Banda Islands: Batu Kapal
- Coral Triangle Center (CTC) — Wali (12) (2018): 42% hard coral cover, 2.93 km from Indonesia - Banda Islands: Batu Kapal
- Coral Triangle Center (CTC) — Wali (12) (2019): 35% hard coral cover, 2.93 km from Indonesia - Banda Islands: Batu Kapal
- Kalea A. & Ocean cholic* — Maitara Land 2 (2021): 2.7% hard coral cover, 1.21 km from Indonesia - Halmahera: Maitara North
- Kalea A. & Ocean cholic* — Maitara land (2021): 1.5% hard coral cover, 1.60 km from Indonesia - Halmahera: Maitara North
- MERMAID project “Monitoring Maitara 2021”* — Maitara 1 (2021): 17% hard coral cover, 1.21 km from Indonesia - Halmahera: Maitara North
- MERMAID project “Monitoring Maitara 2021”* (MERMAID test project) — Maitara 1 (2021): 17% hard coral cover, 1.21 km from Indonesia - Halmahera: Maitara North
- MERMAID project “Nukila”* — Nukila (2021): 35% hard coral cover, 1.43 km from Indonesia - Halmahera: Pantai Falajawa
- MERMAID project “maitara selatan”* — Nukila (2021): 35% hard coral cover, 1.44 km from Indonesia - Halmahera: Pantai Falajawa
- Reef Check — Ai Pohon 3 (2018): 43% hard coral cover, 0.67 km from Indonesia - Banda Islands: Goat Hall (Pulau Ai)
- Reef Check — Ai Pohon 3 (2018): 42% hard coral cover, 0.67 km from Indonesia - Banda Islands: Goat Hall (Pulau Ai)
- Reef Check — Ai Pohon 3 (2019): 41% hard coral cover, 0.67 km from Indonesia - Banda Islands: Goat Hall (Pulau Ai)
- Reef Check — Ampas Roti, Gunung Api (2016): 47% hard coral cover, 0.97 km from Indonesia - Banda Islands: Lava Flow (Gunung Api)
- Reef Check — Ampas Roti, Gunung Api (2016): 34% hard coral cover, 0.96 km from Indonesia - Banda Islands: Lava Flow (Gunung Api)
- Reef Check — Ampas Roti, Gunung Api (2018): 26% hard coral cover, 0.97 km from Indonesia - Banda Islands: Lava Flow (Gunung Api)
- Reef Check — Ampas Roti, Gunung Api (2019): 29% hard coral cover, 0.97 km from Indonesia - Banda Islands: Lava Flow (Gunung Api)
- Reef Check — Ampas Roti, Gunung Api (2024): 50% hard coral cover, 0.97 km from Indonesia - Banda Islands: Lava Flow (Gunung Api)
- Reef Check — Banda Besar 4.05 (2018): 85% hard coral cover, 3.14 km from Indonesia - Banda Islands: Batu Kapal
- Reef Check — Banda Besar 4.2 (2018): 47% hard coral cover, 4.36 km from Indonesia - Banda Islands: Batu Kapal
- Reef Check — Banda Besar 4.25 (2018): 35% hard coral cover, 4.60 km from Indonesia - Banda Islands: Batu Kapal
- Reef Check — Banda Besar 4.4 (2018): 42% hard coral cover, 4.87 km from Indonesia - Banda Islands: Tanjung Pisang (Banana Island)
- Reef Check — Bandara (2018): 21% hard coral cover, 1.08 km from Indonesia - Banda Islands: Airport (Banda Ara)
- Reef Check — Bandara (2018): 27% hard coral cover, 1.08 km from Indonesia - Banda Islands: Airport (Banda Ara)
- Reef Check — Bandara (2019): 33% hard coral cover, 1.08 km from Indonesia - Banda Islands: Airport (Banda Ara)
- Reef Check — Batu Belanda (2018): 27% hard coral cover, 3.94 km from Indonesia - Banda Islands: Lava Flow (Gunung Api)
- Reef Check — Batu Belanda (2019): 32% hard coral cover, 3.94 km from Indonesia - Banda Islands: Lava Flow (Gunung Api)
- Reef Check — Batu Belanda (2020): 29% hard coral cover, 3.94 km from Indonesia - Banda Islands: Lava Flow (Gunung Api)
- Reef Check — Batu Belanda (2024): 50% hard coral cover, 3.94 km from Indonesia - Banda Islands: Lava Flow (Gunung Api)
- Reef Check — Batu Belanda (2025): 56% hard coral cover, 3.94 km from Indonesia - Banda Islands: Lava Flow (Gunung Api)
- Reef Check — Batu Kapal (2016): 34% hard coral cover, 1.82 km from Indonesia - Banda Islands: Batu Kapal
- Reef Check — Batu Kapal (2017): 29% hard coral cover, 1.82 km from Indonesia - Banda Islands: Batu Kapal
- Reef Check — Batu Kapal (2017): 30% hard coral cover, 1.82 km from Indonesia - Banda Islands: Batu Kapal
- Reef Check — Batu Kapal (2019): 28% hard coral cover, 1.82 km from Indonesia - Banda Islands: Batu Kapal
- Reef Check — Batu Payung (2023): 44% hard coral cover, 0.52 km from Indonesia - Banda Islands: Goat Hall (Pulau Ai)
- Reef Check — Belakang Selamon (2018): 57% hard coral cover, 3.68 km from Indonesia - Banda Islands: Batu Kapal
- Reef Check — Karnofol (2015): 47% hard coral cover, 4.83 km from Indonesia - Banda Islands: Tanjung Pisang (Banana Island)
- Reef Check — Karnofol (2016): 54% hard coral cover, 4.97 km from Indonesia - Banda Islands: Tanjung Pisang (Banana Island)
- Reef Check — Karnofol (2017): 49% hard coral cover, 4.97 km from Indonesia - Banda Islands: Tanjung Pisang (Banana Island)
- Reef Check — Karnofol (2018): 52% hard coral cover, 4.83 km from Indonesia - Banda Islands: Tanjung Pisang (Banana Island)
- Reef Check — Karnofol (2019): 43% hard coral cover, 4.83 km from Indonesia - Banda Islands: Tanjung Pisang (Banana Island)
- Reef Check — Karnofol (2024): 40% hard coral cover, 4.83 km from Indonesia - Banda Islands: Tanjung Pisang (Banana Island)
- Reef Check — Karnofol (2025): 56% hard coral cover, 4.83 km from Indonesia - Banda Islands: Tanjung Pisang (Banana Island)
- Reef Check — Lampu Merah (2019): 56% hard coral cover, 1.57 km from Indonesia - Banda Islands: Lighthouse
- Reef Check — Lava Flow (2015): 76% hard coral cover, 1.94 km from Indonesia - Banda Islands: Lava Flow (Gunung Api)
- Reef Check — Lava Flow (2016): 64% hard coral cover, 1.94 km from Indonesia - Banda Islands: Lava Flow (Gunung Api)
- Reef Check — Lava Flow (2017): 63% hard coral cover, 1.94 km from Indonesia - Banda Islands: Lava Flow (Gunung Api)
- Reef Check — Lava Flow (2017): 70% hard coral cover, 1.94 km from Indonesia - Banda Islands: Lava Flow (Gunung Api)
- Reef Check — Lava Flow (2018): 68% hard coral cover, 1.94 km from Indonesia - Banda Islands: Lava Flow (Gunung Api)
- Reef Check — Lava Flow (2019): 74% hard coral cover, 1.94 km from Indonesia - Banda Islands: Lava Flow (Gunung Api)
- Reef Check — Lava Flow (2024): 93% hard coral cover, 1.15 km from Indonesia - Banda Islands: Lighthouse
- Reef Check — Lava Flow (2025): 88% hard coral cover, 1.15 km from Indonesia - Banda Islands: Lighthouse
- Reef Check — Pantai Wali (2017): 47% hard coral cover, 2.46 km from Indonesia - Banda Islands: Batu Kapal
- Reef Check — Pisang East (2016): 45% hard coral cover, 1.94 km from Indonesia - Banda Islands: Batu Kapal
- Reef Check — Pisang East (2016): 48% hard coral cover, 1.94 km from Indonesia - Banda Islands: Batu Kapal
- Reef Check — Pisang East (2017): 37% hard coral cover, 2.05 km from Indonesia - Banda Islands: Batu Kapal
- Reef Check — Pisang East (2019): 50% hard coral cover, 1.94 km from Indonesia - Banda Islands: Batu Kapal
- Reef Check — Pisang East (2022): 56% hard coral cover, 1.94 km from Indonesia - Banda Islands: Batu Kapal
- Reef Check — Pohon Miring (2015): 73% hard coral cover, 3.10 km from Indonesia - Banda Islands: Batu Kapal
- Reef Check — Pohon Miring (2016): 61% hard coral cover, 3.15 km from Indonesia - Banda Islands: Batu Kapal
- Reef Check — Pohon Miring (2017): 46% hard coral cover, 3.15 km from Indonesia - Banda Islands: Batu Kapal
- Reef Check — Pohon Miring (2018): 51% hard coral cover, 3.15 km from Indonesia - Banda Islands: Batu Kapal
- Reef Check — Pohon Miring (2019): 55% hard coral cover, 3.10 km from Indonesia - Banda Islands: Batu Kapal
- Reef Check — Pohon Miring (2020): 55% hard coral cover, 3.10 km from Indonesia - Banda Islands: Batu Kapal
- Reef Check — Pohon Miring (2022): 52% hard coral cover, 3.10 km from Indonesia - Banda Islands: Batu Kapal
- Reef Check — Pohon Miring (2023): 58% hard coral cover, 3.10 km from Indonesia - Banda Islands: Batu Kapal
- Reef Check — Pohon Miring (2025): 66% hard coral cover, 3.10 km from Indonesia - Banda Islands: Batu Kapal
- Reef Check — Pohon Tiga (2025): 50% hard coral cover, 1.50 km from Indonesia - Banda Islands: Goat Hall (Pulau Ai)
- Reef Check — Pulau Ay, Lubang Kambing (2015): 23% hard coral cover, 1.27 km from Indonesia - Banda Islands: Shark Point (Pulau Ai)
- Reef Check — Pulau Ay, Lubang Kambing (2016): 36% hard coral cover, 1.27 km from Indonesia - Banda Islands: Shark Point (Pulau Ai)
- Reef Check — Pulau Ay, Lubang Kambing (2019): 40% hard coral cover, 1.27 km from Indonesia - Banda Islands: Shark Point (Pulau Ai)
- Reef Check — Pulau Ay, Lubang Kambing (2019): 35% hard coral cover, 1.27 km from Indonesia - Banda Islands: Shark Point (Pulau Ai)
- Reef Check — Pulau Ay, Lubang Kambing (2024): 47% hard coral cover, 1.27 km from Indonesia - Banda Islands: Shark Point (Pulau Ai)
- Reef Check — Pulau Ay, Lubang Kambing (2025): 51% hard coral cover, 1.27 km from Indonesia - Banda Islands: Shark Point (Pulau Ai)
- Reef Check — Pulau Pisang West (2015): 54% hard coral cover, 1.59 km from Indonesia - Banda Islands: Batu Kapal
- Reef Check — Pulau Pisang West (2016): 55% hard coral cover, 1.59 km from Indonesia - Banda Islands: Batu Kapal
- Reef Check — Pulau Pisang West (2018): 56% hard coral cover, 1.59 km from Indonesia - Banda Islands: Batu Kapal
- Reef Check — Pulau Pisang West (2019): 65% hard coral cover, 1.59 km from Indonesia - Banda Islands: Batu Kapal
- Reef Check — Pulau Pisang West (2019): 58% hard coral cover, 1.59 km from Indonesia - Banda Islands: Batu Kapal
- Reef Check — Rata Eyo (2018): 38% hard coral cover, 3.49 km from Indonesia - Banda Islands: Batu Kapal
- Reef Check — Rata Eyo (2019): 33% hard coral cover, 3.49 km from Indonesia - Banda Islands: Batu Kapal
- Reef Check — Tanah Rata (2015): 38% hard coral cover, 0.96 km from Indonesia - Banda Islands: Lighthouse
- Reef Check — Tanjung Nama (2019): 51% hard coral cover, 4.82 km from Indonesia - Banda Islands: Lava Flow (Gunung Api)
- Reef Check — Tanjung Nama (2025): 44% hard coral cover, 4.82 km from Indonesia - Banda Islands: Lava Flow (Gunung Api)
- WCS Indonesia via MERMAID — Guraici (2024): 34% hard coral cover, 1.11 km from Indonesia - Halmahera: Lelay Utara (north)
- WCS Indonesia via MERMAID — Inti Gafi (2024): 50% hard coral cover, 3.69 km from Indonesia - Halmahera: Siko Pinnacle
- WCS Indonesia via MERMAID — Inti Siko (2024): 25% hard coral cover, 0.00 km from Indonesia - Halmahera: Siko Pinnacle
- WCS Indonesia via MERMAID — Joronga (2024): 55% hard coral cover, 2.04 km from Indonesia - Halmahera: Lelay Utara (north)
- WCS Indonesia via MERMAID — Legoma (2024): 19% hard coral cover, 0.00 km from Indonesia - Halmahera: Batu Mandi
- WCS Indonesia via MERMAID — Lelei (2024): 18% hard coral cover, 0.00 km from Indonesia - Halmahera: Lelay Utara (north)
- WCS Indonesia via MERMAID — Pulau Kelo (2024): 45% hard coral cover, 0.72 km from Indonesia - Halmahera: Batu Balong
- WCS Indonesia via MERMAID — Pulau Rajawali (2024): 51% hard coral cover, 2.75 km from Indonesia - Halmahera: Batu Balong
- WCS Indonesia via MERMAID — Shark Point (2024): 59% hard coral cover, 1.52 km from Indonesia - Halmahera: Lelay Utara (north)
- WCS Indonesia via MERMAID — Tanjung Lepa (2024): 33% hard coral cover, 2.51 km from Indonesia - Halmahera: Batu Balong
- WCS Indonesia via MERMAID — Tanjung Marikoko (2024): 19% hard coral cover, 4.80 km from Indonesia - Halmahera: Batu Balong
- WCS Indonesia via MERMAID — Temo Madofa (2024): 38% hard coral cover, 3.19 km from Indonesia - Halmahera: Batu Balong
- WCS Indonesia via MERMAID — Tomalou (2024): 47% hard coral cover, 3.19 km from Indonesia - Halmahera: Failonga
- WCS Indonesia via MERMAID — Tunguwai (2024): 45% hard coral cover, 1.46 km from Indonesia - Halmahera: Failonga
All images from Coral Reef Diagnostics. Data are from Coral Reef Diagnostics and Reef Check Foundation.
© Coral Reef Diagnostics.