

Indonesia - Banda Islands: Lava Flow (Gunung Api)

Part of the regional summaries: Indonesia - Banda and Indonesia - Maluku
More info
Maluku (NOAA CRW virtual station) · Banda Sea ecoregion mean=7.3°C-heating weeksLava Flow, under Gunung Api's 1988 lava flow, is the highest-cover site of the Banda group by these photographs - unbroken Acropora carpets, foliose plate gardens filling the old lava channel, and a genus-rich pavement with over 20 hard coral genera. Eleven frames show recent mortality (disarticulated staghorn rubble) and eighteen show colony-scale bleaching, not a reef-wide event; nearby surveys show this reef's cover swinging from over 60% to around 11% within a few years. A blind Claude computer-vision point count puts coral cover around 55%.
Lava Flow, di bawah aliran lava Gunung Api tahun 1988, adalah lokasi dengan tutupan tertinggi di gugusan Banda menurut foto-foto ini — hamparan Acropora yang tanpa putus, taman karang lembaran yang mengisi alur lava lama, dan hamparan yang kaya genus dengan lebih dari 20 genus karang keras.
Terjemahan ringkasan ini oleh AI; versi bahasa Inggris yang berlaku. Translated from the site’s shorter map summary.
Fourteen independent survey stations shown with the program’s logo — click one to see how far it is from this site.
Three other CRD dive sites within 5 km shown in orange — click a marker to open its page.
24 of these 50 photographs are shown beside the text that discusses them under "Site description" below.
Site description
Setting
Lava Flow sits under Gunung Api on the 1988 flow and was dived on 25 April 2018 from 12:40 to 13:45, 65 minutes to a maximum of 13.7 m and an average of 7.62 m at 29.44°C.
General benthic features
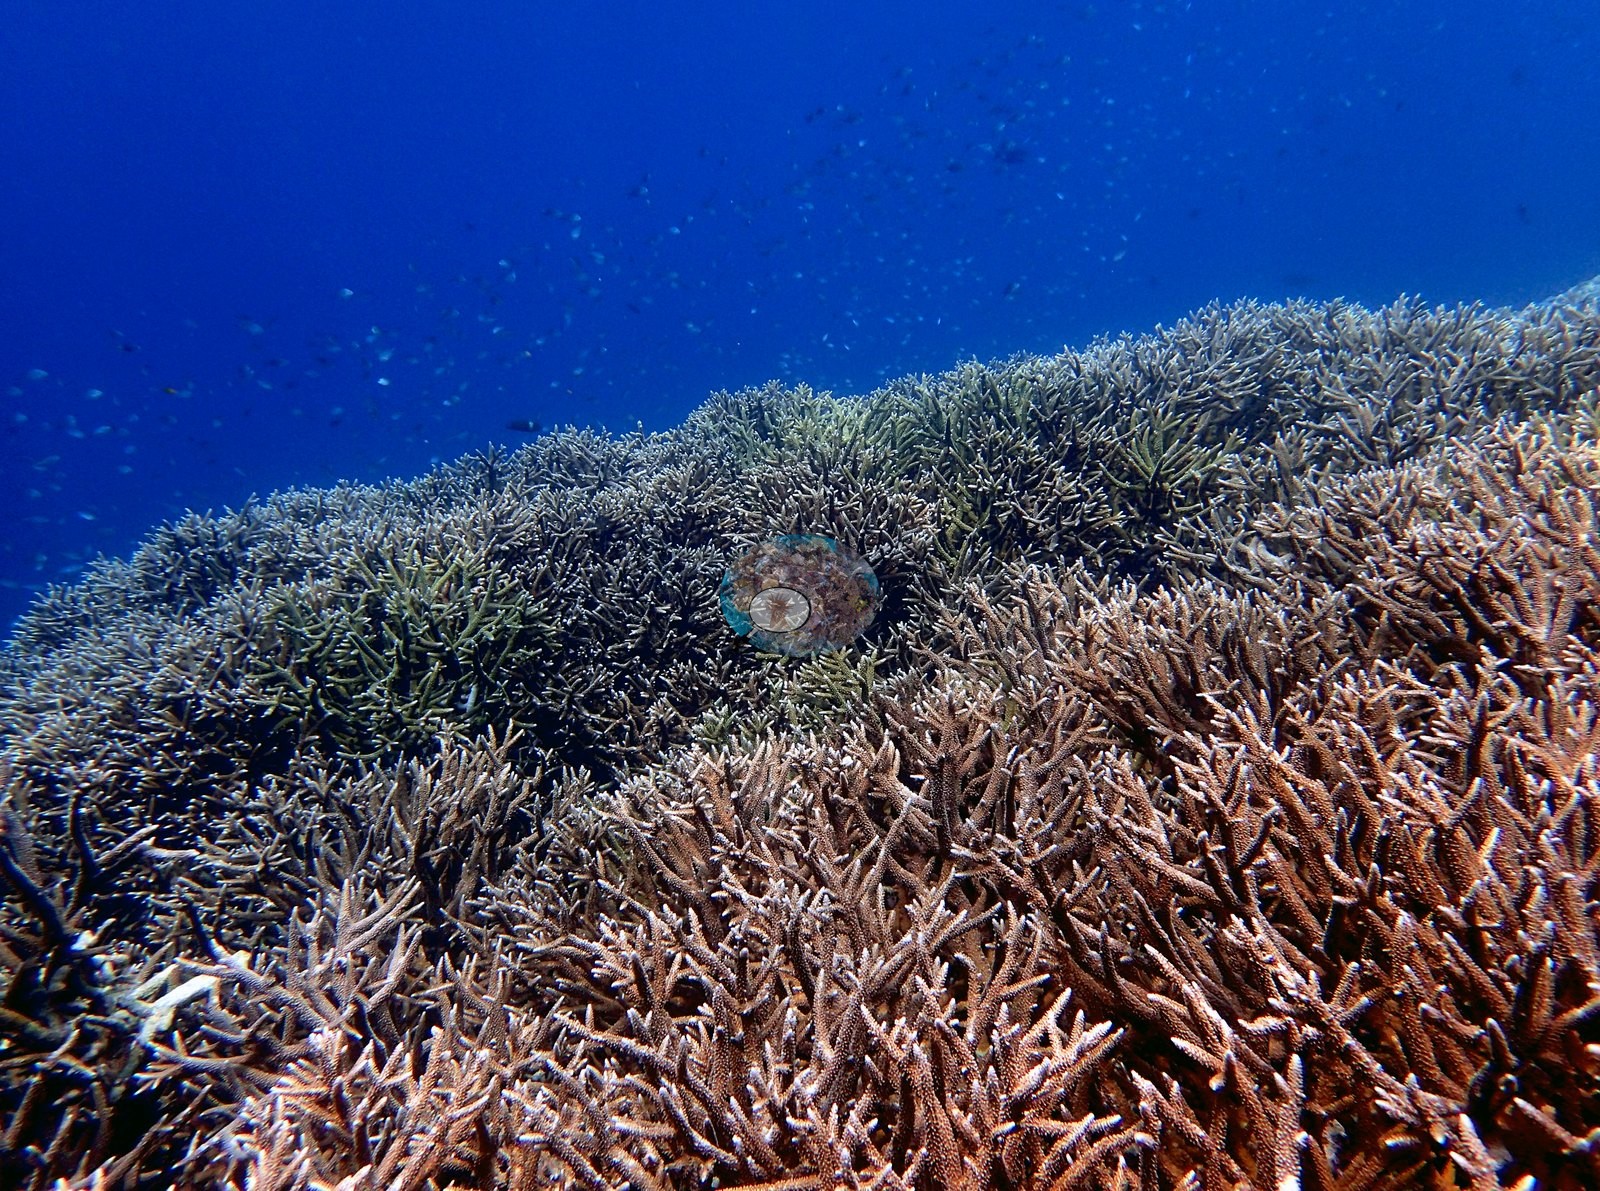
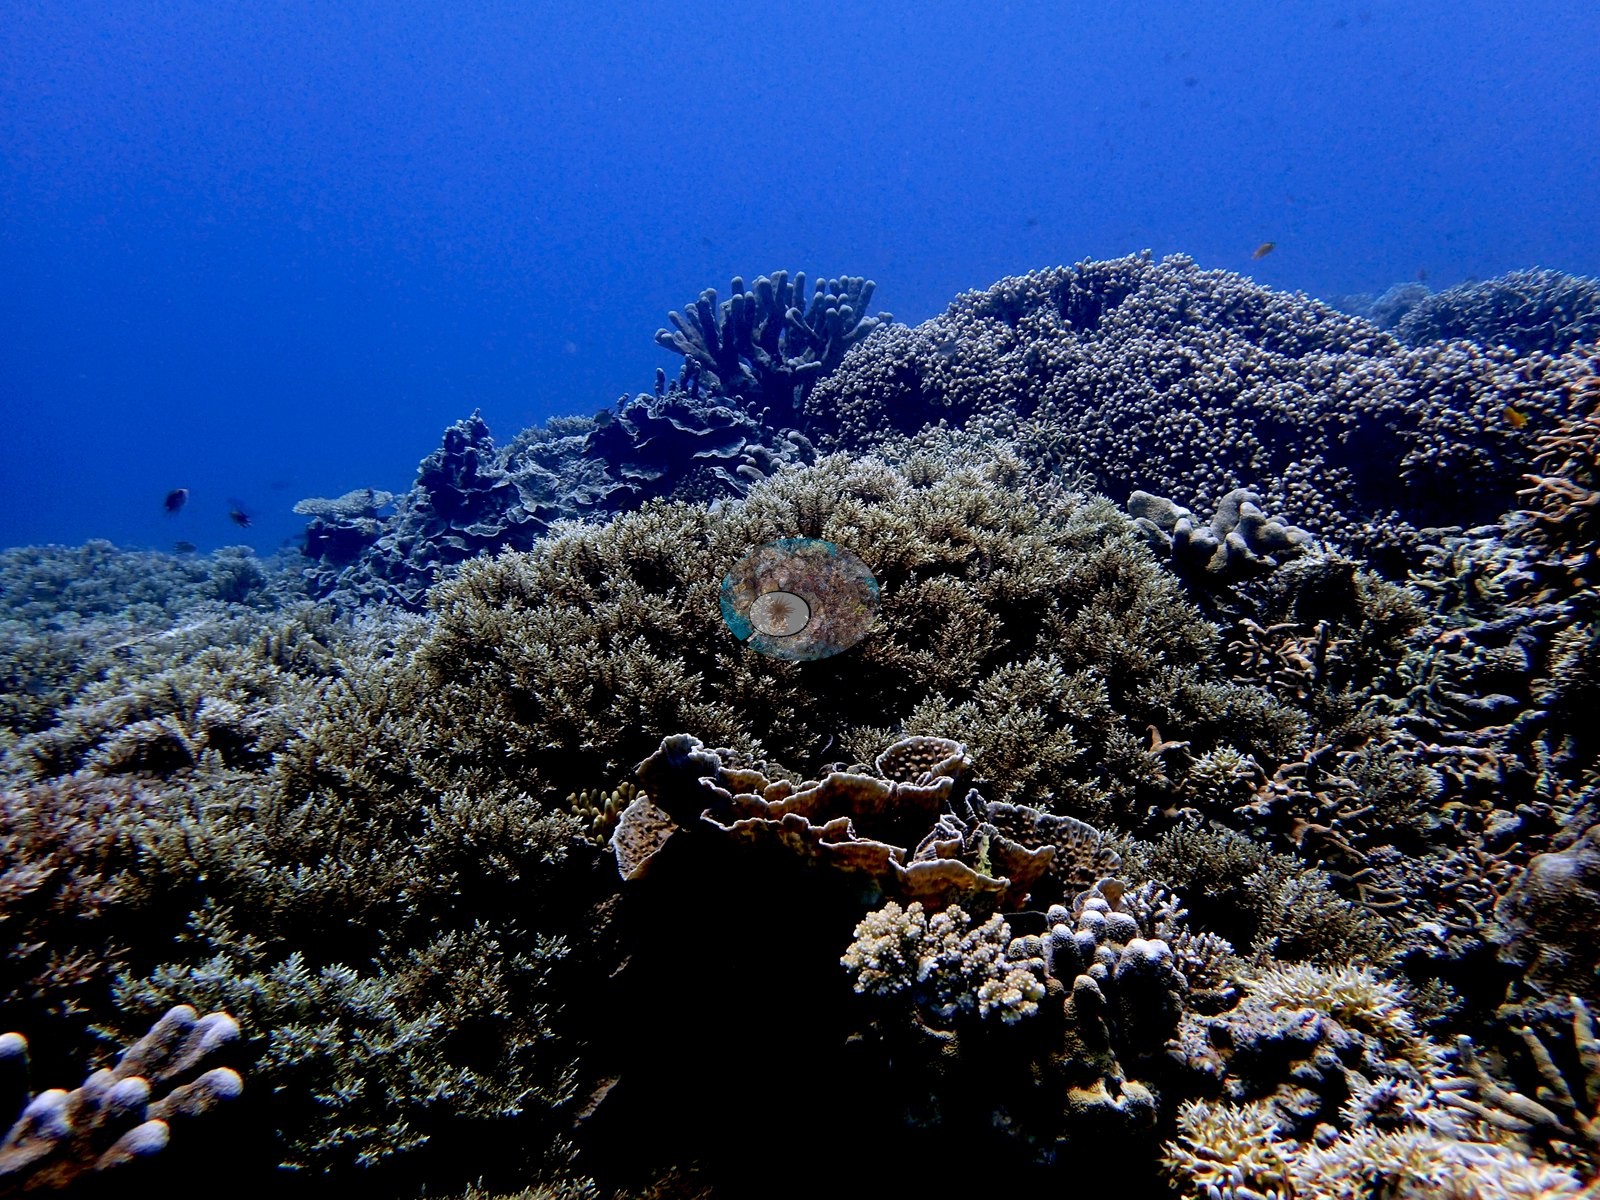
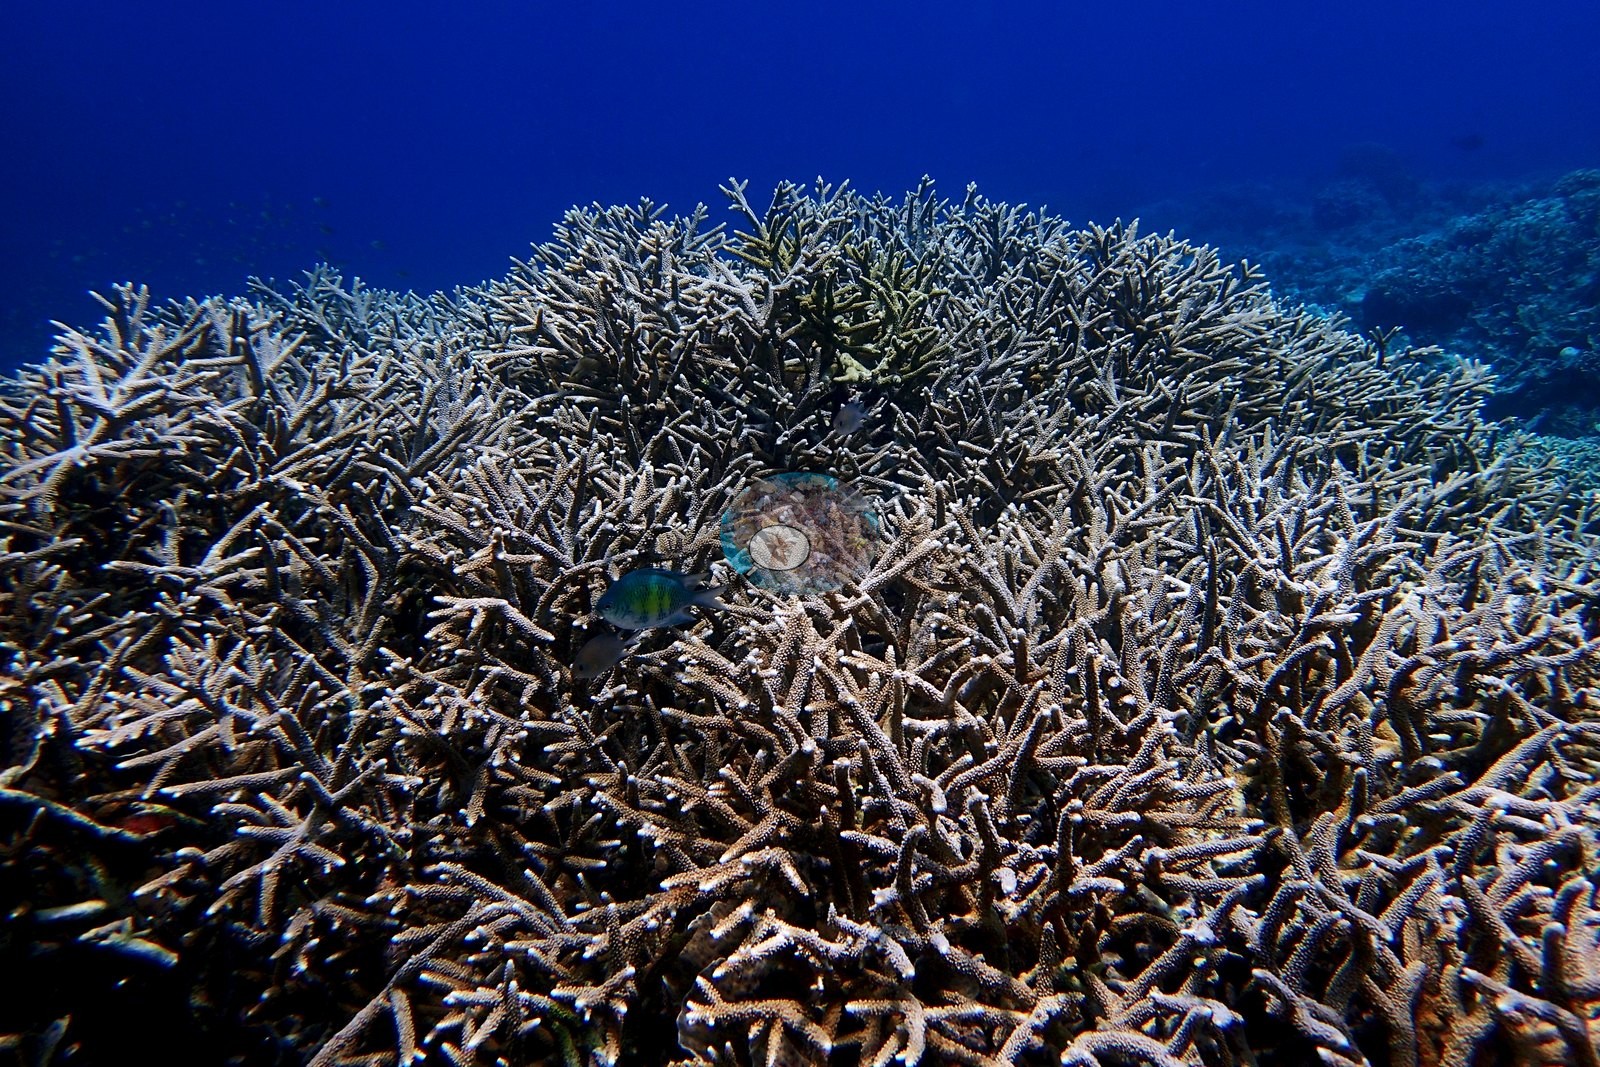
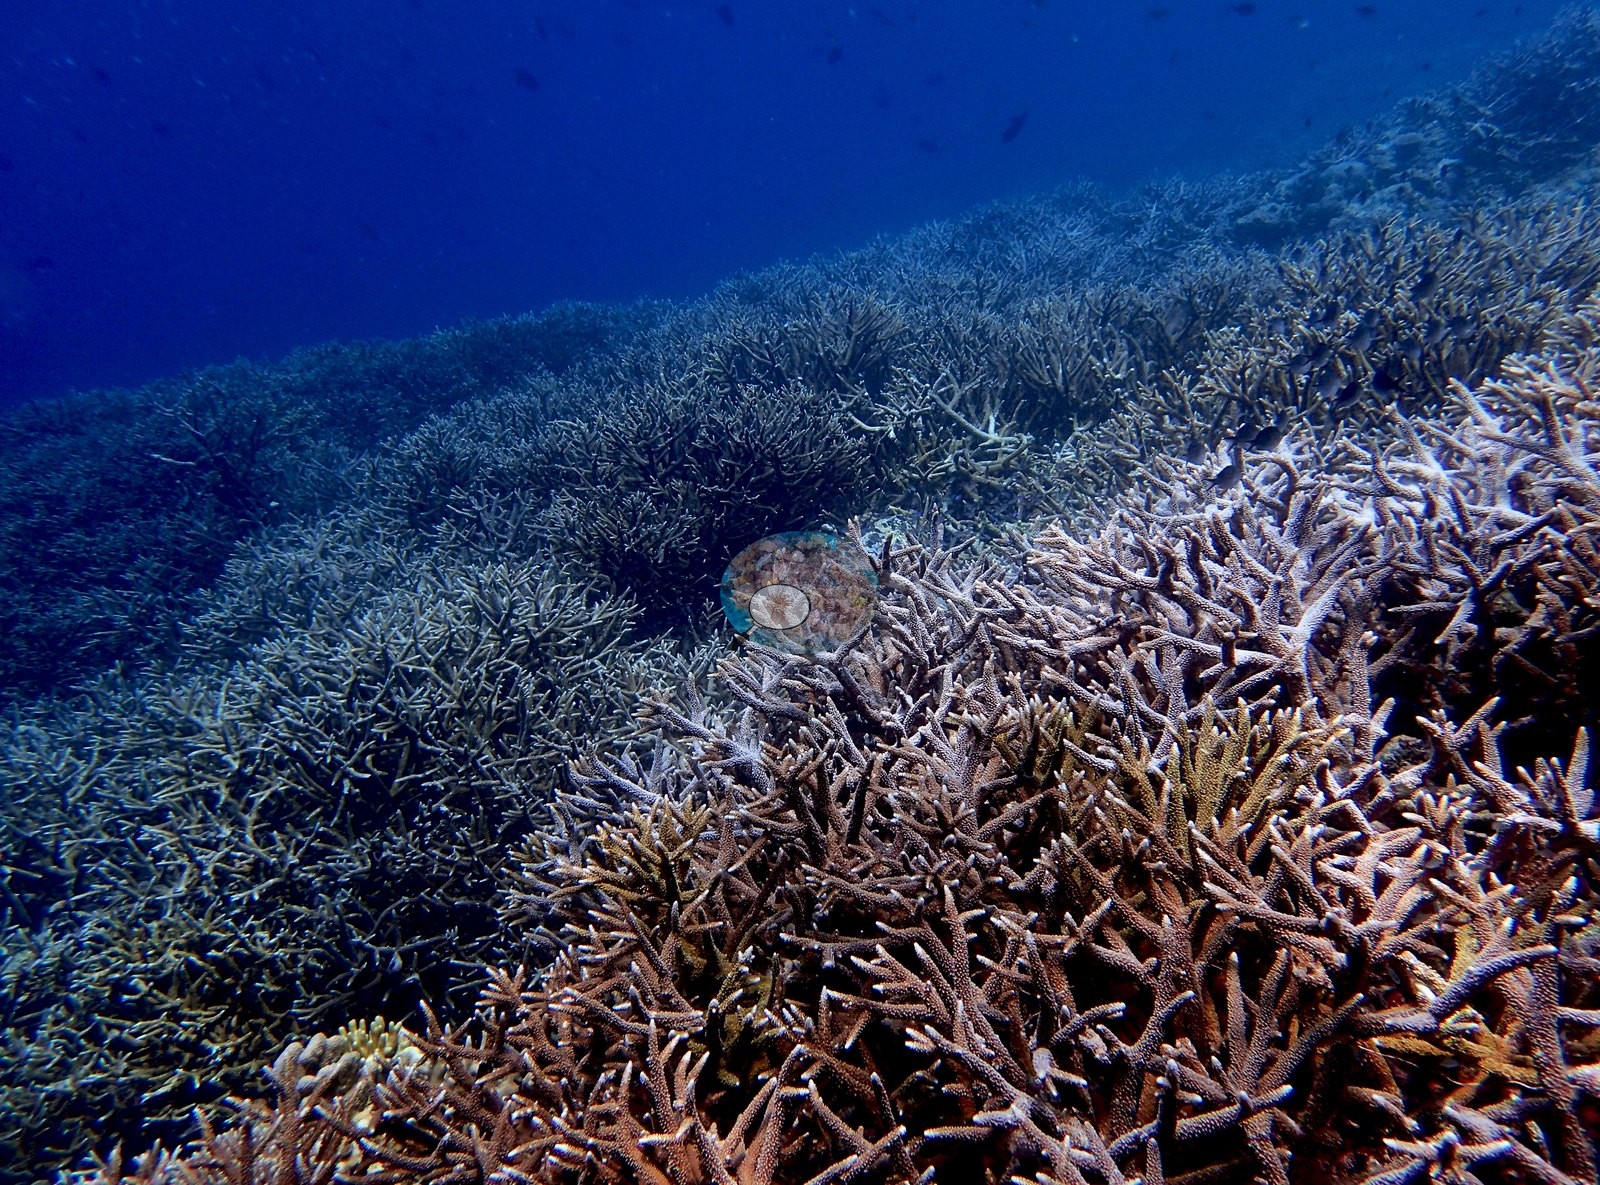
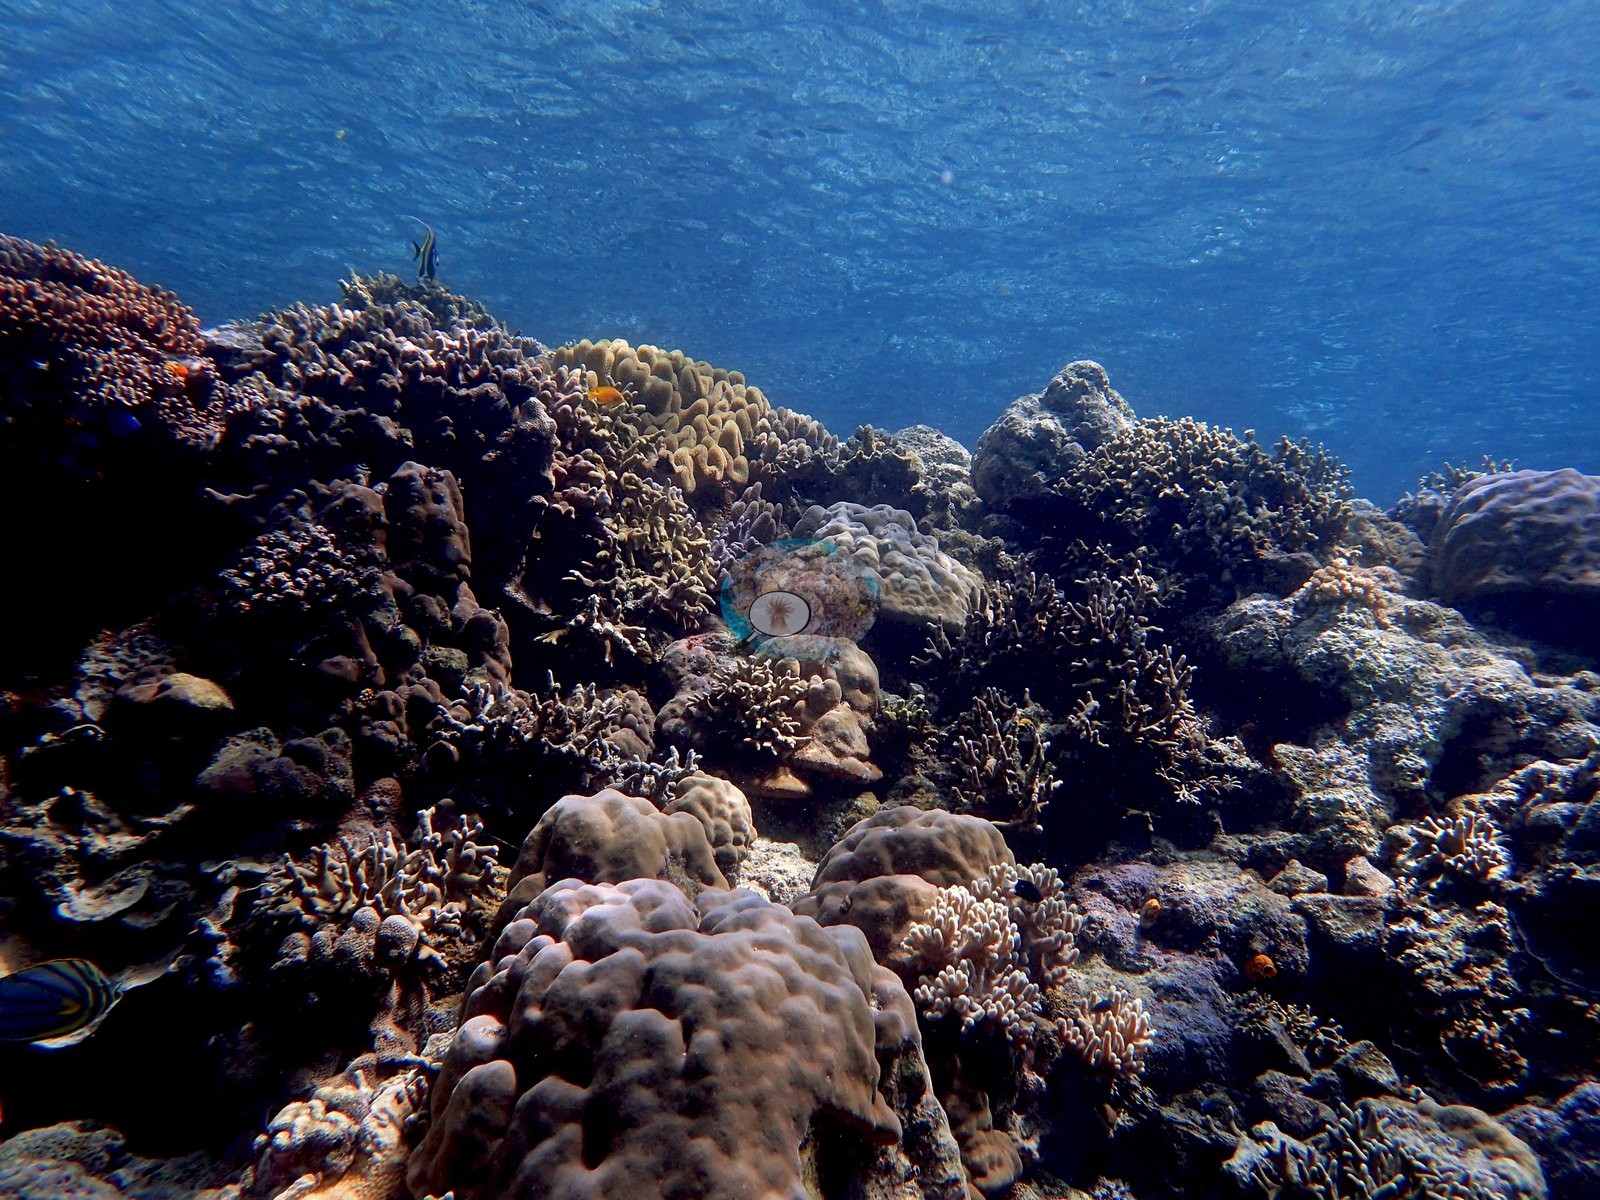
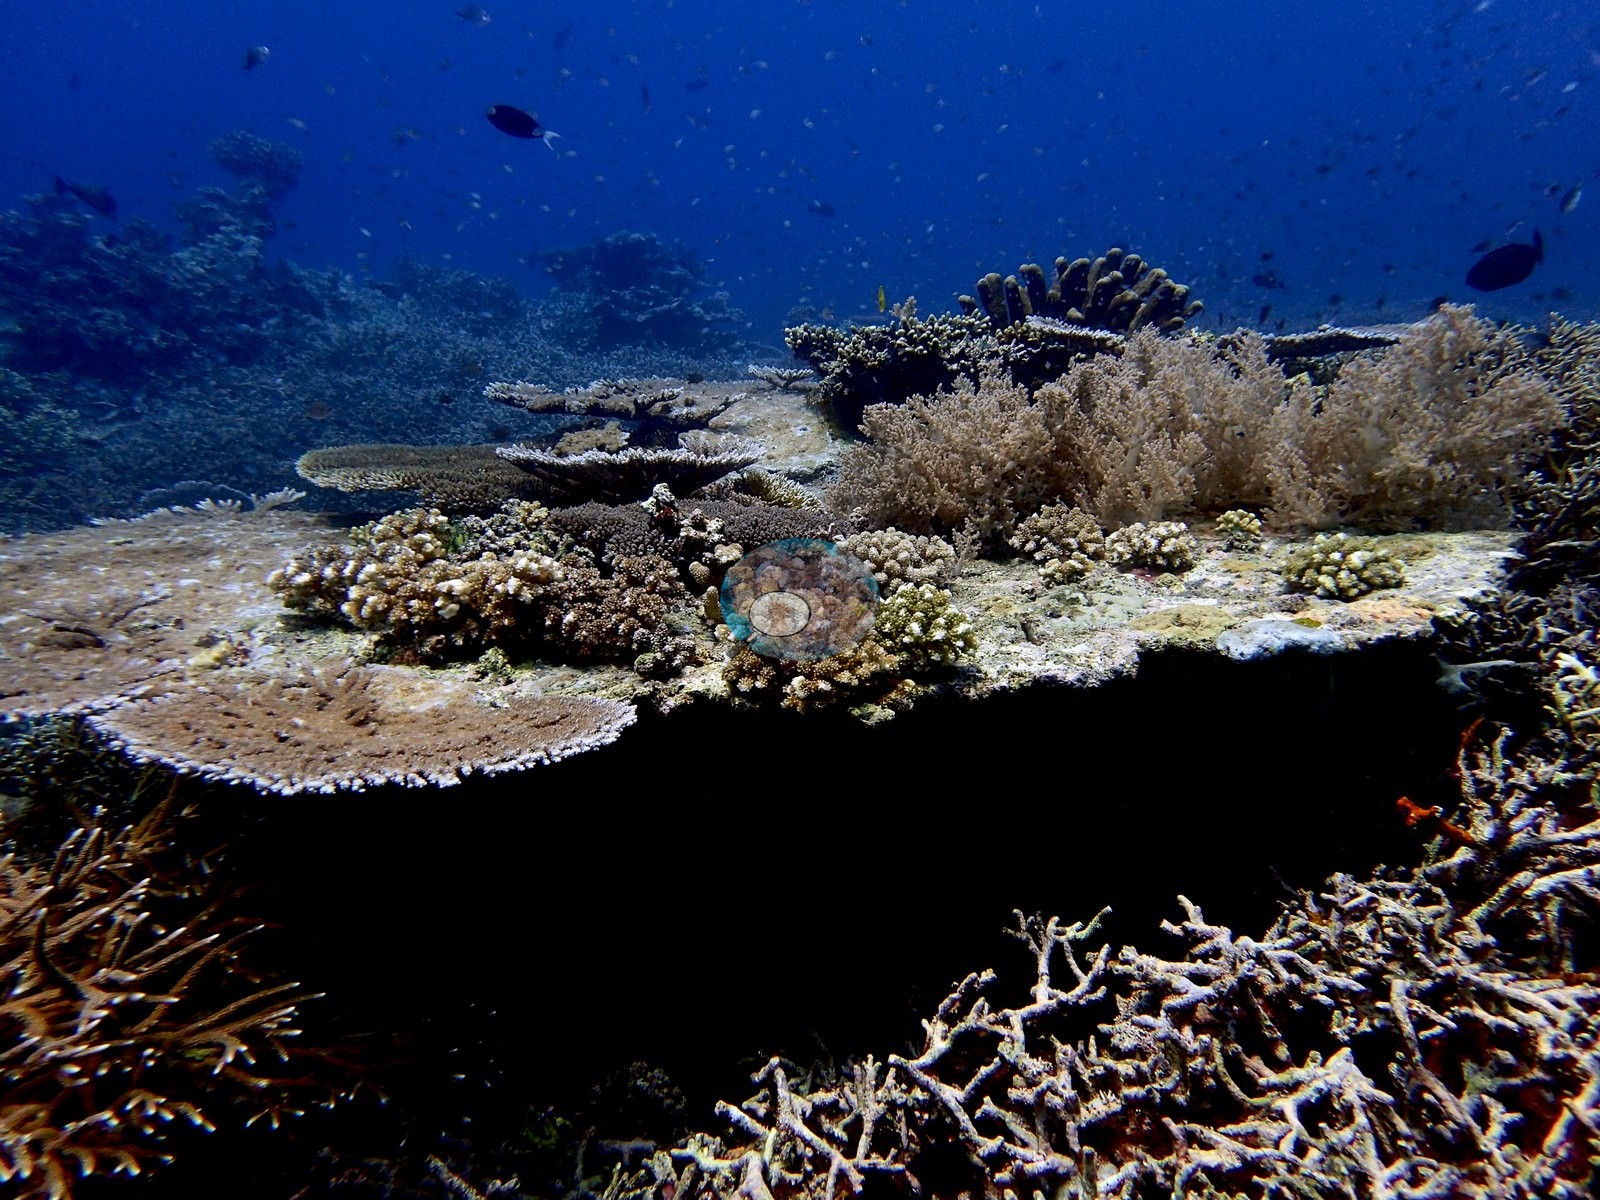
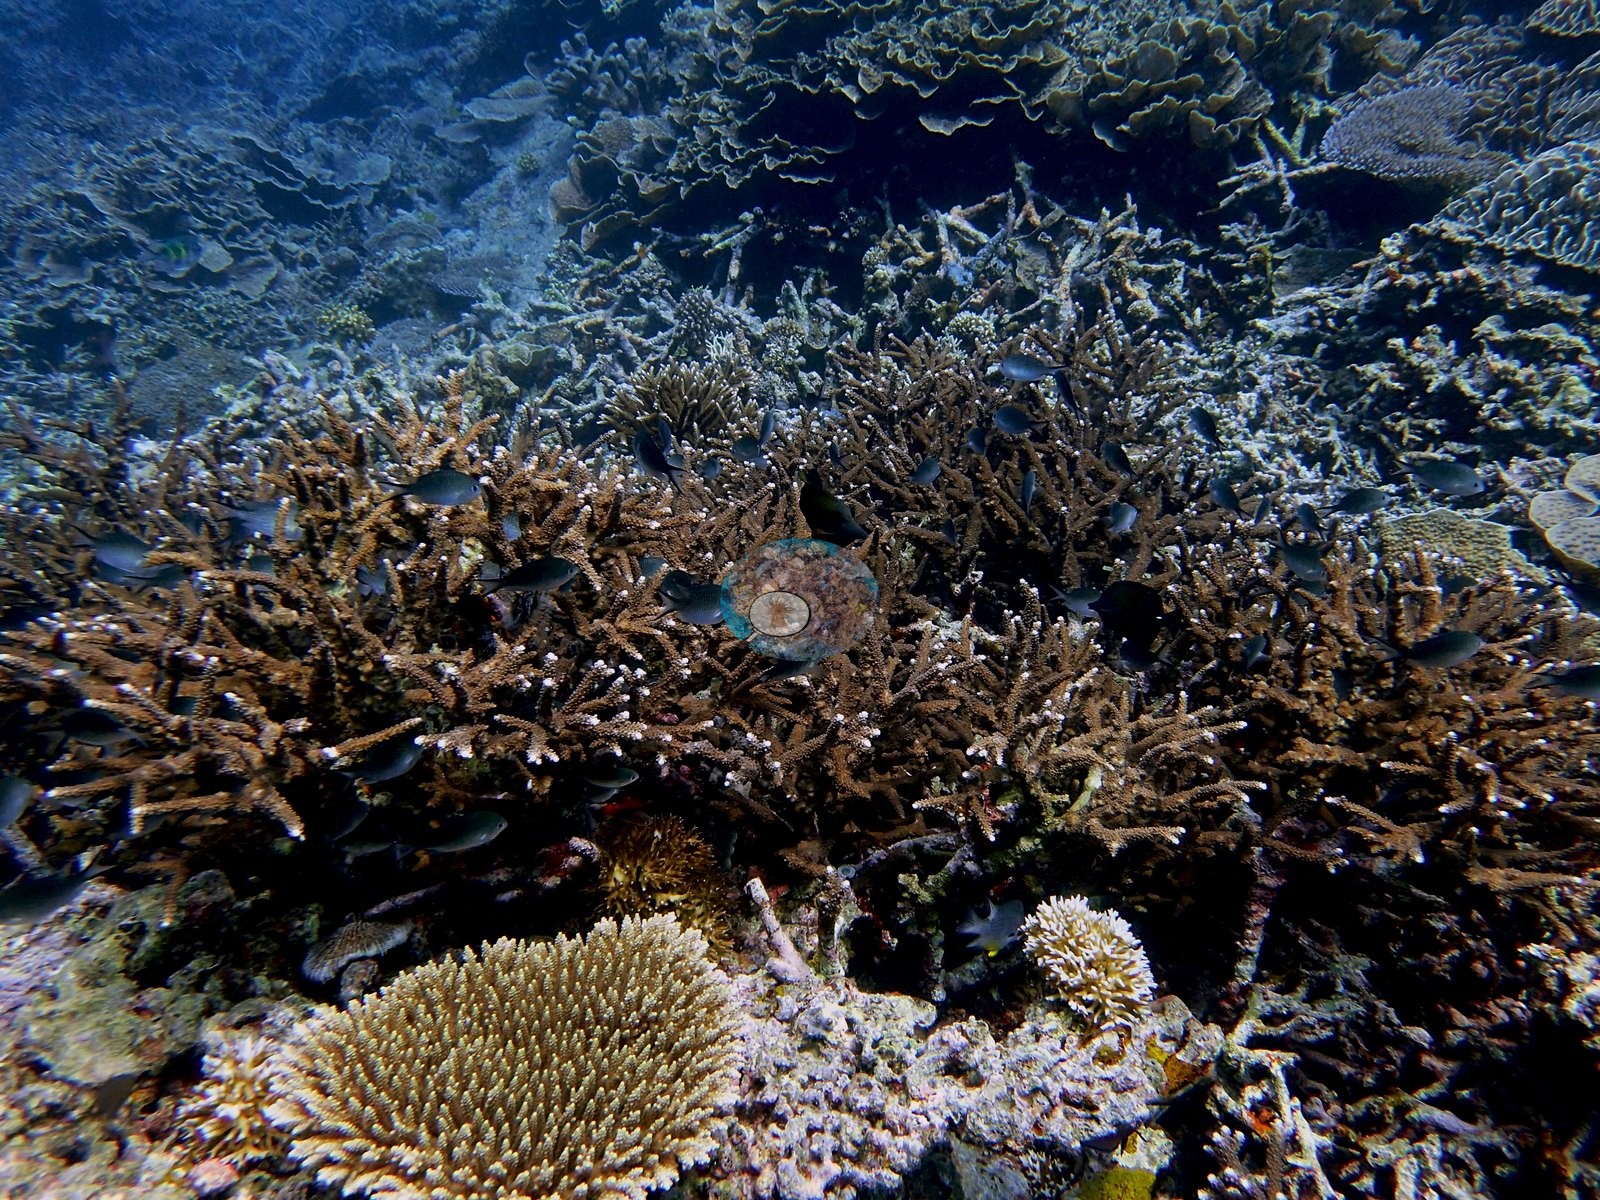
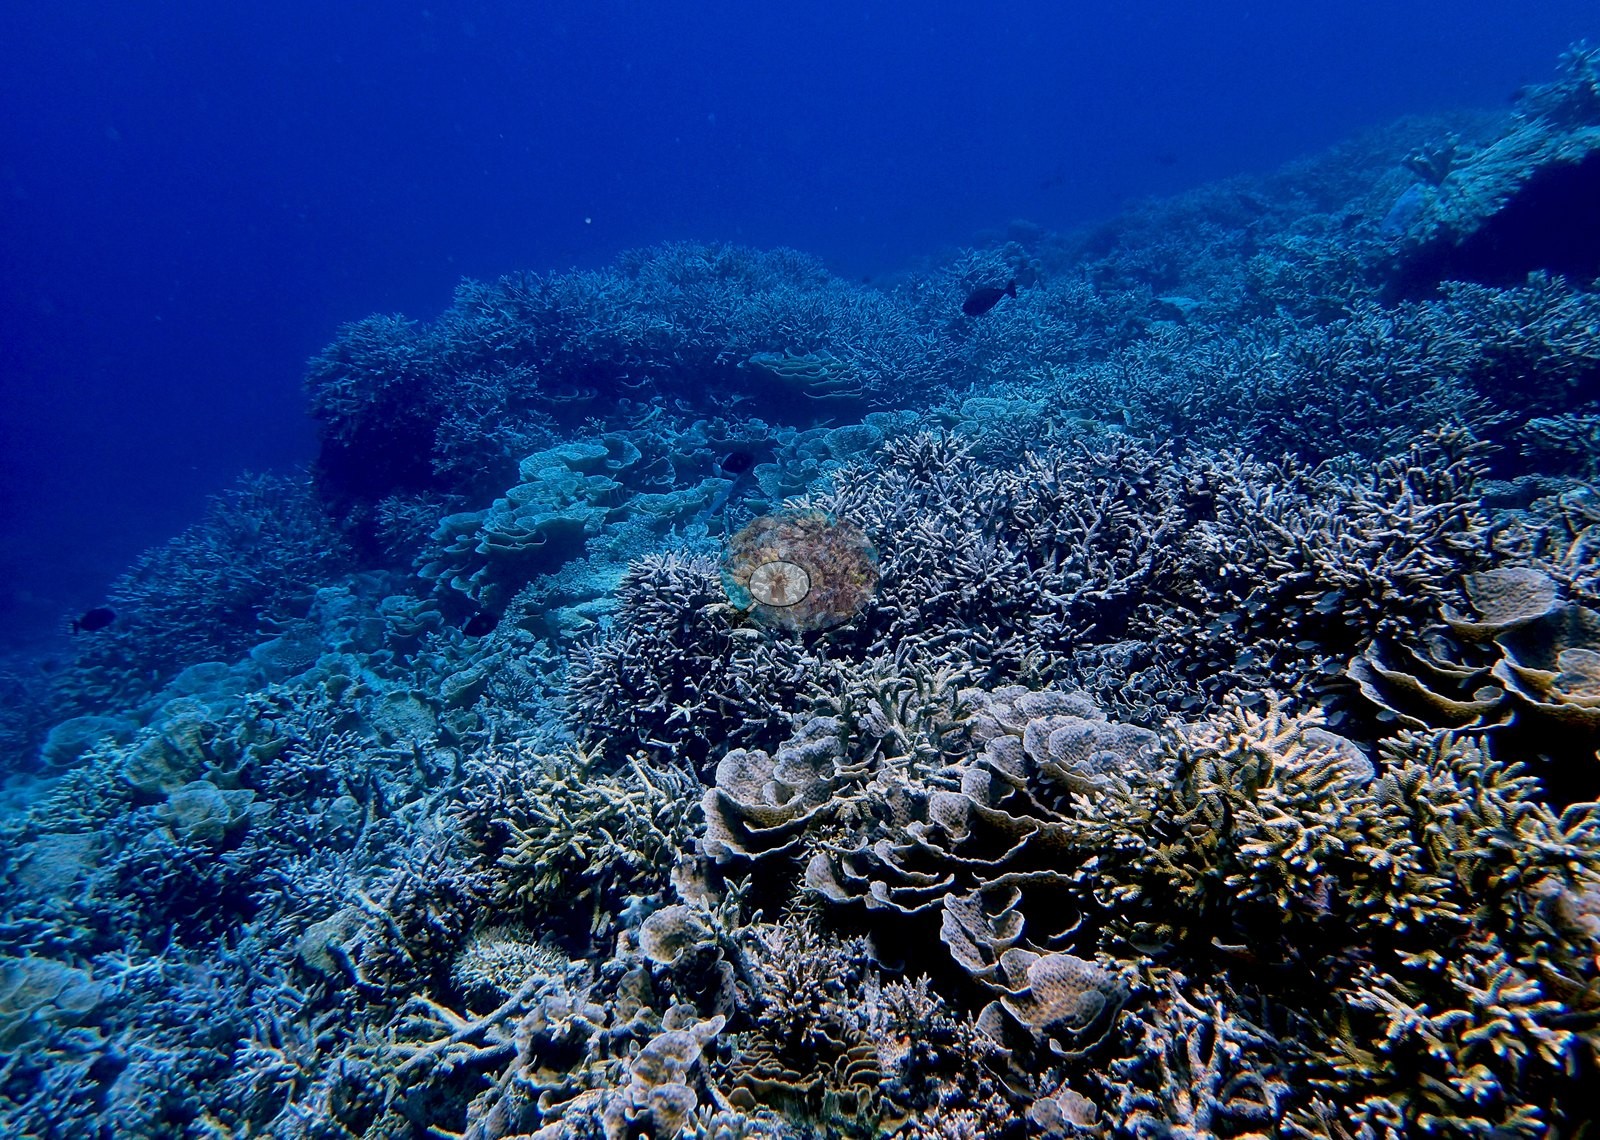
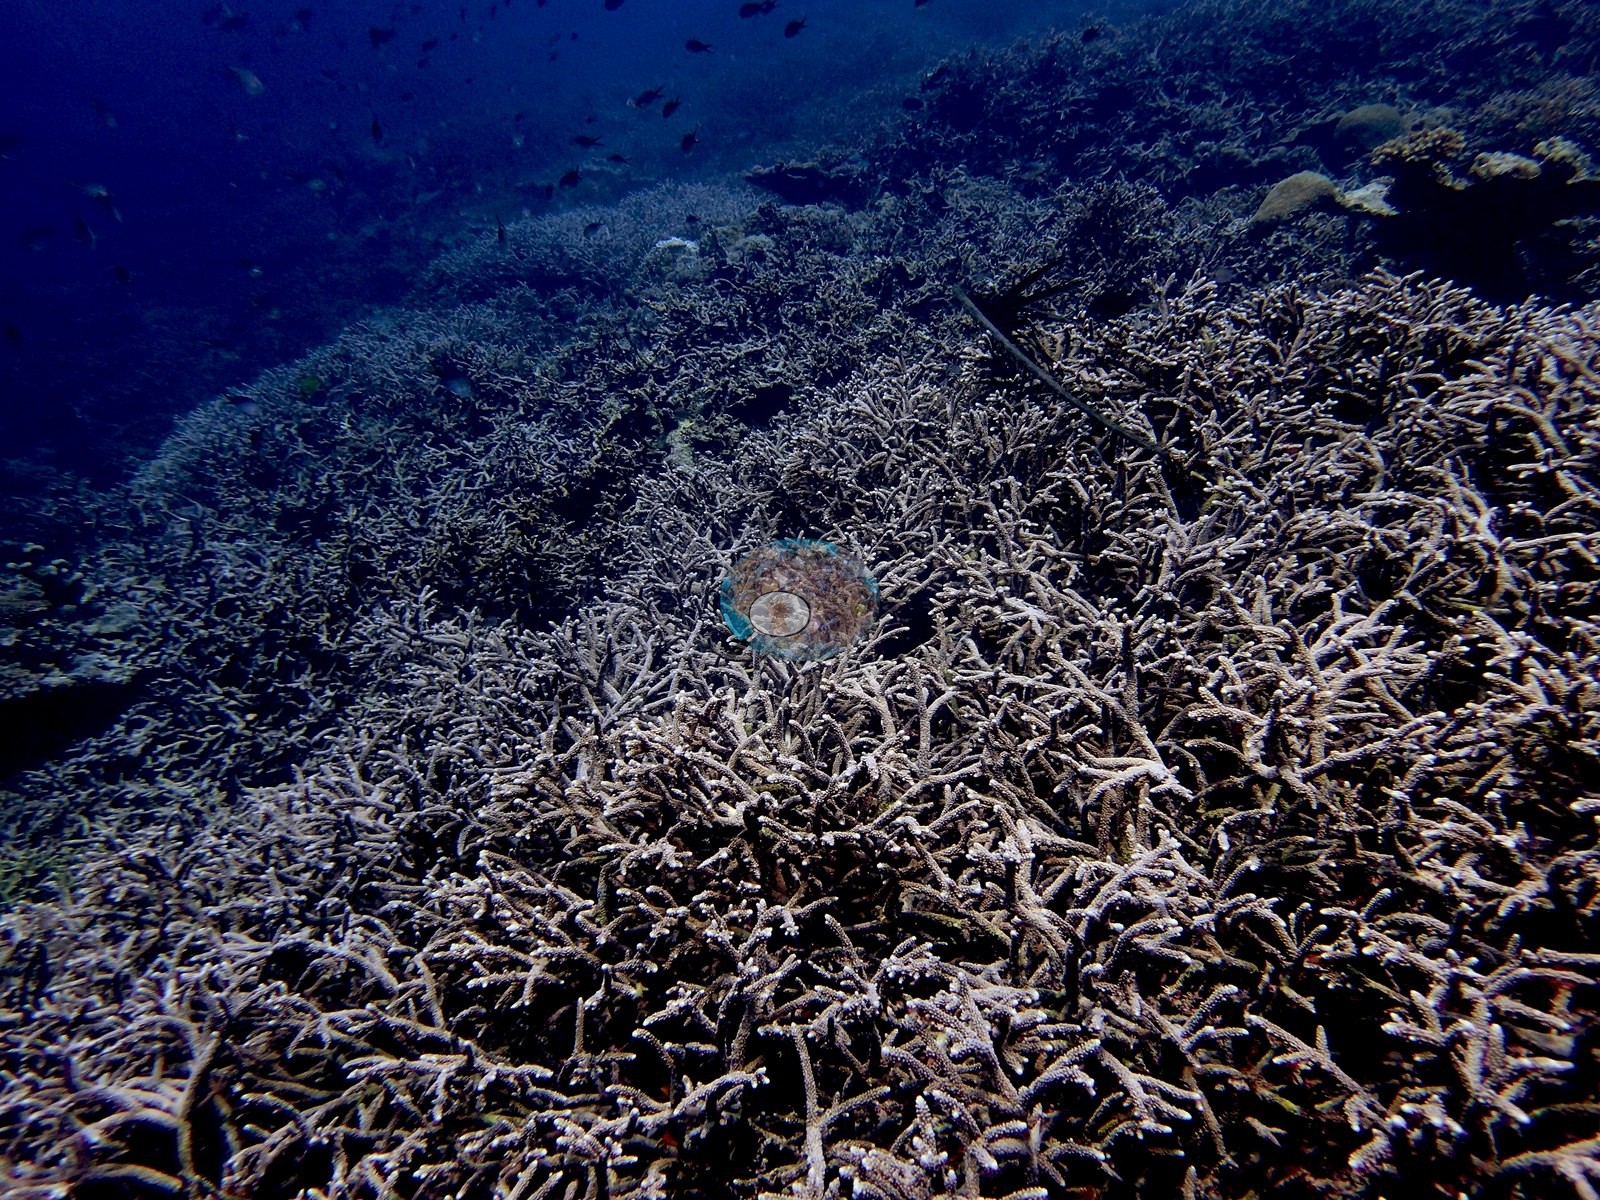
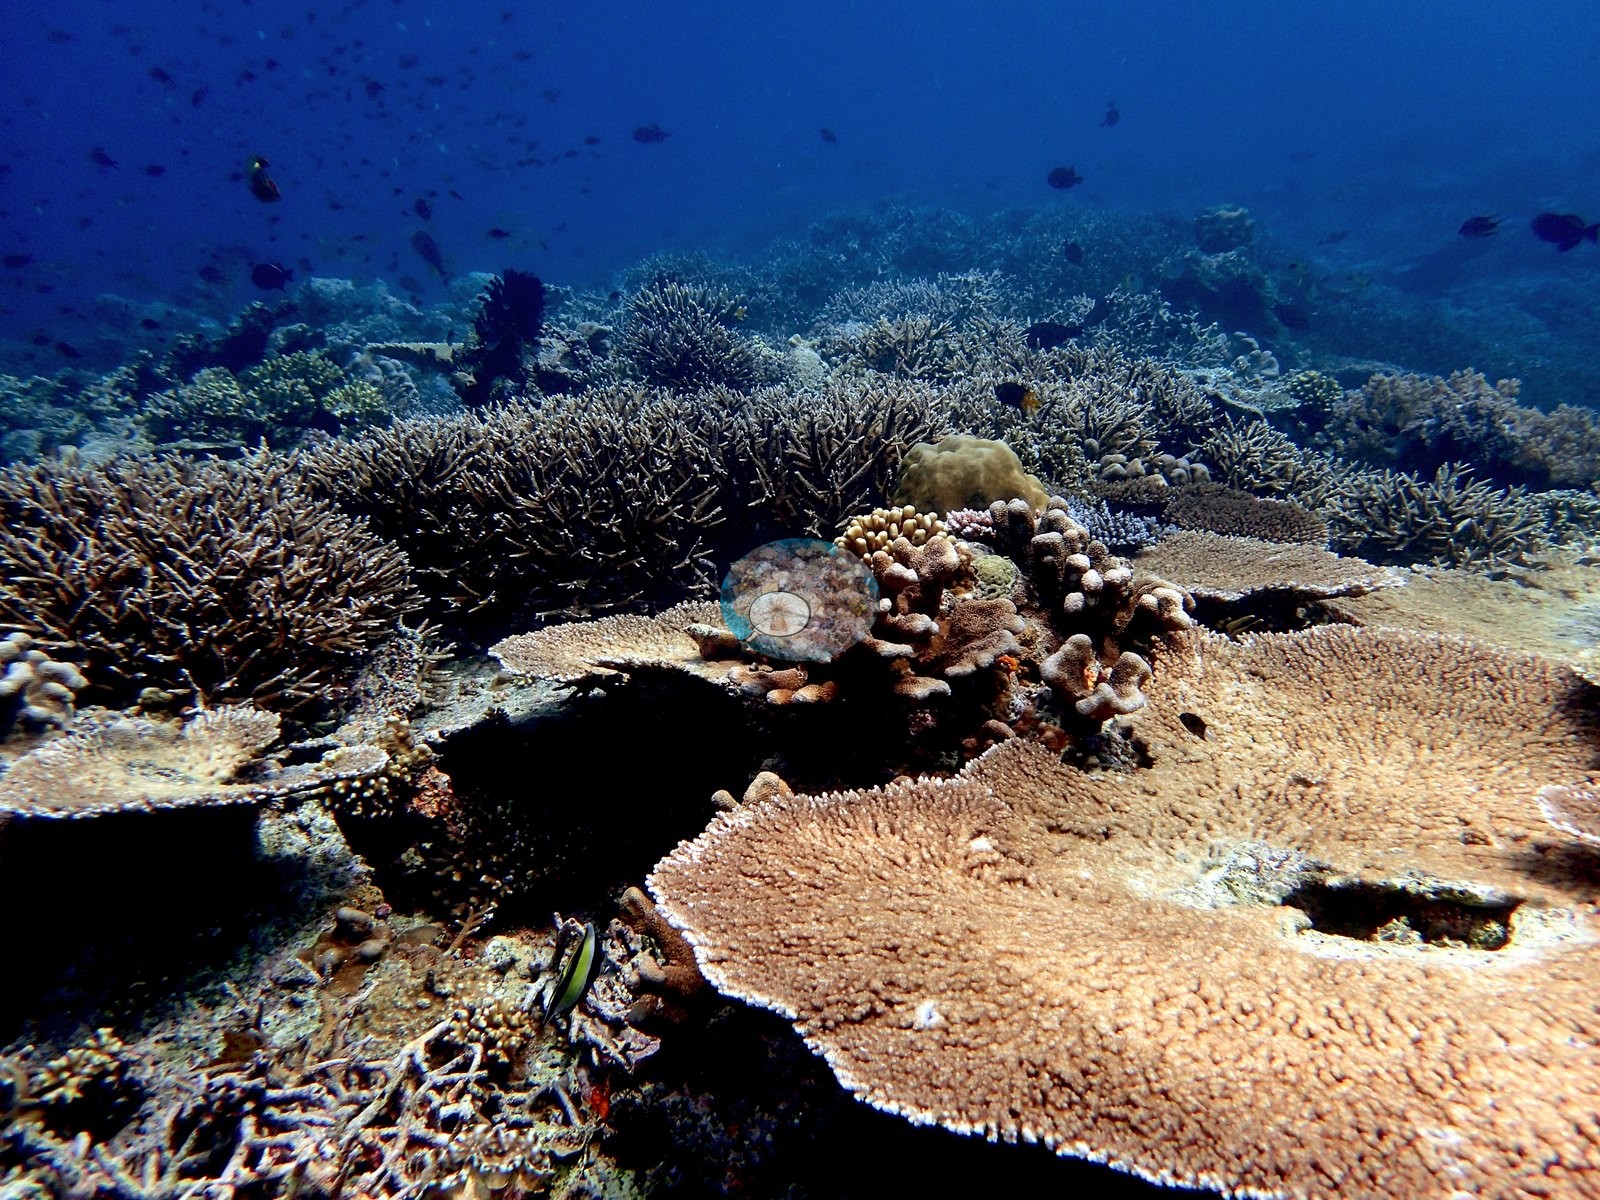
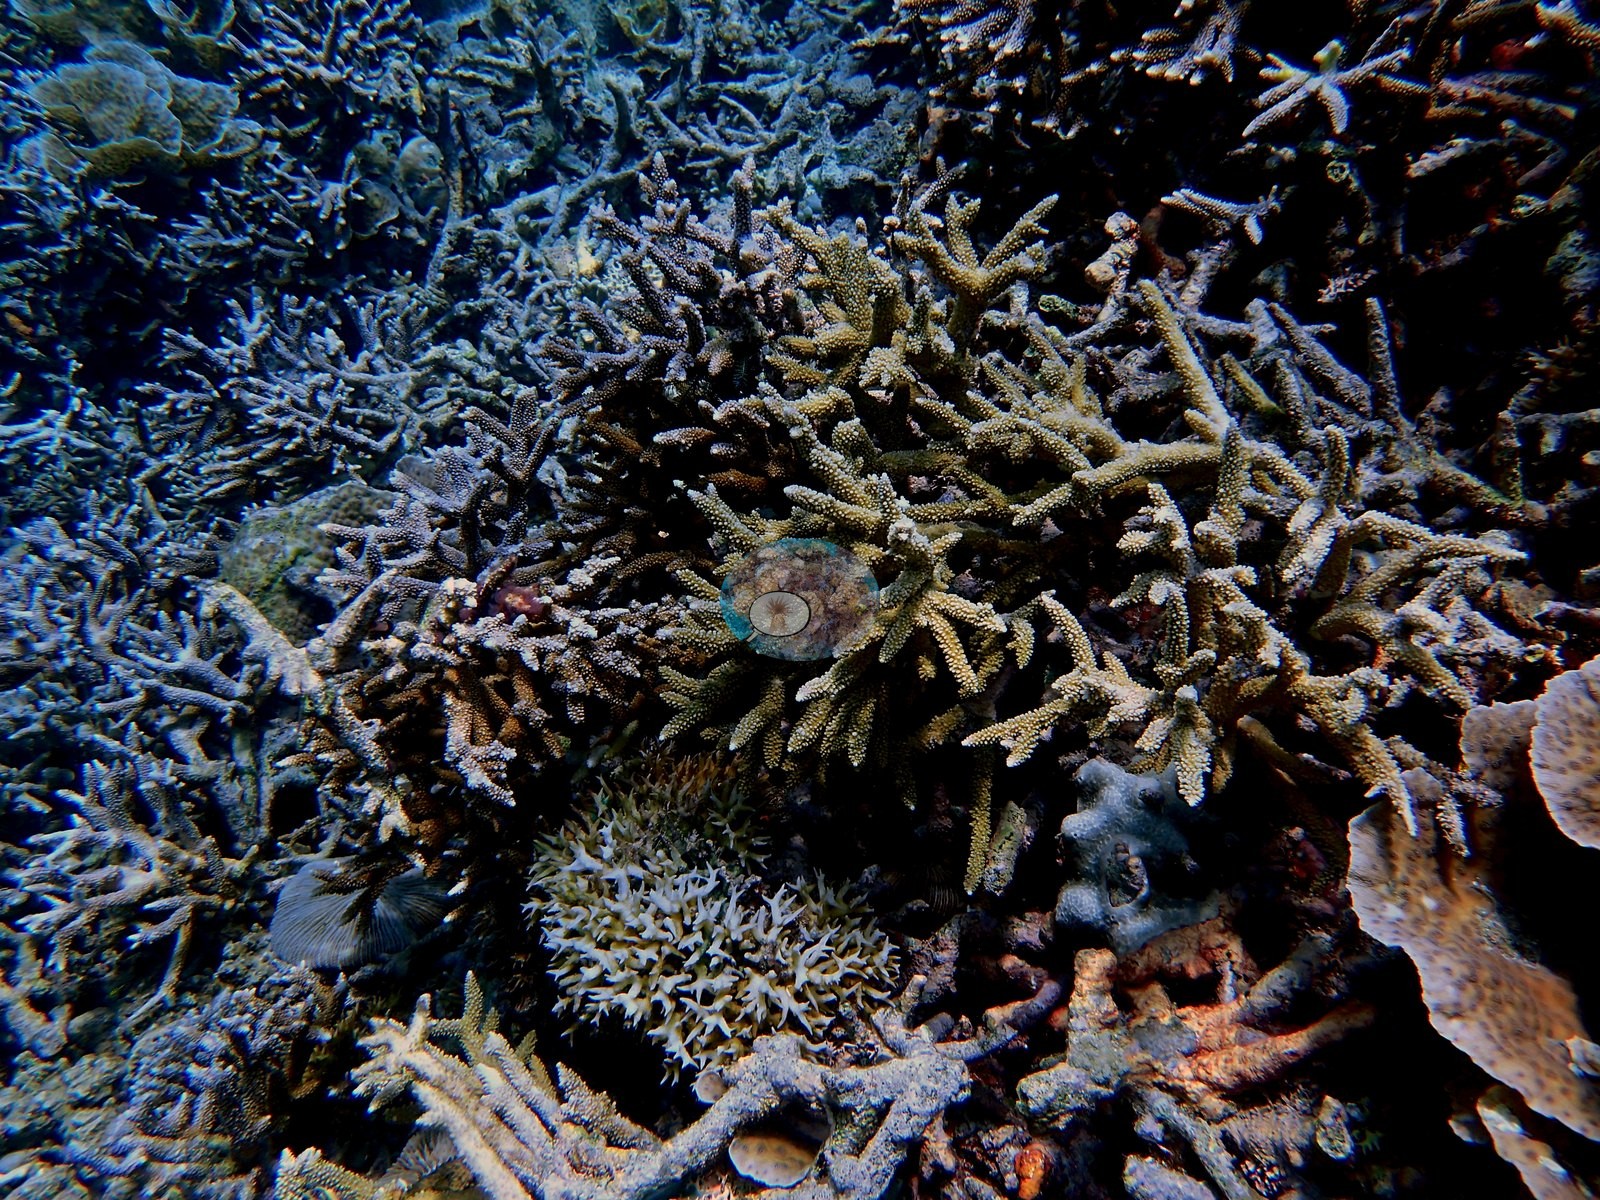
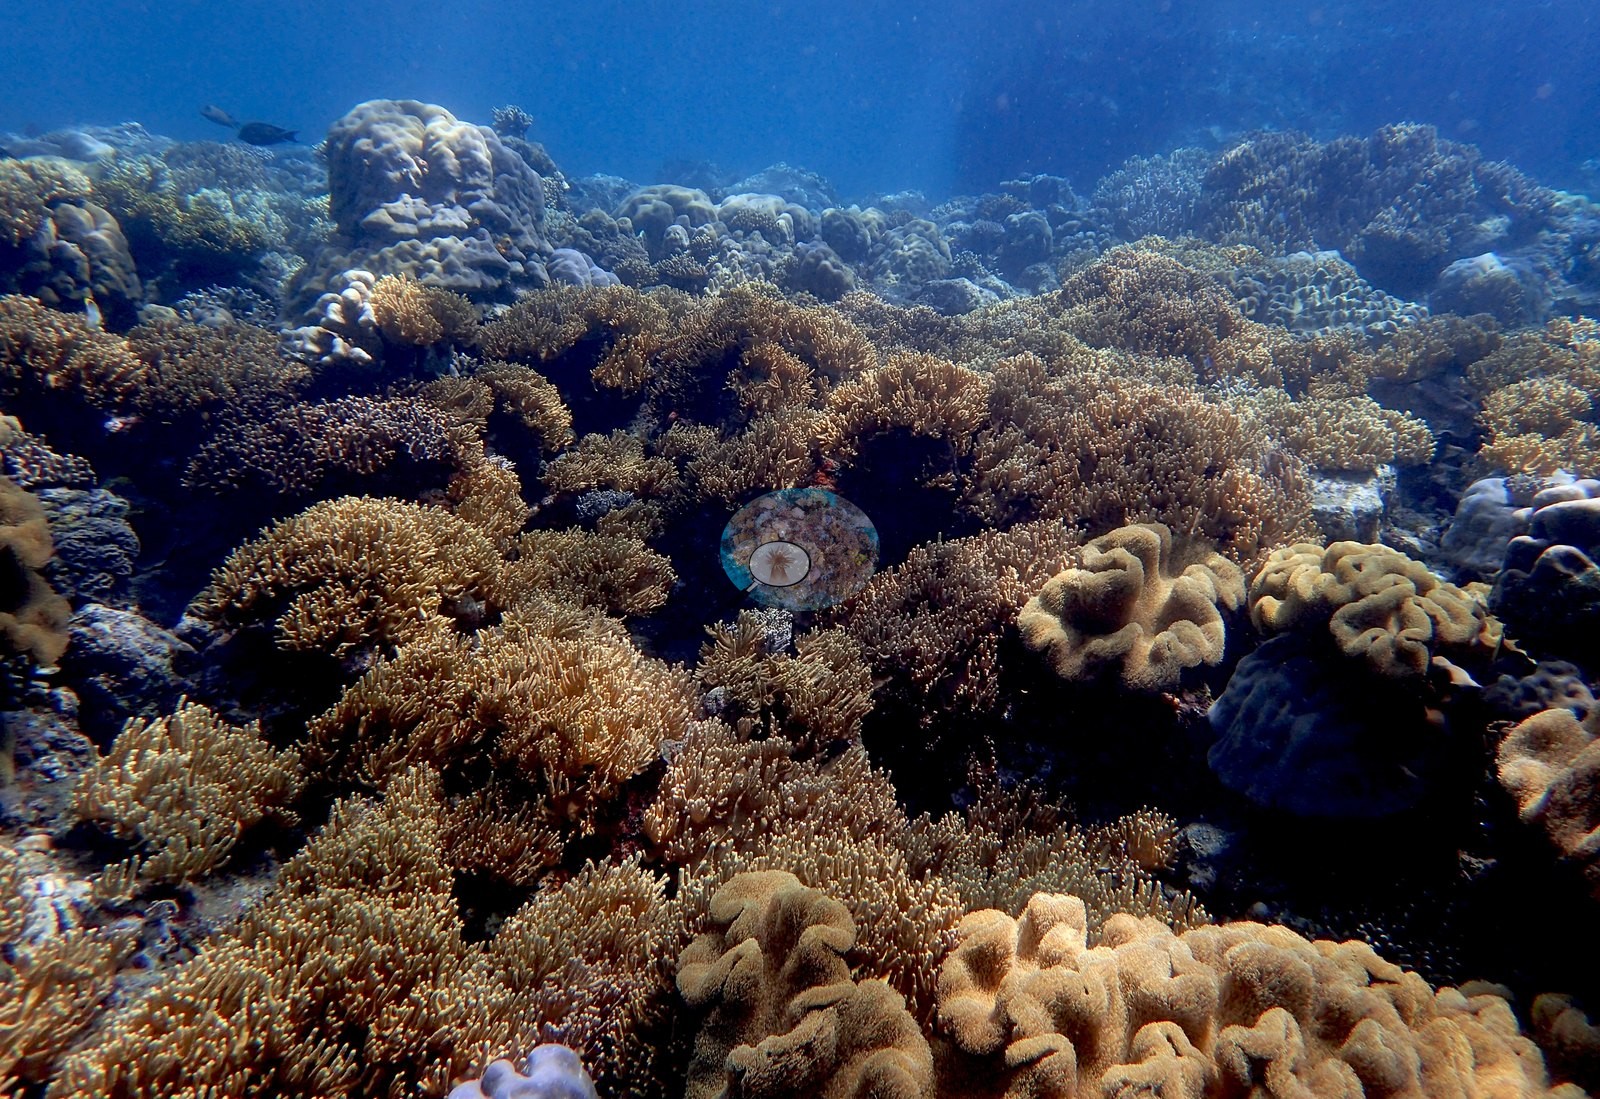
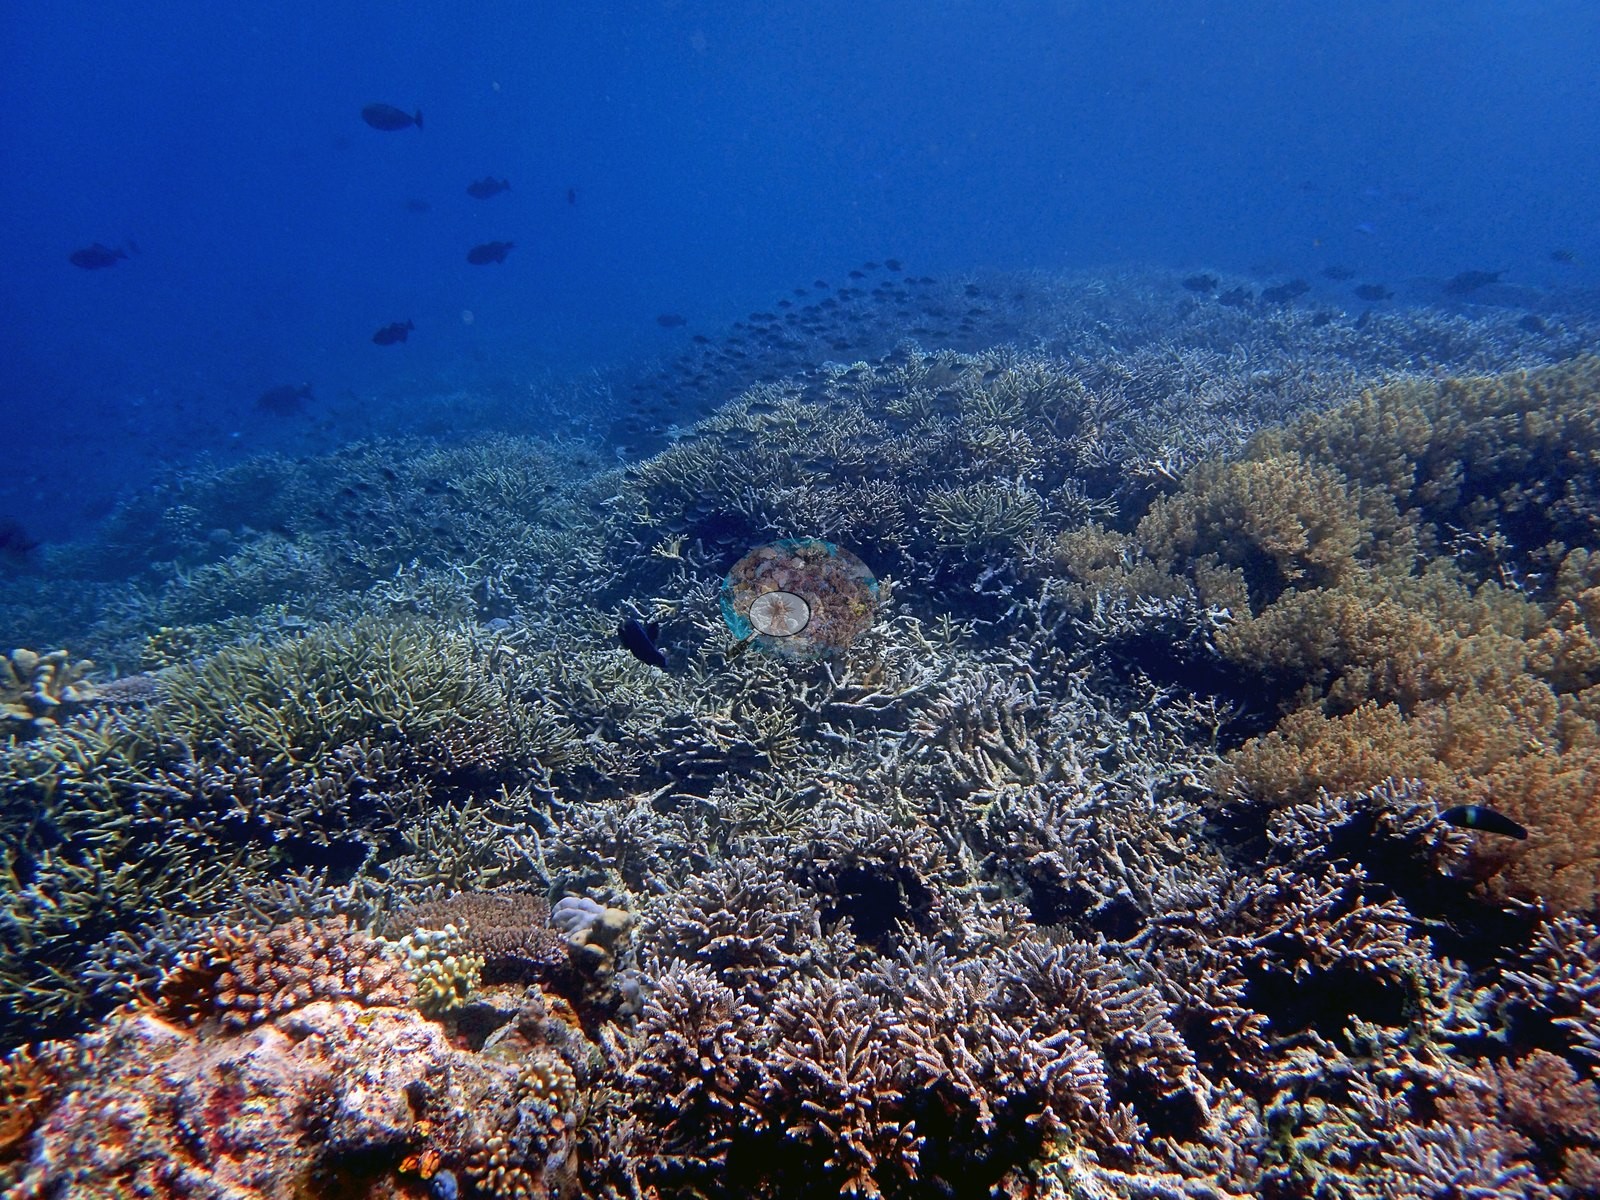
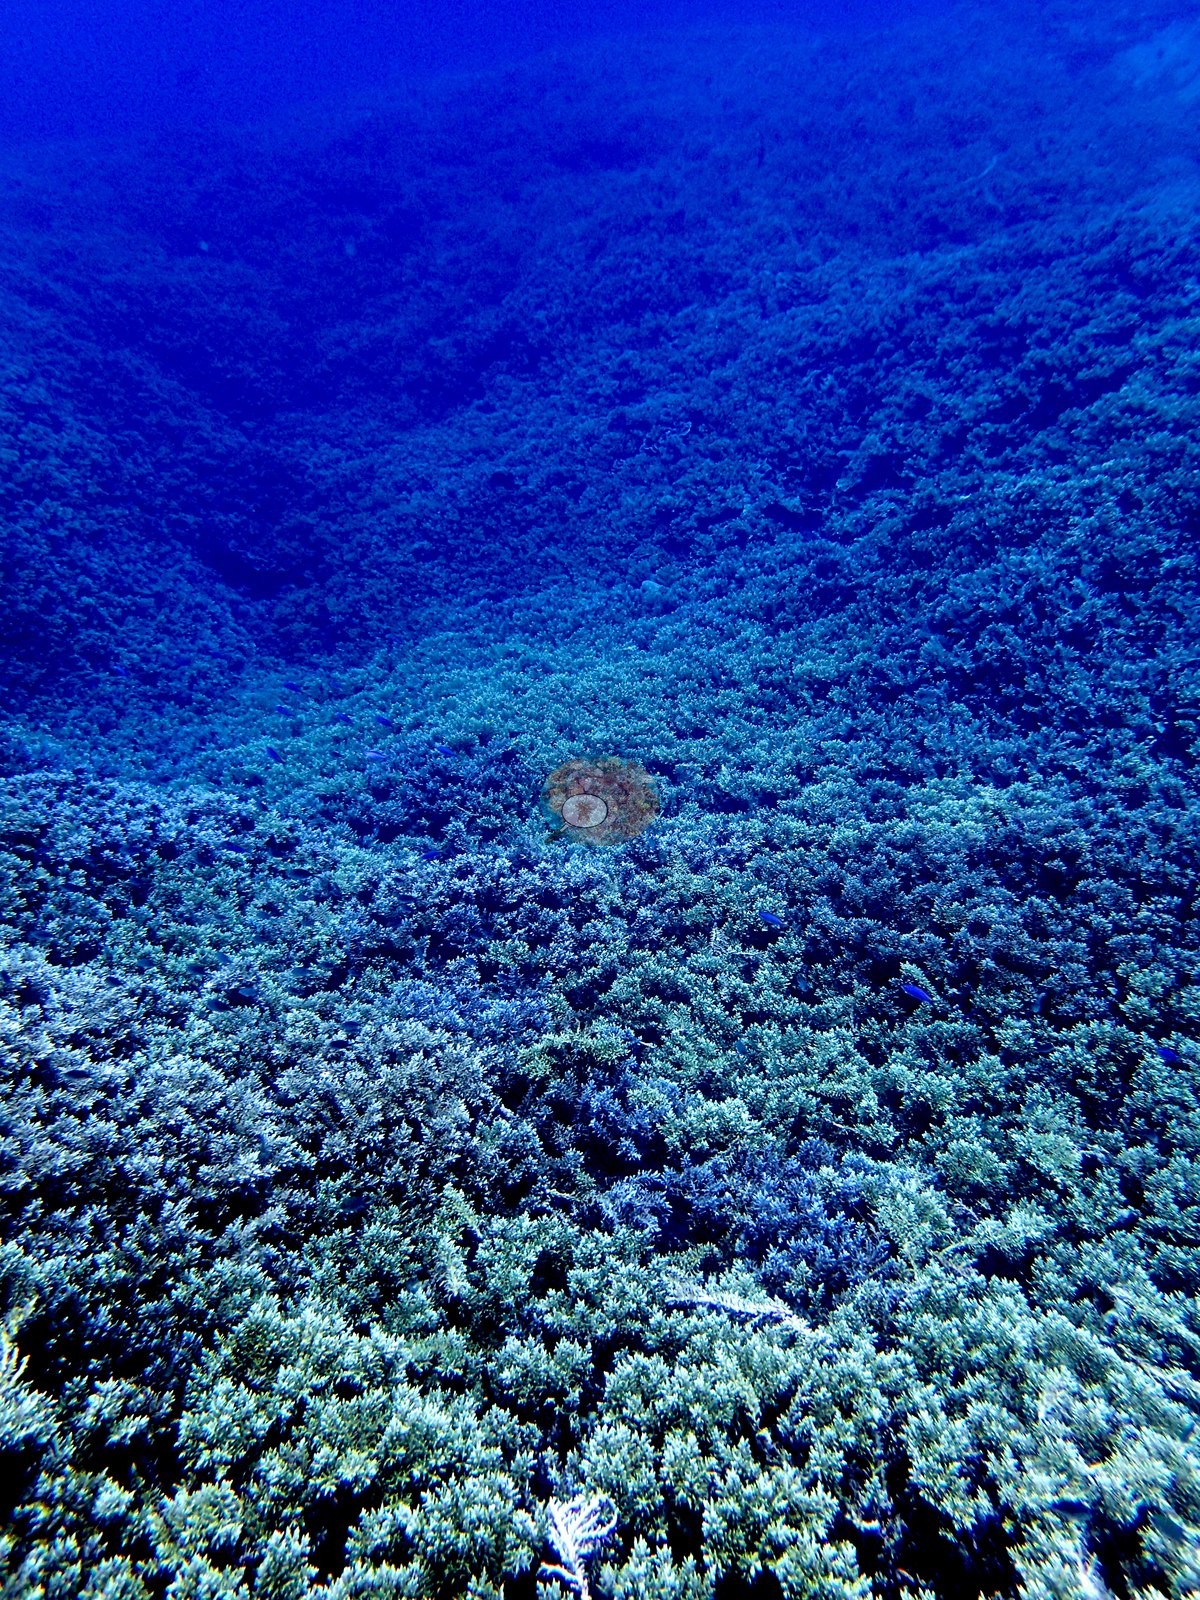
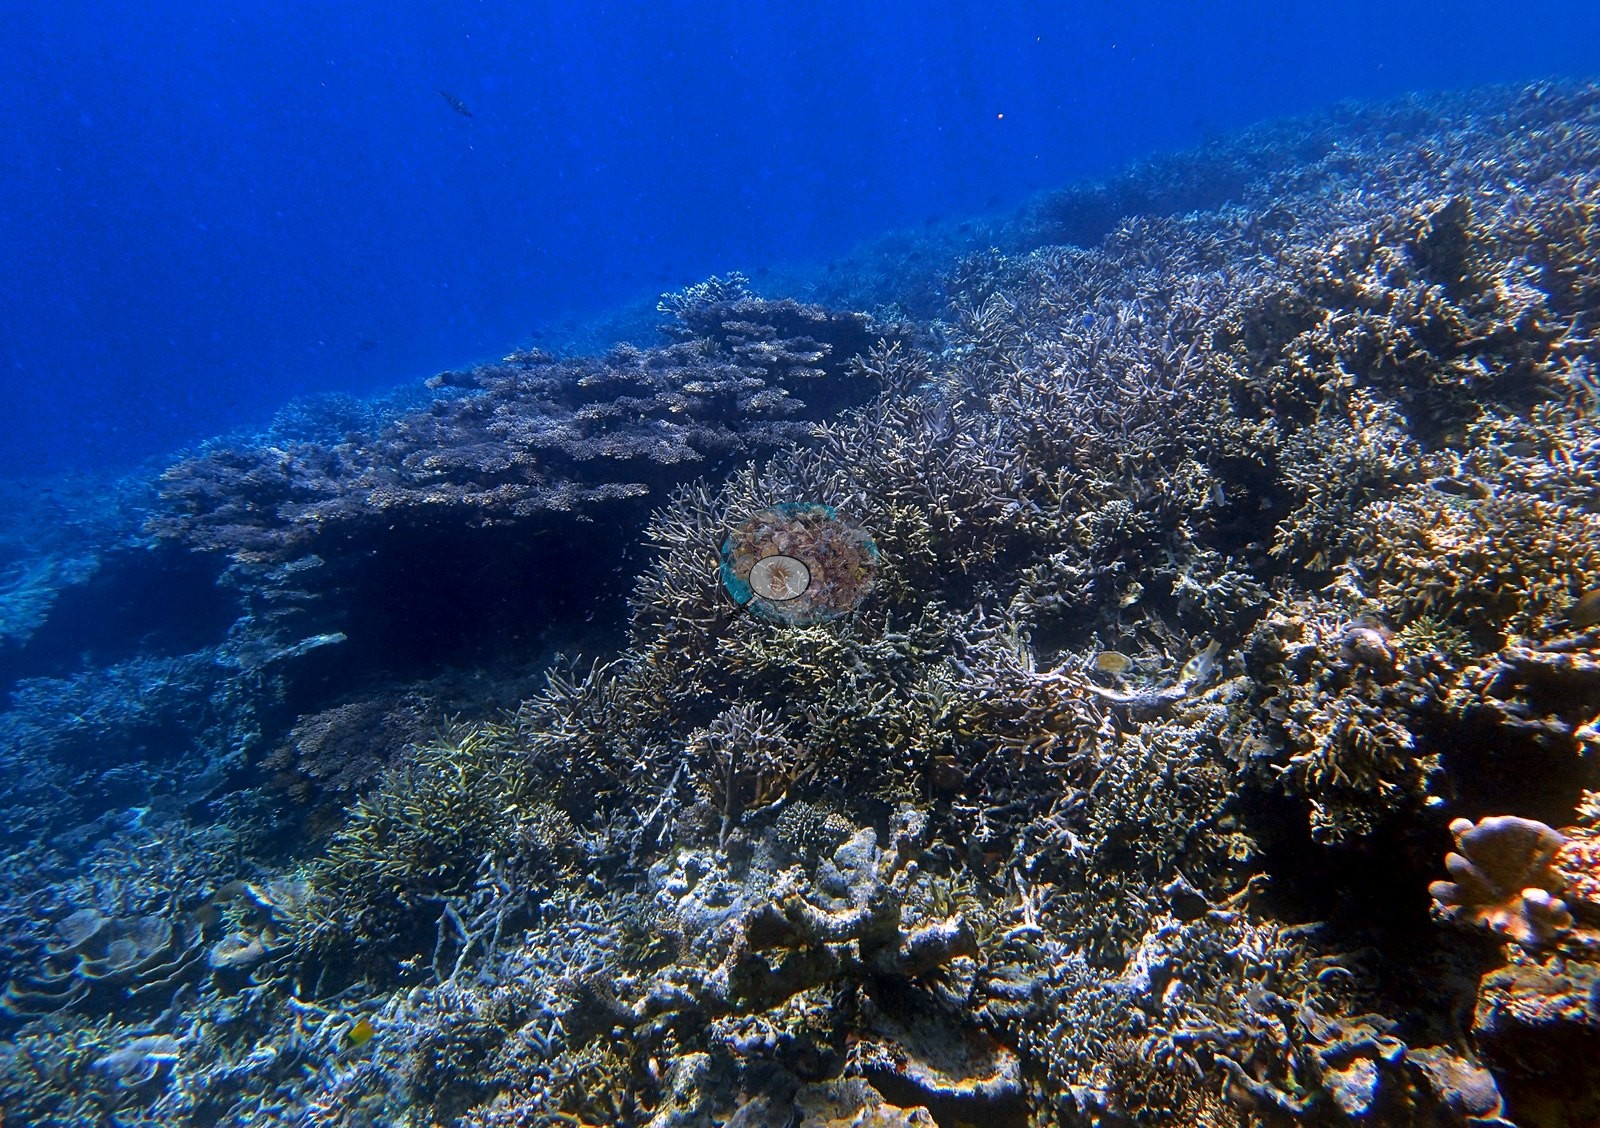
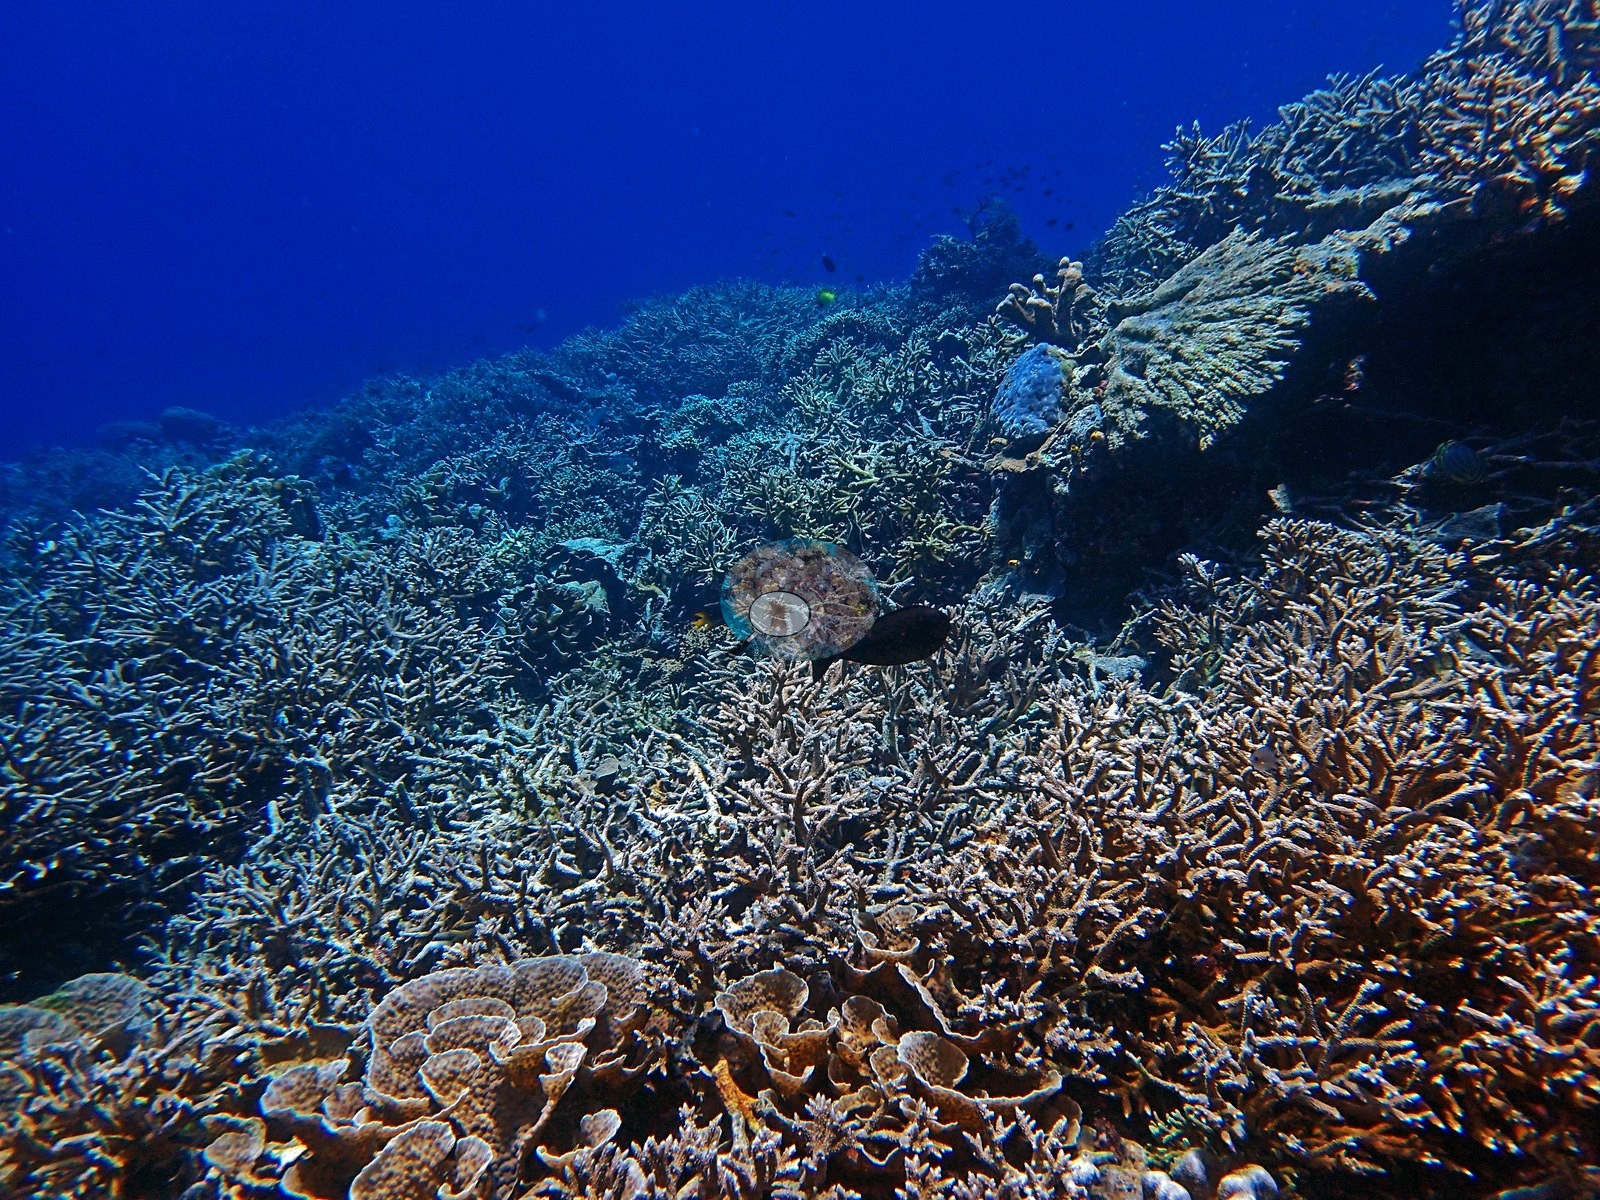
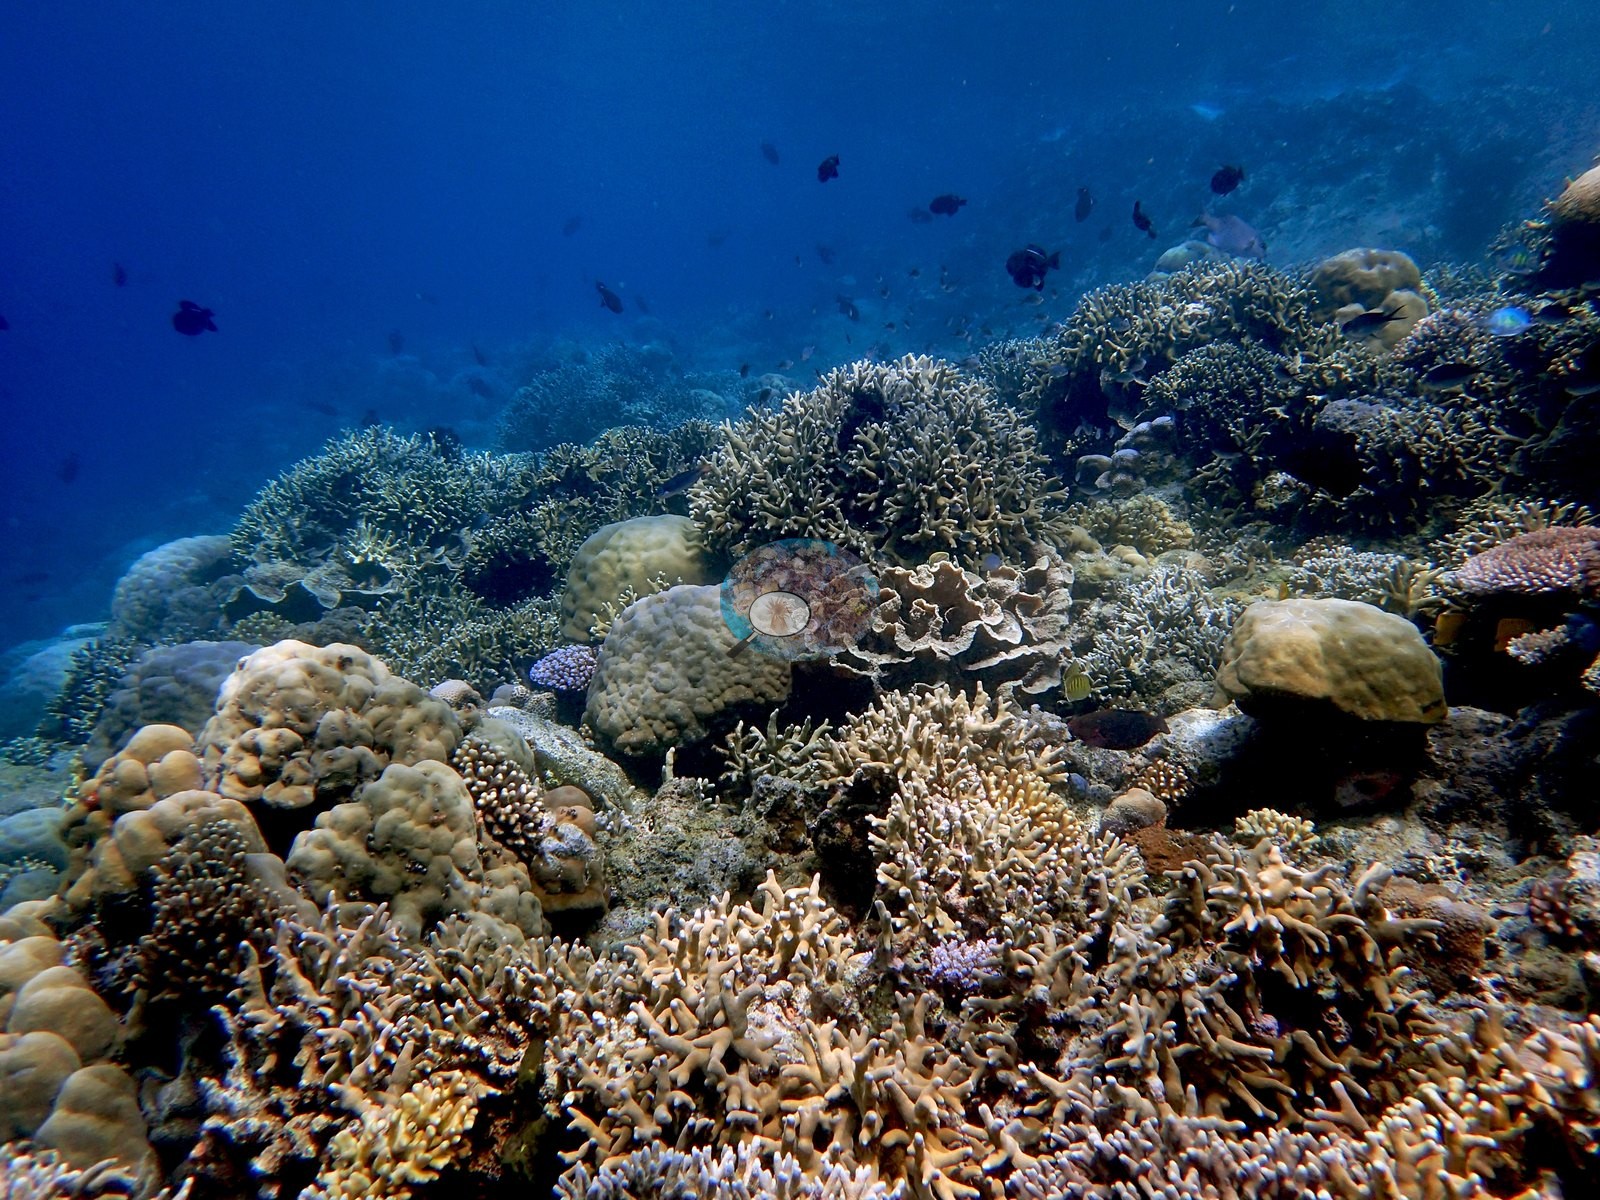
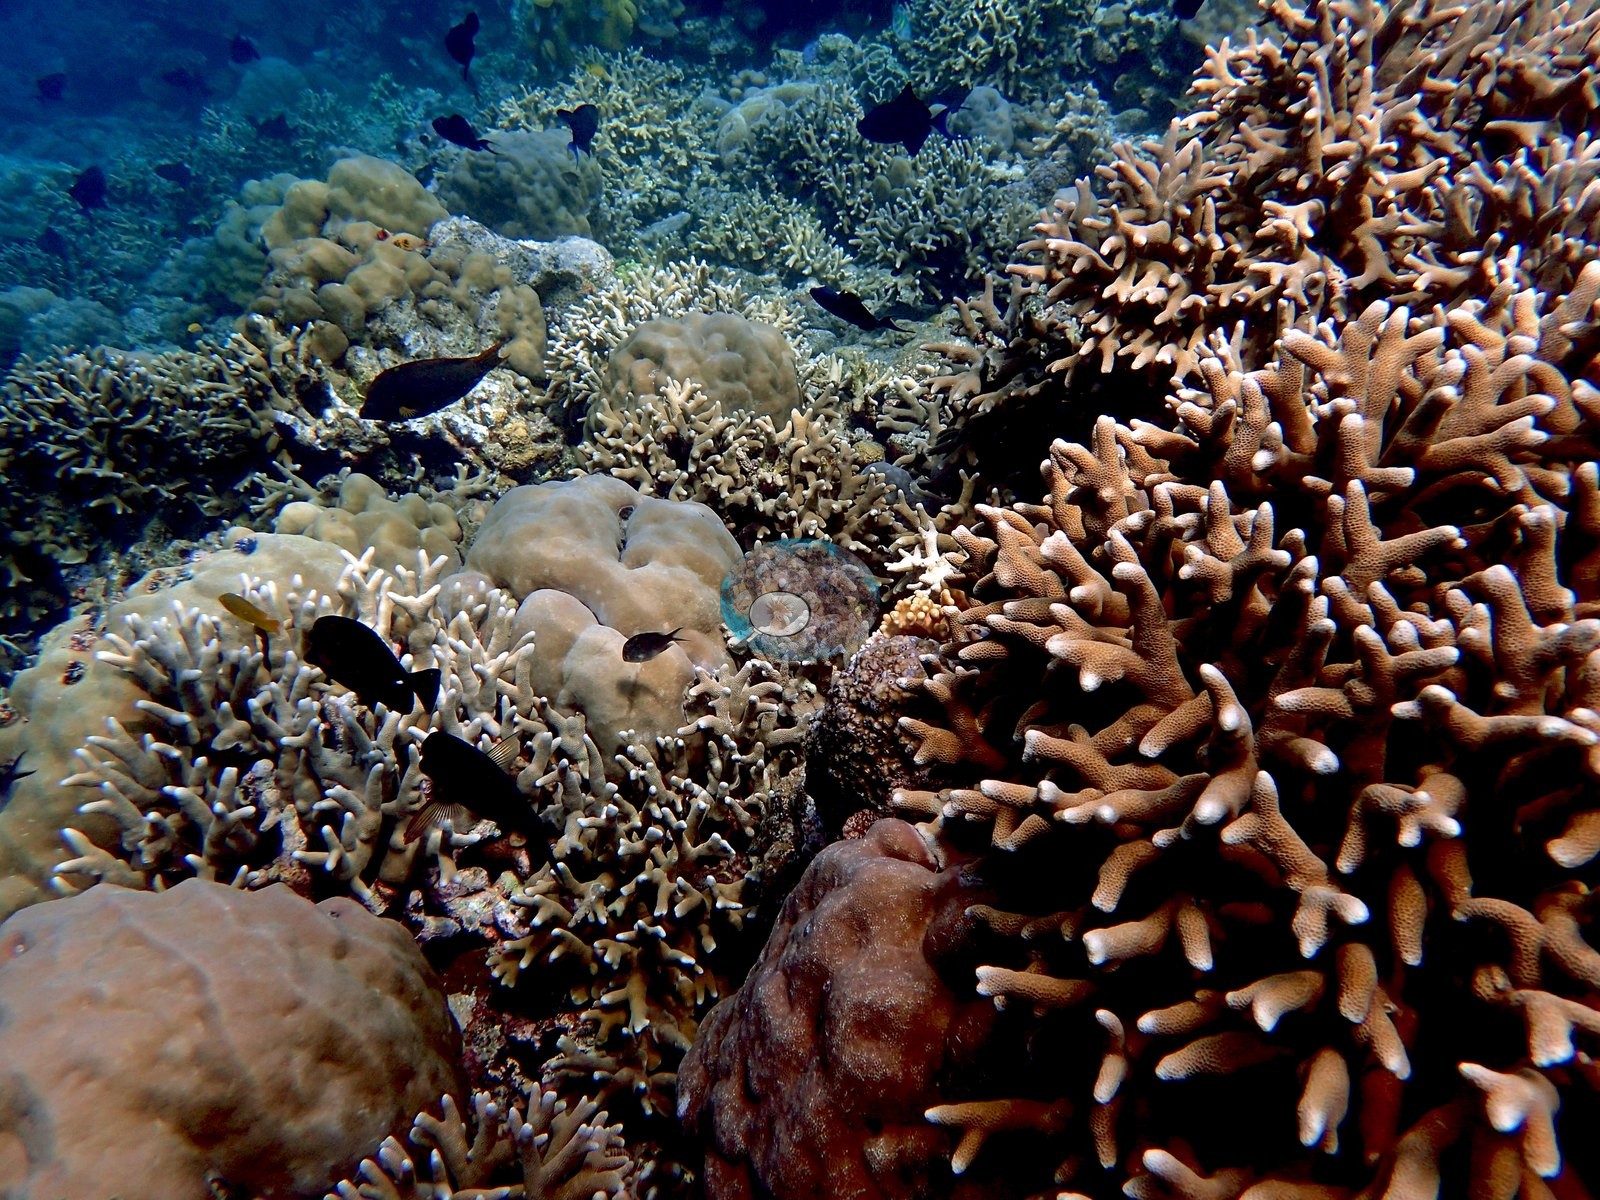
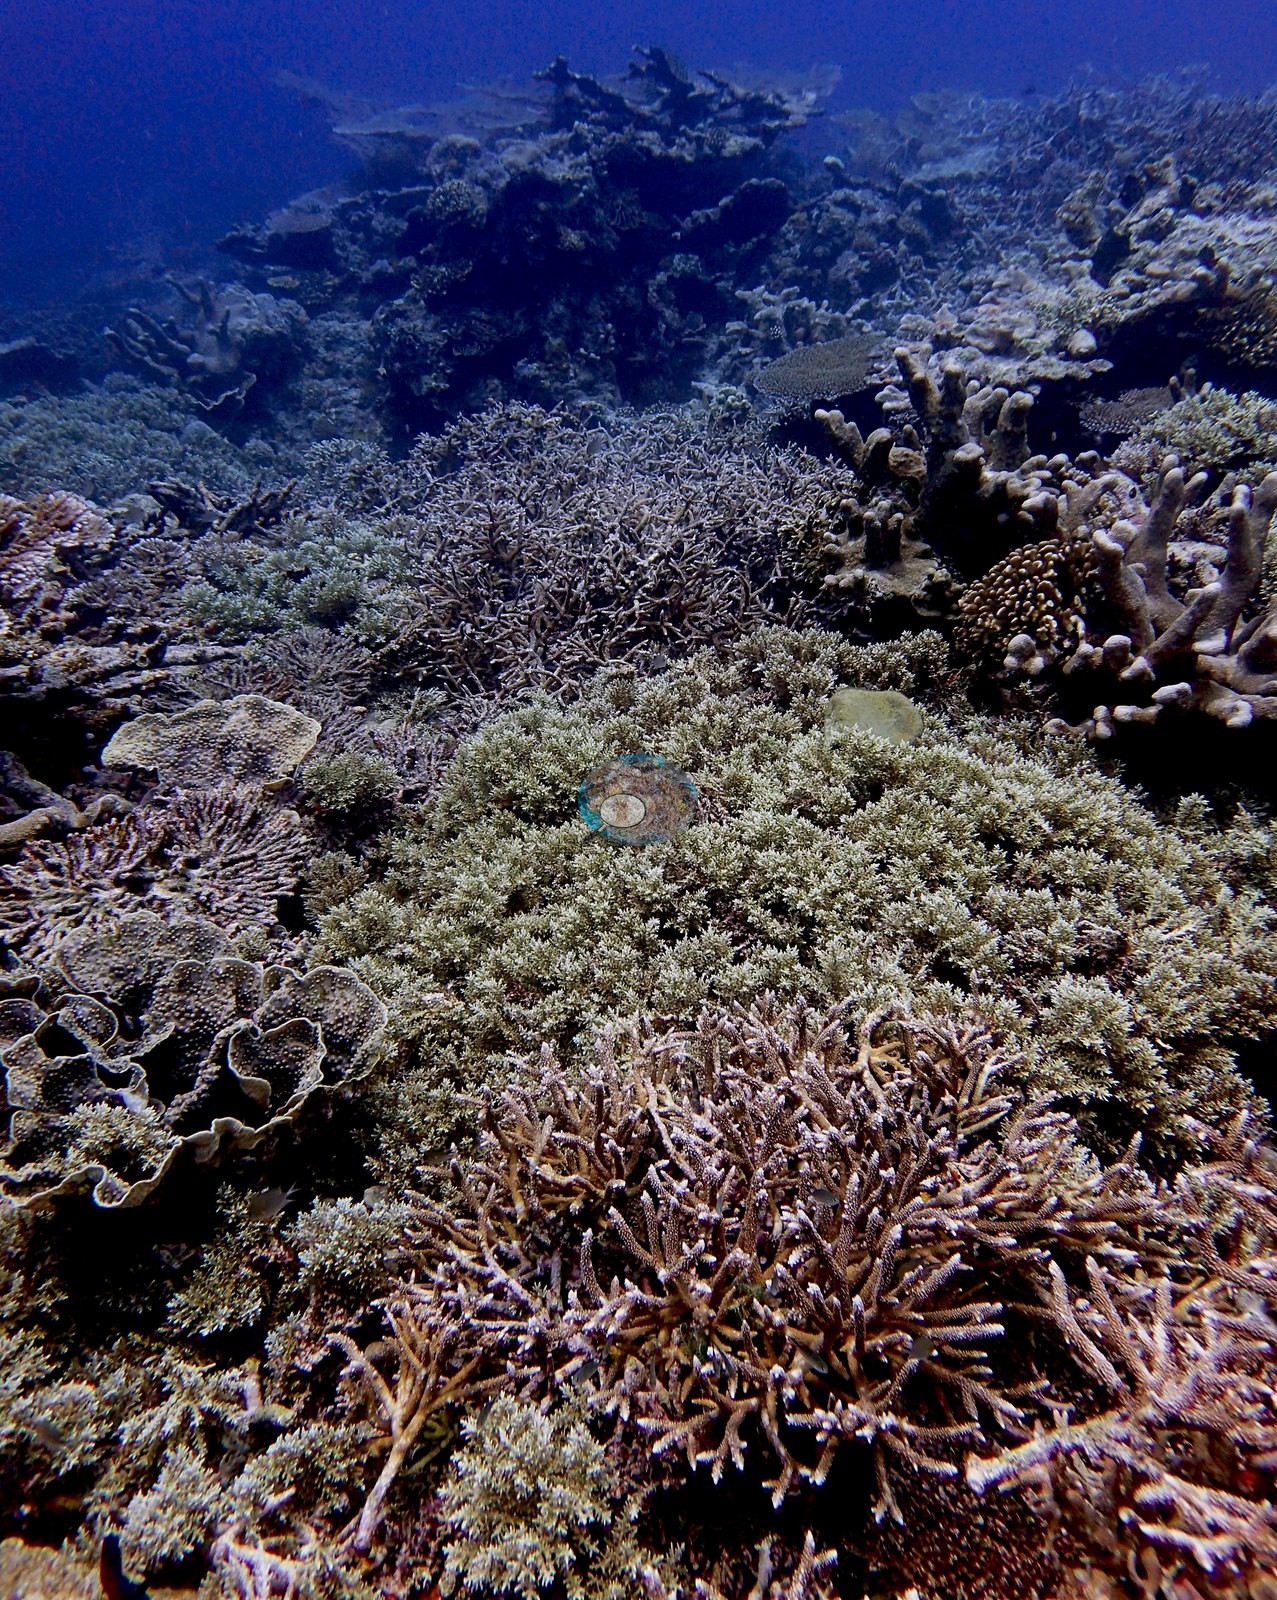
The habitat zones. The staghorn and corymbose Acropora thicket slope is the dive, 70 of 192 frames: unbroken carpets running out of sight into blue water, in brown, olive, and lilac color morphs, with tabulate tables set through them (e.g., Image 1, Image 2, Image 15, Image 22, Image 23, Image 24, Image 25).
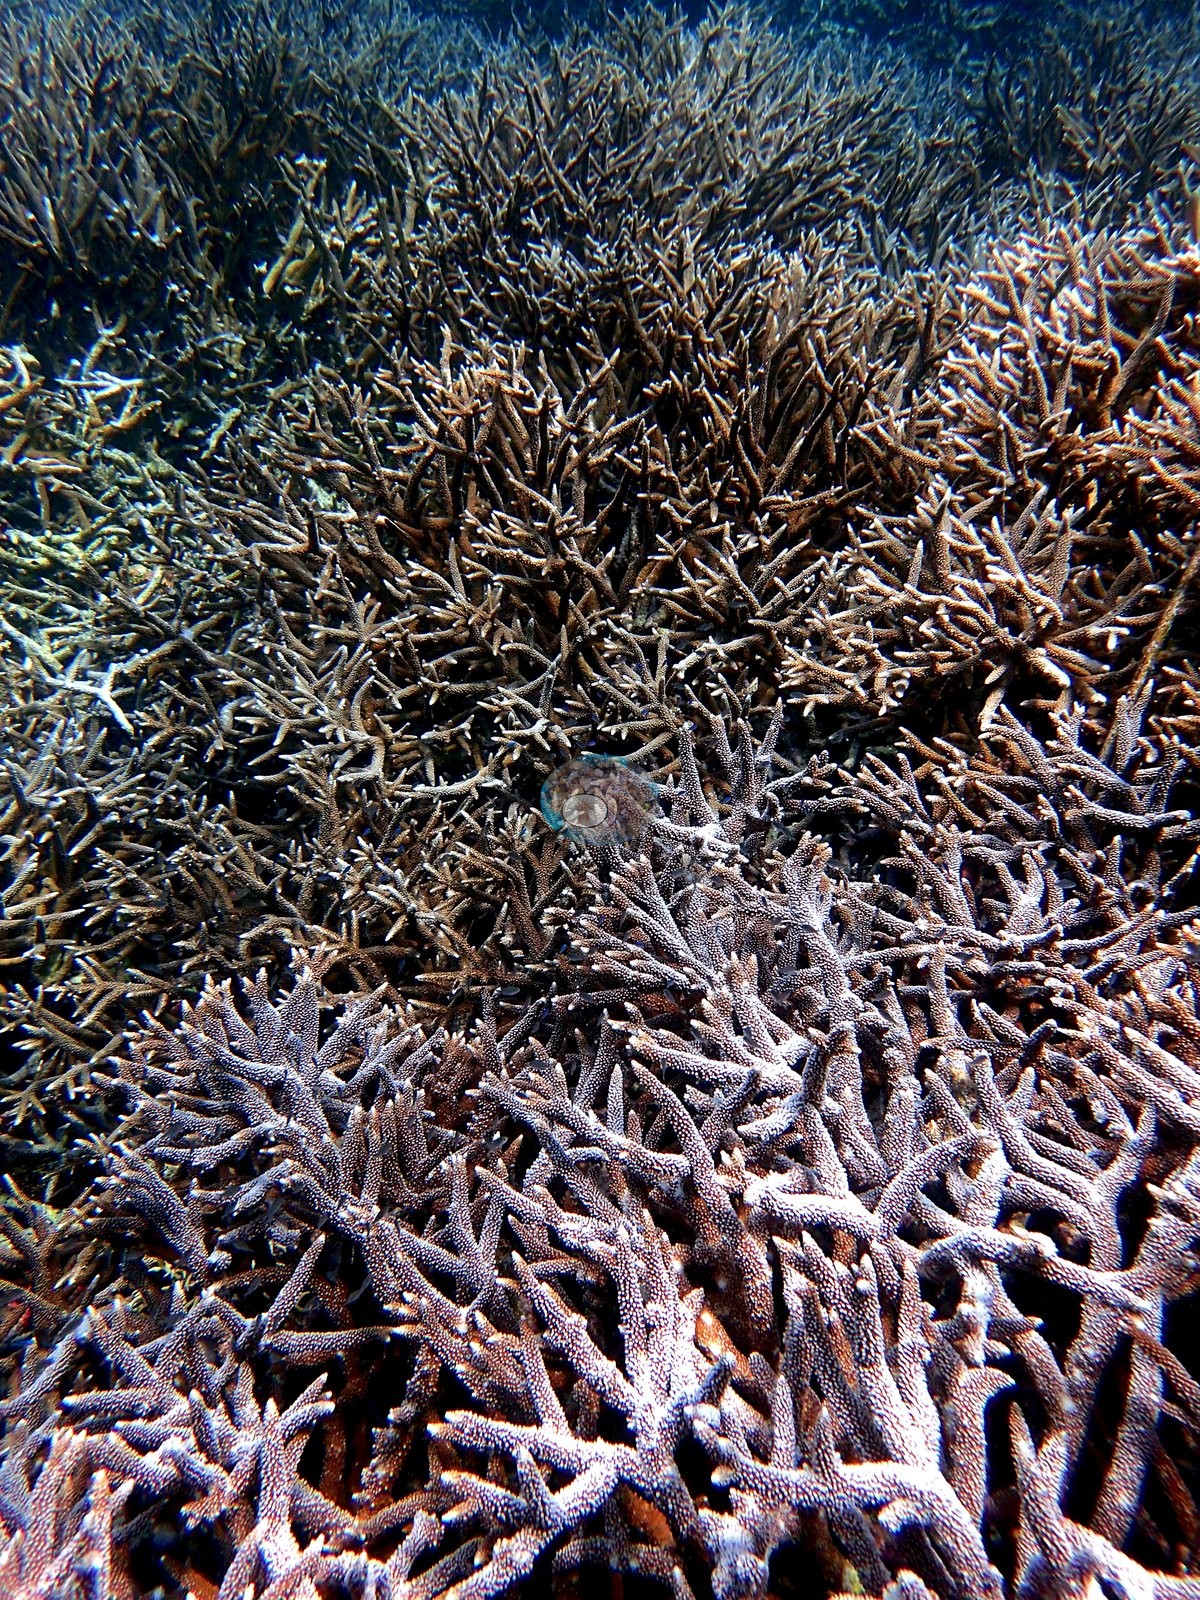
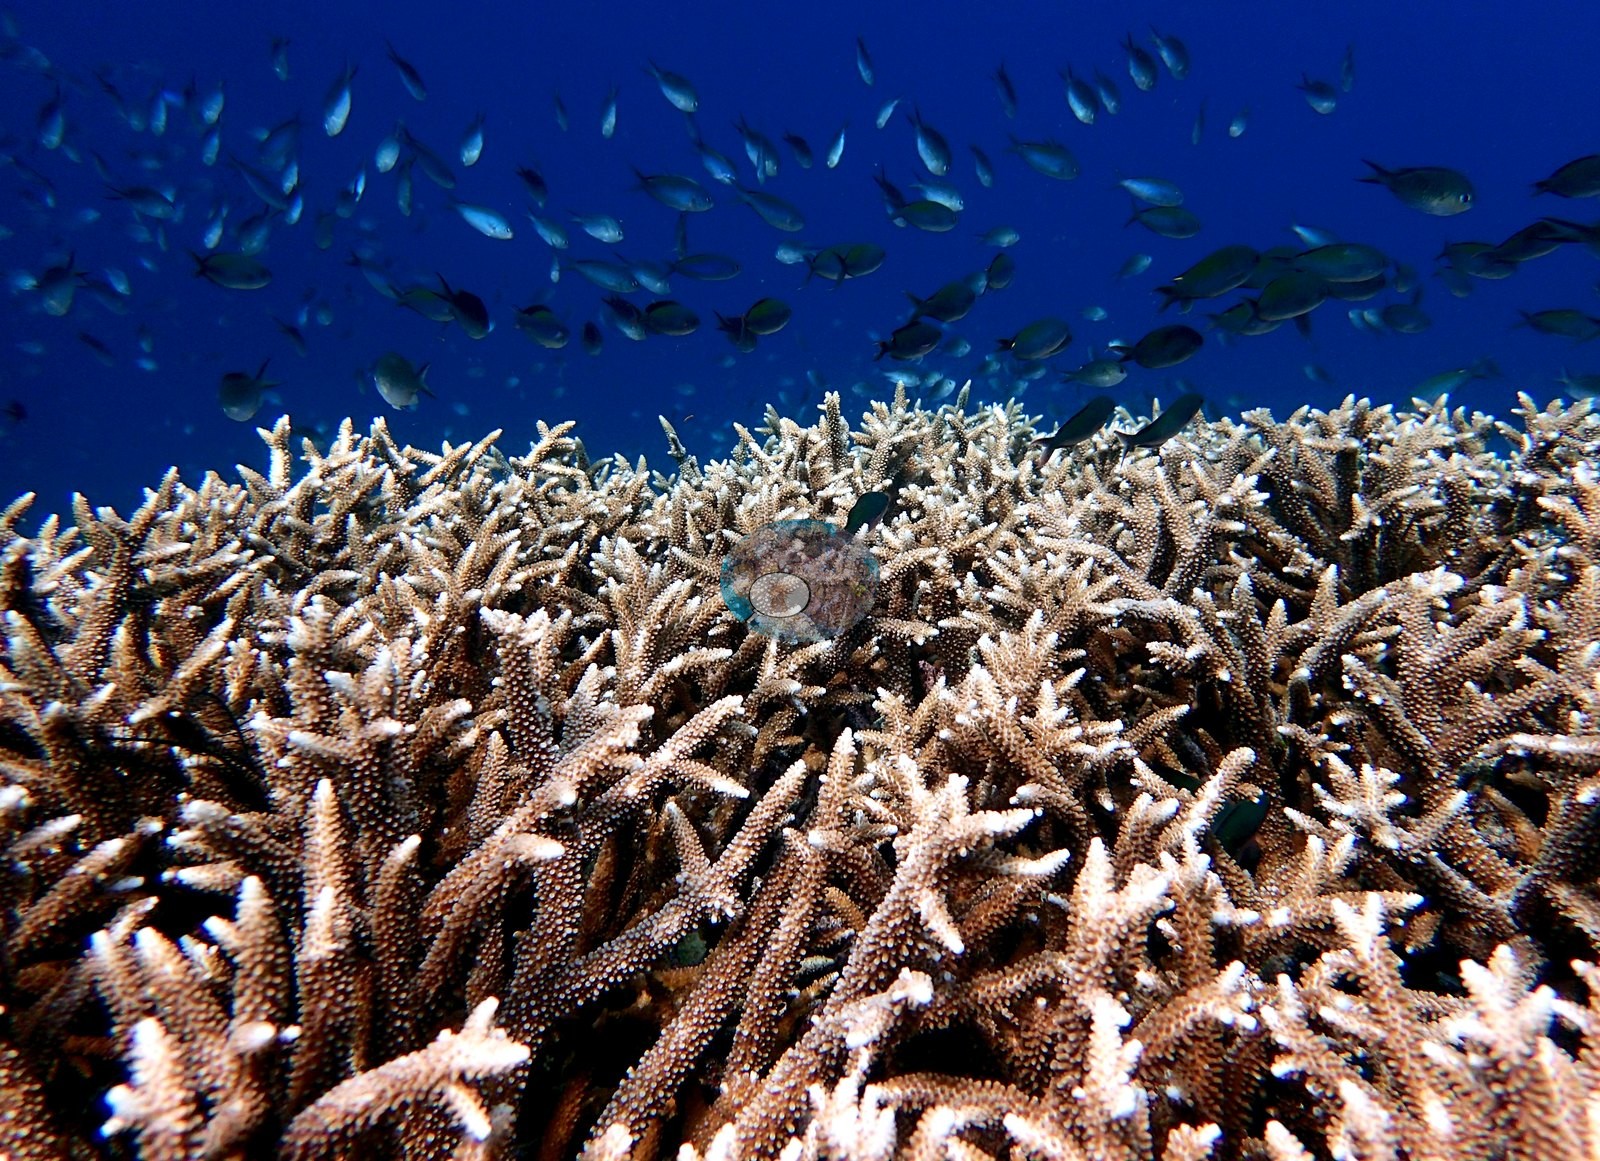
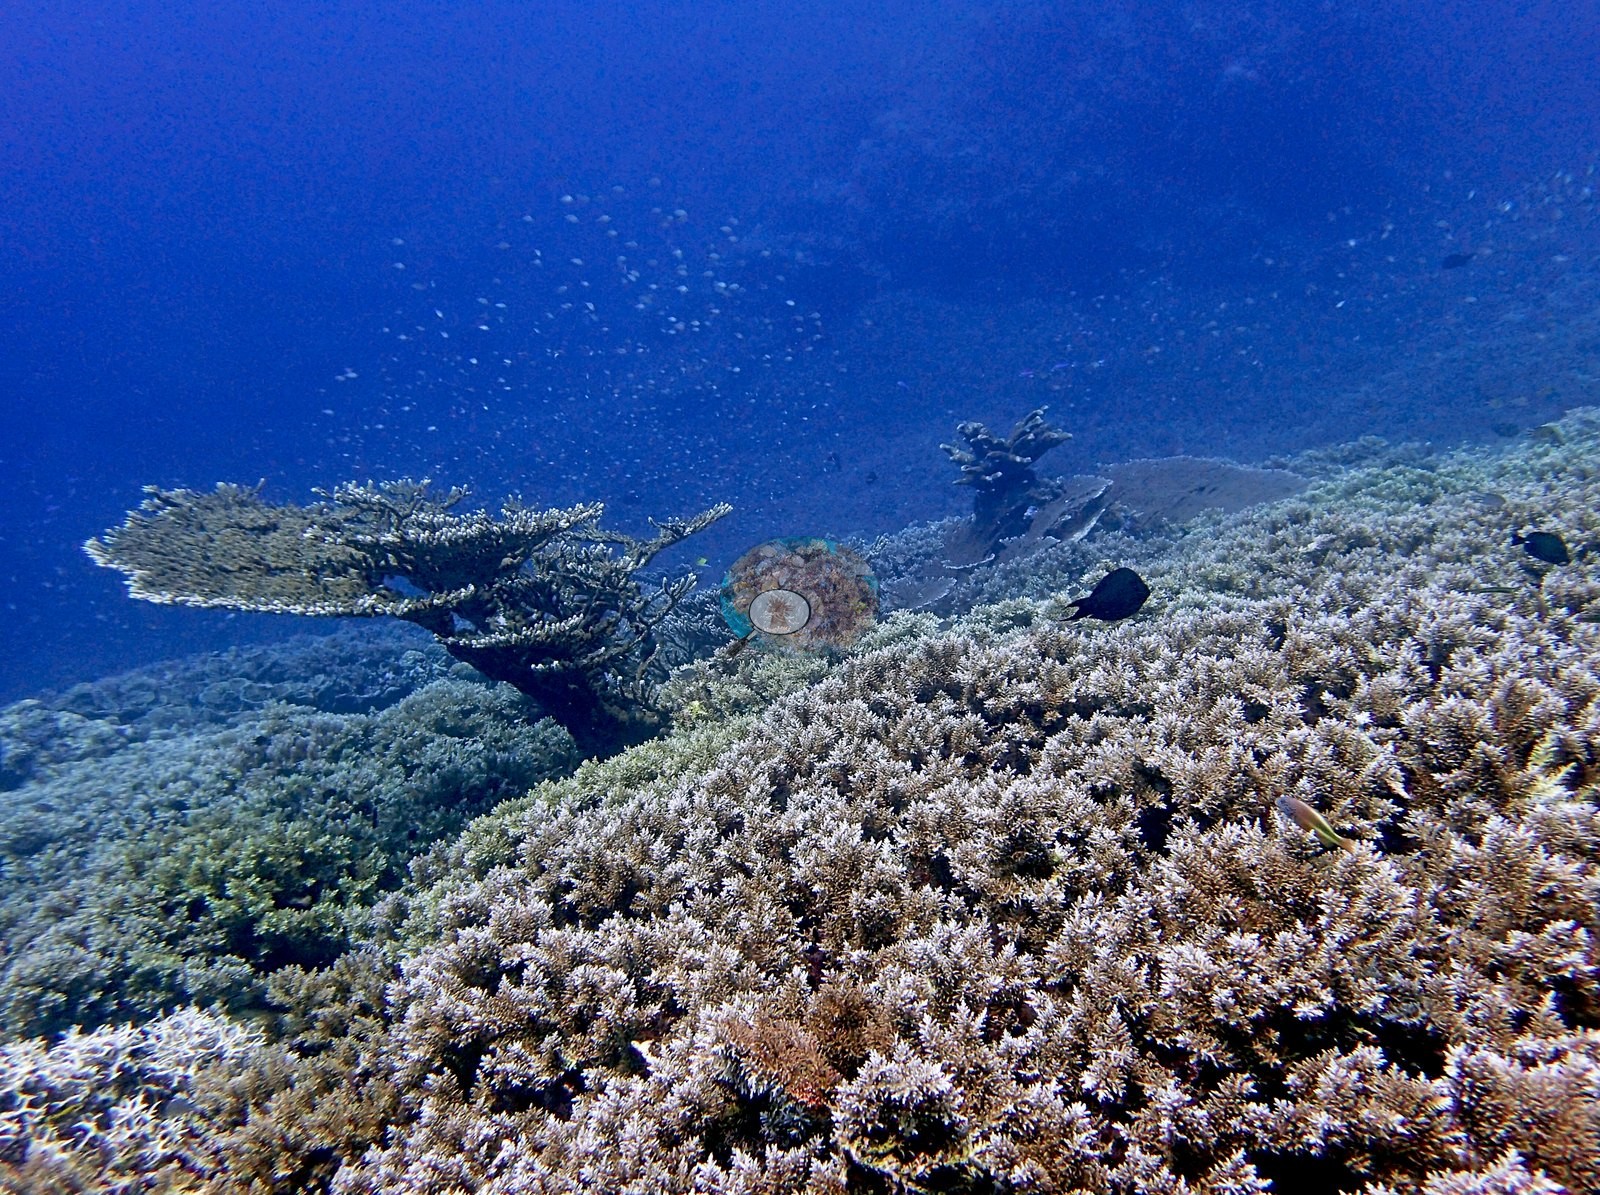
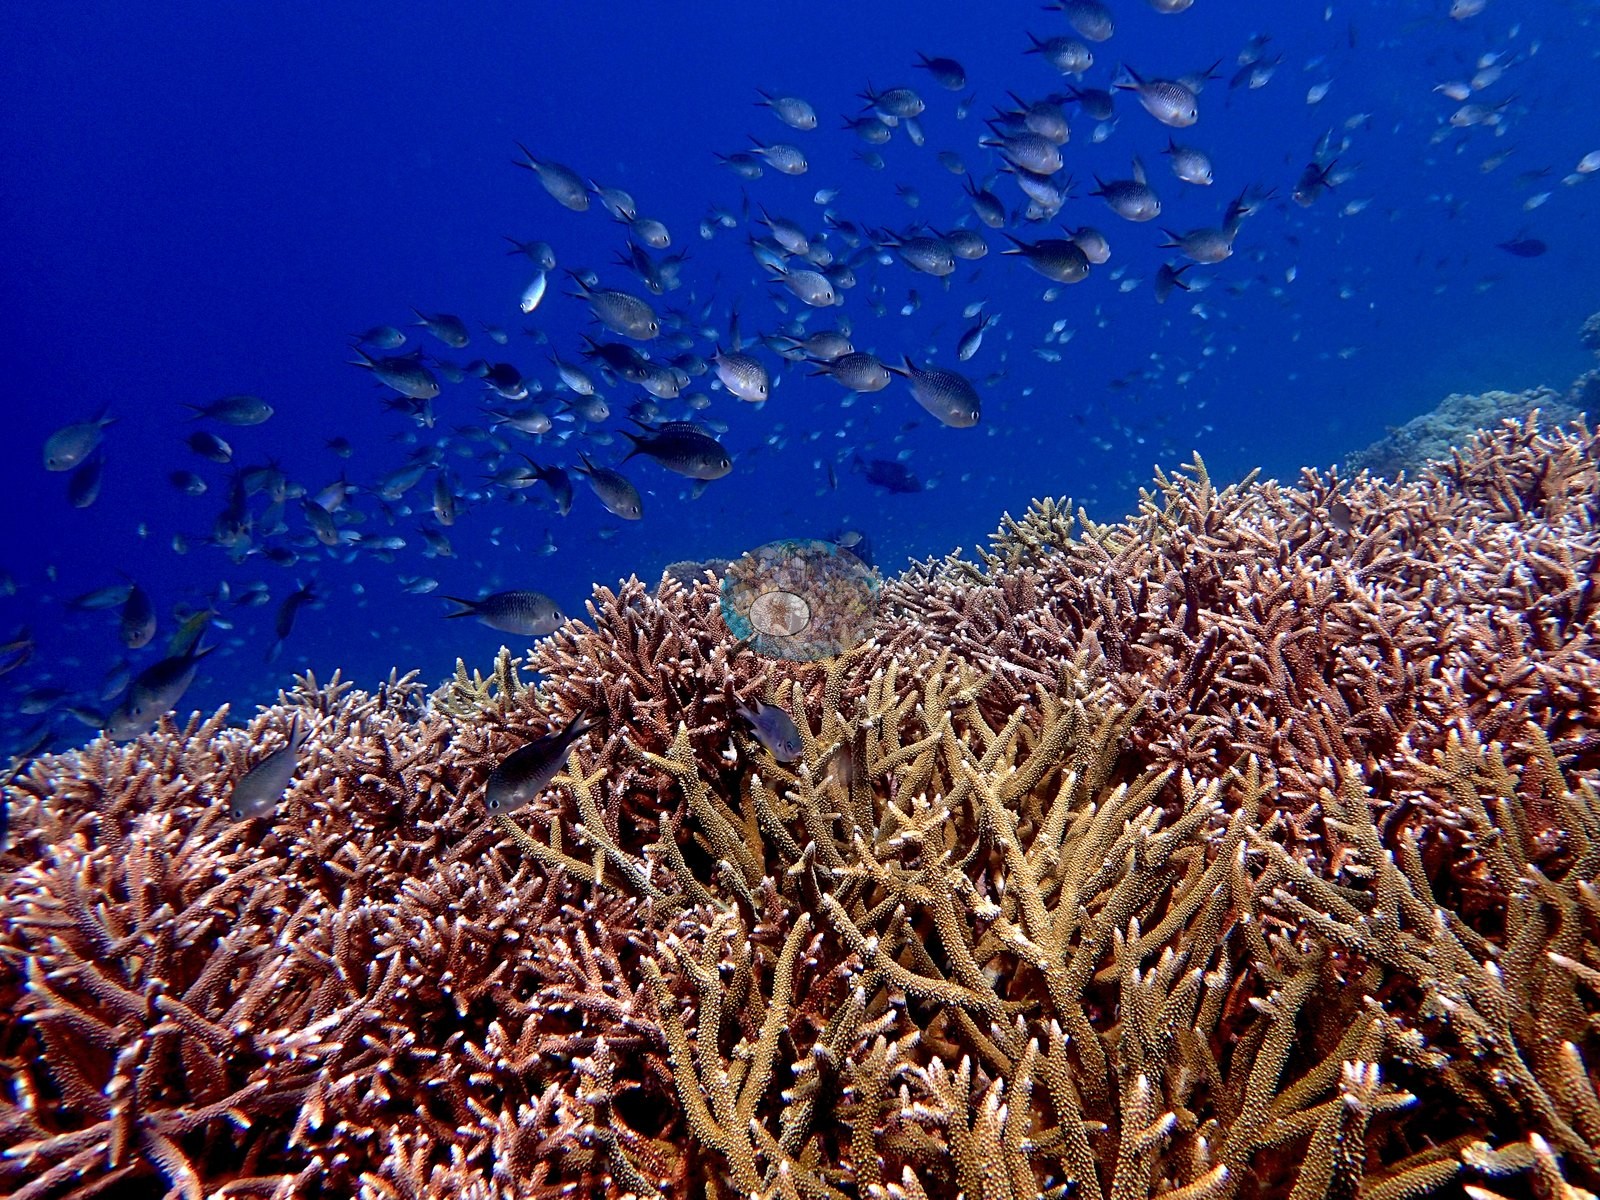
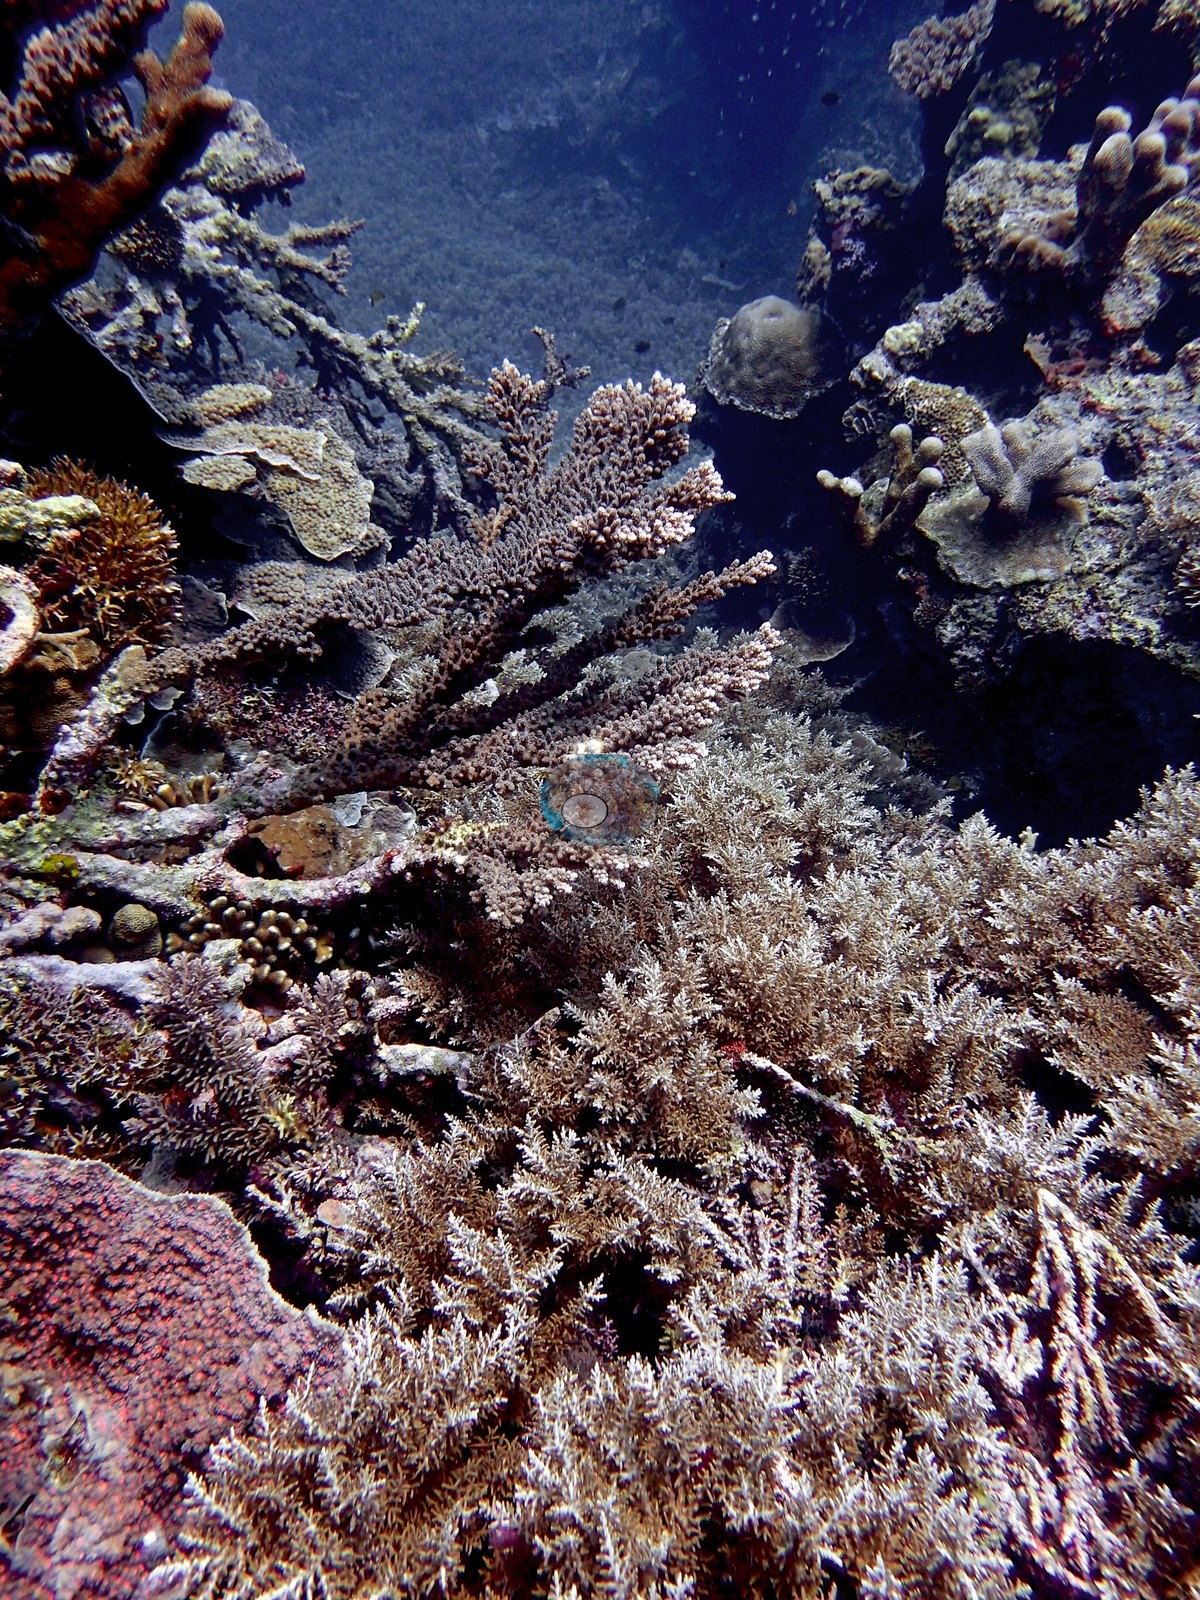
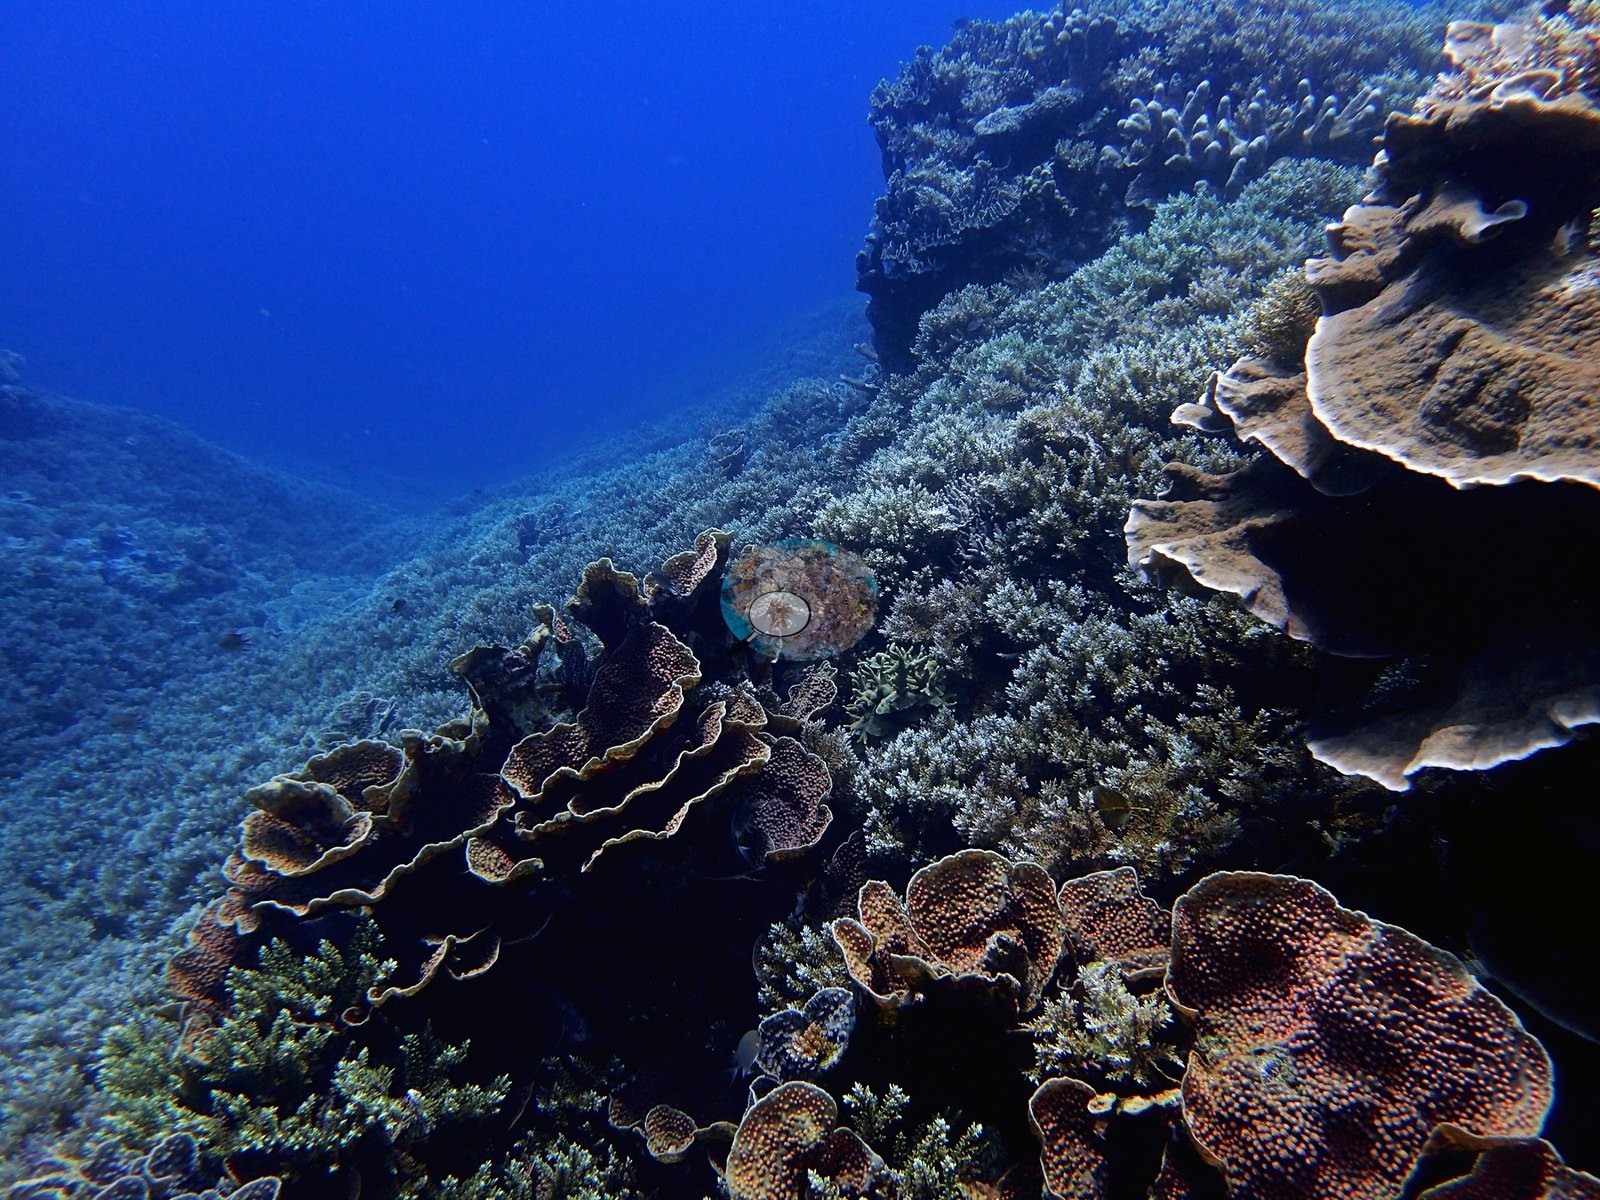
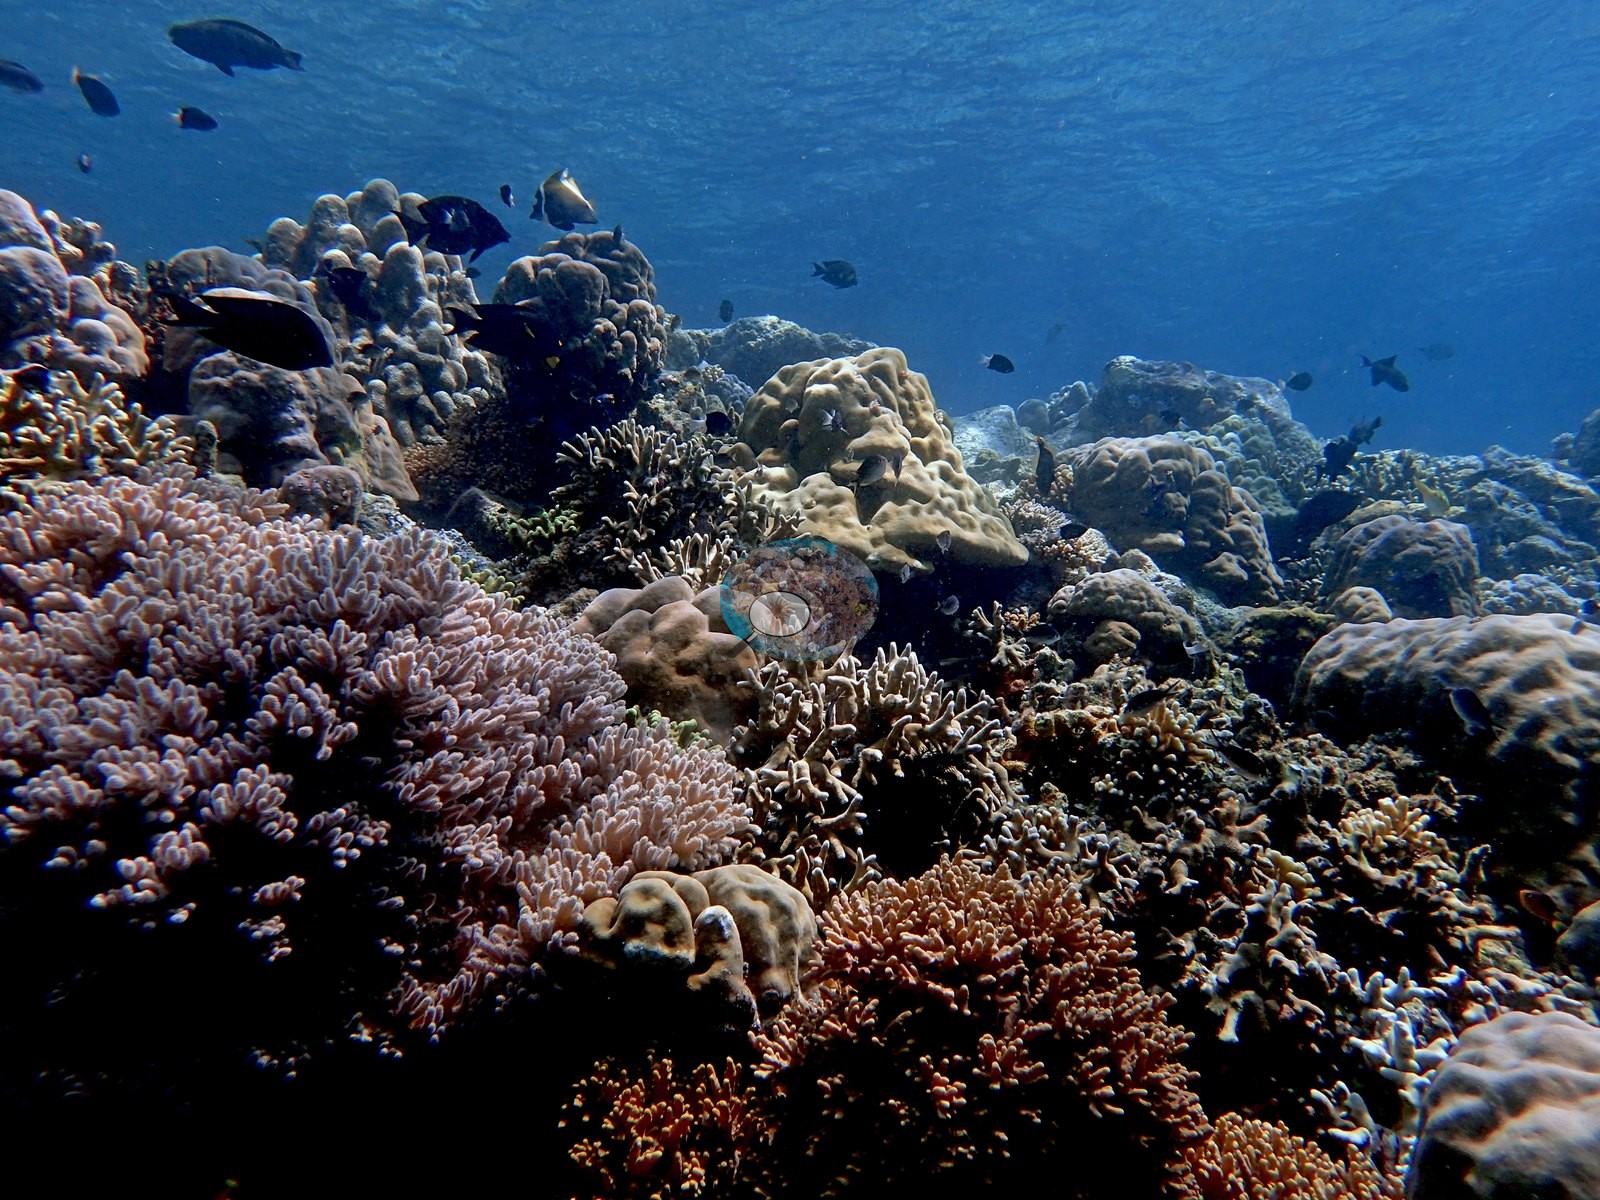
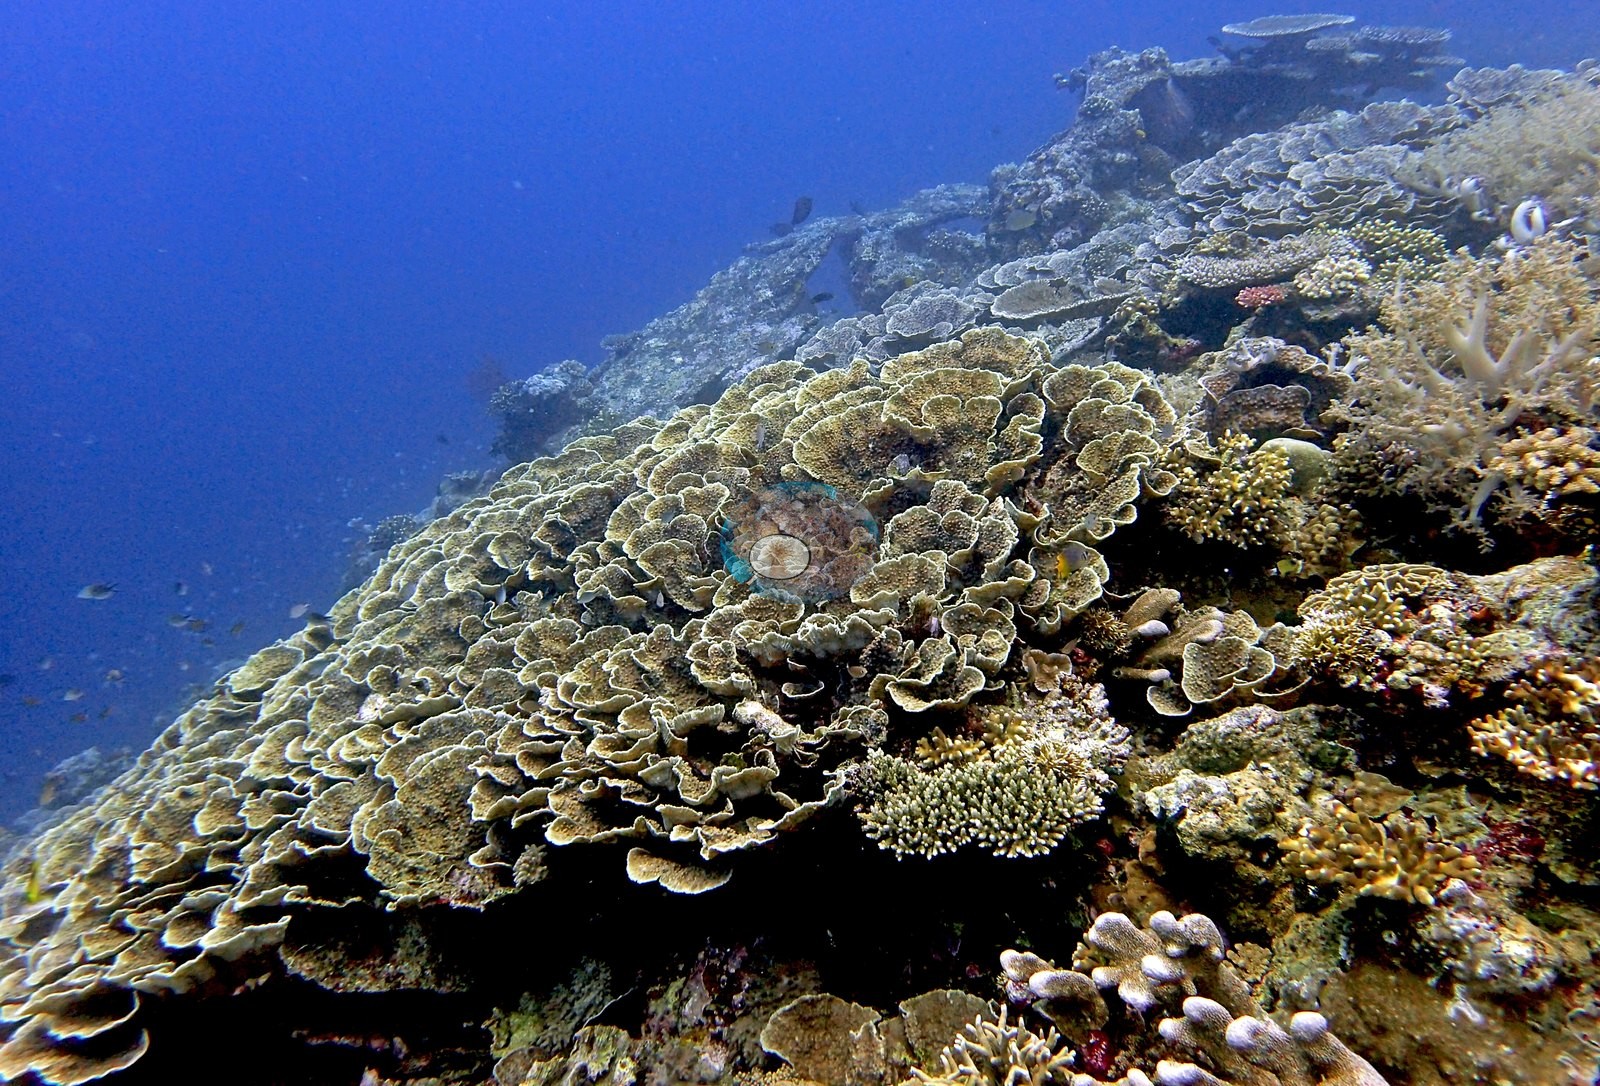
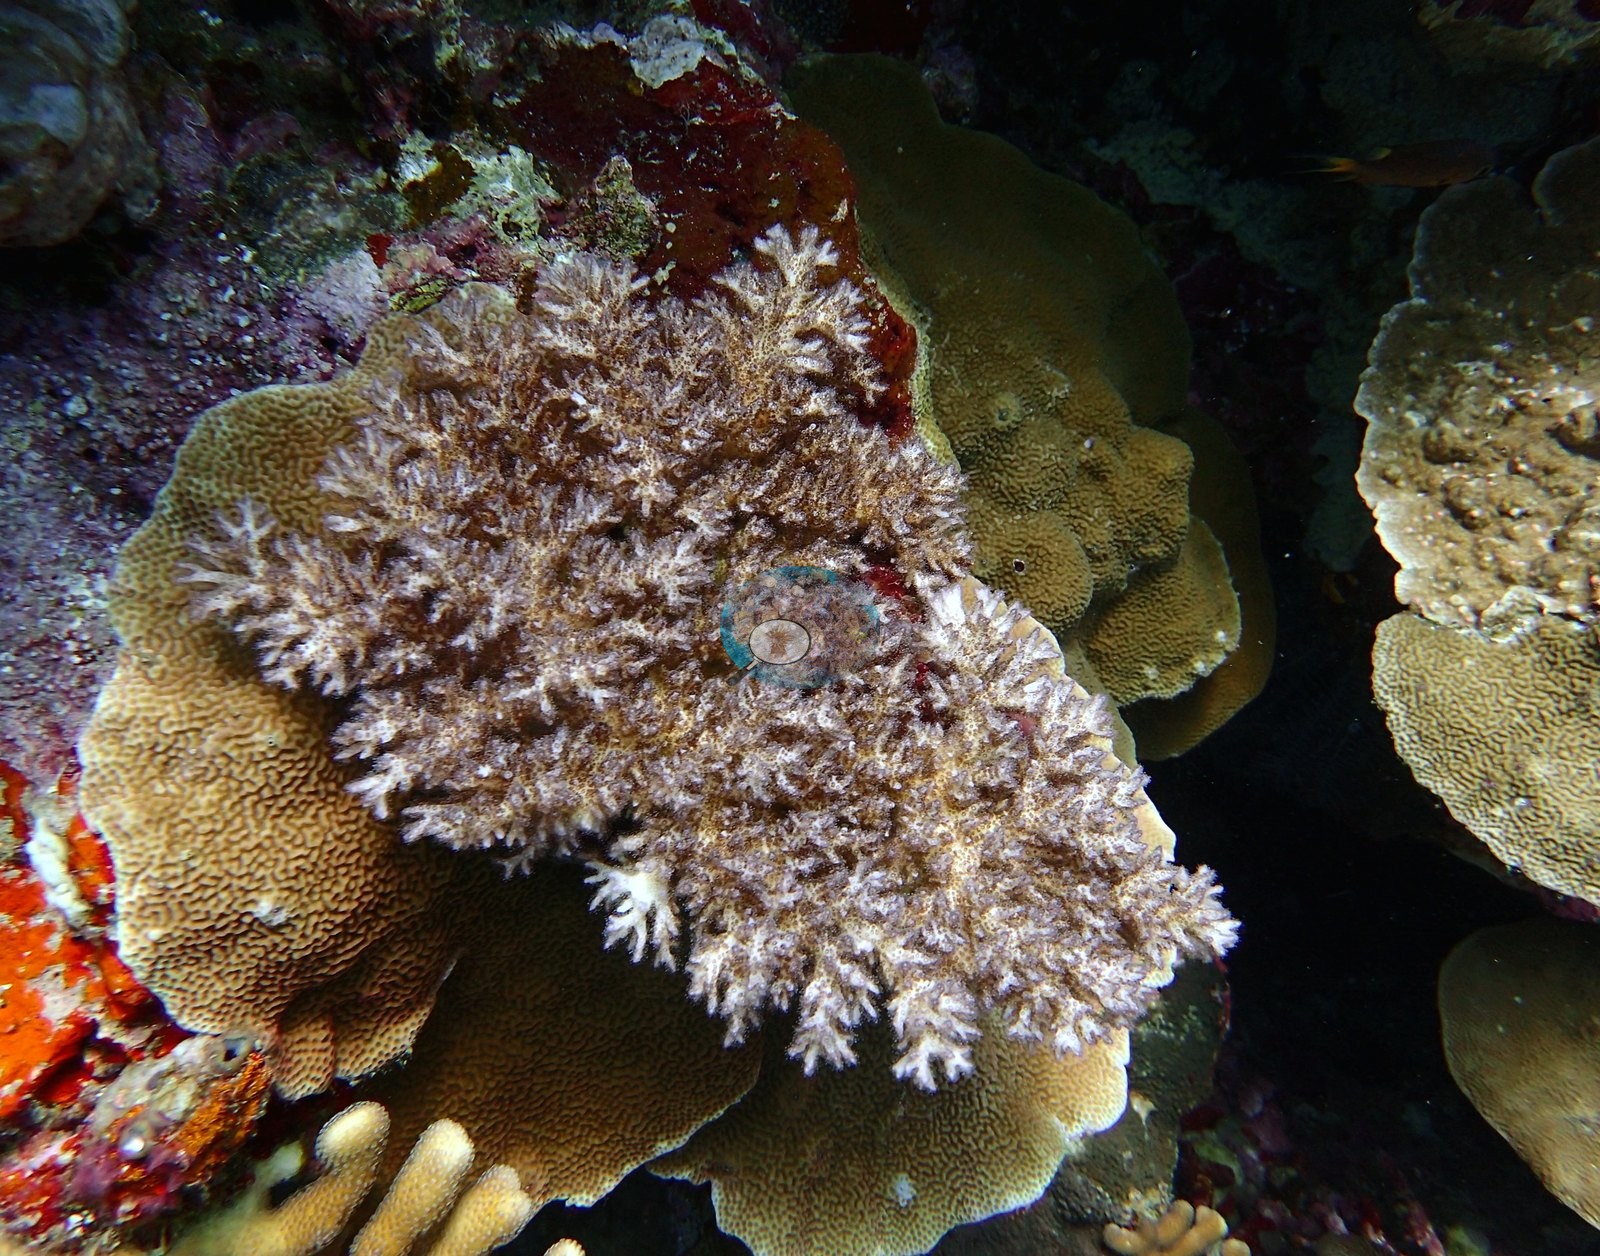
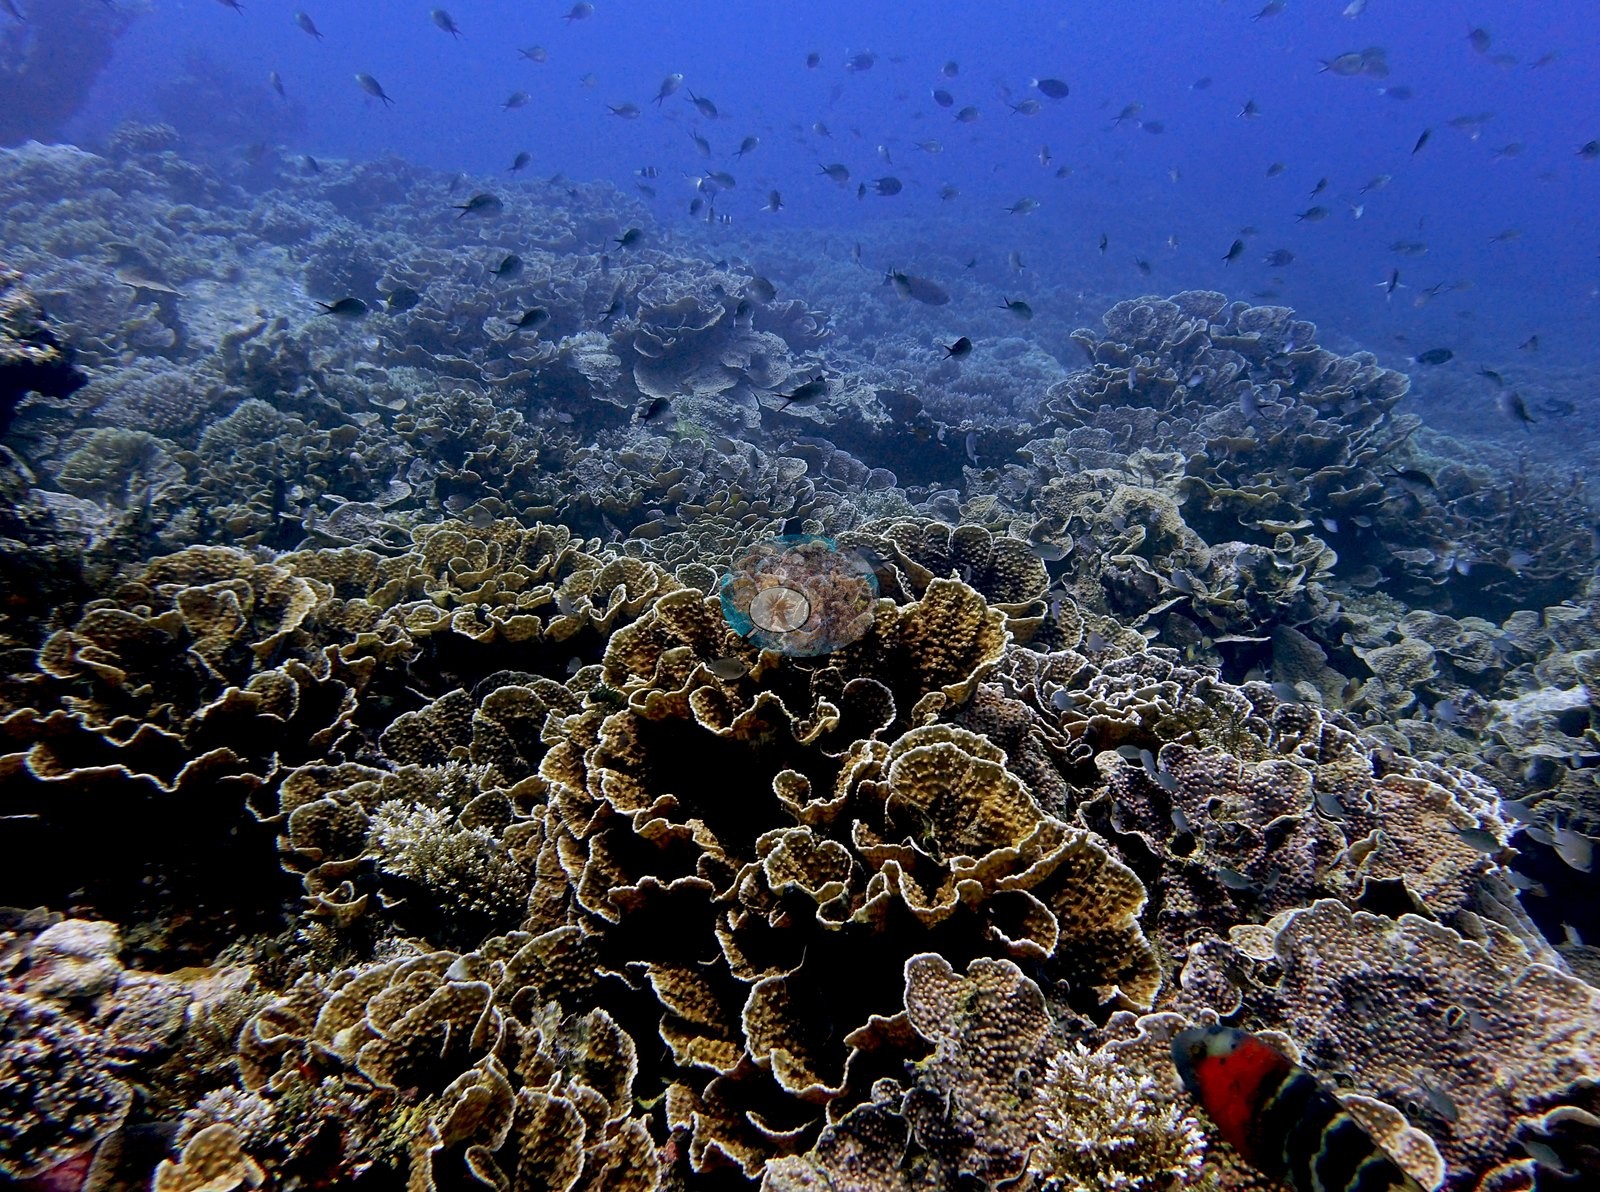
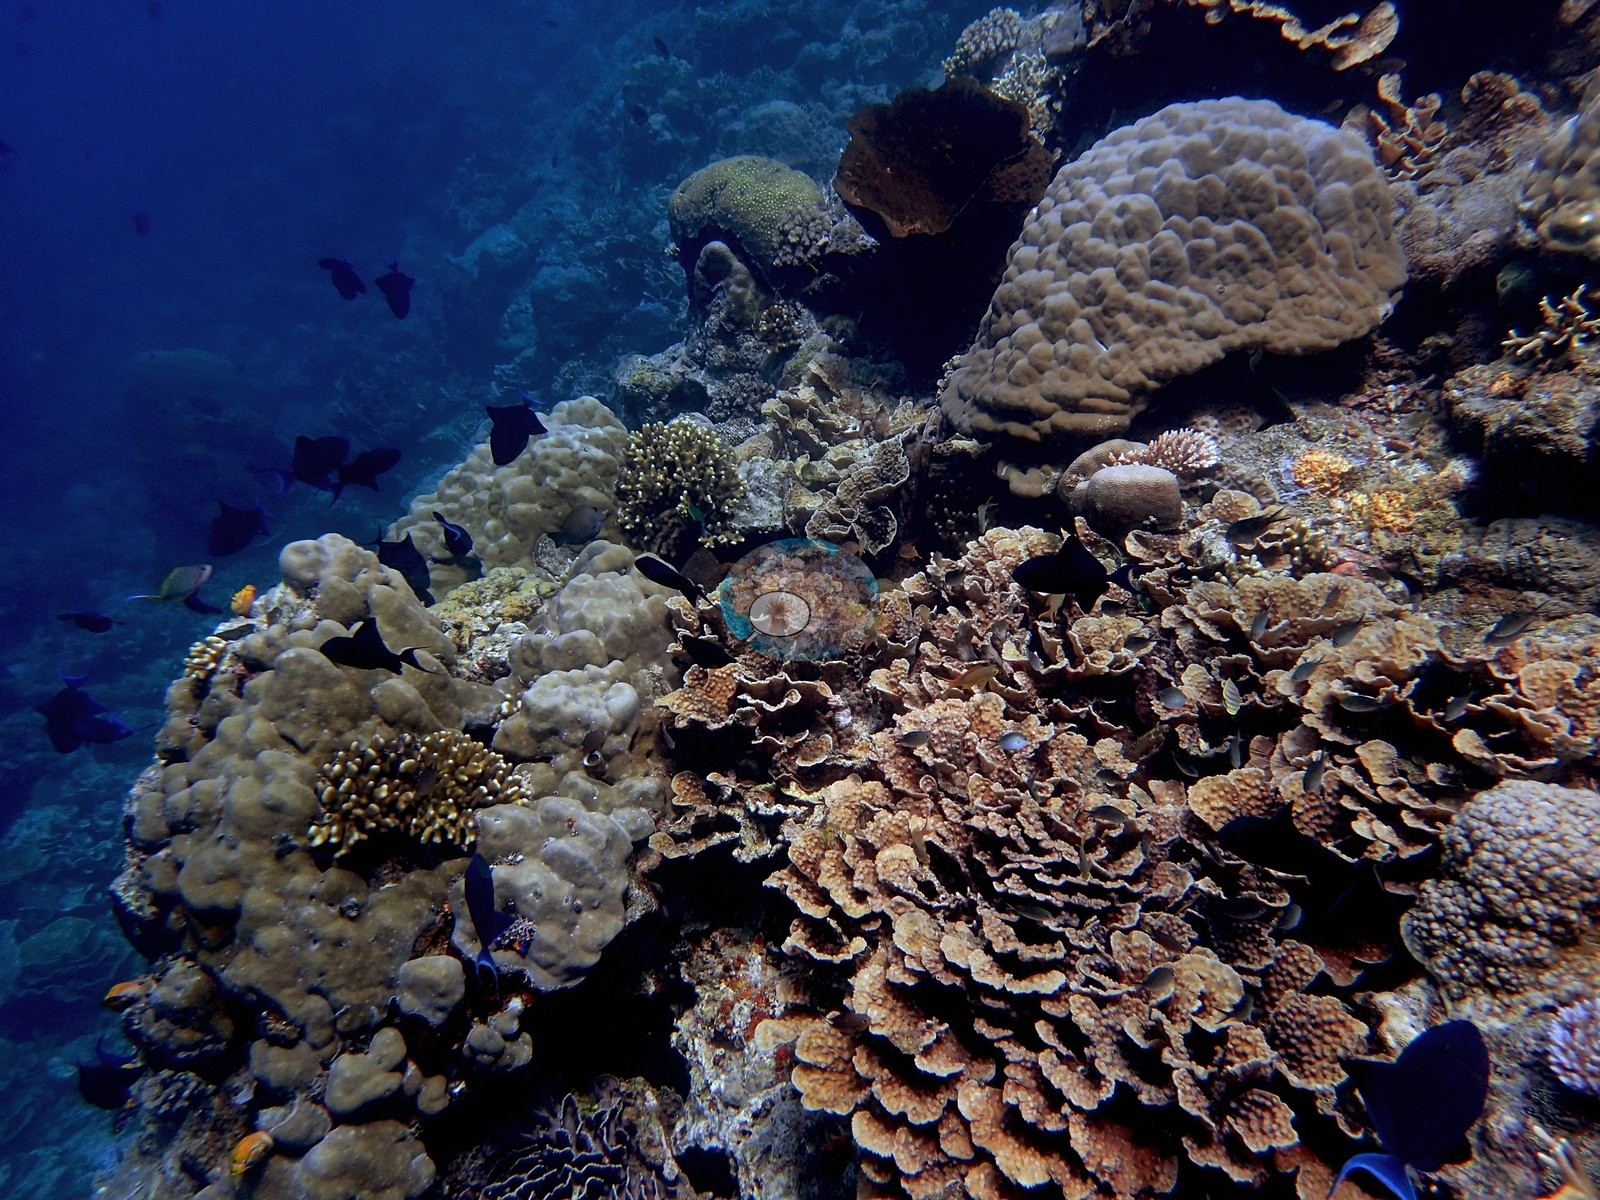
A foliose plate garden (30 frames) of Turbinaria, foliose Montipora, and Pachyseris fills the gullies, including the lava channel the site is named for, which now carries essentially complete plate-coral cover (e.g., Image 3, Image 9, Image 10, Image 13, Image 14).
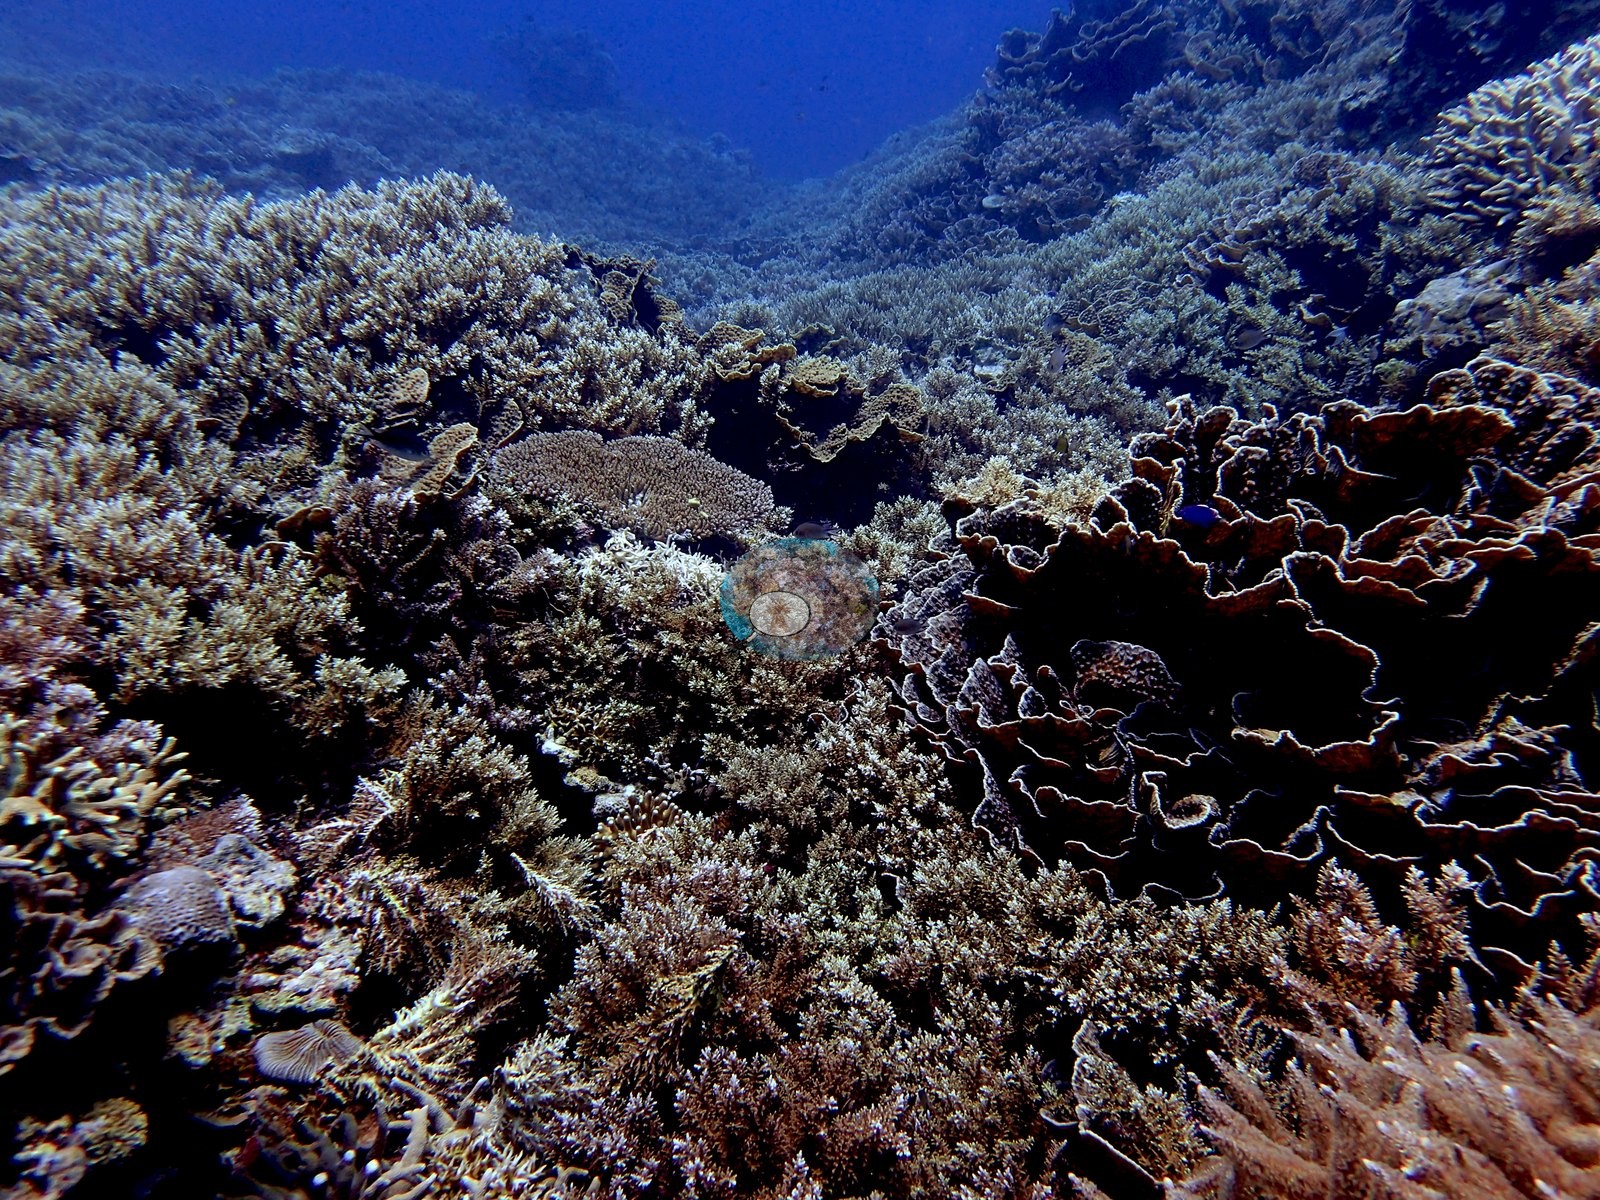
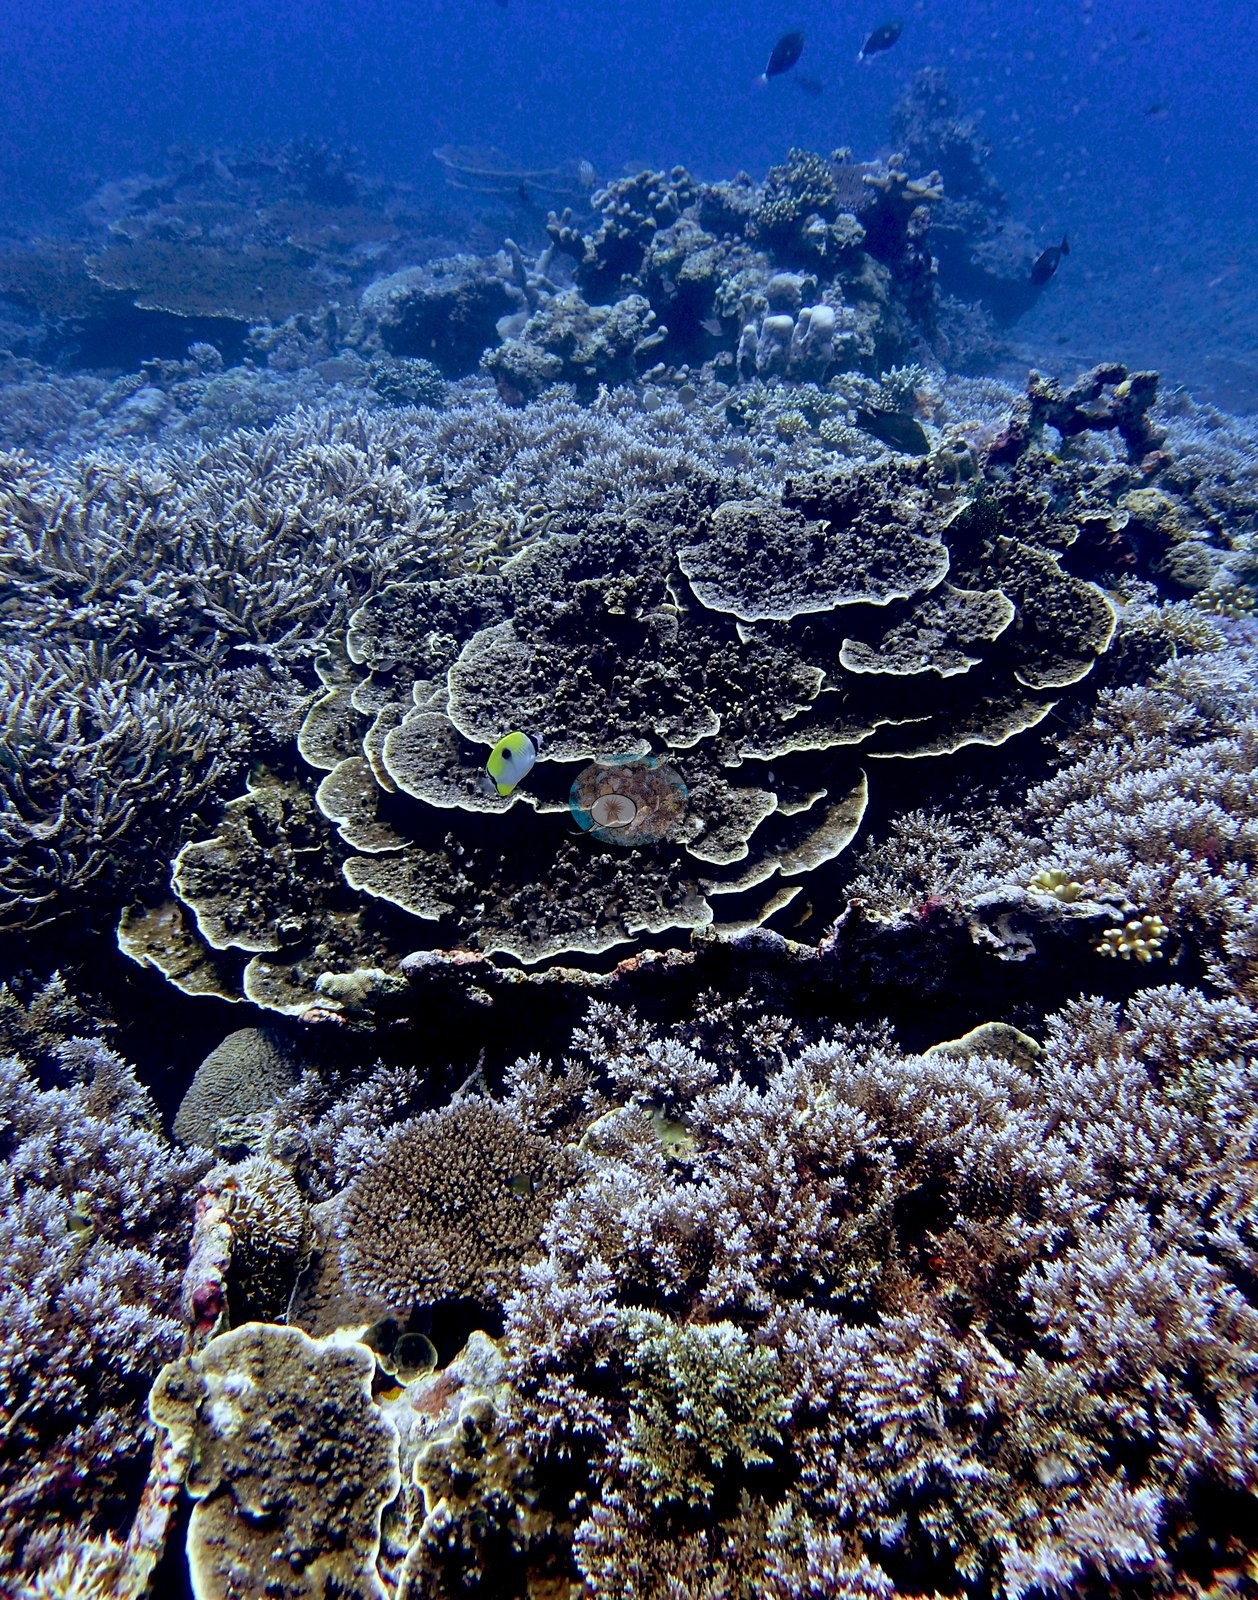
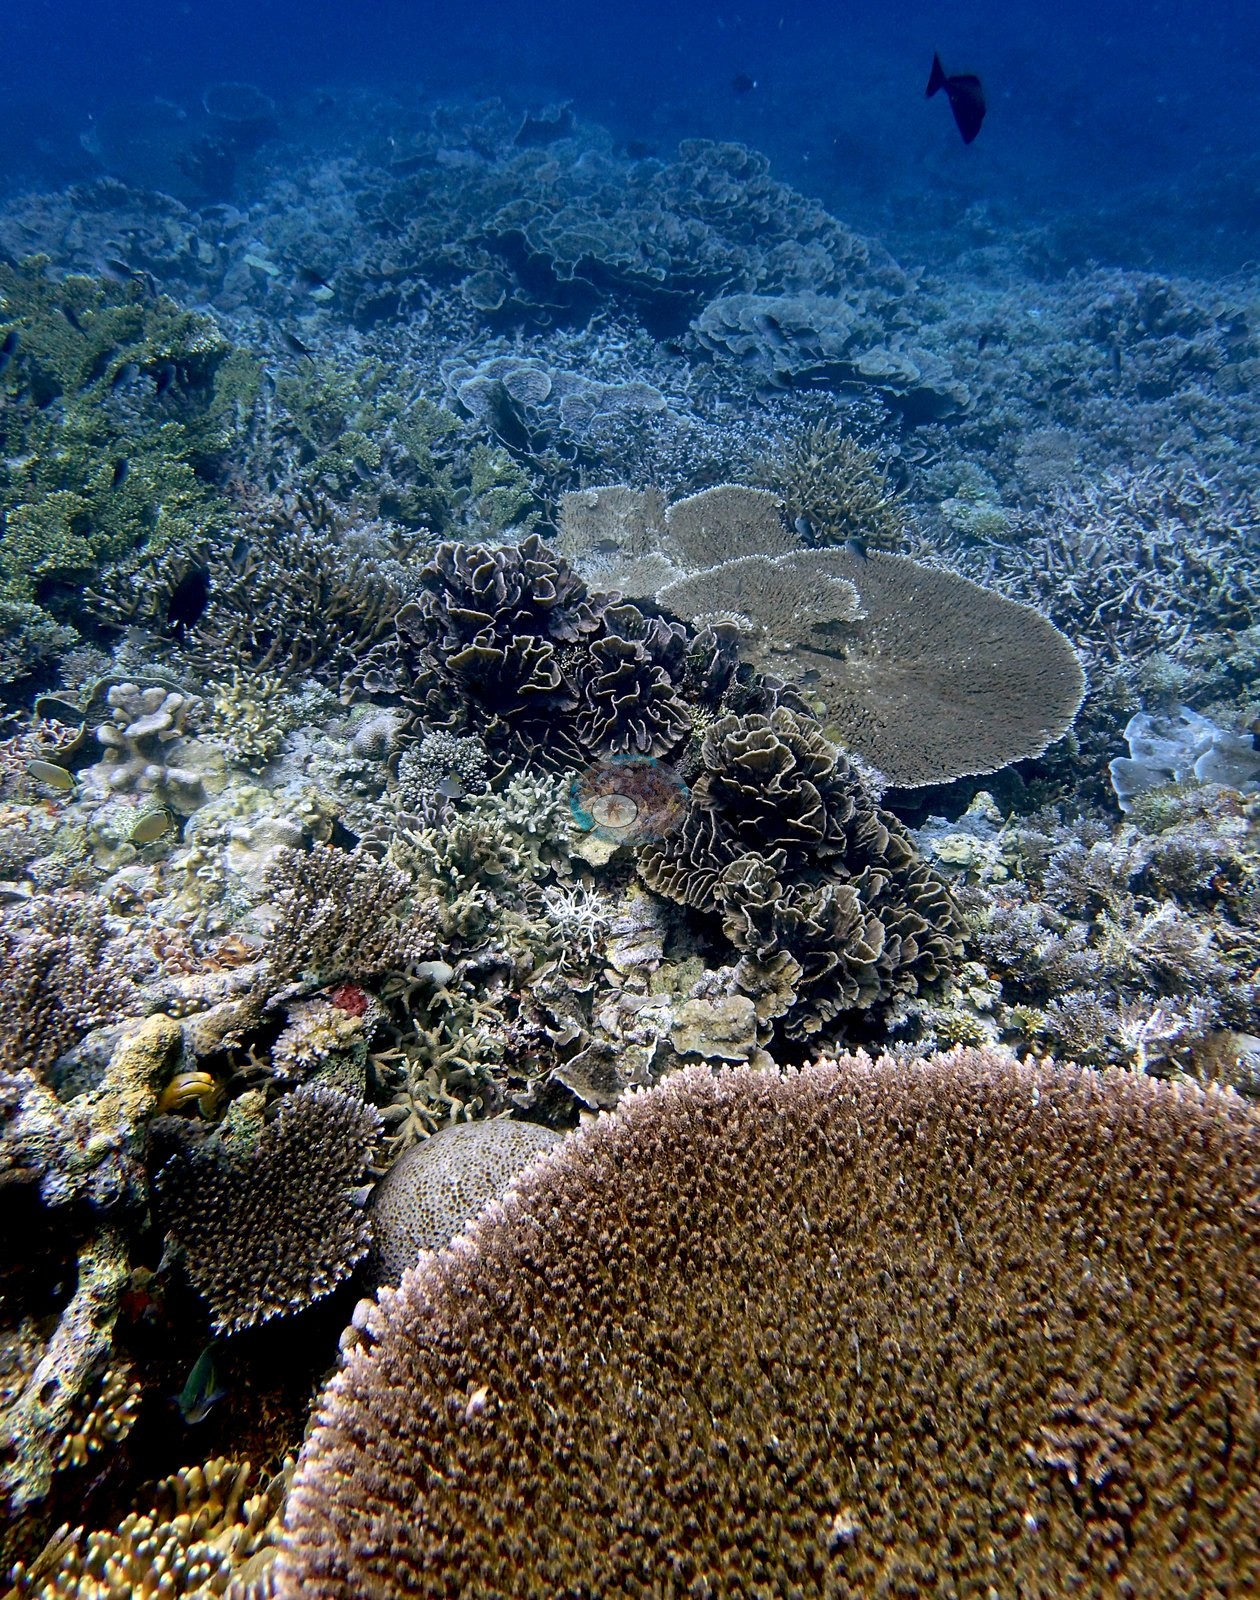
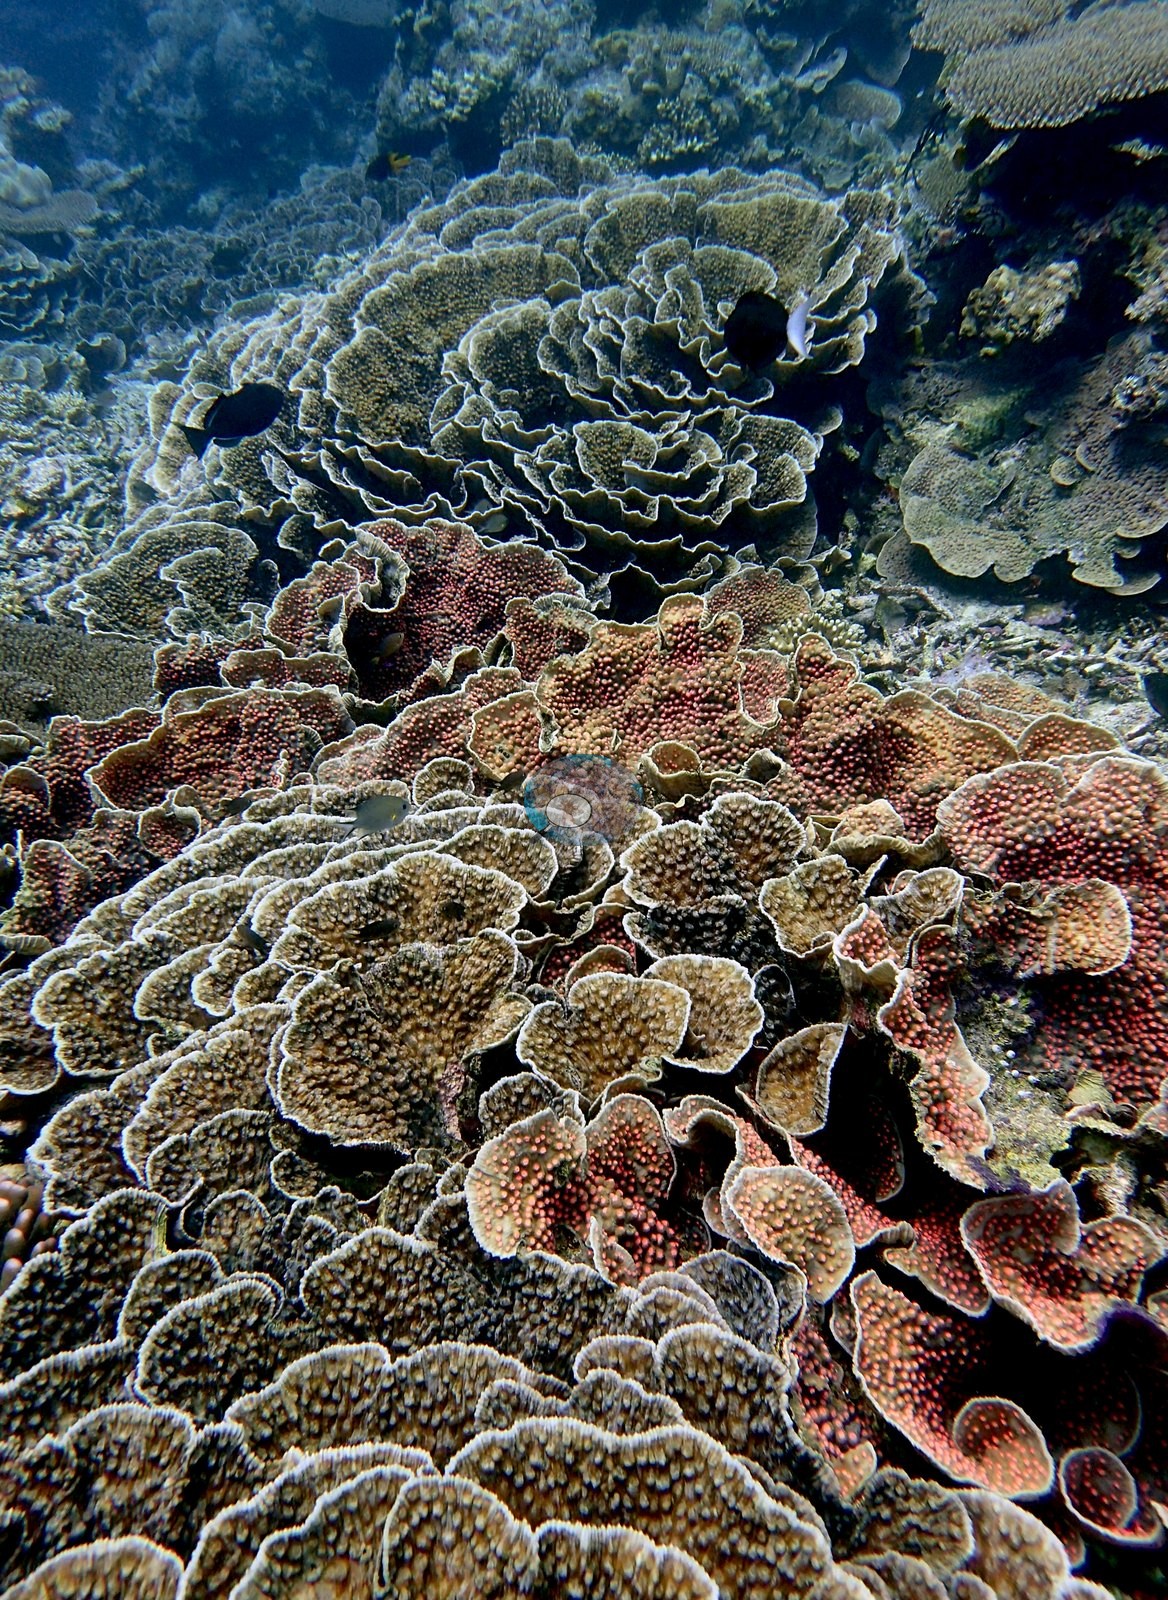
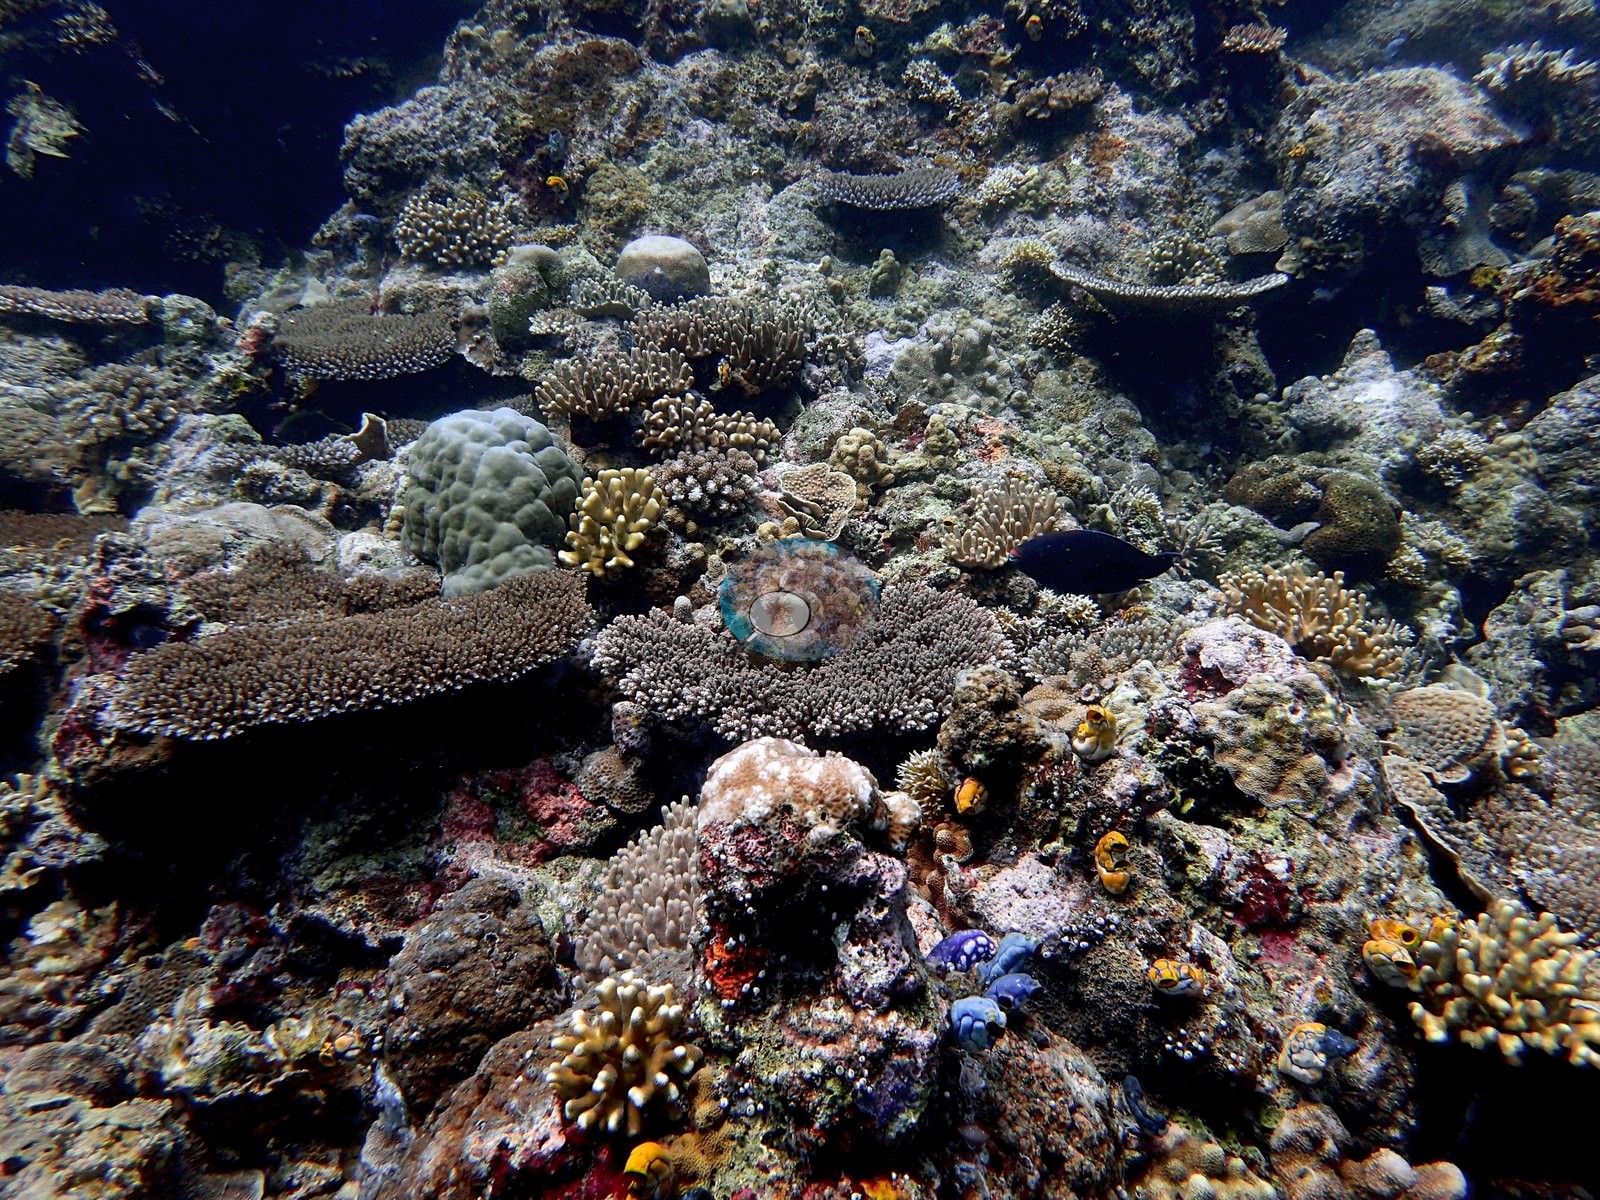
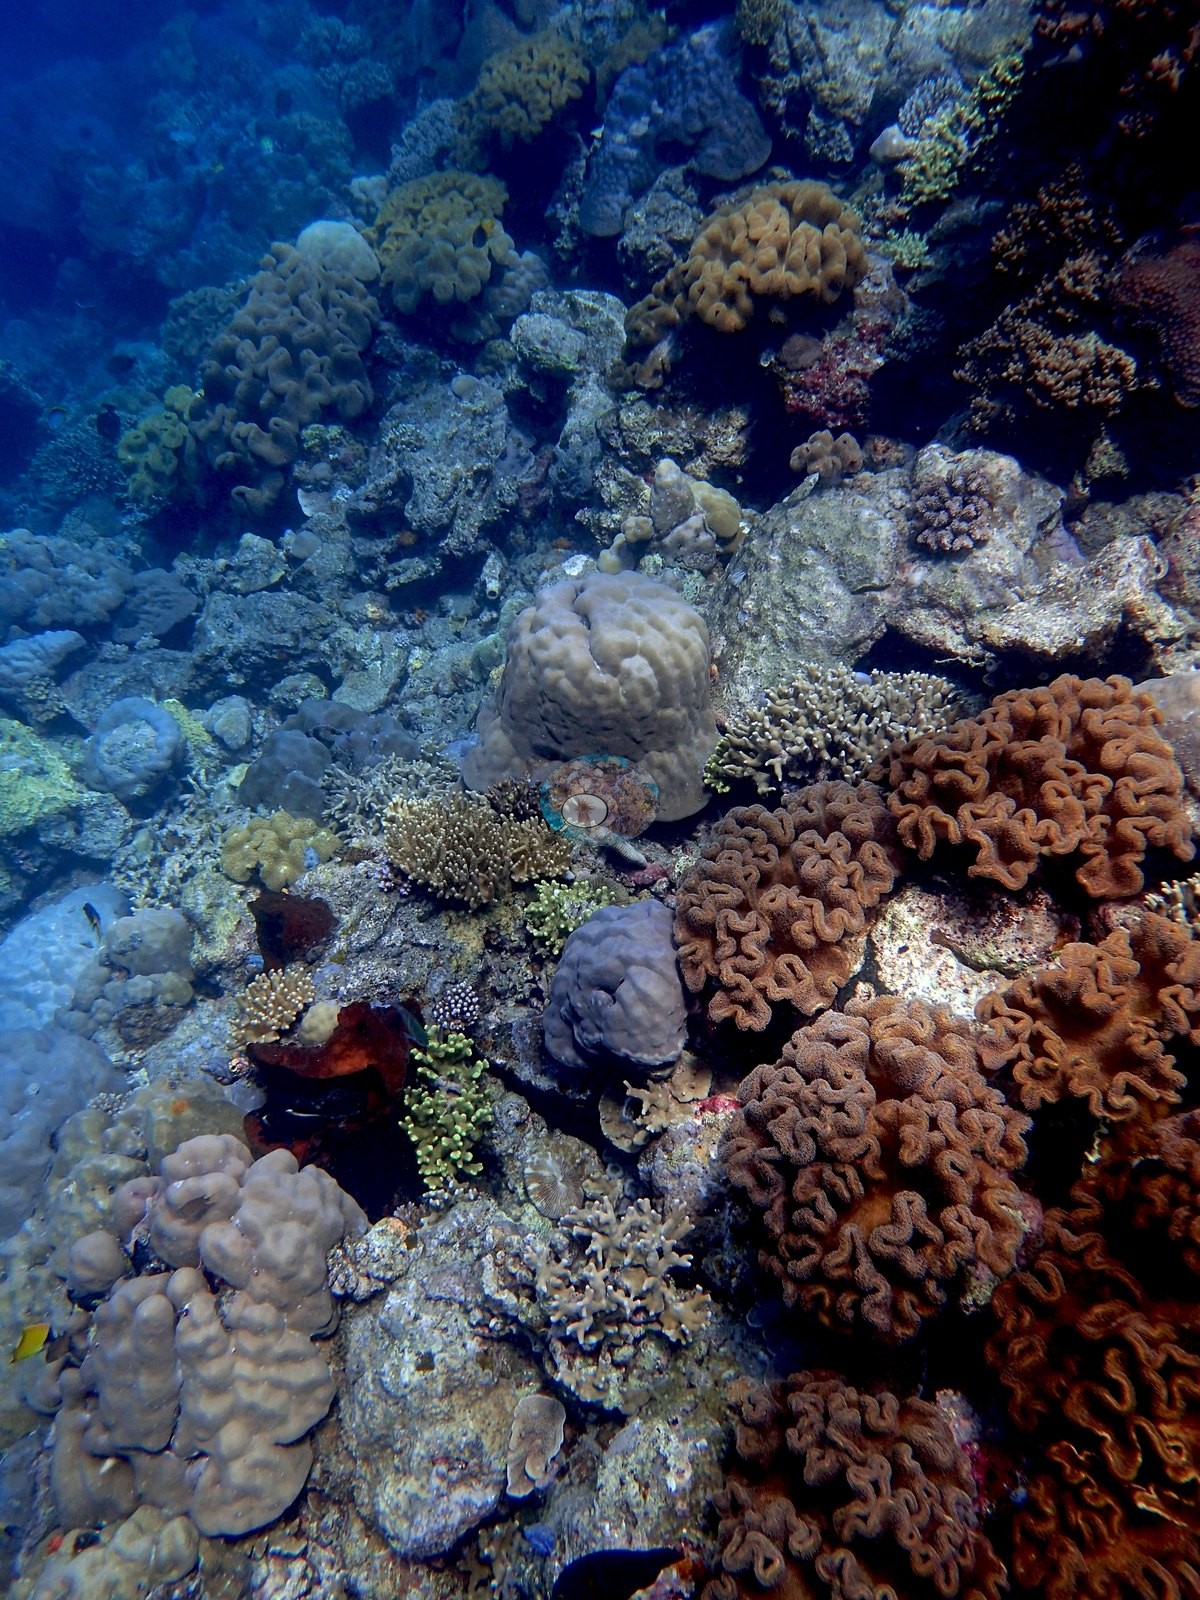
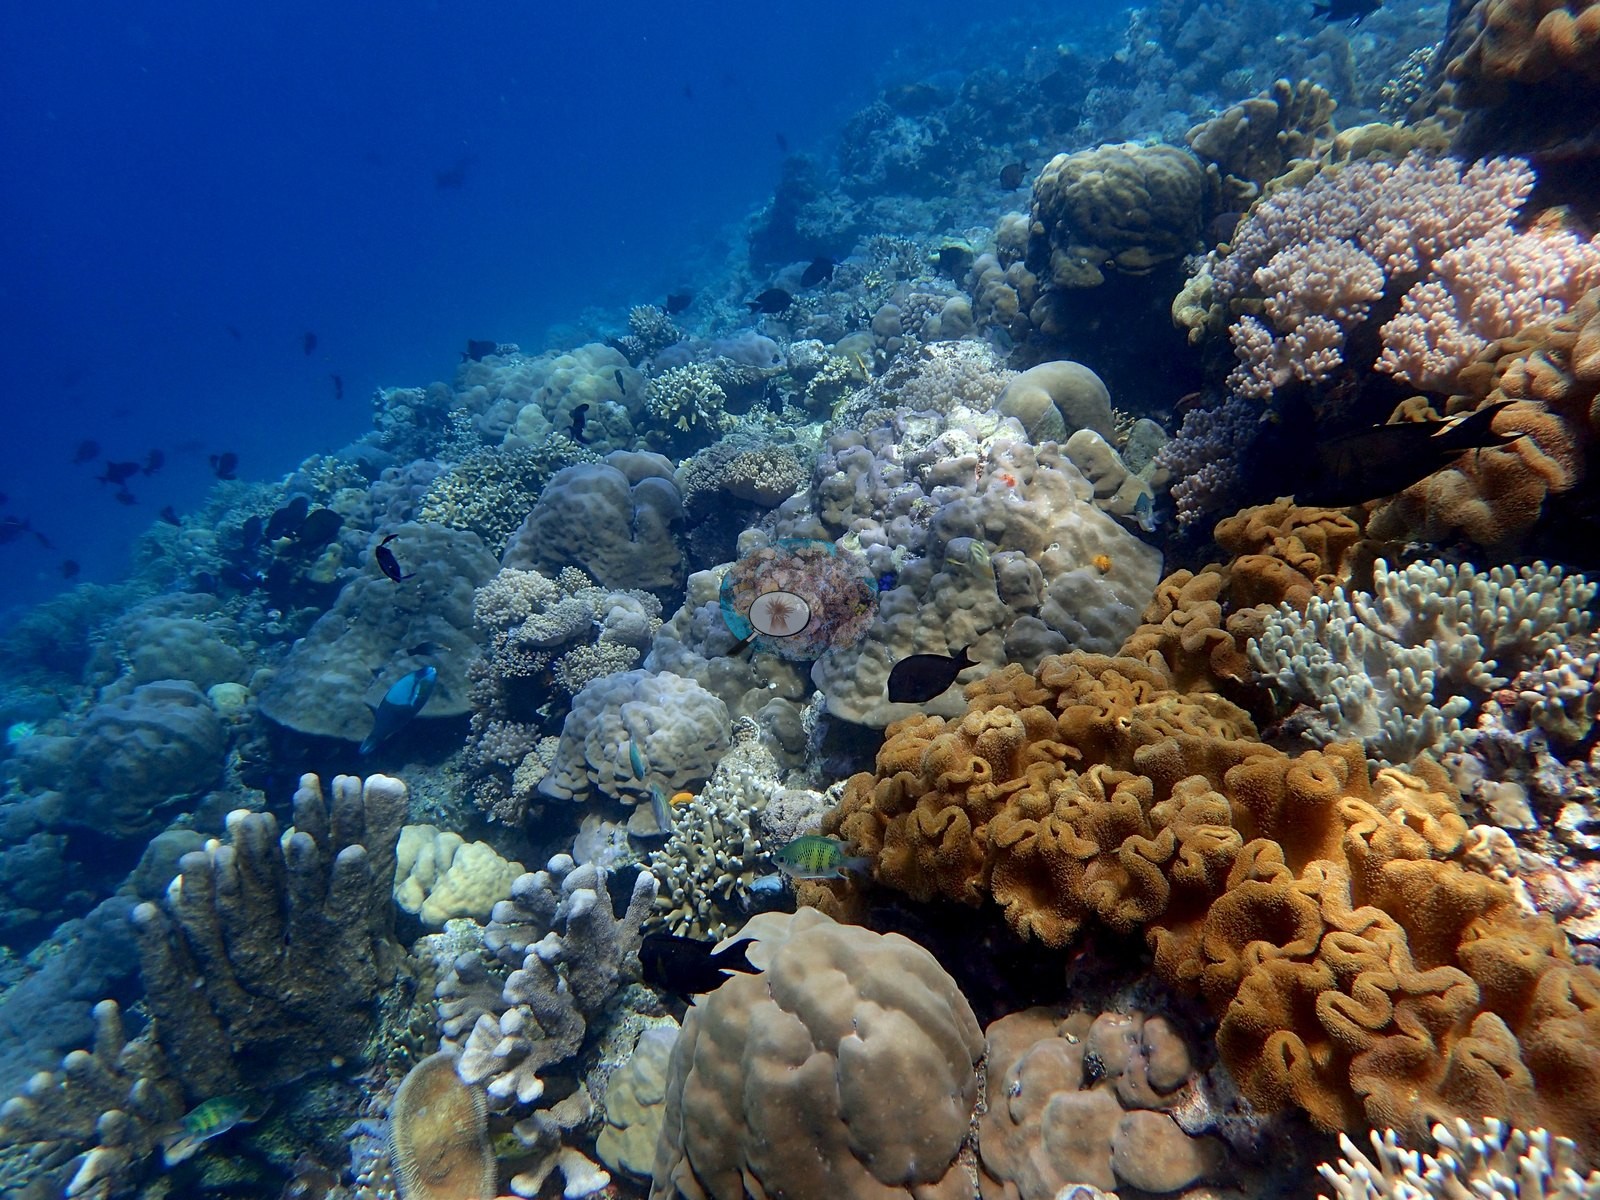
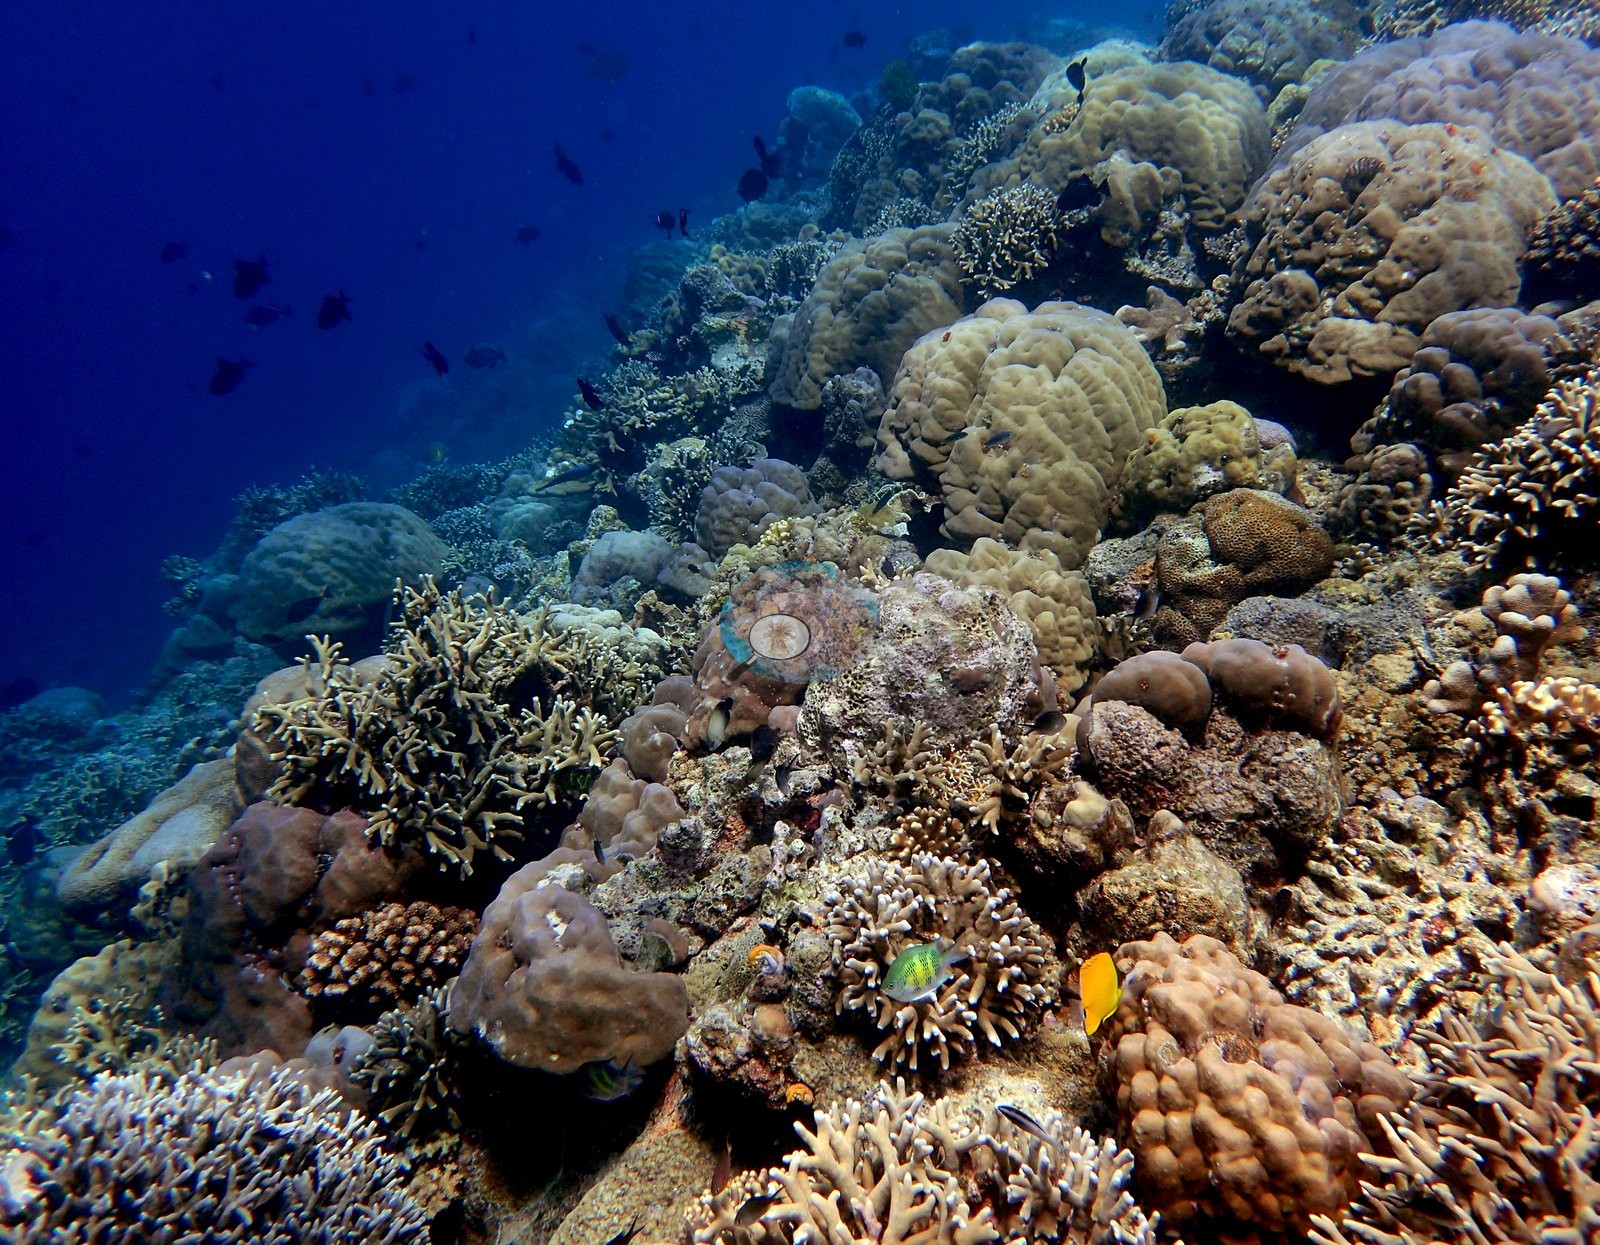
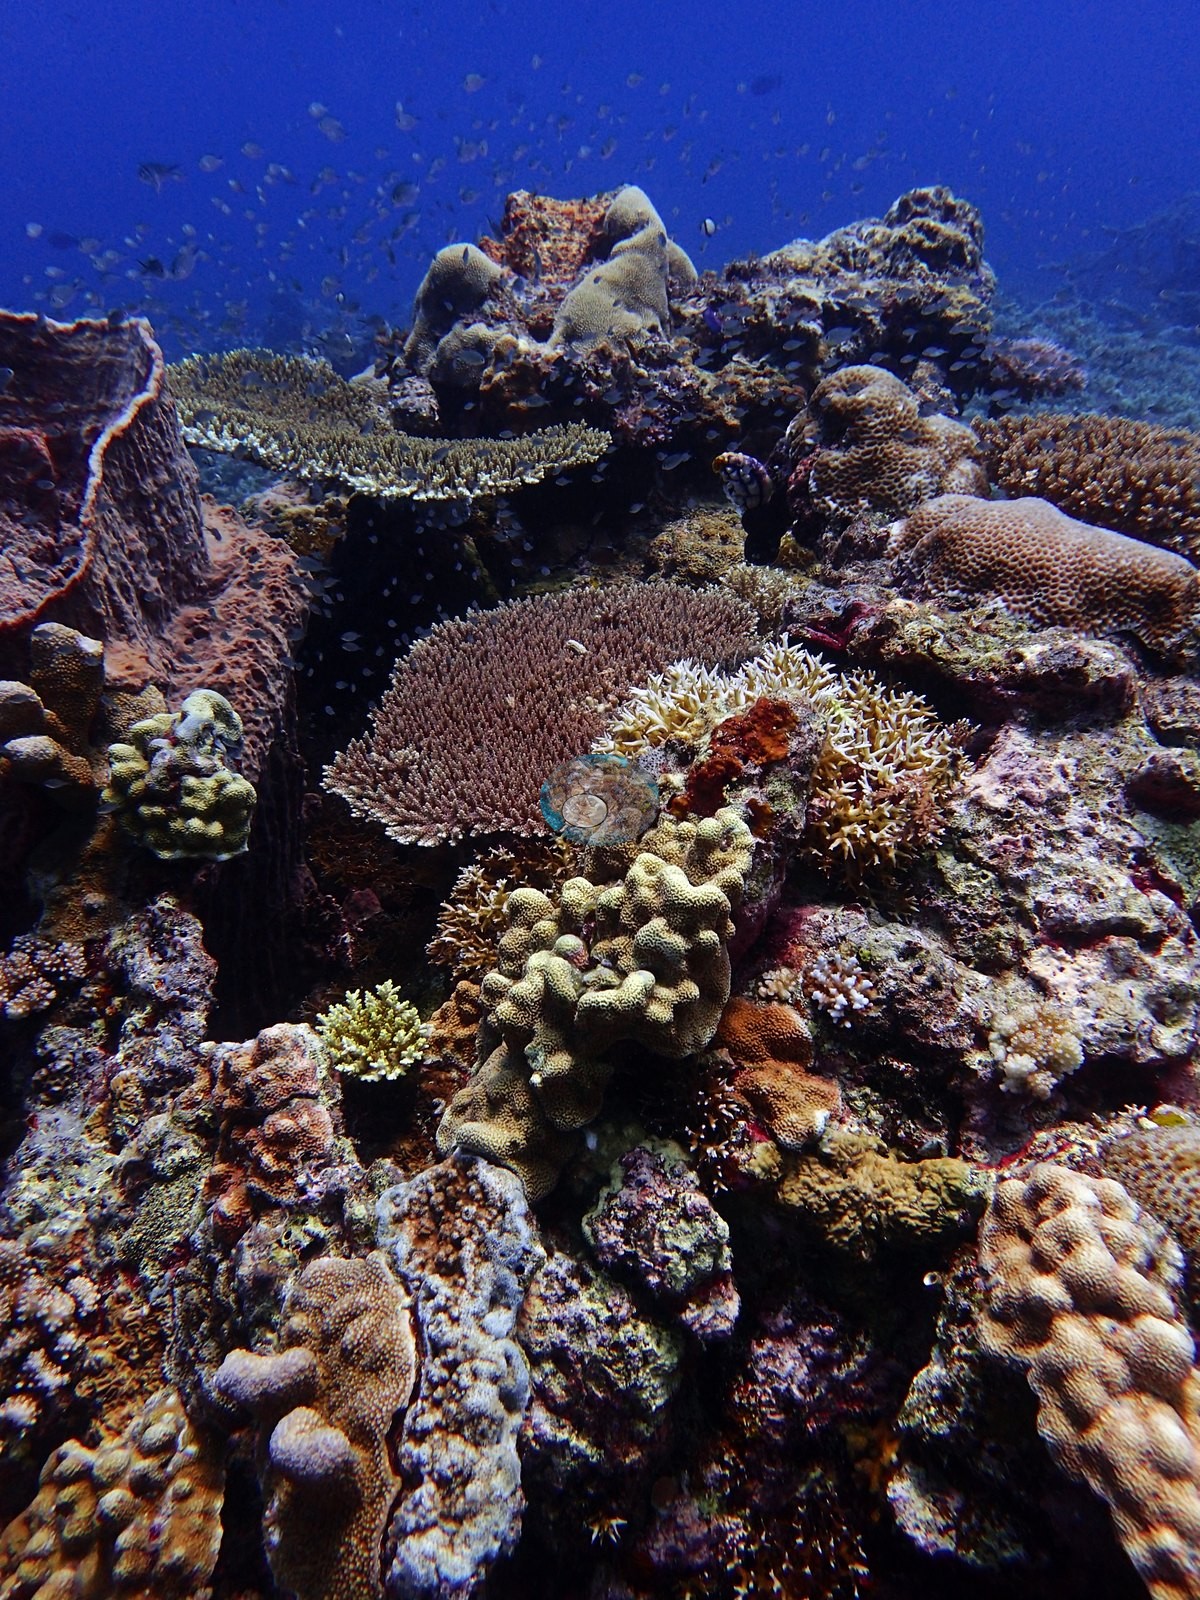
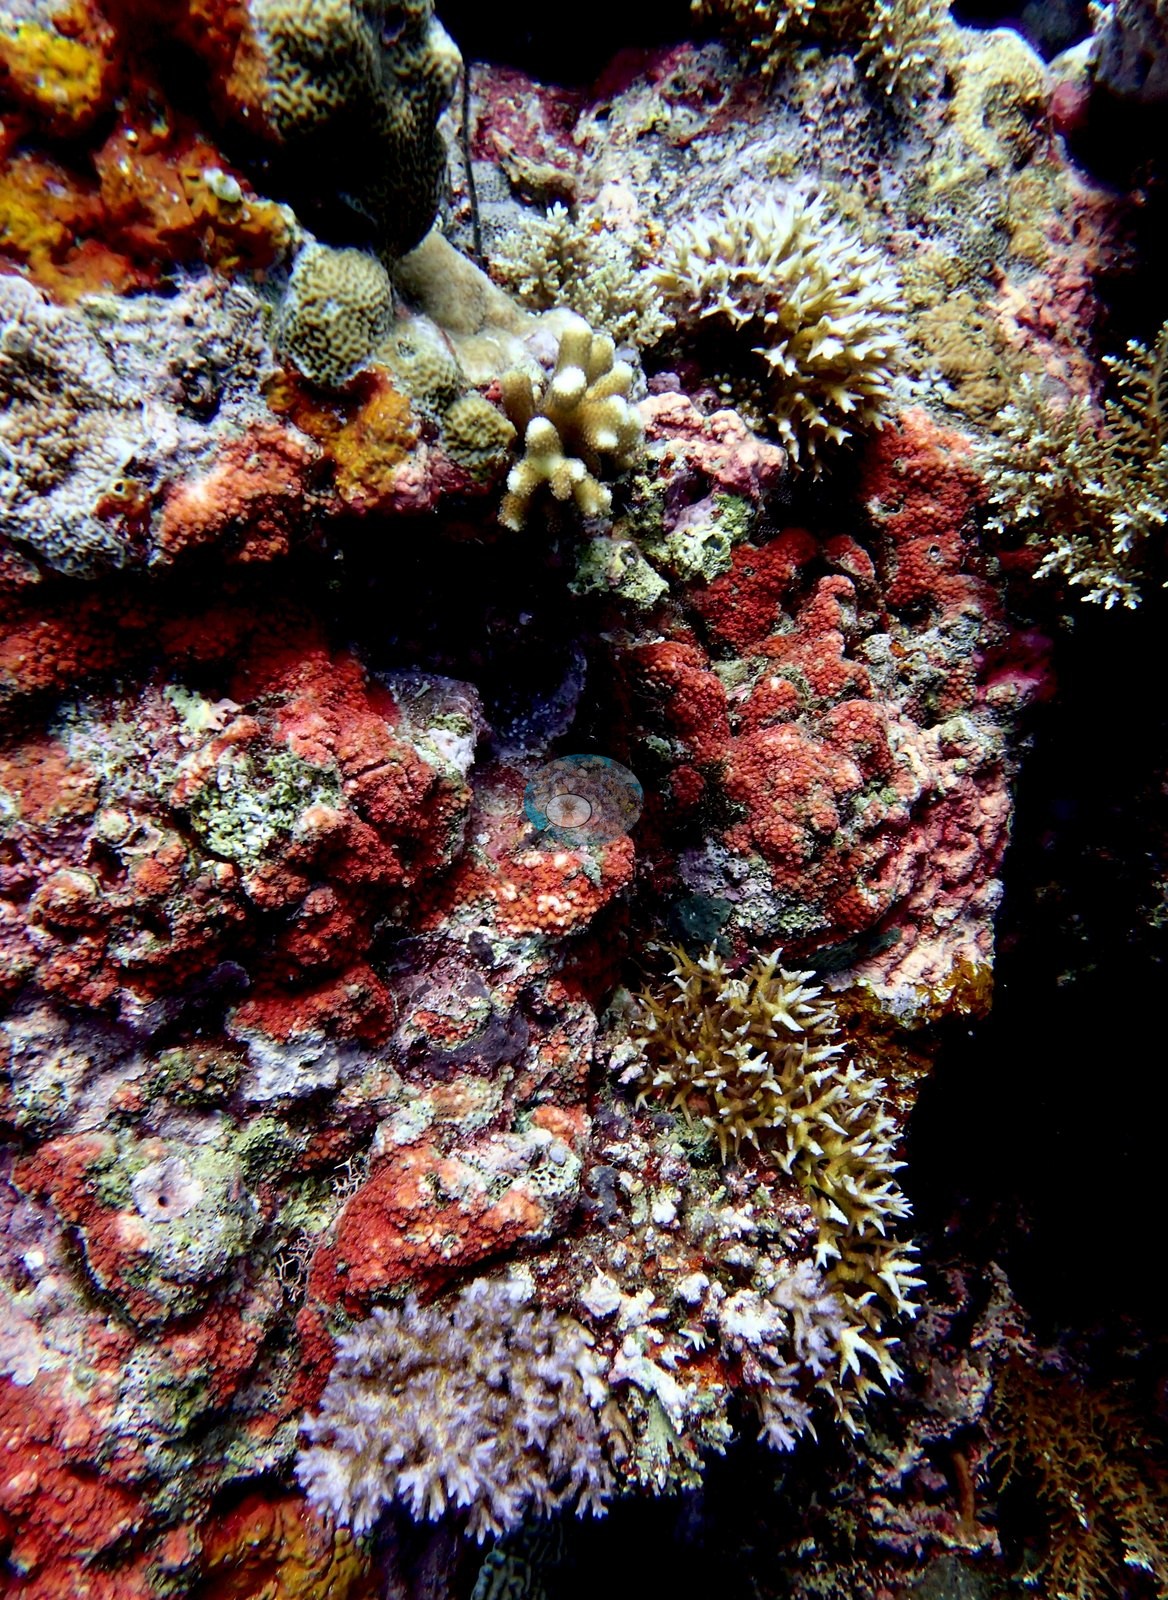
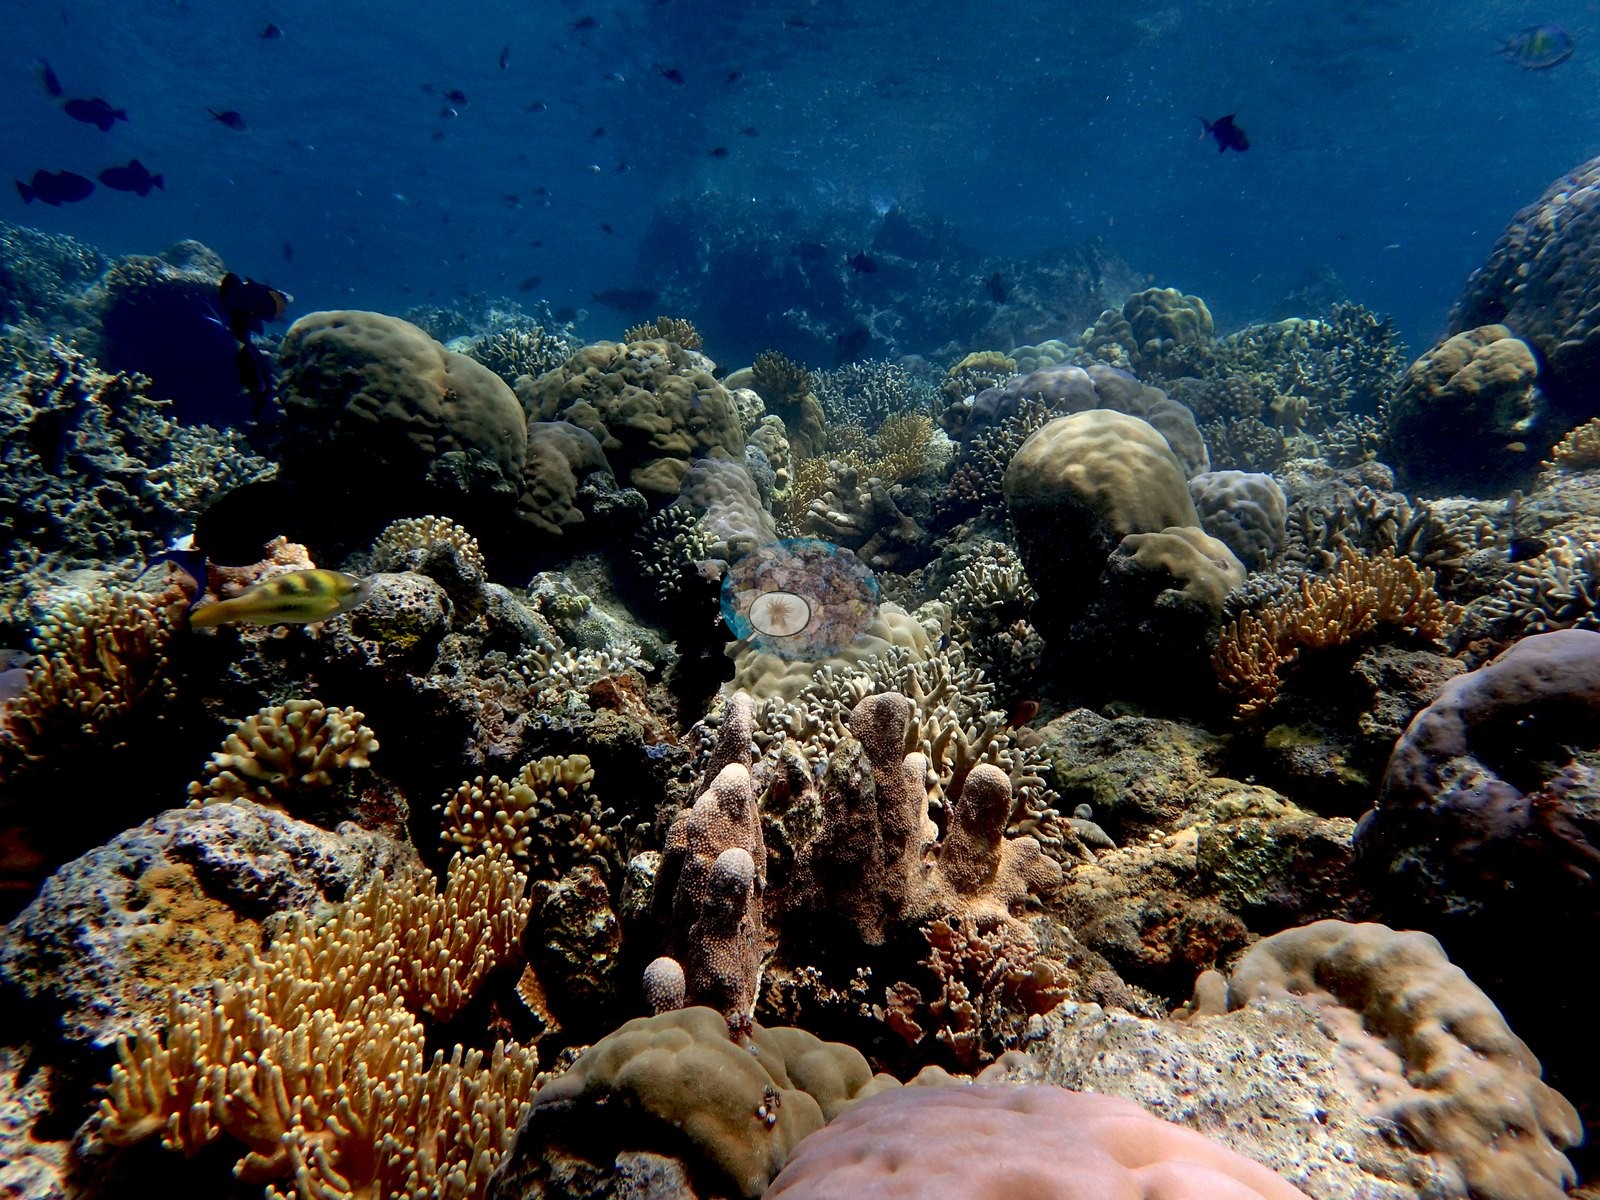
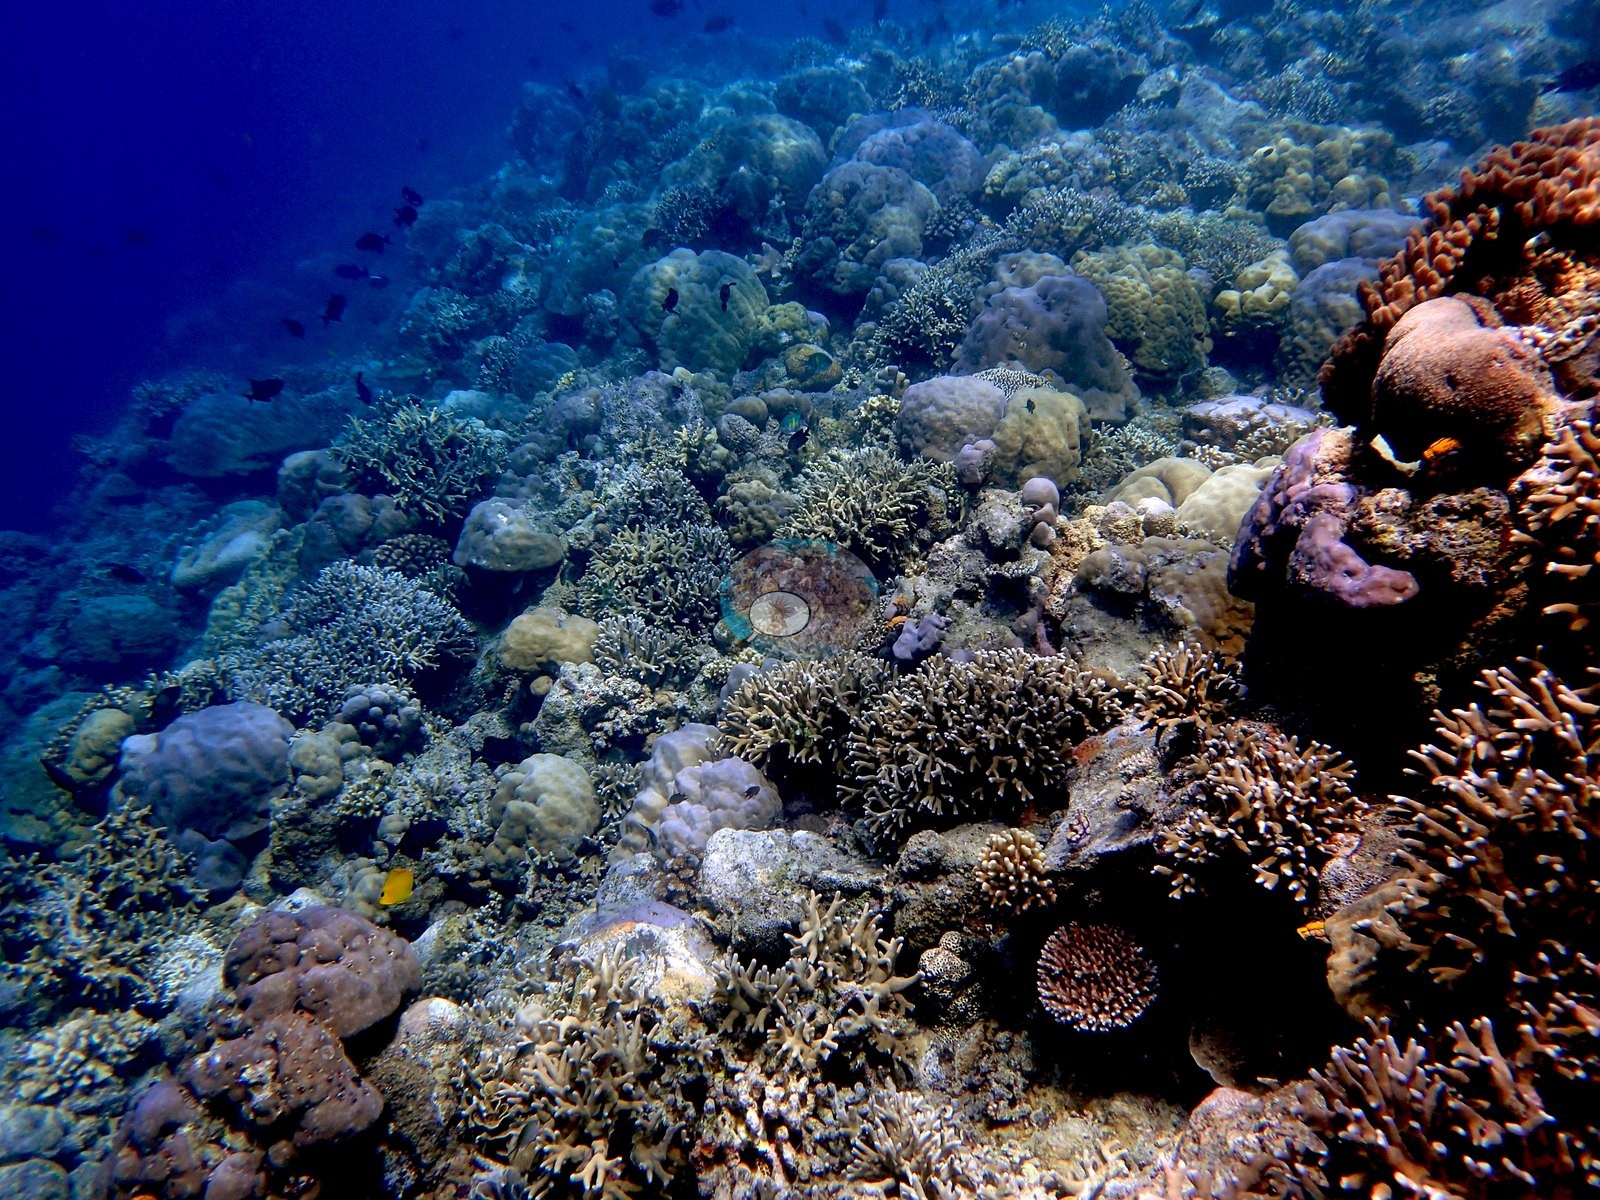
A genus-rich pavement and drop-off mosaic (59 frames) adds massive and columnar Porites, Pocillopora, Seriatopora, Stylophora, Goniopora-type colonies with extended polyps, meandroid Platygyra/Leptoria brains, and fungiids, with blue, and yellow colonial ascidians, black coral bushes, crinoids, and encrusting sponges through it — 20-plus hard coral genera (e.g., Image 6, Image 16, Image 17, Image 18, Image 19, Image 20, Image 21).
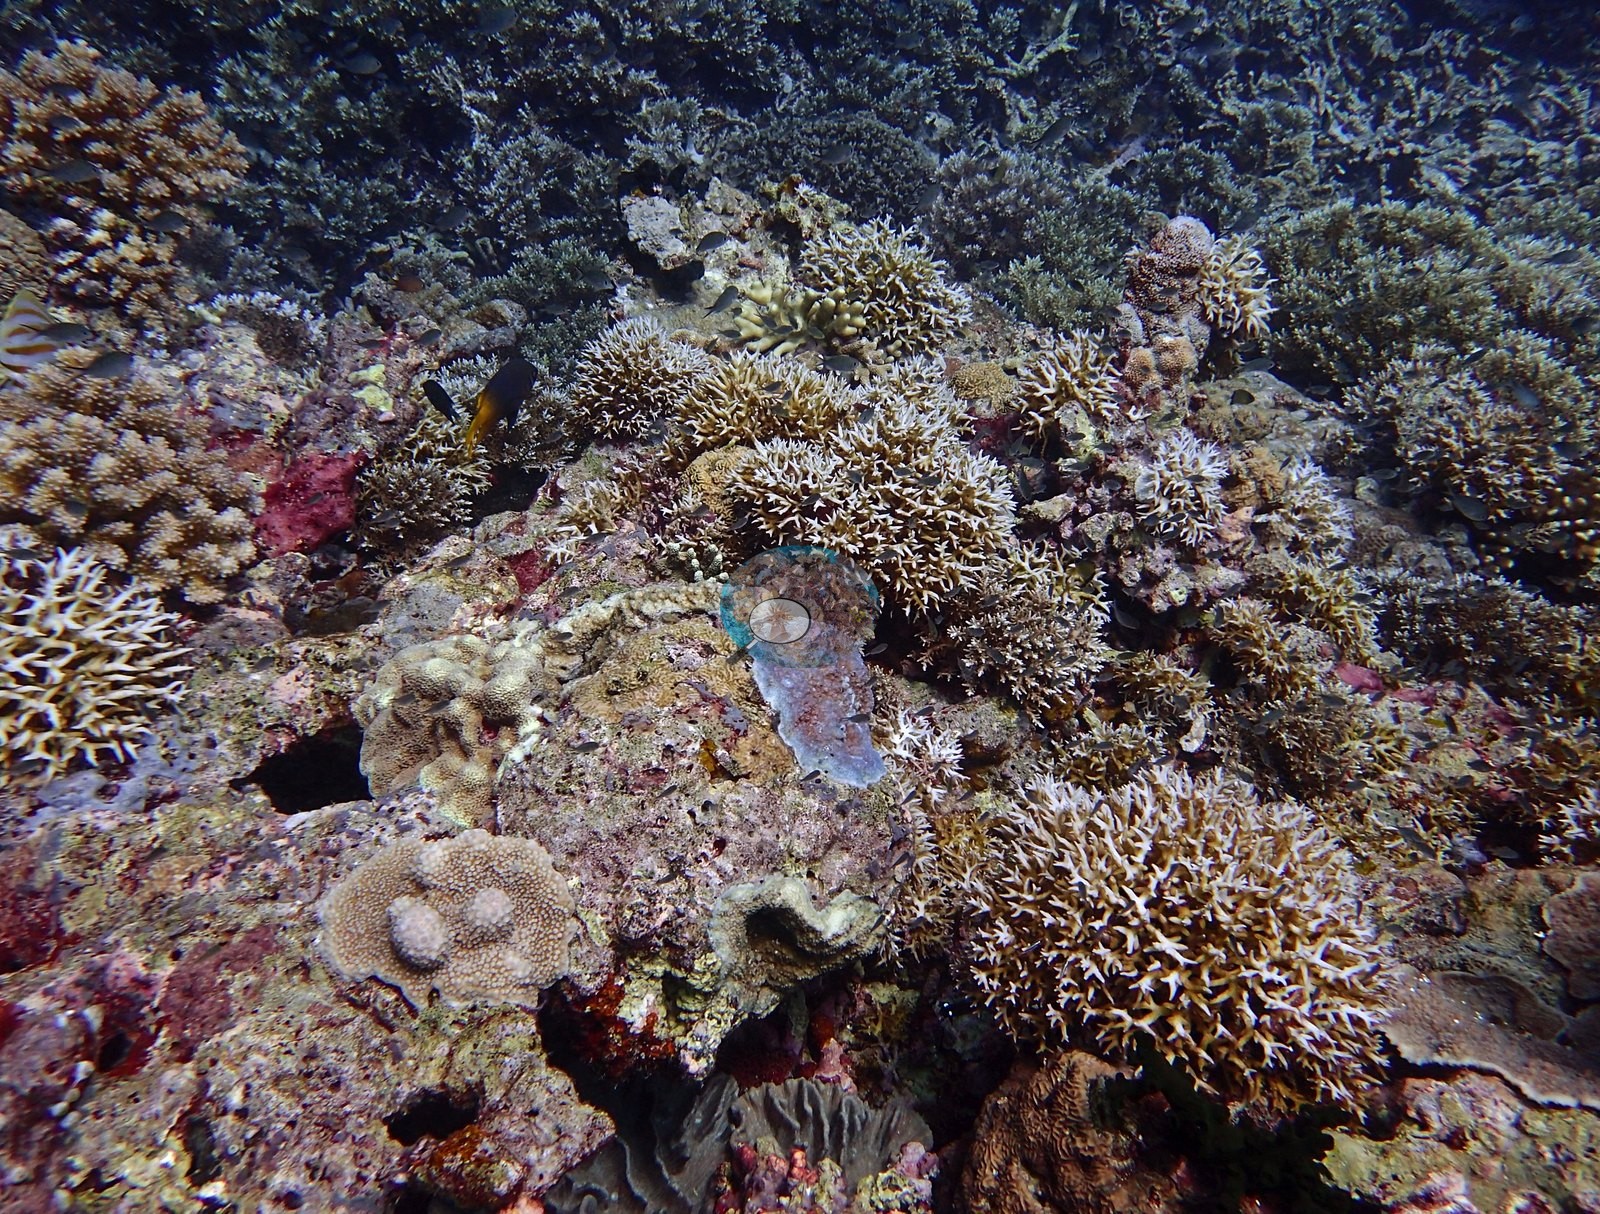
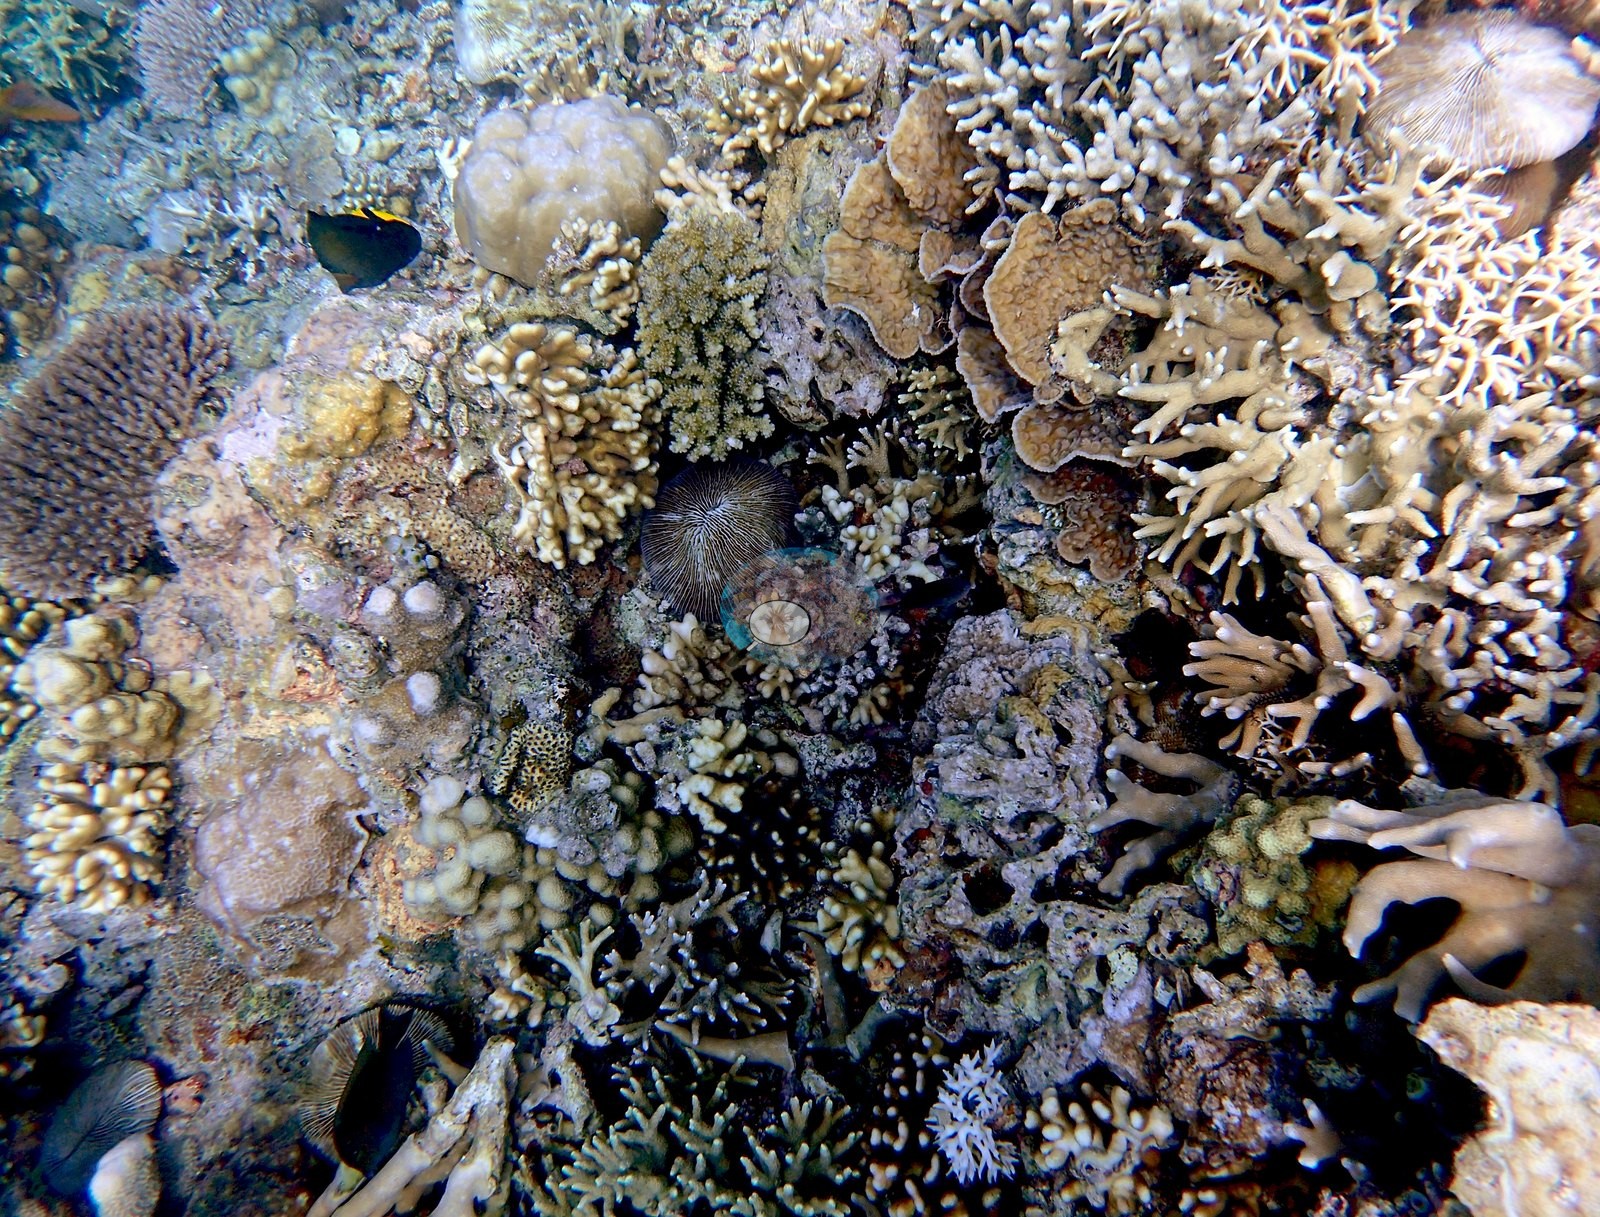
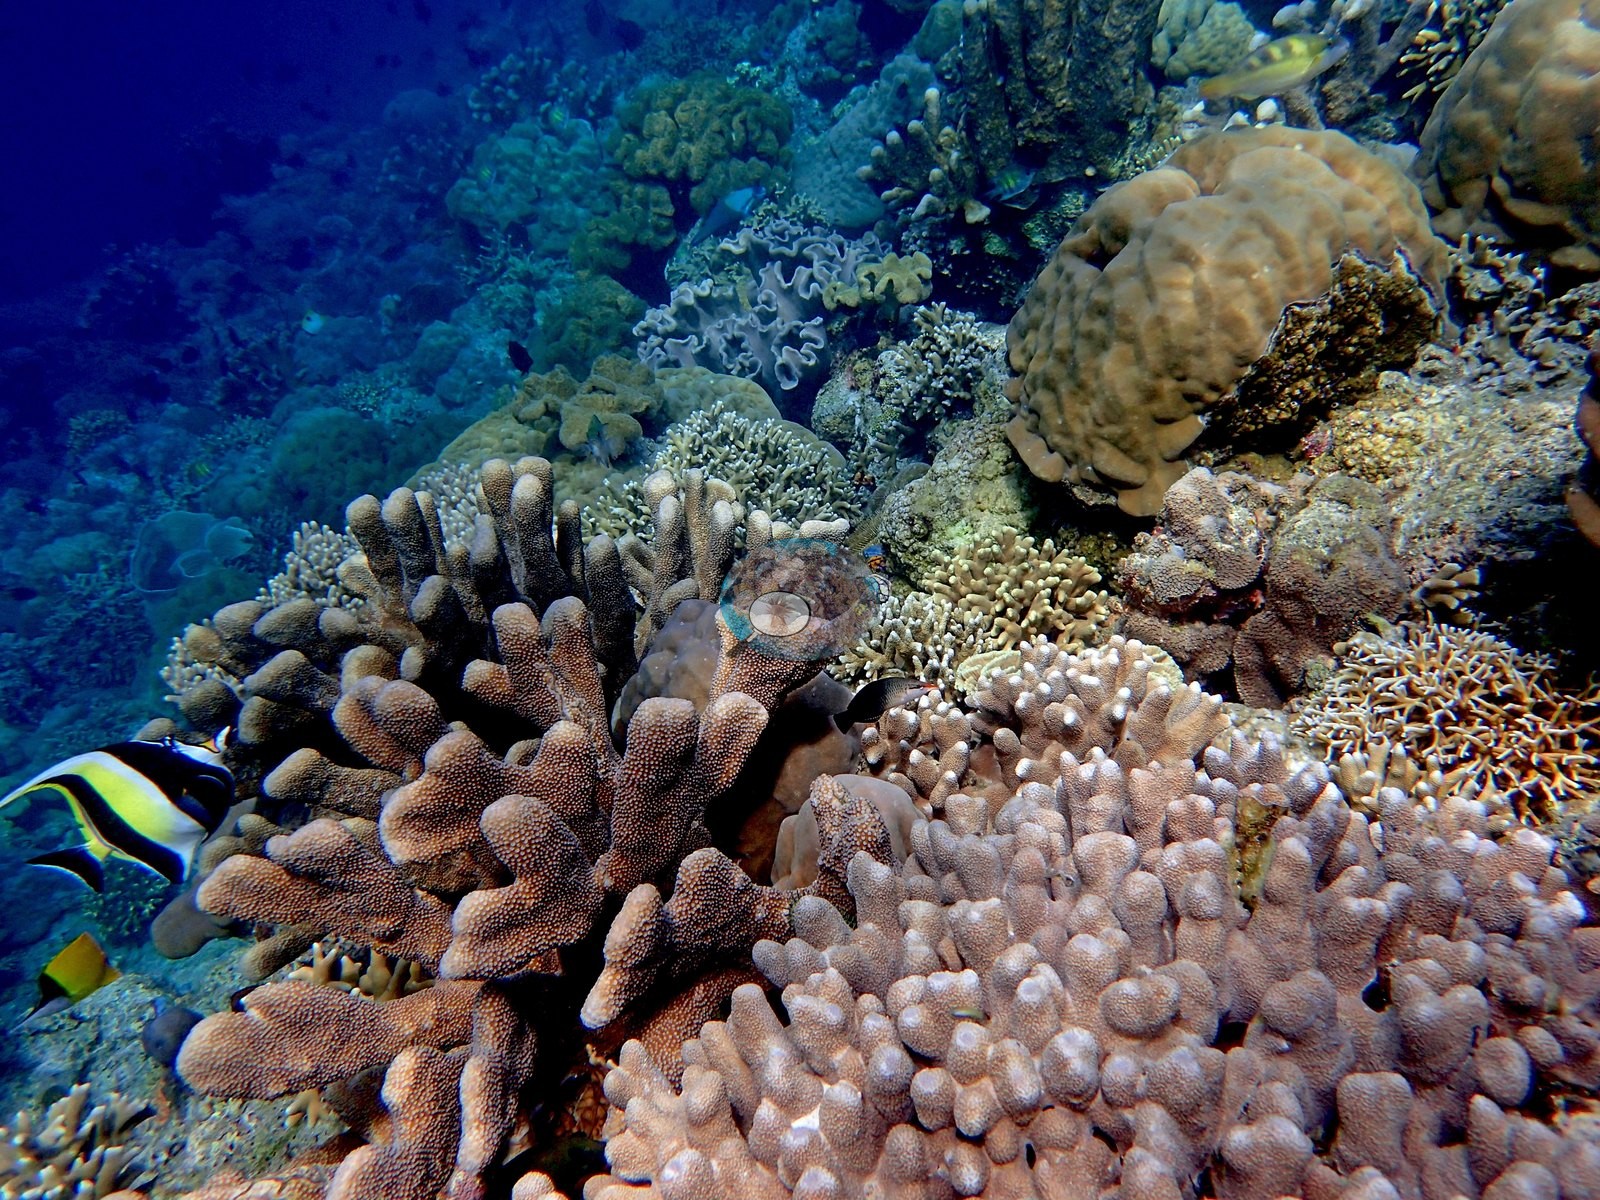
A soft-coral garden of bushy Sinularia/Litophyton-type colonies (6 frames), the shallow crest (7), cryptic overhangs (5), and bare basalt shallows (4) complete it. That basalt is angular, unbroken bedrock and boulder with crustose coralline and sparse small recruits — young lava, not dead reef, and deliberately distinguished from the mortality ground.
Coral cover
Coral cover: 55% — a blind Claude computer-vision point count of 190 of Anderson's edited photographs (20 points per photo; water, fish, and obstructions excluded). Other computer-vision methods are listed in the method table. Anderson is still comparing computer-vision models, and these figures will be updated as the methods improve.
Stressors
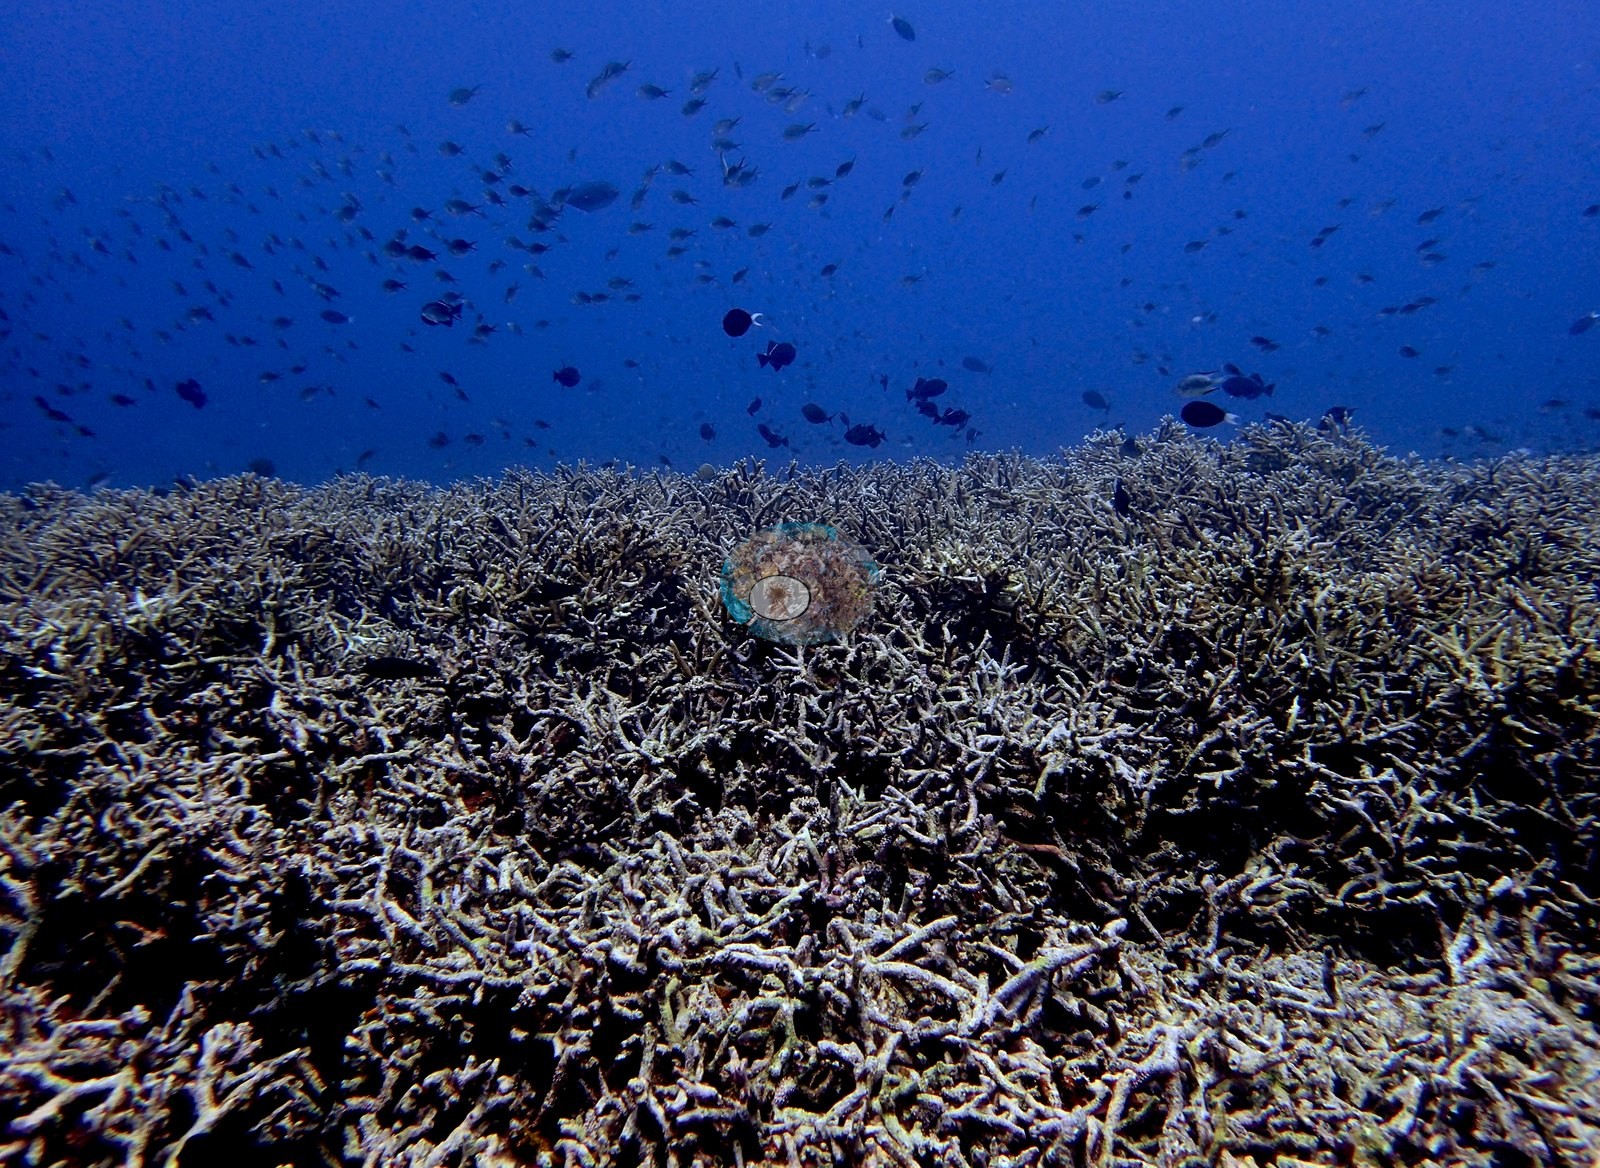
Condition. Eleven frames are primary recent-mortality ground: broad fields of disarticulated Acropora branch rubble and standing dead staghorn still in growth position under algal turf, with damselfish over it (e.g., Image 11).
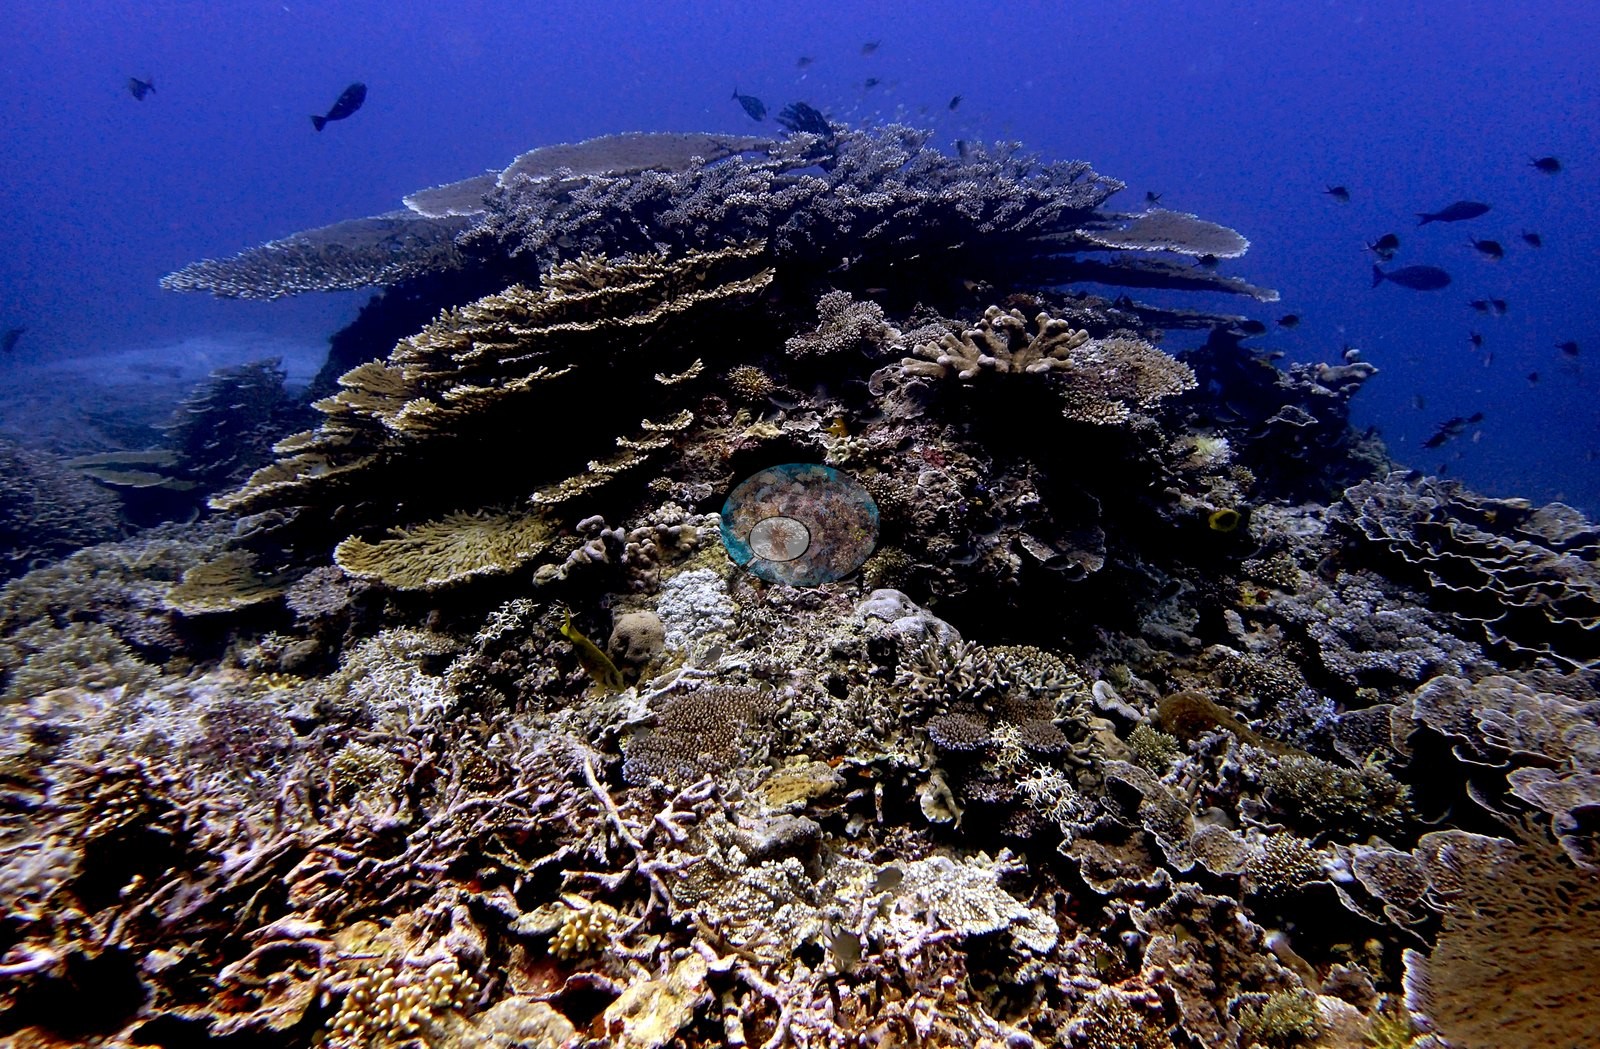
Eighteen frames carry stark-white colonies among pigmented neighbors — low-level, colony-scale bleaching in Acropora, Pocillopora acuta-type, Seriatopora, and massive Porites, not a reef-wide event. One plating colony carries unambiguous white parrotfish bite scars. No Acanthaster and no Drupella appear in any frame. The cause is not asserted: dead staghorn under turf, branch rubble, and a minority of freshly bleached colonies are consistent with recent thermal stress, physical breakage, or both, and the photographs cannot separate them.
Comparisons with other data
Roughly half the frames show living coral covering the great majority of the benthos, so the photographs sit far closer to the 2016 figure than the 2019 one; if the two reefs tracked each other at all, most of that loss came in the twelve months after this dive (e.g., Image 4, Image 5, Image 8, Image 12).
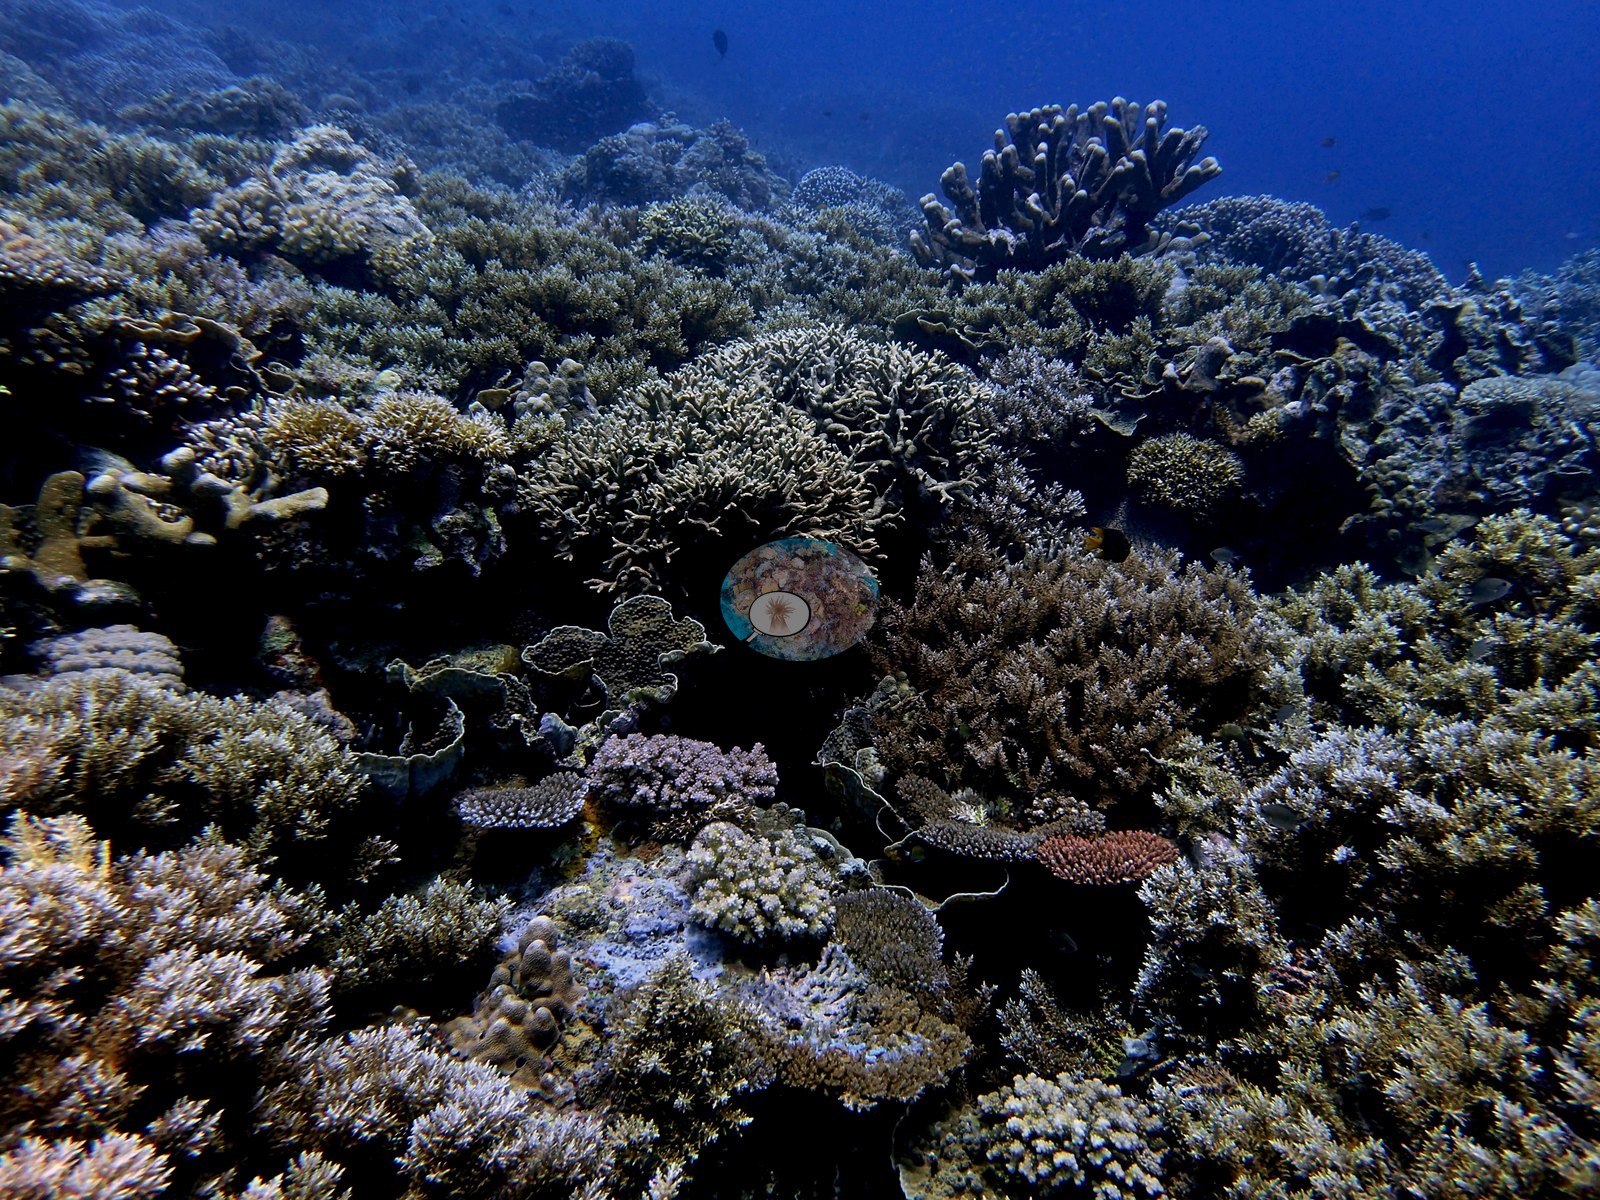
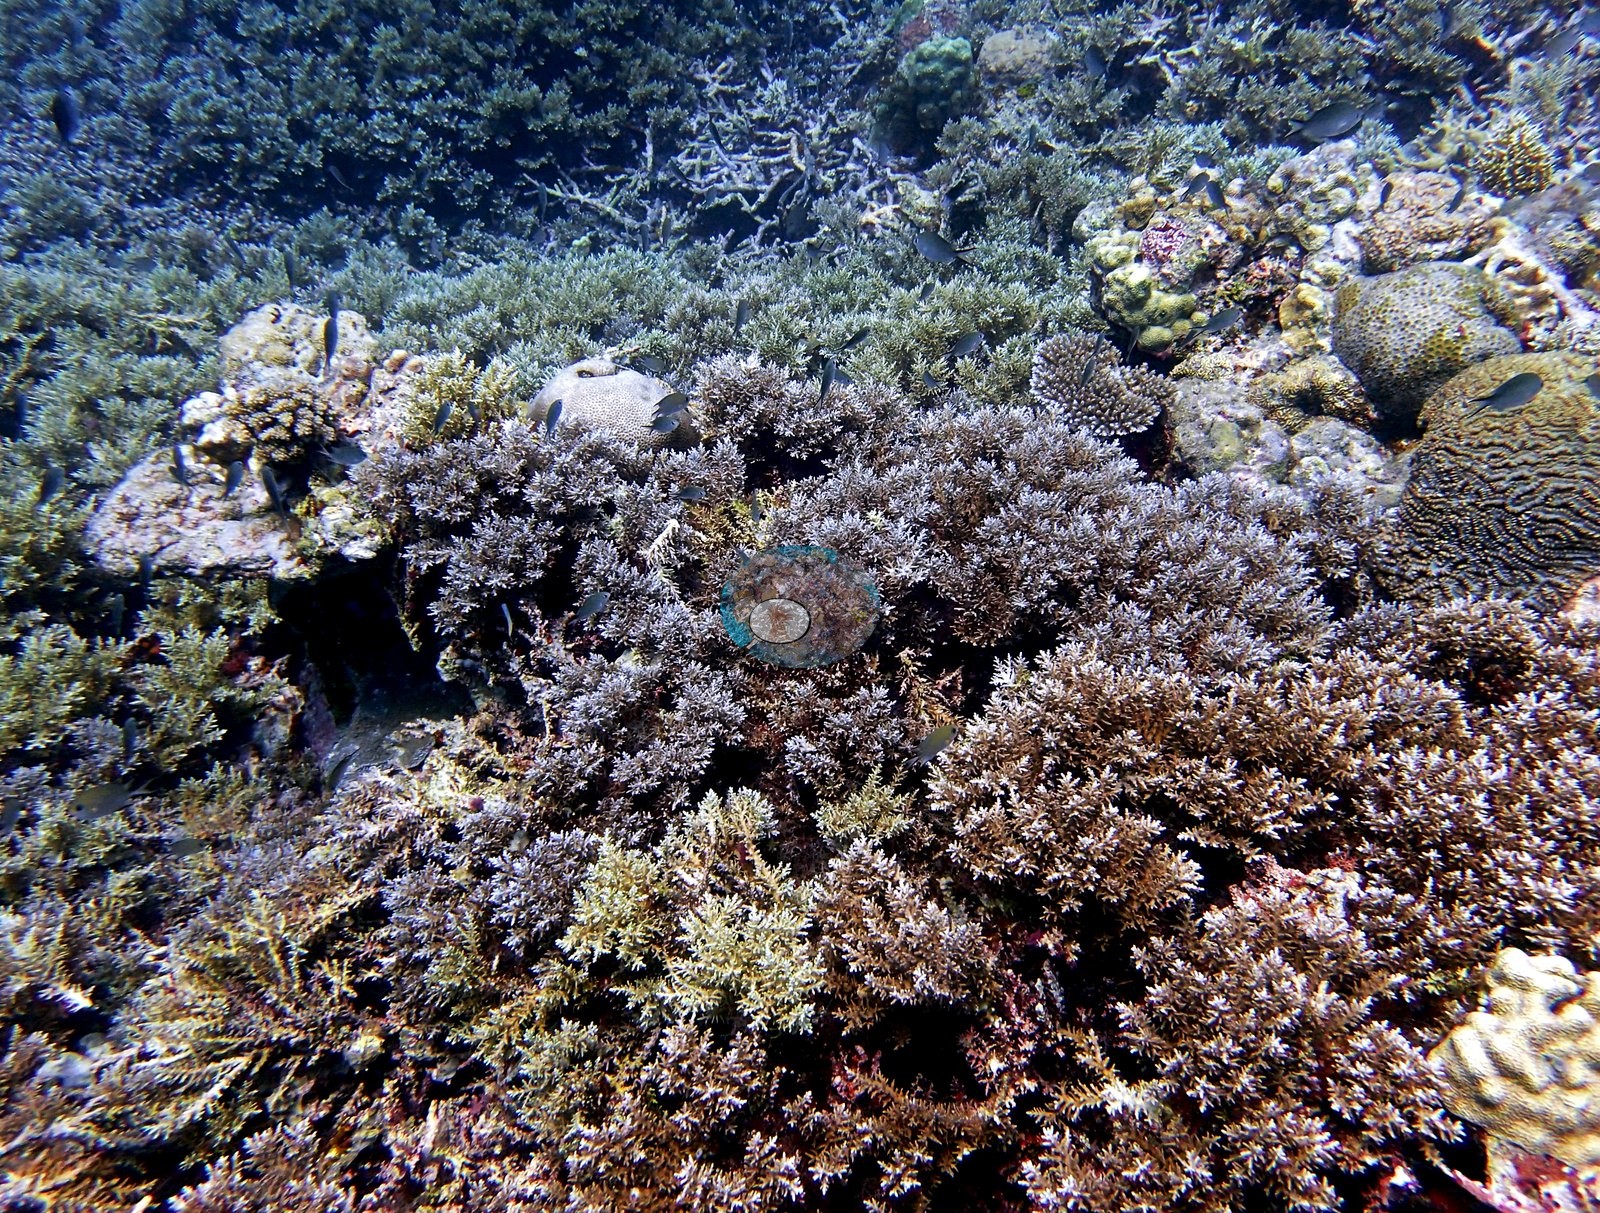
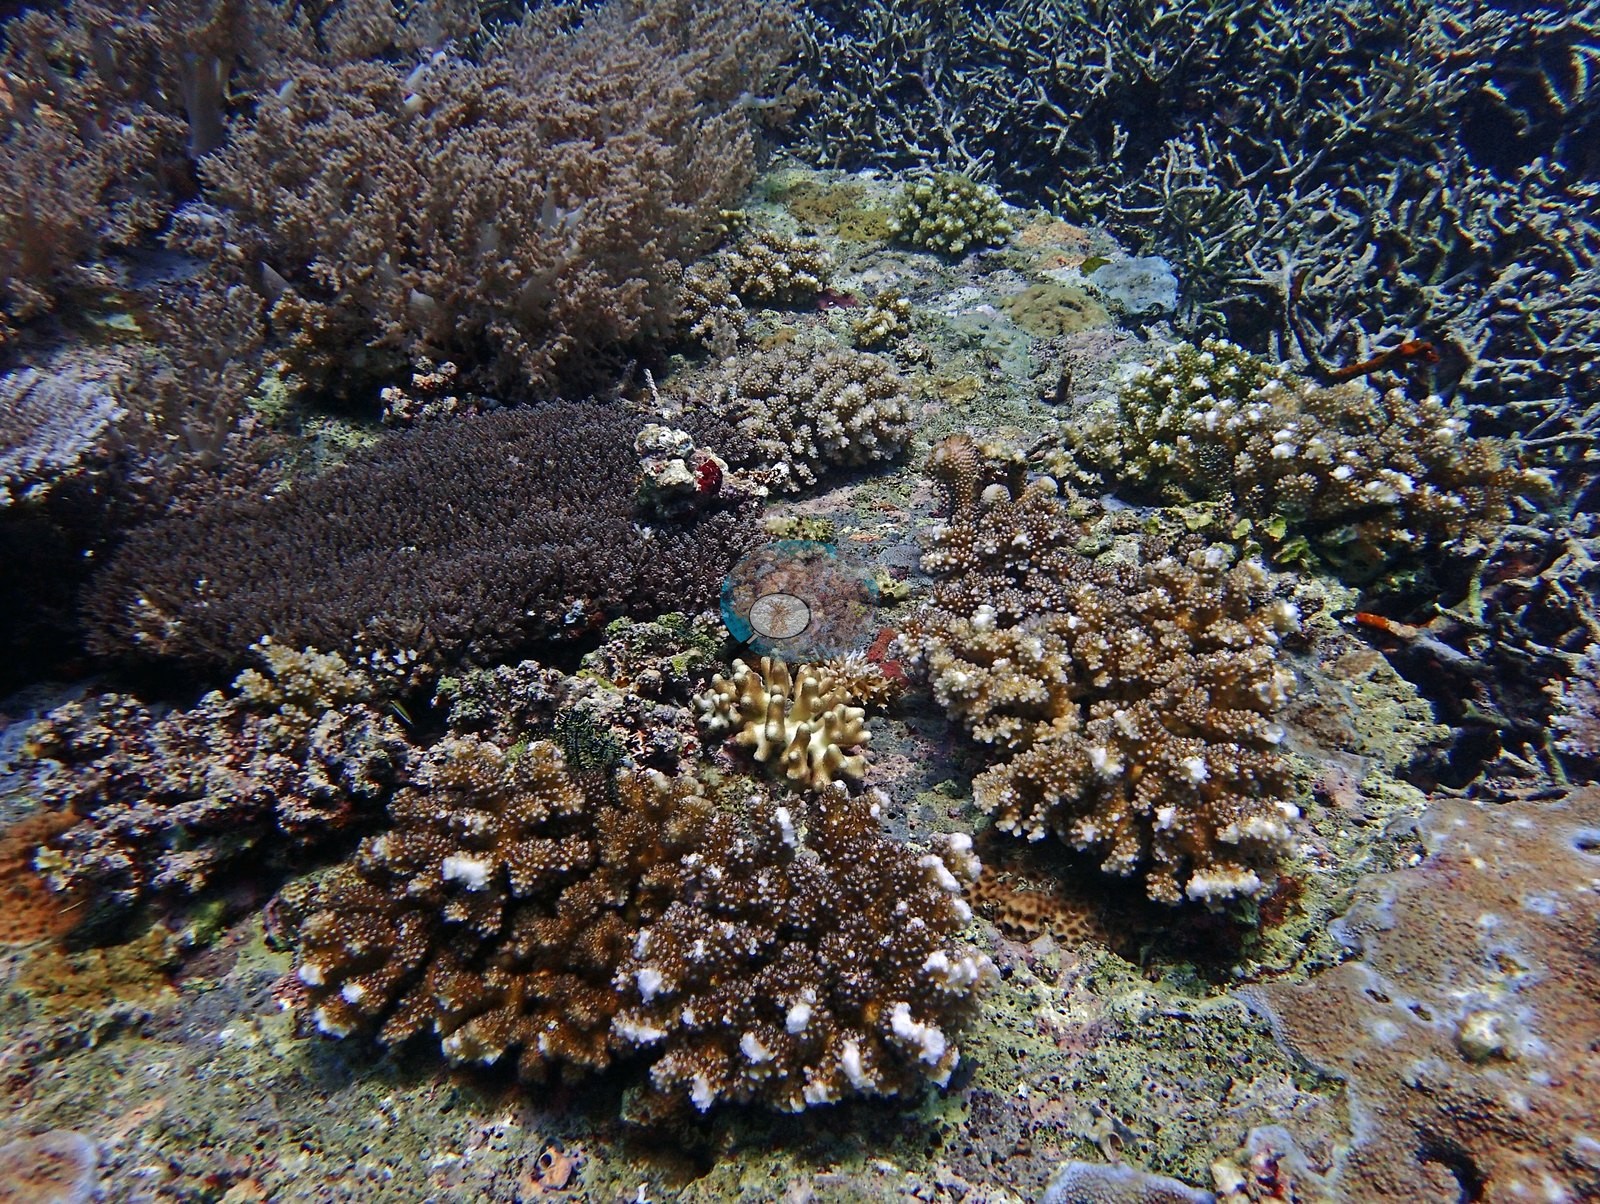
They need not have tracked each other, and a separate Reef Check station actually named Lava Flow, 1.94 km off, held 63–76% hard coral across 2015–2019 with no collapse at all. Different station, different observers: a near-concurrent cross-check, not a repeat of this site.
Dive record
It is the second dive of the trip and, on the photographs, the highest-cover site of the six reviewed here.
CV model comparison
More info
DINOv3 and CoralSCOP were run on the same photos and are listed for comparison. Coralscapes v2 and v1 were also run but are not shown: Anderson does not consider Coralscapes reliable for these photos. No diver transect exists for this trip, so agreement between the rows is not accuracy, and as of September 2026 no computer-vision method estimates coral cover accurately on new images; treat every row as indicative.| Method | Hard-coral cover (%) |
|---|---|
| In-house DINOv3 | 35.3 |
| CoralSCOP edited | 37.0 |
| Claude (edited photos) | 54.6 |
Independent surveys nearby
| Agency / program | Year(s) | Stations / distance | Link |
|---|---|---|---|
| Coral Triangle Center (CTC) | 2014–2019 | 7 stations, 1.96–4.44 km | Records ↓ |
| Reef Check | 2015–2025 | 7 stations, 0.97–4.82 km | Records ↓ |
 Dr. Coral (CRD)
Within 5 km, 14 independent survey stations recorded hard coral cover in 83 surveys between 2014 and 2025. Of the 6 stations surveyed in more than one year, 2 declined, 3 increased, and 1 changed by less than 5 percentage points between their first and latest surveys. The longest record, Lava Flow (Reef Check, 1.94 km away), went from 76% (best patch) in 2015 to 88% (best patch) in 2025. Surveys since 2021 average 50% (range 44–56%, n=4); 2 best-patch values above 70% are left out, as they are not site means. This site's own estimate (55%) sits within the recent range (44–56%); the methods differ, so the comparison is context, not a like-for-like test.
Collected by other programs using different methods (Reef Check uses point-intercept transects), so these are context for the figures above, not a like-for-like comparison. Where a station was surveyed more than once the range is shown. Station names are not dive-site names. Values marked best patch exceed 70%: surveyors usually chose the richest area, so they are not site means.
Show all 14 independent survey records
Data & links
All images from Coral Reef Diagnostics. Data are from Coral Reef Diagnostics and the organizations named in the data-sources table above.
© Coral Reef Diagnostics.