

Indonesia - Banda Islands: Lighthouse

Part of the regional summaries: Indonesia - Banda and Indonesia - Maluku
2018-04-26
More info
Maluku (NOAA CRW virtual station) · Banda Sea ecoregion mean=7.3°C-heating weeksA Banda Islands dive; nearby Reef Check surveys span 21-93% across a decade, though those describe a different, named station rather than this dive.
Penyelaman di Kepulauan Banda; survei Reef Check di dekatnya berkisar 21-93% sepanjang satu dekade, meskipun survei tersebut menggambarkan stasiun bernama yang berbeda, bukan penyelaman ini.
Terjemahan ringkasan ini oleh AI; versi bahasa Inggris yang berlaku.
22 independent survey stations shown with the program’s logo — click one to see how far it is from this site.
Four other CRD dive sites within 5 km shown in orange — click a marker to open its page.
Site description
General benthic features
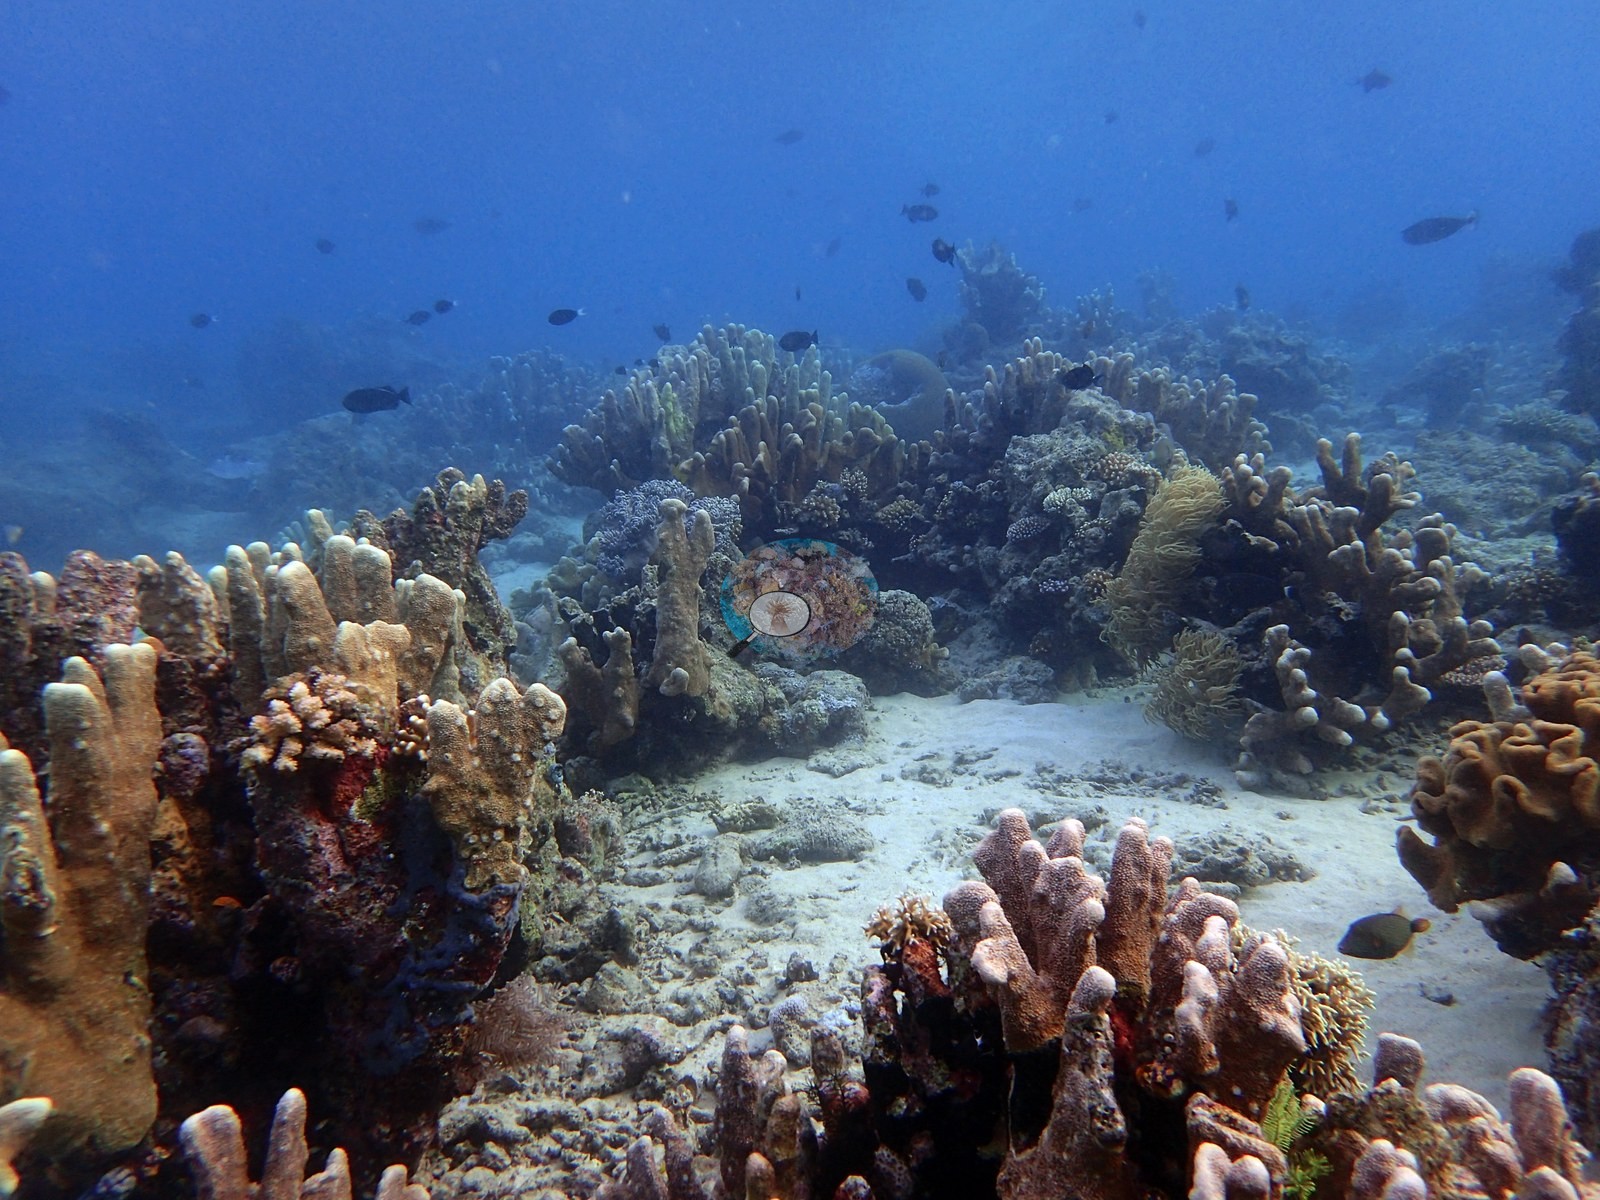
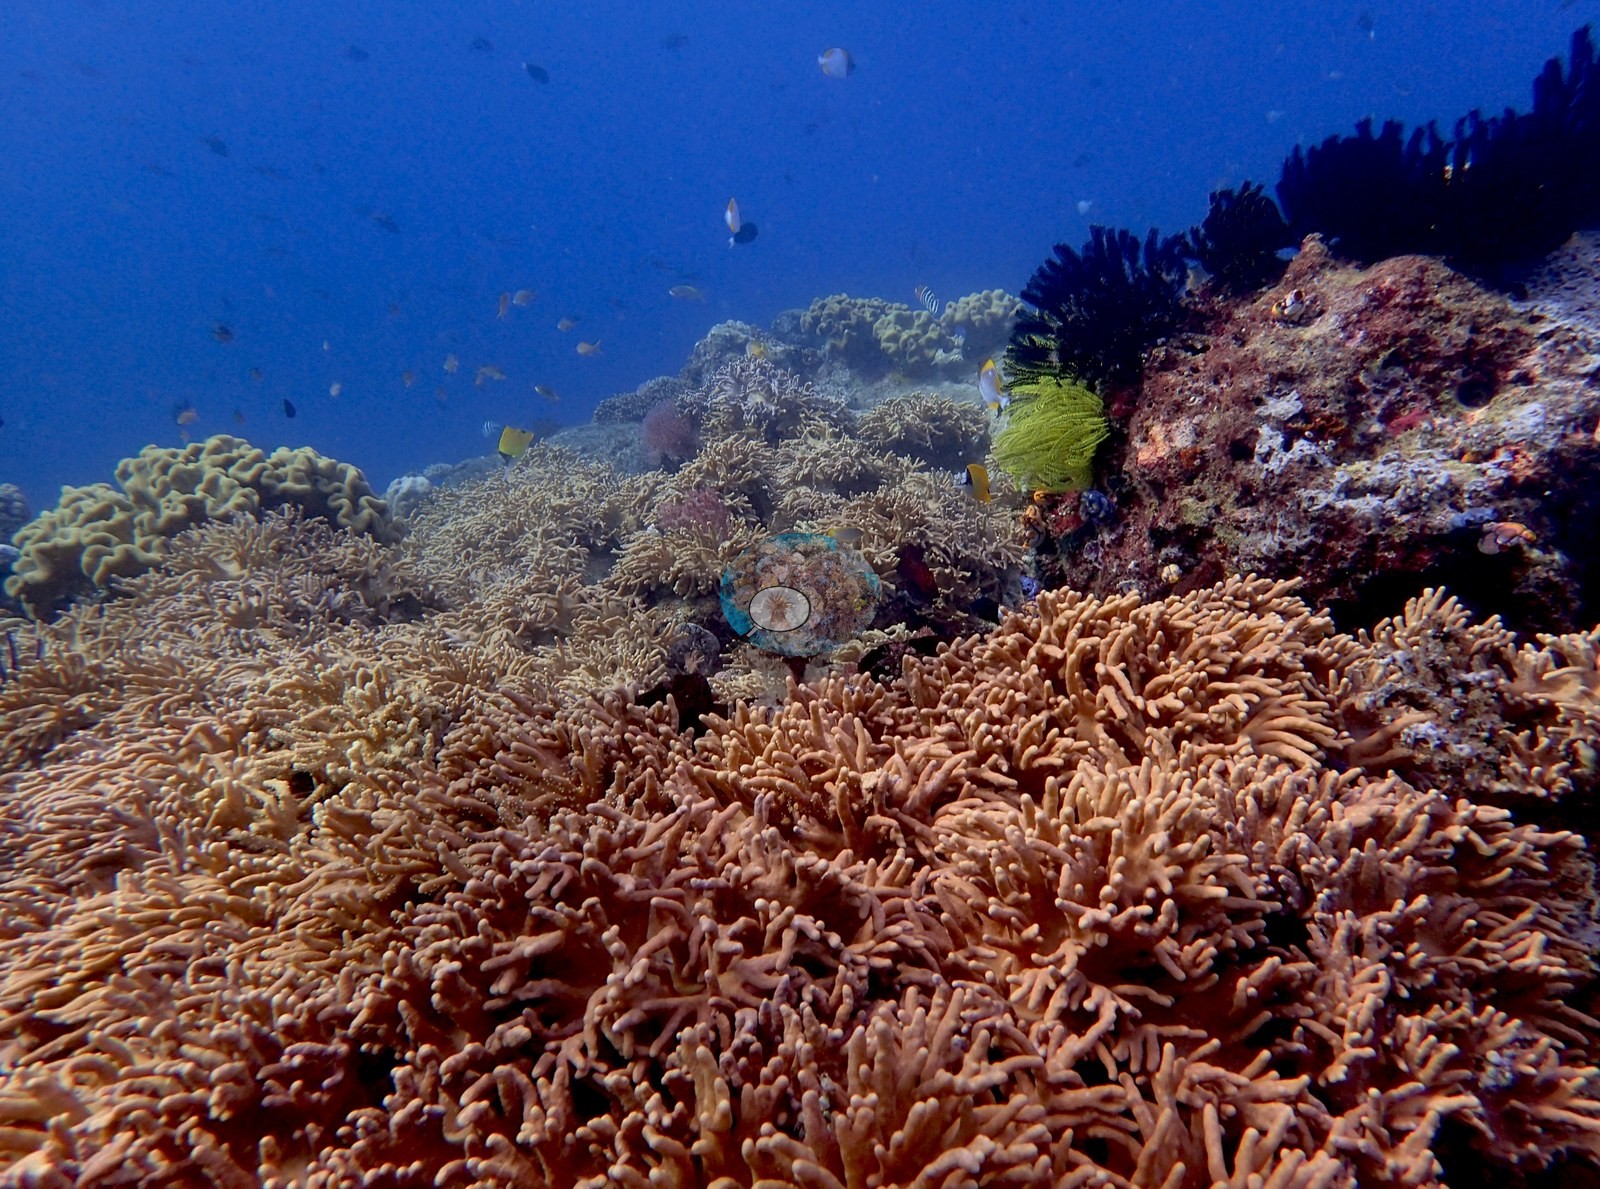
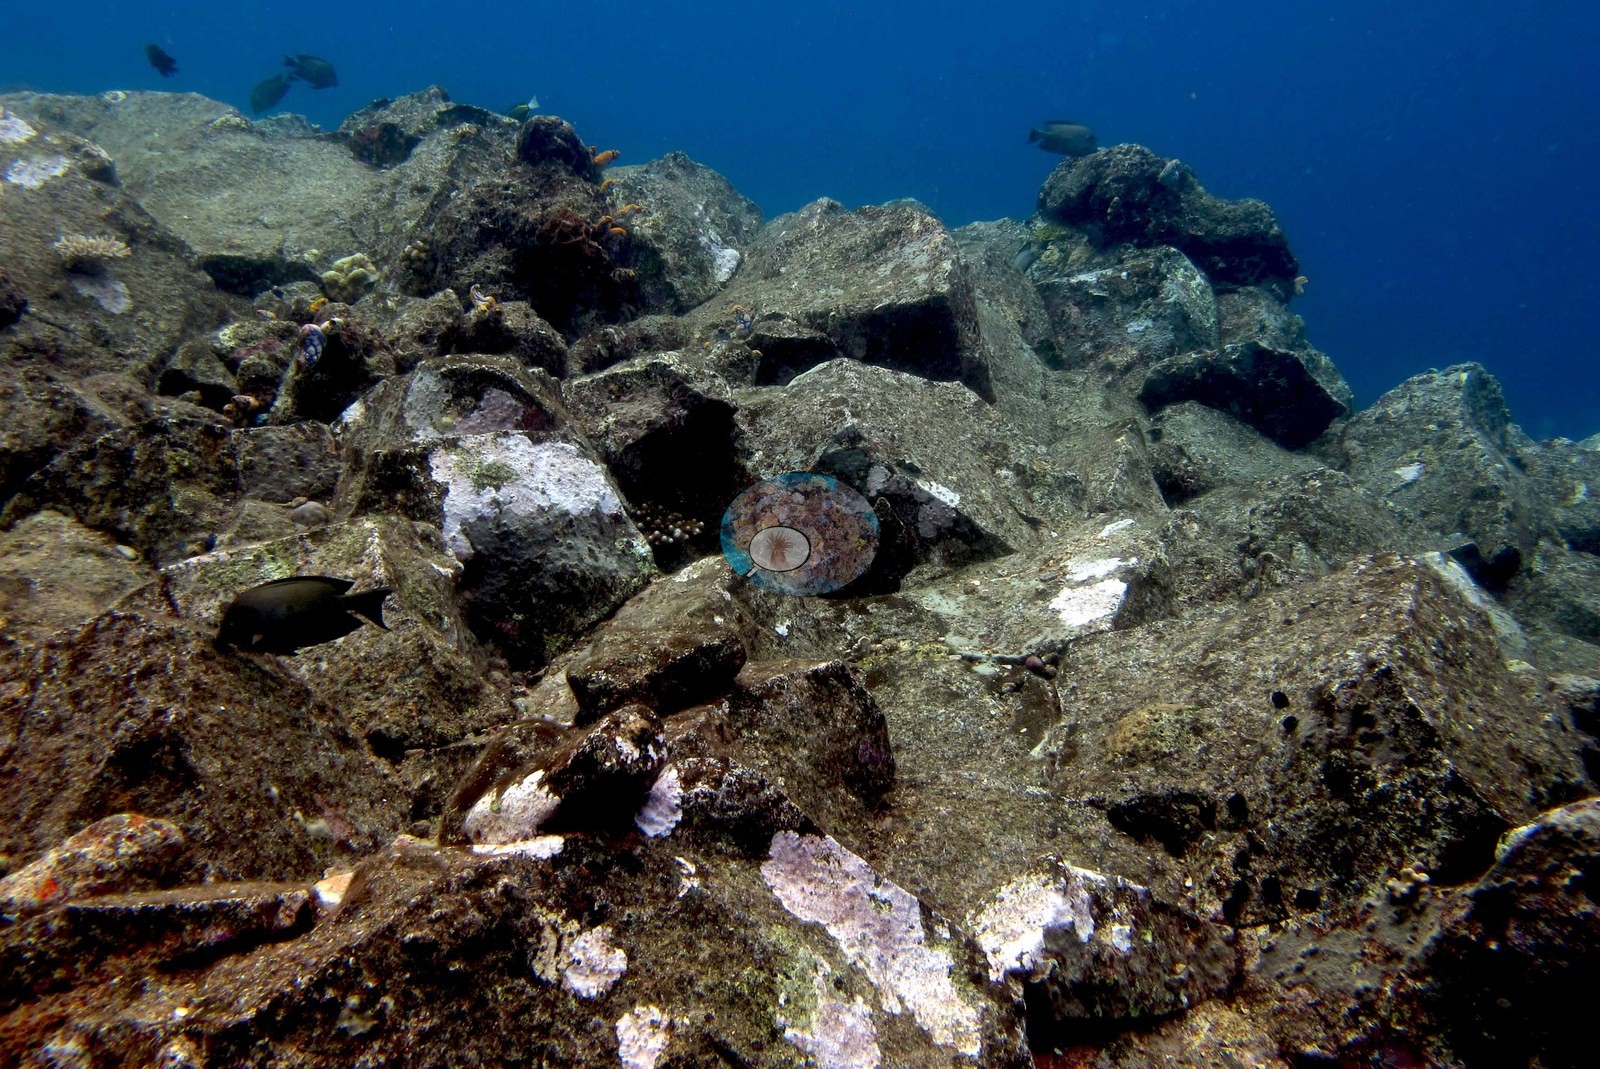
The wider frames show a reef whose framework is columnar and branching rather than tabulate: one is a flat of pale tan-cream columnar Porites-type colonies with brown foliose colonies and a mustard soft coral between them, broken by broad white sand and rubble channels, with surgeonfish and damselfish over it; another is a near-continuous field of salmon-tan fine-branched coral filling the frame, with a cream leathery soft coral, chartreuse crinoid and a black antipatharian bush at the margin. The fourth reef frame is the poorest ground in the set: a slope of large angular boulders and broken reef blocks coated in gray-green turf and coralline algae, carrying only a handful of small colonies, with damselfish and surgeonfish over it.
Coral cover
Coral cover: 29% — a blind Claude computer-vision point count of 133 of Anderson's edited photographs (20 points per photo; water, fish, and obstructions excluded). Other computer-vision methods are listed in the method table.
Stressors
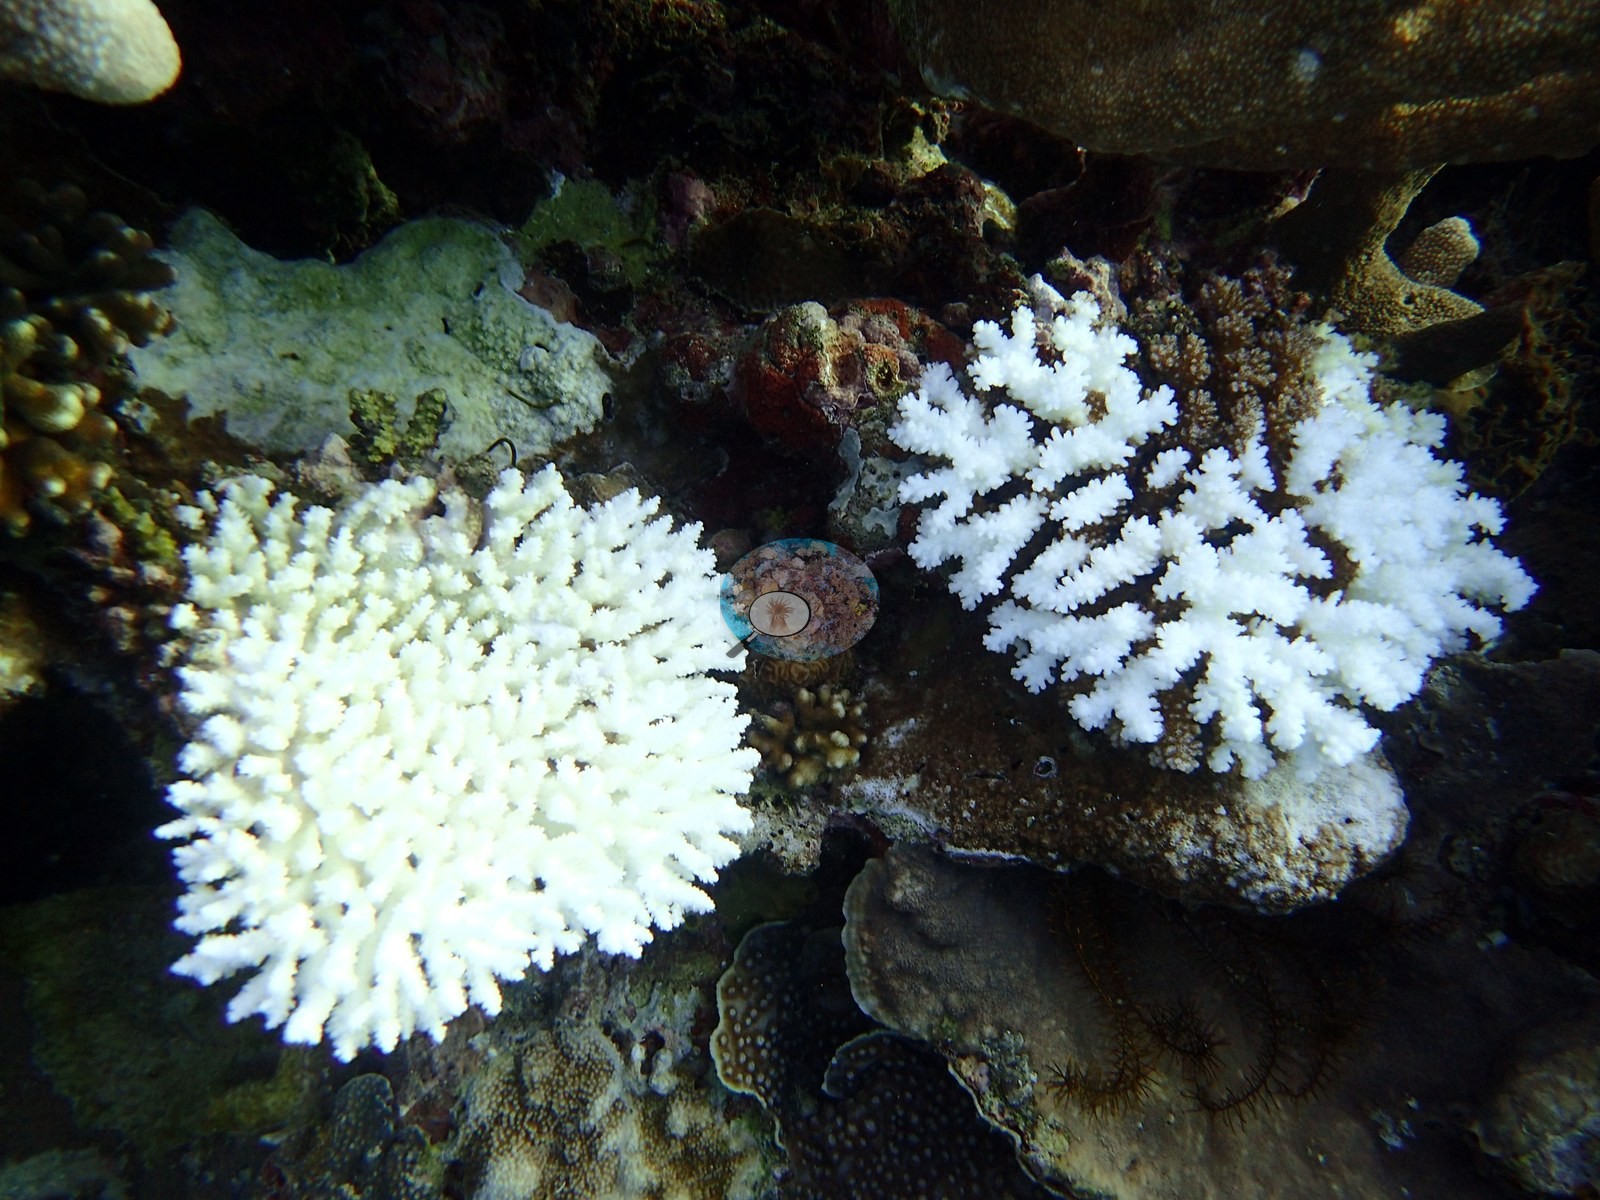
One close frame shows two corymbose Acropora colonies, each roughly 30-40 cm across, snow-white from base to branch tip with tissue still intact and structure undamaged: this is active bleaching, not dead skeleton, and it sits directly beside normally pigmented brown and olive colonies. Given the 30-degree logs, that is a real and dateable observation from this site.
Comparisons with other data
No independent survey was made at this exact site; the nearest ones are listed in the table below.
Dive record
Three dives here on 25 and 26 April 2018 (16:35, 18:58 and 13:03; 54-61 minutes; max 13.7, 14.6 and 29.3 m; average 7-16 m) with a logged minimum temperature of 30.0 degrees C on every dive - the warmest water in this whole photo queue.
Other notes
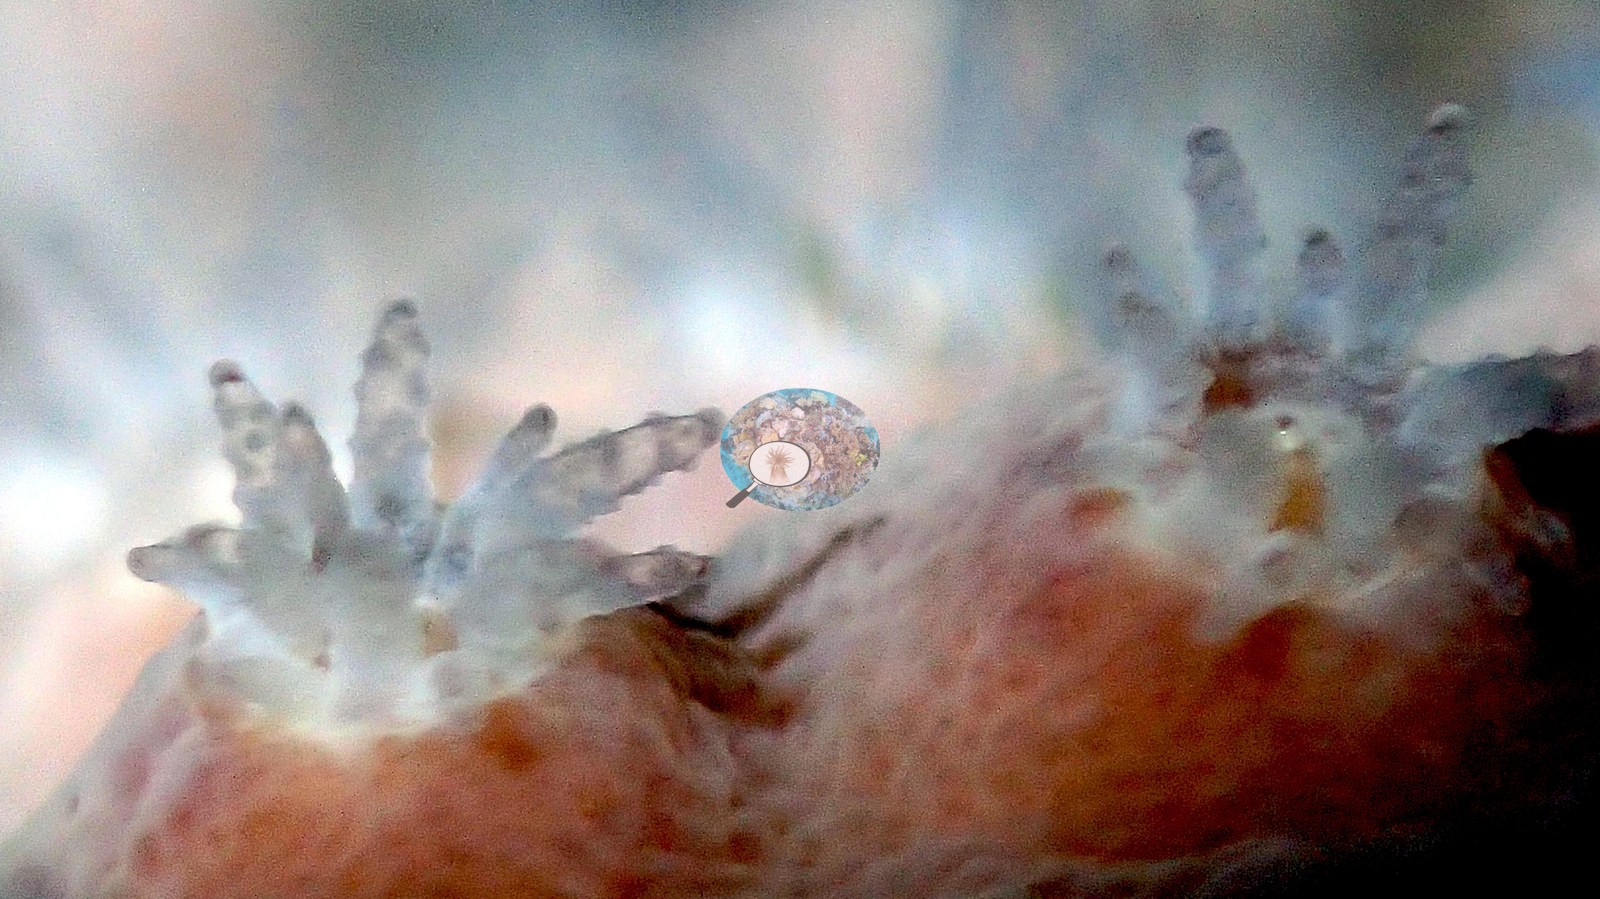
The frames record that. The fifth frame is an out-of-focus extreme macro of pale translucent polyps or cerata on a salmon body and cannot be identified.
CV model comparison
More info
DINOv3 and CoralSCOP were run on the same photos and are listed for comparison. Coralscapes v2 and v1 were also run but are not shown: Anderson does not consider Coralscapes reliable for these photos. No diver transect exists for this trip, so agreement between the rows is not accuracy, and as of September 2026 no computer-vision method estimates coral cover accurately on new images; treat every row as indicative.| Method | Hard-coral cover (%) |
|---|---|
| In-house DINOv3 | 23.8 |
| CoralSCOP edited | 36.3 |
| Claude (edited photos) | 28.9 |
% coral cover by visit
Each visit is analyzed independently; these are not pooled into a single site mean.
| Date | % coral cover | Std. dev. | Frames scored |
|---|---|---|---|
| 2018-04-25 | 36% | ±29 | 77 |
| 2018-04-26 | 20% | ±19 | 56 |
Independent surveys nearby
| Agency / program | Year(s) | Stations / distance | Link |
|---|---|---|---|
| Coral Triangle Center (CTC) | 2014–2019 | 11 stations, 1.22–4.98 km | Records ↓ |
| Reef Check | 2015–2025 | 11 stations, 0.96–4.96 km | Records ↓ |
 Dr. Coral (CRD)
Within 5 km, 22 independent survey stations recorded hard coral cover in 135 surveys between 2014 and 2025. Of the 10 stations surveyed in more than one year, 3 declined, 4 increased, and 3 changed by less than 5 percentage points between their first and latest surveys. The longest record, Lava Flow (Reef Check, 1.15 km away), went from 76% (best patch) in 2015 to 88% (best patch) in 2025. Surveys since 2021 average 56% (range 50–66%, n=5); 2 best-patch values above 70% are left out, as they are not site means. This site's own estimate (29%) sits 21.1 points below the recent range (50–66%); the methods differ, so the comparison is context, not a like-for-like test.
Collected by other programs using different methods (Reef Check uses point-intercept transects), so these are context for the figures above, not a like-for-like comparison. Where a station was surveyed more than once the range is shown. Station names are not dive-site names. Values marked best patch exceed 70%: surveyors usually chose the richest area, so they are not site means.
Show all 22 independent survey records
Data & links
- Photo portfolio ↗
- Coral Reef Diagnostics page for this area ↗
- Coral Reef Diagnostics page for this area ↗
- Coral Reef Diagnostics page for this area ↗
All images from Coral Reef Diagnostics. Data are from Coral Reef Diagnostics and the organizations named in the data-sources table above.
© Coral Reef Diagnostics.