
Indonesia - Halmahera: Batu Balong
Part of the regional summaries: Indonesia - Halmahera and Indonesia - Maluku
More info
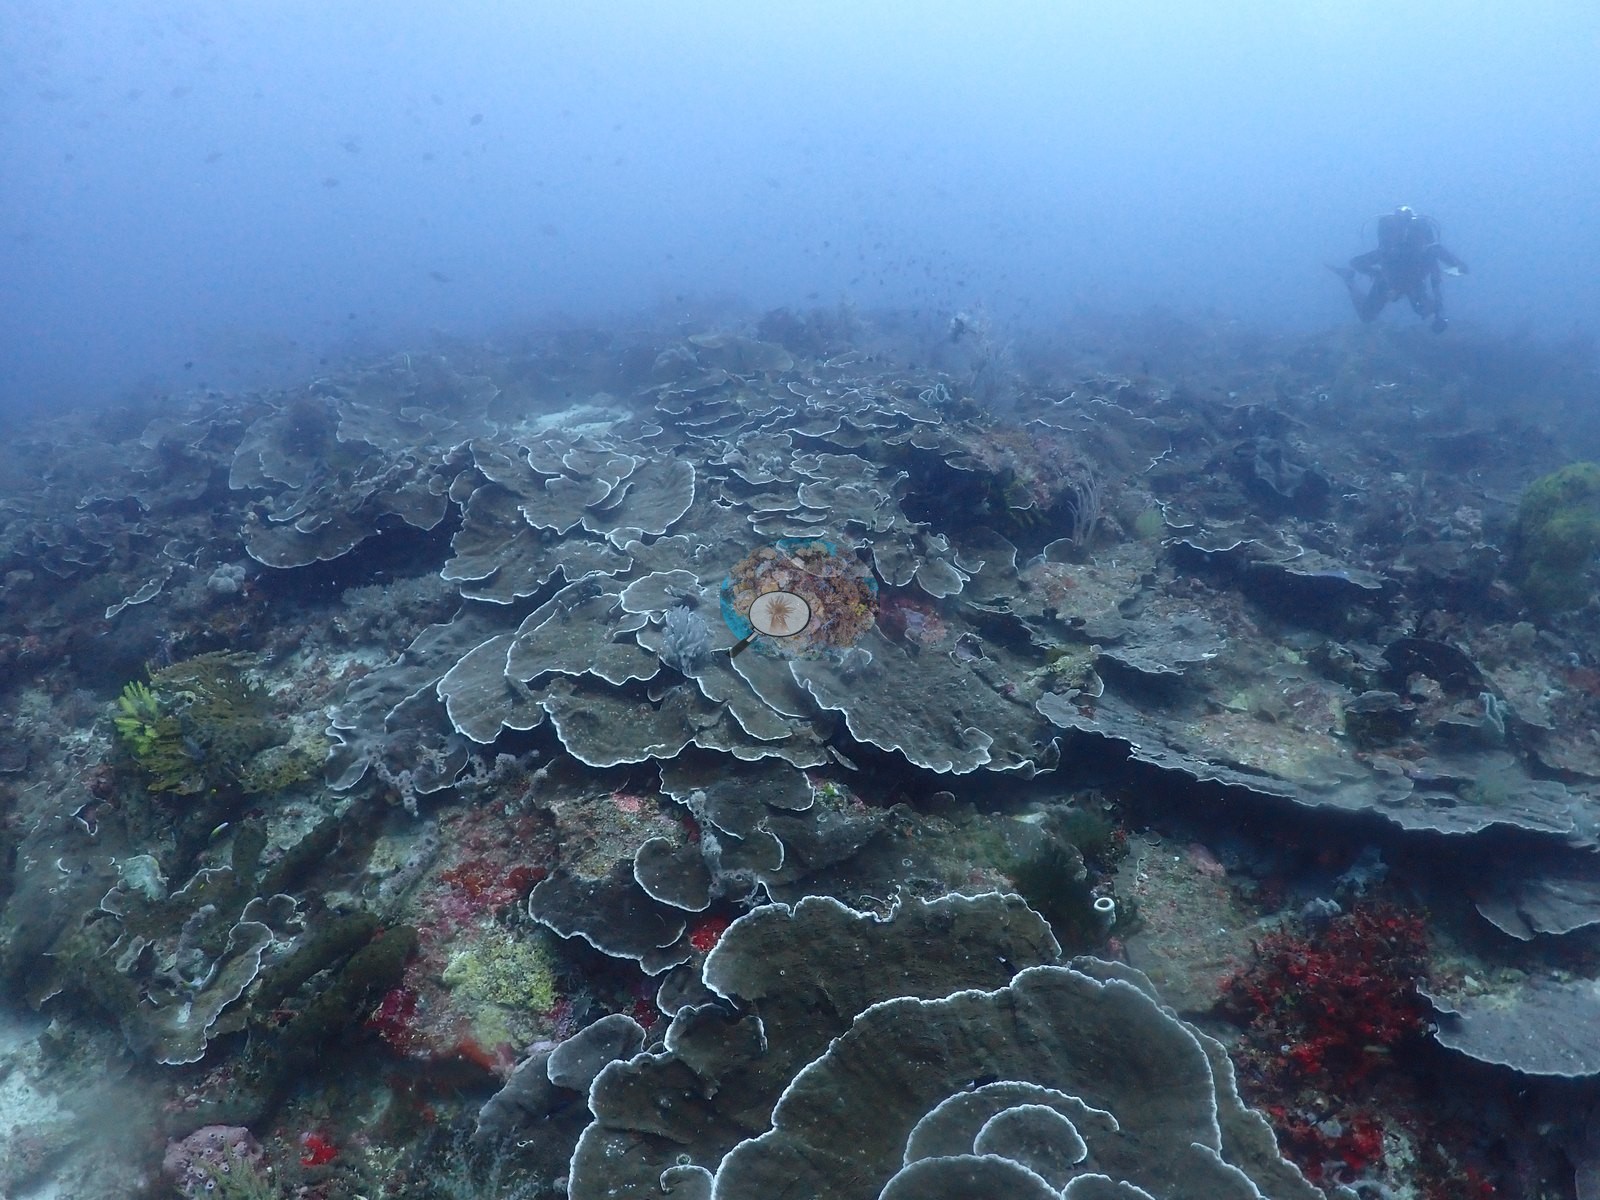
North Maluku (NOAA CRW virtual station)Batu Balong, the deepest dive of the crossing, is exactly the underwater hike Anderson's log describes - a foliose-plate-covered pinnacle wall giving way to a broad plateau blanketed edge to edge in mauve and pink corymbose Acropora, then a series of discrete coral knolls on open sand linking back to shore. A blind Claude computer-vision point count puts coral cover around 39%.
Batu Balong, penyelaman terdalam sepanjang penyeberangan, persis seperti pendakian bawah laut yang diuraikan catatan Anderson — dinding puncak batu yang tertutup karang lembaran, memberi jalan kepada dataran luas yang berselimut dari tepi ke tepi oleh Acropora korimbosa berwarna ungu muda dan merah muda, lalu serangkaian gundukan karang terpisah di atas pasir terbuka yang menghubungkan kembali ke pantai. Penghitungan titik buta visi komputer Claude memperkirakan tutupan karang sekitar 39%.
Terjemahan ringkasan ini oleh AI; versi bahasa Inggris yang berlaku.
Nine independent survey stations shown with the program’s logo — click one to see how far it is from this site.
Three other CRD dive sites within 5 km shown in orange — click a marker to open its page.
43 of these 53 photographs are shown beside the text that discusses them under "Site description" below.
Site description
Setting
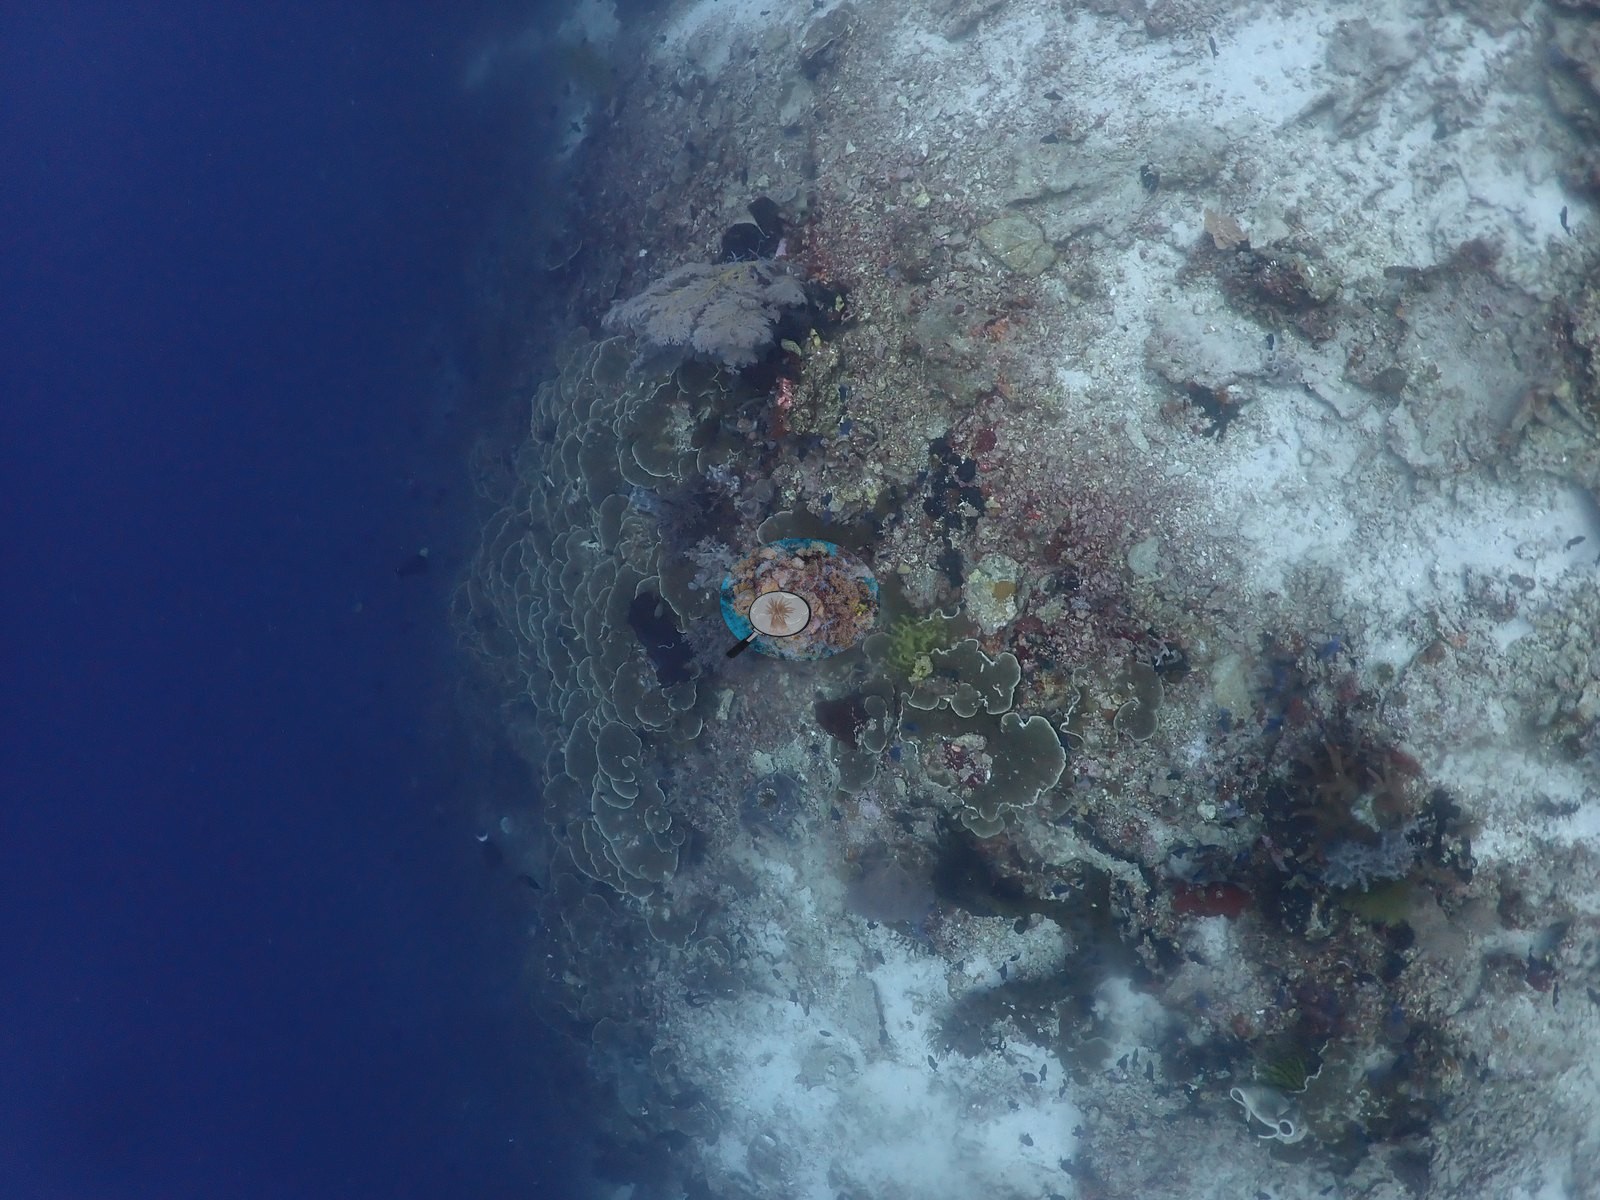
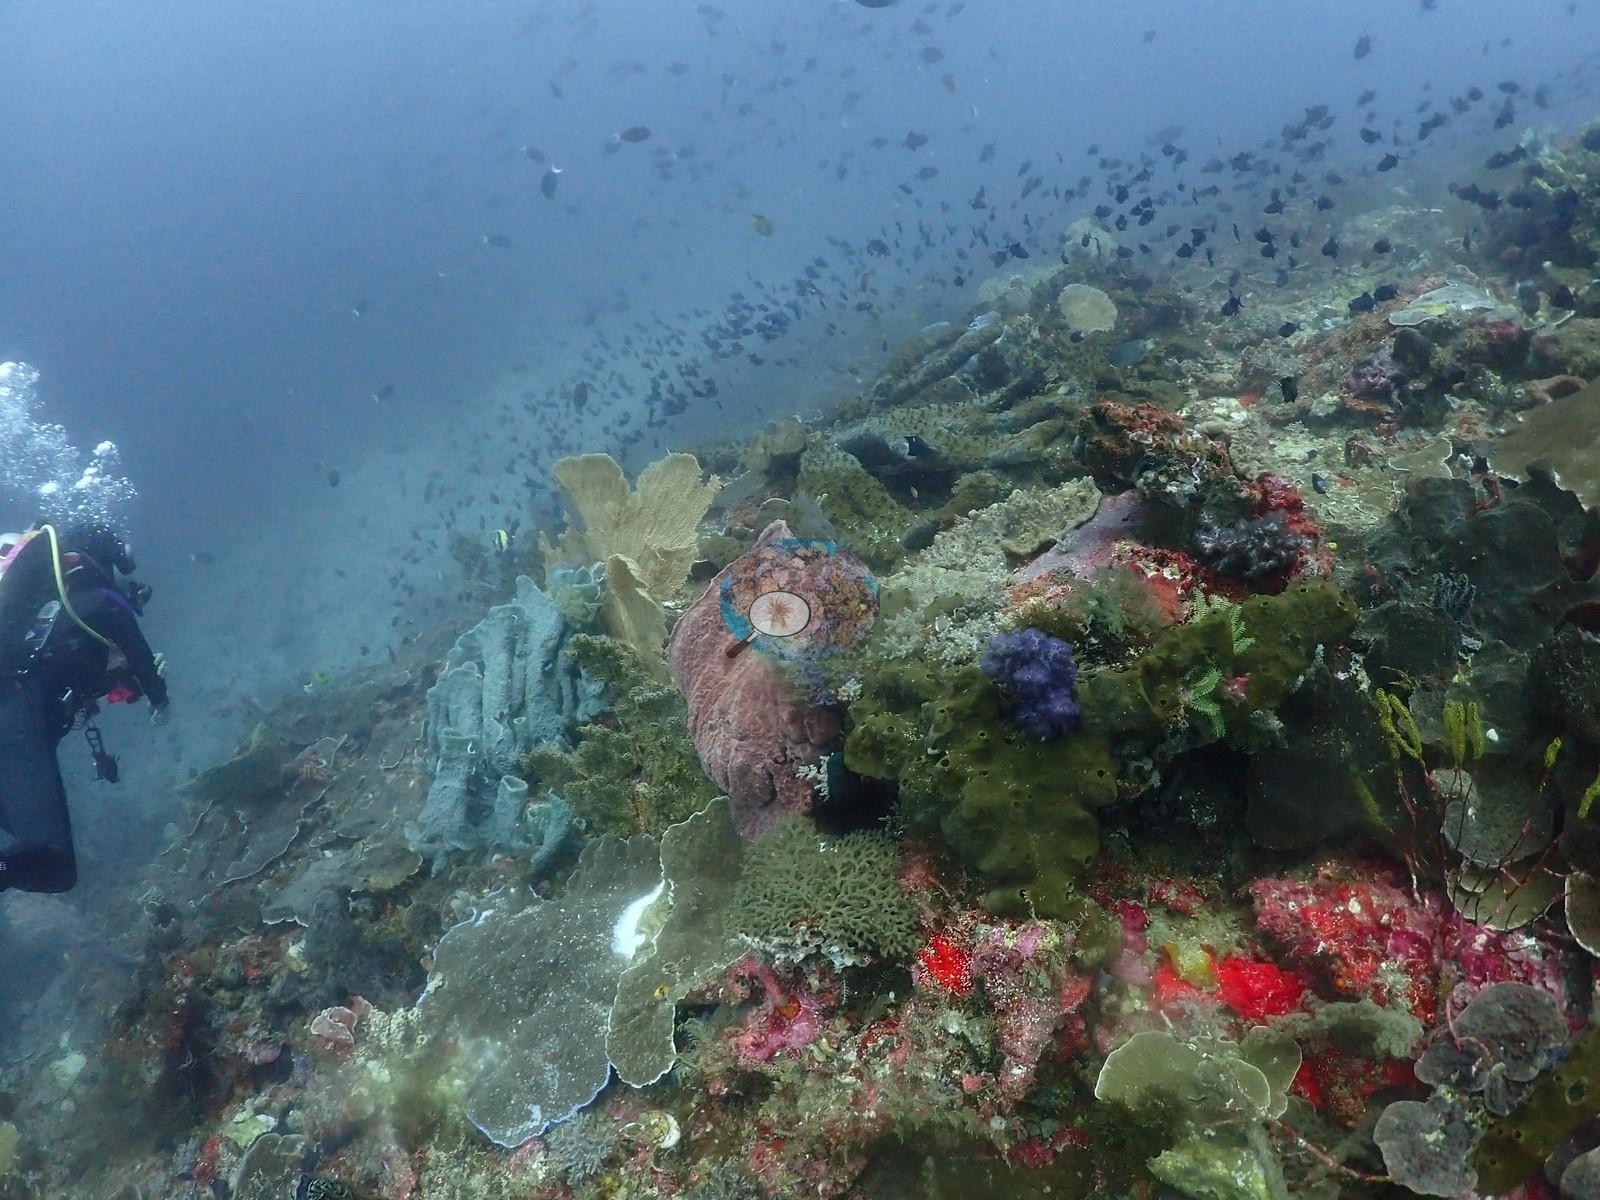
Batu Balong is the deepest dive of Anderson's Halmahera crossing at 31.4 m, and his field note describes its shape better than any summary could: “an underwater hike: seamounts interspersed with blue-water swims. Tons of fish, sharks.” The frame sequence follows that itinerary in four legs. The descent drops through green, particle-loaded surface water with almost nothing resolvable — these are the lowest-cover frames and the dive's minimum.
General benthic features
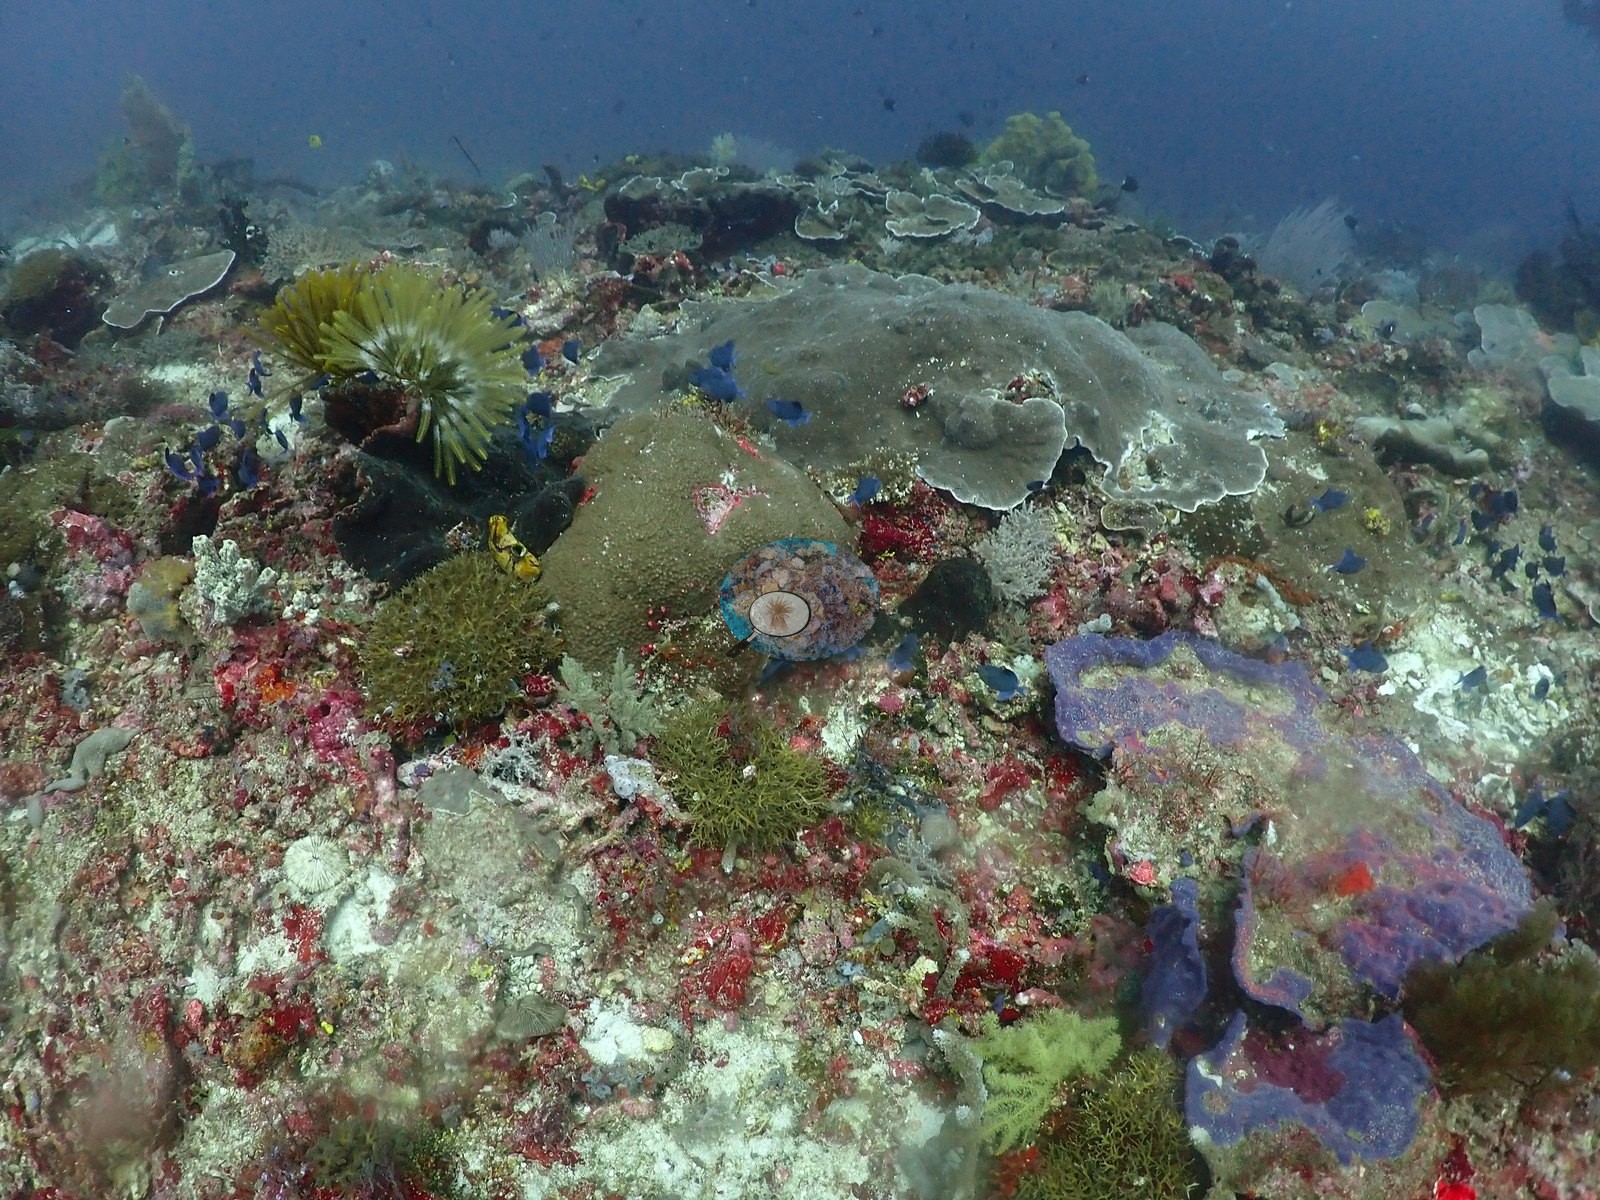
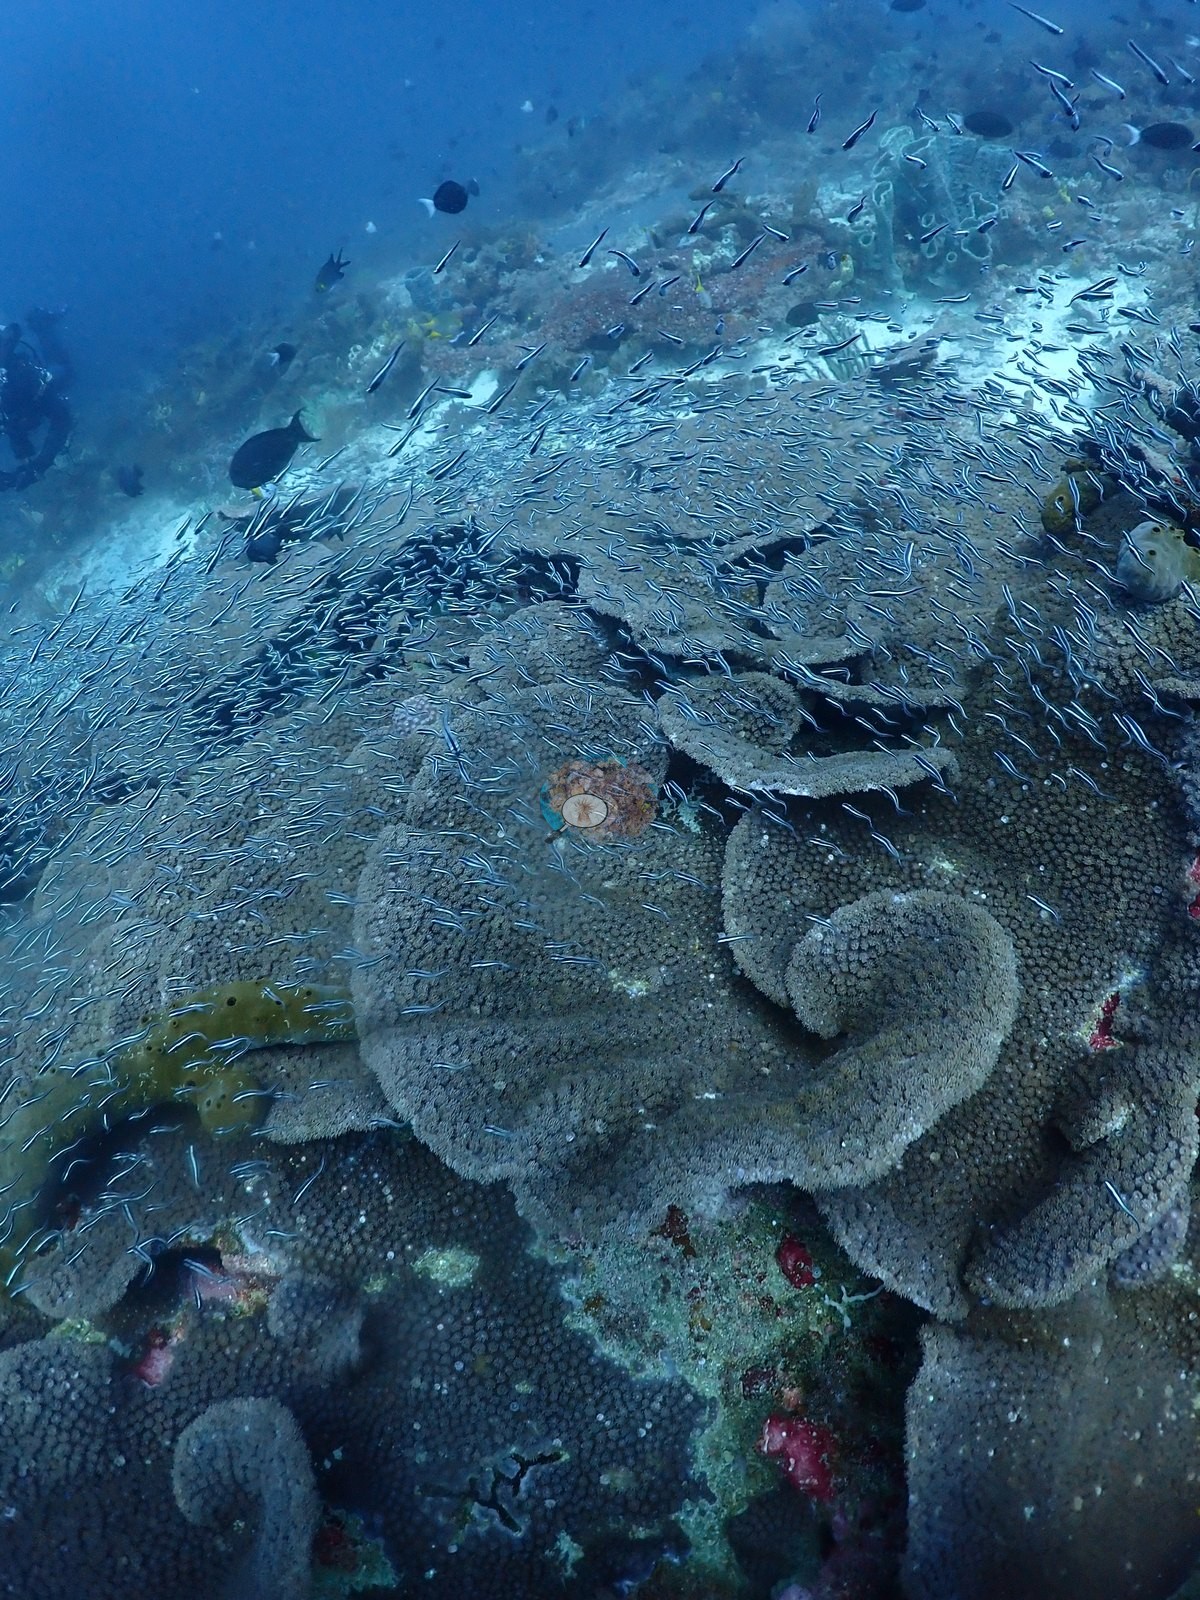
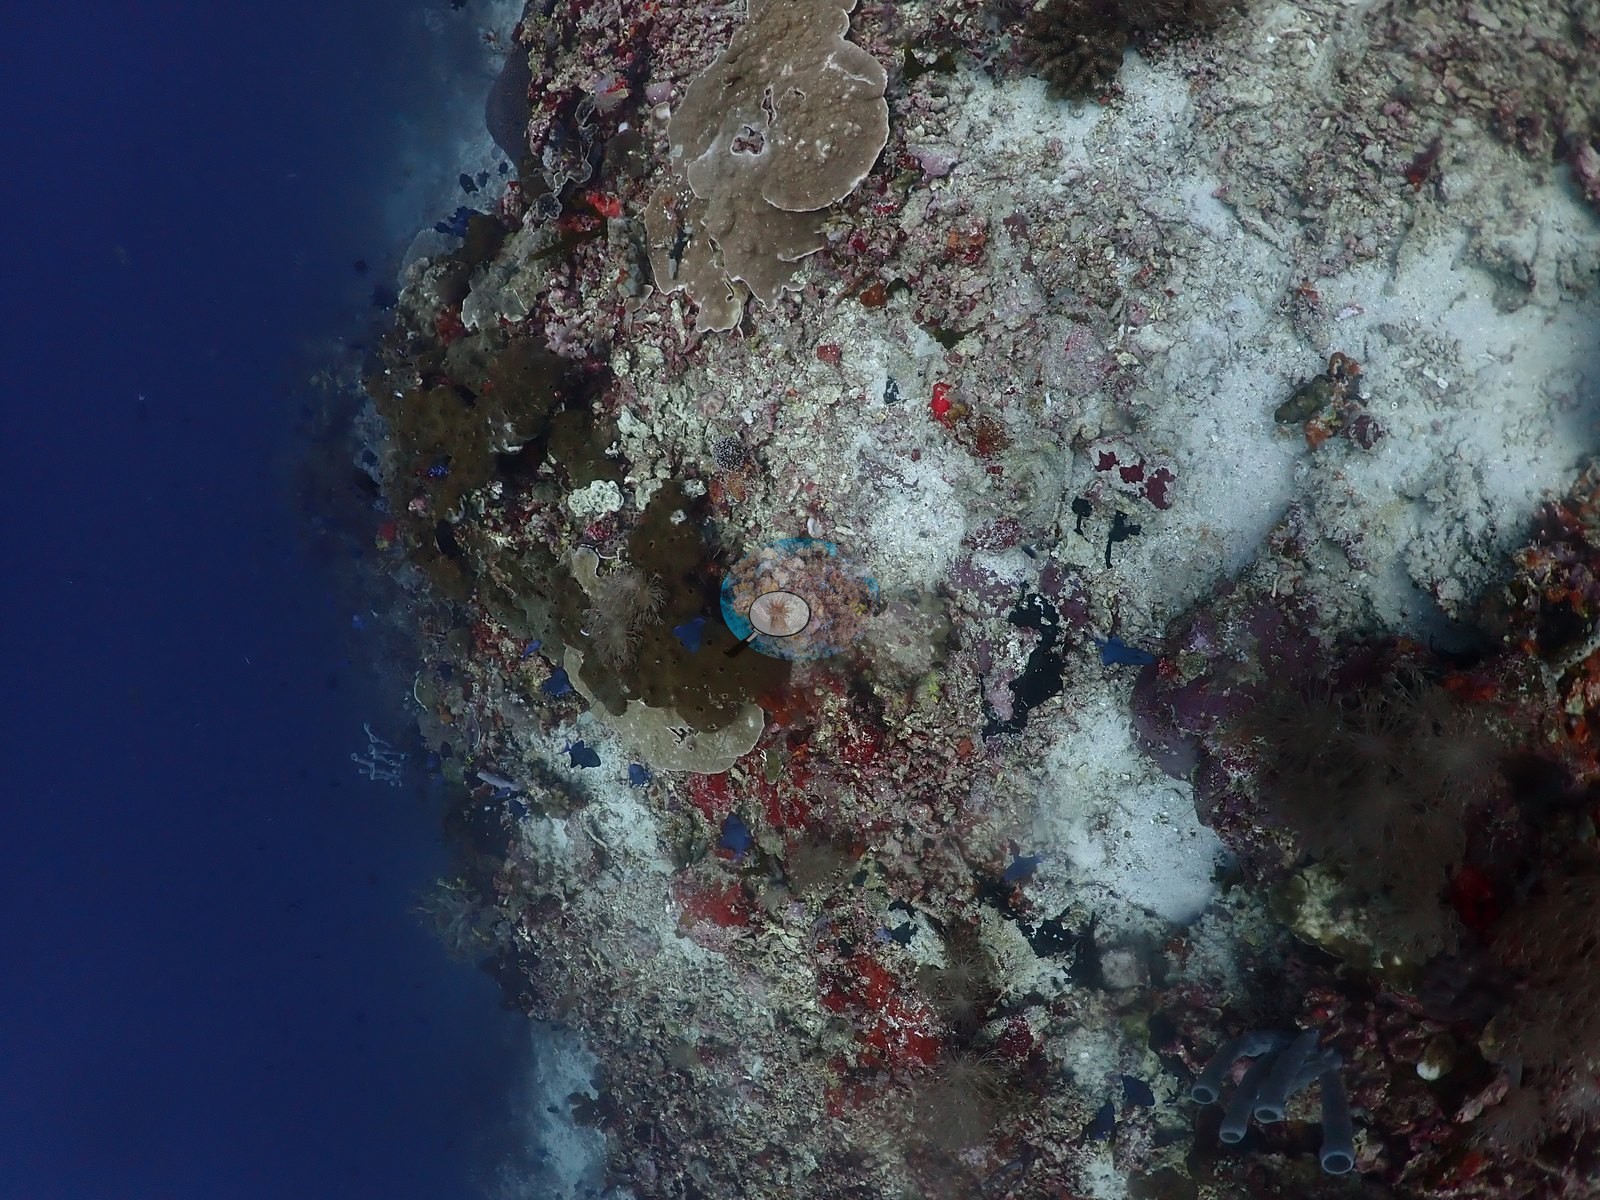
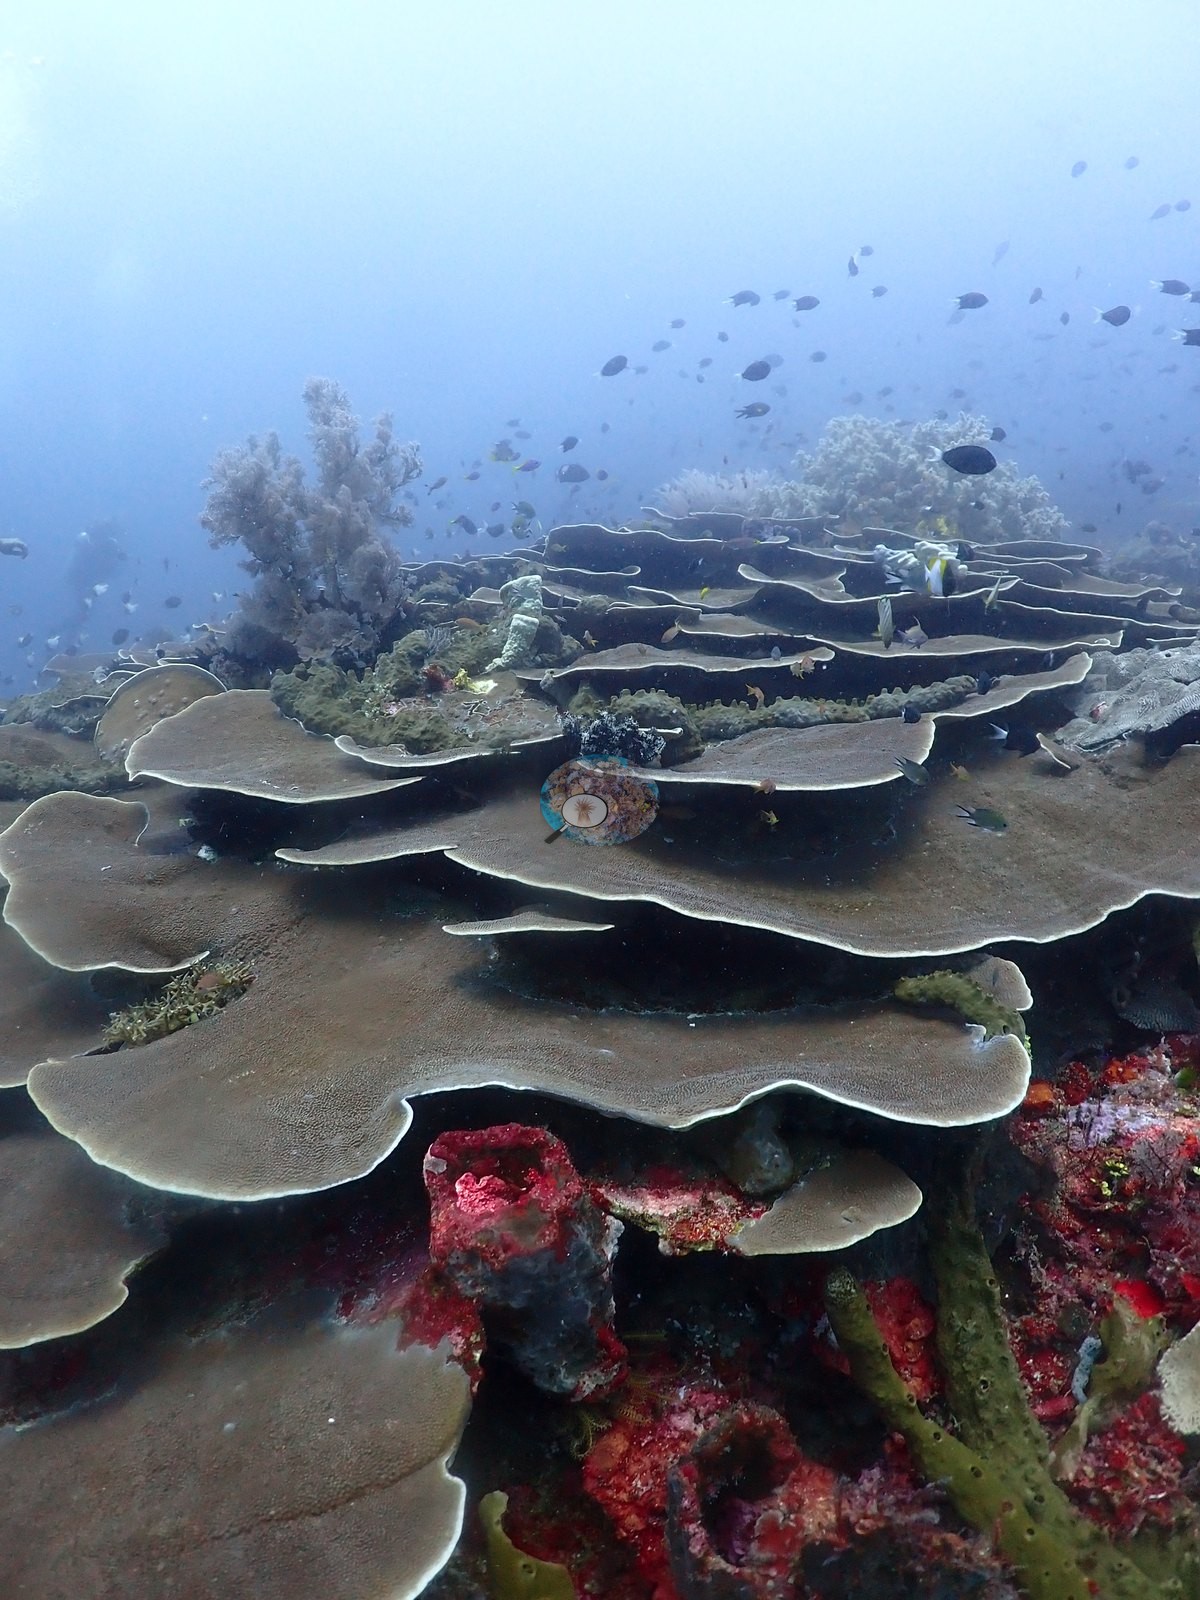
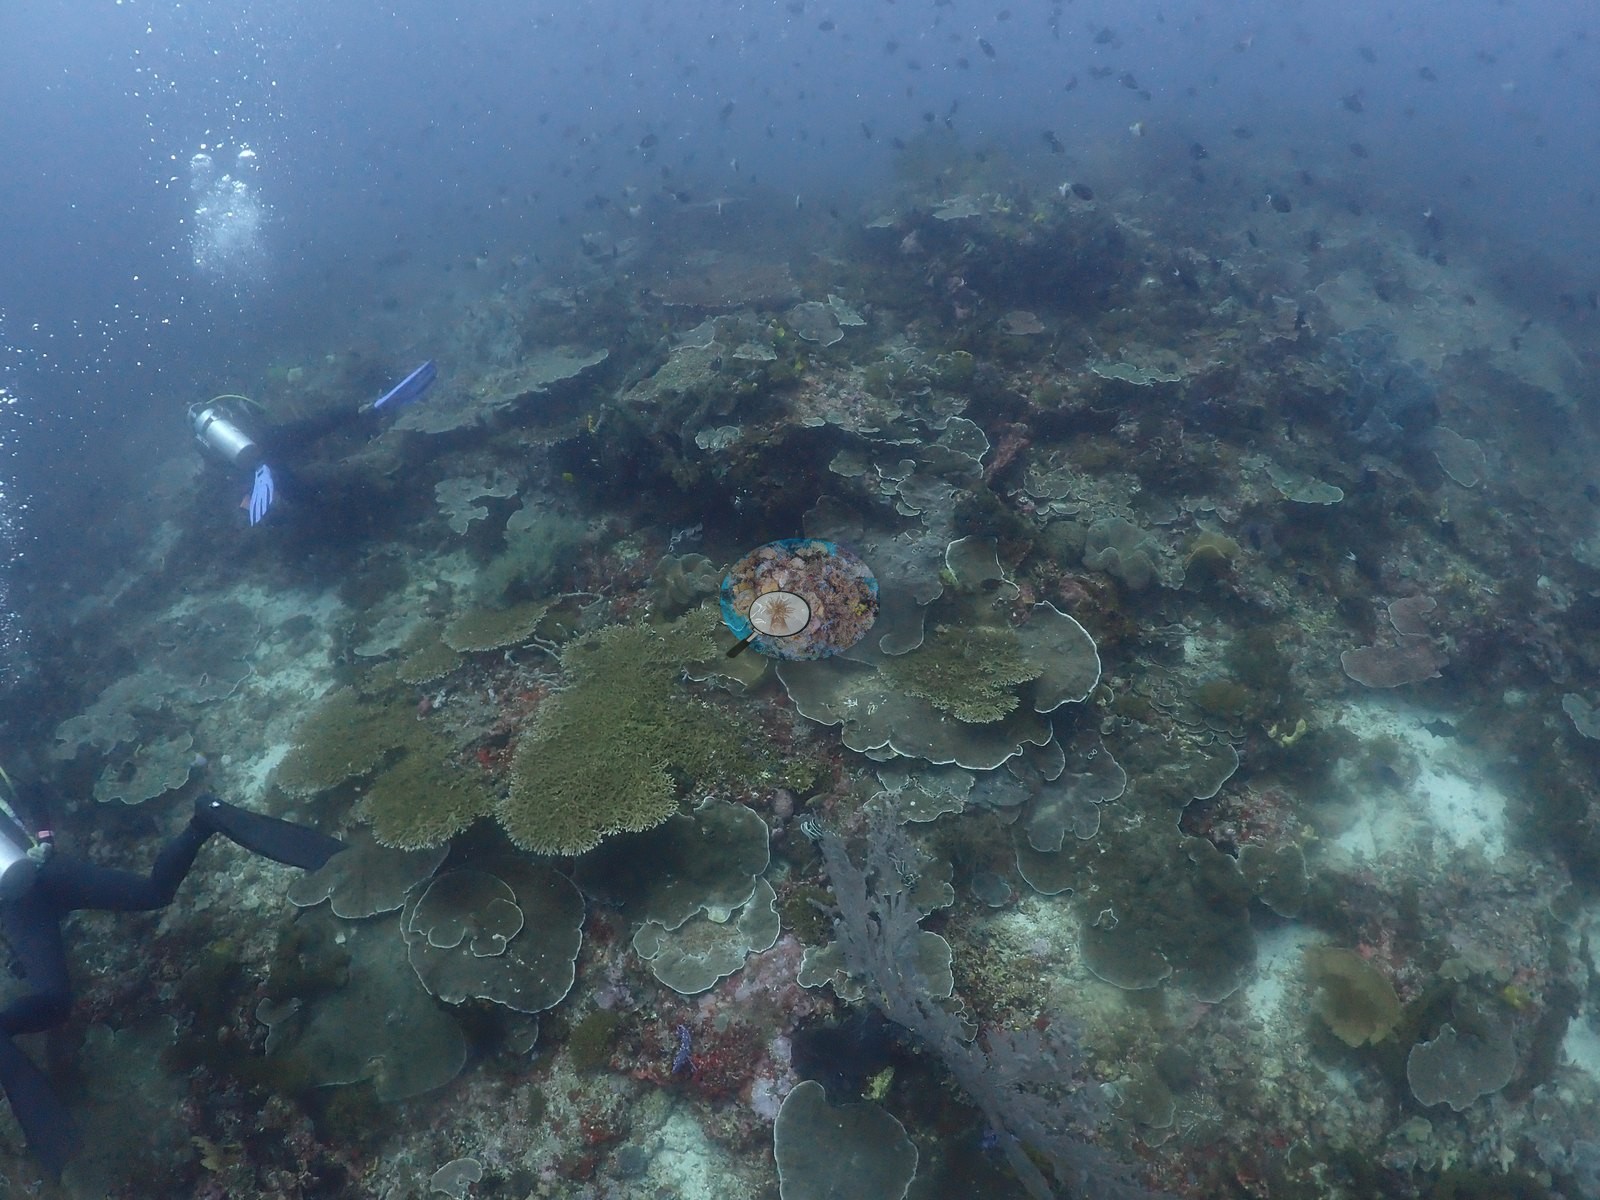
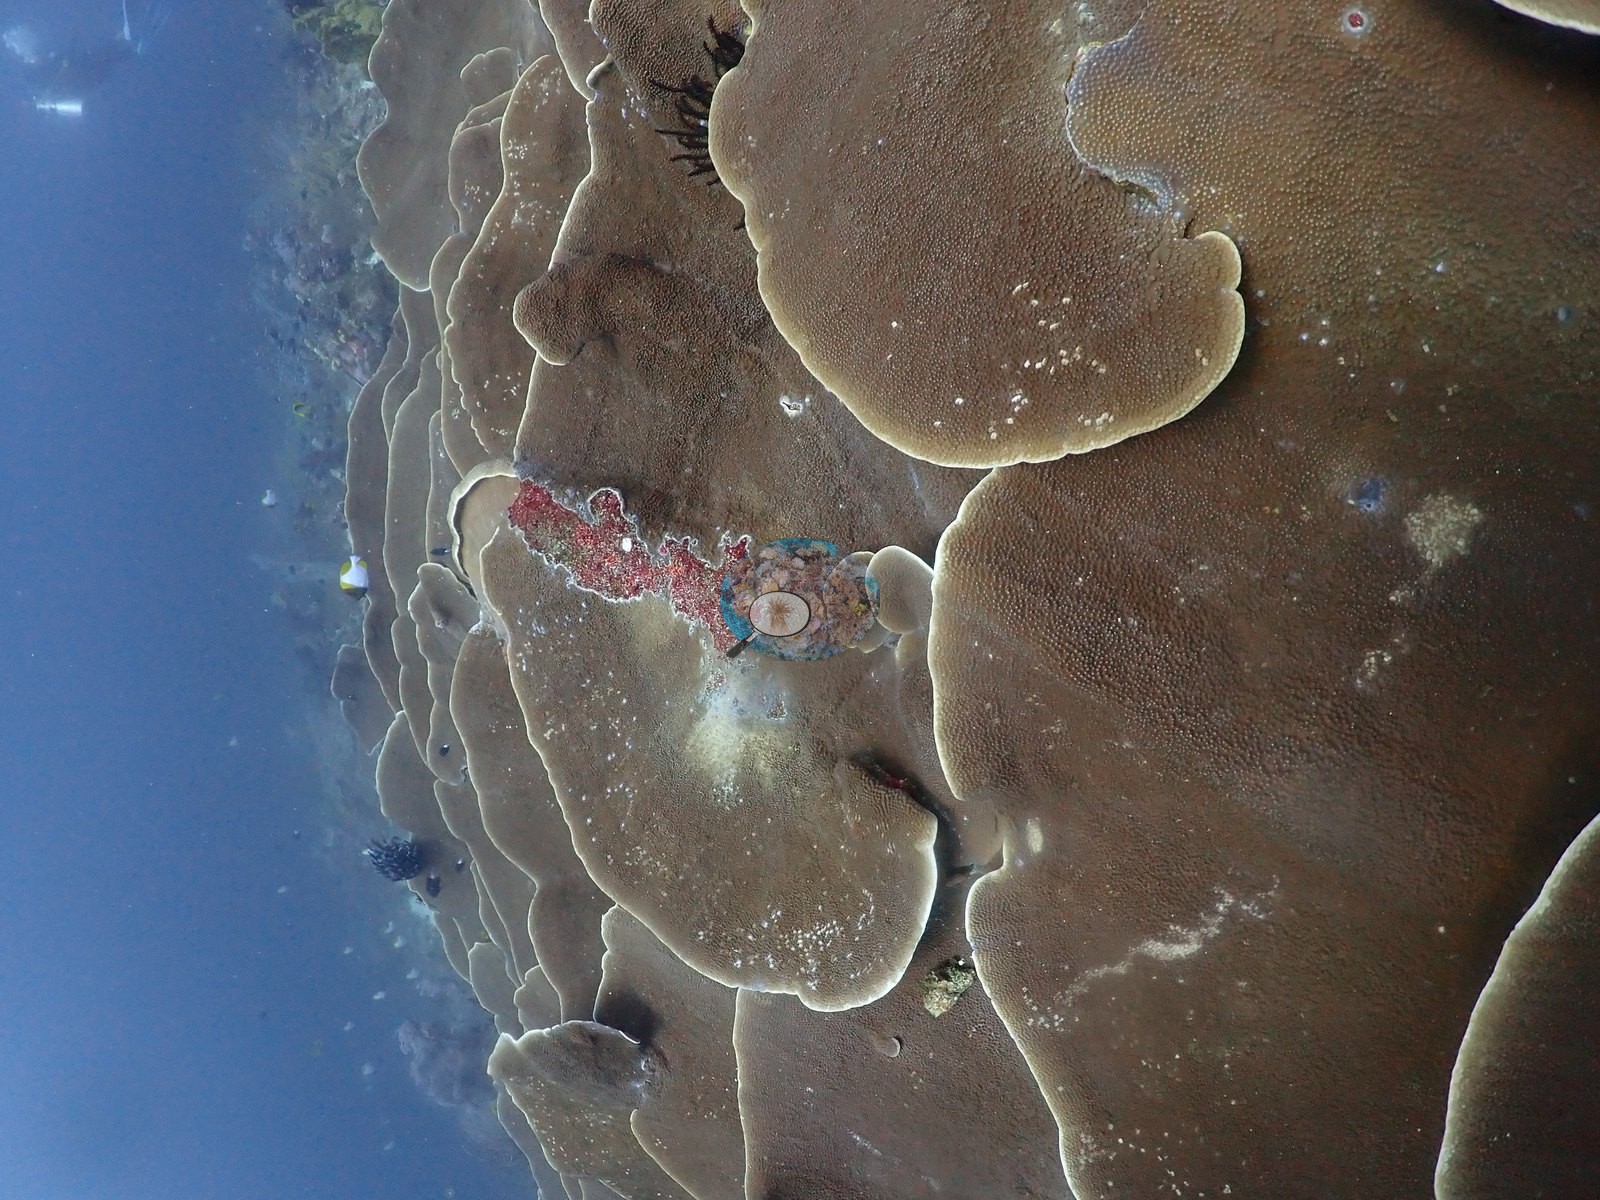
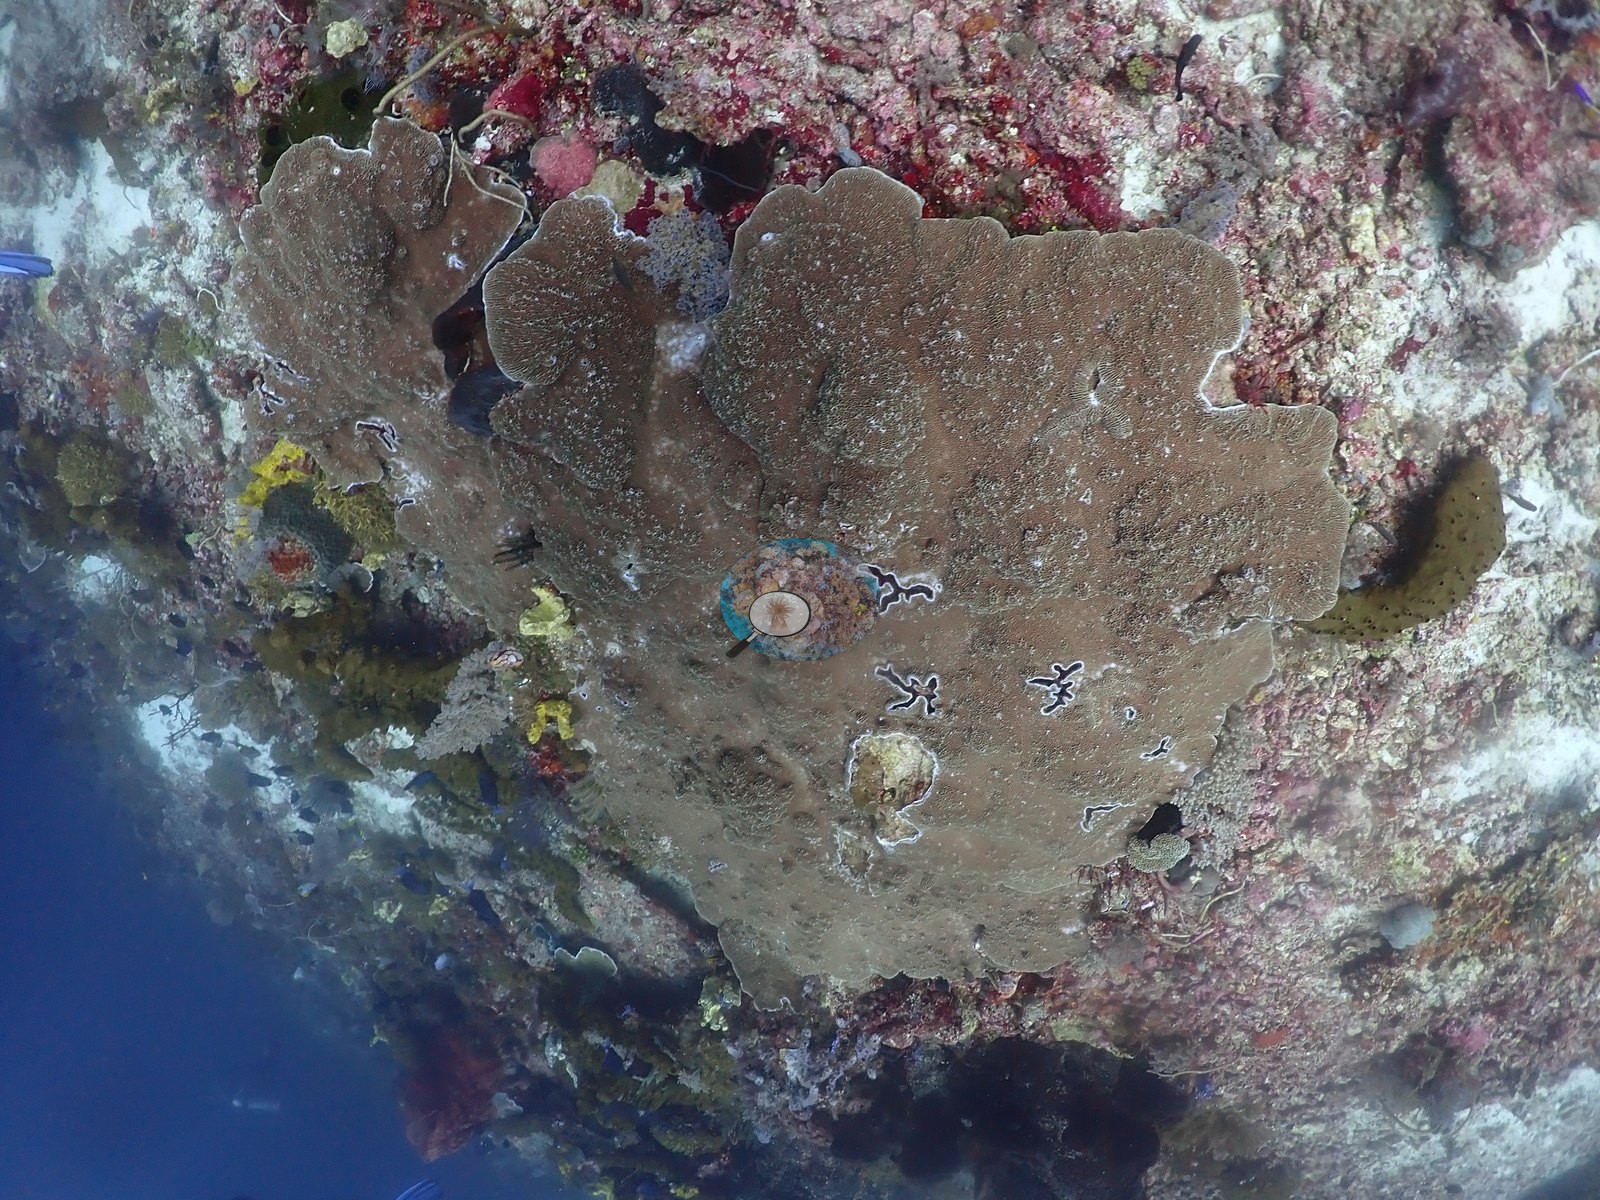
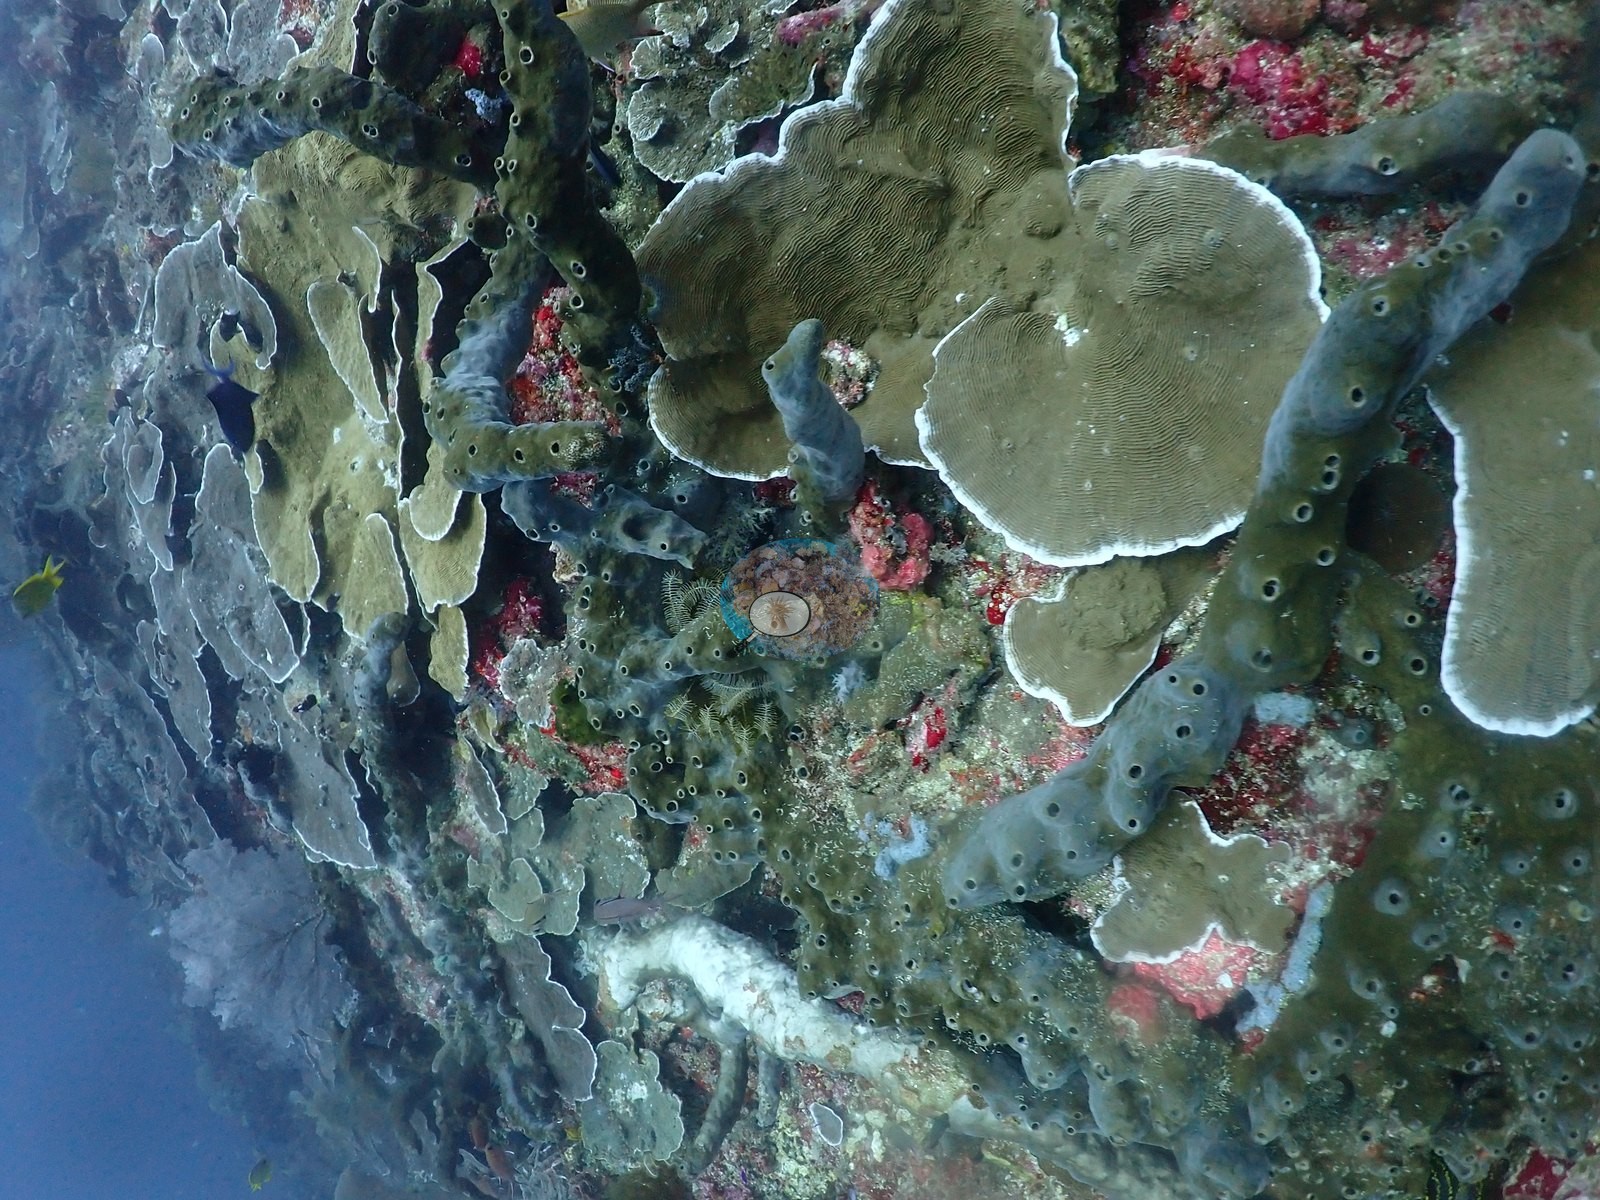
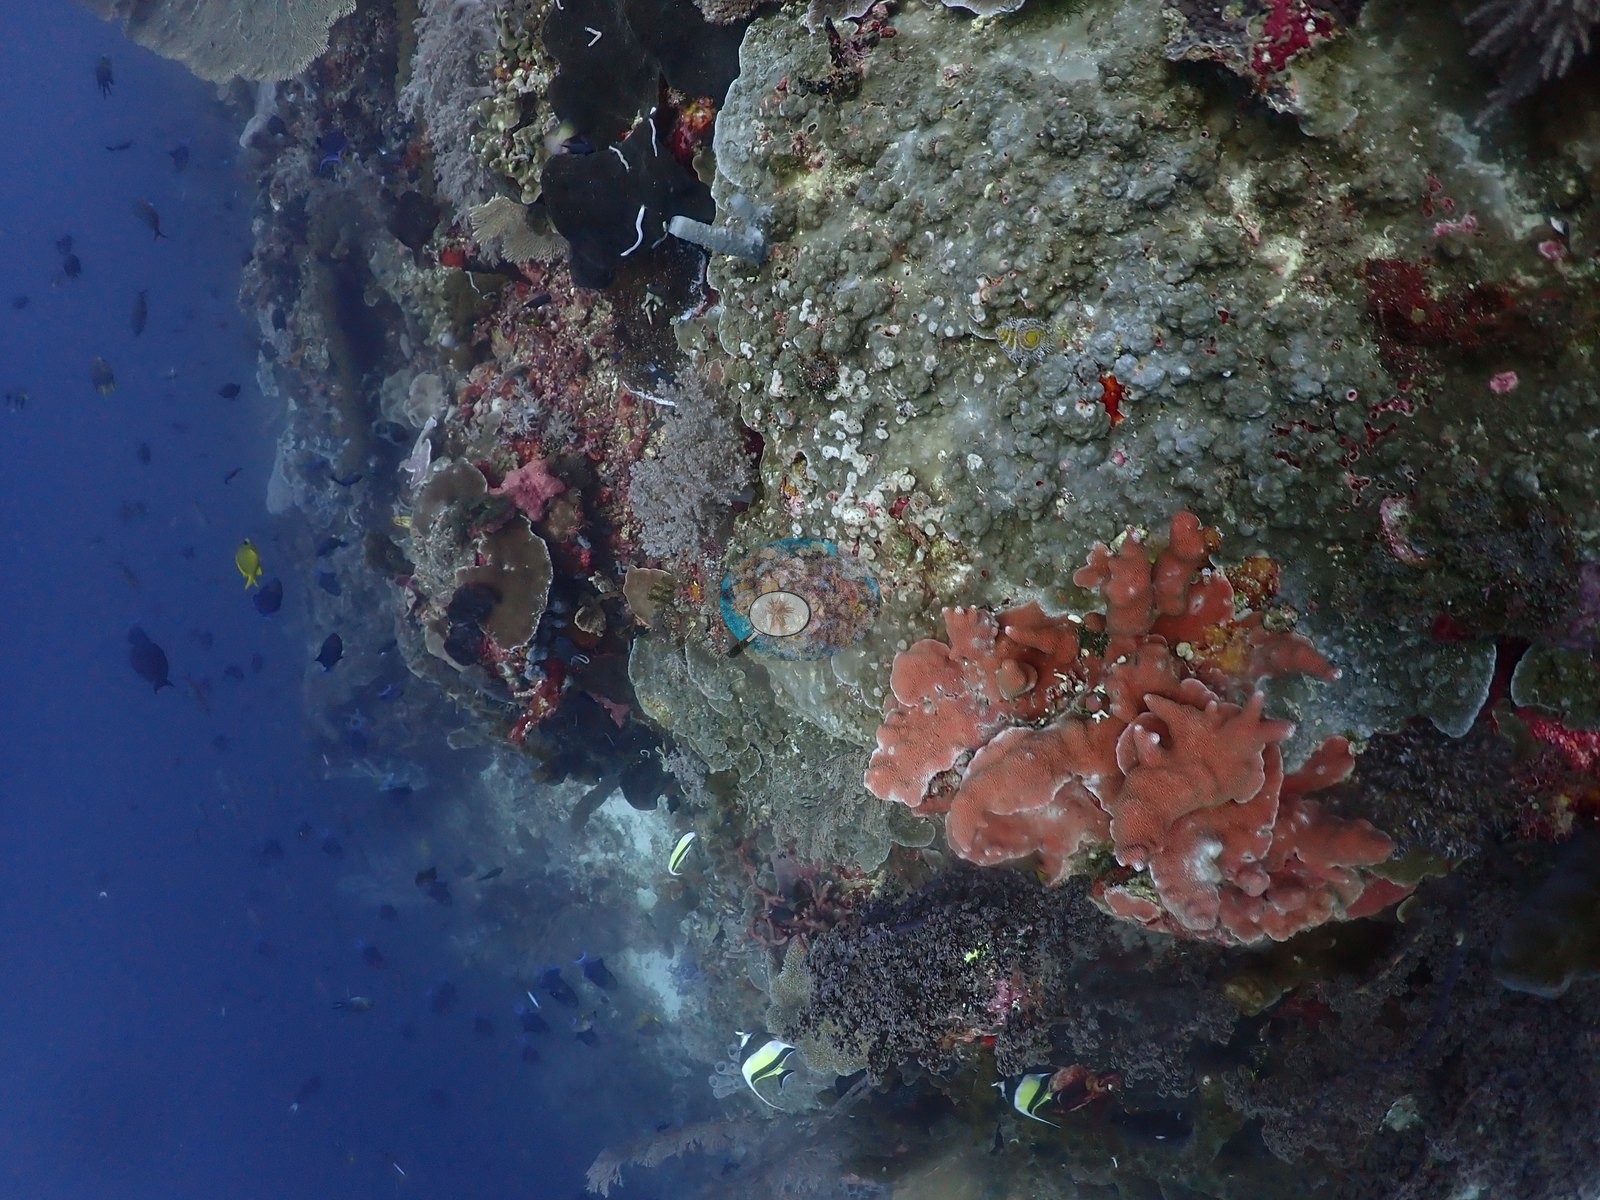
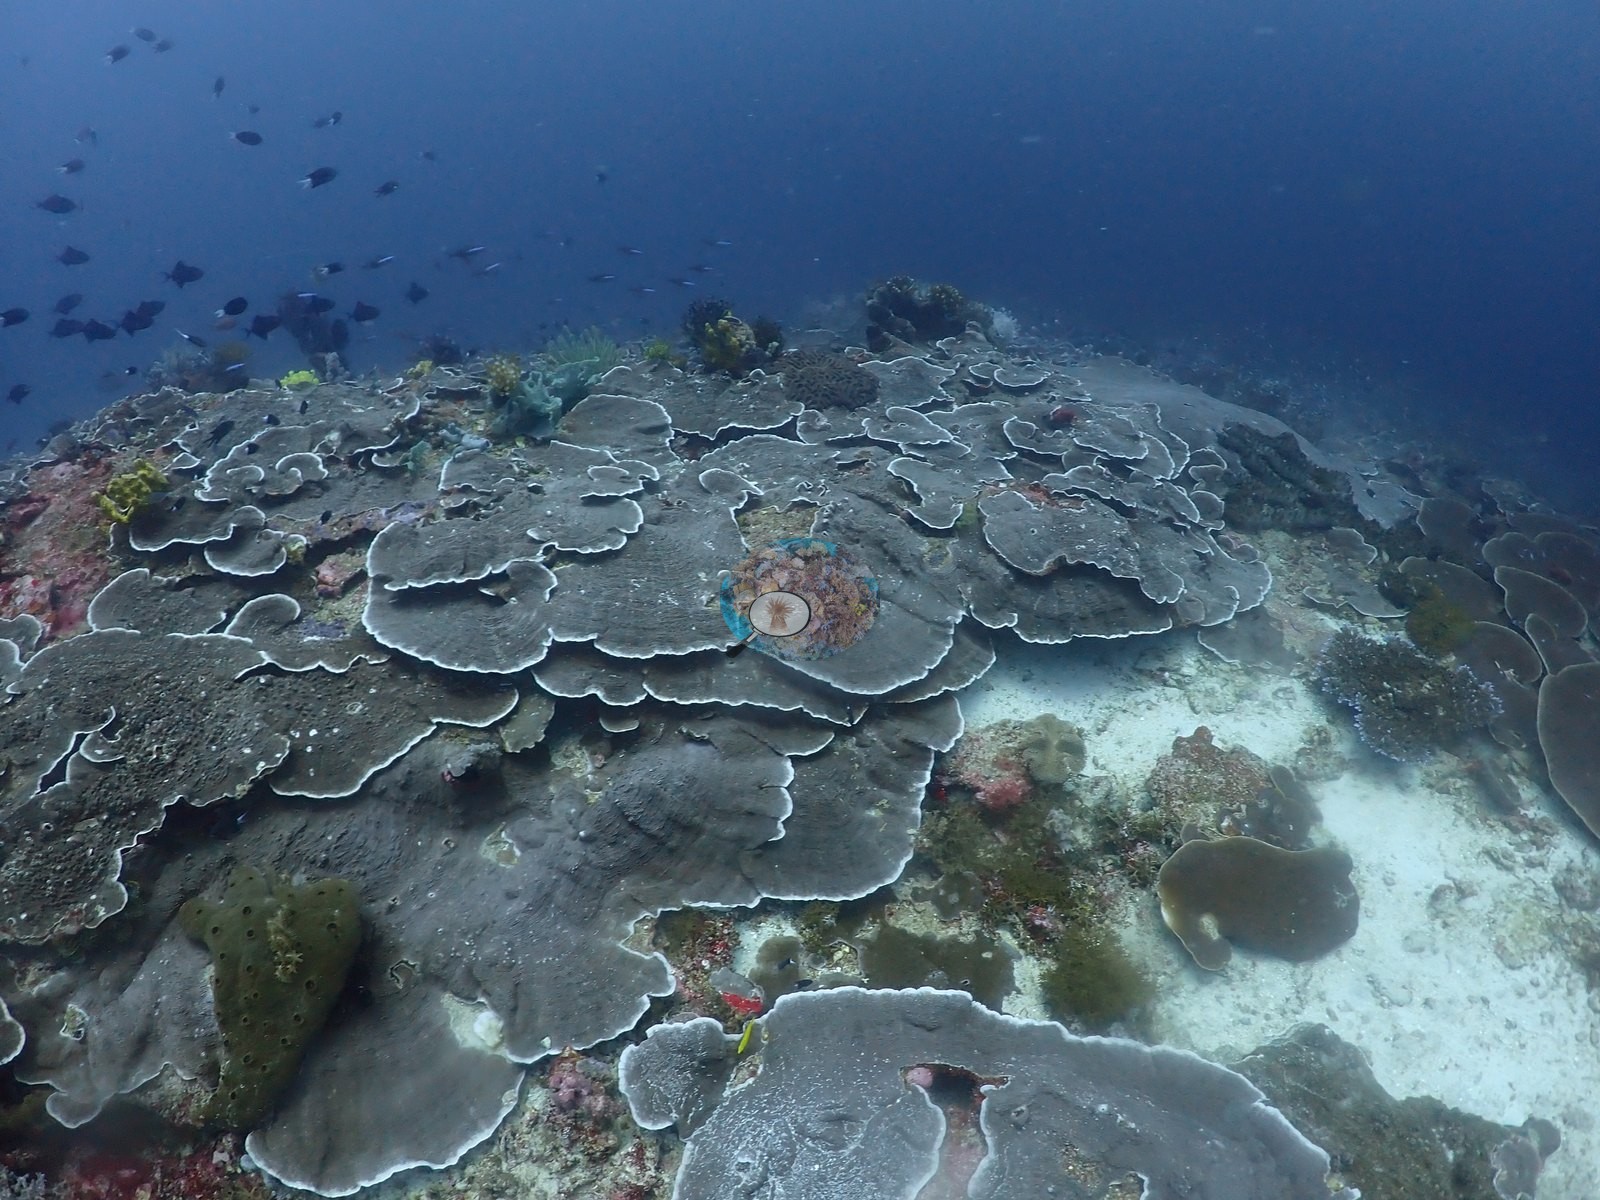
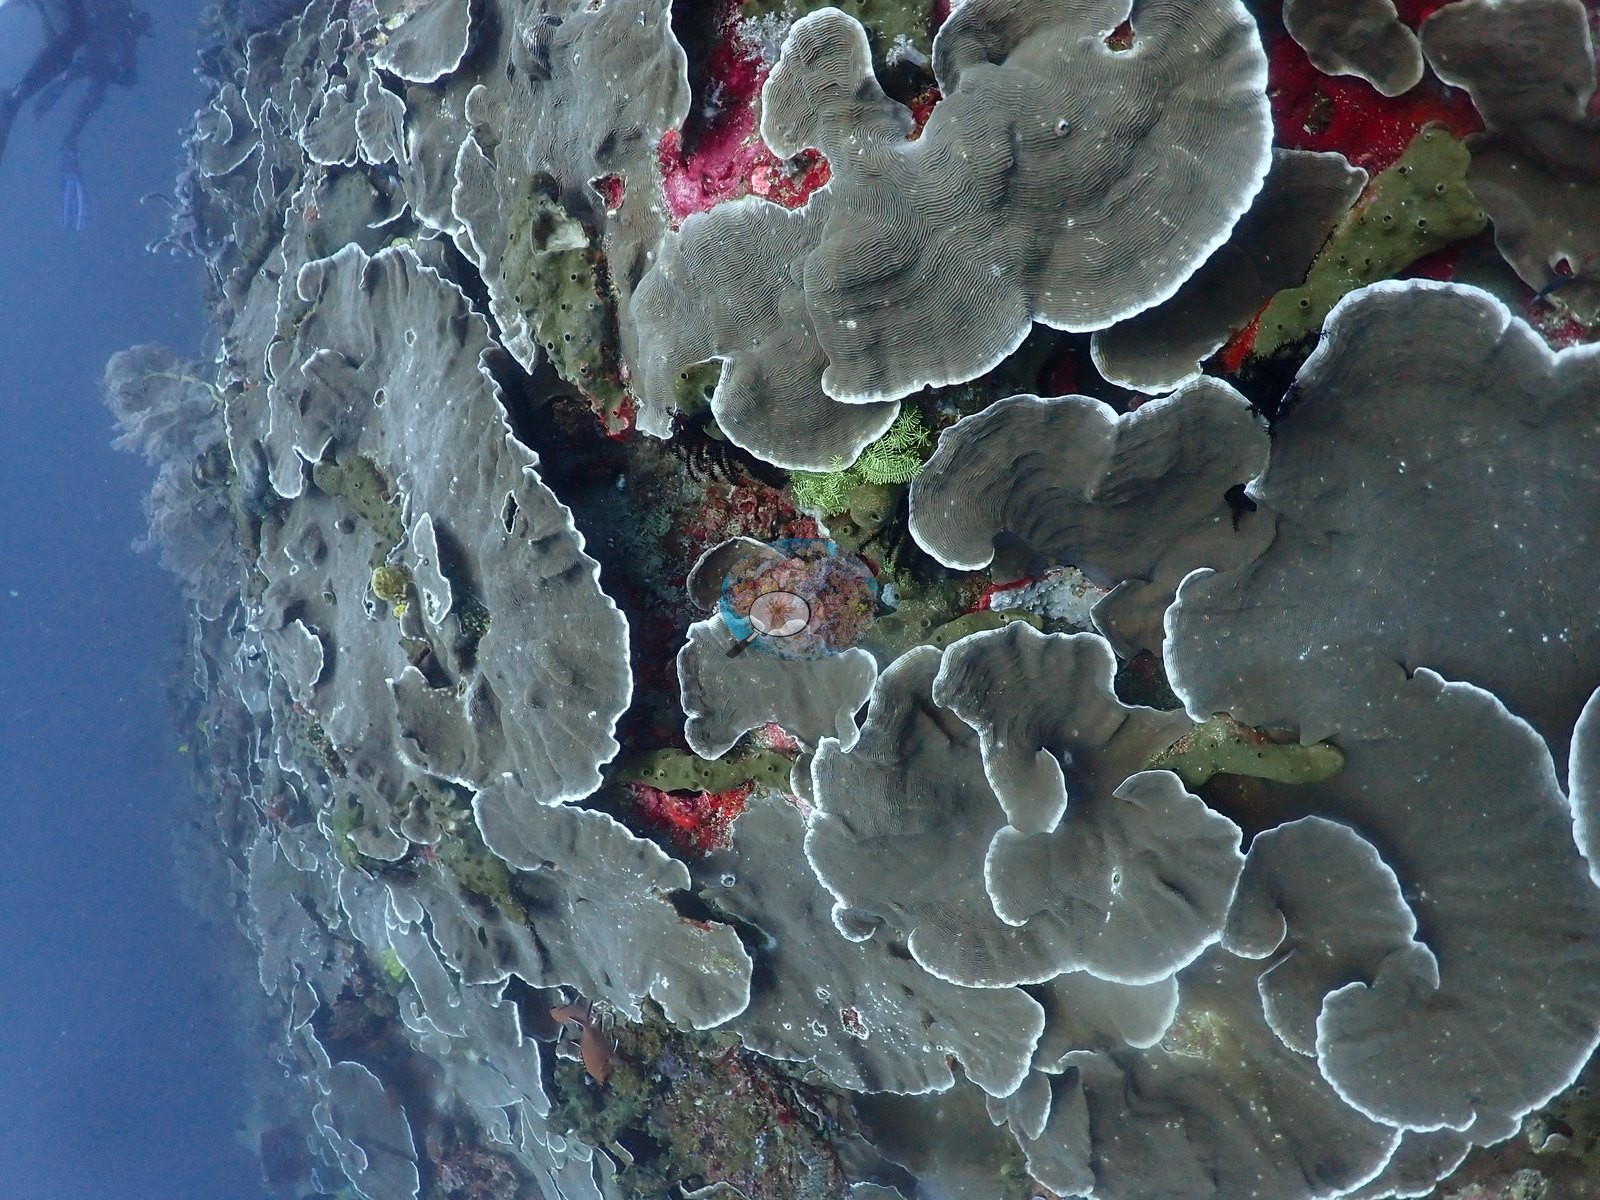
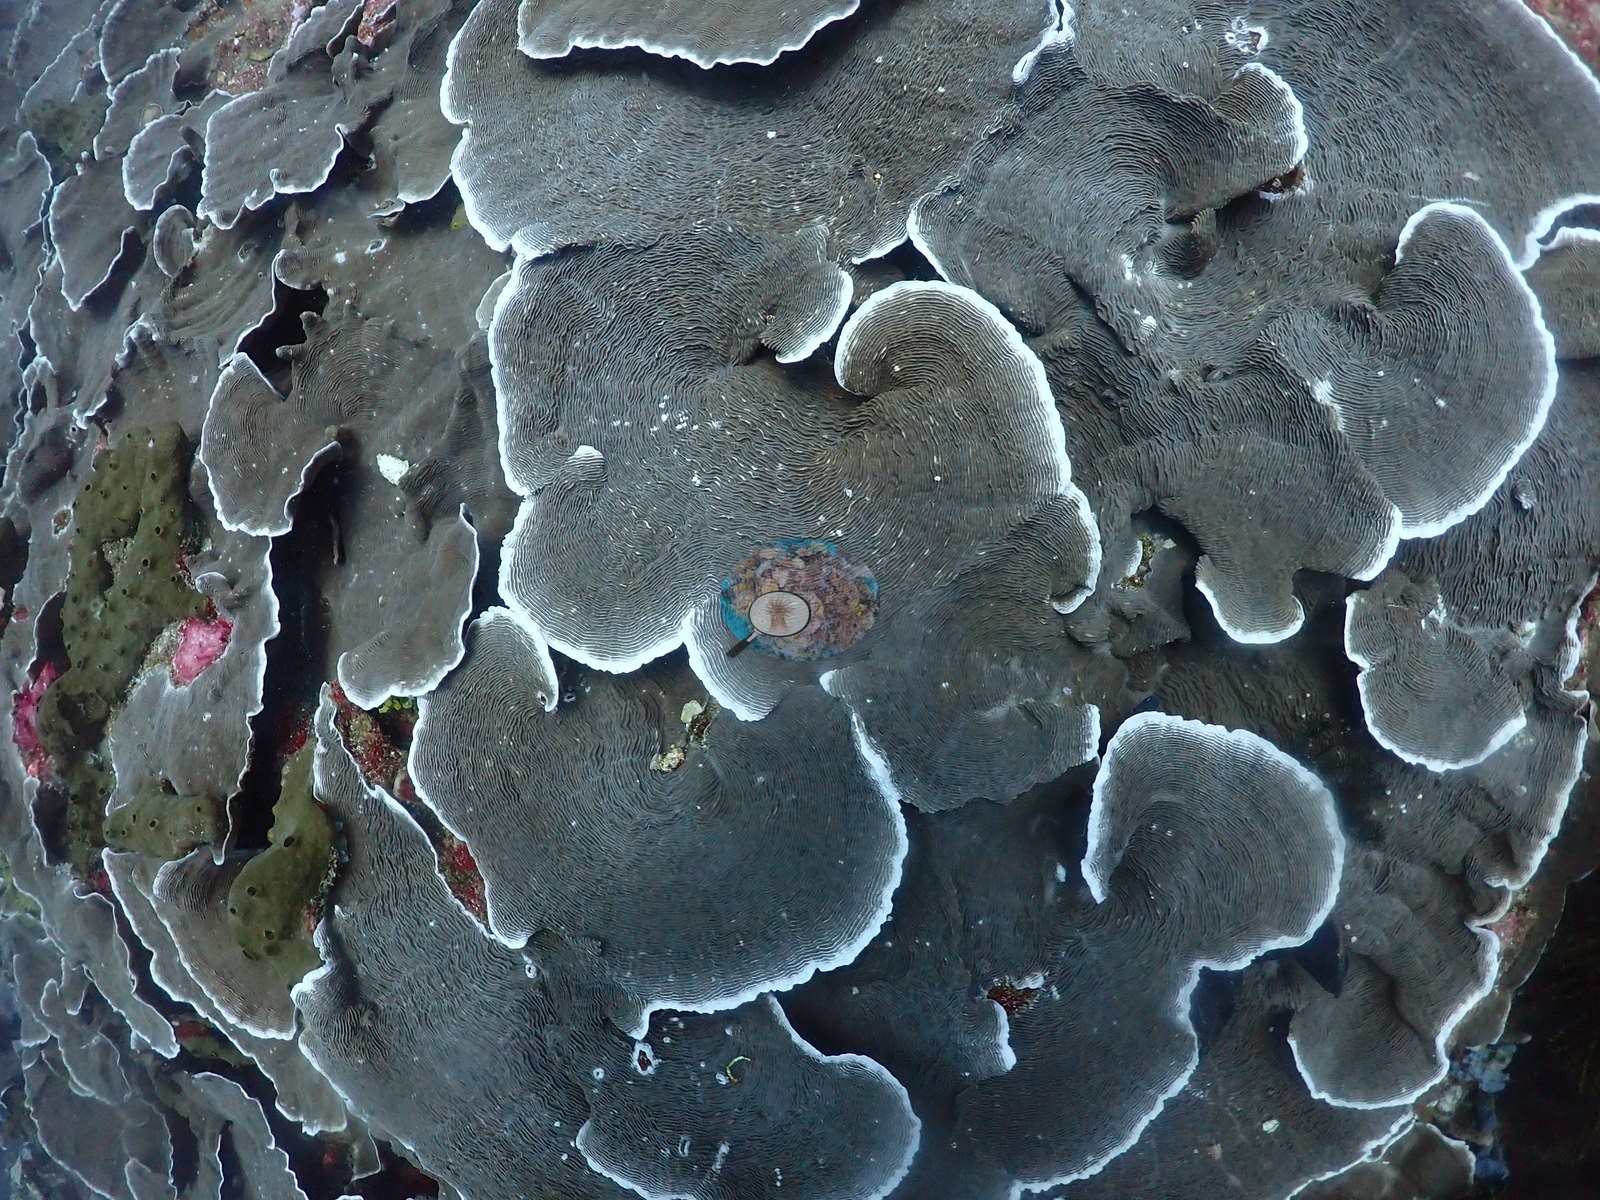
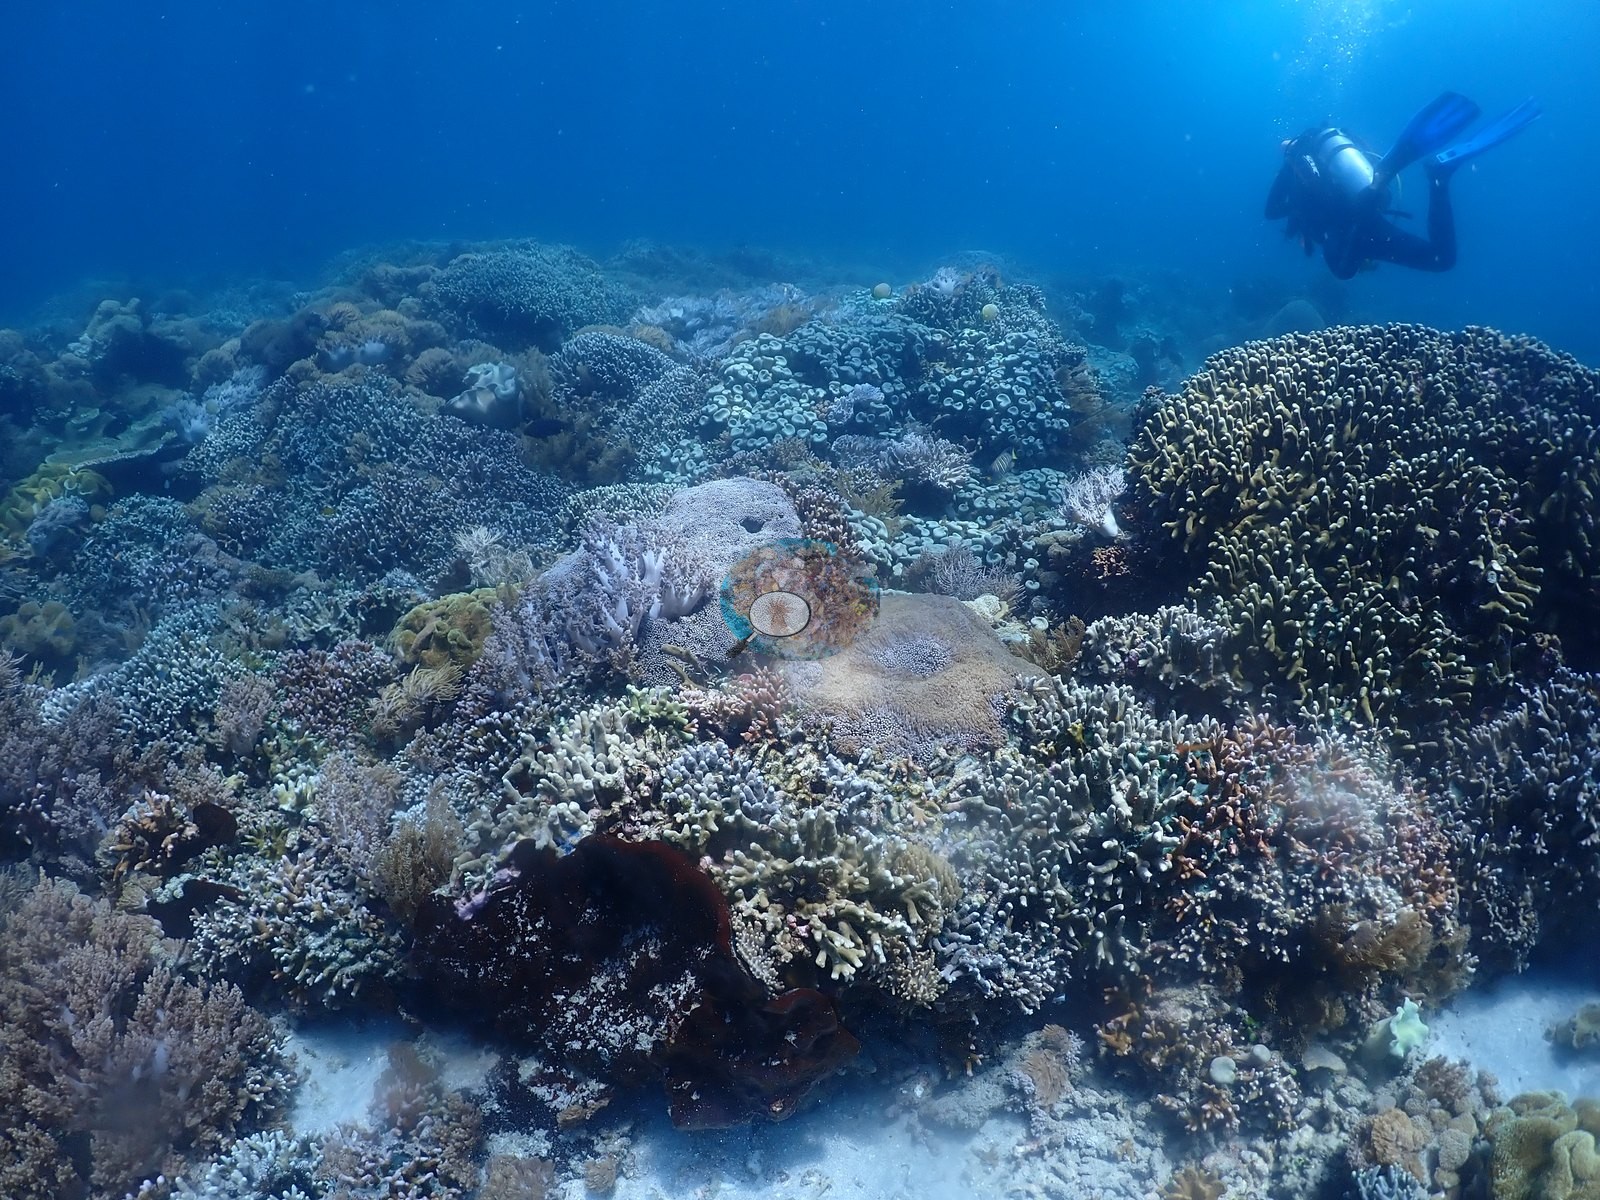
The deep flank is a steep pinnacle wall in flat blue-gray light, and its dominant cover is not branching coral at all but sheet after sheet of shingled foliose plate coral with bright pale growing margins, stacked into overlapping tiers (a run of ten frames is near-continuous plate) over a groundmass of magenta and scarlet crustose coralline algae, red and orange encrusting sponges, blue tube sponges, and small violet and lilac sea fans (e.g., Image 1, Image 8, Image 11, Image 14, Image 16, Image 17, Image 24, Image 25, Image 26, Image 37, Image 38, Image 41, Image 42, Image 52, Image 54).
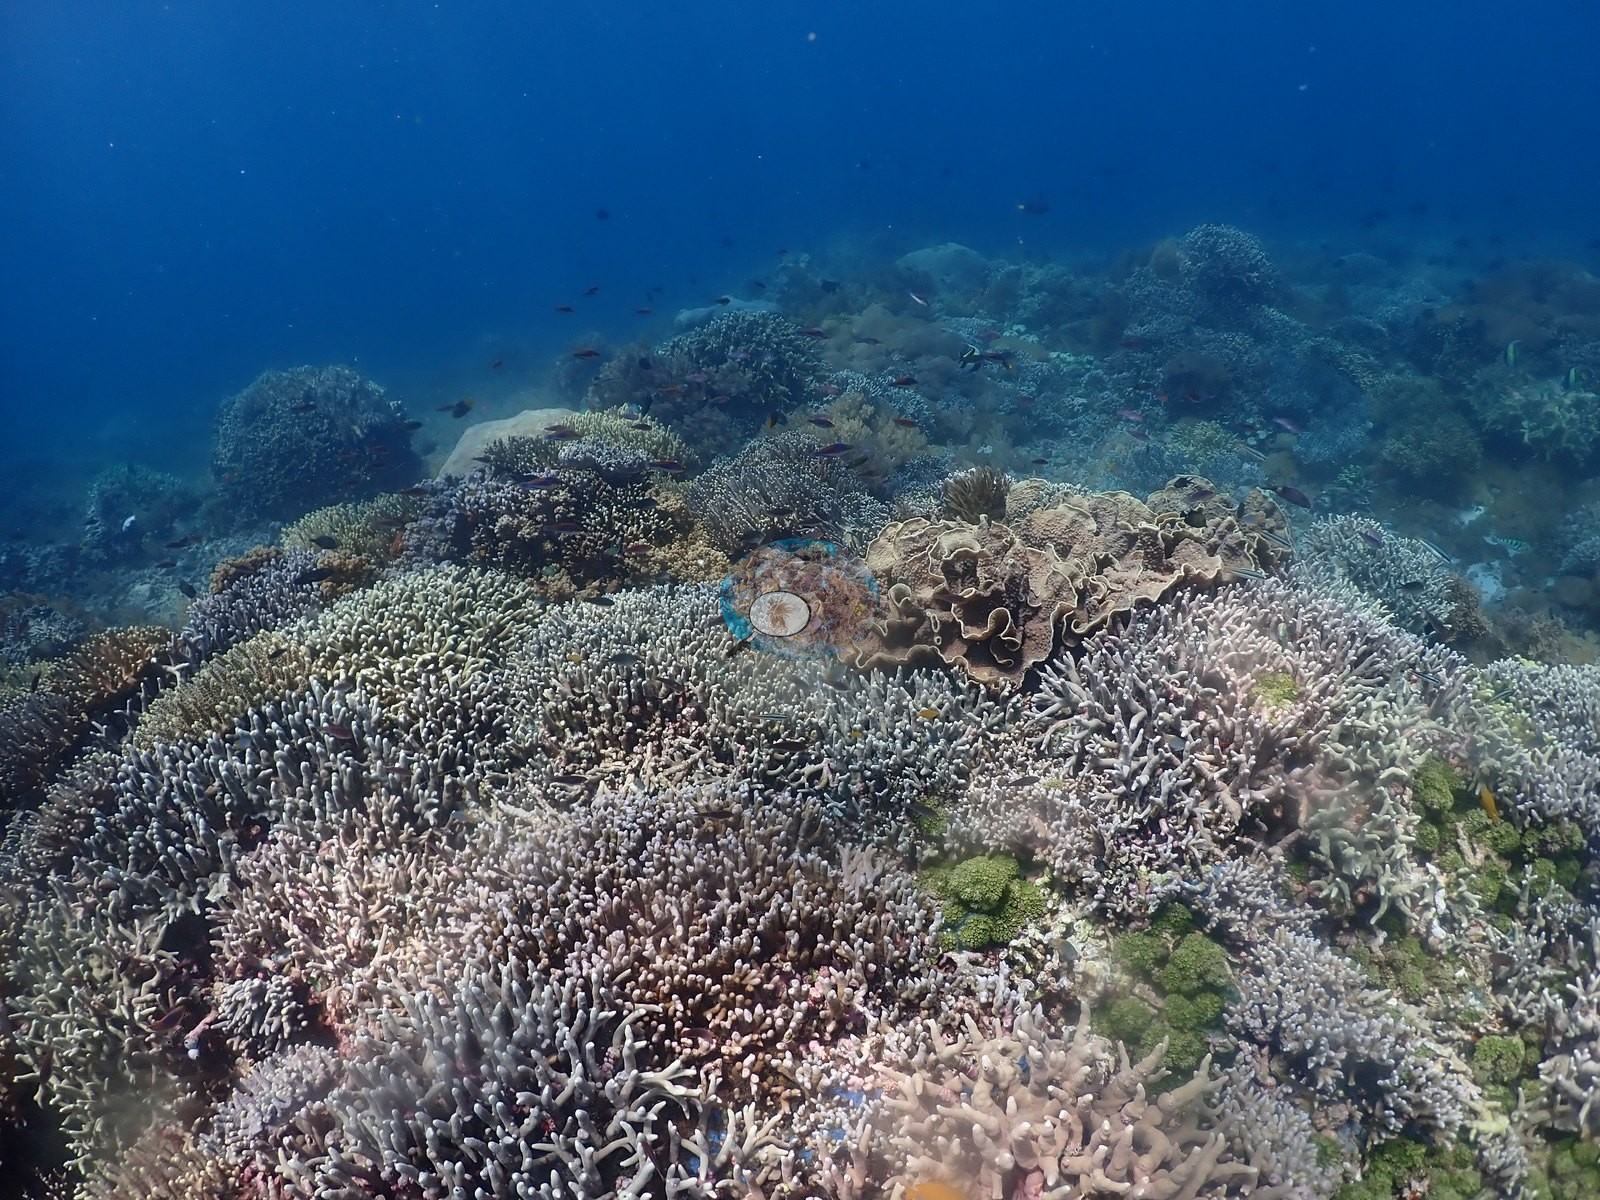
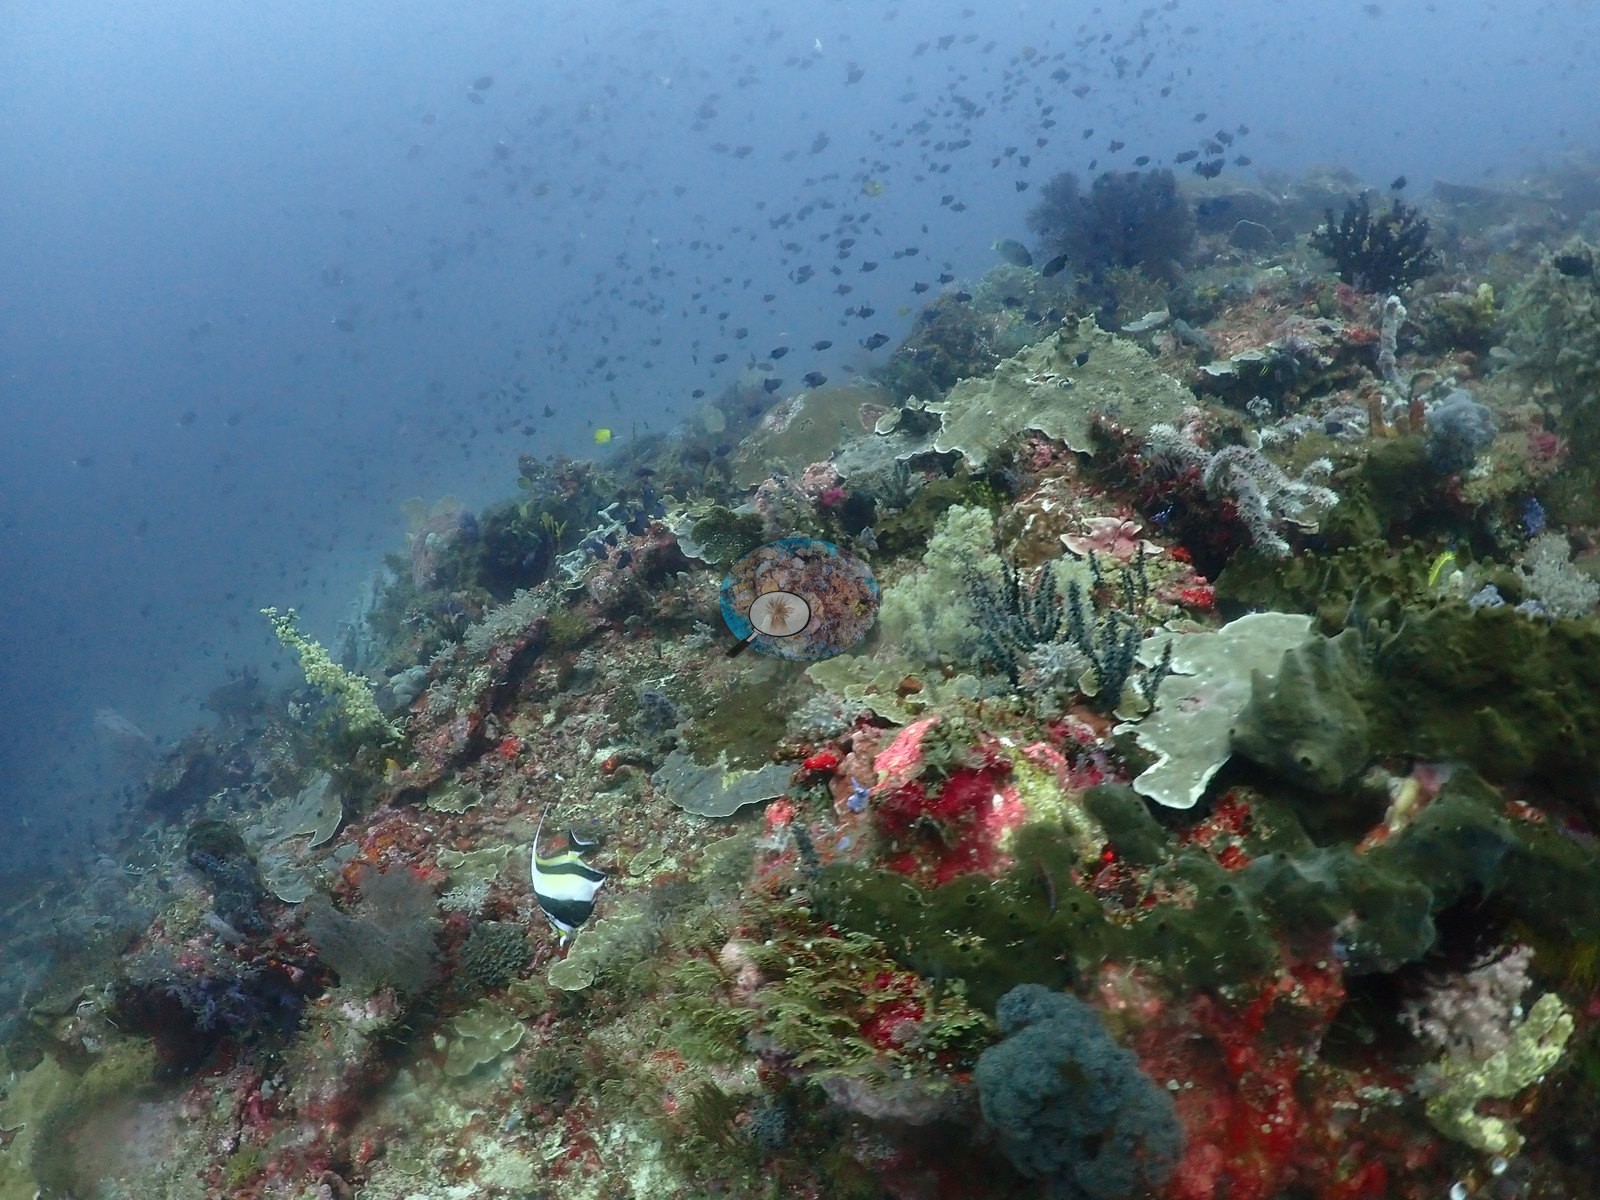
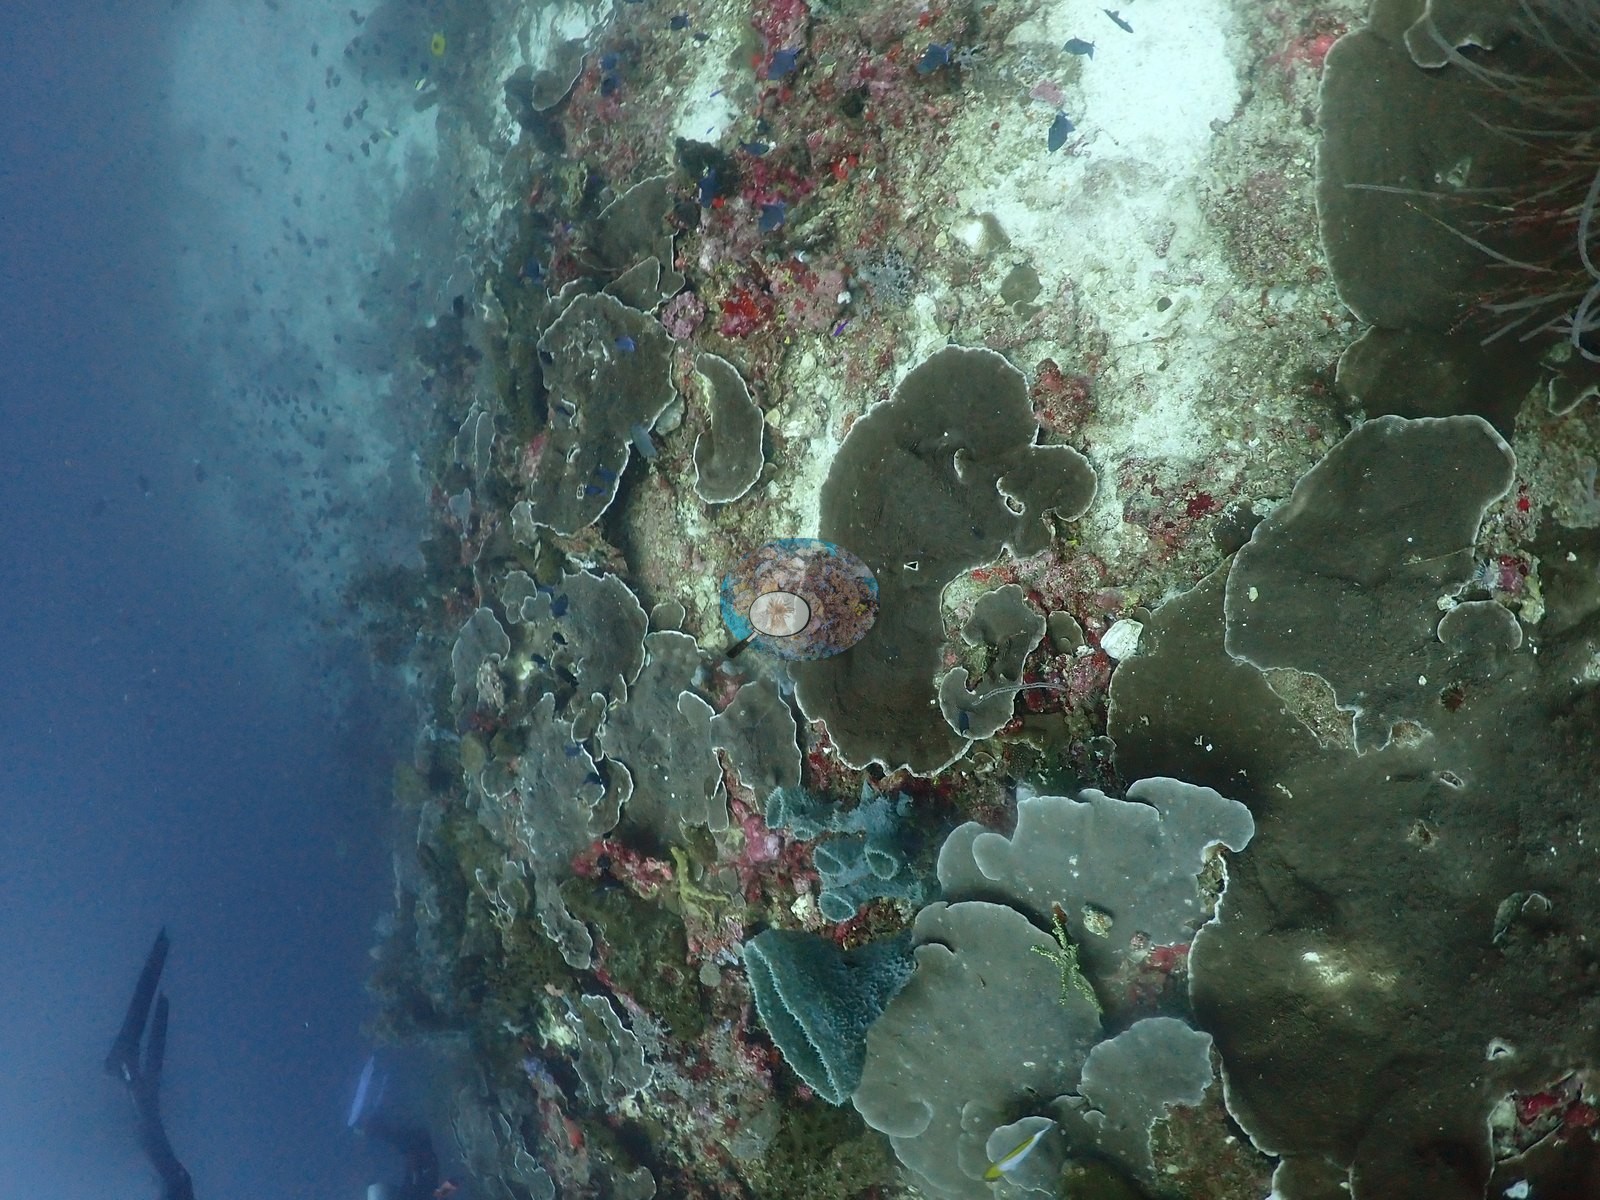
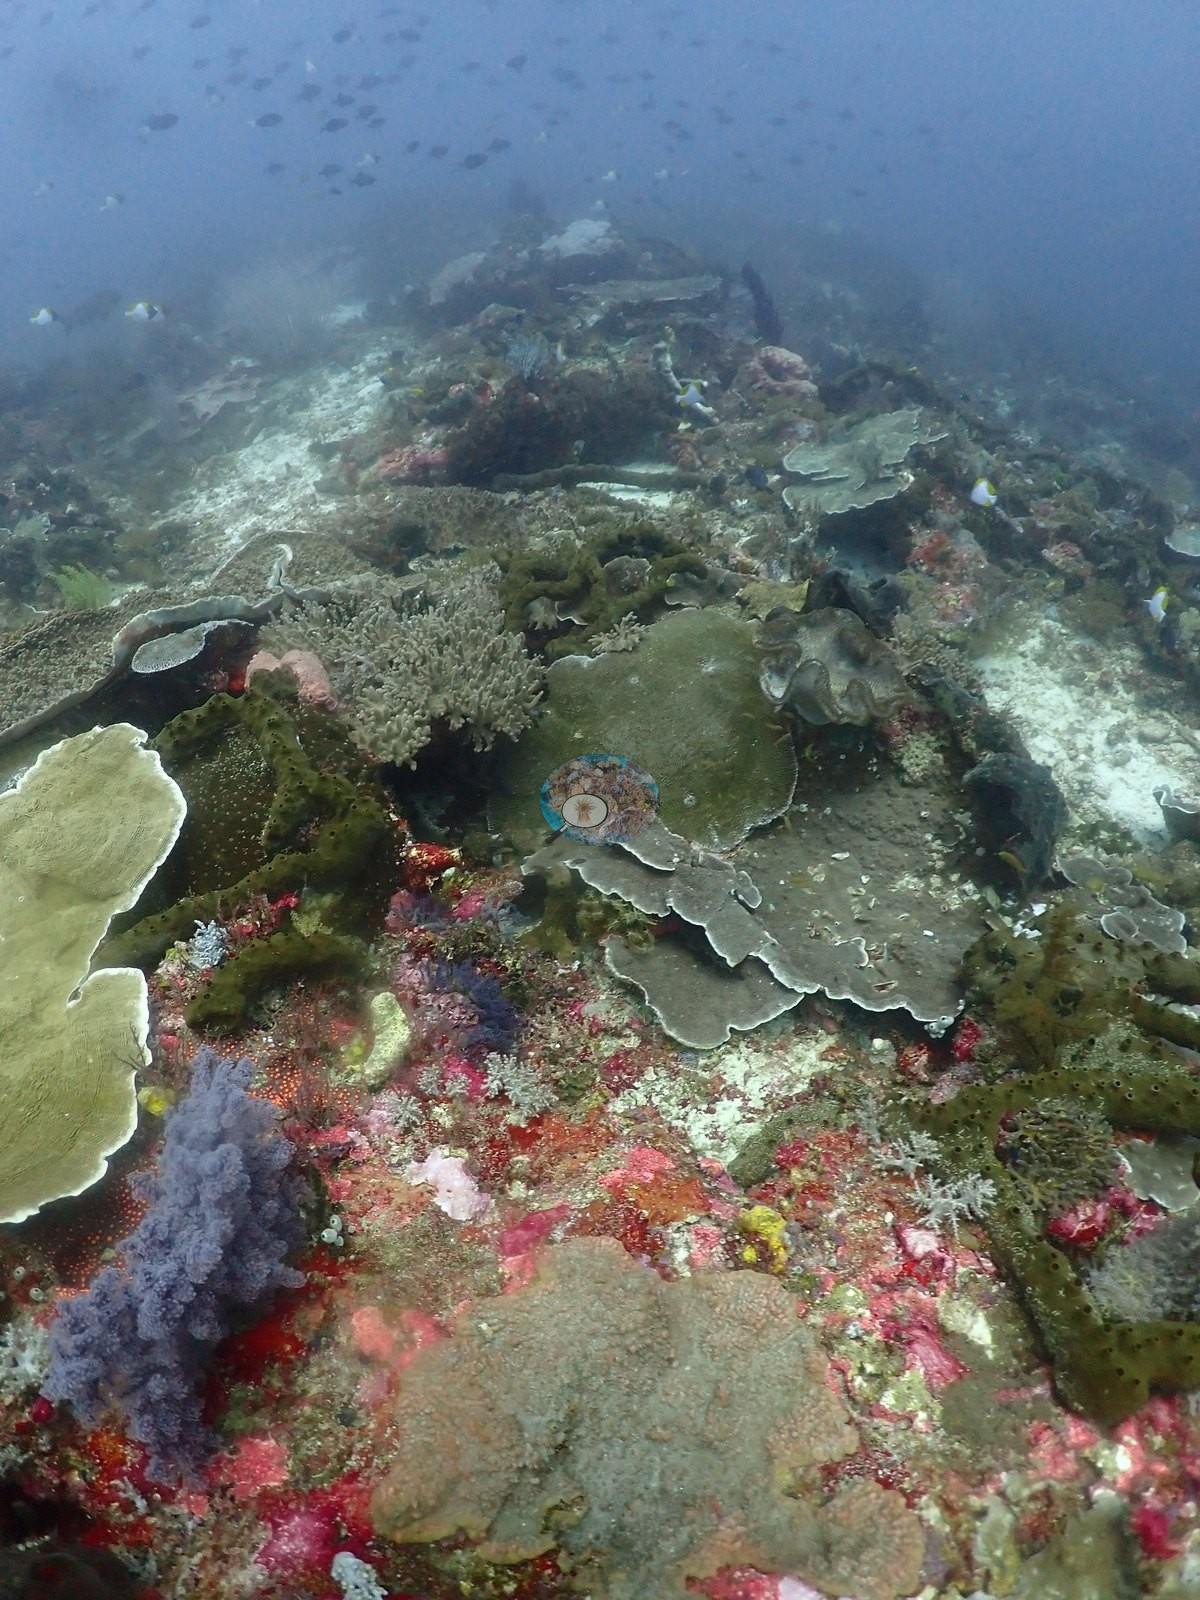
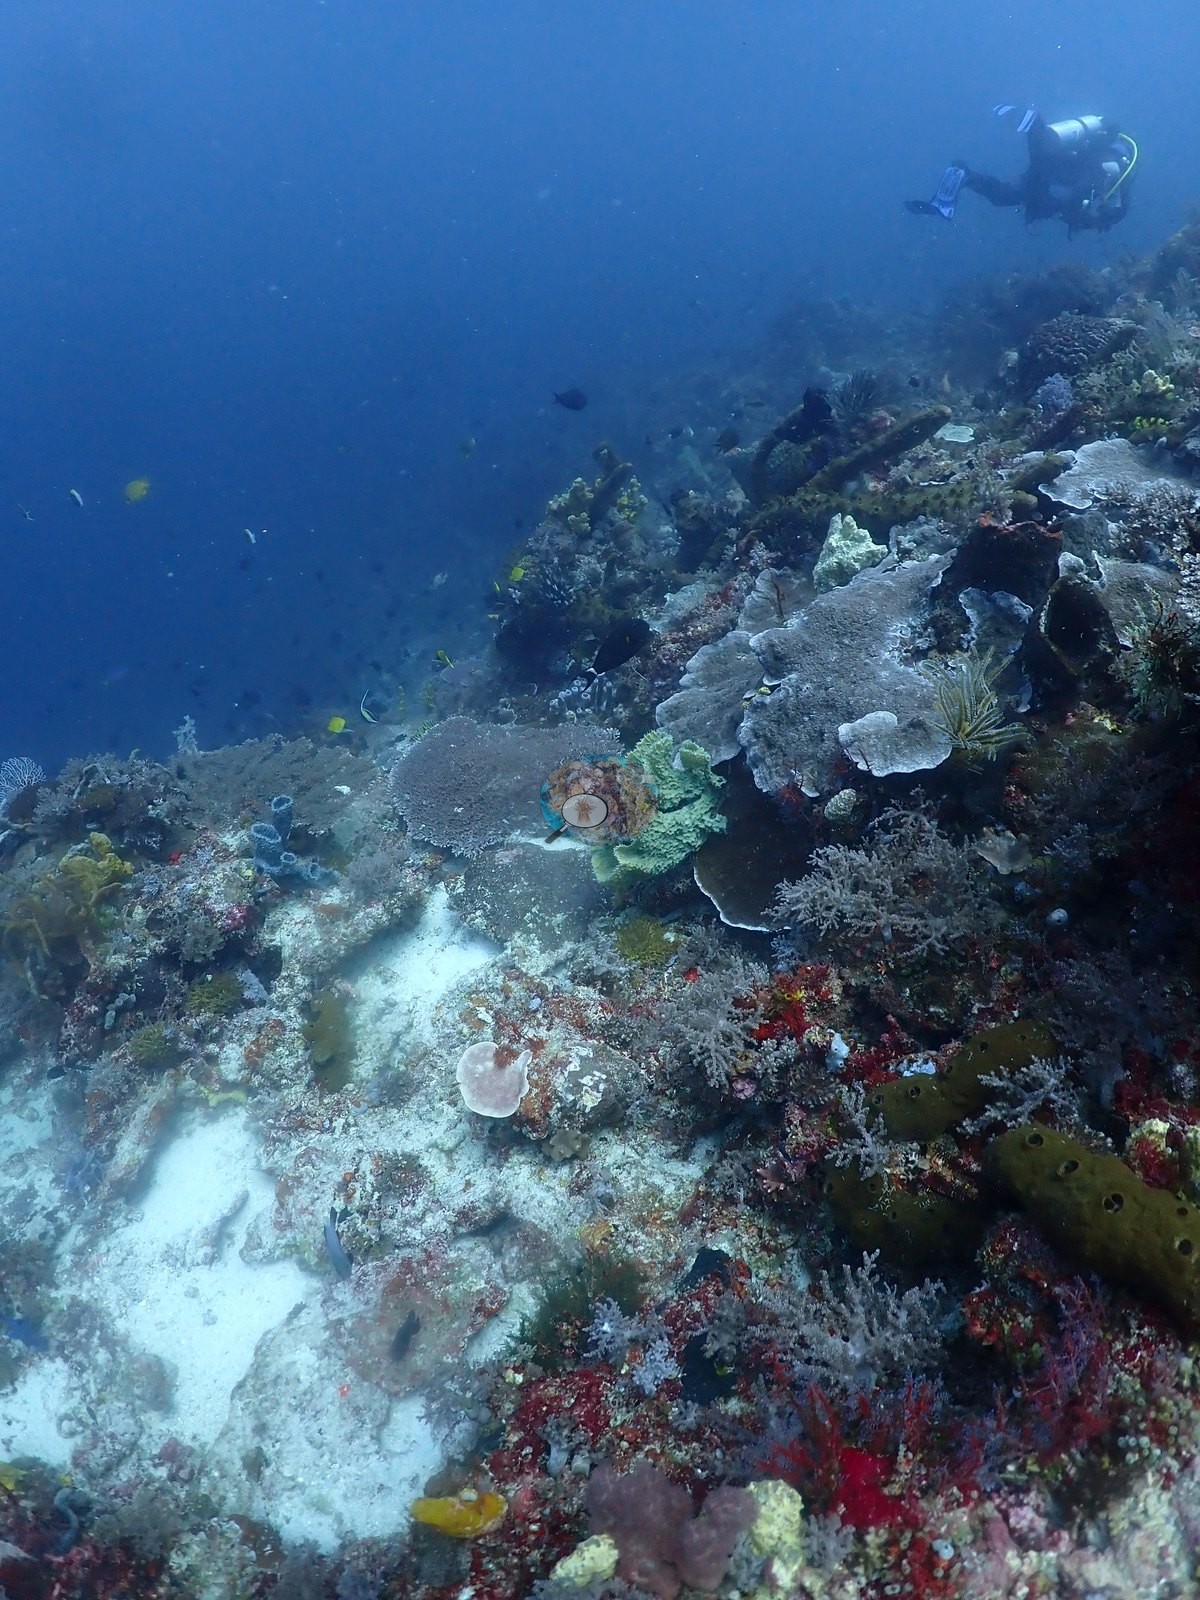
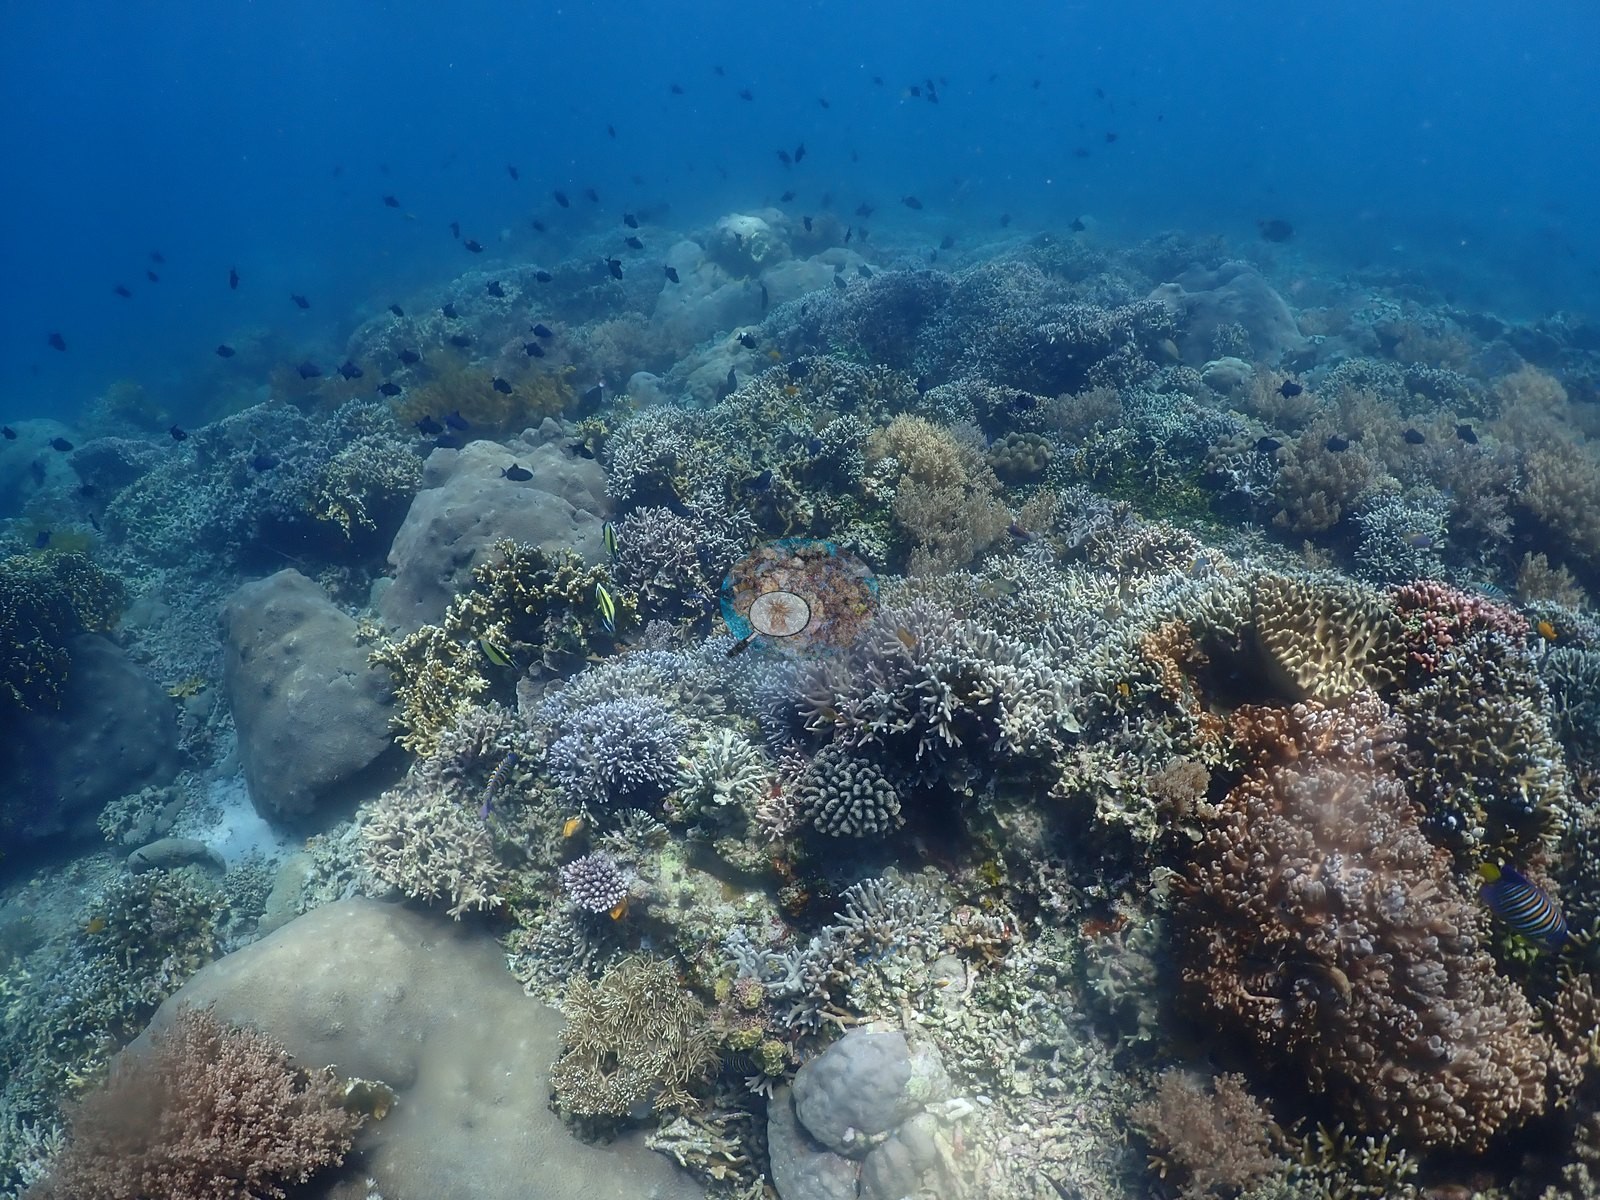
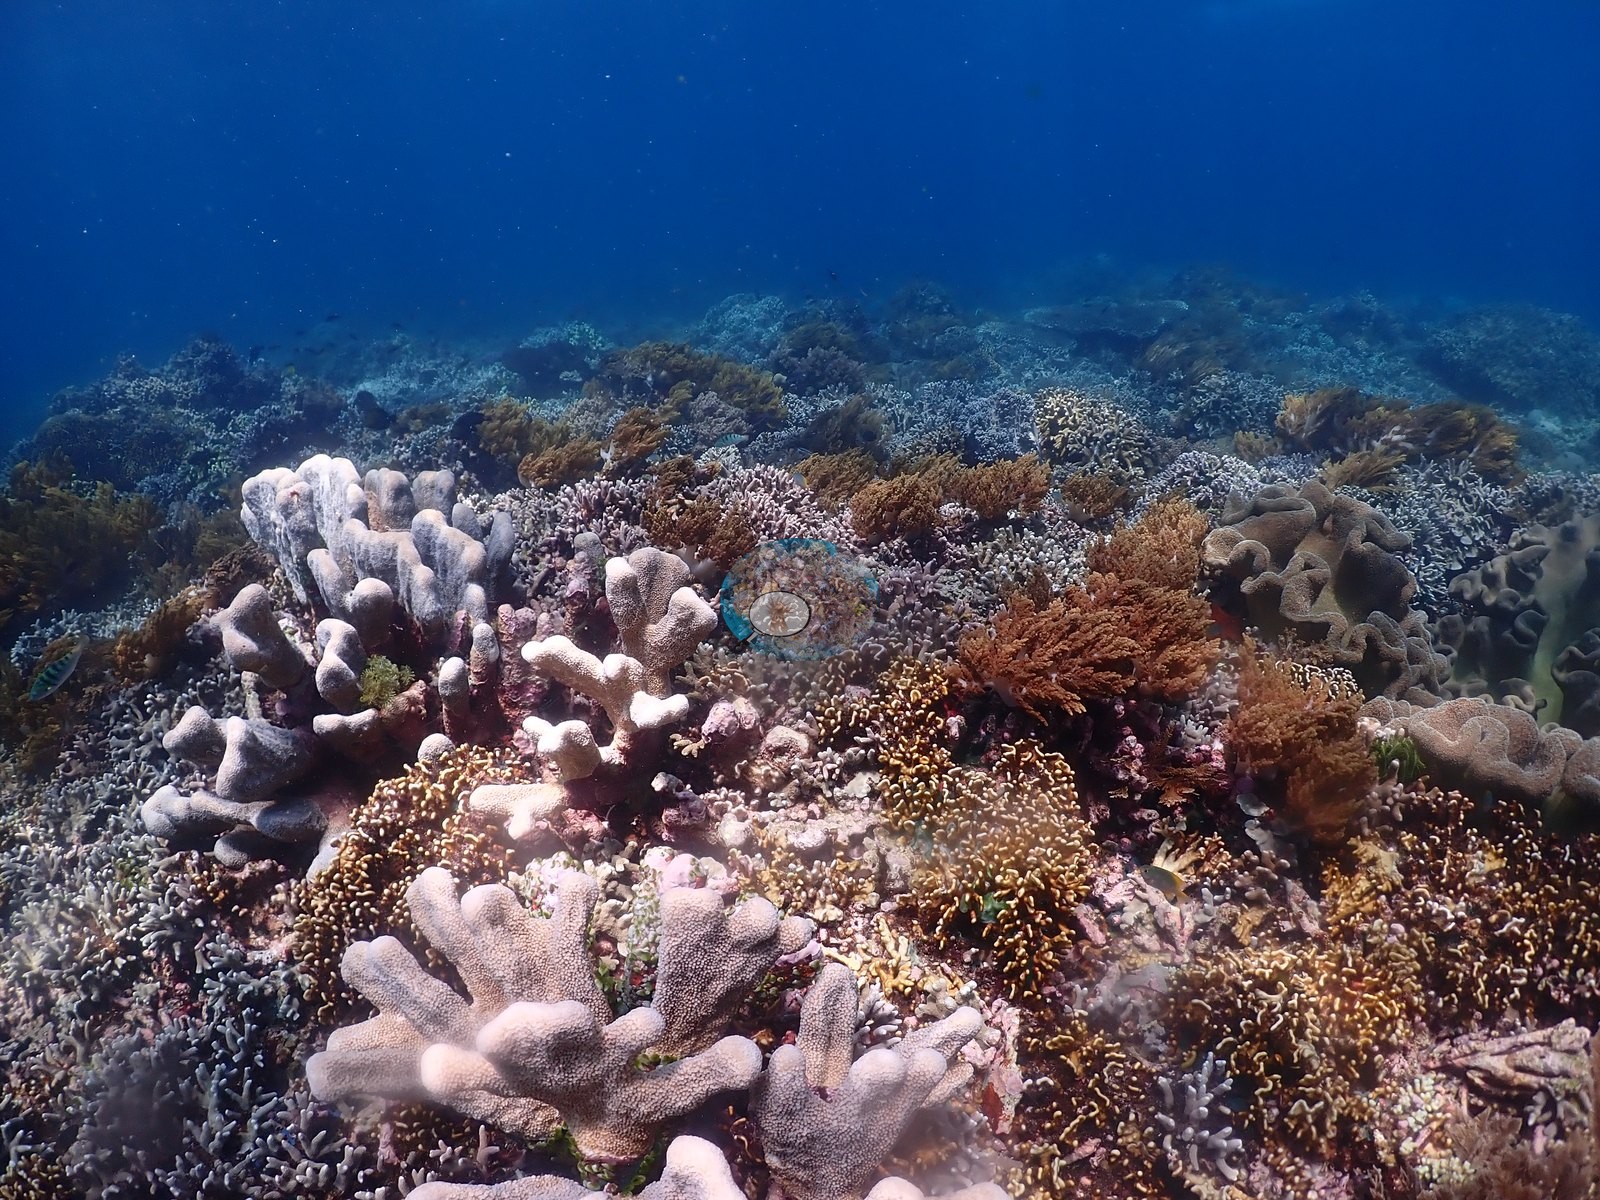
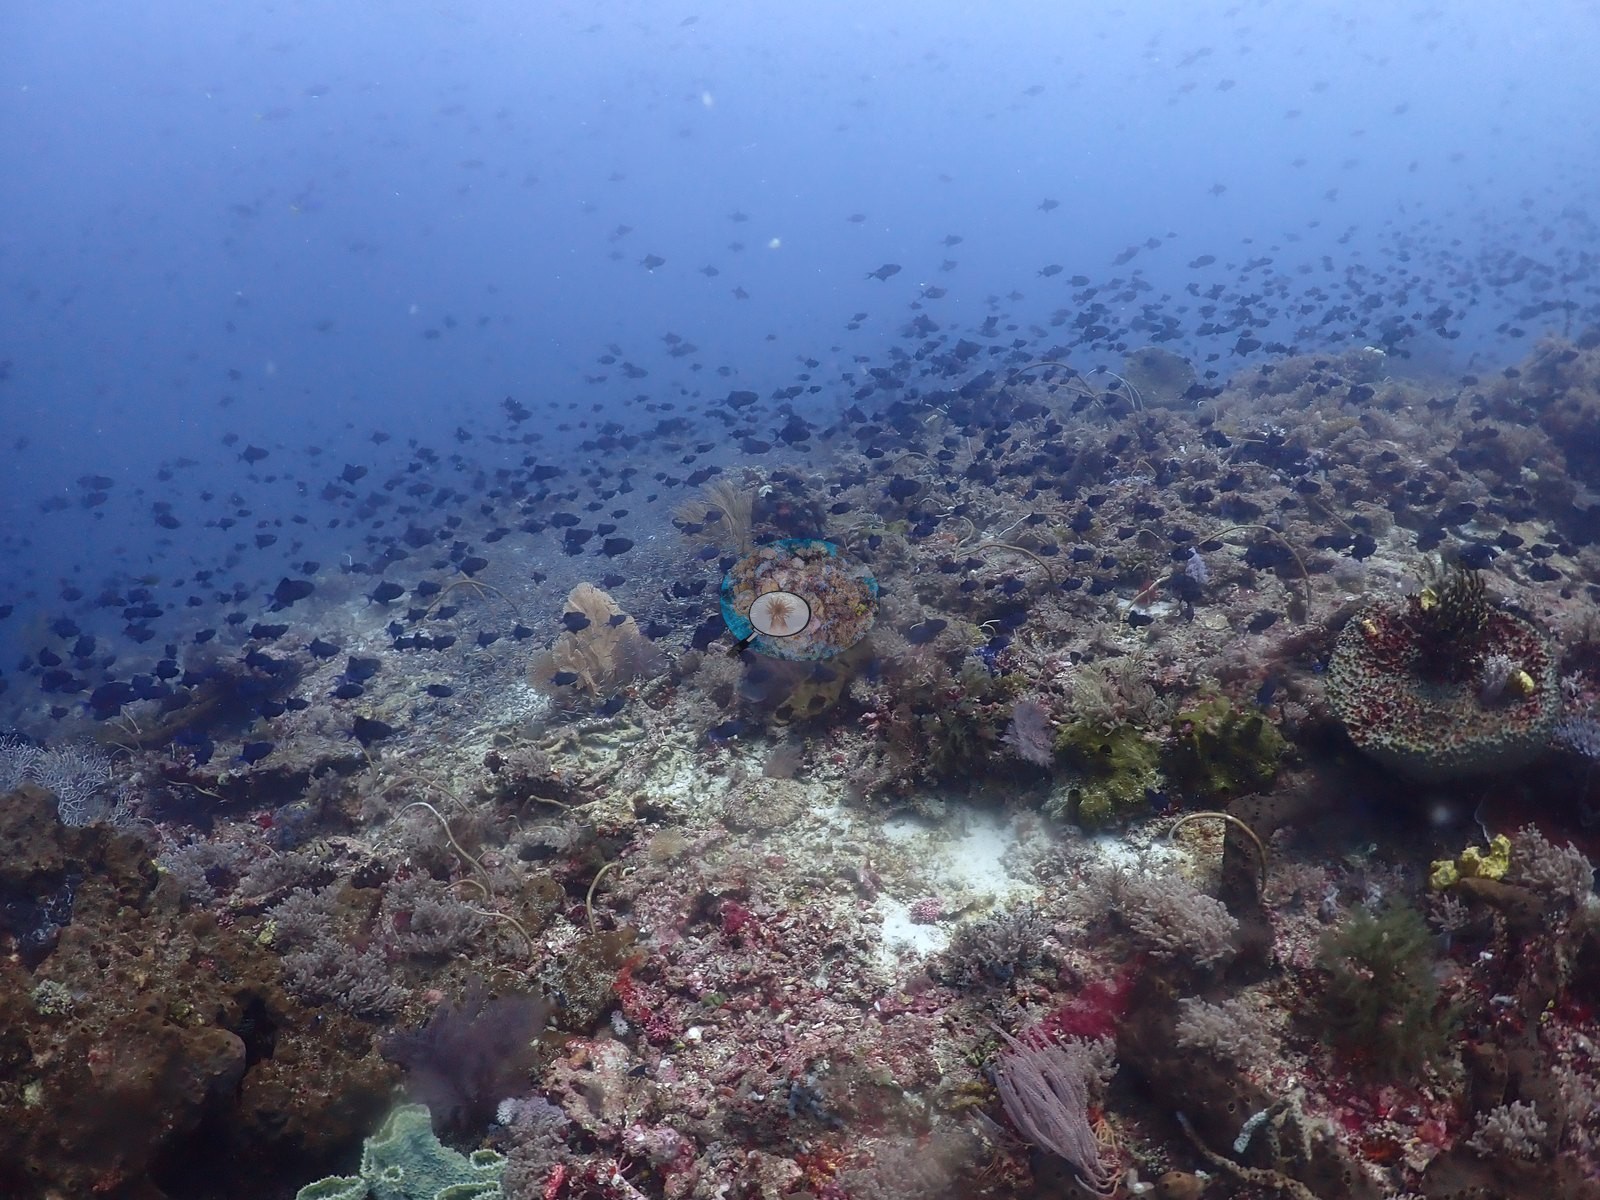
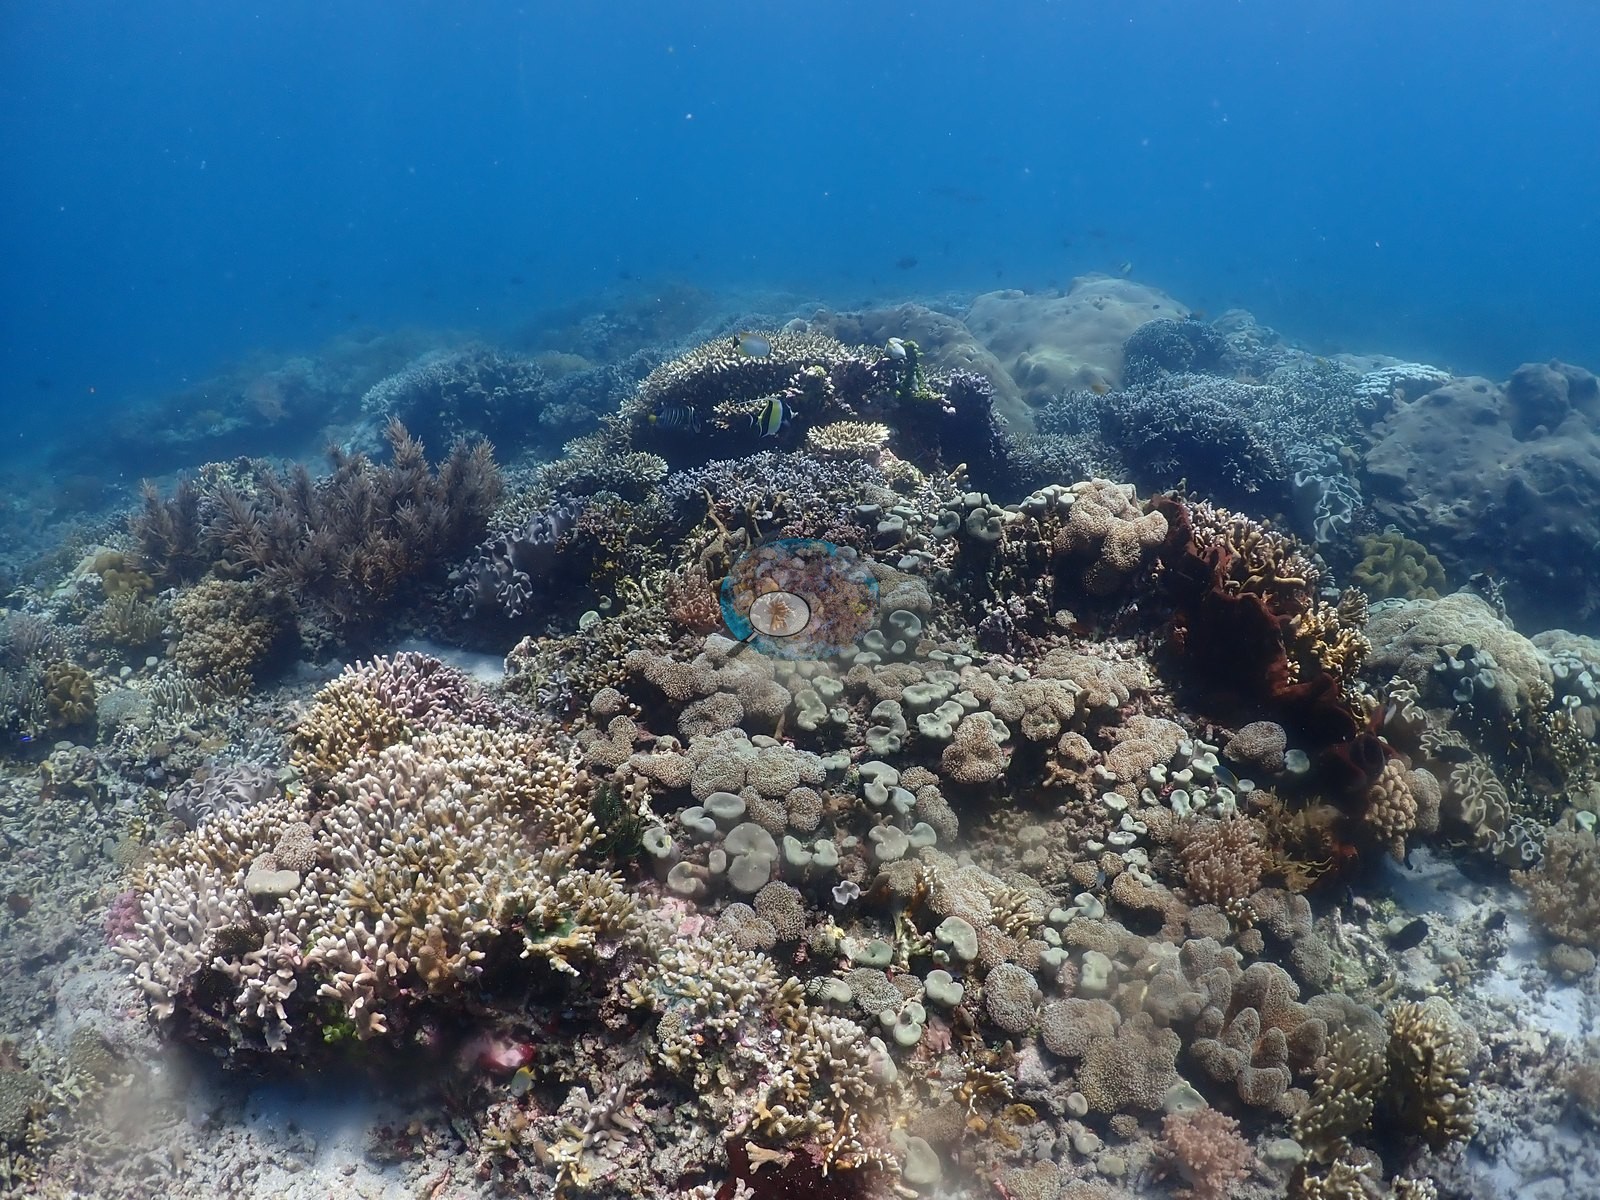
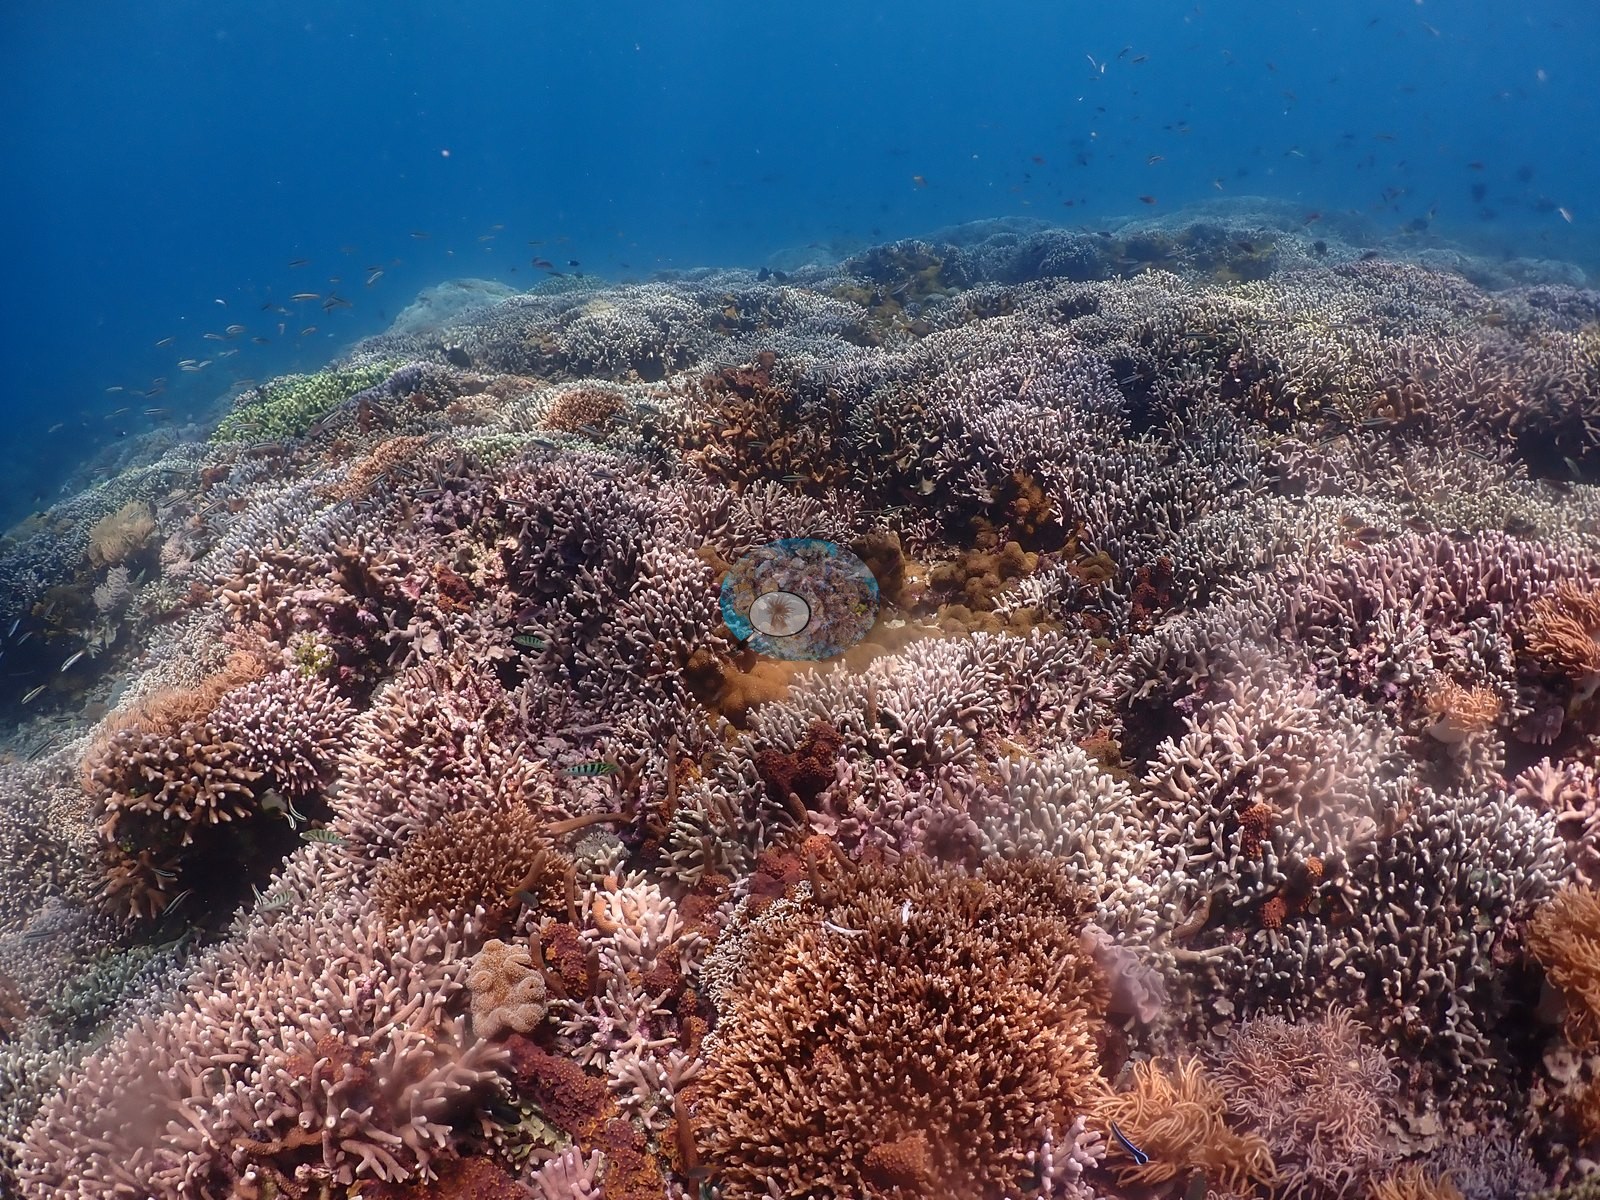
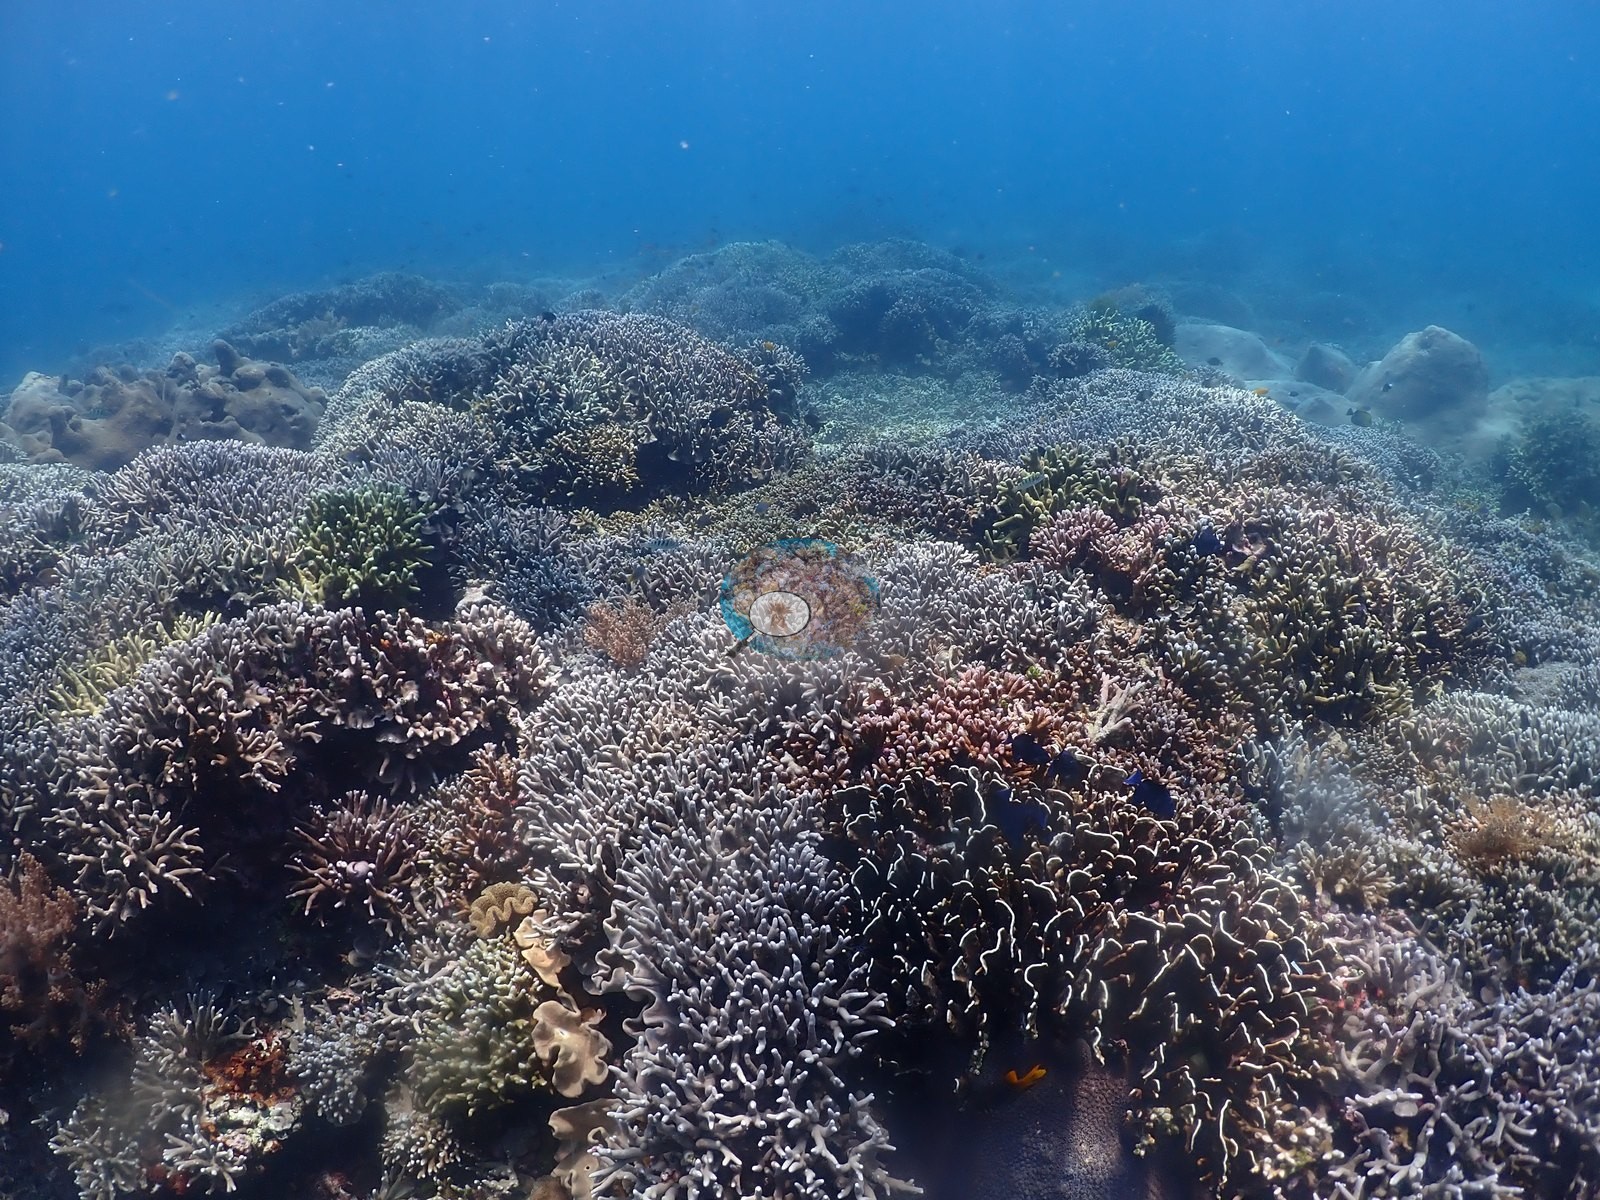
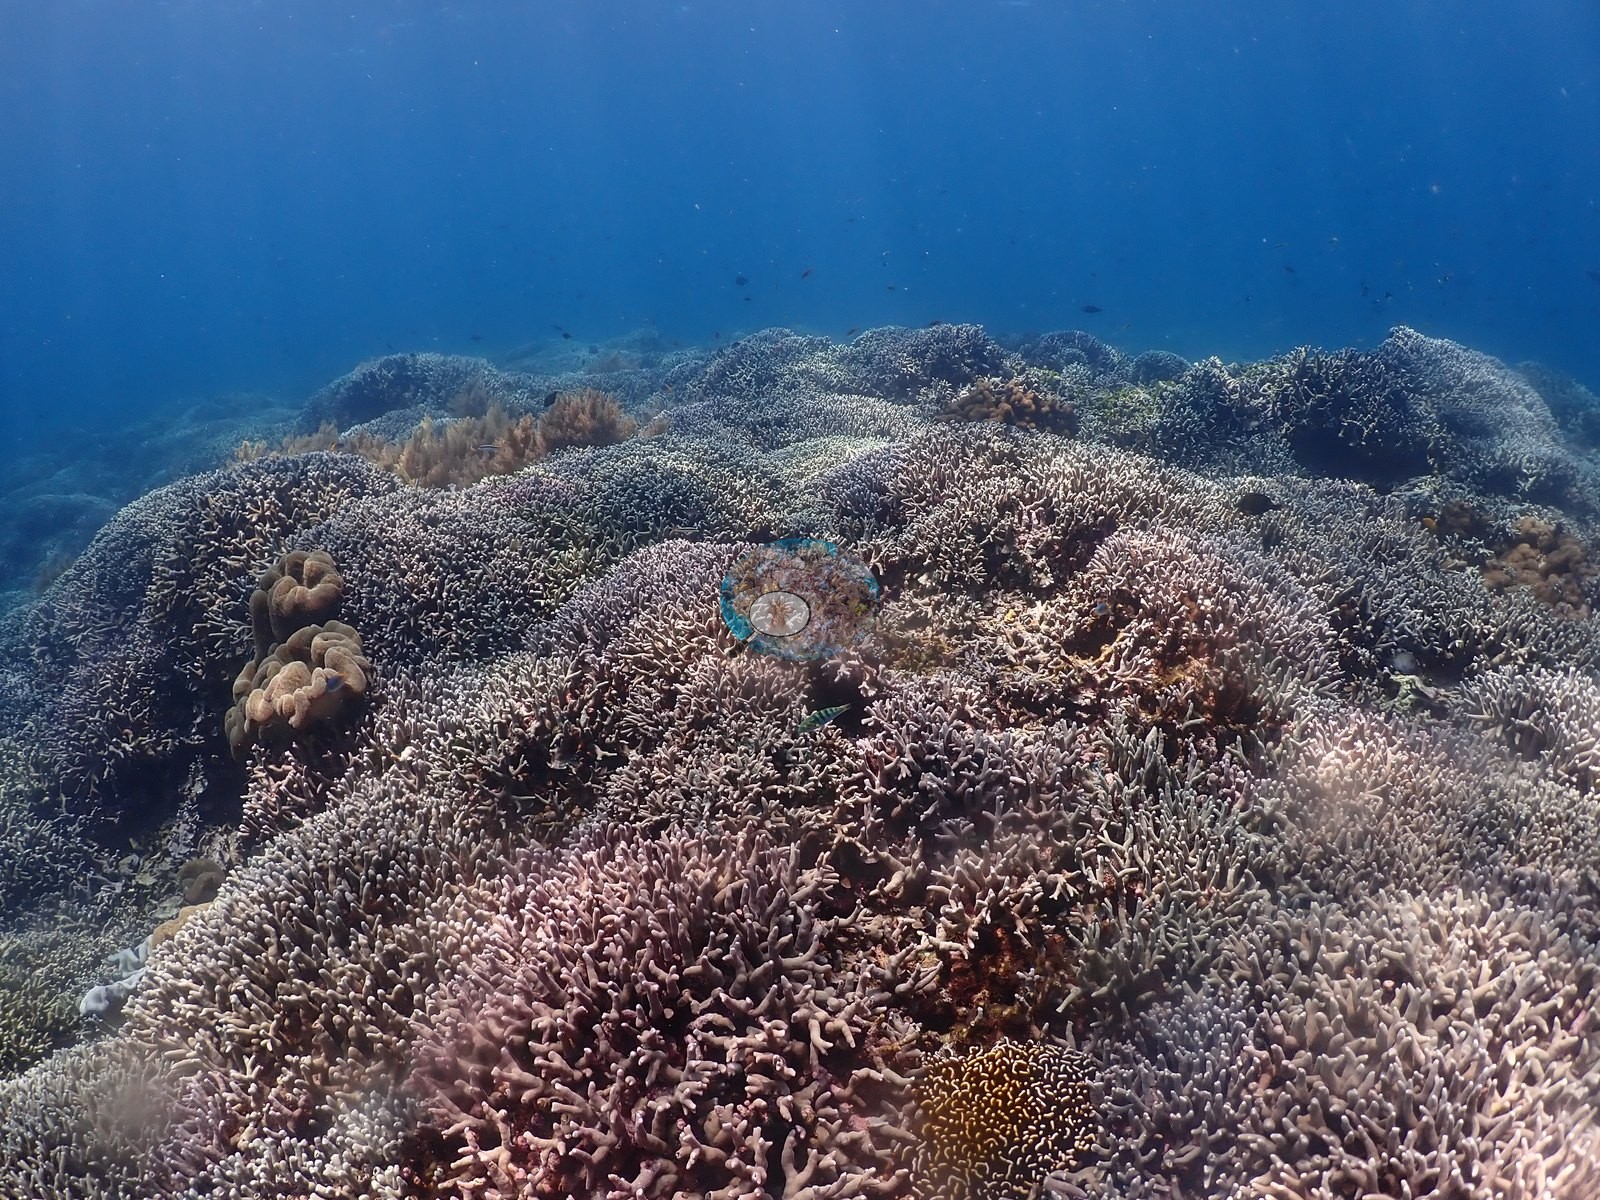
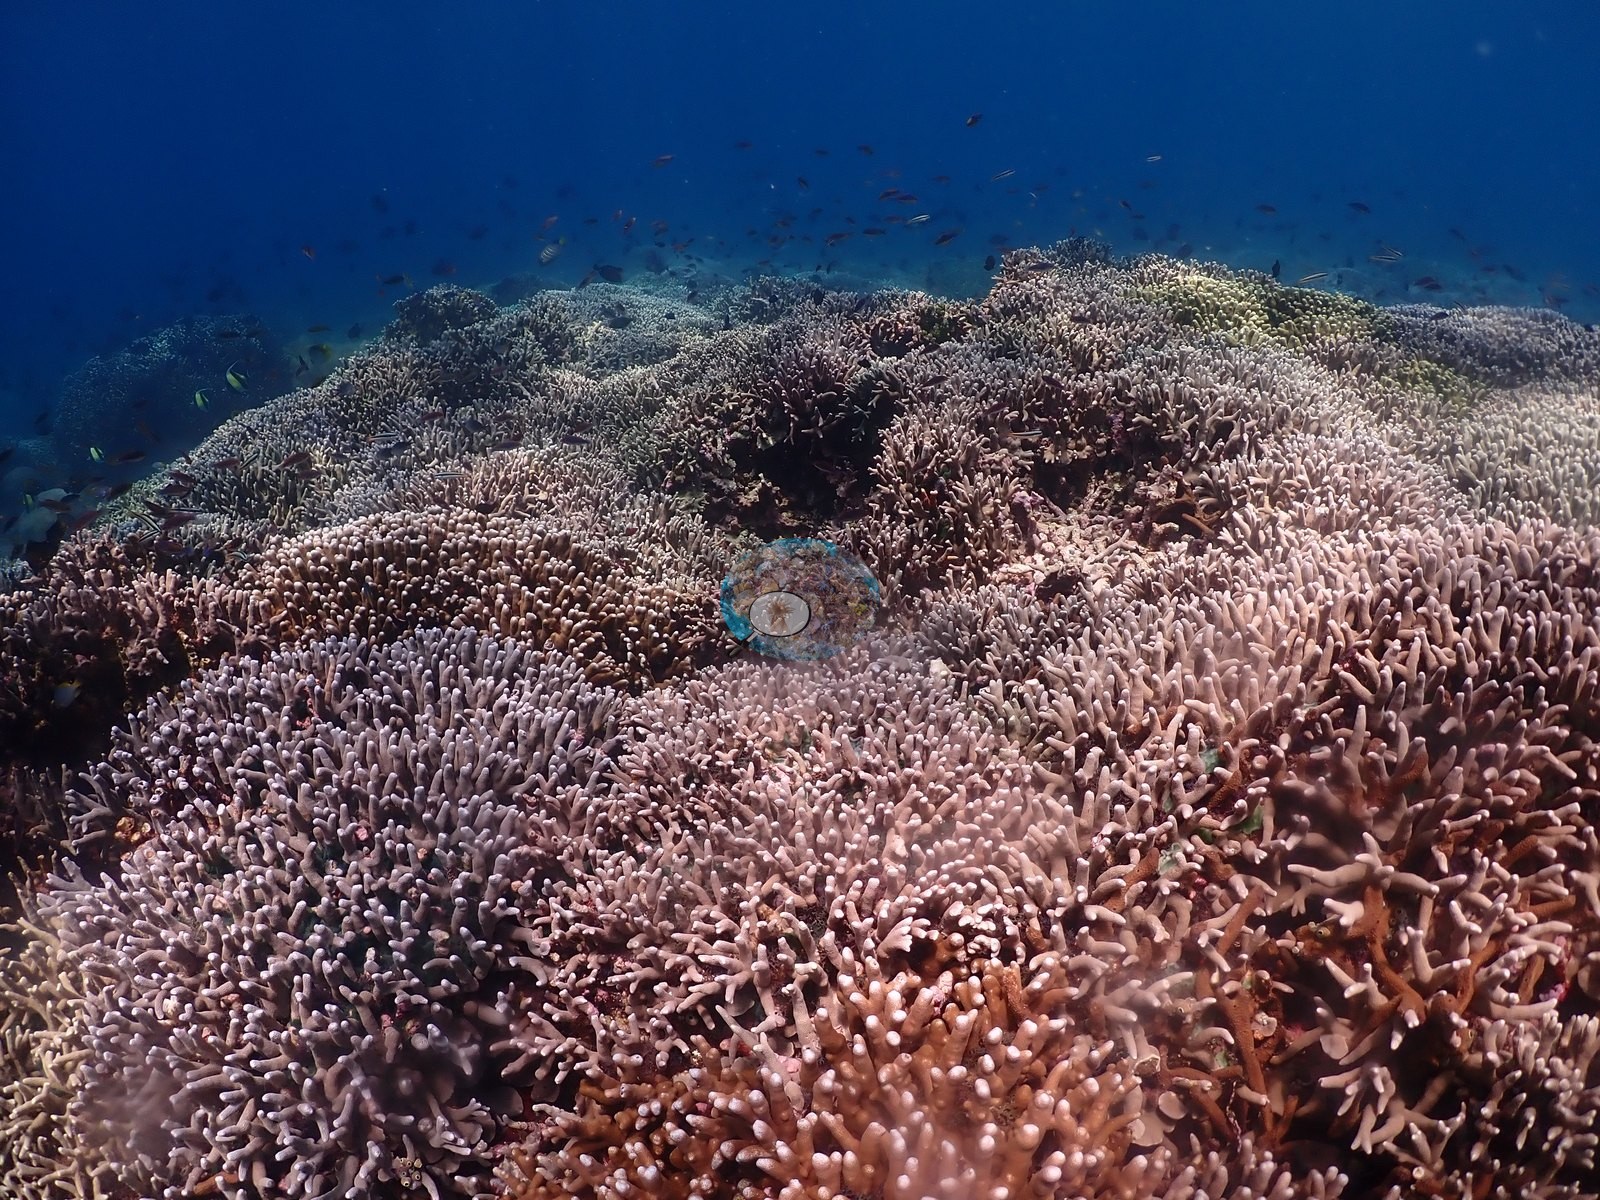
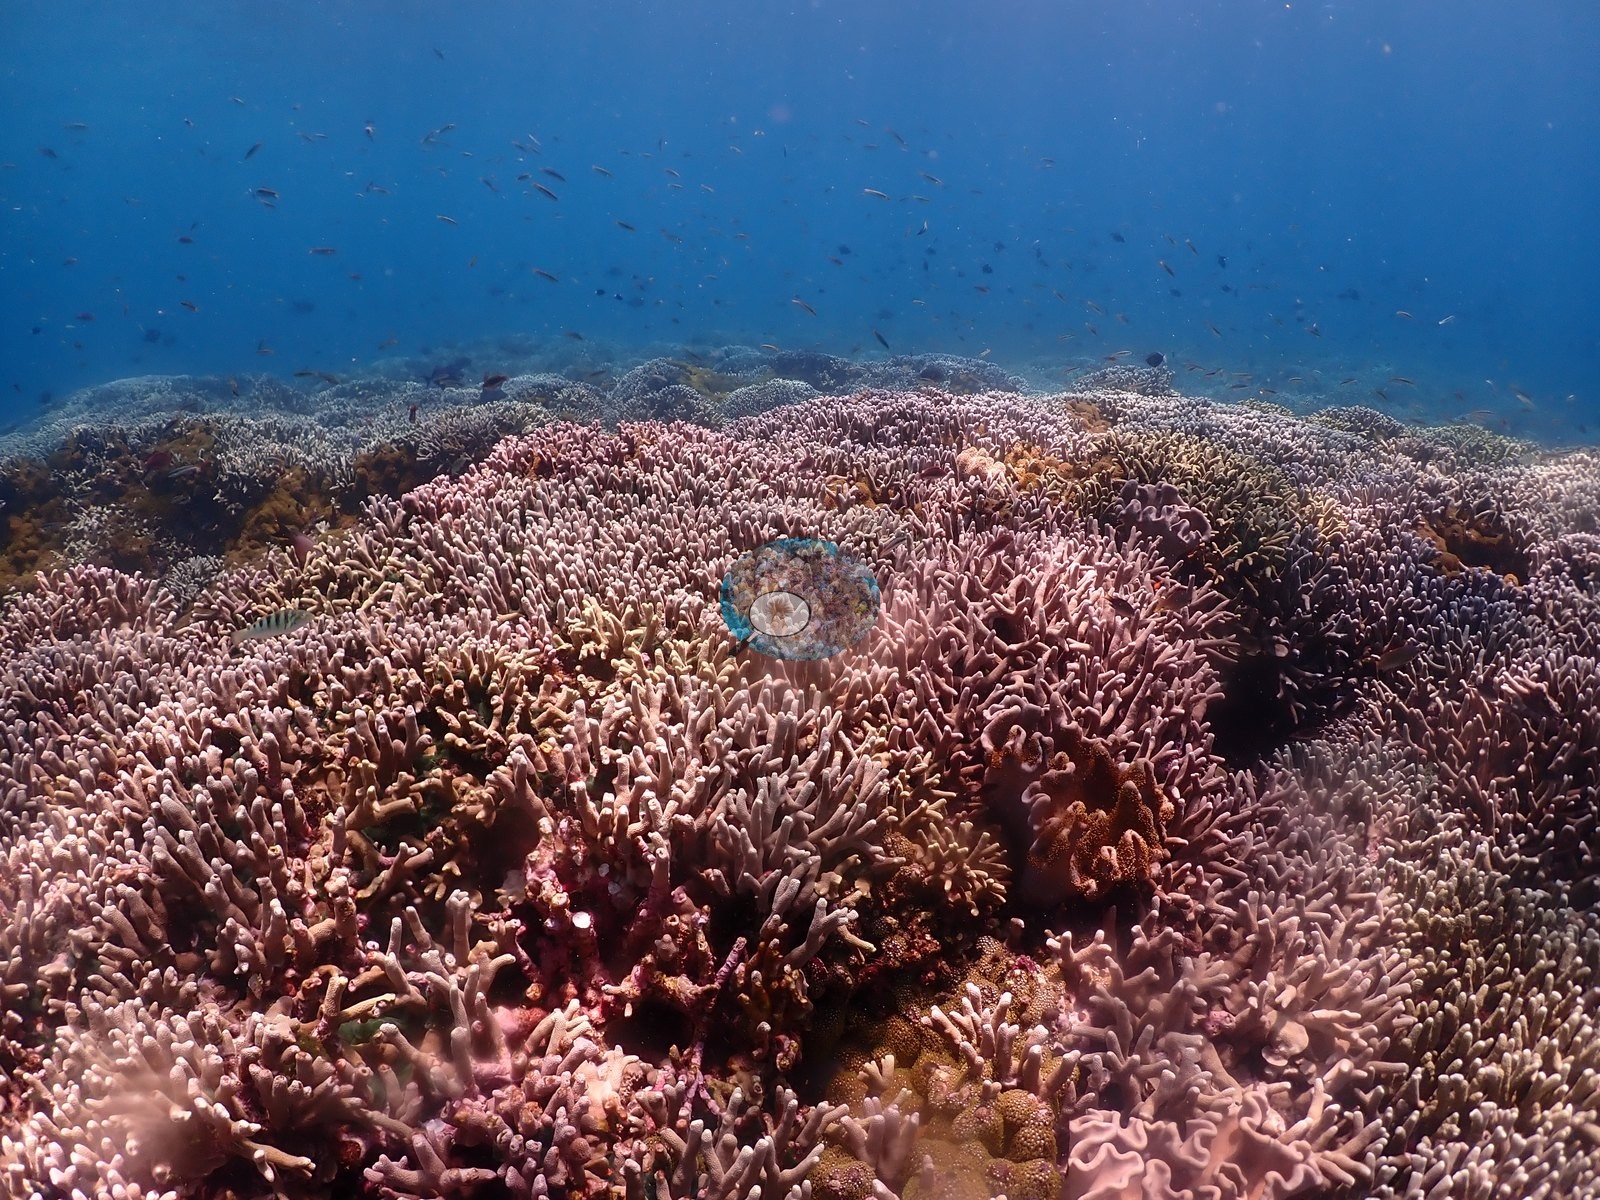
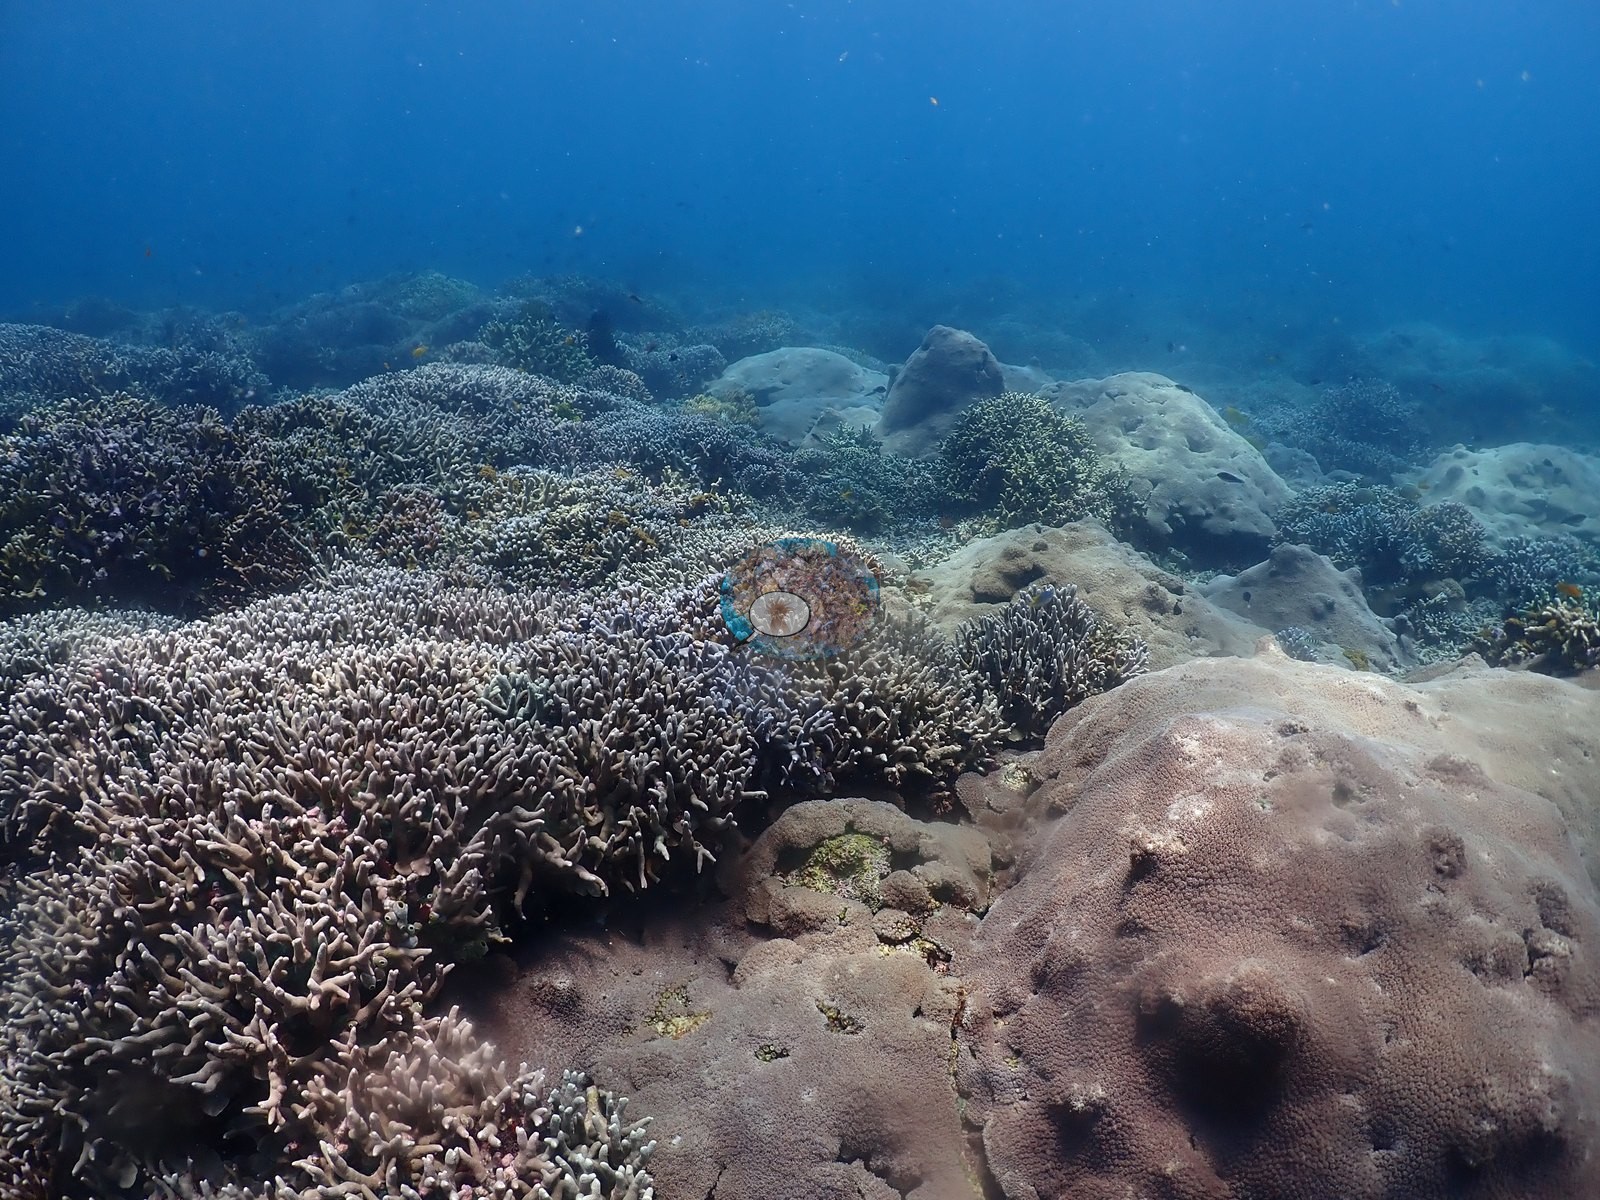
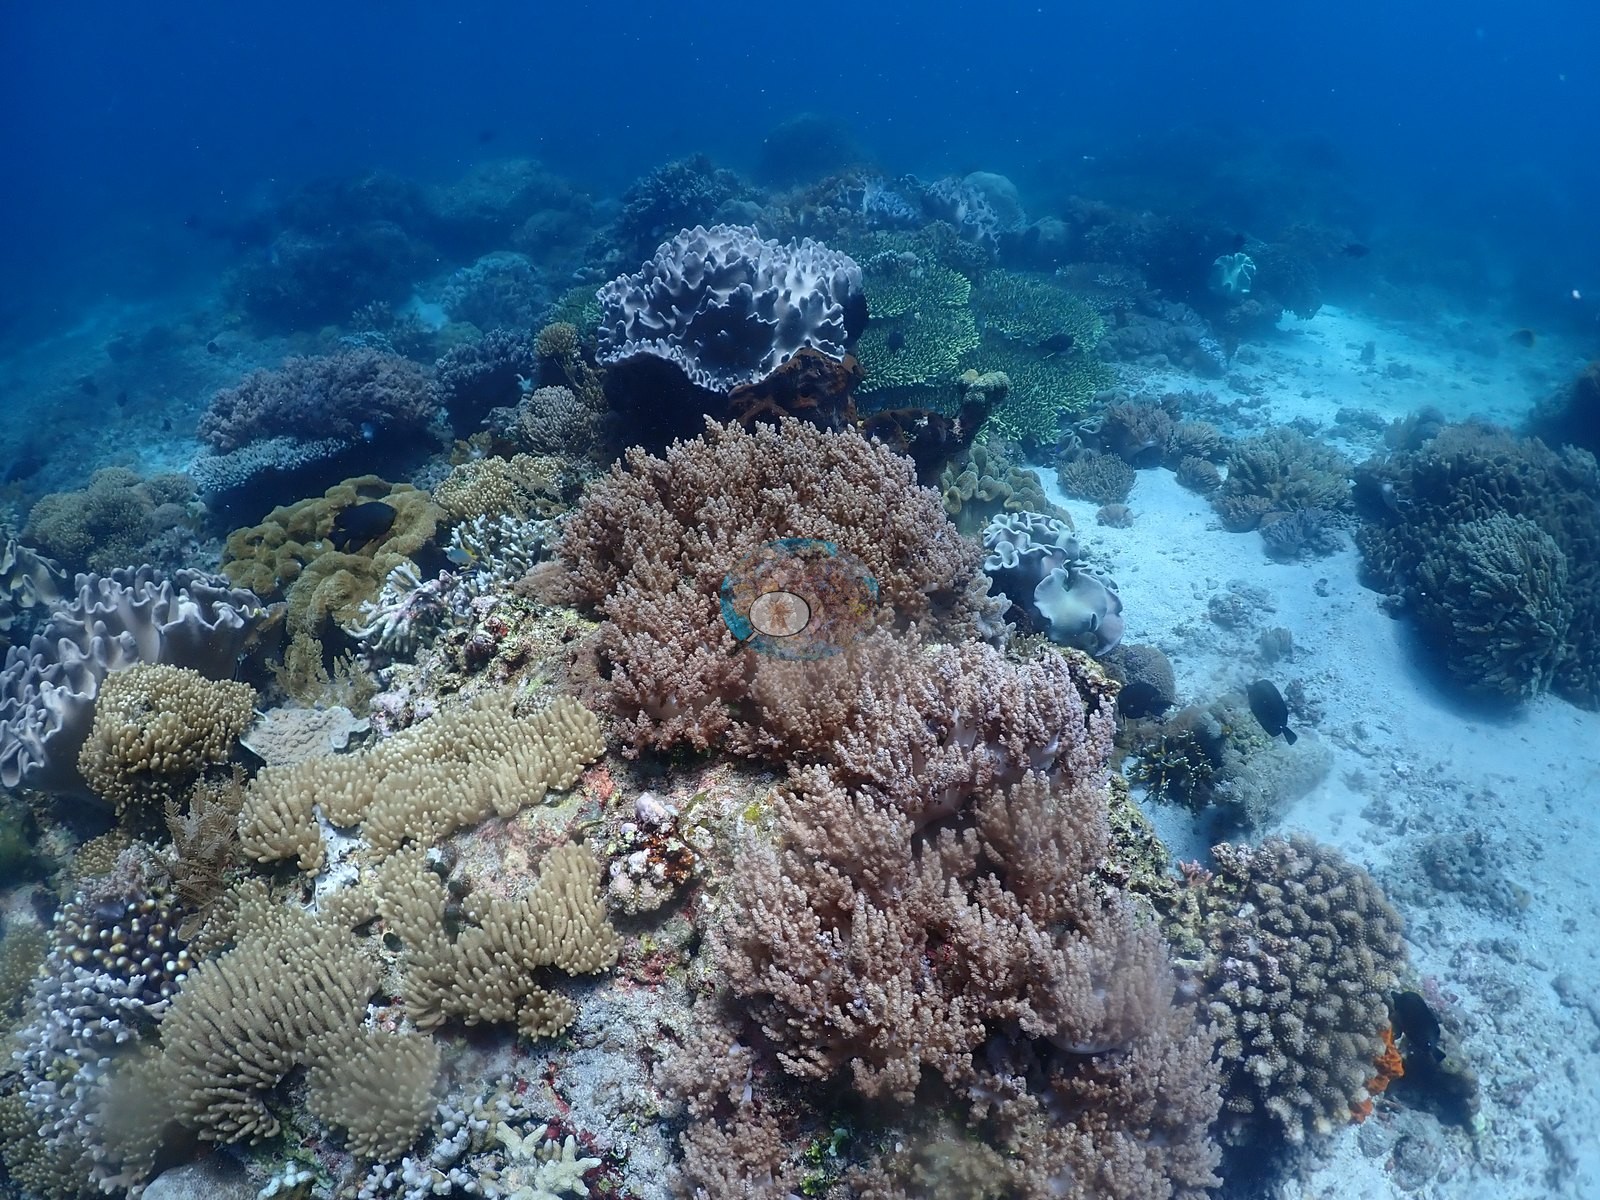
The plateau is the opposite: a broad, gently domed terrace carpeted almost edge to edge in mauve, lilac, and dusty-pink corymbose and bottlebrush Acropora, so uniform that consecutive frames look nearly interchangeable (e.g., Image 3, Image 5, Image 9, Image 12, Image 13, Image 18, Image 19, Image 23, Image 29, Image 32, Image 36, Image 44, Image 46, Image 48, Image 51).
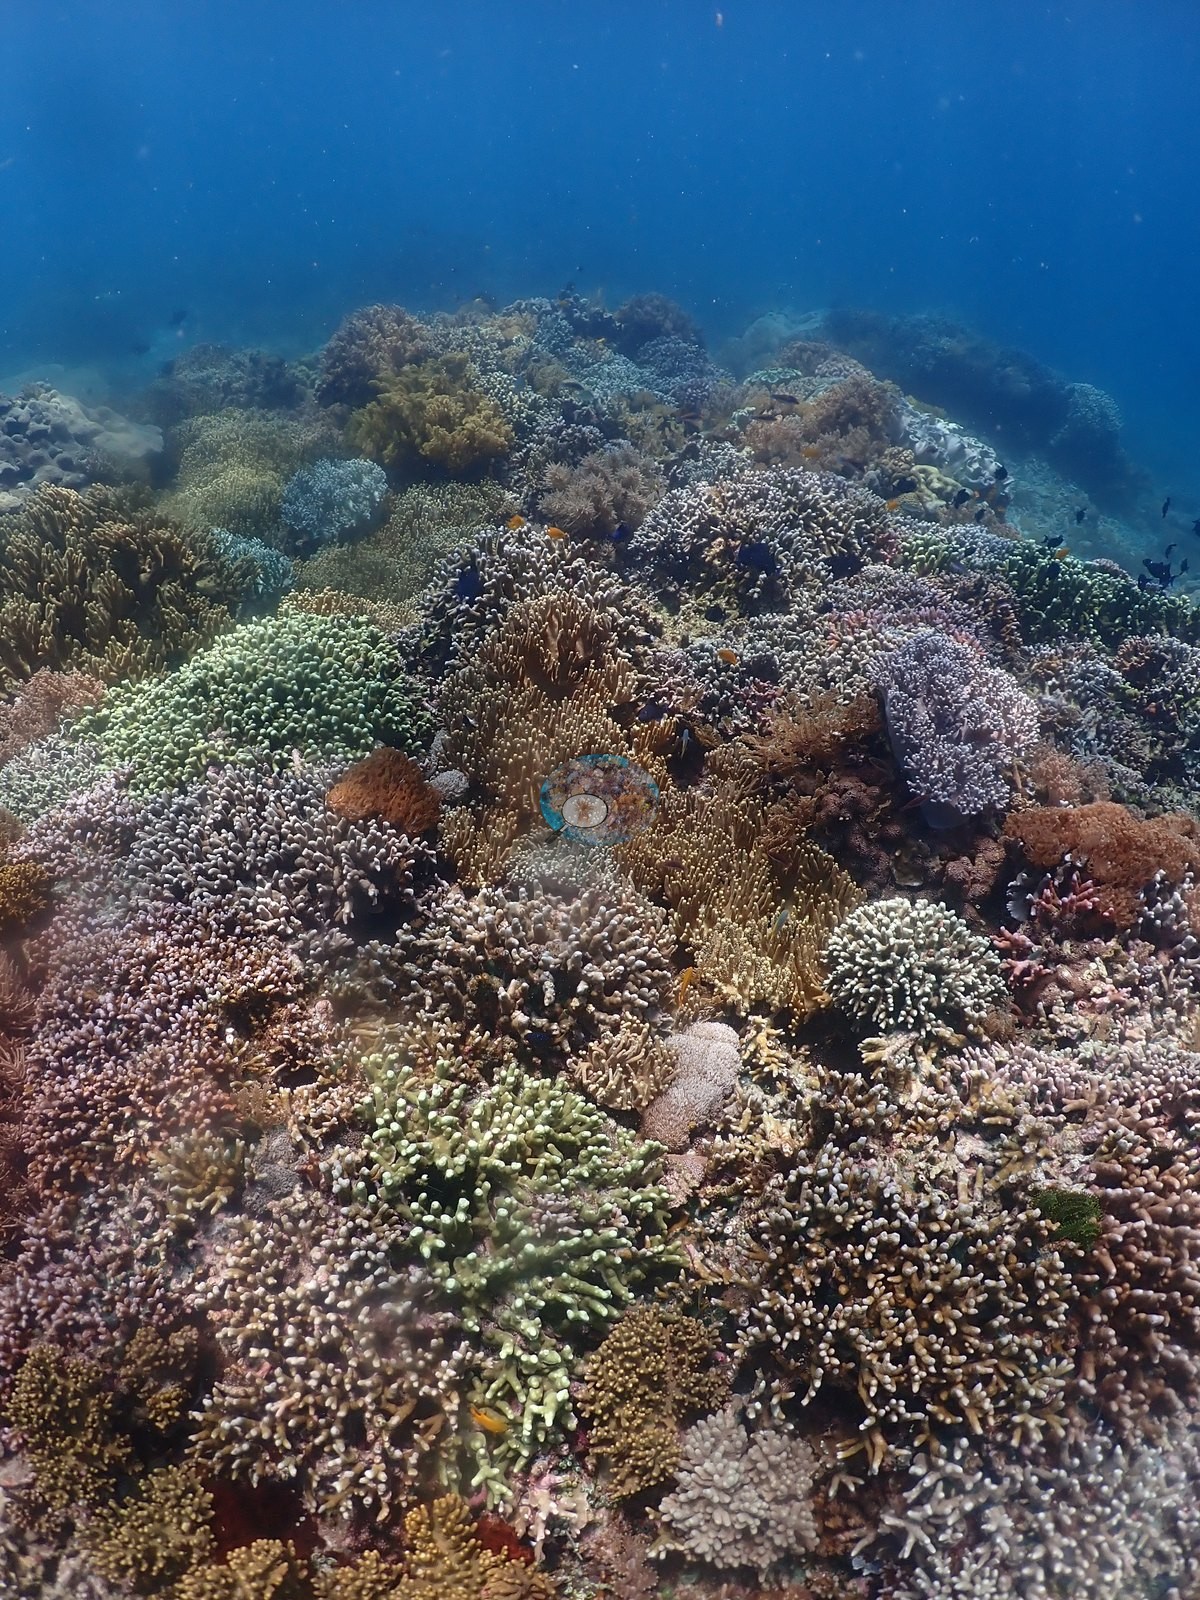
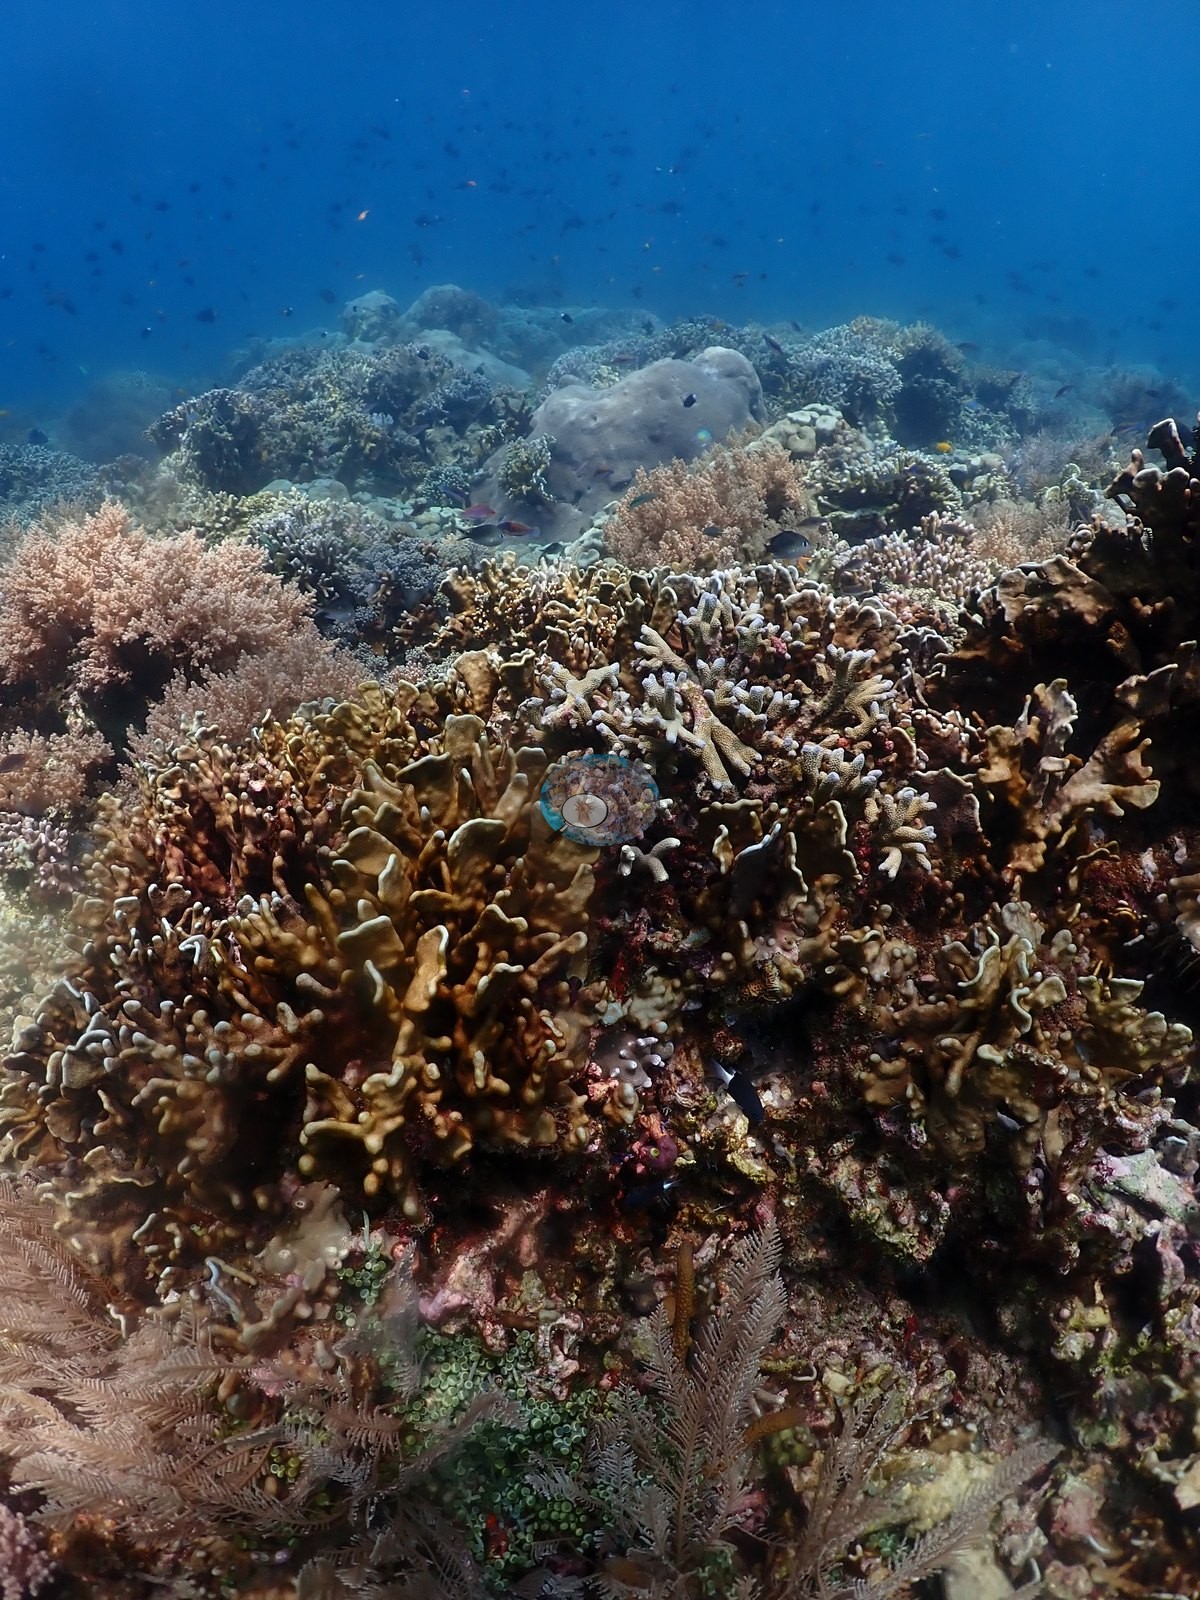
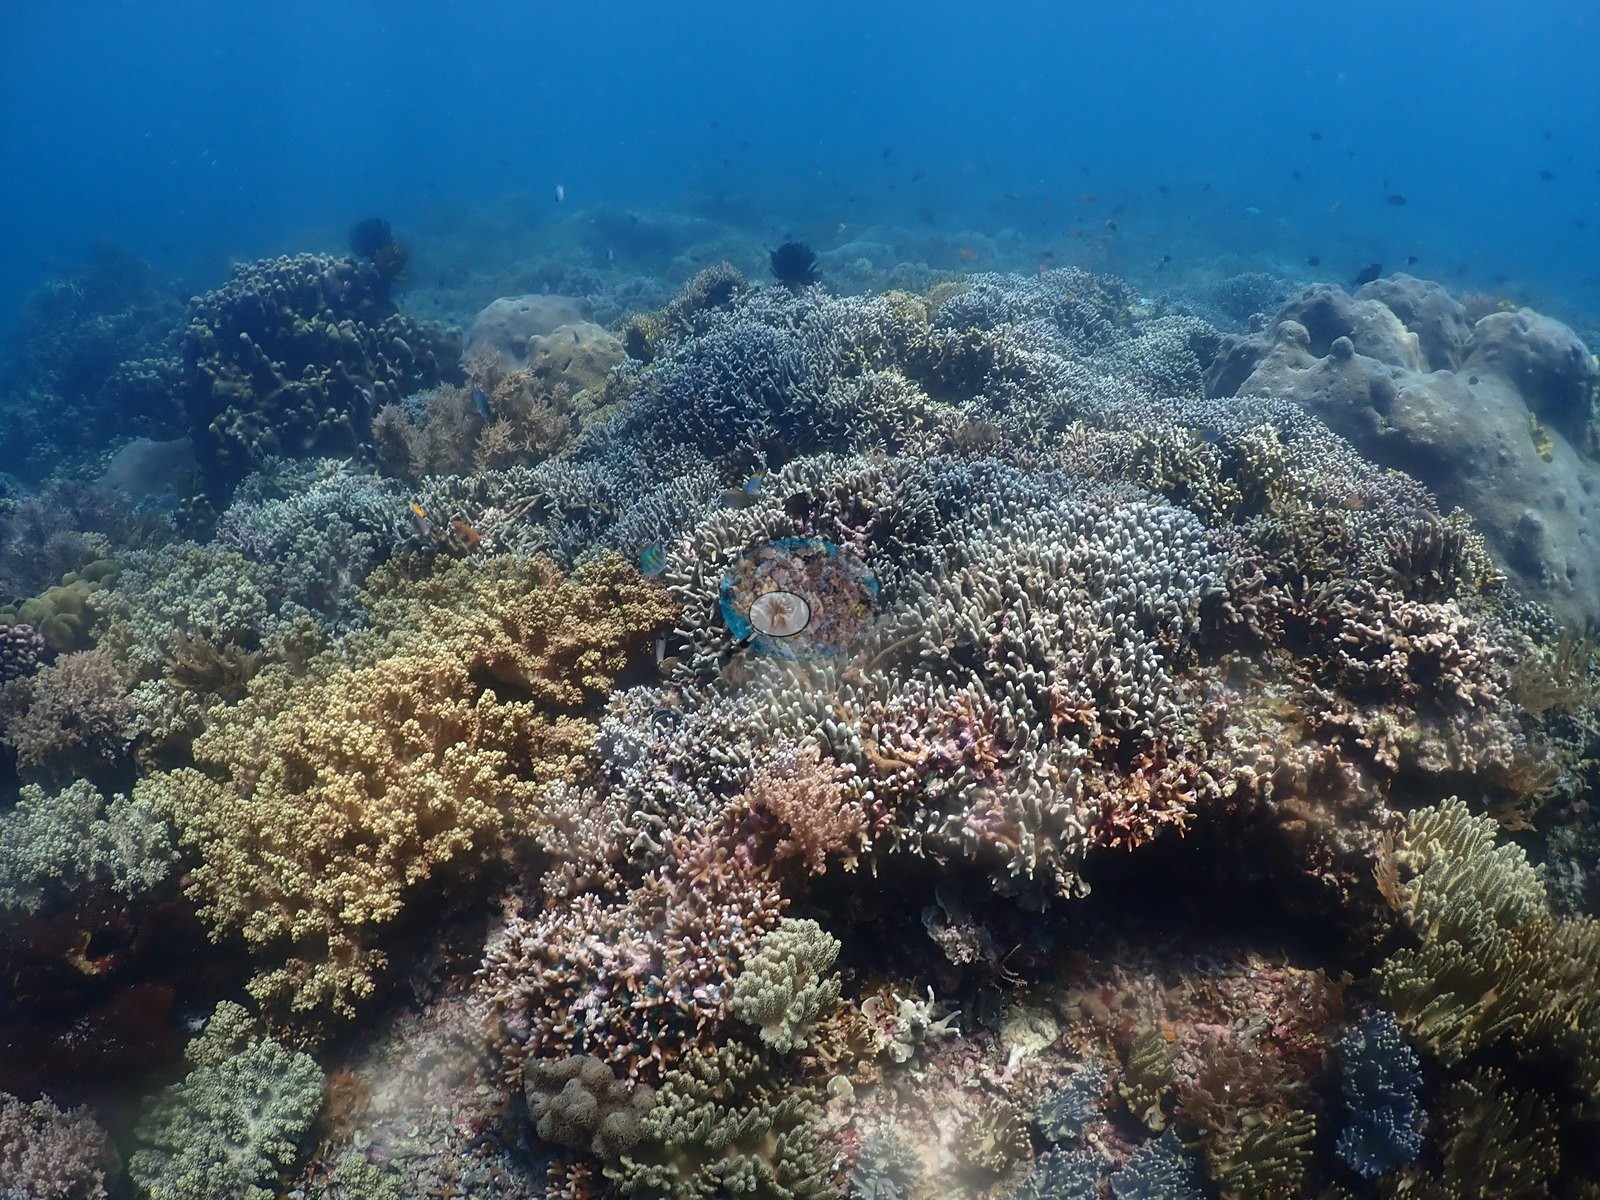
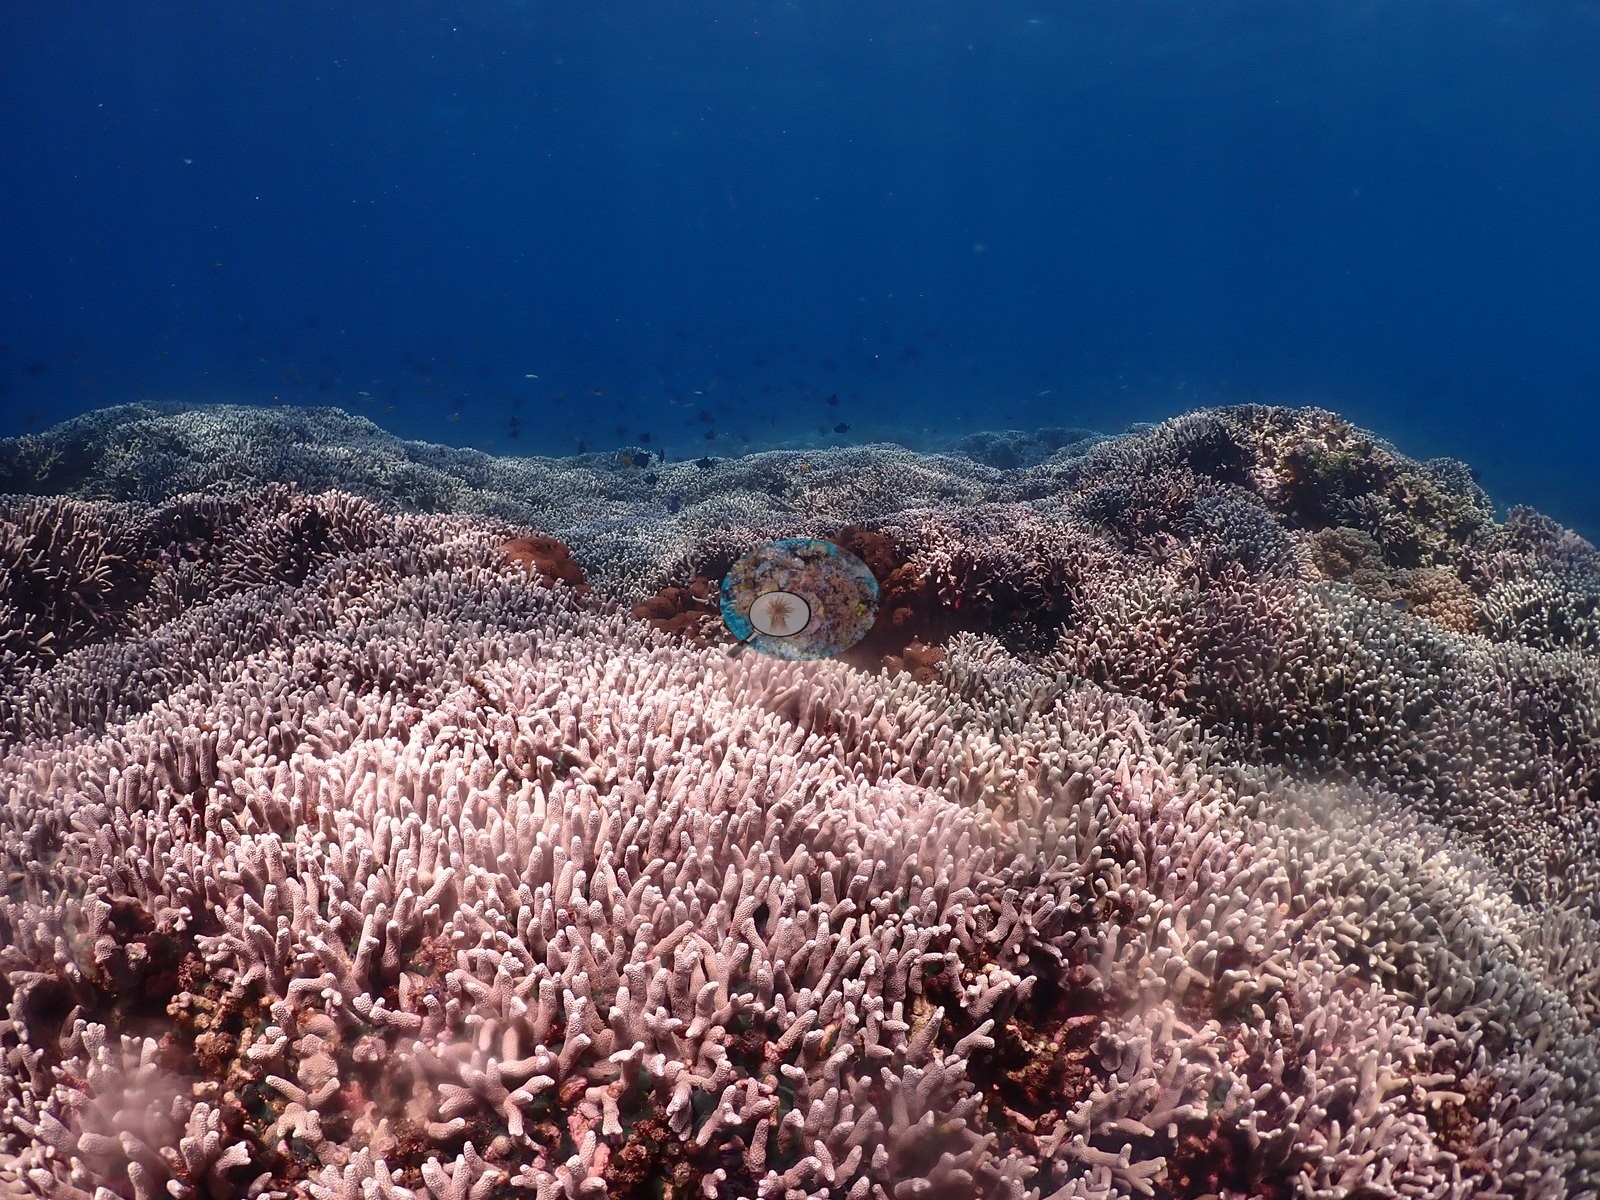
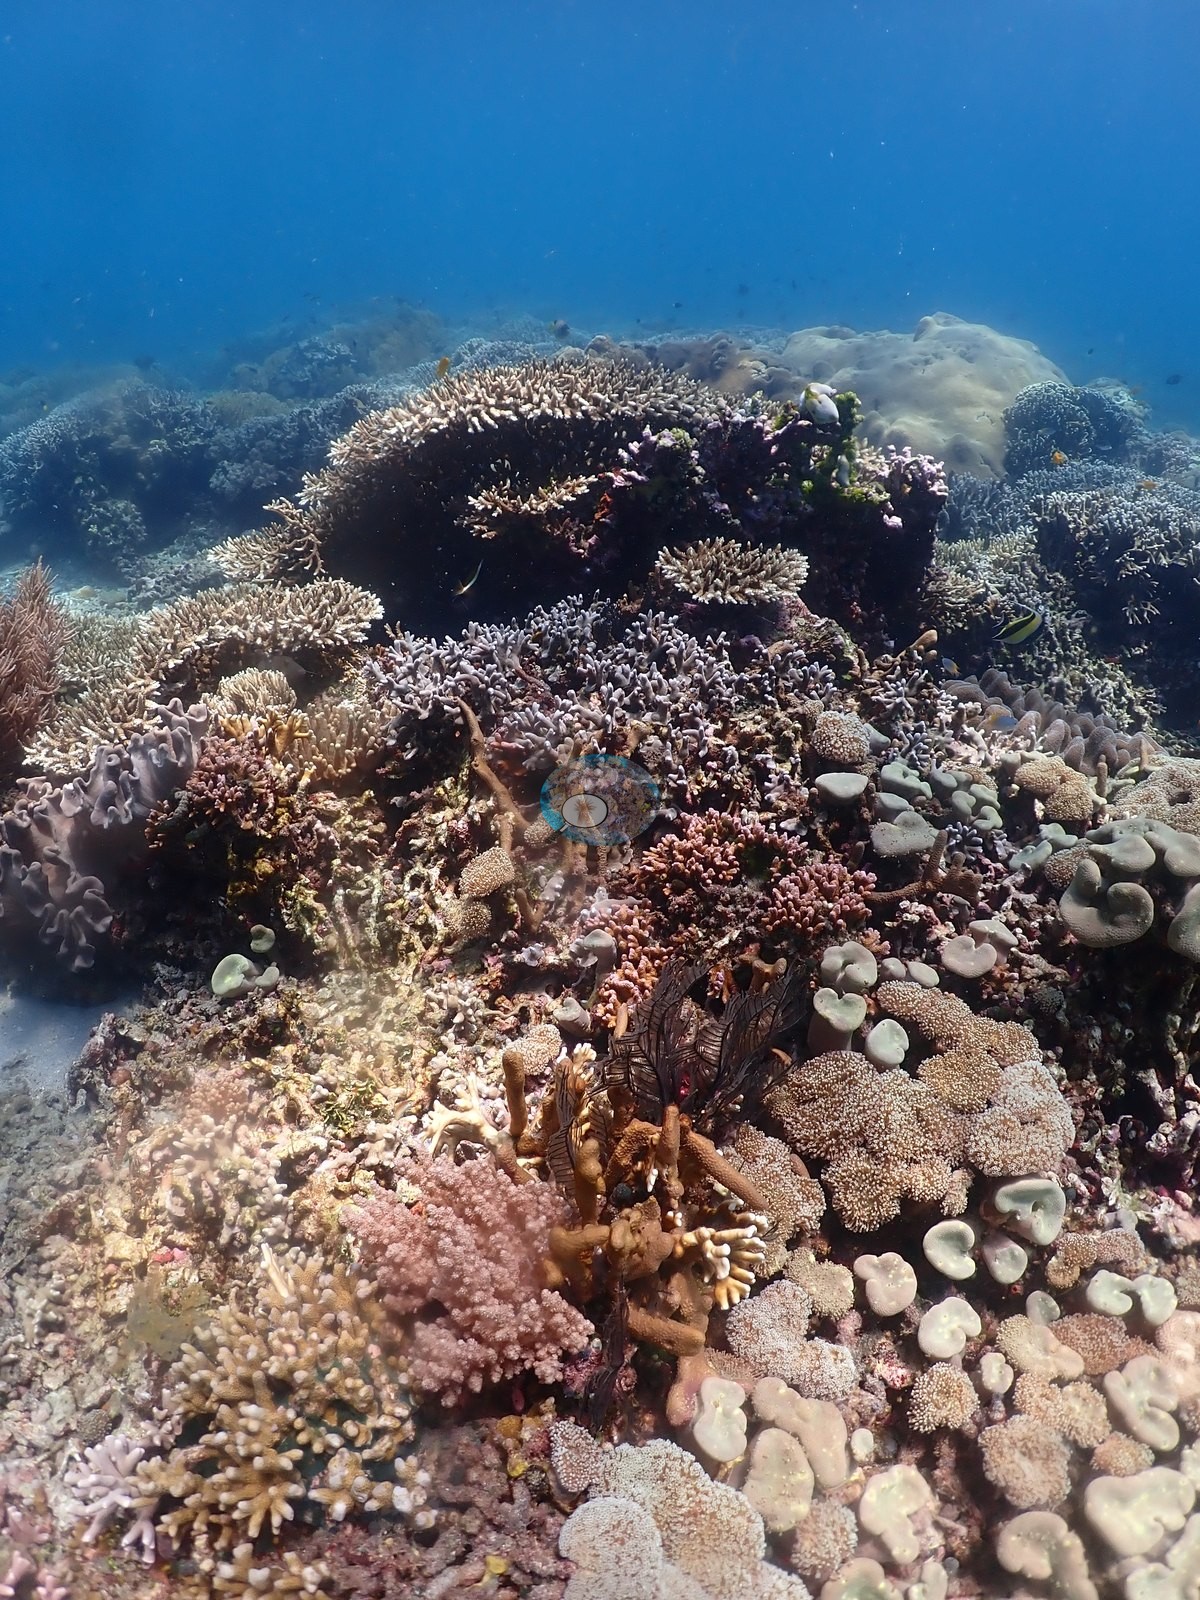
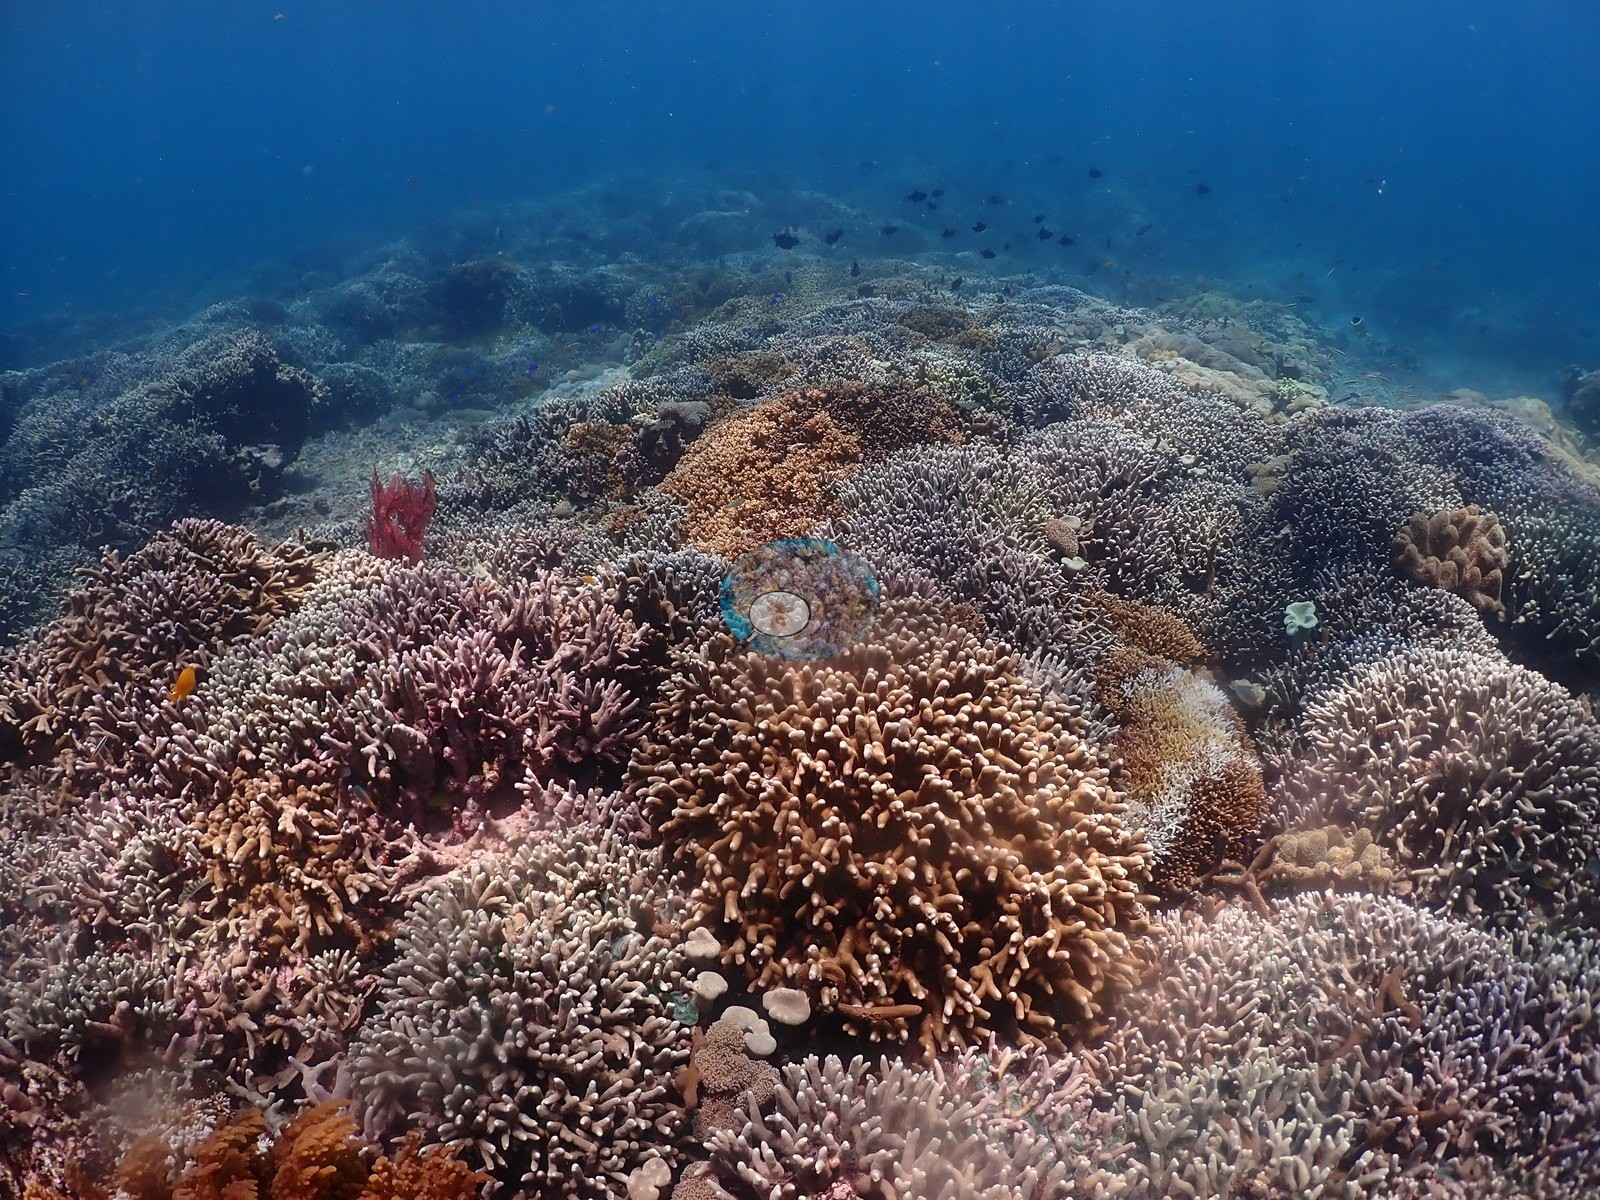
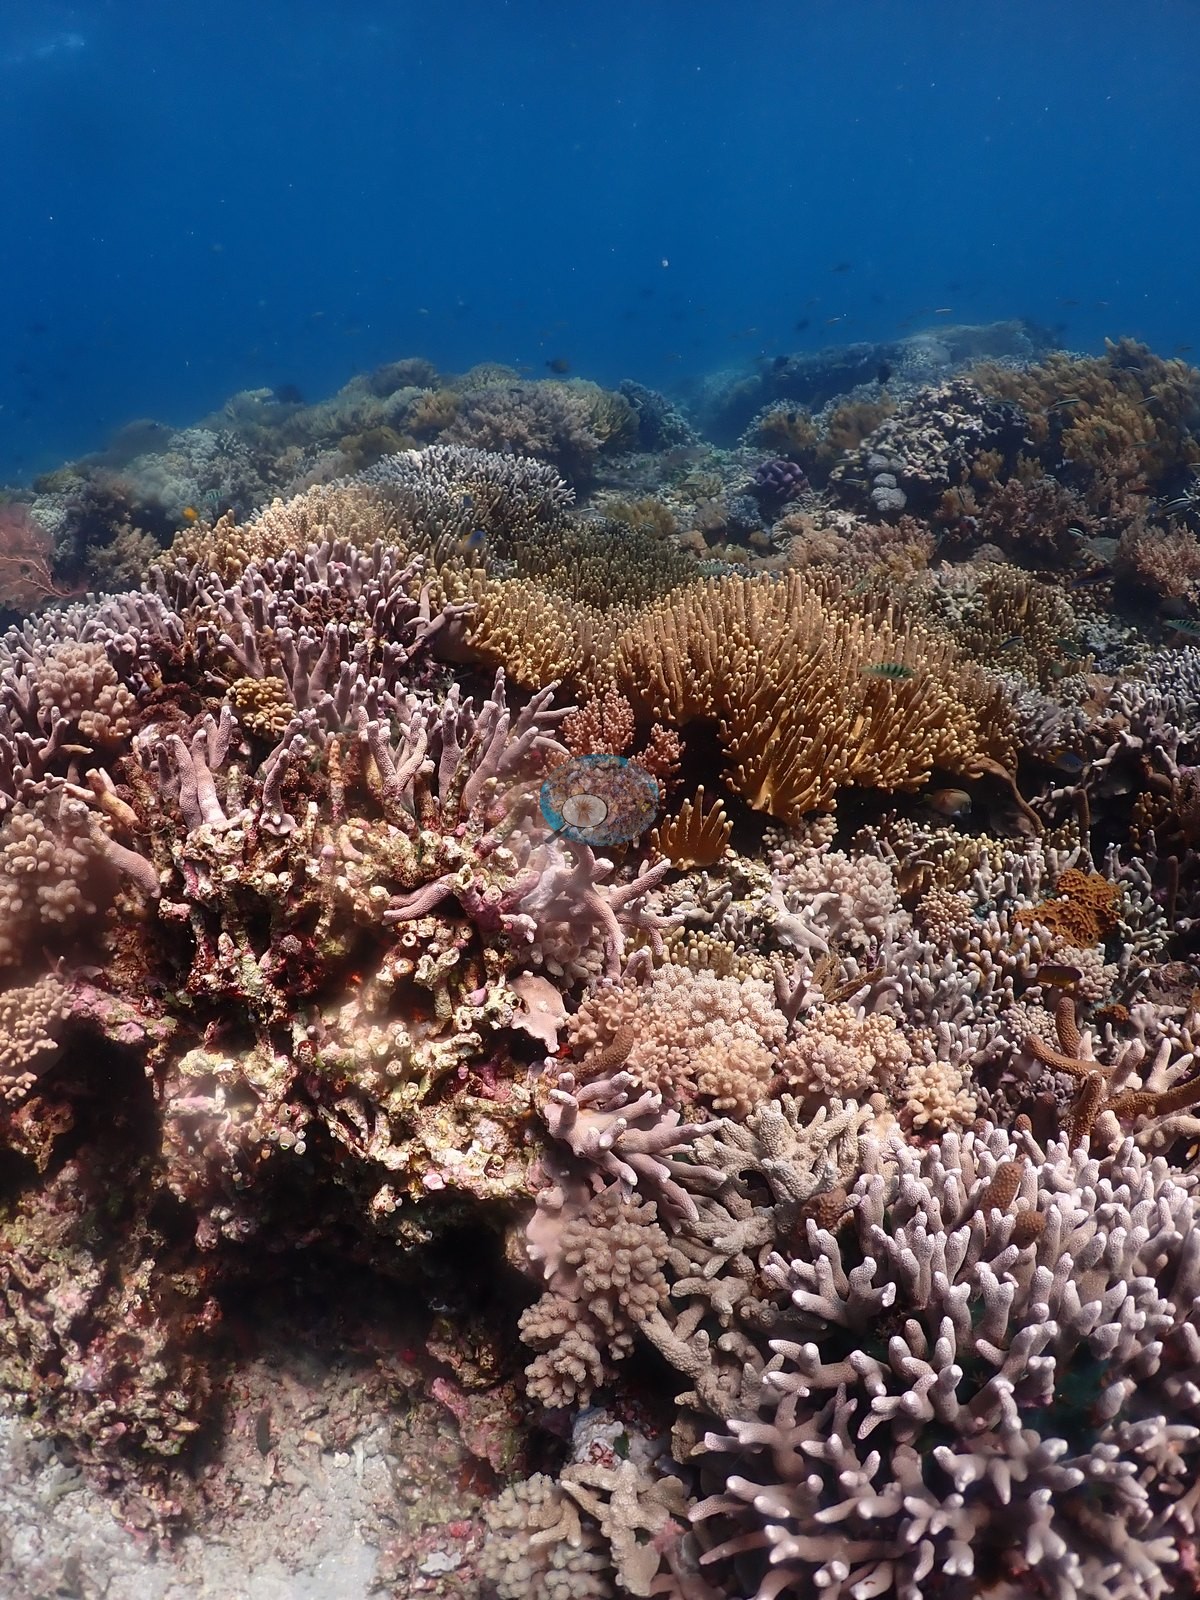
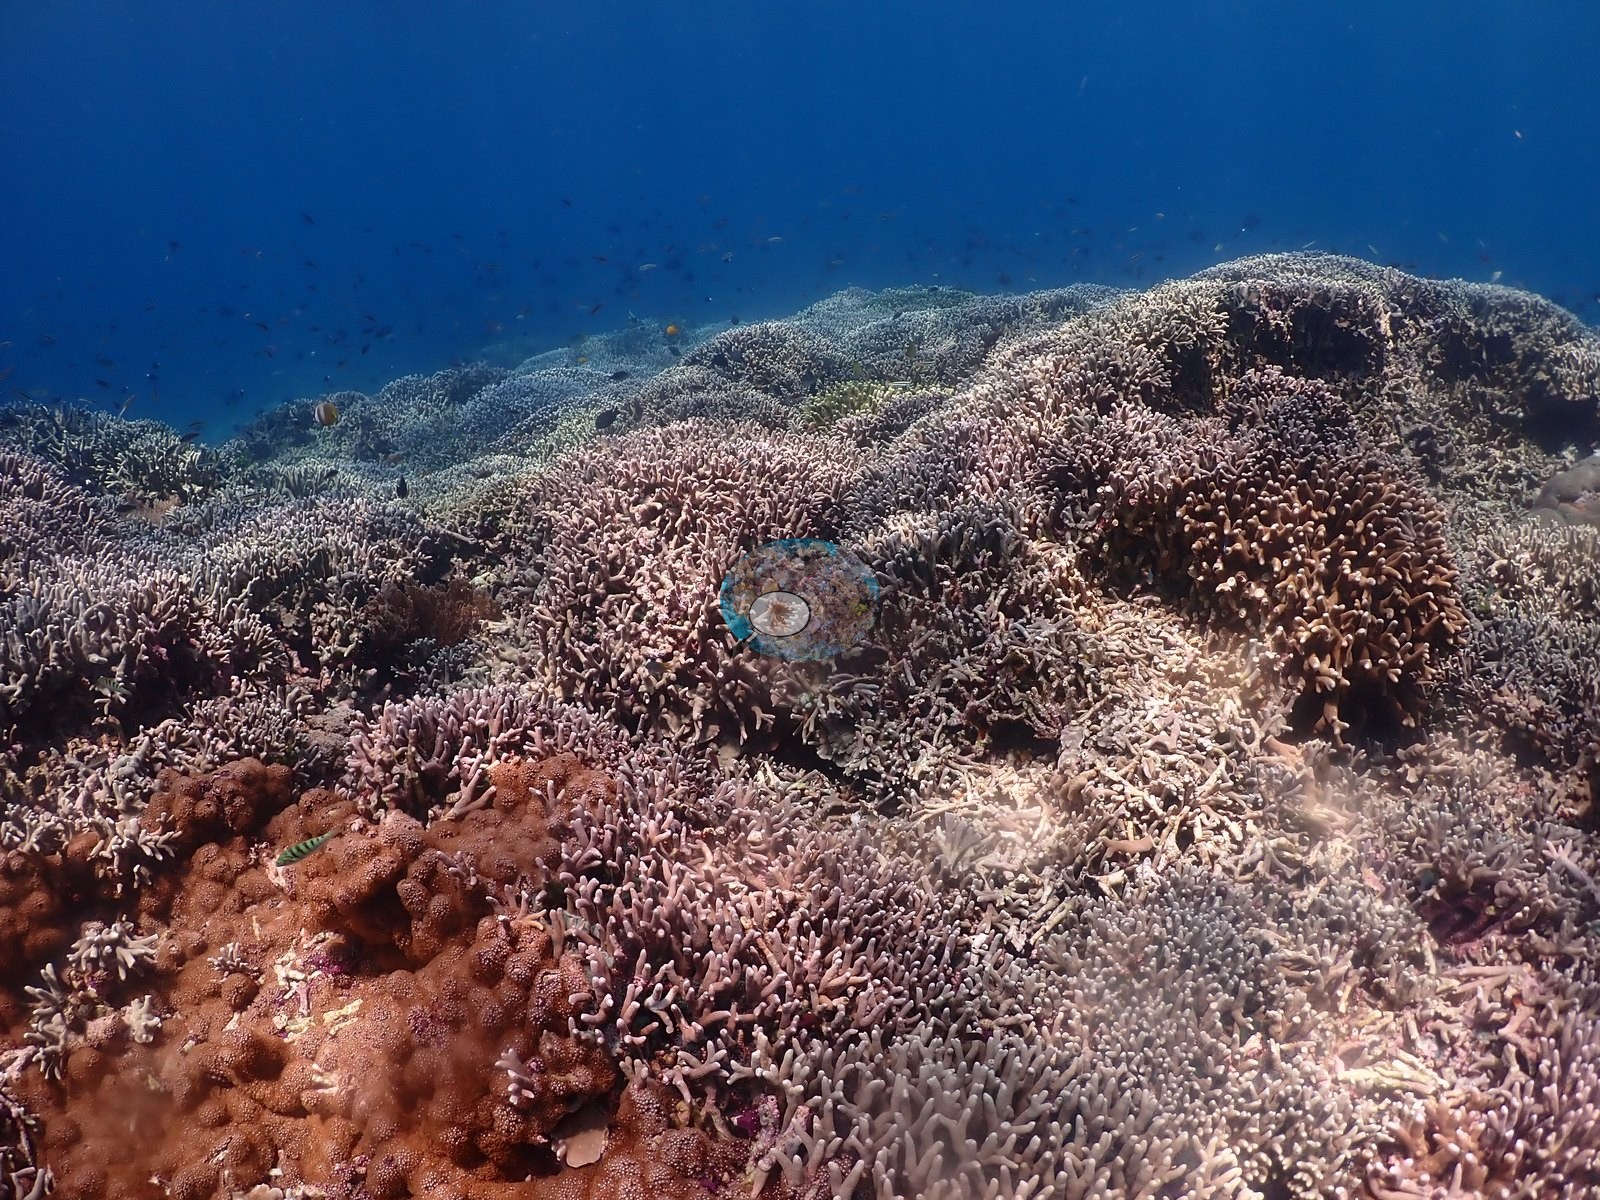
Big smooth chocolate-brown Porites domes and one massive colony rise through the carpet, alongside salmon Dendronephthya and an unmissable vermilion soft coral bouquet in two frames (e.g., Image 4, Image 33, Image 34, Image 39, Image 47).
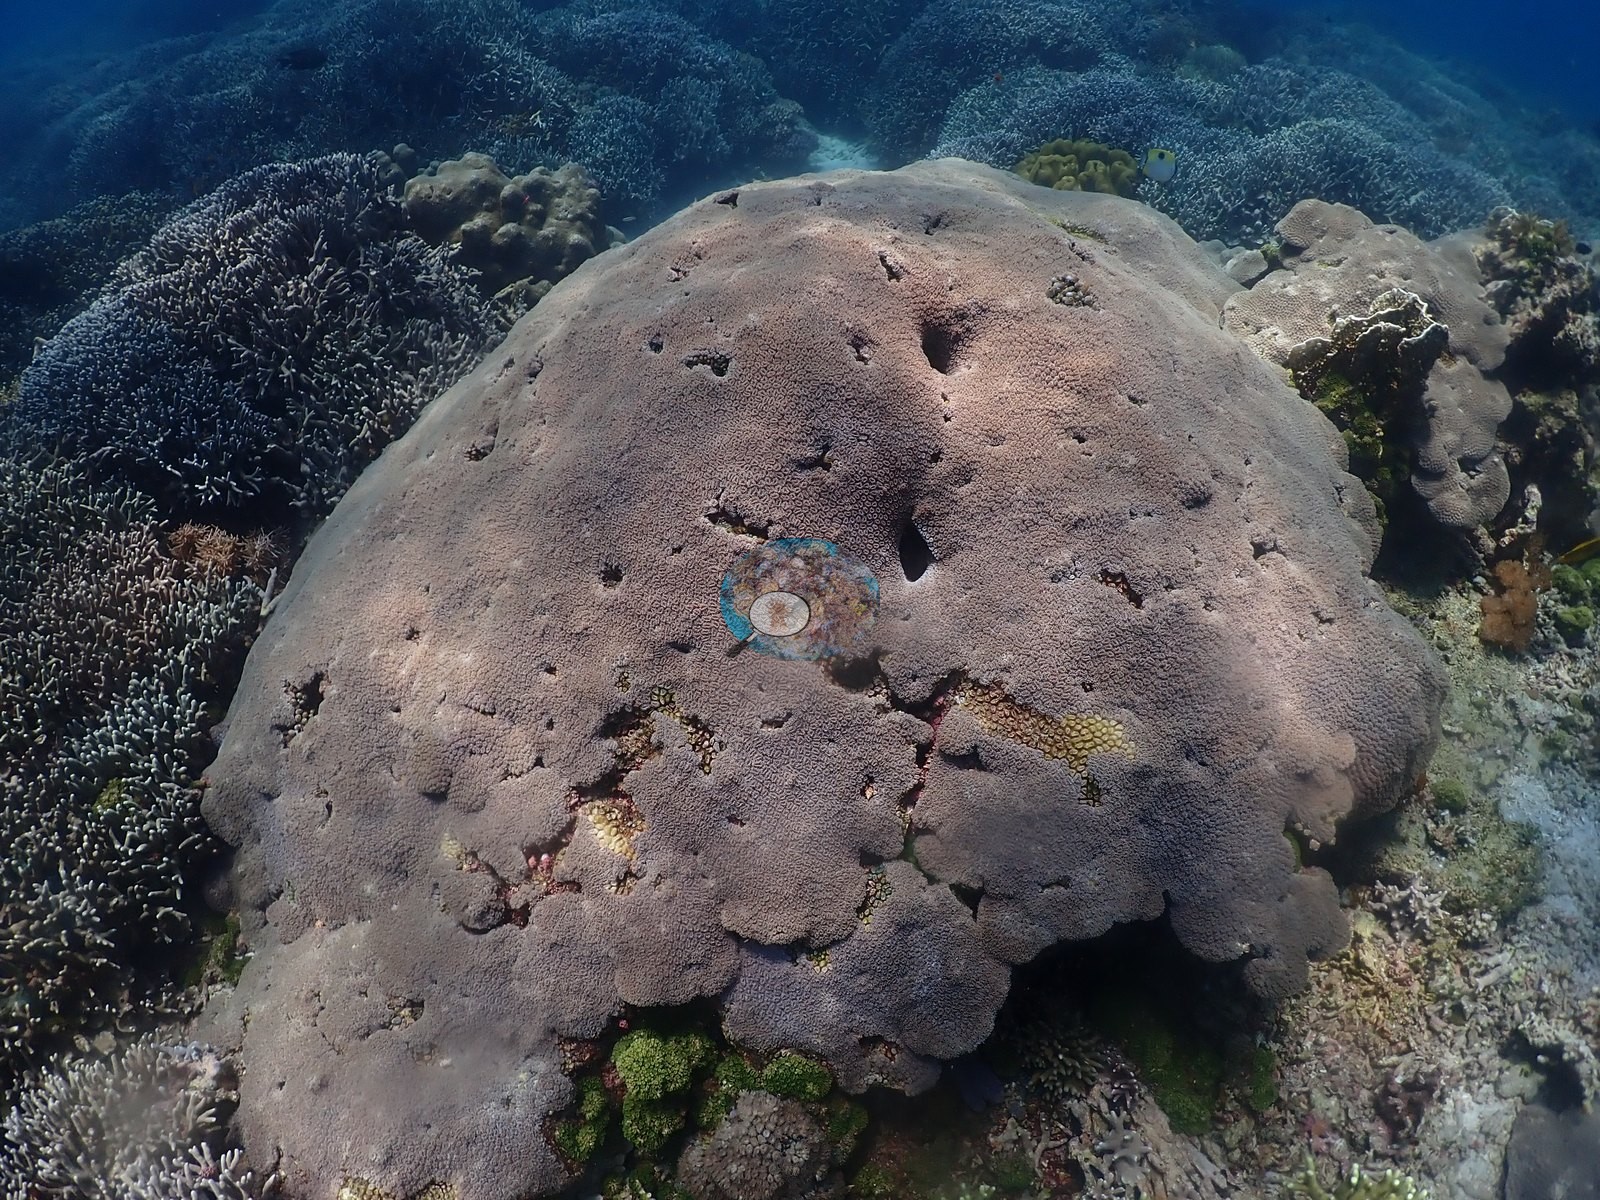
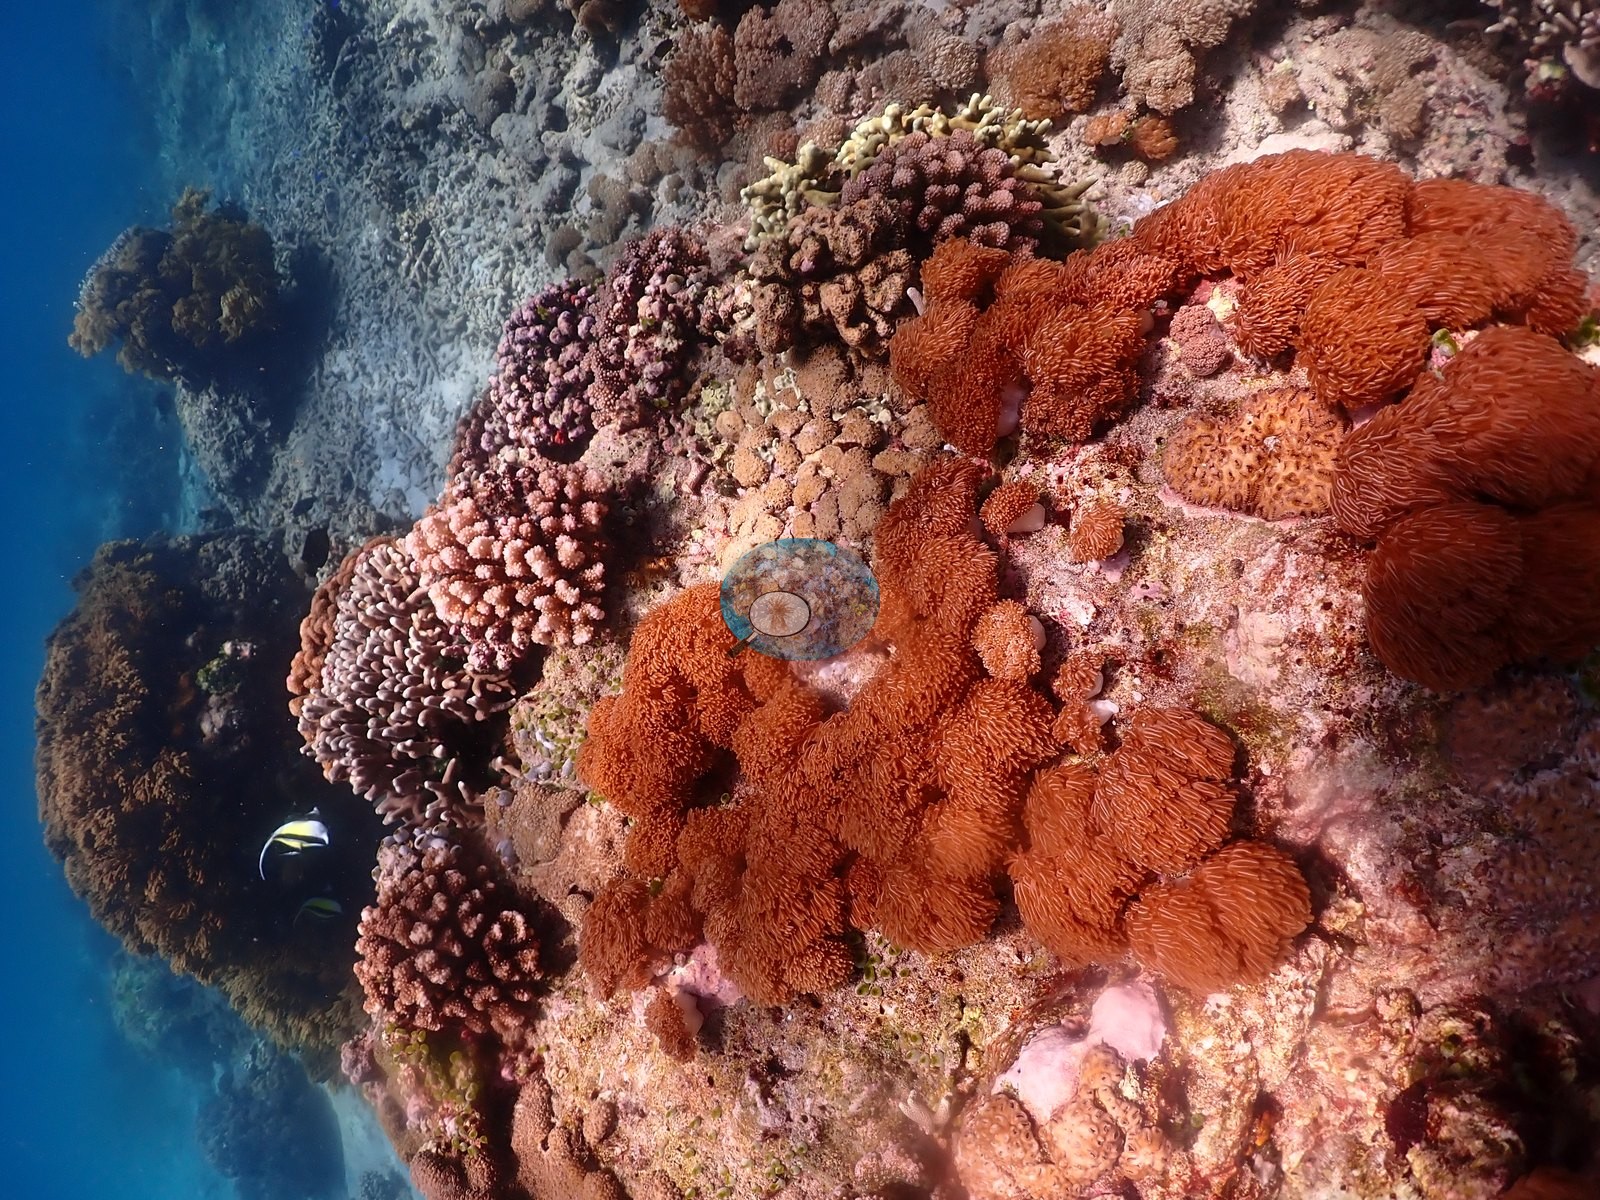
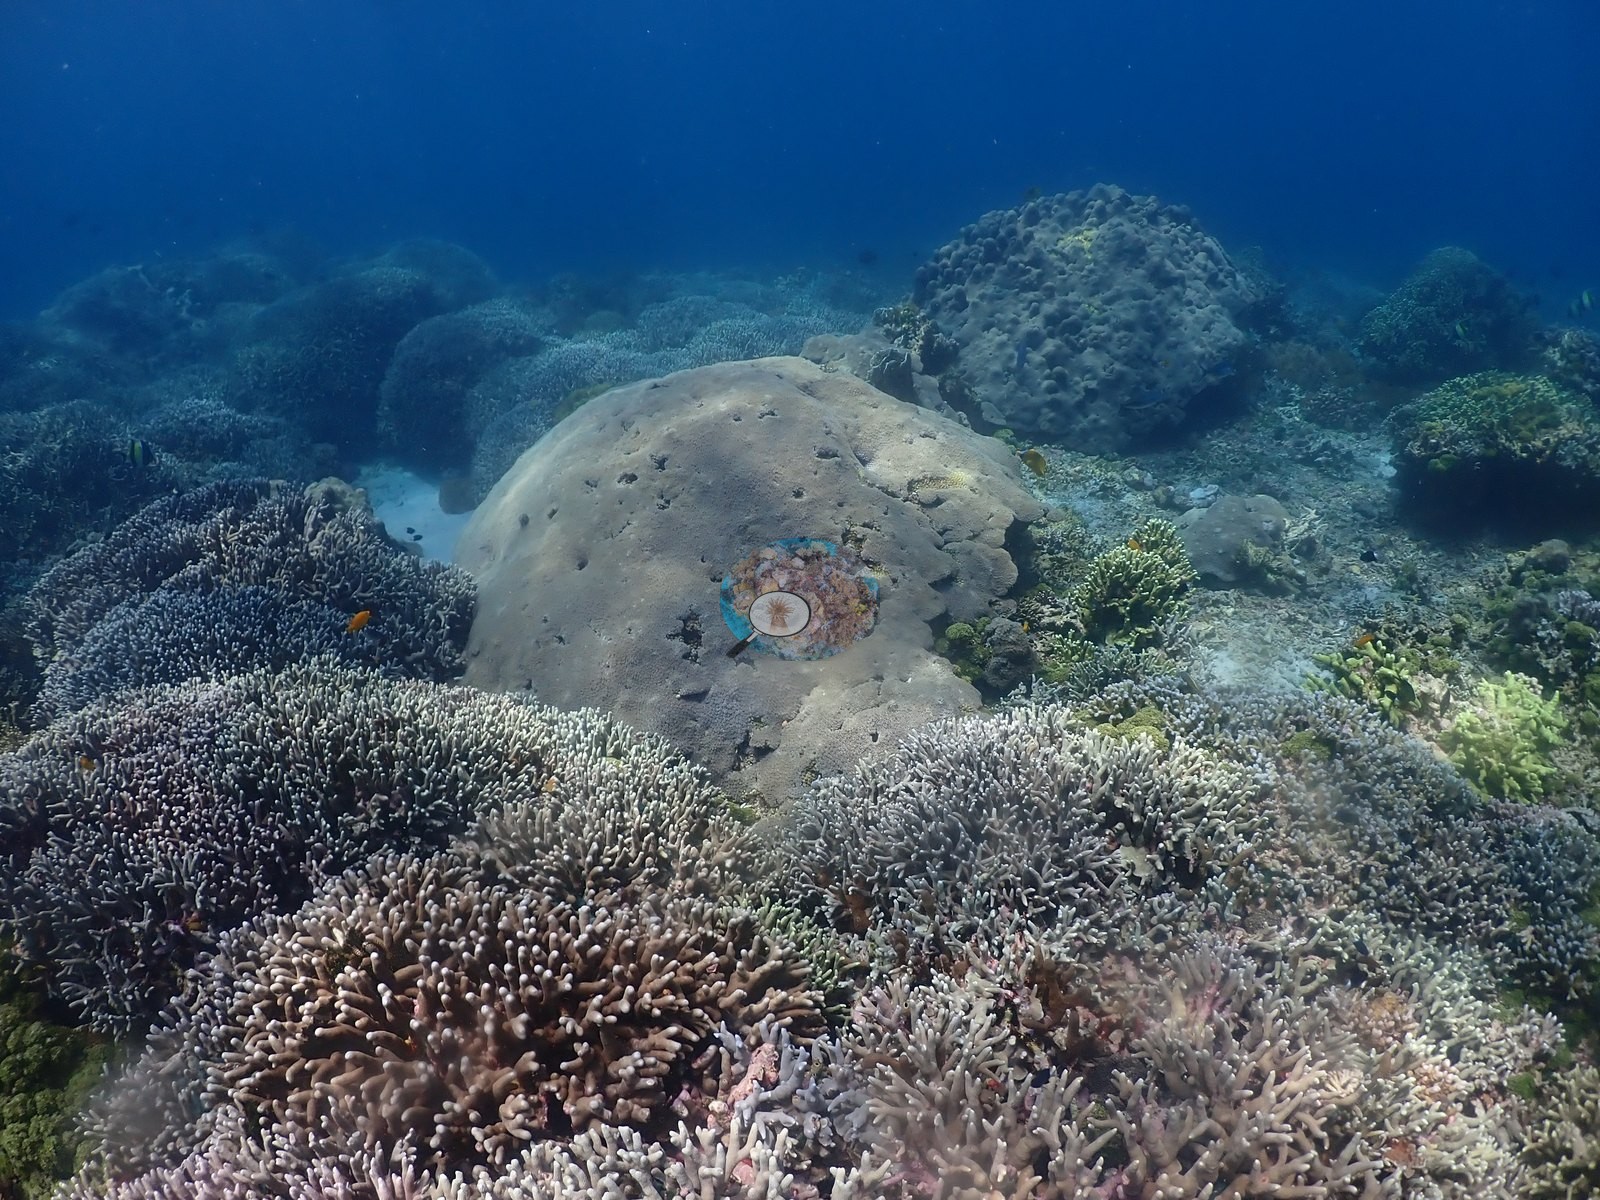
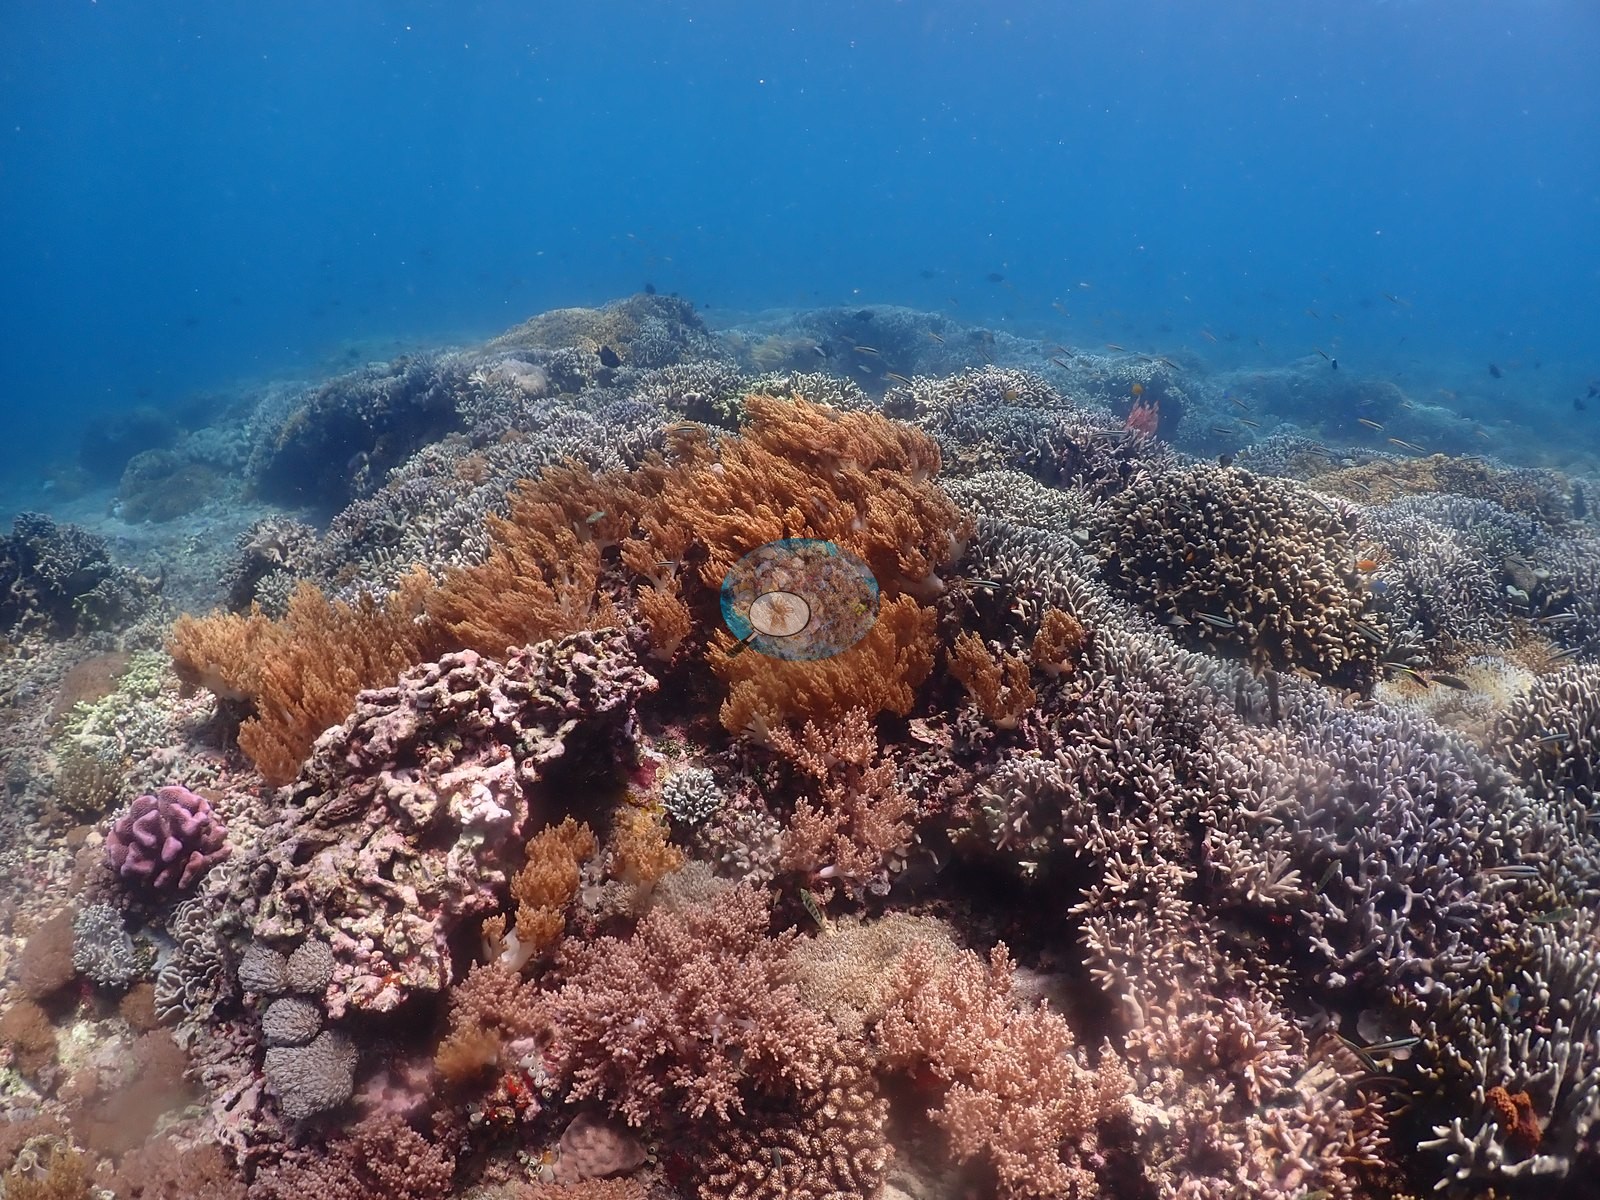
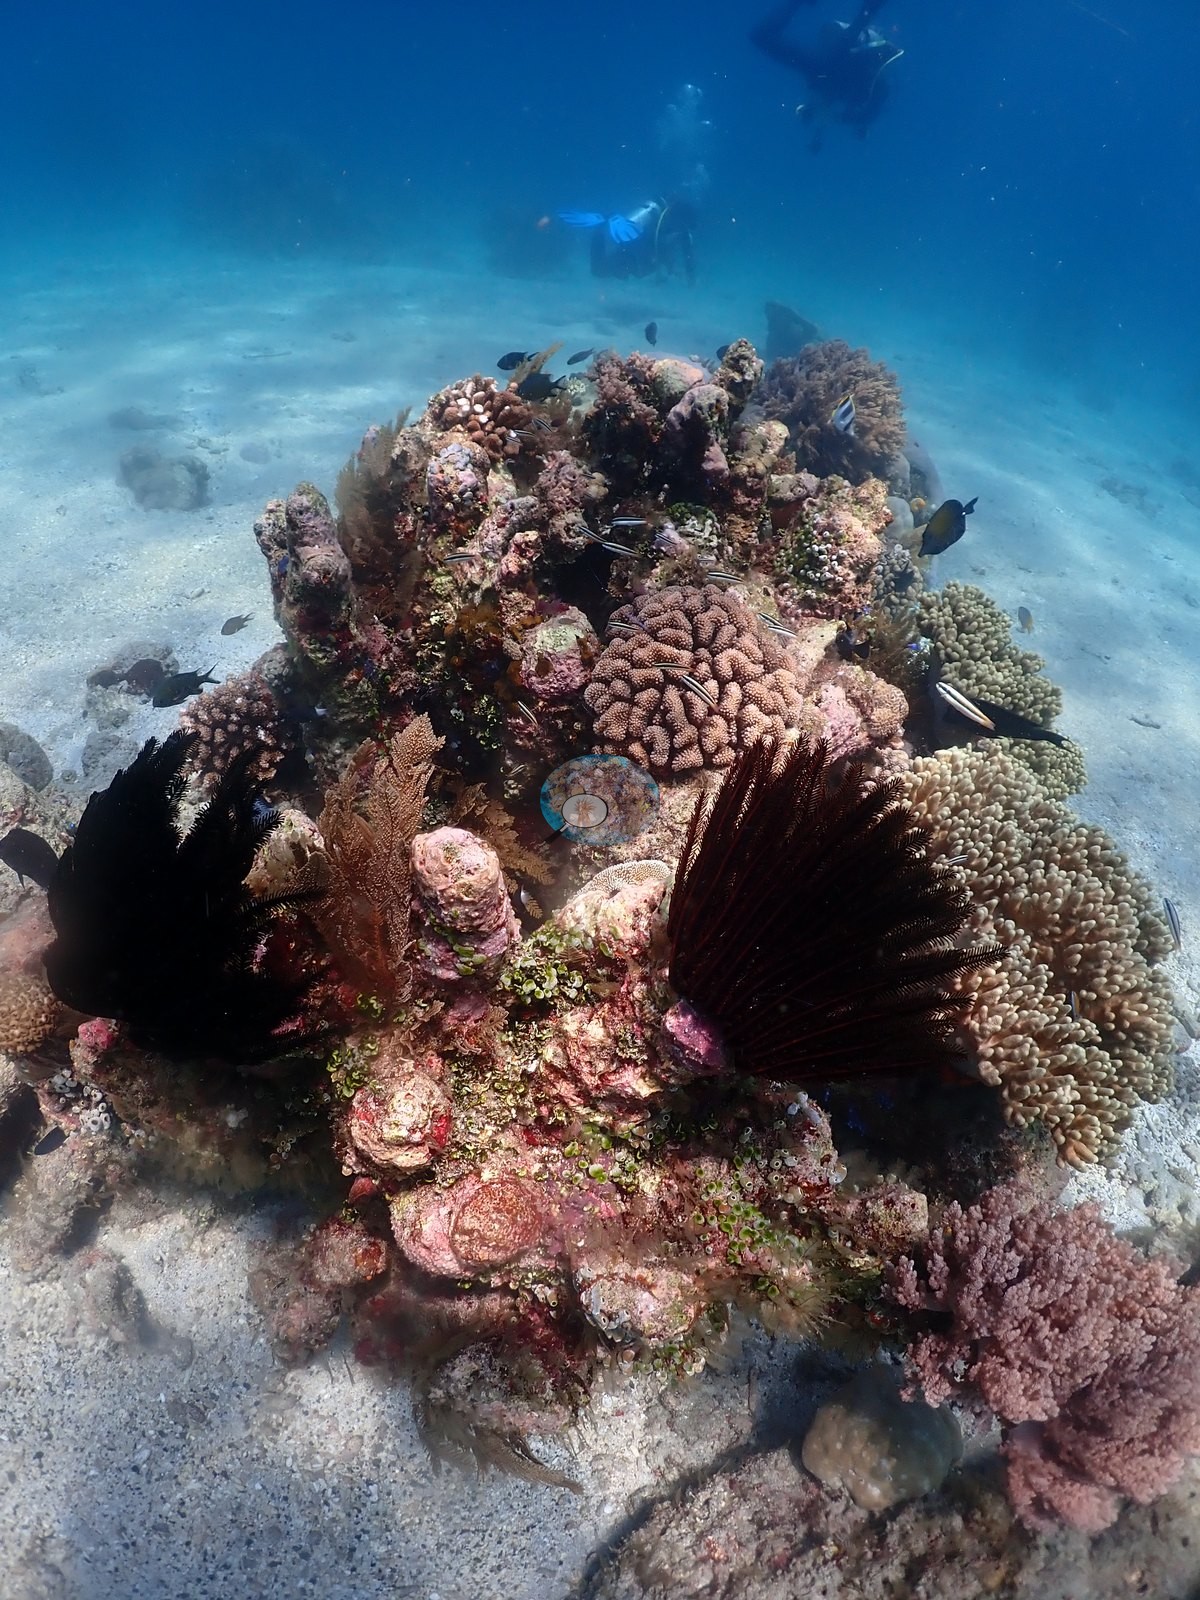
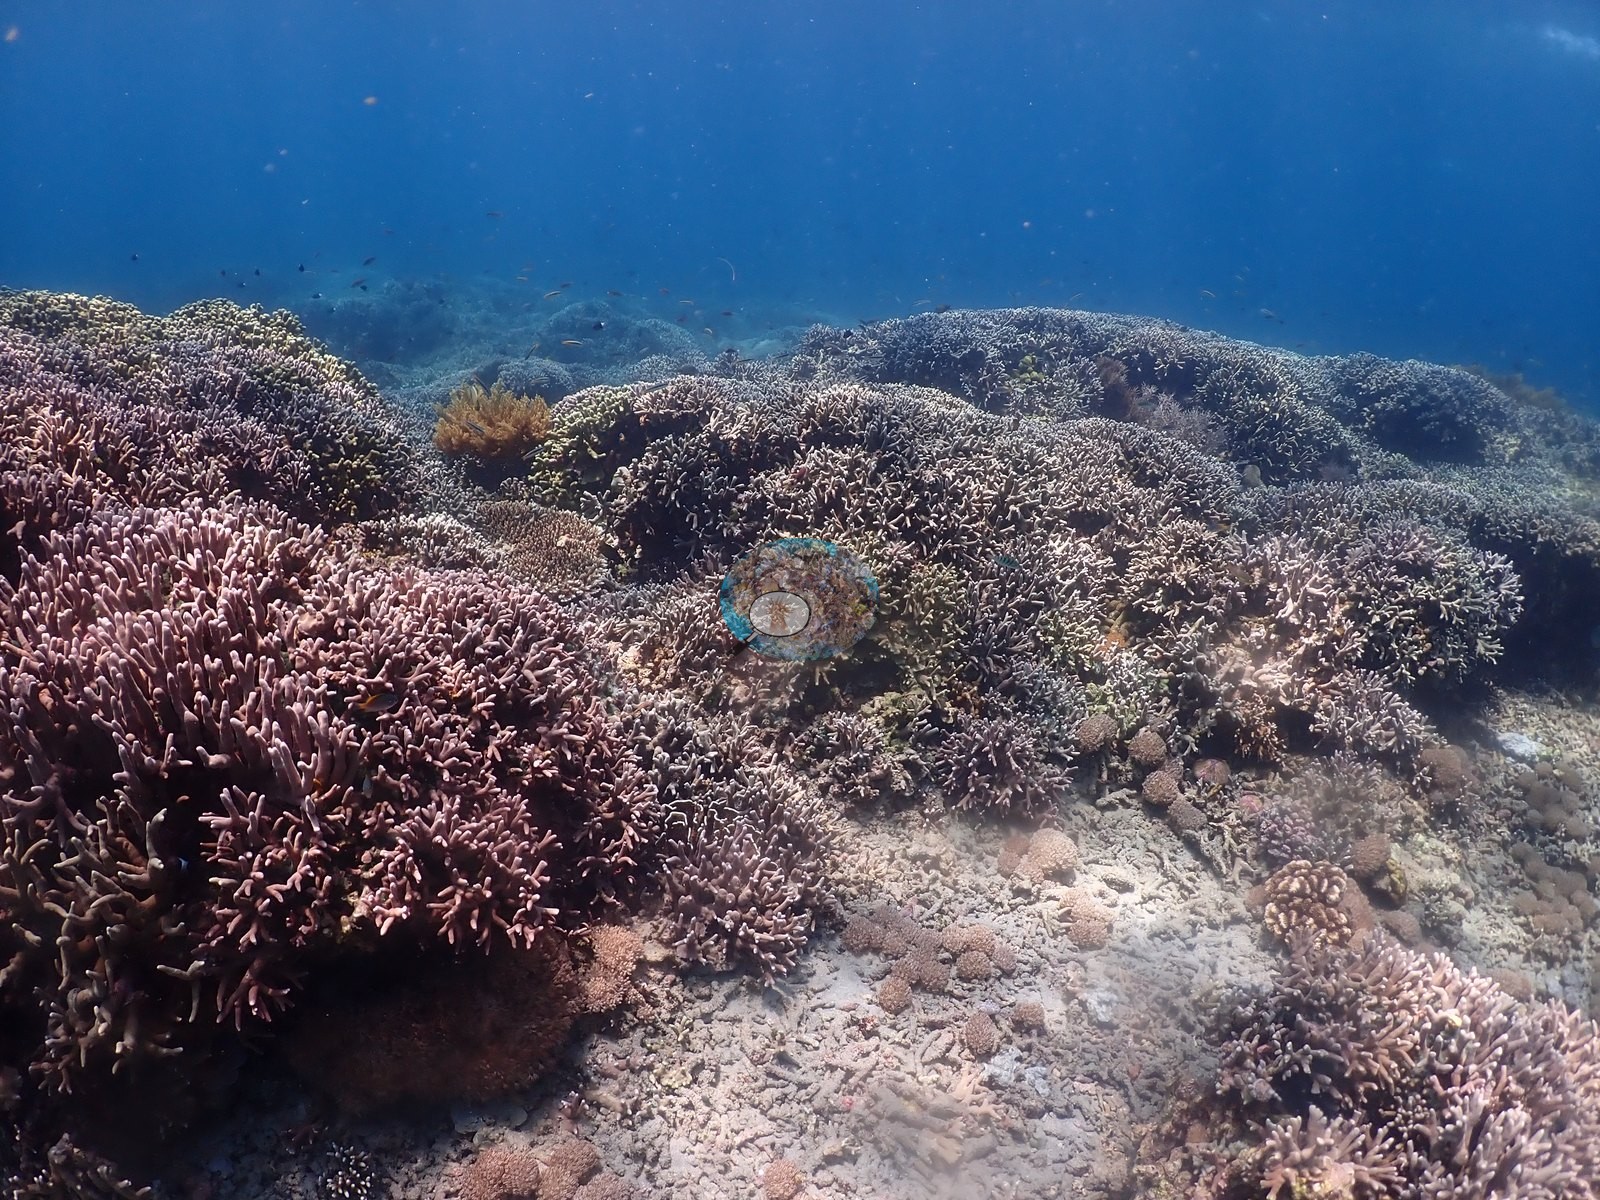
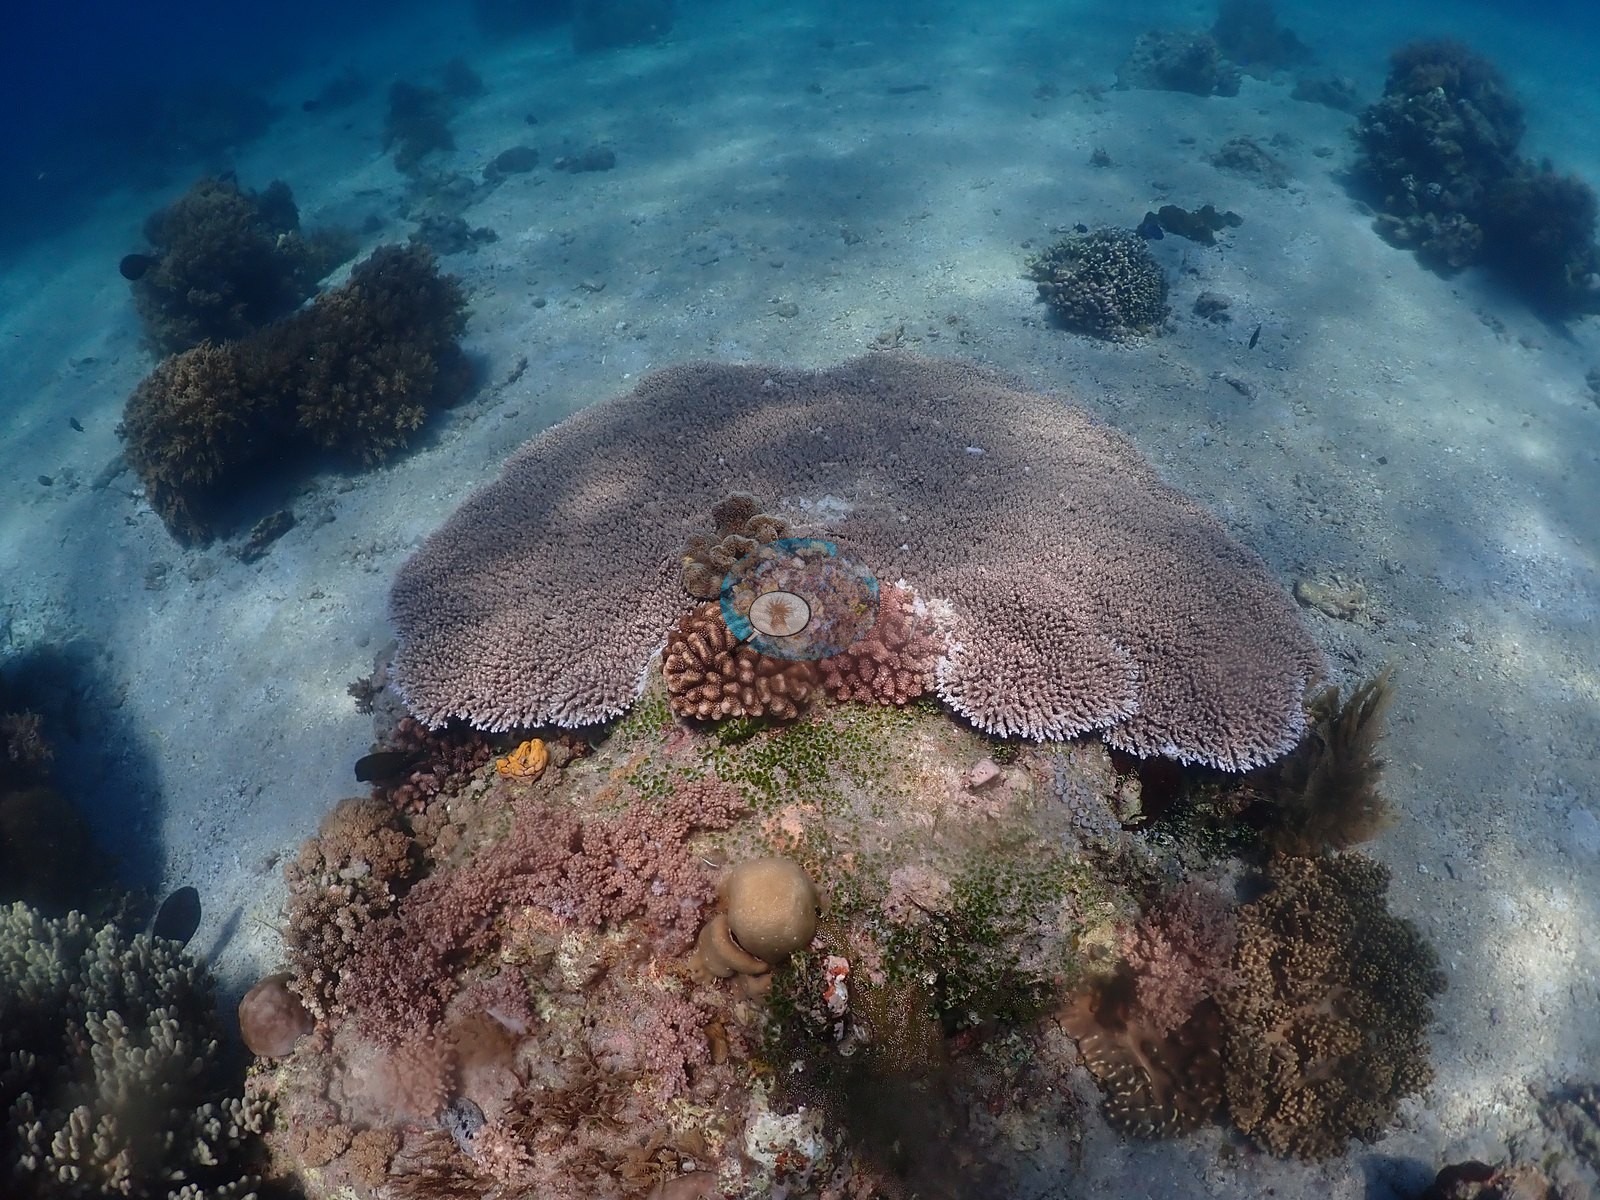
The hike itself closes the dive: discrete coral knolls standing alone on open white sand with clear water between them, divers crossing the gaps, each knoll carrying its own table Acropora, pink gorgonian, or soft-coral cluster (e.g., Image 6, Image 10, Image 15, Image 1, Image 30, Image 40, Image 43, Image 45).
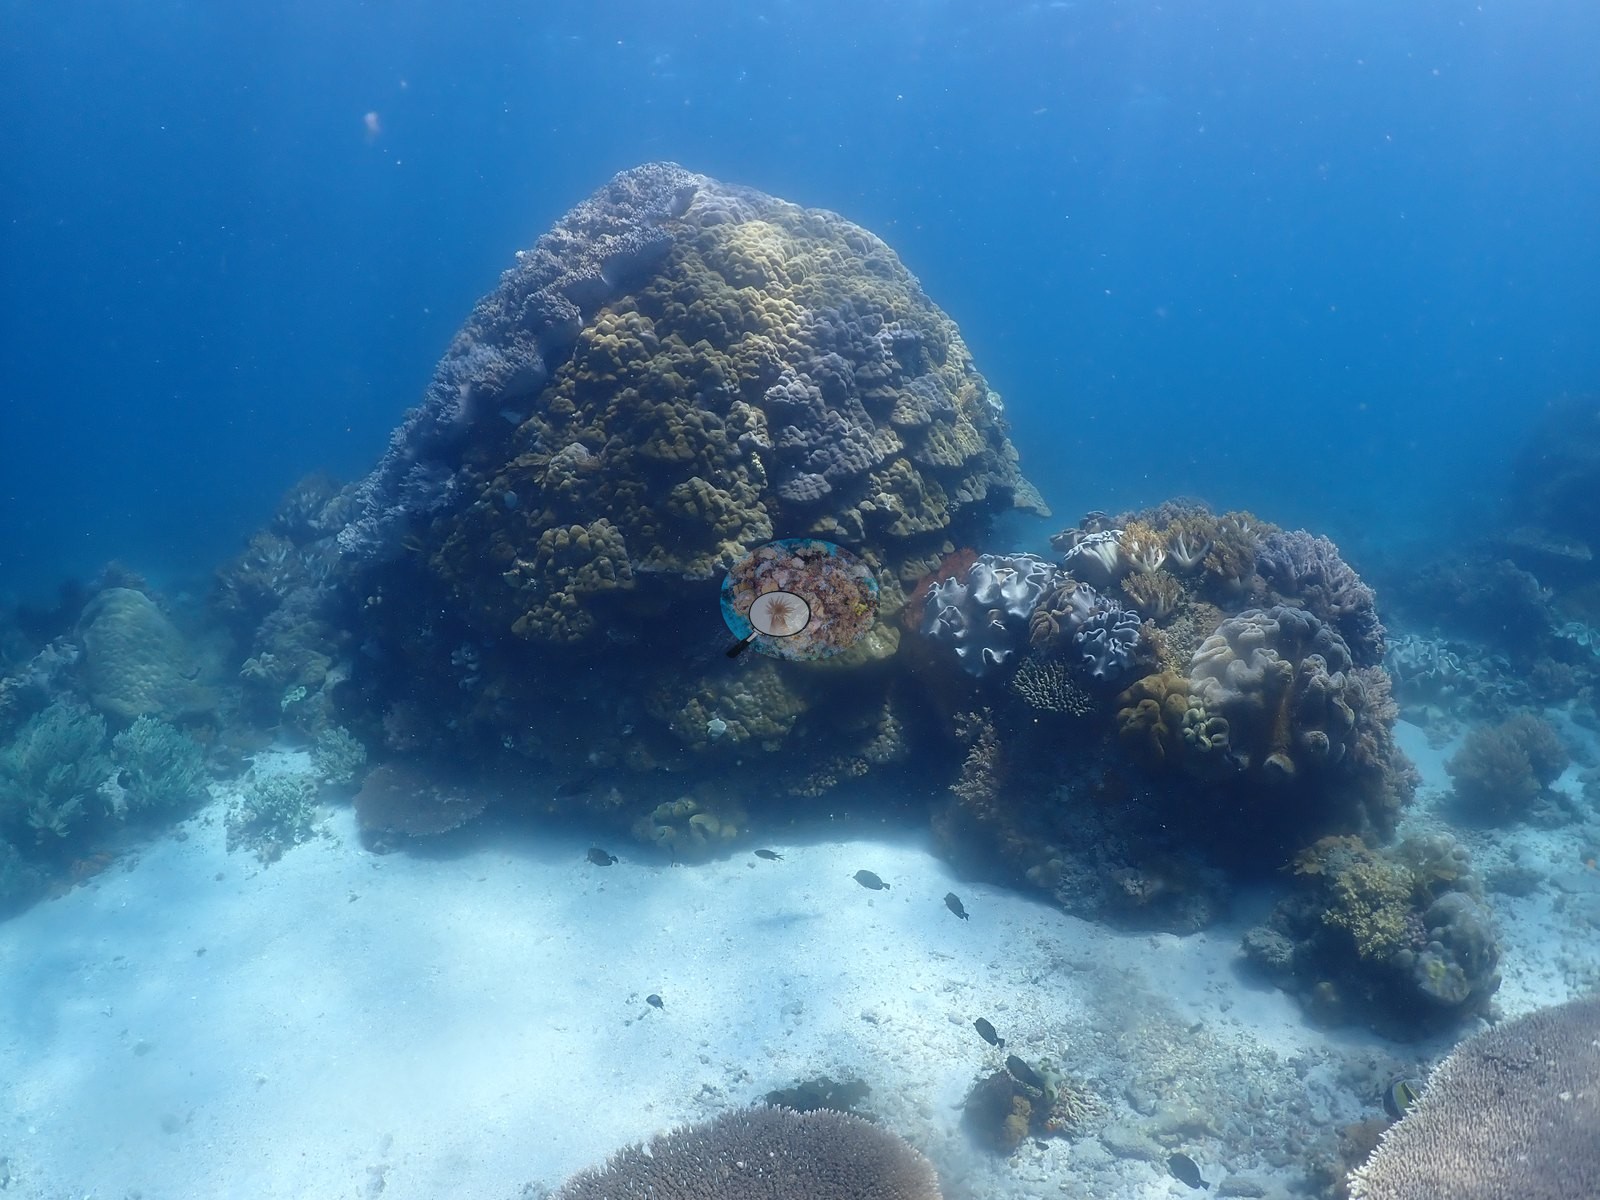
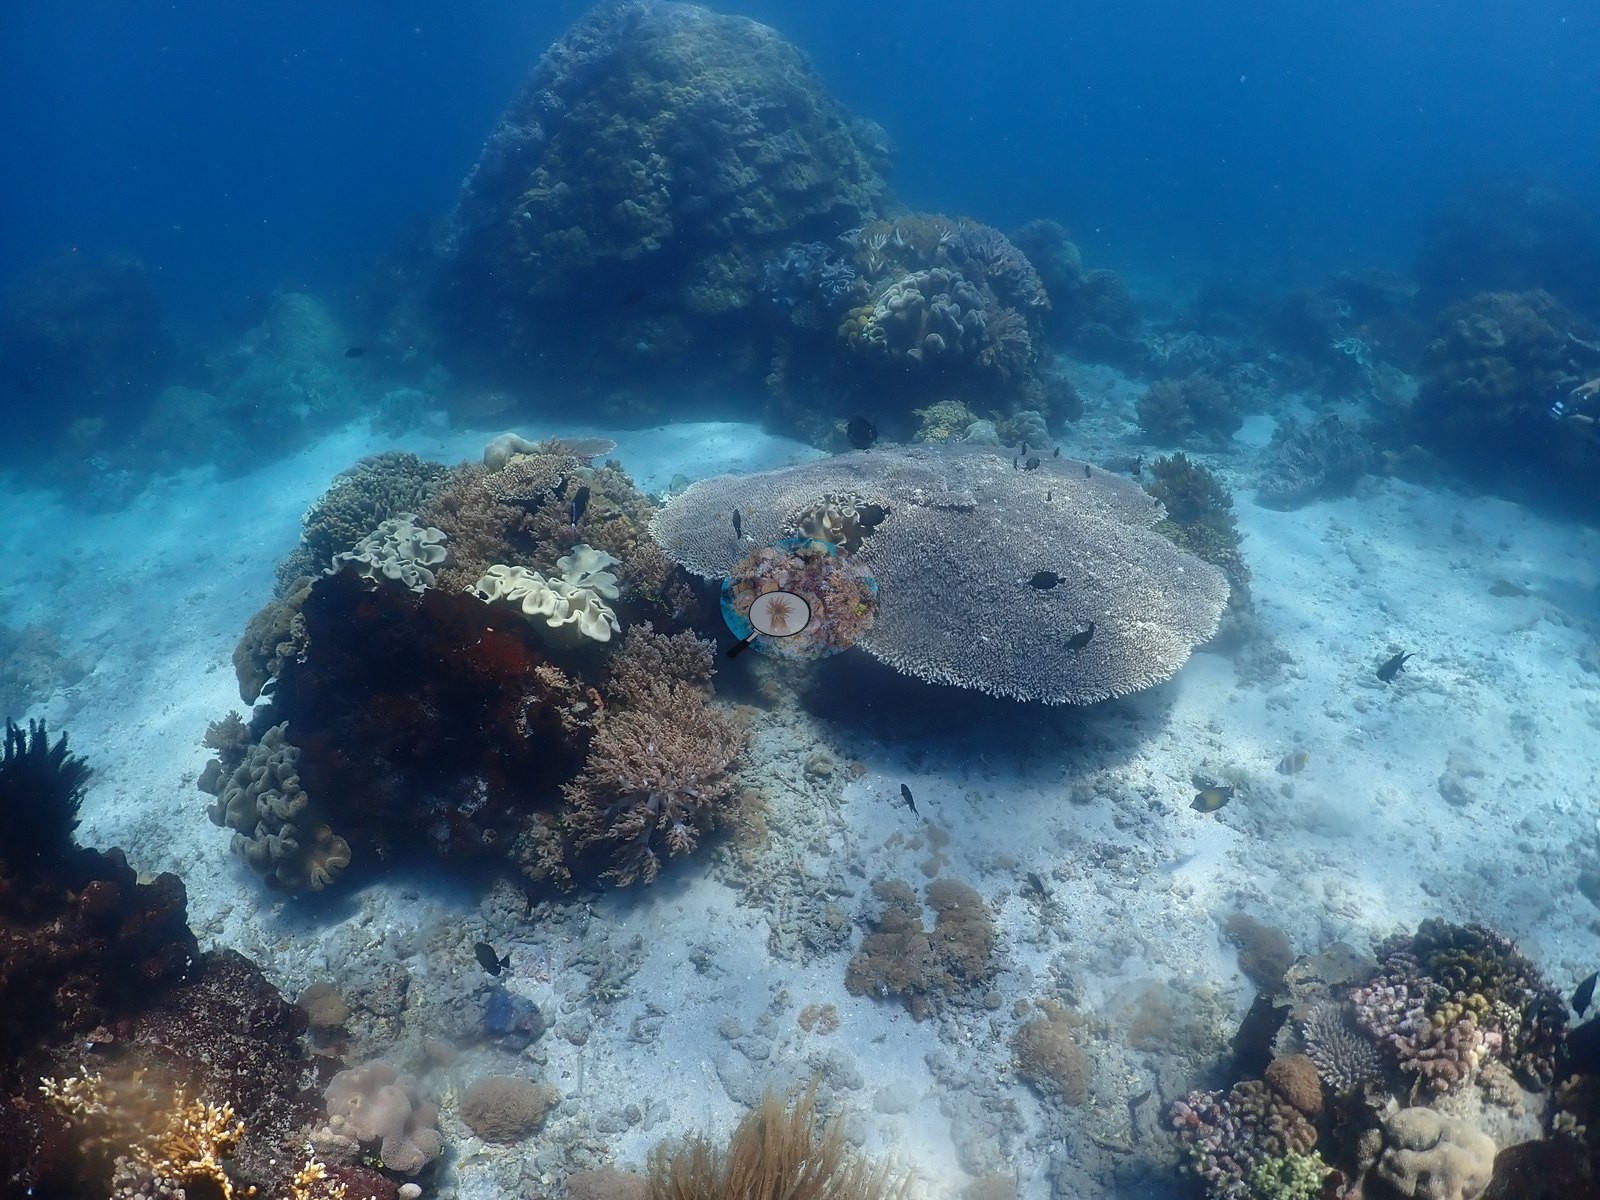
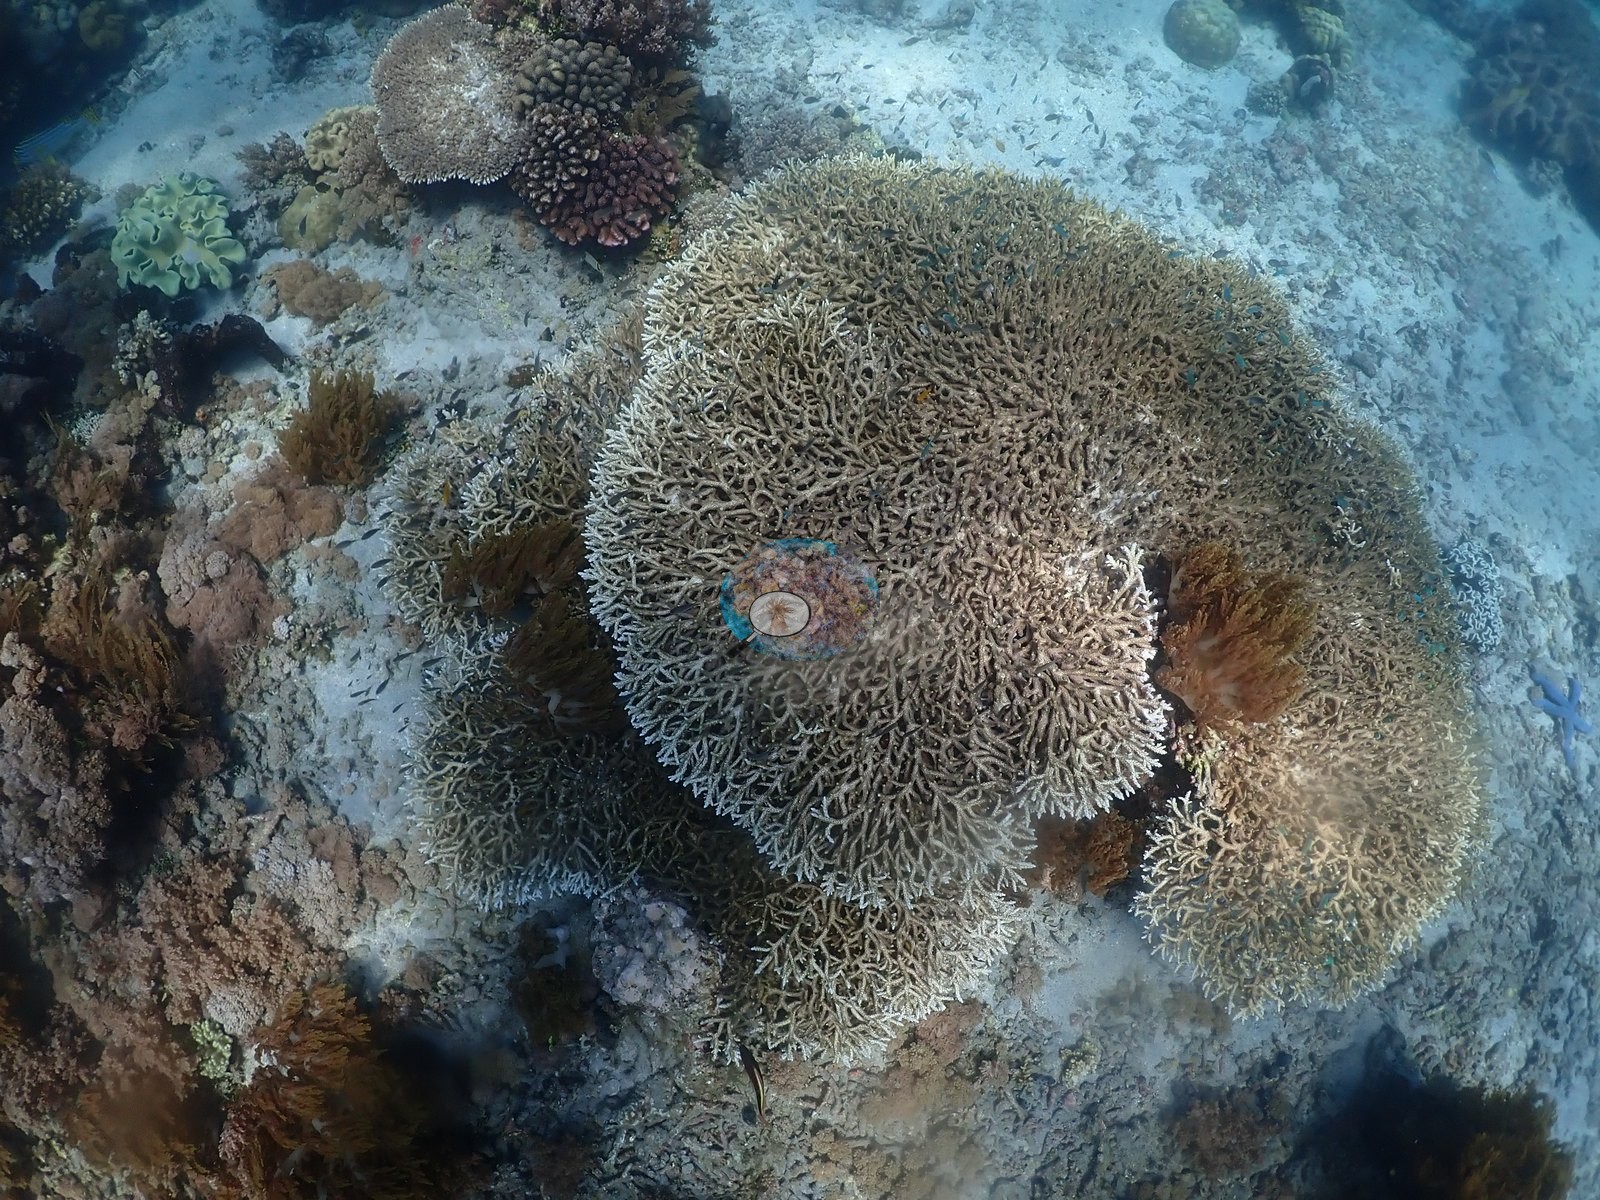
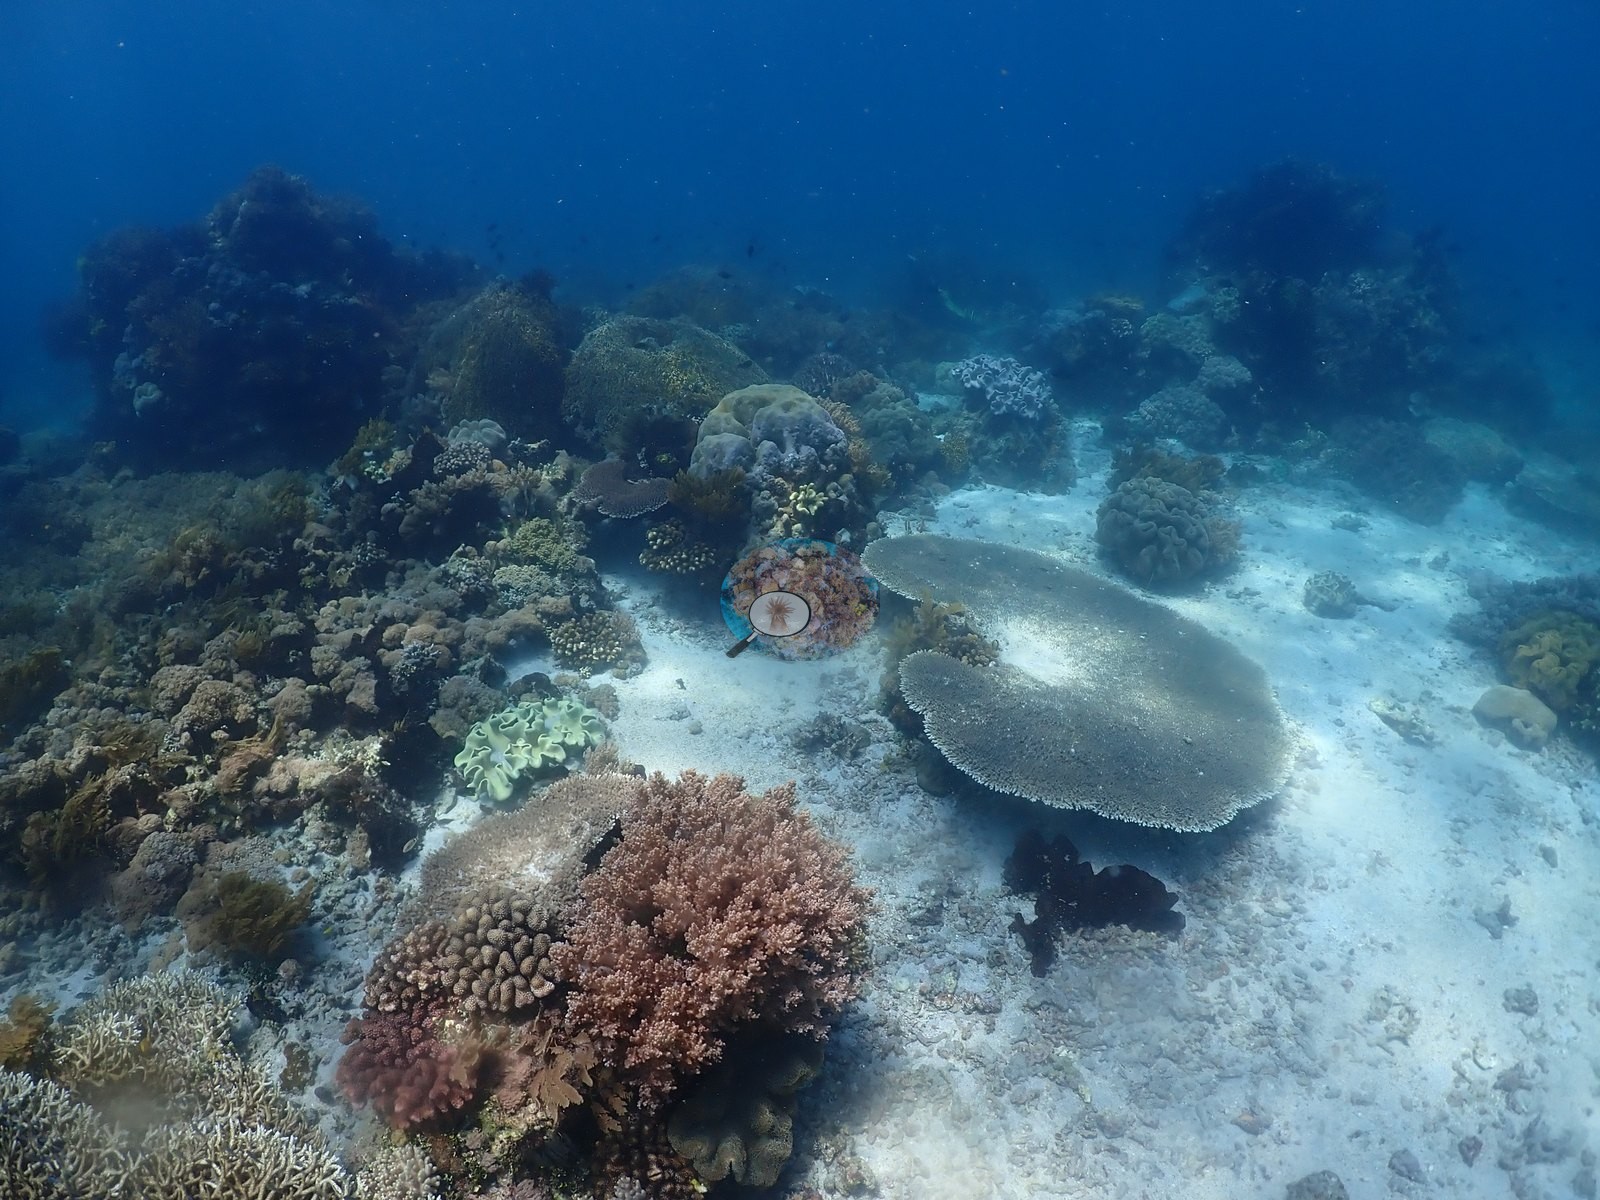
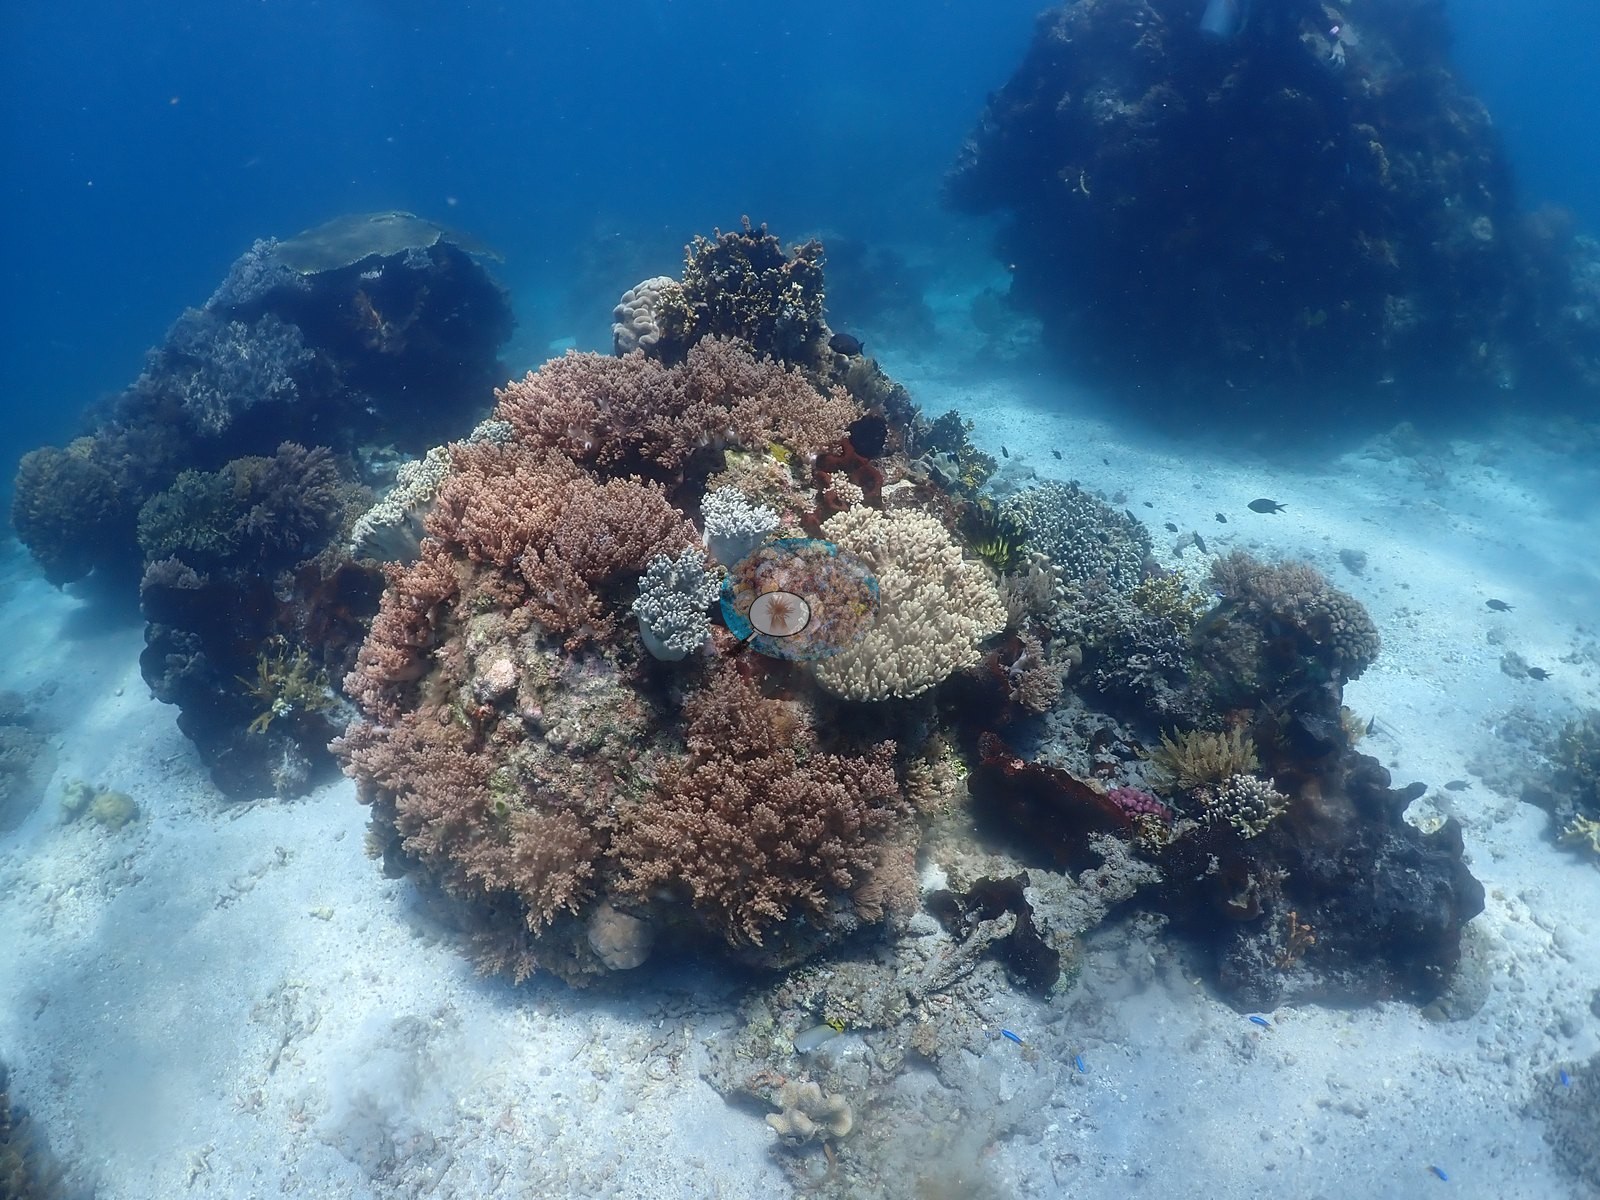
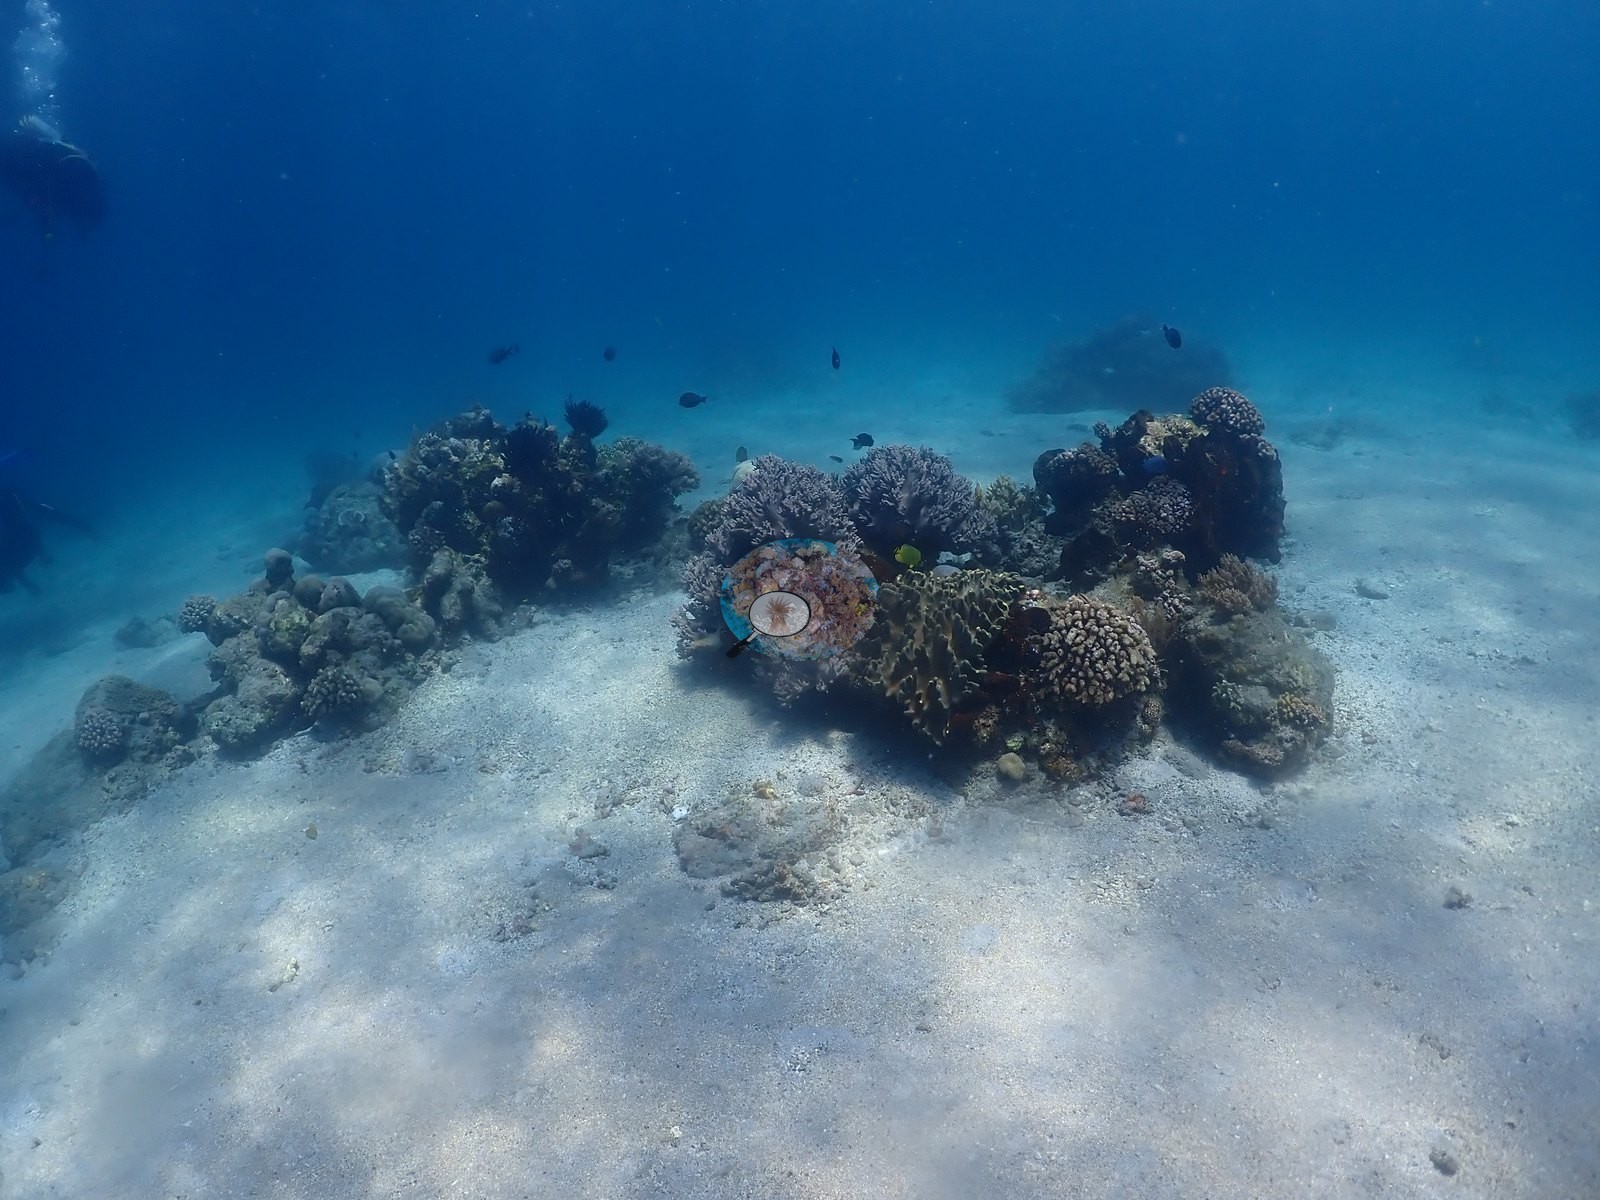
The last frames drop into a dense soft-coral and anemone garden (e.g., Image 35).
Cover spreads widely (Claude: 39% ± 28 over 126 frames, 0–100%), and the spread tracks those four legs directly.
Coral cover
Coral cover: 39% — a blind Claude computer-vision point count of 126 of Anderson's unedited photographs (20 points per photo; water, fish, and obstructions excluded). Other computer-vision methods are listed in the method table.
Comparisons with other data
No independent survey was made at this exact site; the nearest ones are listed in the table below.
CV model comparison
More info
DINOv3 and CoralSCOP were run on the same photos and are listed for comparison. Coralscapes v2 and v1 were also run but are not shown: Anderson does not consider Coralscapes reliable for these photos. No diver transect exists for this trip, so agreement between the rows is not accuracy, and as of September 2026 no computer-vision method estimates coral cover accurately on new images; treat every row as indicative.| Method | Hard-coral cover (%) |
|---|---|
| In-house DINOv3 | 28.0 |
| CoralSCOP unedited | 34.1 |
| Claude | 39.4 |
Independent surveys nearby
Within 5 km, 9 independent survey stations recorded hard coral cover in 2024. Surveys since 2021 average 40% (range 18–59%, n=10). This site's own estimate (39%) sits within the recent range (18–59%); the methods differ, so the comparison is context, not a like-for-like test.
Collected by other programs using different methods (MERMAID is a data platform: each MERMAID row names the organization that did the survey, and its method is in the row's hover text), so these are context for the figures above, not a like-for-like comparison. Where a station was surveyed more than once the range is shown. Station names are not dive-site names.
Data & links
All images from Coral Reef Diagnostics. Data are from Coral Reef Diagnostics and the organizations named in the data-sources table above.
© Coral Reef Diagnostics.