
Regional summary of 37 dive sites. Figures are averages across the sites that report them (n = sites with a value); each site's own page has its individual values. Part of the Maldives overview.
⬇ Download this region as a report card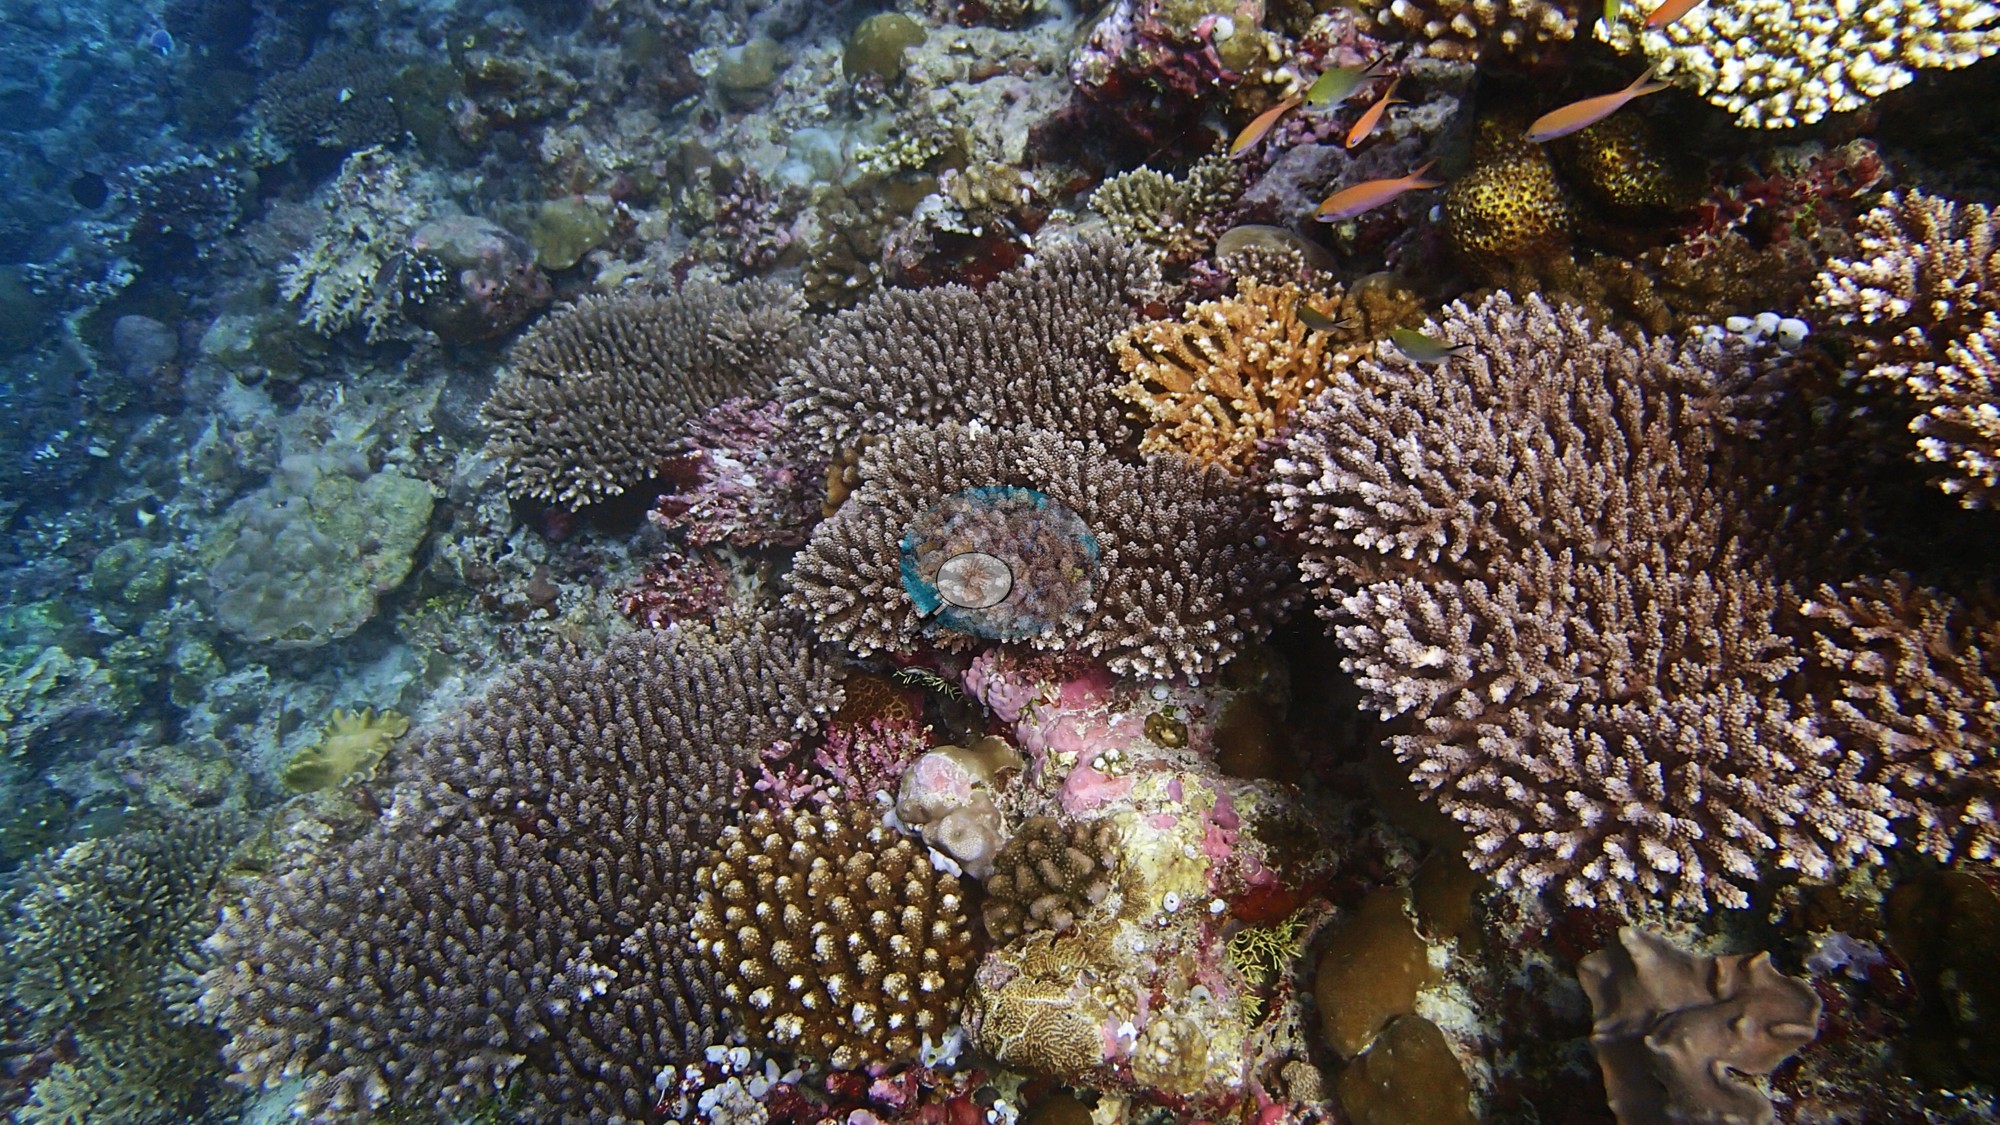

Bank reefs, thilas, channels, and walls in the central Maldives atolls were first dived in January 2016 and resurveyed that April, when most recorded colonies at several sites had bleached. Later dives found crown-of-thorns starfish at ten sites and young corals recolonizing rubble.
Heat stress
Long-term record: 3 years since 1985 reached 8 or more °C-weeks at NOAA’s Maldives station. Download the annual DHW data (CSV).
37 sites in this region — click a marker to open that site.
Regional setting
The central atolls sit midway along the Maldives chain, 22 atolls stretching some 800 km north to south on the Chagos–Laccadive Ridge, a volcanic trace of the Réunion hotspot (Spalding et al. 2001). The atlas uses an aerial view of this area to show the two parallel rows in which the atolls are aligned, and illustrates a typical Maldivian lagoon with Felidu and Wataru atolls, just south of South Male, crowded with patch reefs and faros, ring-shaped reefs resembling small atolls that are unusual outside this country. Rims are broad reef flats cut by deep channels and topped with islands and sand cays, and lagoons range from 15 to 55 m deep. When the first protected areas were gazetted in 1995, as protected dive sites, most lay in North Male, South Male, and Ari atolls, among them Banana Reef, HP Reef, Fish Head, and Maaya Thila; more followed in 1999. Before 1998, coral cover on atoll edges, faros, and lagoon knolls exceeded 60% to at least 20 m, but the 1998 bleaching was among the worst recorded and killed up to 90% of hermatypic corals in some areas. Coral mining for building material, estimated at 200,000 to 1 million m³ a year in the early 1990s, was later confined to a few designated reefs. Spalding et al. (2001) estimate about 8,920 km² of reef for the Maldives as a whole, and Souter et al. (2021) give 6,372 km² for the Maldives ecoregion.
As of 2001, Spalding et al. listed the localized effects of the resort-based tourism industry: diver and anchor damage, groynes and jetties that disrupt sand movement, sewage discharged into lagoons, warm effluent from desalination plants, and solid waste. Summarizing the 2004 status report, Wilkinson (2006) notes encouraging recovery after 1998, many marine protected areas run by resorts, and heavy 2004 tsunami damage to shorelines and islands, with reefs less affected. Souter et al. (2021) show Maldivian coral cover recovering until about 2015, then falling after the 2016 bleaching, which killed over 42% of living hard coral across South Asia; localized bleaching continued from 2017 to 2019. All nine of the region's long-term monitoring sites are in the Maldives, and of 30 long-term sampling units that had lost at least a fifth of their coral, 28 had not regained 90% of their earlier cover.
Overview
The central Maldives unit covers North and South Male, Ari, and Vaavu. Seven atoll-level pins carry only nearby-survey context, and the rest are individual dive sites from two periods of fieldwork. In January 2016, research dives tagged and measured coral colonies at Small Sand Bank, Raaeundi Reef, Veli, Stage, Maafushi, and Big Sand Bank, and the Anantara Dhigu house reef was dived on the same trip. A later liveaboard covered thilas, channels, walls, and wrecks, including two night dives in May 2017.
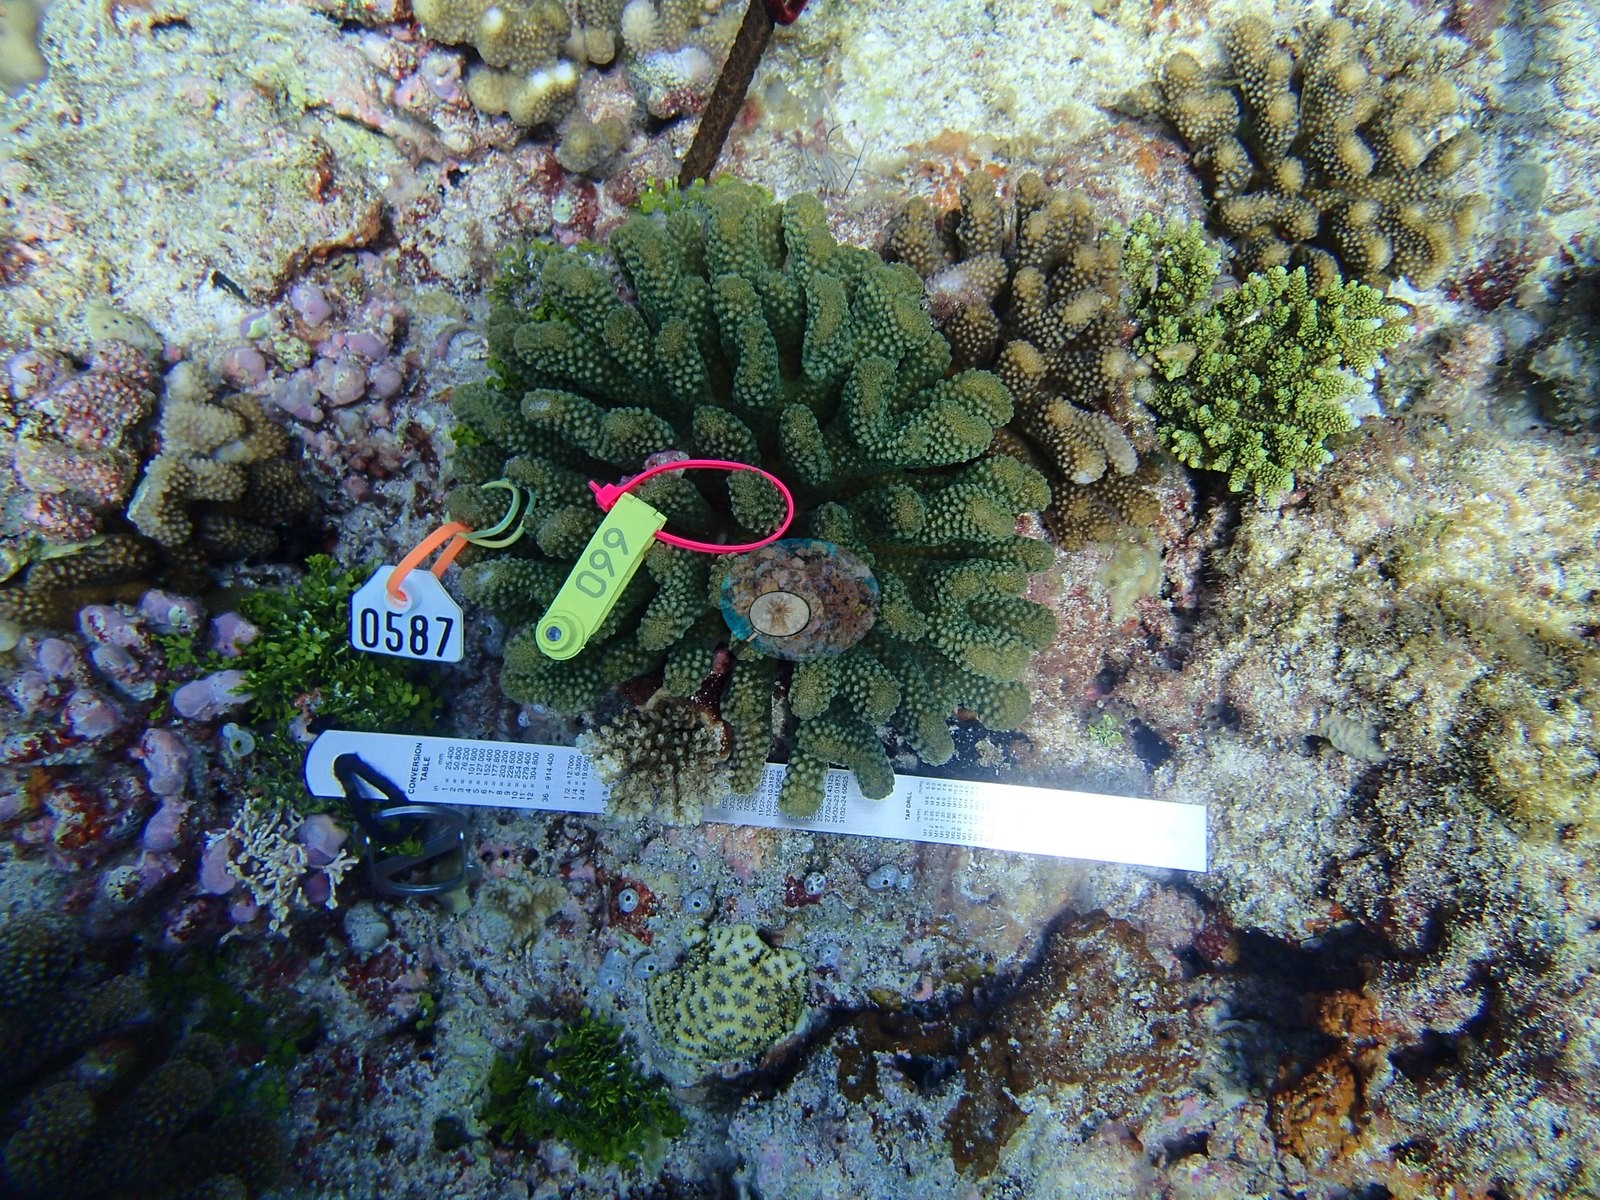
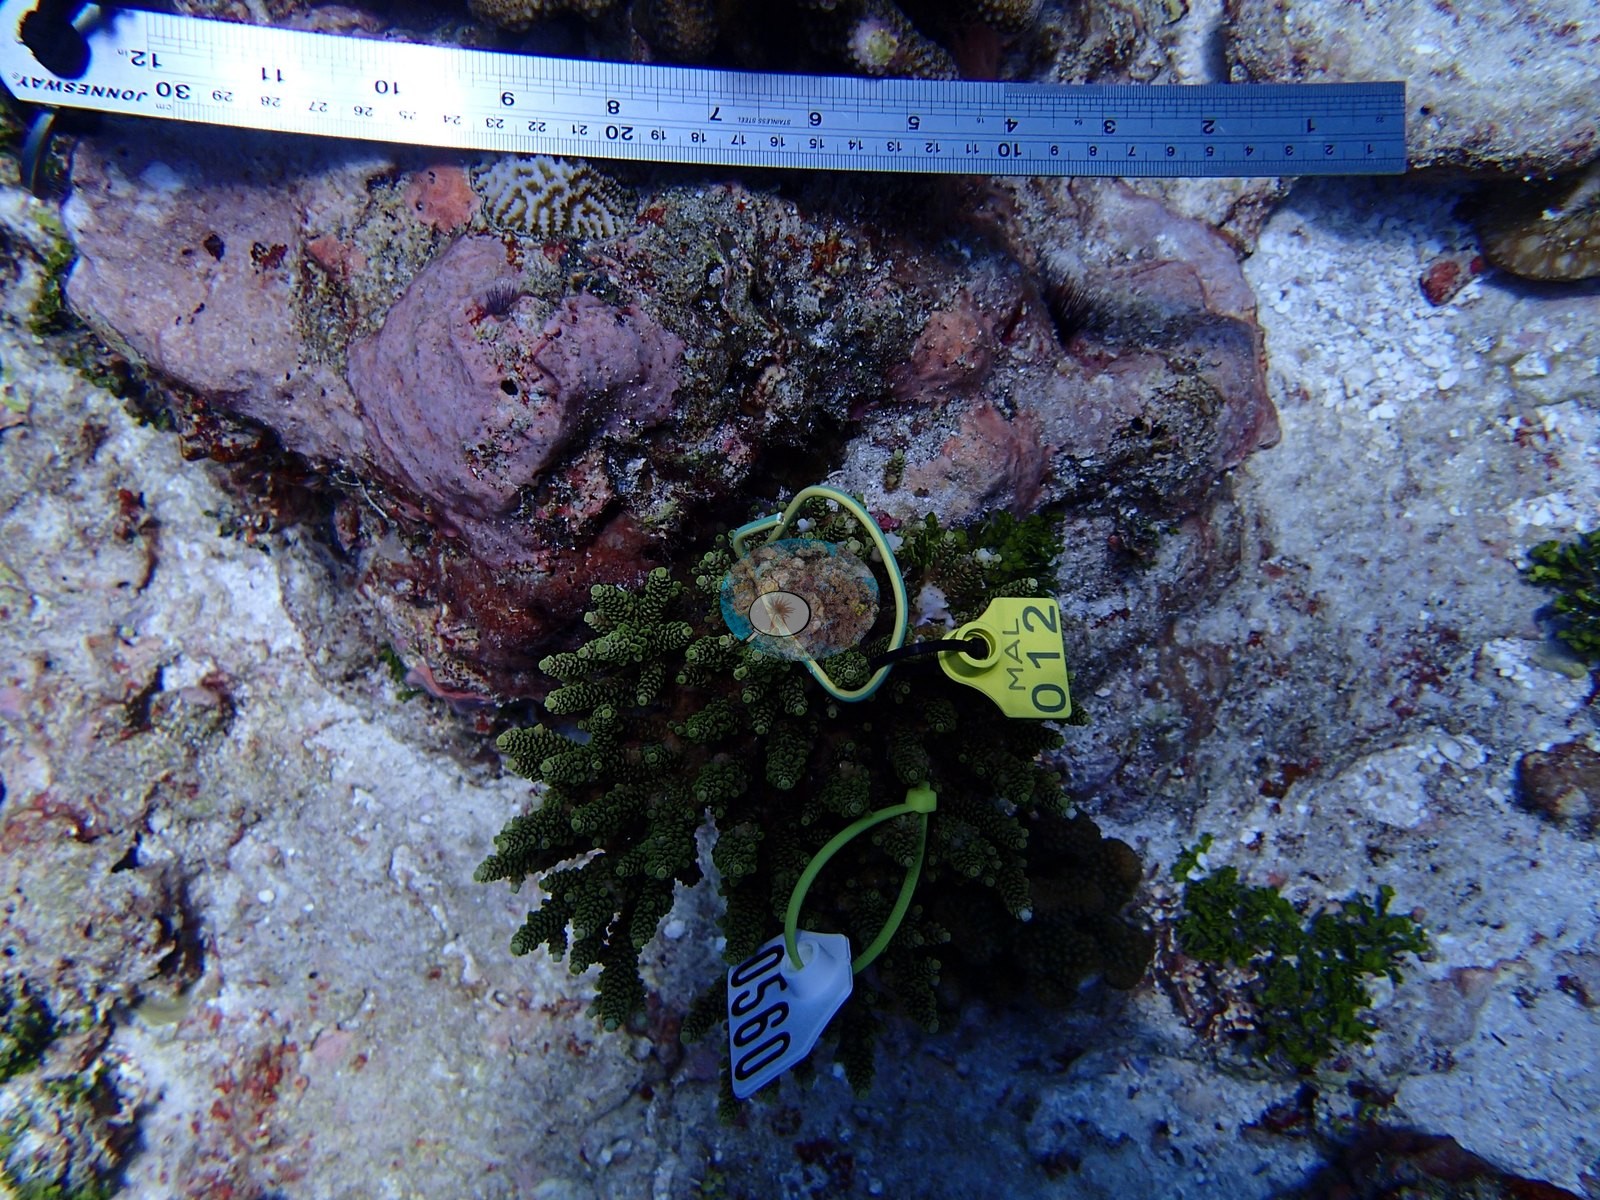
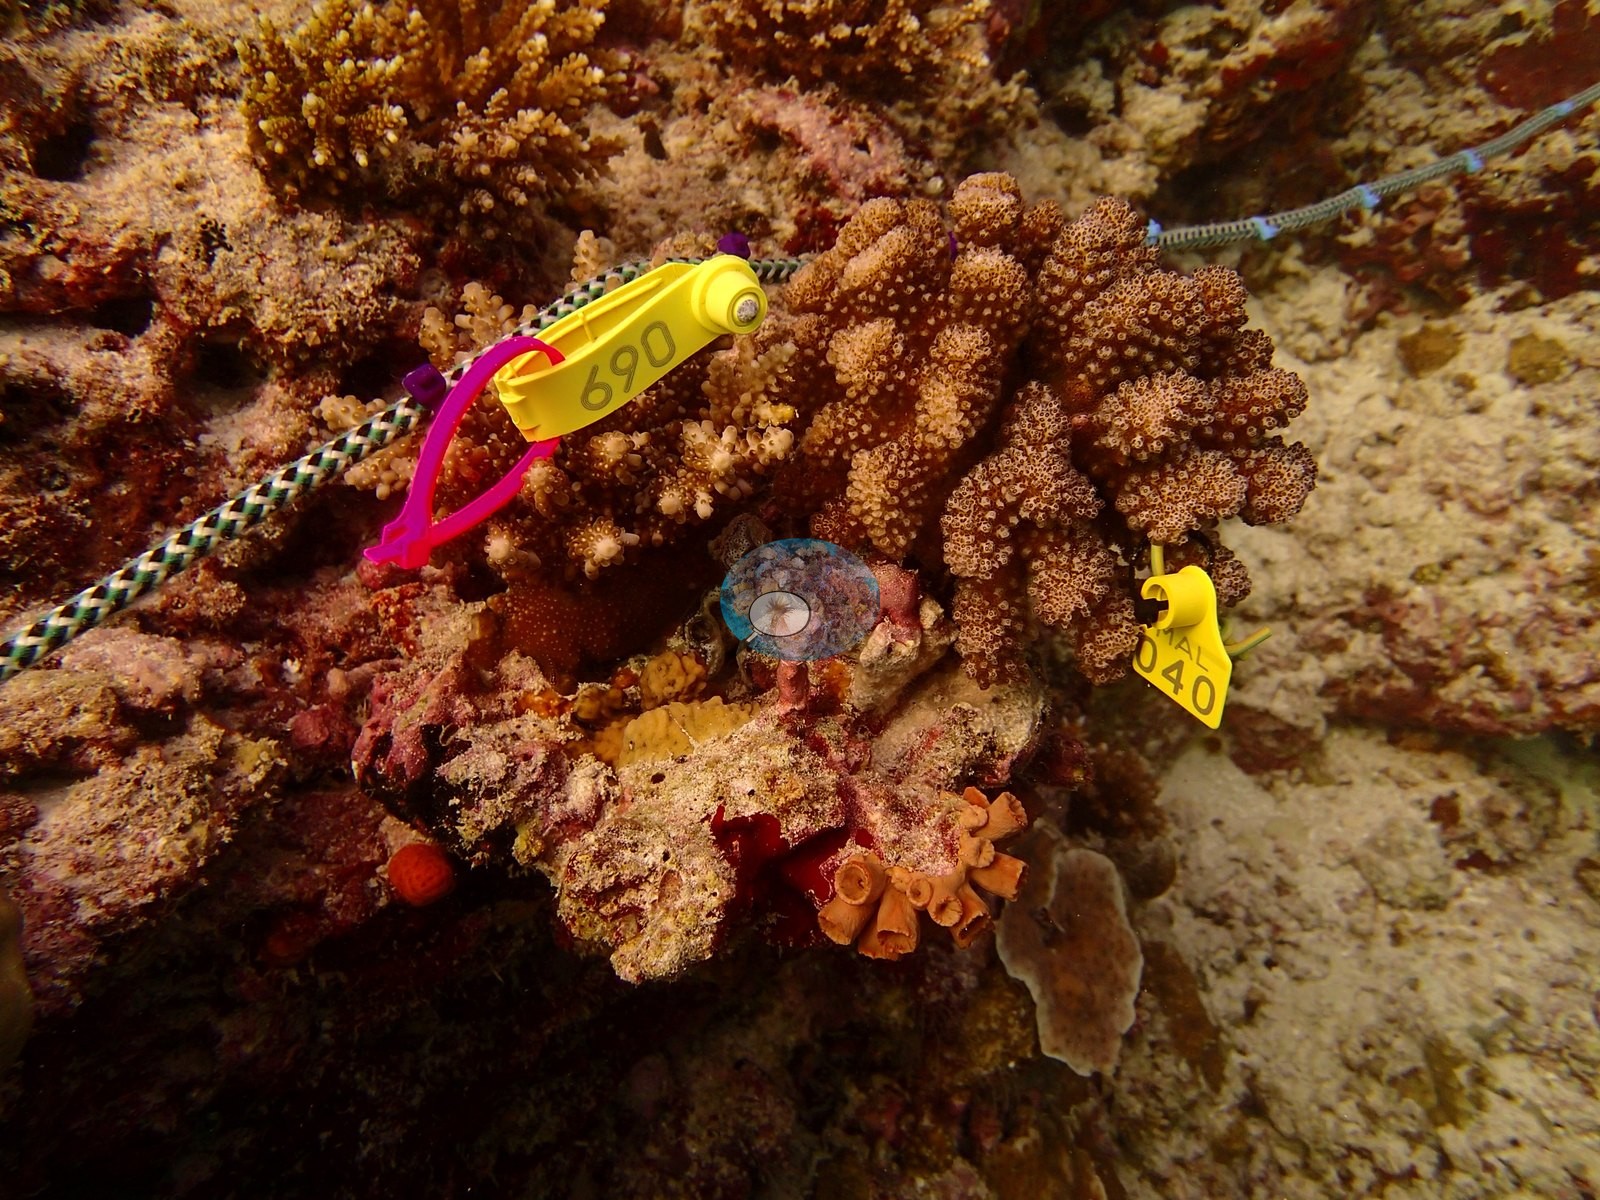
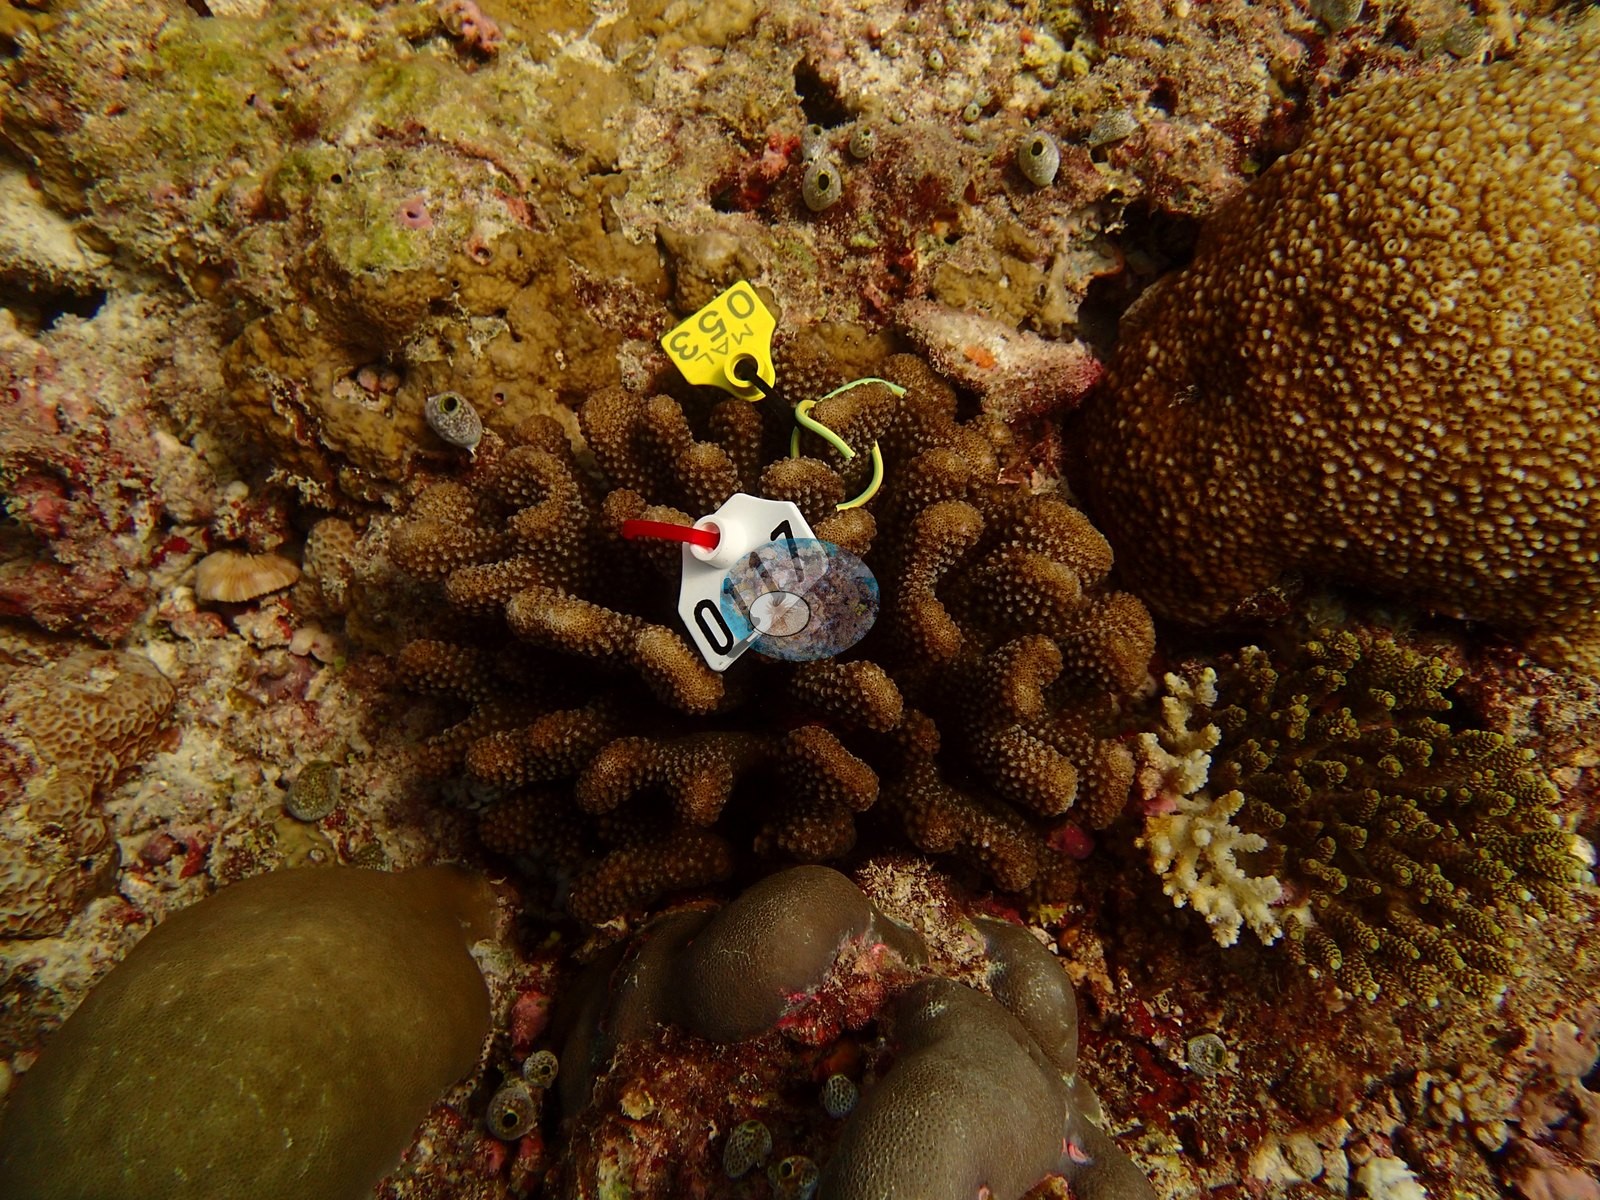
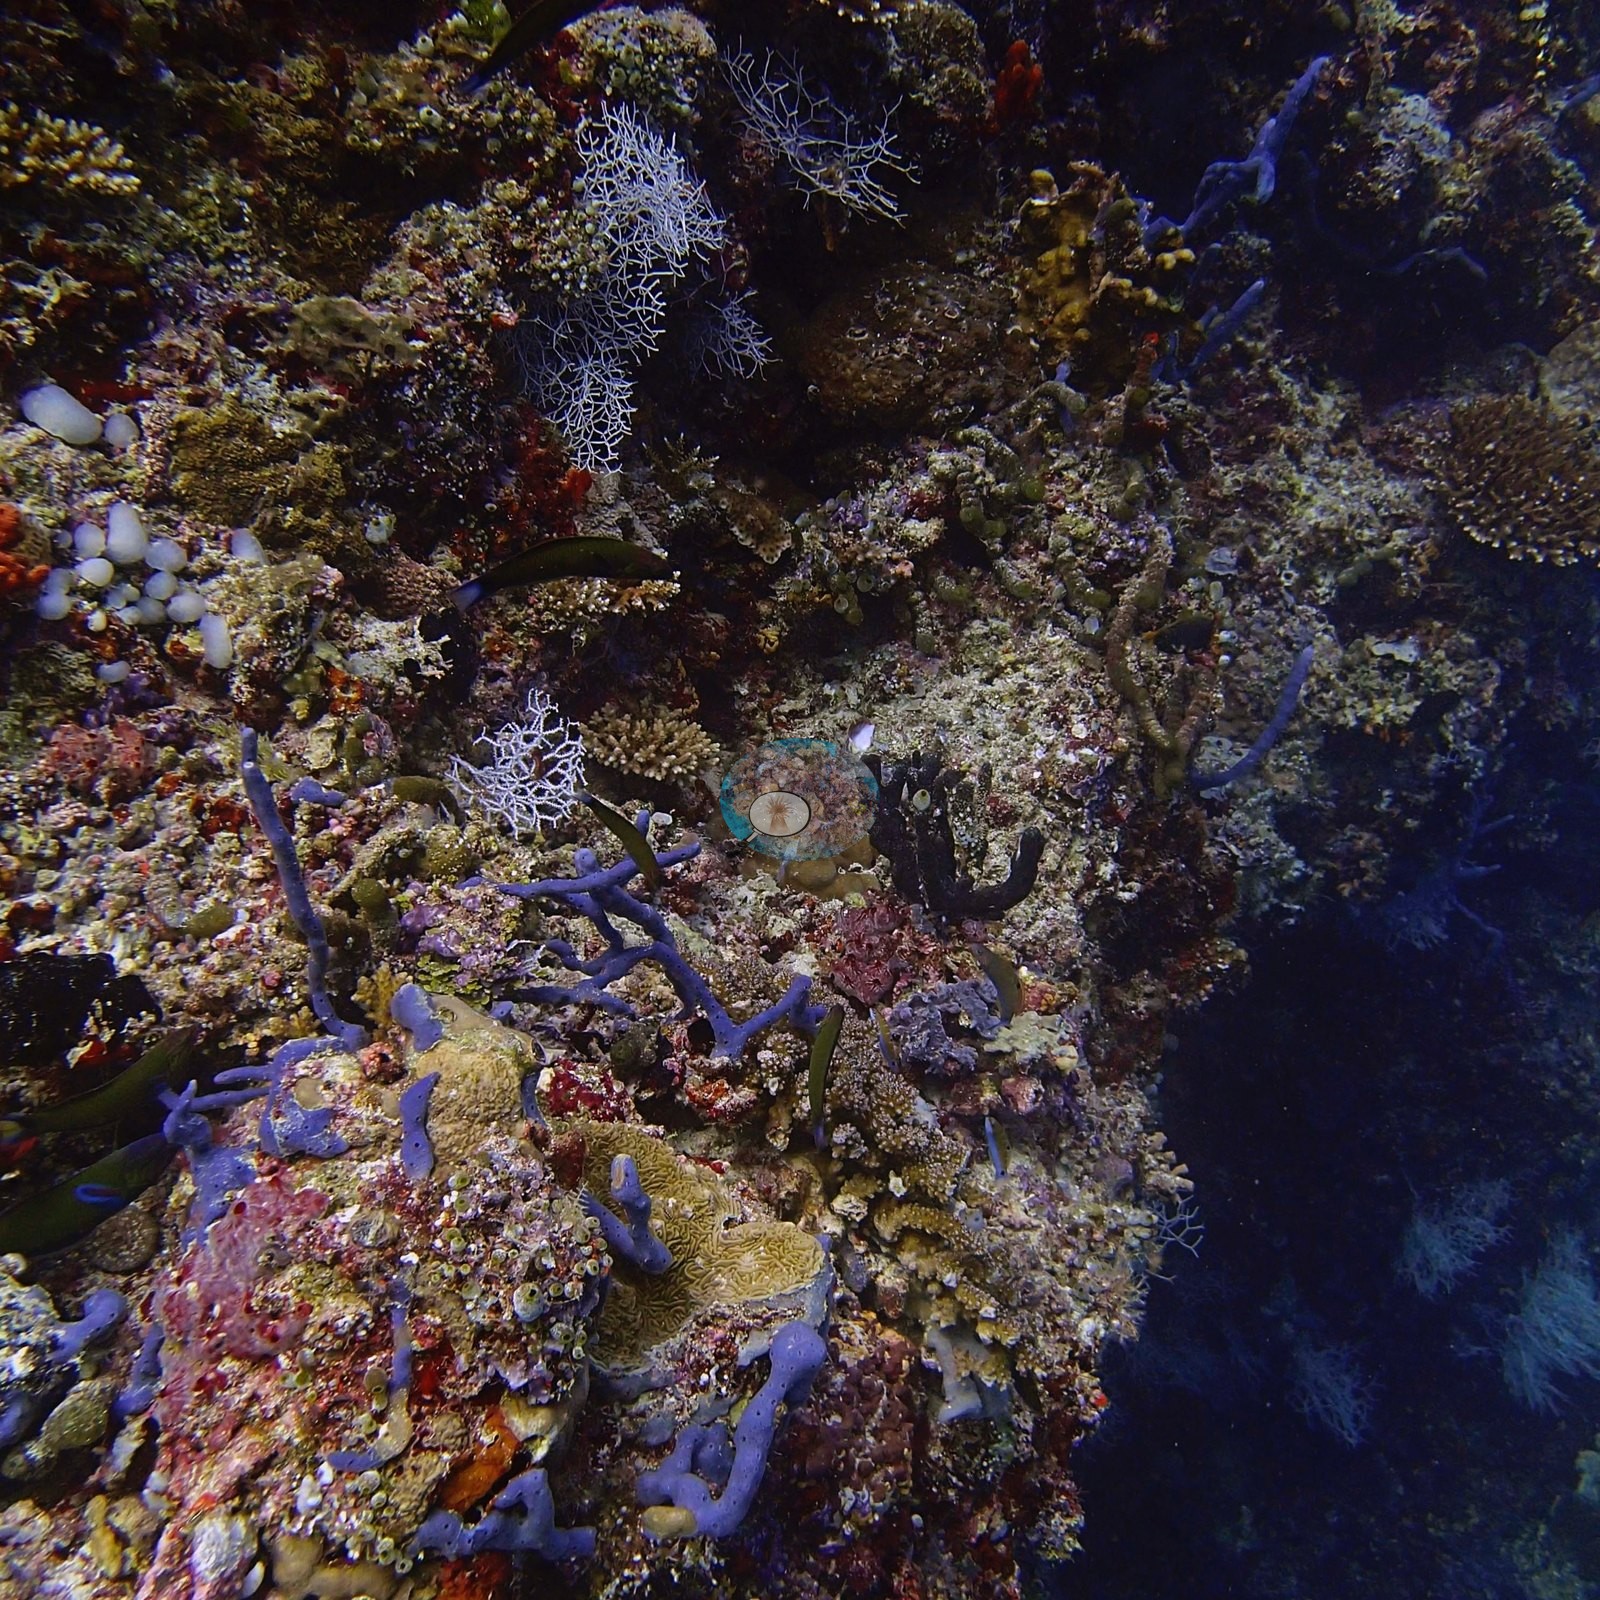
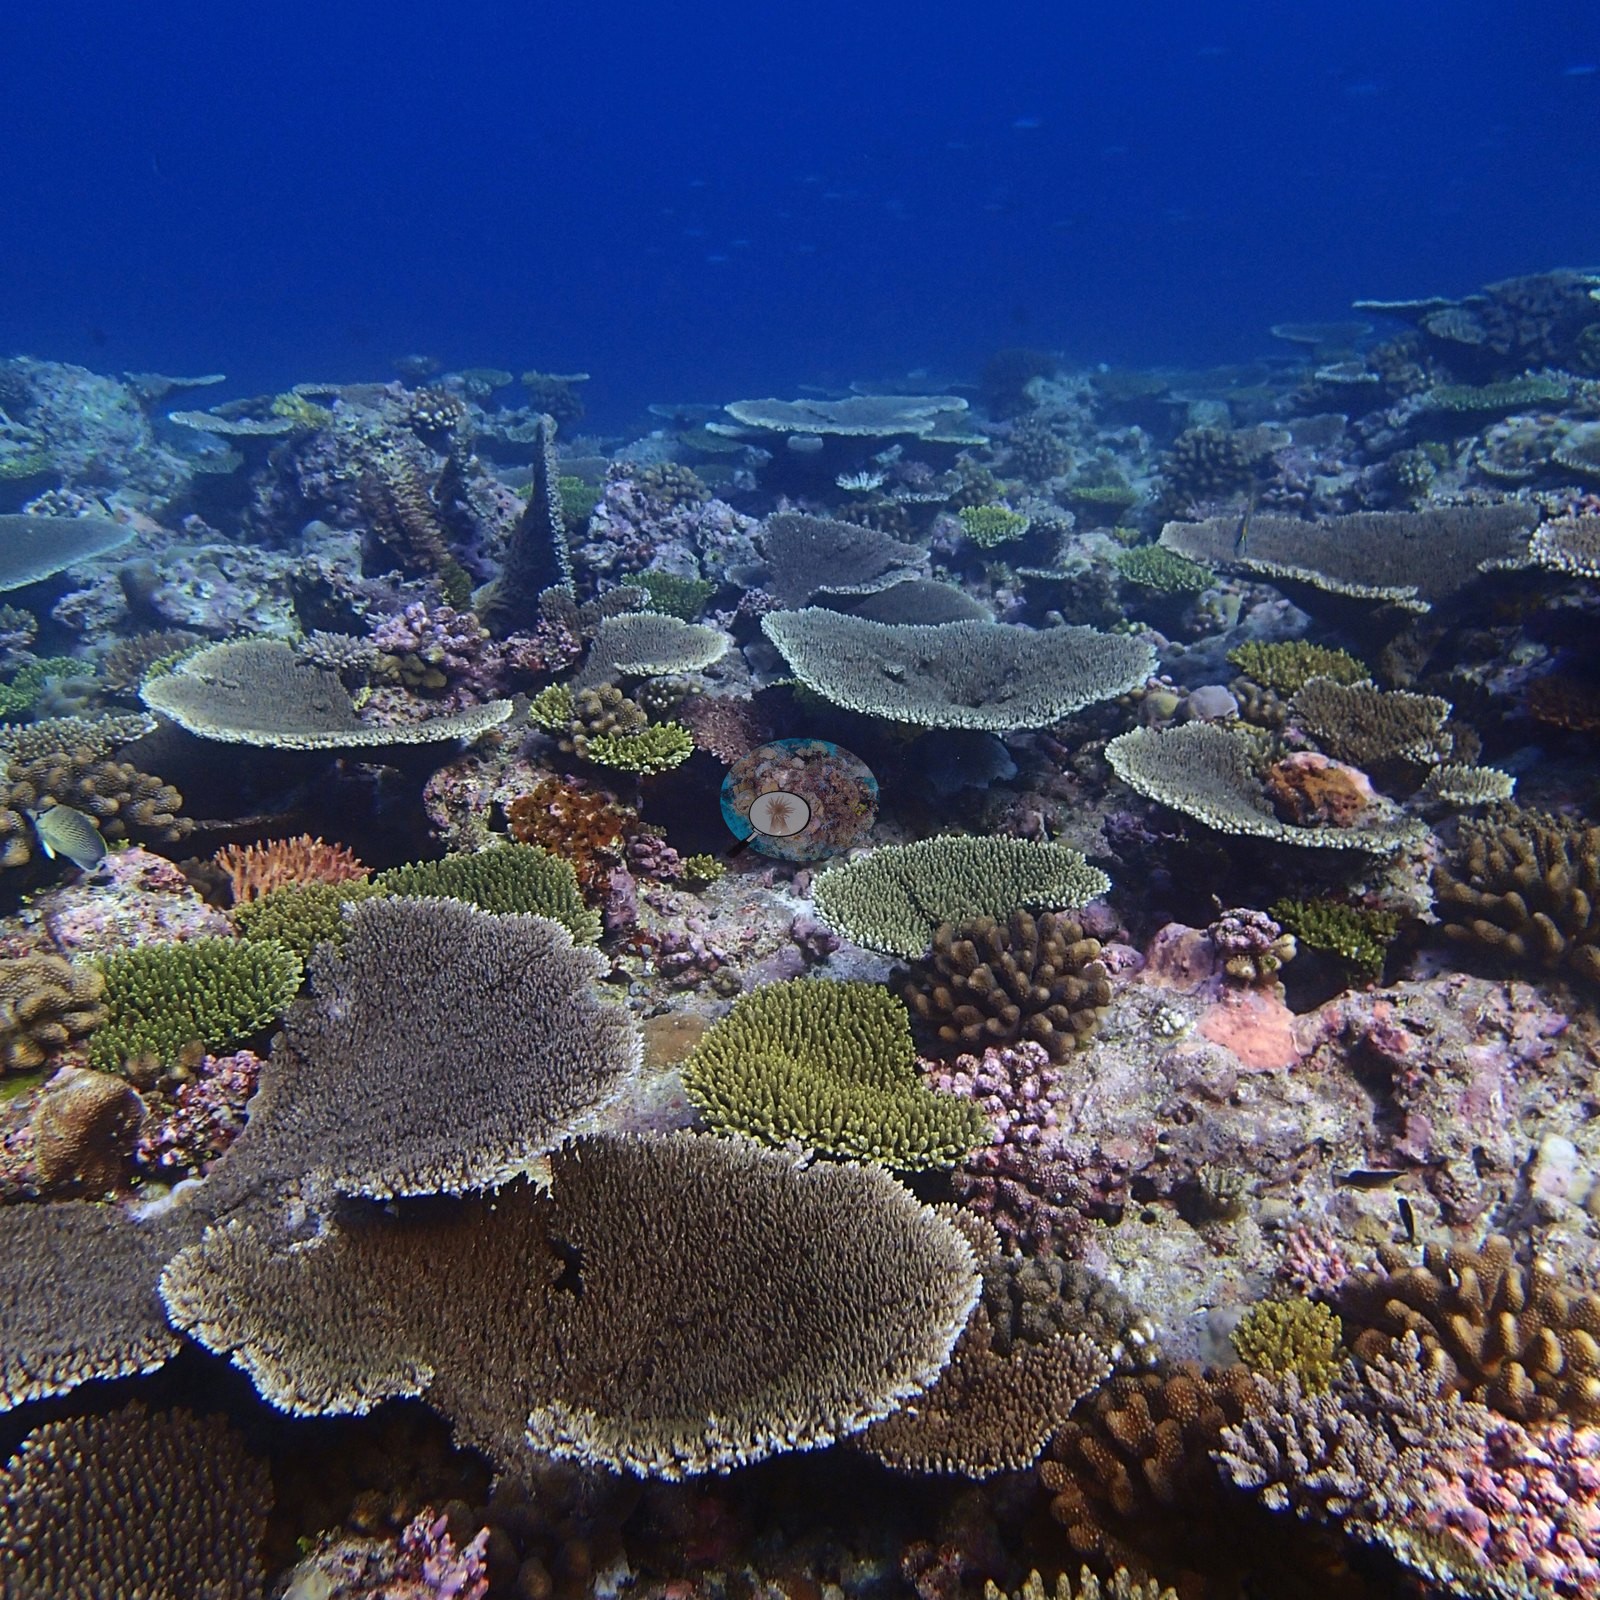
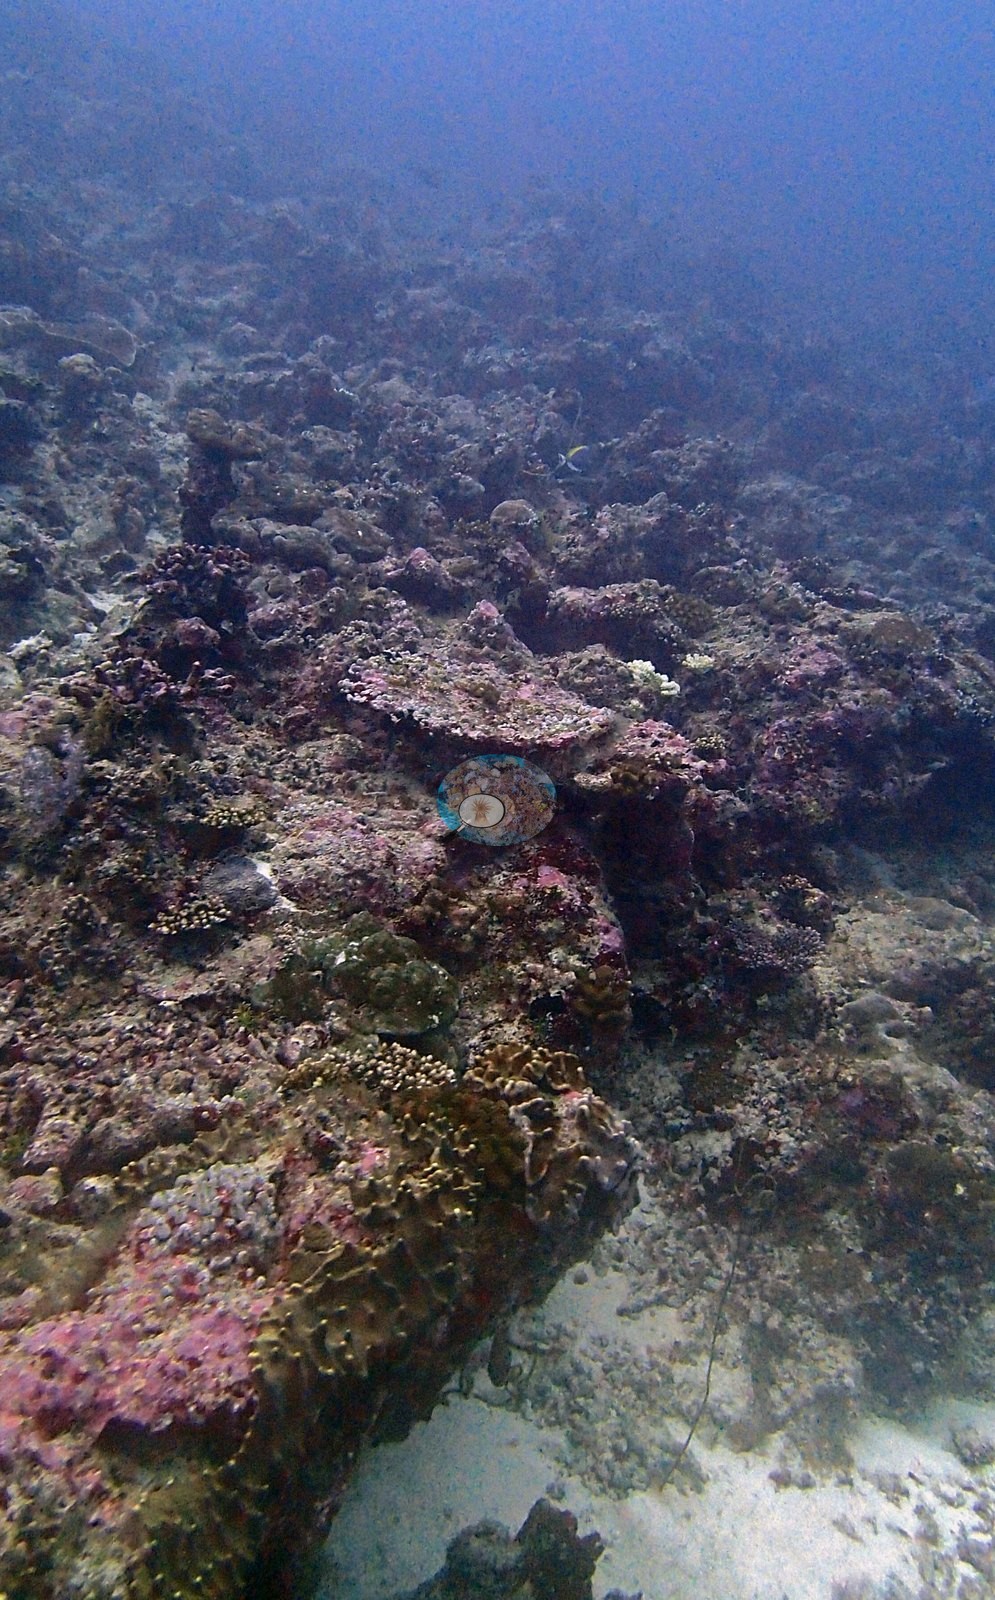
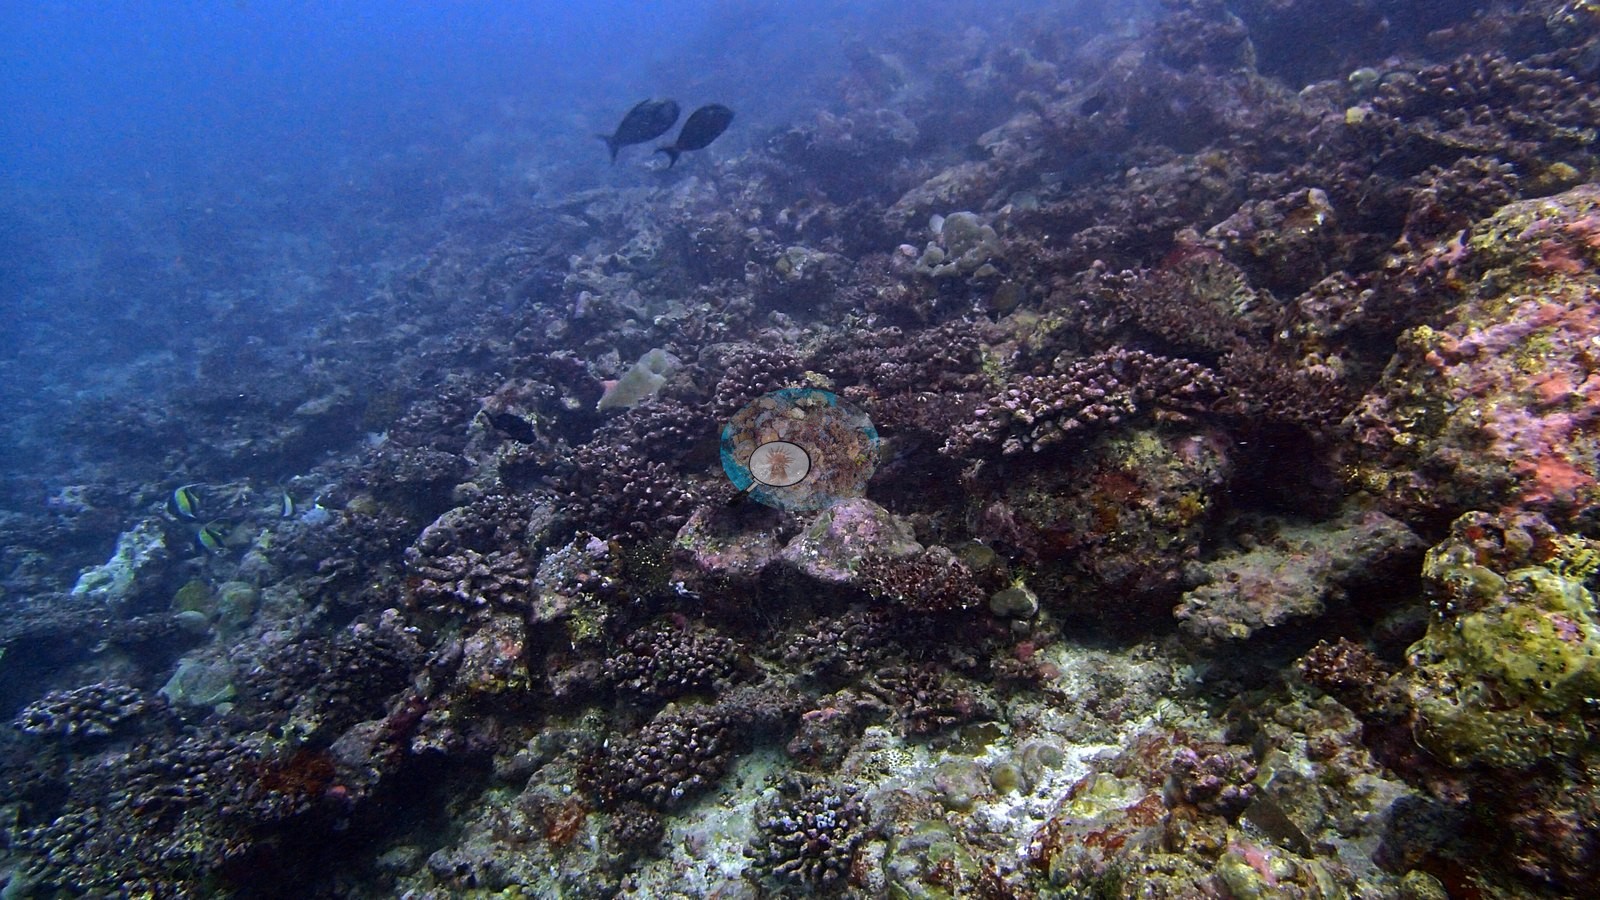
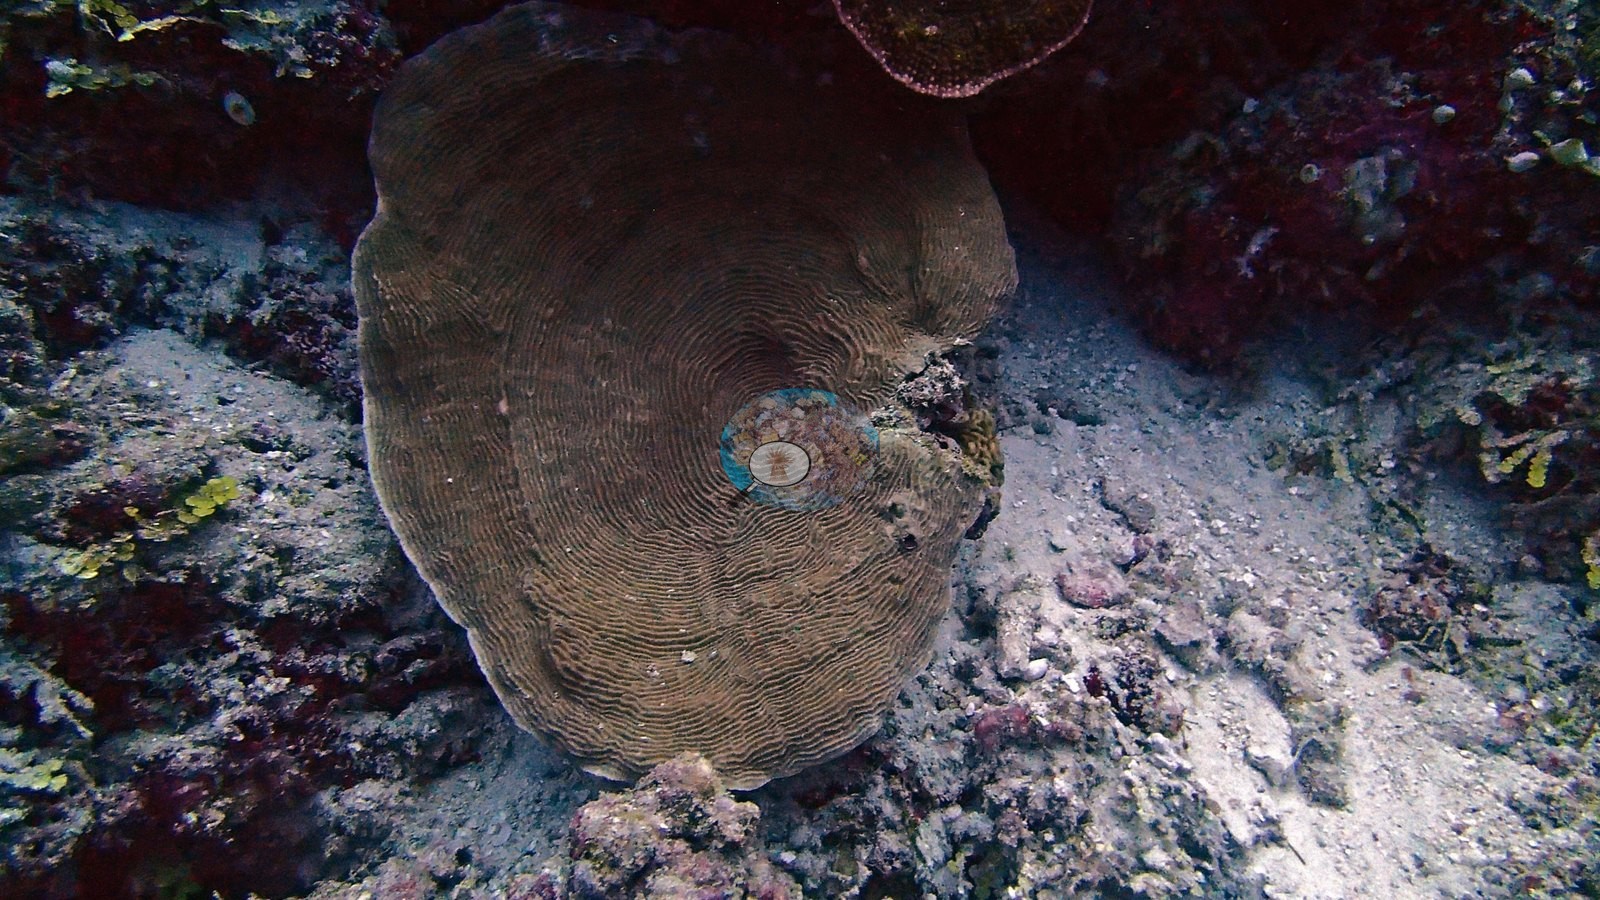
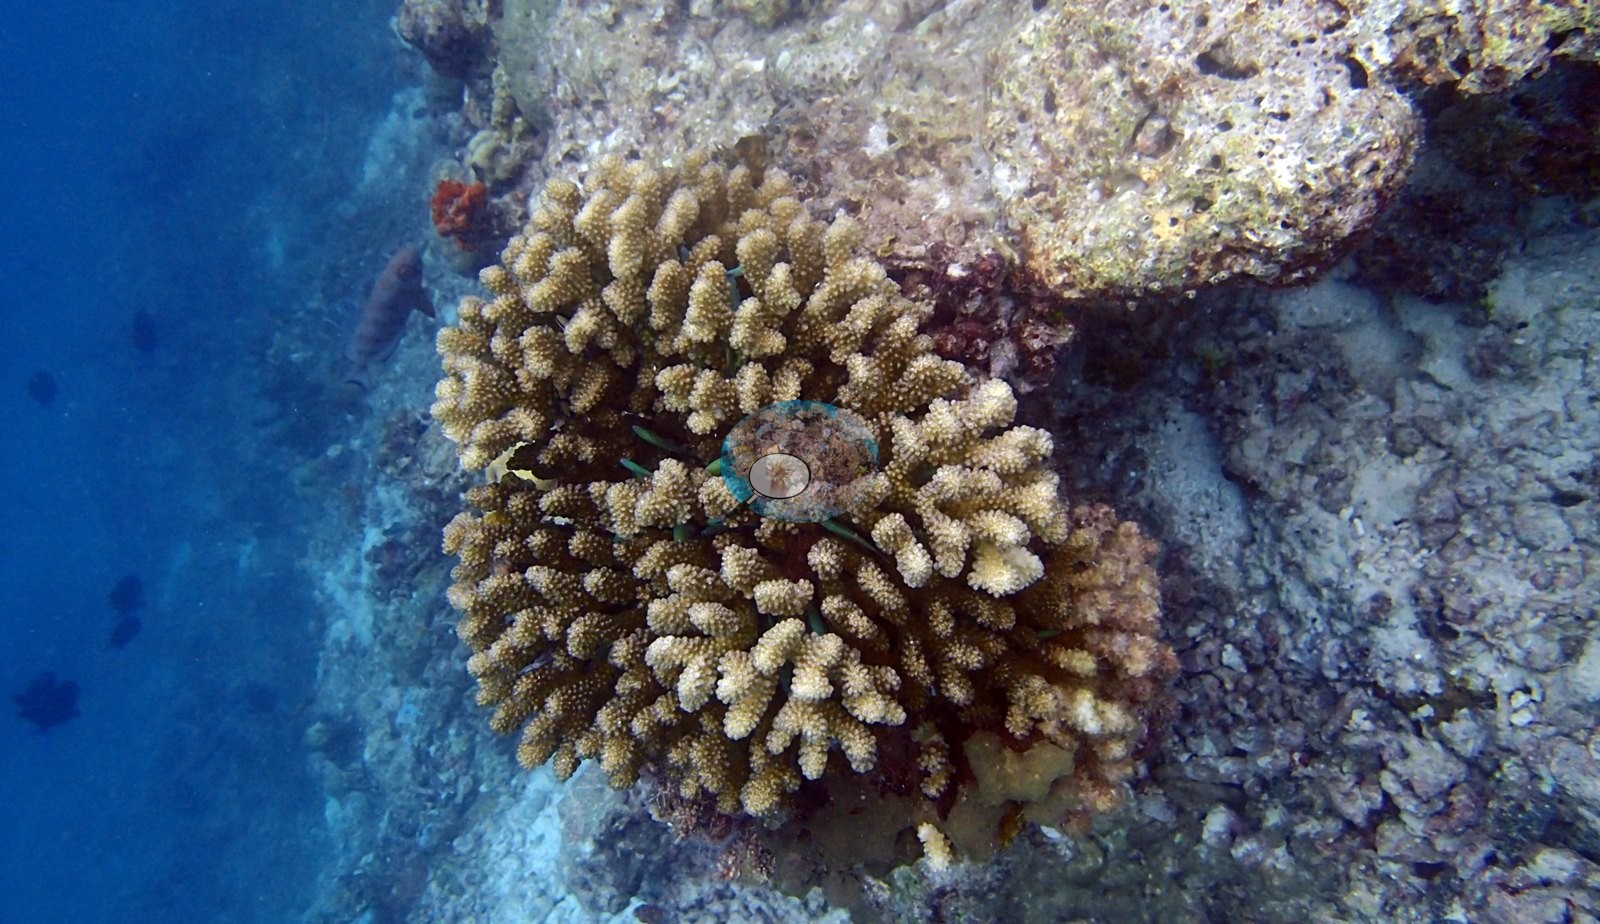
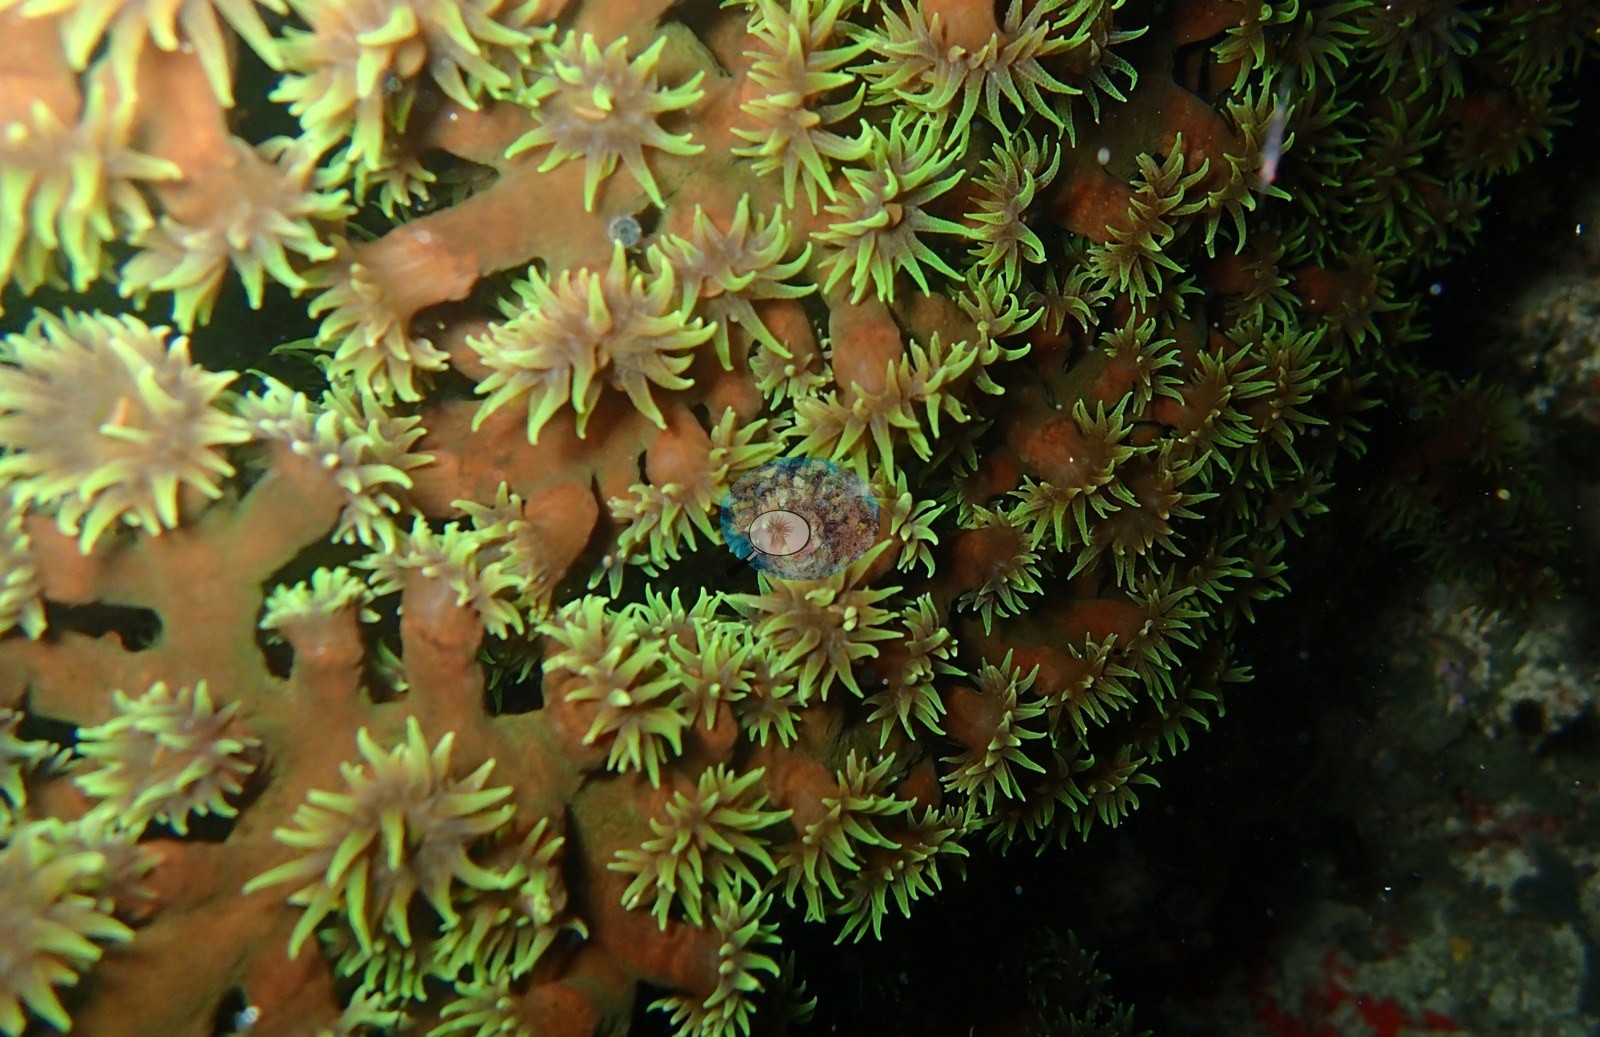
The January 2016 frames show bank reefs, flats, and slopes of cauliflower Pocillopora, staghorn and table Acropora, and massive Porites, with tiered tables at Veli and the Anantara Dhigu house reef. Raaeundi was already a flat of algae-gray staghorn skeletons with living colonies scattered over it. On the liveaboard, Dhega Thila, Hodeli Bodu Giri, and Camel Point carried dense staghorn and table gardens, while Dhigga Thila and Vaadhoo Caves were draped in soft corals. Fish Tank, Fish House, Ghuli Faru, and Moofushi Kandu had little coral. Photo-derived cover indices ran from 8.0% at Fish Tank to 34.7% at Veli. These are computer-vision estimates, and the two methods disagree by as much as 18.9 percentage points at Maafushi.
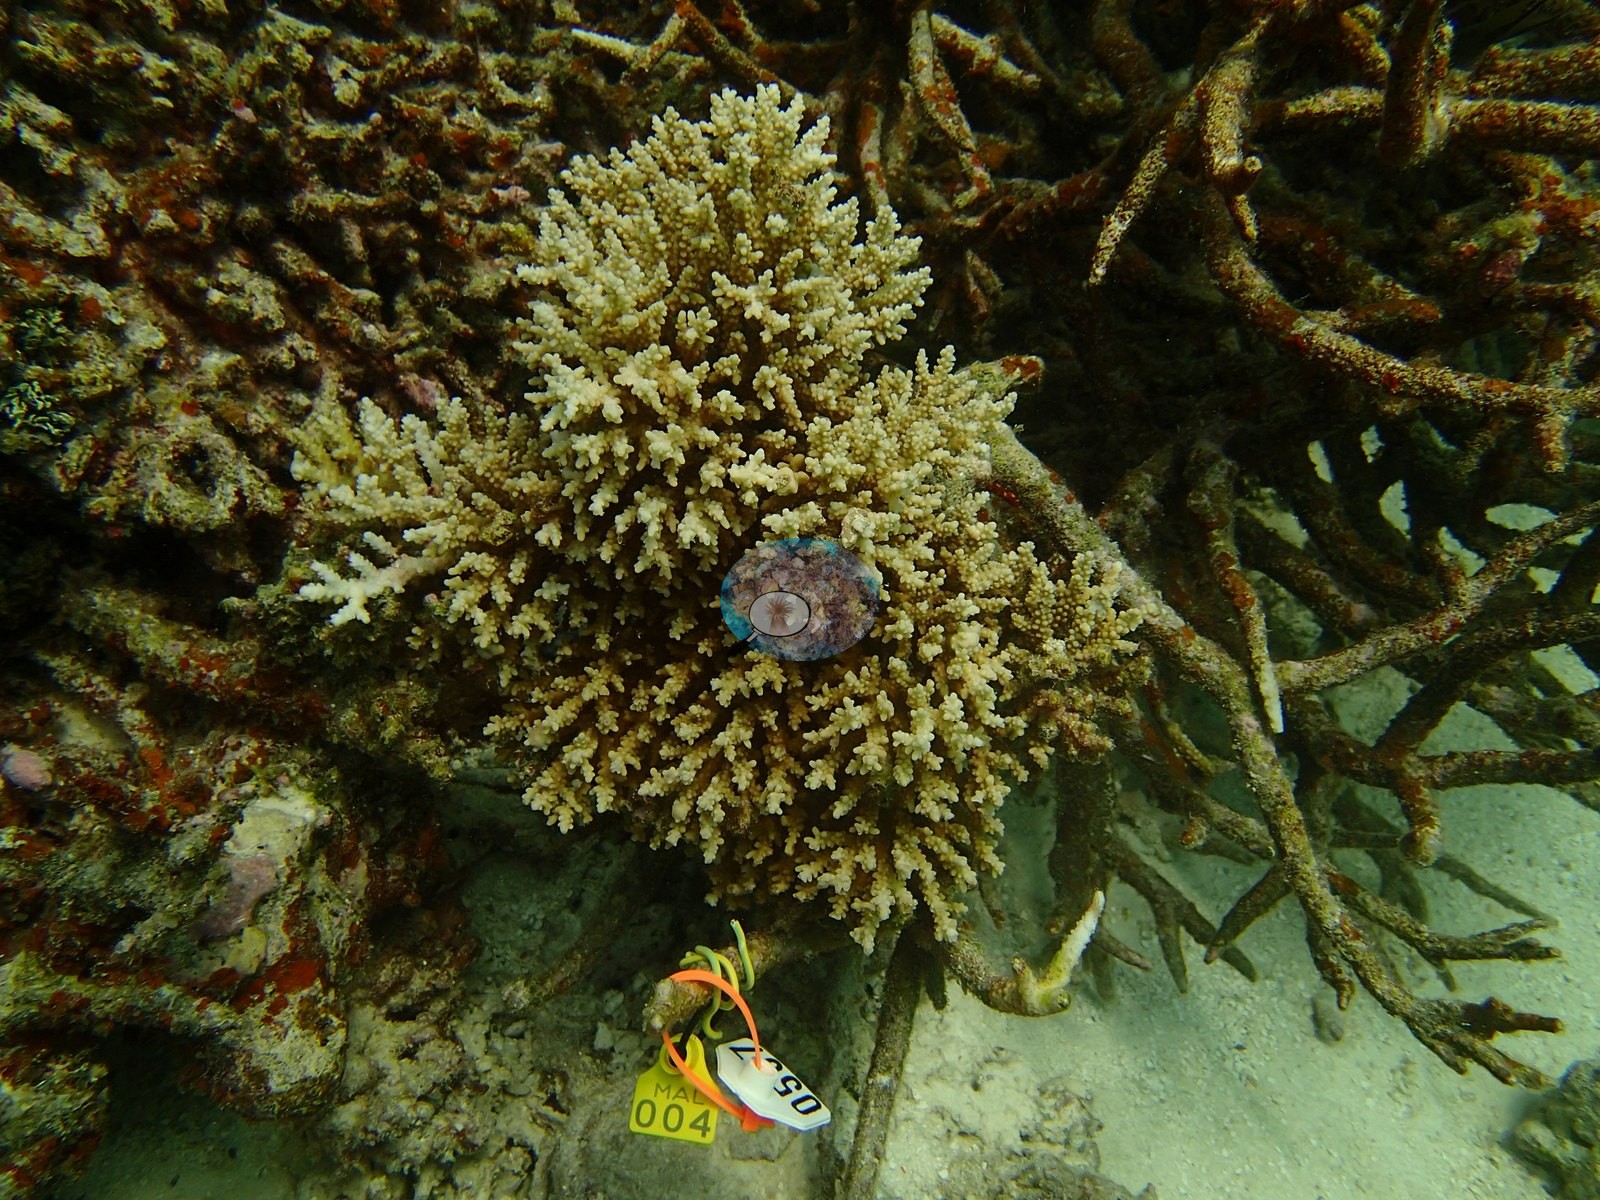
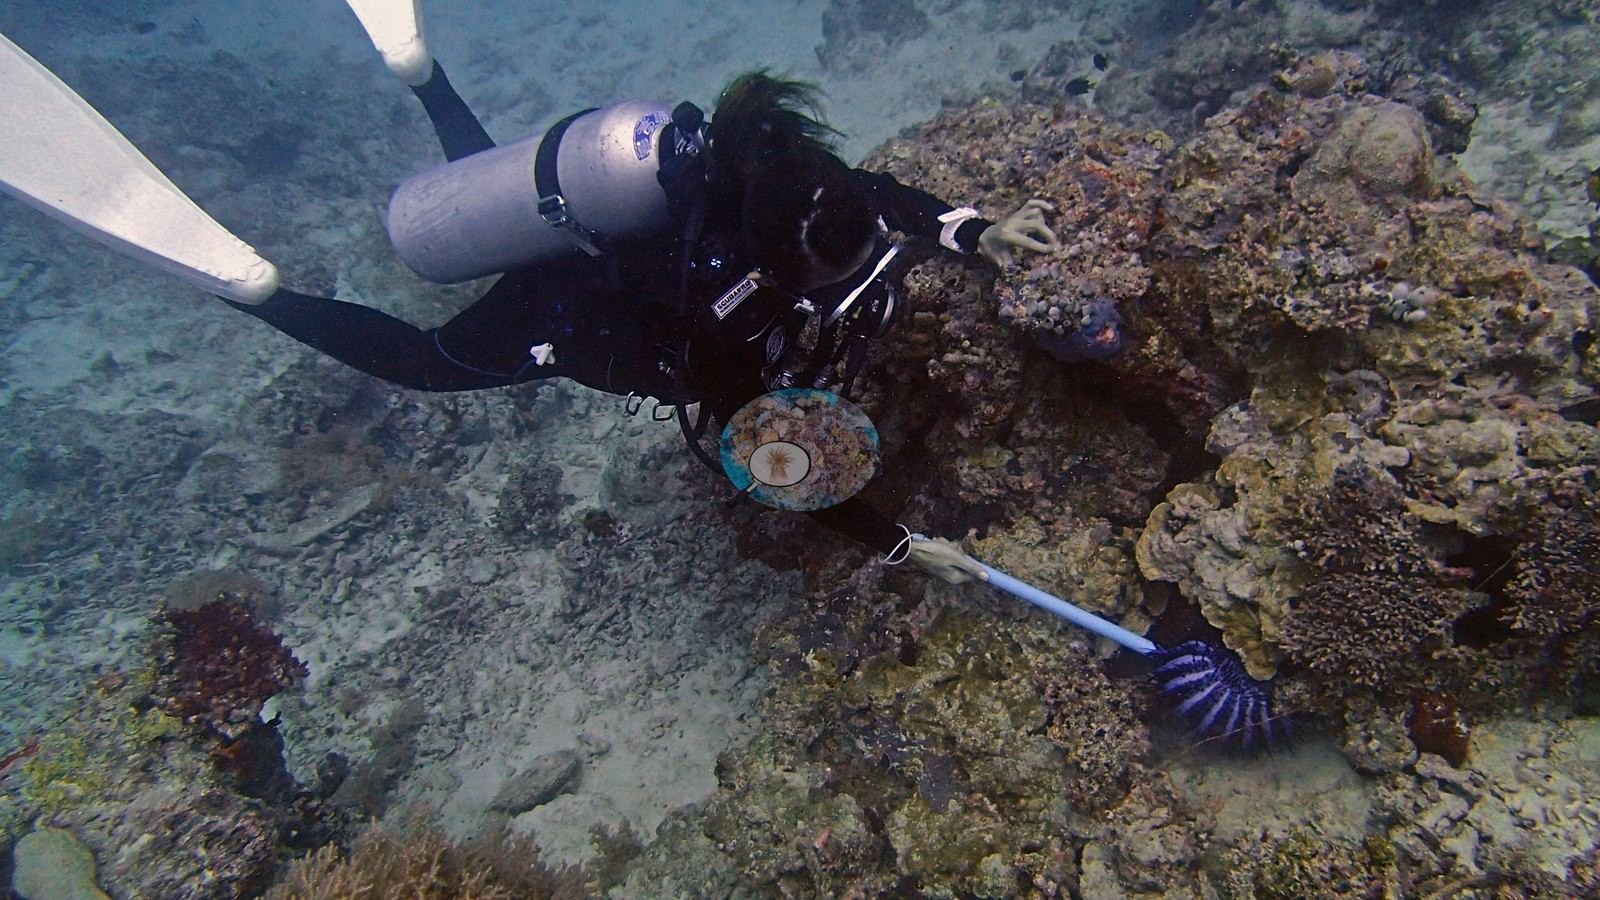
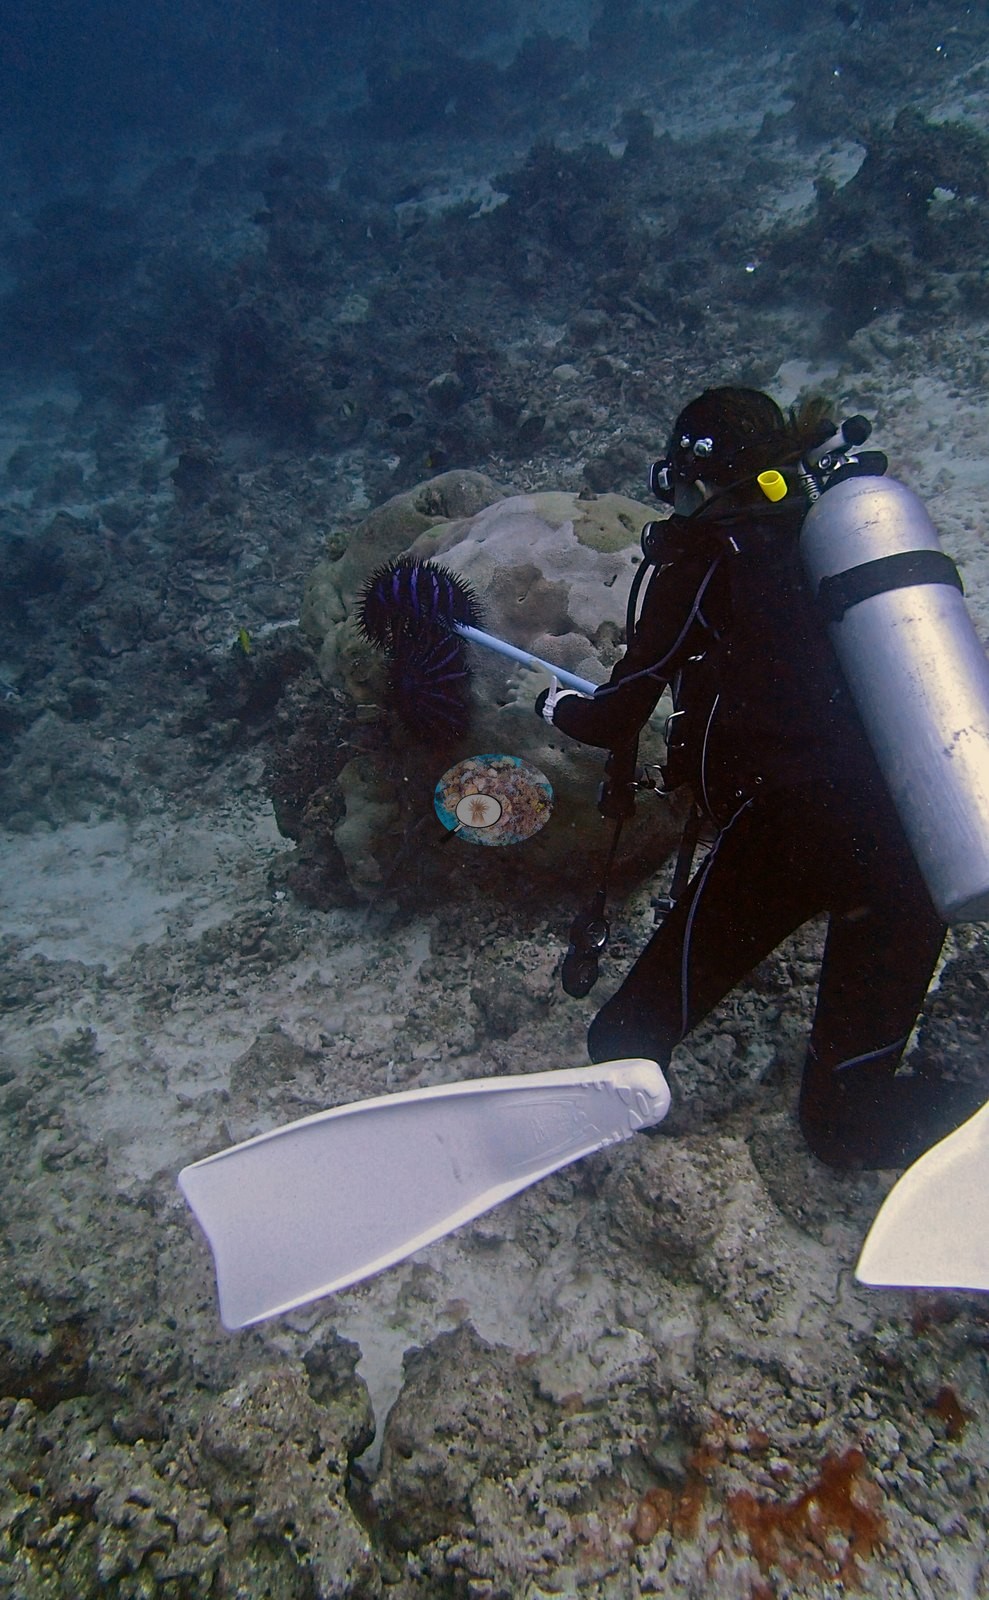
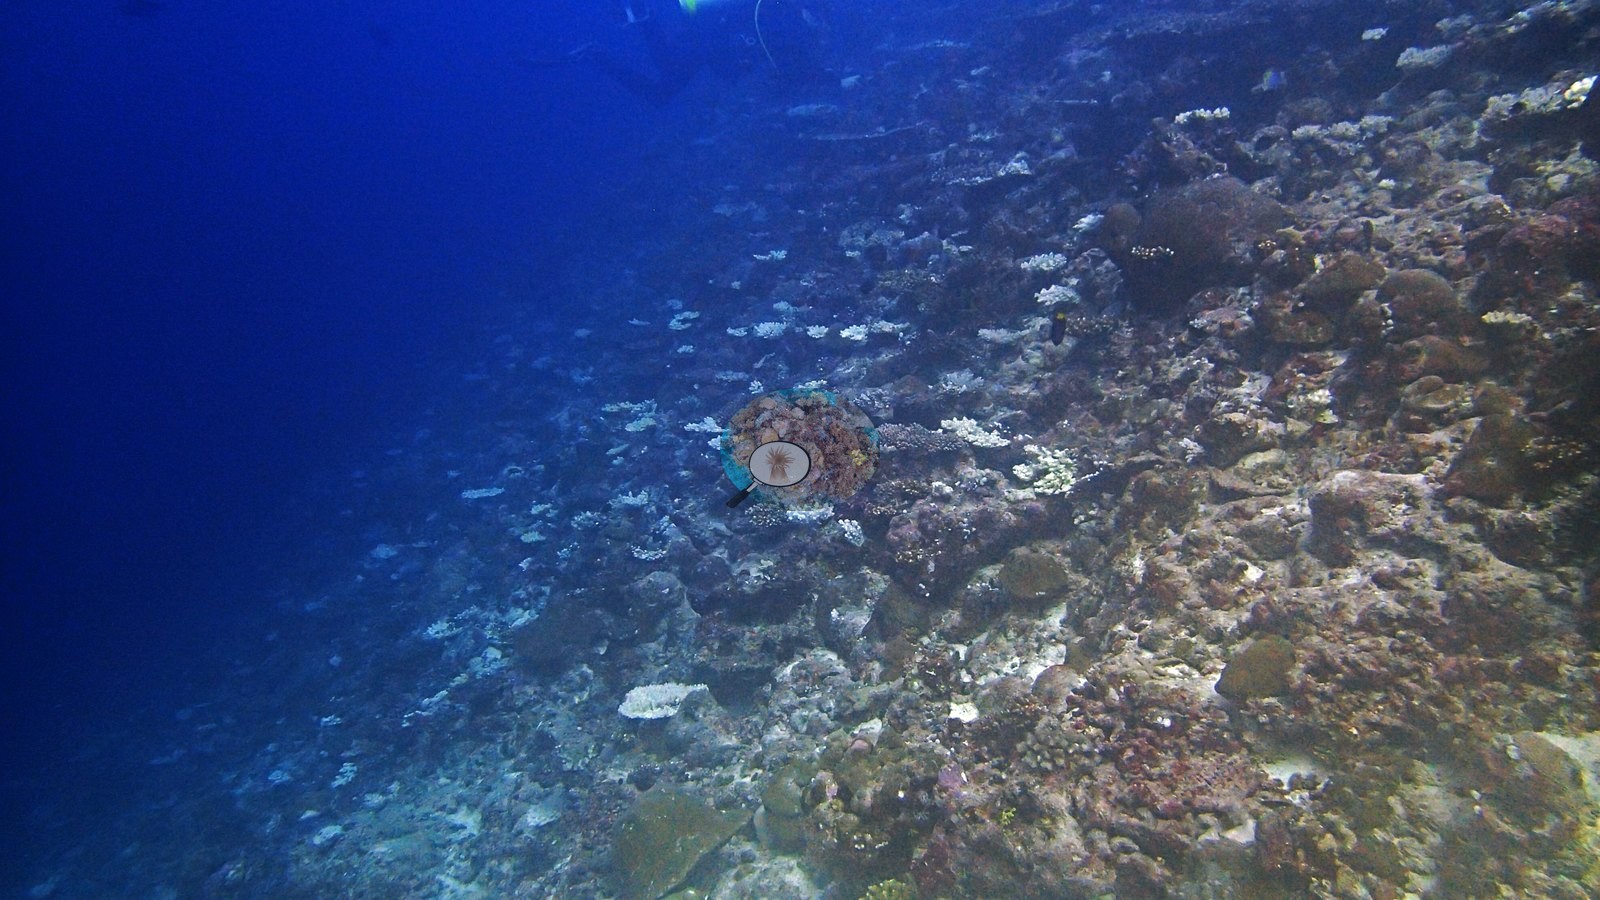
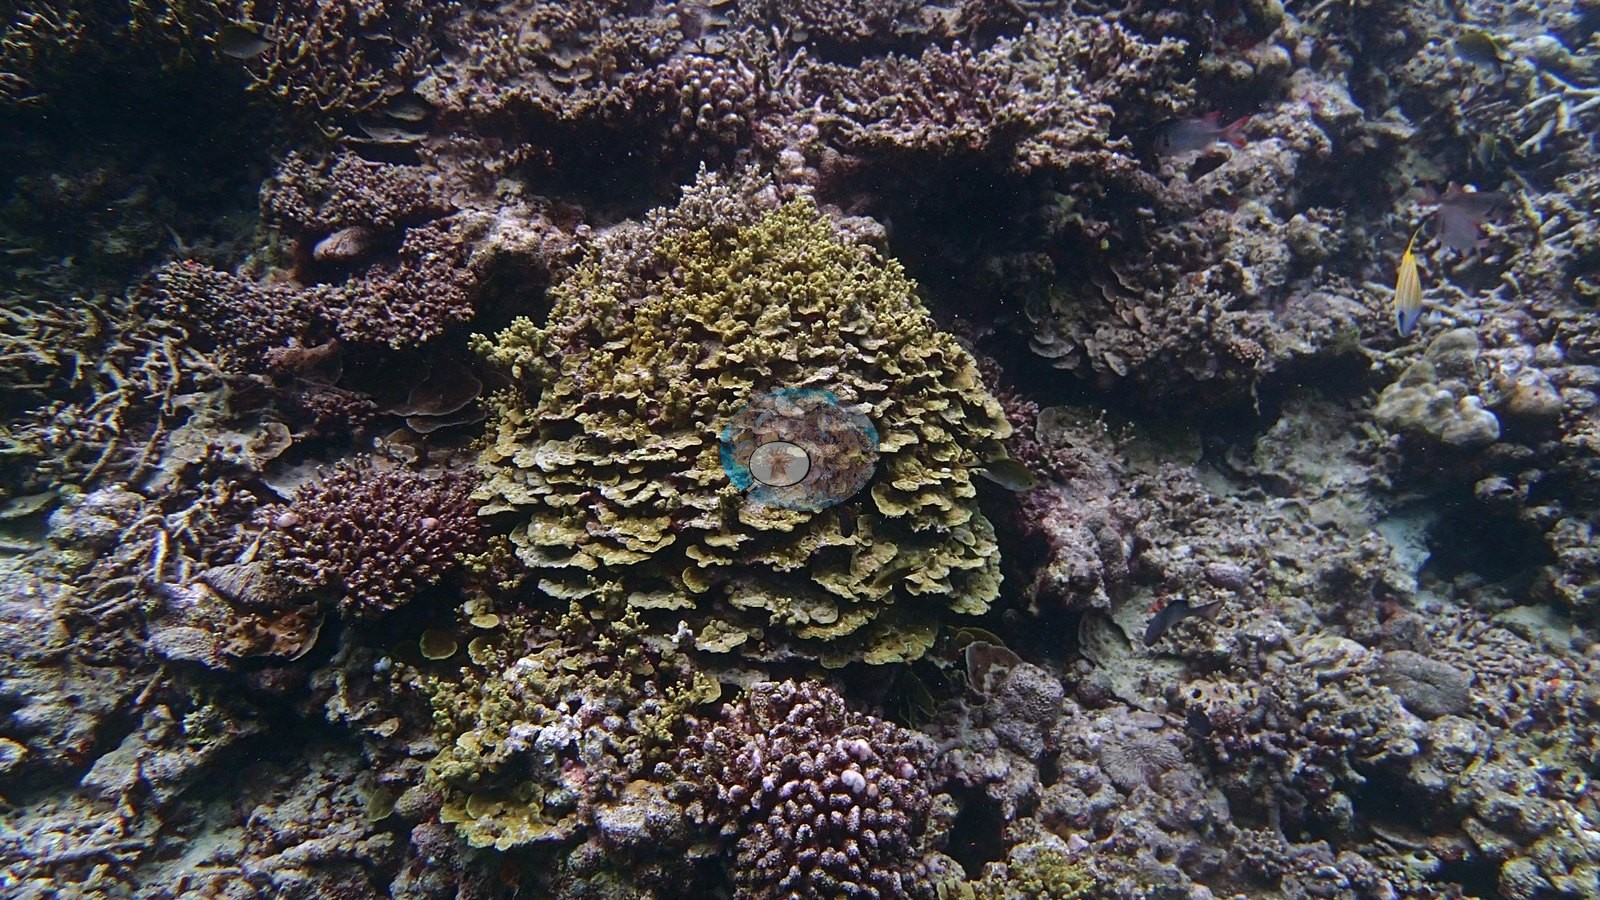
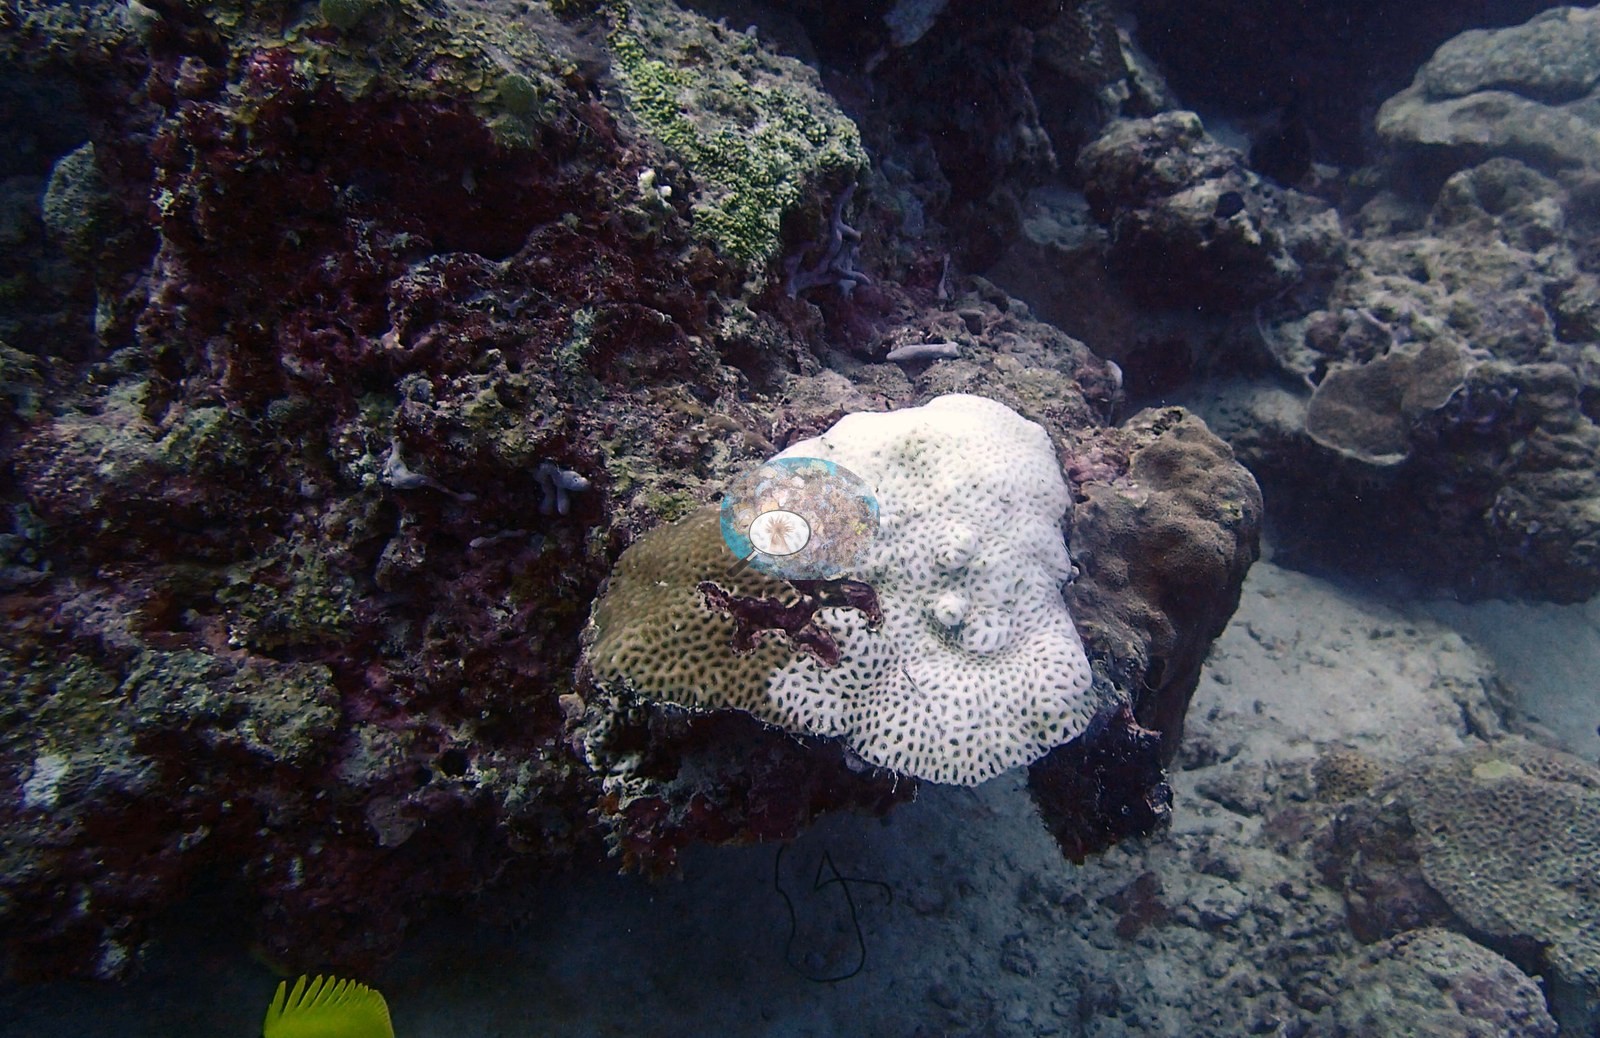
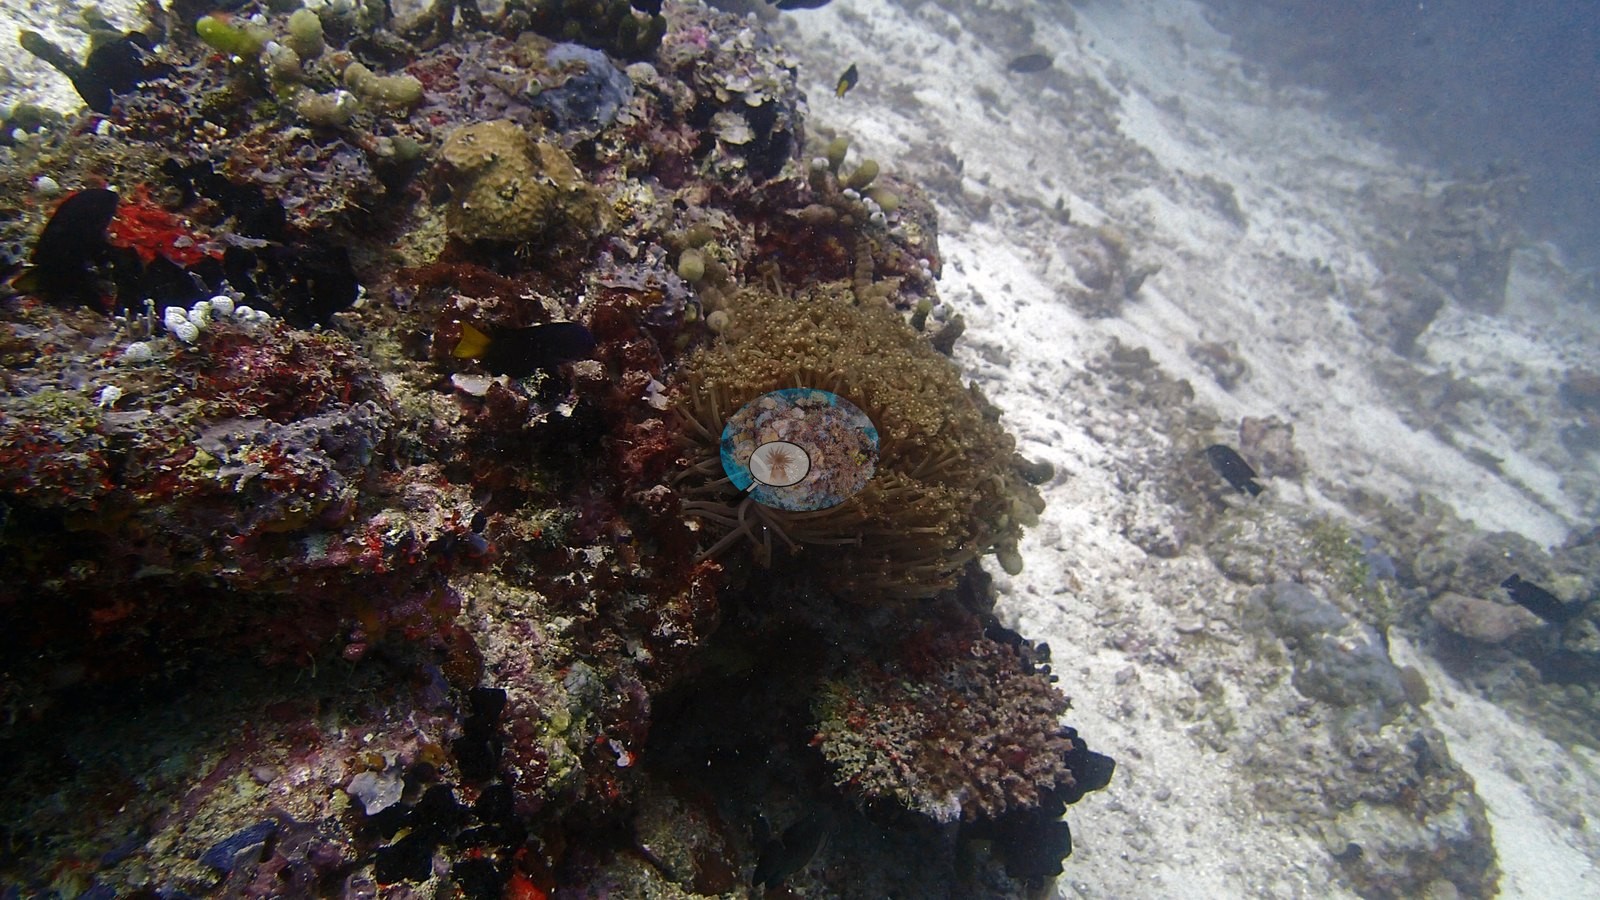
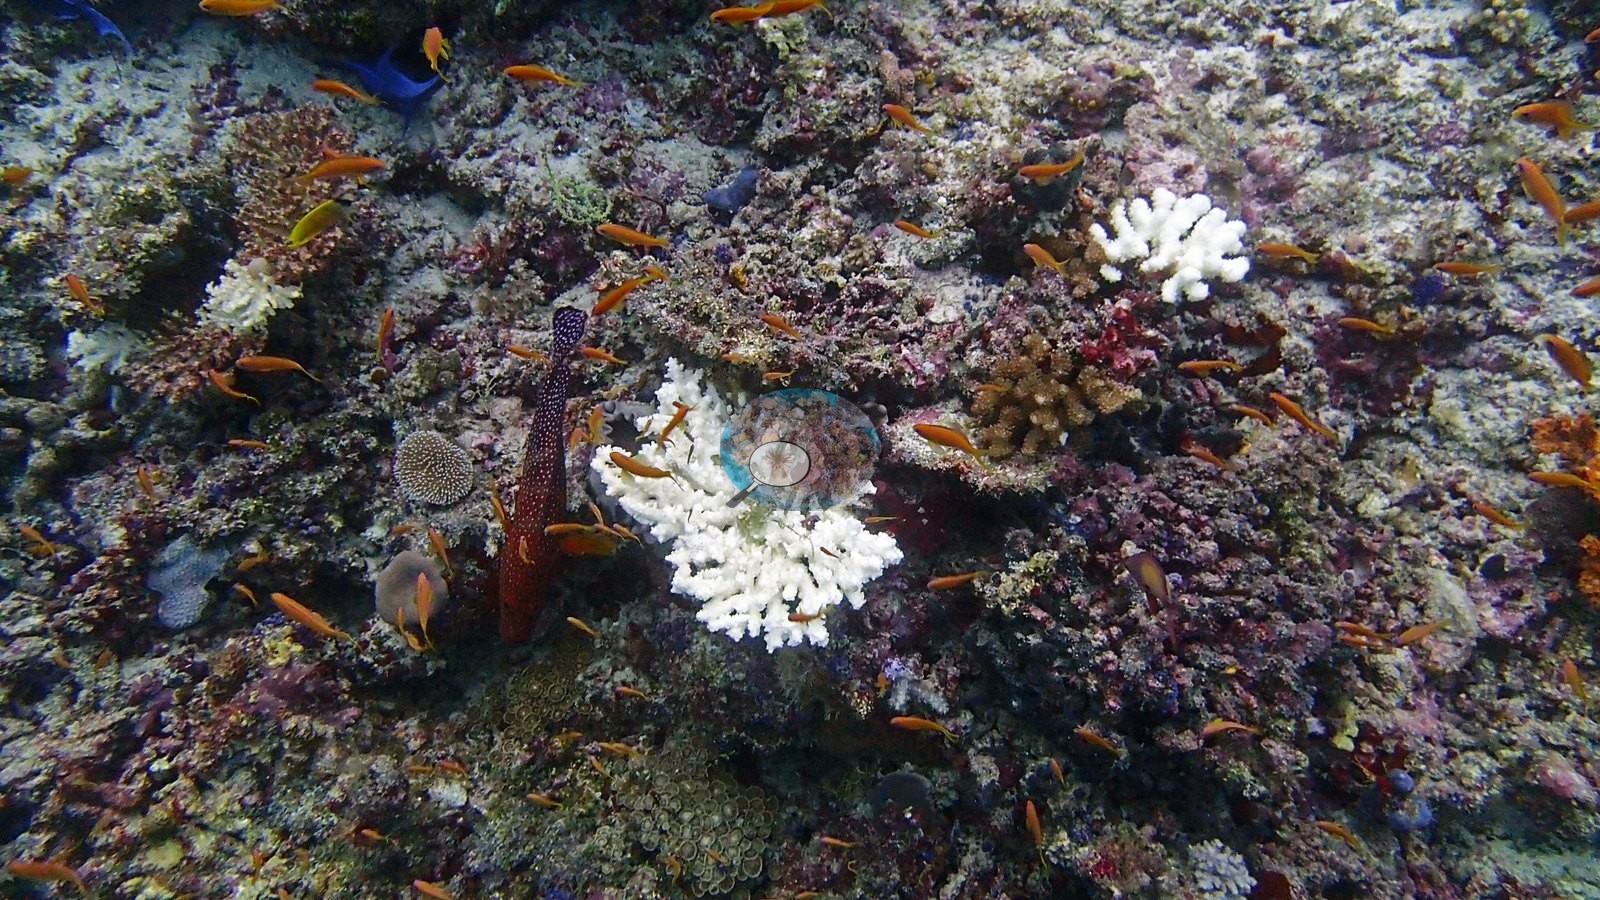
The pins record the 2016 bleaching directly. At the April 2016 resurvey, every recorded colony at Raaeundi was bleached, as were more than nine in ten at Stage, about 95% at Maafushi, and four in five at Small Sand Bank. The sheltered Veli Lagoon reef escaped almost untouched. Tagged colonies at Big Sand Bank were largely dead by May 2017. Later frames show algae-covered table skeletons at Dhigga Thila and Lohosfushi Corner, along with Pocillopora recruiting across rubble at Back Faru and small colonies recolonizing Miyaru Bay. Crown-of-thorns starfish were recorded at ten sites. At Ari Atoll's south tip the photographer labeled it an outbreak, and at Hodeli Bodu Giri the crew removed starfish with a collection stick.
Highlights
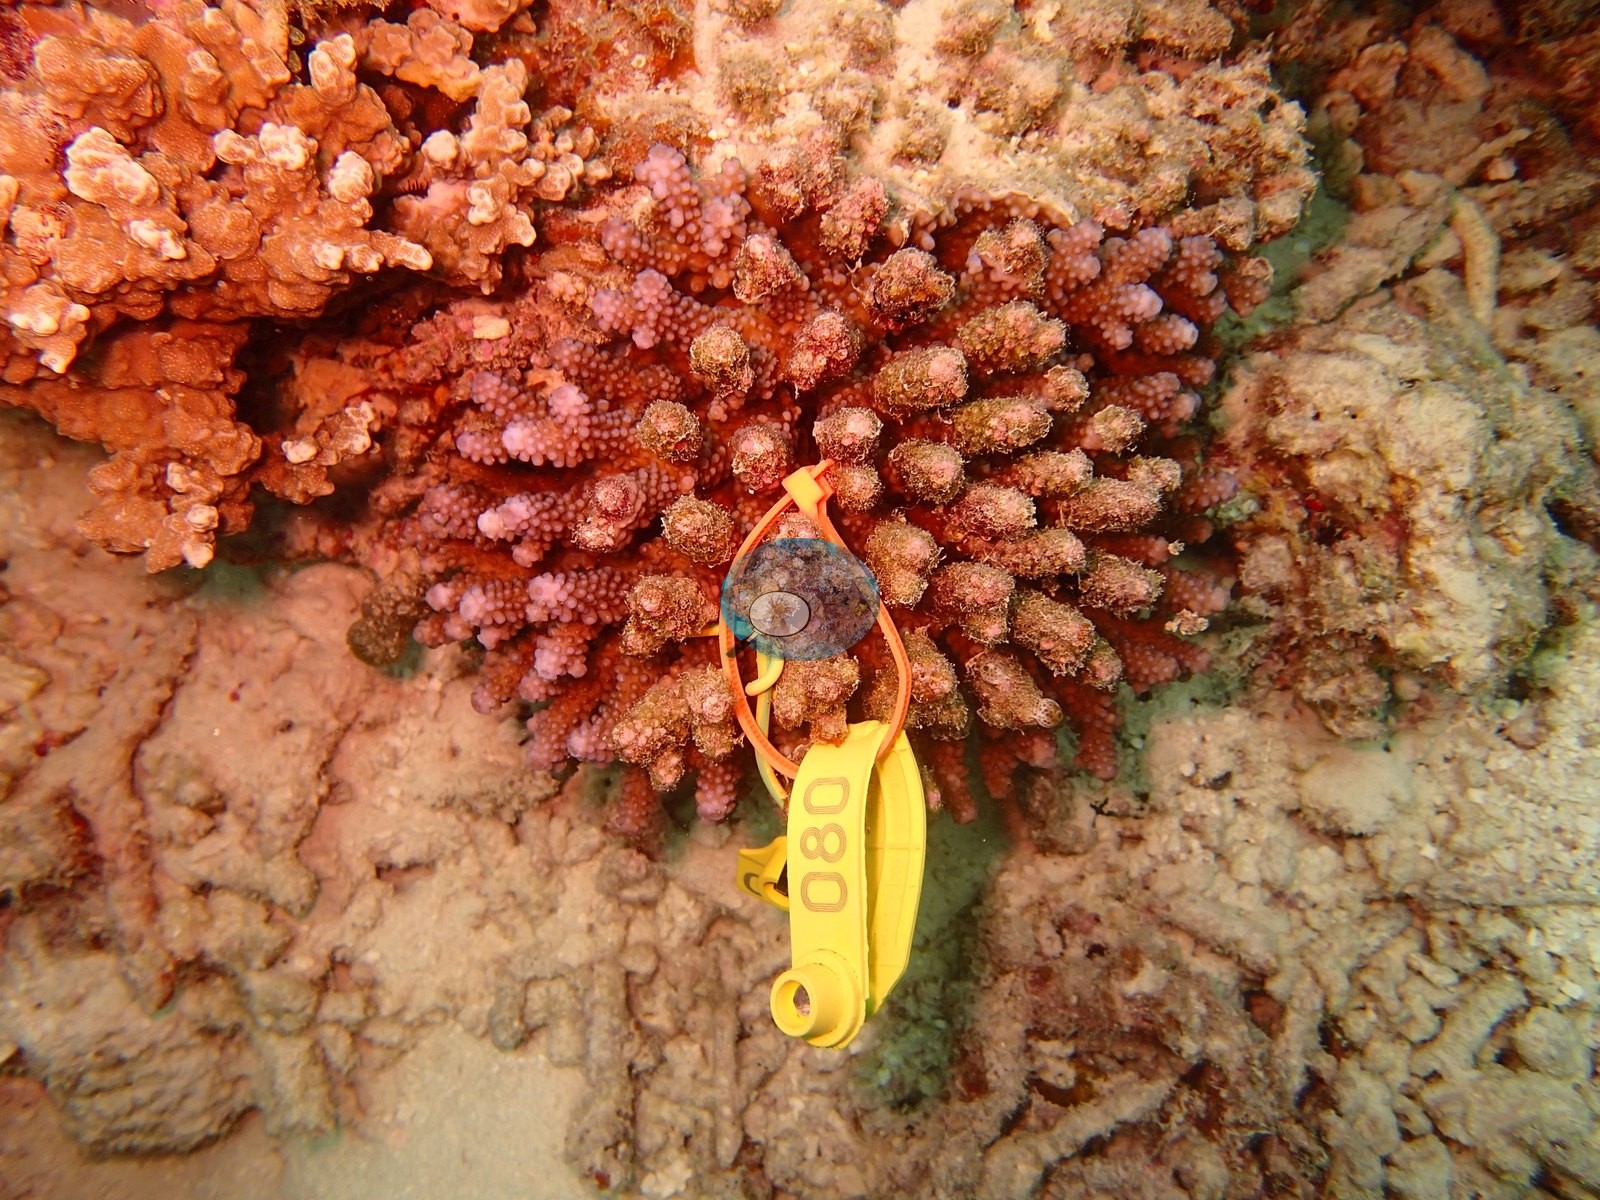
- January 2016 baseline, then April 2016 resurvey: all recorded colonies bleached at Raaeundi Reef, more than nine in ten at Stage, and about 95% at Maafushi.
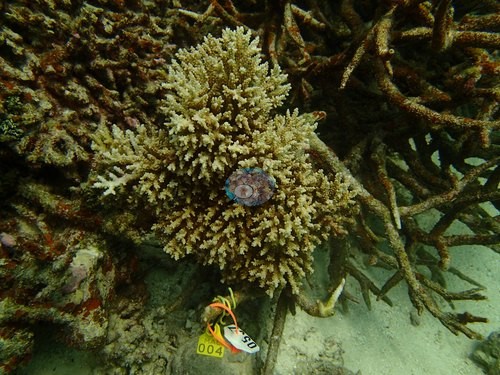 photo: Maldives - Raaeundi Reef
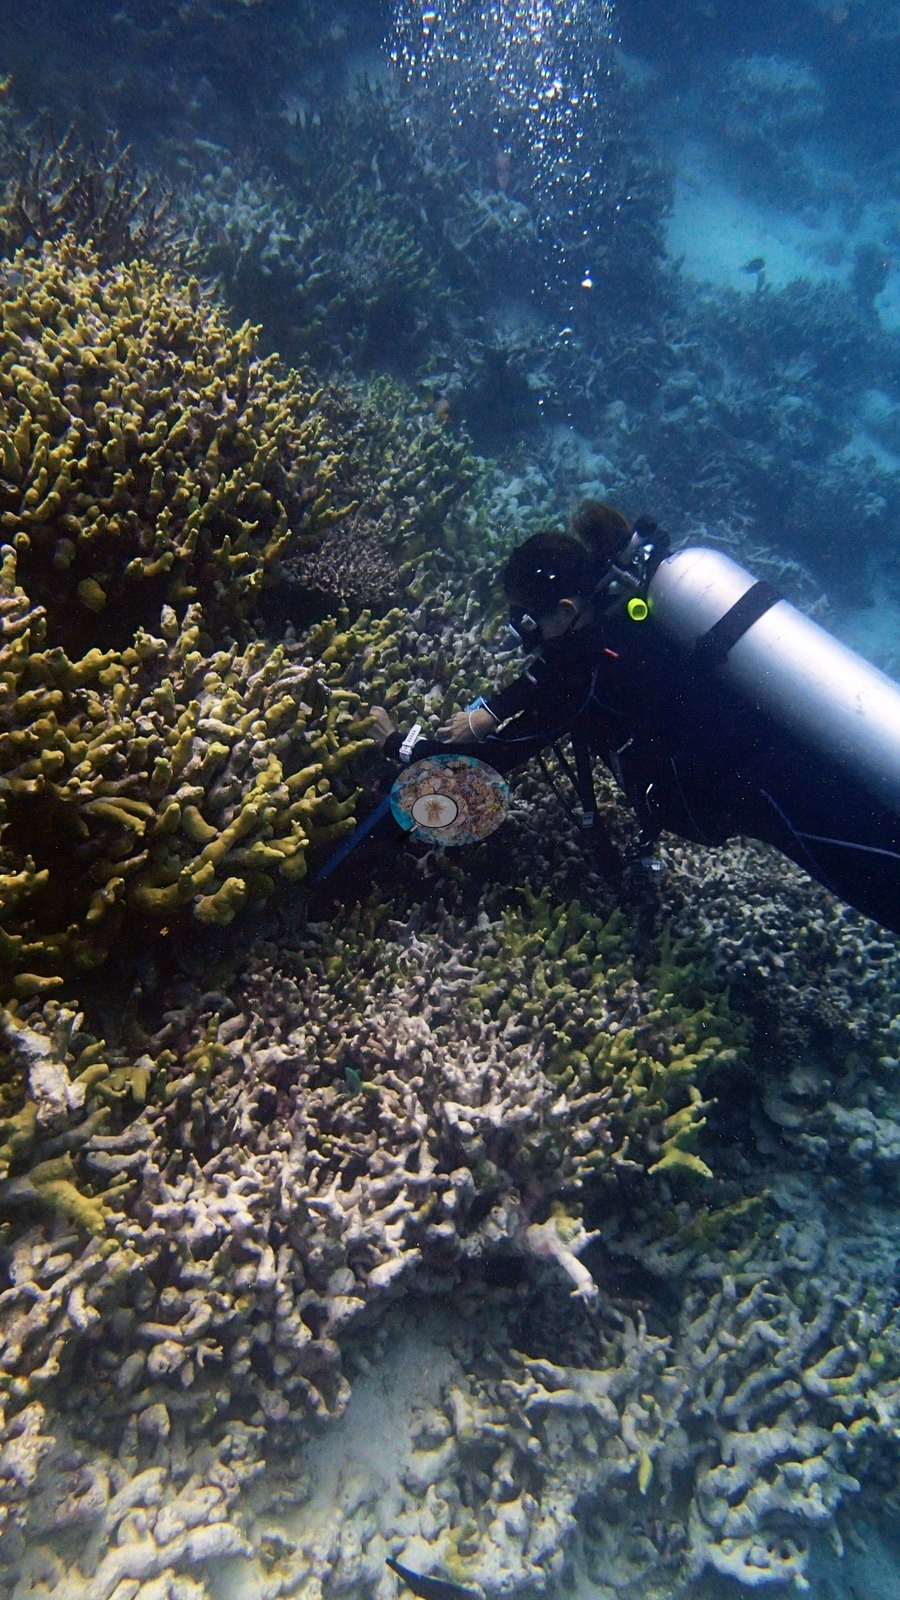
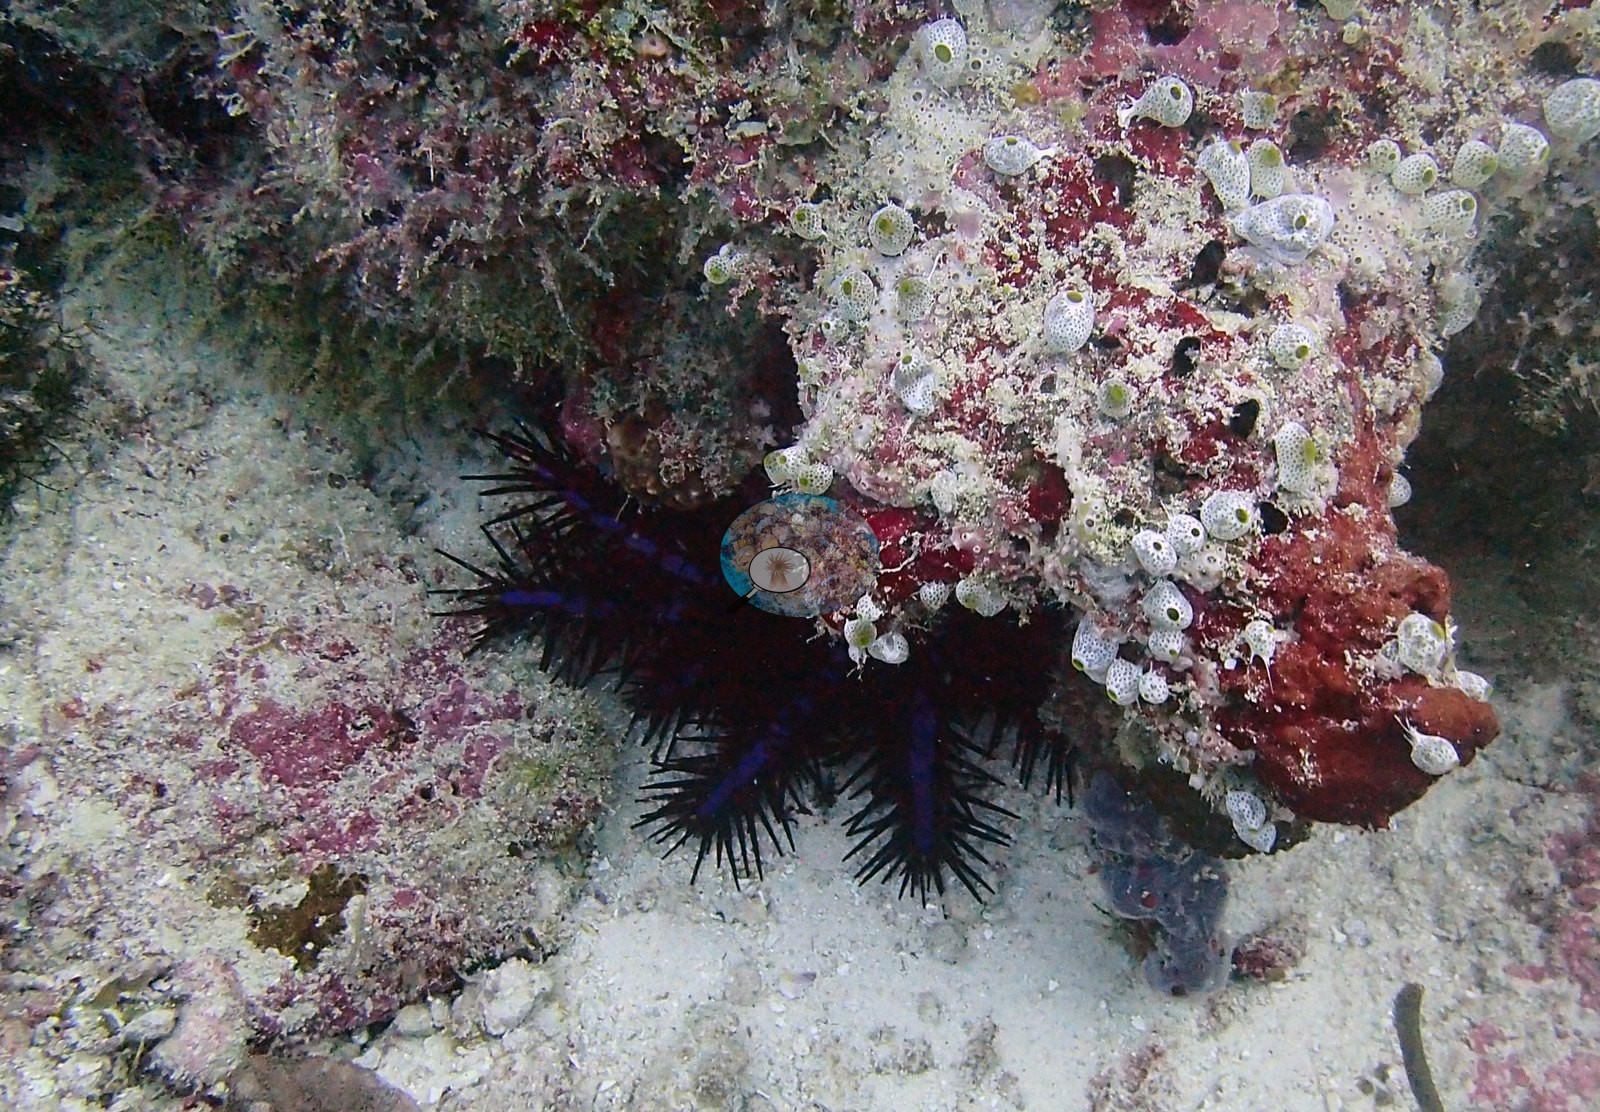
 - Crown-of-thorns starfish at ten sites, with an outbreak label at Ari Atoll's south tip and manual removal at Hodeli Bodu Giri.
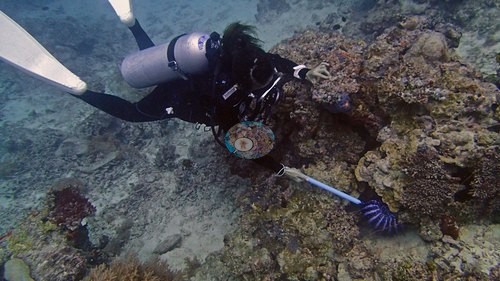 photo: Maldives - Hodeli Bodu Giri
 - Dense staghorn and table gardens at Dhega Thila, Hodeli Bodu Giri, and Camel Point; soft-coral-draped walls at Dhigga Thila and Vaadhoo Caves.
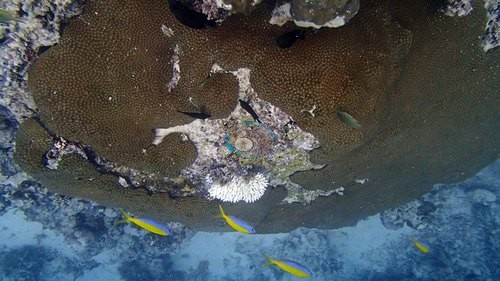 photo: Maldives - Hodeli Bodu Giri
 - Lankan Faru is a manta cleaning station; a whale shark was photographed at Ari Atoll's south tip.
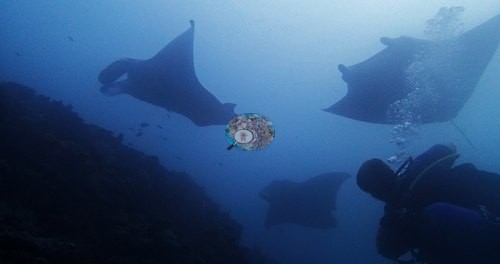 photo: Maldives - Lankan Faru
 - Signs of recovery: Pocillopora recruiting at Back Faru and young table corals at Lohosfushi Corner.
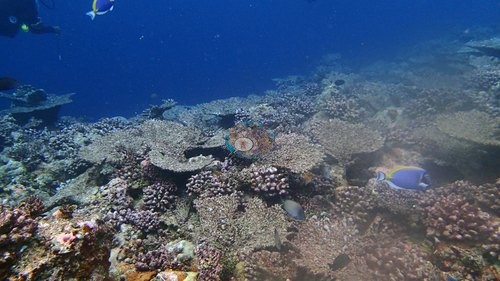 photo: Maldives - Lohosfushi Corner
މިއީ އިނގިރޭސި ބަހުން ލިޔެފައިވާ ޚުލާޞާގެ މެޝިން ތަރުޖަމާއެކެވެ. ރަސްމީ ނުސްހާއަކީ އިނގިރޭސި ނުސްހާއެވެ. AI translation of this summary, low confidence and not yet reviewed by a native speaker; the English is authoritative.
Regional setting
މެދު އަތޮޅުތައް ހުރީ ދިވެހިރާއްޖޭގެ ރޮނގުގެ މެދުތެރޭގައެވެ. މި ރޮނގަކީ Réunion ހޮޓްސްޕޮޓްގެ ވޯލްކޭނިކް ފާހަގައެއް ކަމުގައިވާ Chagos–Laccadive Ridge ގެ މަތީގައި، އުތުރުން ދެކުނަށް ގާތްގަނޑަކަށް 800 km ދިގުކޮށް ހުރި 22 އަތޮޅެވެ (Spalding et al. 2001). އެޓްލަސްގައި މި ސަރަހައްދުގެ މައްޗަށް ނެގި ފޮޓޯއެއް ބޭނުންކޮށްގެން އަތޮޅުތައް ހުރި އެއްކޮޅަށް ދާ ދެ ރޮނގު ދައްކާފައިވެއެވެ. އަދި ދެކުނު މާލެ (South Male) އާ ދެކުނުން ހުރި ފެލިދޫ (Felidu) އާއި ވަތަރު (Wataru) އަތޮޅު ބޭނުންކޮށްގެން، ކުދި ފަރުތަކާއި ފަރޯ (faro) އިން ފުރިފައިވާ، ދިވެހިރާއްޖޭގެ ޢާންމު ވިލެއް ދައްކާފައިވެއެވެ. ފަރޯއަކީ ކުދި އަތޮޅުތަކާ ވައްތަރު، ވަށްކޮށް ހުންނަ ފަރުތަކެއް ކަމަށާއި، މިފަދަ ފަރުތައް މި ޤައުމުން ބޭރުގައި ފެންނަނީ މަދުންނެވެ. އަތޮޅުގެ ބޭރު ގޮށަކީ ފުން ކަނޑުތަކުން ކެނޑިފައިވާ، ރަށްރަށާއި ފިނޮޅުތައް މަތީގައި ހުރި، ފުޅާ ފަރުގެ ފަޅުތަކެވެ. ވިލުތަކުގެ ފުންމިނަކީ 15 އިން 55 m އާ ހަމައަށެވެ. 1995 ގައި ހިމާޔަތްކުރެވިފައިވާ ޑައިވް ސައިޓްތަކުގެ ގޮތުގައި ފުރަތަމަ ހިމާޔަތްކުރެވުނު ސަރަހައްދުތައް ގެޒެޓްކުރިއިރު، އޭގެ ގިނަ ބައެއް ހުރީ އުތުރު މާލެ (North Male)، ދެކުނު މާލެ، އަދި އަރި (Ari) އަތޮޅުގައެވެ. އޭގެ ތެރޭގައި Banana Reef، HP Reef، Fish Head، އަދި Maaya Thila ހިމެނެއެވެ؛ 1999 ގައި އިތުރު ސައިޓްތައް އިތުރުކުރެވުނެވެ. 1998 ގެ ކުރިން، އަތޮޅުގެ ގޮށްތަކުގައާއި، ފަރޯތަކުގައާއި، ވިލުގެ ނޮލްތަކުގައި ހިރިގާ ނިވާކުރާ މިންވަރު (coral cover)، މަދުވެގެން 20 m ފުނާ ހަމައަށް 60% އިން މަތިވެފައި ވިއެވެ. ނަމަވެސް 1998 ގެ ހިރިގާ ހުދުވުމަކީ ރެކޯޑްކުރެވުނު އެންމެ ނުބައި ހާދިސާތަކުގެ ތެރެއިން އެއް ހާދިސާއެވެ. އޭގެ ސަބަބުން ބައެއް ސަރަހައްދުތަކުގައި ފަރުބިނާކުރާ (hermatypic) ހިރިގާގެ 90% އާ ހަމައަށް މަރުވިއެވެ. ޢިމާރާތްކުރުމުގެ މާއްދާއަށް ހިރިގާ ނެގުން، 1990 ގެ އަހަރުތަކުގެ ފެށުމުގައި އަހަރަކު 200,000 އިން 1 މިލިއަން m³ އާ ހަމައަށް ކަމަށް ލަފާކުރެވުނު ނަމަވެސް، ފަހުން ހަމައެކަނި ކަނޑައަޅާފައިވާ މަދު ފަރުތަކަކަށް ހަނިކުރެވުނެވެ. Spalding et al. (2001) ލަފާކުރާ ގޮތުގައި މުޅި ދިވެހިރާއްޖޭގައި ގާތްގަނޑަކަށް 8,920 km² ގެ ފަރު ހުރެއެވެ. Souter et al. (2021) ދިވެހިރާއްޖޭގެ އިކޯރީޖަނަށް 6,372 km² ދެއެވެ.
2001 ގެ ނިޔަލަށް، Spalding et al. ލިސްޓުކޮށްފައިވަނީ ރިސޯޓްތަކަށް ބިނާވެފައިވާ ފަތުރުވެރިކަމުގެ ދާއިރާއިން ސަރަހައްދީ ގޮތުން ކުރާ އަސަރުތަކެވެ: ފީނާ މީހުންނާއި ނަނގުރުން ލިބޭ ގެއްލުން، ވެލި ހަރަކާތްކުރުމަށް ހުރަސްއަޅާ ގްރޮއިން (groyne) އާއި ޖެޓީތައް، ވިލުތަކަށް ދޫކުރާ ނަޖިސްފެން، ކަނޑުފެން ފޮނިކުރާ ޕްލާންޓްތަކުން ދޫކުރާ ހޫނު ފެން، އަދި ކުނި. 2004 ގެ ހާލަތު ރިޕޯޓު ޚުލާޞާކުރަމުން Wilkinson (2006) ފާހަގަކުރަނީ، 1998 ގެ ފަހުން ހިތްވަރުލިބޭ ގޮތަކަށް ފަރުތައް އަލުން ރަނގަޅުވަމުން ދިޔަ ކަމާއި، ގިނަ ބަހުރީ ހިމާޔަތްކުރެވިފައިވާ ސަރަހައްދުތައް ހިންގަނީ ރިސޯޓްތަކުން ކަމާއި، 2004 ގެ ސުނާމީއިން ގޮނޑުދޮށްތަކާއި ރަށްރަށަށް ބޮޑު ގެއްލުން ލިބުނު ނަމަވެސް ފަރުތަކަށް އަސަރުކުރީ މަދުން ކަމެވެ. Souter et al. (2021) ދައްކާ ގޮތުގައި ދިވެހިރާއްޖޭގެ ހިރިގާ ނިވާކުރާ މިންވަރު ގާތްގަނޑަކަށް 2015 އާ ހަމައަށް އަލުން ރަނގަޅުވަމުން ދިޔައިރު، 2016 ގެ ހިރިގާ ހުދުވުމުގެ ފަހުން ދަށްވެގެން ދިޔައެވެ. އެ ހިރިގާ ހުދުވުމުން ދެކުނު އޭޝިއާގައި ދިރިހުރި ހަރު ހިރިގާގެ 42% އަށްވުރެ ގިނައިން މަރުވިއެވެ؛ 2017 އިން 2019 އަށް ސަރަހައްދީ ހިރިގާ ހުދުވުން ކުރިއަށް ދިޔައެވެ. ސަރަހައްދުގެ ދިގު މުއްދަތުގެ ނުވަ މޮނިޓަރިންގ ސައިޓްގެ ހުރިހާ ސައިޓެއް ހުރީ ދިވެހިރާއްޖޭގައެވެ. އަދި ހިރިގާގެ މަދުވެގެން ފަހަކުން އެއް ބައި ގެއްލިފައިވާ ދިގު މުއްދަތުގެ 30 ސާމްޕްލިންގ ޔުނިޓުގެ ތެރެއިން 28 ޔުނިޓުގައި، ކުރިން ހުރި ނިވާކުރާ މިންވަރުގެ 90% އަލުން ހޯދިފައެއް ނުވެއެވެ.
Overview
މެދު ދިވެހިރާއްޖޭގެ މި ޔުނިޓުގައި އުތުރު އަދި ދެކުނު މާލެ (North and South Male)، އަރި (Ari)، އަދި ވާވު (Vaavu) ހިމެނެއެވެ. އަތޮޅު ފެންވަރުގެ ހަތް ޕިނުގައި ހުރީ ހަމައެކަނި ކައިރީގައި ކުރި ސާވޭތަކުގެ މަޢުލޫމާތެވެ. ބާކީ ޕިންތަކަކީ ފީލްޑްވޯކުގެ ދެ މުއްދަތެއްގެ ވަކިވަކި ޑައިވް ސައިޓްތަކެވެ. 2016 ގެ ޖަނަވަރީގައި، ދިރާސާގެ ފީނުންތަކުގައި Small Sand Bank، Raaeundi Reef، Veli، Stage، Maafushi، އަދި Big Sand Bank ގައި ހިރިގާގެ ކޮލޯނީތައް ޓެގްކޮށް މިނިއެވެ. އަދި ހަމަ އެ ދަތުރުގައި Anantara Dhigu ގެ ހައުސް ރީފުގައި ވެސް ފީނާފައިވެއެވެ. ފަހުން ލައިވްއަބޯޑް ދަތުރެއްގައި ތިލަތަކާއި، ކަނޑުތަކާއި، ފާރުތަކާއި، ރެކް (wreck) ތަކުގައި ފީނިއެވެ. އޭގެ ތެރޭގައި 2017 ގެ މެއި މަހު ކުރި ދެ ރޭގަނޑު ފީނުން ހިމެނެއެވެ.
2016 ގެ ޖަނަވަރީގެ ފޮޓޯތަކުގައި ފެންނަނީ ކޮލީފްލާވަރ Pocillopora، ސްޓެގްހޯން އާއި ޓޭބަލް Acropora، އަދި ބޮޑު ގަނޑު Porites ހުރި ބޭންކް ފަރުތަކާއި، ފަޅުތަކާއި، ފުންވަމުން ދާ ބިންތަކެވެ. Veli އާއި Anantara Dhigu ގެ ހައުސް ރީފުގައި މަތިމަތިން ހުރި ޓޭބަލް ހިރިގާ ހުރެއެވެ. Raaeundi އަކީ އޭރުވެސް، ކަނޑުވިނަ ލެގި އަޅި ކުލައަށް ބަދަލުވެފައިވާ ސްޓެގްހޯން ހިރިގާގެ ކަށިތައް ހުރި ފަޅެއް ކަމުގައި ވިއެވެ. އޭގެ މަތީގައި ދިރިހުރި ކޮލޯނީތައް ތަންތަނުގައި ހުރިއެވެ. ލައިވްއަބޯޑް ދަތުރުގައި، Dhega Thila، Hodeli Bodu Giri، އަދި Camel Point ގައި ގަދަކޮށް ހެދިފައިވާ ސްޓެގްހޯން އާއި ޓޭބަލް ހިރިގާގެ ބަގީޗާތައް ހުރިއިރު، Dhigga Thila އާއި Vaadhoo Caves ސޮފްޓް ކޯރަލުން ނިވާވެފައި ހުރިއެވެ. Fish Tank، Fish House، Ghuli Faru، އަދި Moofushi Kandu ގައި ހުރީ މަދު ހިރިގާއެވެ. ފޮޓޯއިން ހޯދި ނިވާކުރާ މިންވަރުގެ އިންޑެކްސް، Fish Tank ގައި 8.0% އިން ފެށިގެން Veli ގައި 34.7% އާ ހަމައަށް ތަފާތުވިއެވެ. މިއީ ކޮމްޕިއުޓަރ ވިޜަން ބޭނުންކޮށްގެން ލެވުނު ލަފާކުރުންތަކެކެވެ. Maafushi ގައި މި ދެ ގޮތުގެ ނަތީޖާ 18.9 ޕަސެންޓޭޖް ޕޮއިންޓްއާ ހަމައަށް ތަފާތުވެއެވެ.
ޕިންތަކުގައި 2016 ގެ ހިރިގާ ހުދުވުން ސީދާ ރެކޯޑްކޮށްފައިވެއެވެ. 2016 ގެ އޭޕްރީލްގައި ކުރި ދެވަނަ ސާވޭގައި، Raaeundi ގައި ރެކޯޑްކުރި ހުރިހާ ކޮލޯނީއެއް ހުދުވެފައި ހުރިއެވެ. Stage ގައި ދިހައިން ނުވައަށްވުރެ ގިނަ ކޮލޯނީ، Maafushi ގައި ގާތްގަނޑަކަށް 95%، އަދި Small Sand Bank ގައި ފަހެއްގެ ތެރެއިން ހަތަރު ކޮލޯނީ ހުދުވެފައި ހުރިއެވެ. ރާޅާ ދުރުގައިވާ Veli Lagoon ފަރަށް ގާތްގަނޑަކަށް އެއްވެސް އަސަރެއް ނުކުރެއެވެ. 2017 ގެ މެއި ވަންދެން Big Sand Bank ގައި ޓެގްކުރި ކޮލޯނީތަކުގެ ގިނަ ބައެއް މަރުވެފައި ހުރިއެވެ. ފަހުން ނެގި ފޮޓޯތަކުގައި Dhigga Thila އާއި Lohosfushi Corner ގައި ކަނޑުވިނައިން ނިވާވެފައިވާ ޓޭބަލް ހިރިގާގެ ކަށިތައް ފެނެއެވެ. އަދި Back Faru ގައި ކުދިކުދިވެފައިވާ ހިރިގާ (rubble) ގެ މަތީގައި Pocillopora ގެ އާ ކުދިން ހެދެމުންދާ ތަން، އަދި Miyaru Bay ގައި ކުދި ކޮލޯނީތައް އަލުން ހެދެމުންދާ ތަން ވެސް ފެނެއެވެ. ދިހަ ސައިޓެއްގައި crown-of-thorns ސްޓާފިޝް ރެކޯޑްކުރެވުނެވެ. އަރި އަތޮޅުގެ ދެކުނު ކޮޅުގައި ފޮޓޯގްރާފަރު އެ ހާލަތު ބަޔާންކުރީ އައުޓްބްރޭކެއް (outbreak) ގެ ގޮތުގައެވެ. އަދި Hodeli Bodu Giri ގައި ކްރޫއިން ކަލެކްޝަން ދަނޑިއެއް ބޭނުންކޮށްގެން ސްޓާފިޝްތައް ނަގައި ދުރުކުރިއެވެ.
Highlights
- 2016 ގެ ޖަނަވަރީގެ ބޭސްލައިން، ދެން 2016 ގެ އޭޕްރީލްގެ ދެވަނަ ސާވޭ: Raaeundi Reef ގައި ރެކޯޑްކުރި ހުރިހާ ކޮލޯނީއެއް، Stage ގައި ދިހައިން ނުވައަށްވުރެ ގިނަ ކޮލޯނީ، އަދި Maafushi ގައި ގާތްގަނޑަކަށް 95% ހުދުވެފައި.
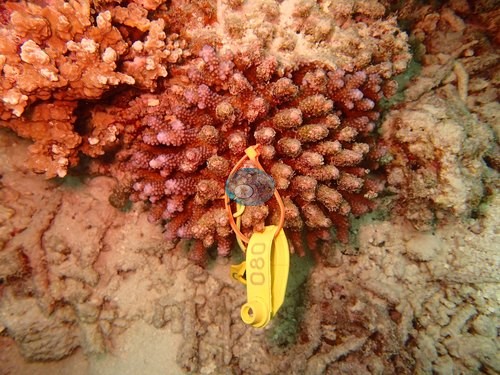 photo: Maldives - Raaeundi Reef
 - ދިހަ ސައިޓެއްގައި crown-of-thorns ސްޓާފިޝް؛ އަރި އަތޮޅުގެ ދެކުނު ކޮޅުގައި އައުޓްބްރޭކެއްގެ ގޮތުގައި ބަޔާންކޮށް، Hodeli Bodu Giri ގައި އަތުން ނަގައި ދުރުކުރެވުނެވެ.
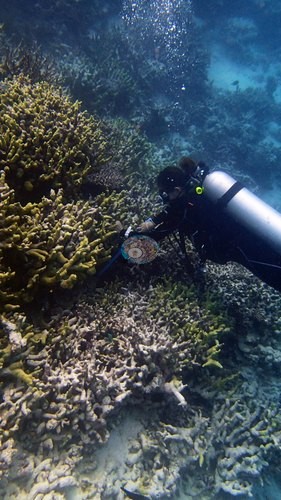 photo: Maldives - Hodeli Bodu Giri
 - Dhega Thila، Hodeli Bodu Giri، އަދި Camel Point ގައި ގަދަކޮށް ހެދިފައިވާ ސްޓެގްހޯން އާއި ޓޭބަލް ހިރިގާގެ ބަގީޗާތައް؛ Dhigga Thila އާއި Vaadhoo Caves ގައި ސޮފްޓް ކޯރަލުން ނިވާވެފައިވާ ފާރުތައް.
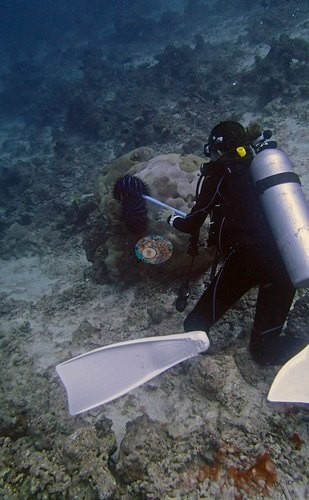 photo: Maldives - Hodeli Bodu Giri
 - Lankan Faru އަކީ ބޮޑުމަދި (manta) ސާފުކުރުވަން އަންނަ ތަނެކެވެ؛ އަރި އަތޮޅުގެ ދެކުނު ކޮޅުގައި ފެހުރިހިއެއްގެ ފޮޓޯ ނަގާފައިވެއެވެ.
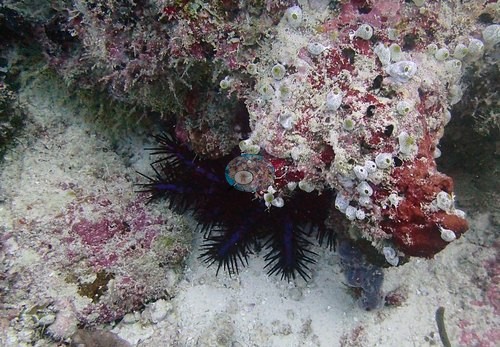 photo: Maldives - Lankan Faru
 - އަލުން ރަނގަޅުވުމުގެ ނިޝާނާ: Back Faru ގައި Pocillopora ގެ އާ ކުދިން ހެދެމުންދާ ތަން، އަދި Lohosfushi Corner ގައި ޒުވާން ޓޭބަލް ހިރިގާ.
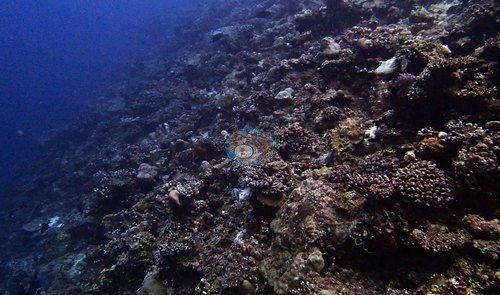 photo: Maldives - Lohosfushi Corner
Notable observations (18)
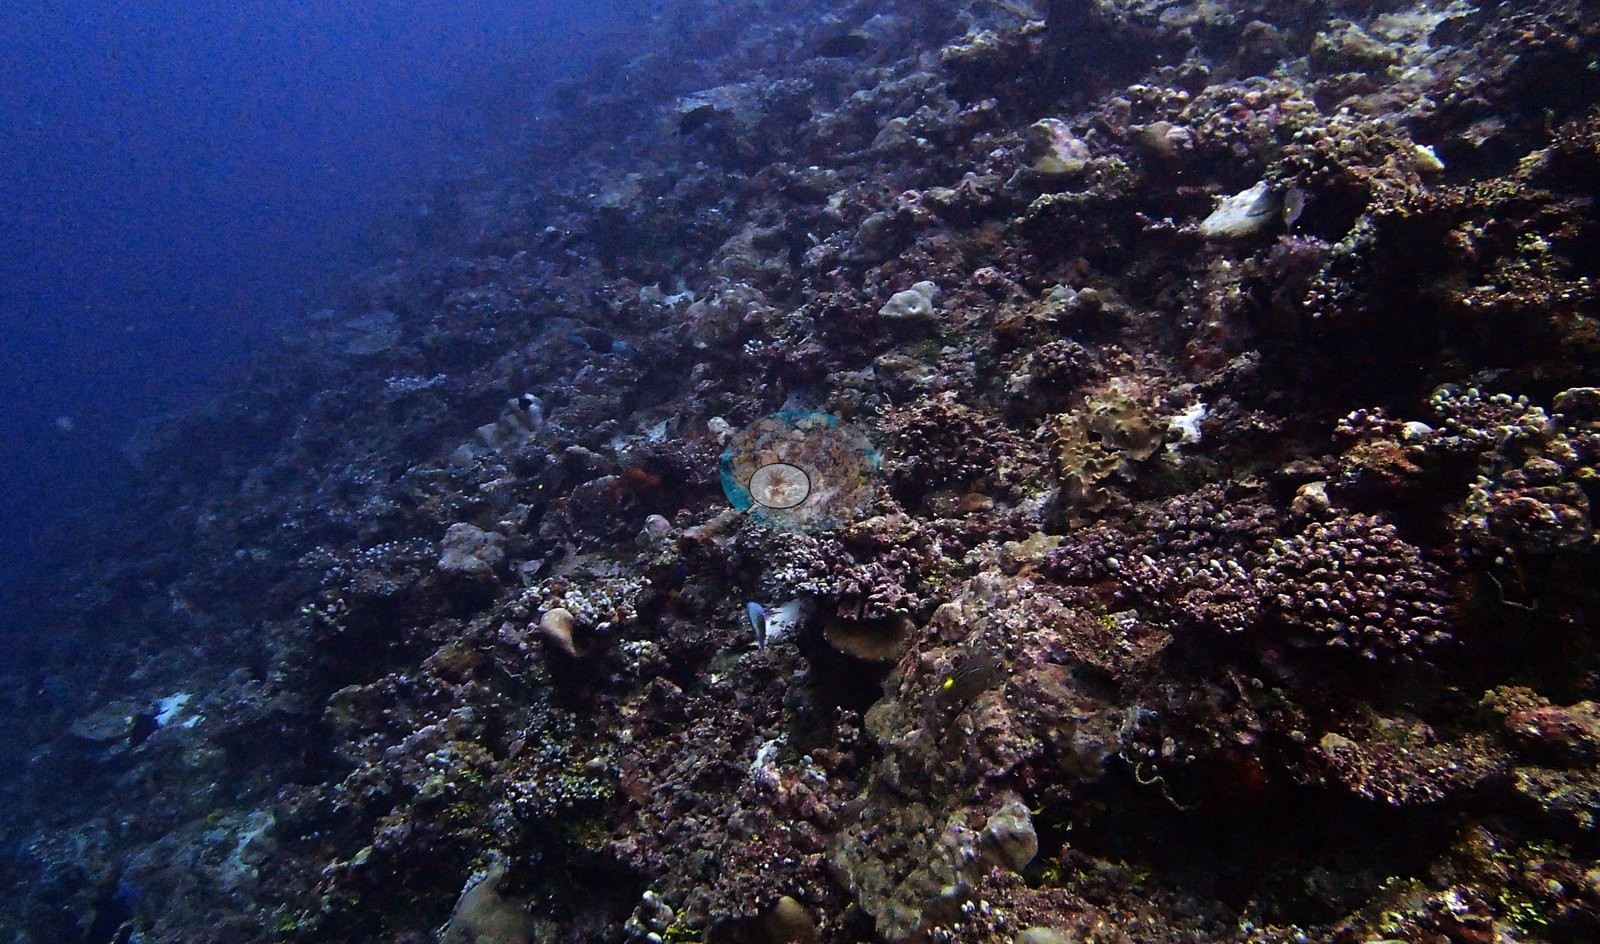
- Maldives - Raaeundi Reef: Bleaching: many colonies pale with white tips and pink stress blushes in January 2016; every coral colony recorded was bleached at the April 2016 resurvey.
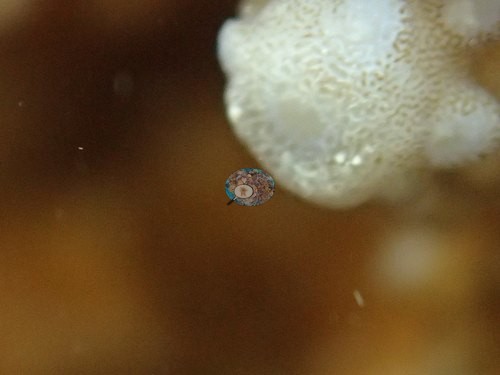
- Maldives - Stage: Bleaching: more than nine of every ten coral colonies bleached at the April 2016 resurvey.
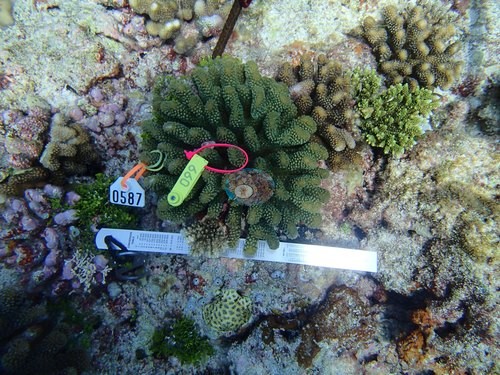
- Maldives - Maafushi: Bleaching: the April 2016 resurvey found roughly 95% of coral colonies bleached.
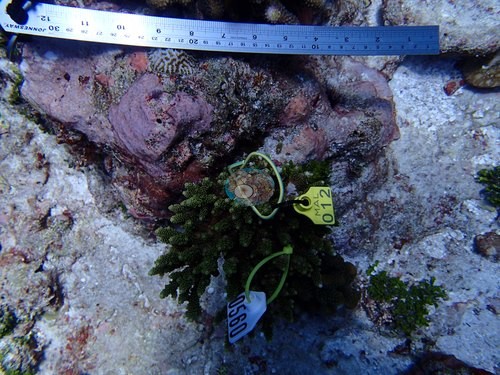
- Maldives - Small Sand Bank: crown-of-thorns starfish (COTS) and bleaching: crown-of-thorns seastars prowl the pavement (January 2016); four out of five colonies bleached at the April 2016 resurvey.
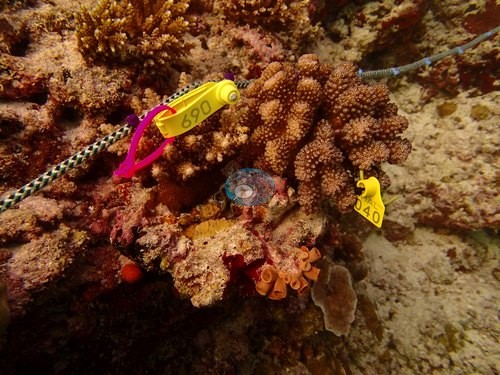
- Maldives - Veli: Bleaching: a few white branch tips and one ghost-white staghorn in January 2016; by April 2016 the neighboring Veli Channel reef had nearly half its corals bleached, while Veli Lagoon escaped almost untouched.
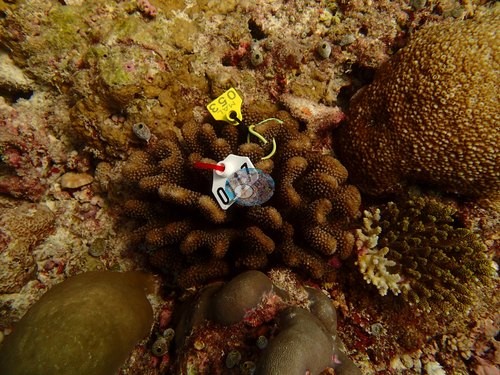
- Maldives - Big Sand Bank: Mortality: tagged long-term monitoring colonies found largely dead on the May 2017 revisit.
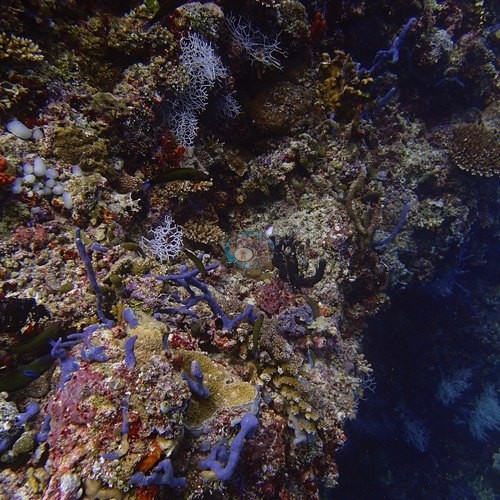
- Maldives - Anantara Dhigu house reef: COTS: a crown-of-thorns starfish on the rubble, a likely author of stark white feeding scars on a couple of table corals (January 2016). Derelict nursery: some transplants toppled casualties in the rubble.
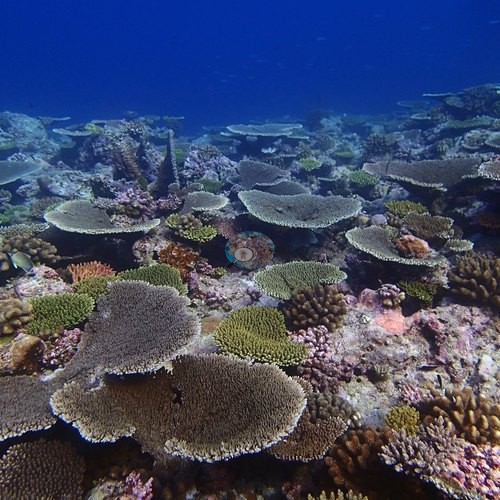
- Maldives - Ari Atoll south tip: COTS: crown-of-thorns seastars wedged two to a crevice amid fresh white skeletons of eaten staghorn and cauliflower corals; photographer labels it an outbreak.
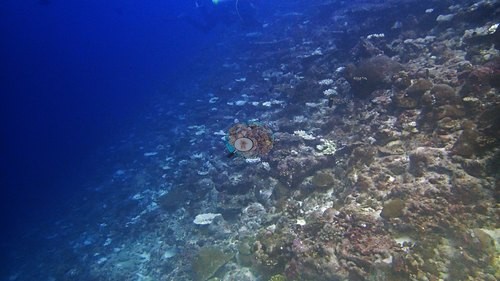
- Maldives - Hodeli Bodu Giri: COTS: crown-of-thorns starfish grazing, white feeding scars on the big dome and table corals; a diver removed them with a collection stick.
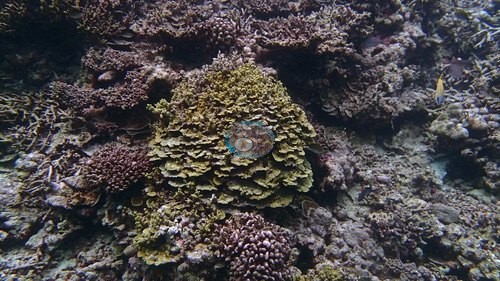
- Maldives - Veligandu: COTS: crown-of-thorns seastars everywhere; feeding scars on a brain coral, staghorn stripped to skeleton, a mound coral eaten down one flank.
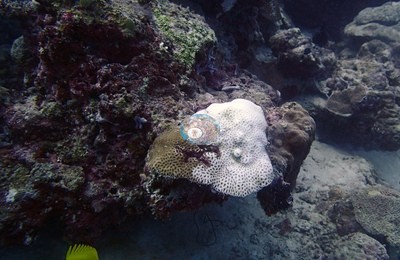
- Maldives - Georgia's Reef: COTS: crown-of-thorns seastars turned up repeatedly, one beside the chalk-white scar of its last coral meal.
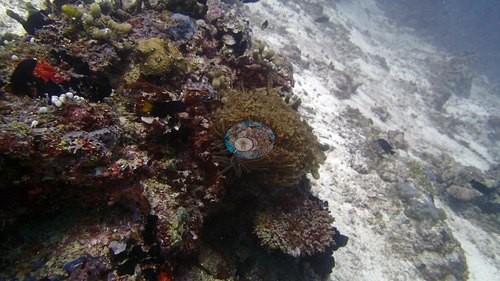
- Maldives - Lankan Faru: COTS: crown-of-thorns starfish in crevices, one under a plate coral, beside fresh white feeding scars.
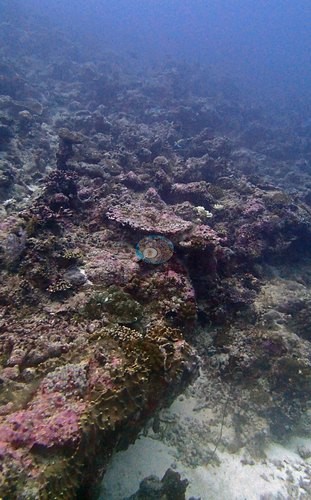
- Maldives - Back Faru: COTS and mortality: crown-of-thorns seastars and fresh feeding scars; dead framework and dead table corals a year after the 2016 bleaching.
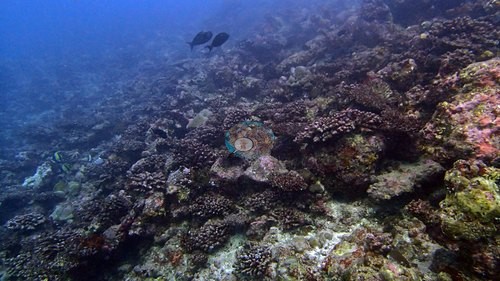
- Maldives - Lohosfushi Corner: Mortality and COTS: table corals gray and algae-overgrown after the 2016 bleaching; the photographer's caption blames crown-of-thorns seastars for finishing parts.
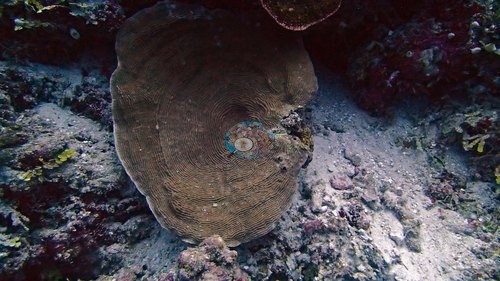
- Maldives - Checkout dive (Hulhumale outer reef): COTS: a crown-of-thorns seastar jammed under a ledge; substrate still carrying the scars of the 2016 bleaching year.
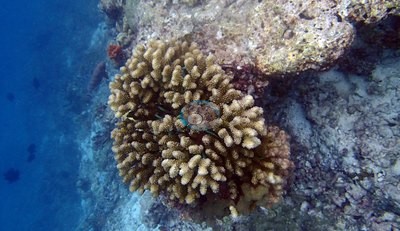
- Maldives - Dhigga Thila: Debris: a length of white PVC pipe left on the reef; algae-covered table skeletons from the 2016 bleaching on the crown.
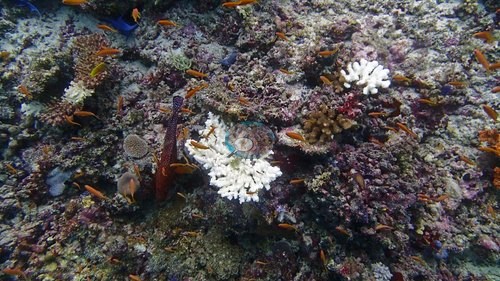
- Maldives - Kuda Giri Wreck: Derelict gear: coral-farming tables nearby with most transplanted fragments long dead.
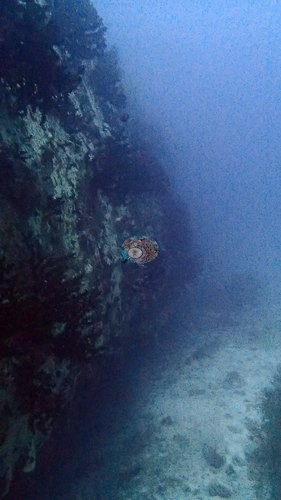
- Maldives - Dhigurah Arches (night dive): Possible pale branch sections on one cauliflower coral, recorded as an ambiguous observation only (strobe lighting); no site-wide bleaching.
Coral cover over time (pooled)
Sites in this region (37)
- Maldives - Anantara Dhigu house reef — 31% coral cover
- Maldives - Ari Atoll
- Maldives - Ari Atoll south tip — 19% coral cover
- Maldives - Back Faru — 14% coral cover
- Maldives - Big Sand Bank — 18% coral cover
- Maldives - Bodu Hithi Thila — 16% coral cover
- Maldives - Camel Point — 24% coral cover
- Maldives - Checkout dive (Hulhumale outer reef) — 19% coral cover
- Maldives - Dhega Thila — 23% coral cover
- Maldives - Dhigga Thila — 25% coral cover
- Maldives - Dhigurah Arches (night dive)
- Maldives - Fesdhoo wreck — 14% coral cover
- Maldives - Feydoo Wall — 22% coral cover
- Maldives - Fish House (Fish Head) — 9.4% coral cover
- Maldives - Fish Tank — 8.1% coral cover
- Maldives - Georgia's Reef — 20% coral cover
- Maldives - Ghuli Faru — 12% coral cover
- Maldives - Hodeli Bodu Giri — 23% coral cover
- Maldives - Kandooma Thila — 10% coral cover
- Maldives - Kuda Giri Wreck — 20% coral cover
- Maldives - Lankan Faru — 16% coral cover
- Maldives - Lohosfushi Corner — 15% coral cover
- Maldives - Maafushi — 31% coral cover
- Maldives - Miyaro Faru — 20% coral cover
- Maldives - Miyaru Bay — 15% coral cover
- Maldives - Moofushi Kandu — 16% coral cover
- Maldives - North Ari Atoll
- Maldives - North Male Atoll
- Maldives - Raaeundi Reef — 22% coral cover
- Maldives - Small Sand Bank — 20% coral cover
- Maldives - South Ari (Maamigili)
- Maldives - South Male Atoll
- Maldives - Stage — 30% coral cover
- Maldives - Vaadhoo Caves — 11% coral cover
- Maldives - Veli — 35% coral cover
- Maldives - Veligandu — 18% coral cover
- Maldives - Vilivaru Giri (night dive)
Nearby external survey stations
141 independent survey records within 5 km of a site in this region (deduplicated across sites).
Show all 141 records
- Montefalcone et al. (2020) — Banana Reef (2015): 40% hard coral cover, 2.28 km from Maldives - Checkout dive (Hulhumale outer reef)
- Montefalcone et al. (2020) — Banana Reef (2016): 16% hard coral cover, 2.28 km from Maldives - Checkout dive (Hulhumale outer reef)
- Montefalcone et al. (2020) — Banana Reef (2018): 12% hard coral cover, 2.28 km from Maldives - Checkout dive (Hulhumale outer reef)
- Montefalcone et al. (2020) — Banana Reef (2019): 19% hard coral cover, 2.28 km from Maldives - Checkout dive (Hulhumale outer reef)
- Montefalcone et al. (2020) — Cocoa Corner (2015): 76% hard coral cover, 1.16 km from Maldives - Ghuli Faru
- Montefalcone et al. (2020) — Dangethi House Reef (2017): 1.0% hard coral cover, 2.77 km from Maldives - Camel Point
- Montefalcone et al. (2020) — Fesdu Wreck (2016): 21% hard coral cover, 3.94 km from Maldives - Fesdhoo wreck
- Montefalcone et al. (2020) — Guraidhoo Kuda Giri (2015): 83% hard coral cover, 0.66 km from Maldives - Vilivaru Giri (night dive)
- Montefalcone et al. (2020) — Guraidhoo Kuda Giri (2016): 12% hard coral cover, 0.66 km from Maldives - Vilivaru Giri (night dive)
- Montefalcone et al. (2020) — Hulumale Beyru (2015): 41% hard coral cover, 0.62 km from Maldives - Back Faru
- Montefalcone et al. (2020) — Hulumale Beyru (2016): 15% hard coral cover, 0.62 km from Maldives - Back Faru
- Montefalcone et al. (2020) — Kandooma Beyru (2016): 7.7% hard coral cover, 0.81 km from Maldives - Kandooma Thila
- Montefalcone et al. (2020) — Kandooma Beyru (2018): 17% hard coral cover, 0.81 km from Maldives - Kandooma Thila
- Montefalcone et al. (2020) — Kandooma Beyru (2019): 34% hard coral cover, 0.81 km from Maldives - Kandooma Thila
- Montefalcone et al. (2020) — Kubulabhi Etheru (2017): 7.0% hard coral cover, 2.58 km from Maldives - Fish House (Fish Head)
- Montefalcone et al. (2020) — Kubulabhi Etheru (2019): 18% hard coral cover, 2.58 km from Maldives - Fish House (Fish Head)
- Montefalcone et al. (2020) — Maadhu Faru Beyru (2016): 18% hard coral cover, 0.60 km from Maldives - Lohosfushi Corner
- Montefalcone et al. (2020) — Maadhu Faru Beyru (2017): 45% hard coral cover, 0.60 km from Maldives - Lohosfushi Corner
- Montefalcone et al. (2020) — Maavaru Faru Beyru (2017): 53% hard coral cover, 3.45 km from Maldives - Moofushi Kandu
- Montefalcone et al. (2020) — Maavaru Faru Beyru (2019): 71% hard coral cover, 3.45 km from Maldives - Moofushi Kandu
- Montefalcone et al. (2020) — Maavaru Faru Etheru (2017): 7.3% hard coral cover, 3.73 km from Maldives - Moofushi Kandu
- Montefalcone et al. (2020) — Maavaru Faru Etheru (2019): 13% hard coral cover, 3.73 km from Maldives - Moofushi Kandu
- Montefalcone et al. (2020) — Vaadhoo Caves (2018): 23% hard coral cover, 0.74 km from Maldives - Vaadhoo Caves
- Montefalcone et al. (2020) — Velassaru (2017): 22% hard coral cover, 3.85 km from Maldives - Vaadhoo Caves
- Montefalcone et al. (2020) — Velassaru (2019): 48% hard coral cover, 3.85 km from Maldives - Vaadhoo Caves
- Montefalcone et al. (2020) — Villivaru Kuda Giri (2015): 51% hard coral cover, 0.66 km from Maldives - Vilivaru Giri (night dive)
- Montefalcone et al. (2020) — Villivaru Kuda Giri (2017): 8.0% hard coral cover, 0.66 km from Maldives - Vilivaru Giri (night dive)
- Montefalcone et al. (2020) — Villivaru Kuda Giri (2018): 19% hard coral cover, 0.66 km from Maldives - Vilivaru Giri (night dive)
- Montefalcone et al. (2020) — Villivaru Kuda Giri (2019): 38% hard coral cover, 0.66 km from Maldives - Vilivaru Giri (night dive)
- Original collectors (compiled by McClanahan et al. 2016) — Villingilli (Maldives) (2016): 8.8% hard coral cover, 4.36 km from Maldives - Feydoo Wall
- Re E.* — Banana_Reef (2026): 29% hard coral cover, 1.64 km from Maldives - Vilivaru Giri (night dive)
- Re E.* (MERMAID test project) — Banana_Reef (2026): 29% hard coral cover, 1.64 km from Maldives - Vilivaru Giri (night dive)
- Reef Check — Banana Reef (1998): 12% hard coral cover, 4.11 km from Maldives - Camel Point
- Reef Check — Banana Reef (2010): 33% hard coral cover, 1.15 km from Maldives - Back Faru
- Reef Check — Banana Reef (2014): 16% hard coral cover, 2.54 km from Maldives - Back Faru
- Reef Check — Bandos Island Housereef (2024): 35% hard coral cover, 4.78 km from Maldives - Fish Tank
- Reef Check — Banyan Tree House Reef (2013): 33% hard coral cover, 2.69 km from Maldives - Georgia's Reef
- Reef Check — Baros House Reef (2010): 38% hard coral cover, 3.61 km from Maldives - Georgia's Reef
- Reef Check — Baros House Reef (2011): 30% hard coral cover, 2.61 km from Maldives - Georgia's Reef
- Reef Check — Baros House Reef (2014): 36% hard coral cover, 3.29 km from Maldives - Georgia's Reef
- Reef Check — Baros House Reef (2016): 43% hard coral cover, 3.61 km from Maldives - Georgia's Reef
- Reef Check — Baros Housereef (2012): 38% hard coral cover, 3.40 km from Maldives - Georgia's Reef
- Reef Check — Beybe's Bellybutton (2019): 32% hard coral cover, 4.71 km from Maldives - Vilivaru Giri (night dive)
- Reef Check — Beybe's Bellybutton (2022): 33% hard coral cover, 4.71 km from Maldives - Vilivaru Giri (night dive)
- Reef Check — Beybe's Bellybutton (2024): 37% hard coral cover, 4.71 km from Maldives - Vilivaru Giri (night dive)
- Reef Check — Beybe's Bellybutton (2025): 52% hard coral cover, 4.71 km from Maldives - Vilivaru Giri (night dive)
- Reef Check — Biyadhoo House Reef (2012): 18% hard coral cover, 2.53 km from Maldives - Vilivaru Giri (night dive)
- Reef Check — Coral Garden (2016): 63% hard coral cover, 2.68 km from Maldives - Dhigurah Arches (night dive)
- Reef Check — Coral Garden (2022): 19% hard coral cover, 2.68 km from Maldives - Dhigurah Arches (night dive)
- Reef Check — Dangethi Inner Reef (2017): 26% hard coral cover, 2.11 km from Maldives - Camel Point
- Reef Check — Dega Giri (2008): 16% hard coral cover, 3.75 km from Maldives - Moofushi Kandu
- Reef Check — Dega Giri, Ari Atoll (2008): 67% hard coral cover, 3.74 km from Maldives - Moofushi Kandu
- Reef Check — Dega Thila (2016): 14% hard coral cover, 3.83 km from Maldives - Moofushi Kandu
- Reef Check — Dega Thila (2017): 35% hard coral cover, 3.83 km from Maldives - Moofushi Kandu
- Reef Check — Dega Thila (2018): 4.4% hard coral cover, 3.83 km from Maldives - Moofushi Kandu
- Reef Check — Dega Thila (2023): 3.8% hard coral cover, 3.83 km from Maldives - Moofushi Kandu
- Reef Check — Dega Thila (2025): 4.7% hard coral cover, 3.83 km from Maldives - Moofushi Kandu
- Reef Check — Dhigga Thila (2013): 29% hard coral cover, 0.08 km from Maldives - Dhigga Thila
- Reef Check — Dhigurah Outreef (2018): 32% hard coral cover, 1.83 km from Maldives - Dhigurah Arches (night dive)
- Reef Check — Dhigurah Outreef (2018): 36% hard coral cover, 1.83 km from Maldives - Dhigurah Arches (night dive)
- Reef Check — Dhigurah Outreef (2018): 30% hard coral cover, 1.84 km from Maldives - Dhigurah Arches (night dive)
- Reef Check — Dhigurah Wall (2016): 39% hard coral cover, 2.70 km from Maldives - Dhigurah Arches (night dive)
- Reef Check — Dhigurah Wall (2018): 22% hard coral cover, 2.98 km from Maldives - Dhigurah Arches (night dive)
- Reef Check — Dhigurah Wall (2023): 27% hard coral cover, 2.70 km from Maldives - Dhigurah Arches (night dive)
- Reef Check — Digga Thilla (2011): 62% hard coral cover, 0.22 km from Maldives - Dhigga Thila
- Reef Check — Digga Thilla (2011): 38% hard coral cover, 0.22 km from Maldives - Dhigga Thila
- Reef Check — Digga Thilla (2017): 14% hard coral cover, 0.22 km from Maldives - Dhigga Thila
- Reef Check — Embudhoo (2012): 38% hard coral cover, 1.86 km from Maldives - Vaadhoo Caves
- Reef Check — Embudhu (South Male) (2017): 9.4% hard coral cover, 1.72 km from Maldives - Vaadhoo Caves
- Reef Check — Faanu Madugau Inner Reef (2017): 52% hard coral cover, 3.92 km from Maldives - Fish House (Fish Head)
- Reef Check — Gulhi Island Backreef (2022): 19% hard coral cover, 0.87 km from Maldives - Stage
- Reef Check — Guraidhoo Backreef (2024): 31% hard coral cover, 1.45 km from Maldives - Vilivaru Giri (night dive)
- Reef Check — Guraidhoo Banana (2024): 25% hard coral cover, 1.39 km from Maldives - Lohosfushi Corner
- Reef Check — Guraidhoo Banana (2025): 27% hard coral cover, 1.39 km from Maldives - Lohosfushi Corner
- Reef Check — Guraidhoo Corner (2017): 21% hard coral cover, 0.78 km from Maldives - Lohosfushi Corner
- Reef Check — Guraidhoo Forereef (2024): 25% hard coral cover, 1.22 km from Maldives - Lohosfushi Corner
- Reef Check — Guraidhoo Forereef (2025): 26% hard coral cover, 1.22 km from Maldives - Lohosfushi Corner
- Reef Check — Guraidhoo backreef (2019): 28% hard coral cover, 1.44 km from Maldives - Vilivaru Giri (night dive)
- Reef Check — Guraidhoo backreef (2022): 20% hard coral cover, 1.20 km from Maldives - Vilivaru Giri (night dive)
- Reef Check — Guraidhoo backreef (2025): 25% hard coral cover, 1.44 km from Maldives - Vilivaru Giri (night dive)
- Reef Check — Guridhoo outer (2019): 20% hard coral cover, 1.11 km from Maldives - Lohosfushi Corner
- Reef Check — Guridhoo outer (2019): 18% hard coral cover, 1.11 km from Maldives - Lohosfushi Corner
- Reef Check — Guridhoo outer (2022): 16% hard coral cover, 1.11 km from Maldives - Lohosfushi Corner
- Reef Check — HP Reef (2006): 18% hard coral cover, 4.15 km from Maldives - Lankan Faru
- Reef Check — HP Reef (2007): 37% hard coral cover, 4.15 km from Maldives - Lankan Faru
- Reef Check — Hembadhoo Hohola (1997): 17% hard coral cover, 3.21 km from Maldives - Bodu Hithi Thila
- Reef Check — Holiday Thila (2015): 13% hard coral cover, 3.03 km from Maldives - South Ari (Maamigili)
- Reef Check — Holiday Thila (2016): 11% hard coral cover, 3.03 km from Maldives - South Ari (Maamigili)
- Reef Check — Holiday Thila (2017): 7.8% hard coral cover, 3.03 km from Maldives - South Ari (Maamigili)
- Reef Check — Holiday Thila (2025): 28% hard coral cover, 3.03 km from Maldives - South Ari (Maamigili)
- Reef Check — Holiday Thila North (2011): 38% hard coral cover, 3.03 km from Maldives - South Ari (Maamigili)
- Reef Check — Holiday Thila South (2011): 54% hard coral cover, 3.03 km from Maldives - South Ari (Maamigili)
- Reef Check — Honkey's (2001): 7.8% hard coral cover, 4.81 km from Maldives - Lankan Faru
- Reef Check — Kandooma Beyru (2018): 18% hard coral cover, 0.48 km from Maldives - Kandooma Thila
- Reef Check — Kandooma Beyru (2018): 24% hard coral cover, 0.48 km from Maldives - Kandooma Thila
- Reef Check — Kandooma Beyru (2019): 30% hard coral cover, 0.48 km from Maldives - Kandooma Thila
- Reef Check — Kubuladhi Inner (2017): 16% hard coral cover, 3.80 km from Maldives - Fish House (Fish Head)
- Reef Check — Kubuladi etere (2019): 11% hard coral cover, 3.08 km from Maldives - Fish House (Fish Head)
- Reef Check — Kuda Banana Reef (2019): 7.2% hard coral cover, 2.32 km from Maldives - Checkout dive (Hulhumale outer reef)
- Reef Check — Kuda Falhu (2013): 44% hard coral cover, 1.11 km from Maldives - Fesdhoo wreck
- Reef Check — Kudafalhu (2016): 5.8% hard coral cover, 1.31 km from Maldives - Fesdhoo wreck
- Reef Check — Kudafalhu (2018): 1.9% hard coral cover, 1.31 km from Maldives - Fesdhoo wreck
- Reef Check — Kudafalhu (2023): 25% hard coral cover, 1.31 km from Maldives - Fesdhoo wreck
- Reef Check — Kudafalhu (2023): 10% hard coral cover, 1.31 km from Maldives - Fesdhoo wreck
- Reef Check — Kudafalhu (2025): 40% hard coral cover, 1.31 km from Maldives - Fesdhoo wreck
- Reef Check — Kudafalu (2011): 44% hard coral cover, 2.19 km from Maldives - Fesdhoo wreck
- Reef Check — Kudafalu (2015): 38% hard coral cover, 2.19 km from Maldives - Fesdhoo wreck
- Reef Check — Kudafalu (2017): 1.9% hard coral cover, 2.19 km from Maldives - Fesdhoo wreck
- Reef Check — Laguna Beyru House Reef (2011): 12% hard coral cover, 3.96 km from Maldives - Vaadhoo Caves
- Reef Check — Maamigili (2011): 48% hard coral cover, 1.15 km from Maldives - Ari Atoll south tip
- Reef Check — Maavaru Faru beyru (2019): 40% hard coral cover, 2.83 km from Maldives - Moofushi Kandu
- Reef Check — Maavaru Faru etere (2019): 16% hard coral cover, 3.30 km from Maldives - Moofushi Kandu
- Reef Check — Maaya Thila (2006): 5.6% hard coral cover, 4.78 km from Maldives - North Ari Atoll
- Reef Check — Orimas Faru Nord (1997): 41% hard coral cover, 3.45 km from Maldives - Fish House (Fish Head)
- Reef Check — Panettone Reef (2006): 36% hard coral cover, 3.76 km from Maldives - Dhega Thila
- Reef Check — Sultans (2001): 7.8% hard coral cover, 4.95 km from Maldives - Lankan Faru
- Reef Check — Vadhoo Caves (2018): 13% hard coral cover, 0.32 km from Maldives - Vaadhoo Caves
- Reef Check — Vellassaru beyru (2019): 8.8% hard coral cover, 3.47 km from Maldives - Vaadhoo Caves
- Reef Check — Villivaru Giri (2018): 8.8% hard coral cover, 0.04 km from Maldives - Vilivaru Giri (night dive)
- Reef Check — Villivaru Kuda Giri (2019): 24% hard coral cover, 0.33 km from Maldives - Vilivaru Giri (night dive)
- Reef Check — Vilm01 (1998): 5.0% hard coral cover, 3.65 km from Maldives - Camel Point
- Reef Check — Vilm02 (1998): 5.6% hard coral cover, 3.96 km from Maldives - Camel Point
- Reef Check — Vilm03 (1998): 9.1% hard coral cover, 3.81 km from Maldives - Camel Point
- Reef Check — Vilm04 (1998): 12% hard coral cover, 3.87 km from Maldives - Camel Point
- Reef Check — Vilm05/Vilamendhoo southwest (1998): 6.2% hard coral cover, 3.94 km from Maldives - Camel Point
- Reef Check — Vilm05/Vilamendhoo southwest (2012): 45% hard coral cover, 3.94 km from Maldives - Camel Point
- ReefCloud — Emboodhoo (2011): 26% hard coral cover, 1.94 km from Maldives - Vaadhoo Caves
- ReefCloud — Emboodhoo (2012): 40% hard coral cover, 1.94 km from Maldives - Vaadhoo Caves
- XL Catlin Seaview Survey — transect 37001 (2015): 14% hard coral cover, 0.55 km from Maldives - Checkout dive (Hulhumale outer reef)
- XL Catlin Seaview Survey — transect 37001 (2017): 1.8% hard coral cover, 0.54 km from Maldives - Checkout dive (Hulhumale outer reef)
- XL Catlin Seaview Survey — transect 37008 (2015): 14% hard coral cover, 0.19 km from Maldives - Fesdhoo wreck
- XL Catlin Seaview Survey — transect 37008 (2017): 8.1% hard coral cover, 0.22 km from Maldives - Fesdhoo wreck
- XL Catlin Seaview Survey — transect 37011 (2015): 15% hard coral cover, 0.90 km from Maldives - Camel Point
- XL Catlin Seaview Survey — transect 37011 (2017): 21% hard coral cover, 0.93 km from Maldives - Camel Point
- XL Catlin Seaview Survey — transect 37012 (2015): 12% hard coral cover, 2.28 km from Maldives - Ari Atoll south tip
- XL Catlin Seaview Survey — transect 37013 (2015): 6.7% hard coral cover, 4.41 km from Maldives - Ari Atoll south tip
- XL Catlin Seaview Survey — transect 37035 (2015): 7.1% hard coral cover, 0.50 km from Maldives - South Male Atoll
- XL Catlin Seaview Survey — transect 37035 (2017): 5.5% hard coral cover, 0.40 km from Maldives - South Male Atoll
- XL Catlin Seaview Survey — transect 37036 (2015): 38% hard coral cover, 1.13 km from Maldives - South Male Atoll
- XL Catlin Seaview Survey — transect 37037 (2015): 14% hard coral cover, 1.81 km from Maldives - Vaadhoo Caves
- XL Catlin Seaview Survey — transect 37037 (2017): 9.1% hard coral cover, 1.94 km from Maldives - Vaadhoo Caves
All images from Coral Reef Diagnostics. Data are from Coral Reef Diagnostics and Reef Check Foundation and XL Catlin Seaview Survey (University of Queensland).
 © Coral Reef Diagnostics.
References
- Souter D, et al. (eds) (2021) Status of Coral Reefs of the World: 2020. International Coral Reef Initiative / Global Coral Reef Monitoring Network. [PDF]
- Spalding MD, et al. (2001) World Atlas of Coral Reefs. University of California Press, Berkeley. [PDF]
- Wilkinson C (2006) Status of coral reefs of the world: summary of threats and remedial action. In: Côté IM, Reynolds JD (eds) Coral Reef Conservation. Cambridge University Press, Cambridge. [PDF]
- Montefalcone M, Morri C, Bianchi CN (2020). Influence of Local Pressures on Maldivian Coral Reef Resilience Following Repeated Bleaching Events, and Recovery Perspectives. Frontiers in Marine Science 7:587. PDF