
Maldives - Kandooma Thila

Part of the regional summaries: Maldives - Central (Male Atolls / Ari / Vaavu) and Maldives
2017-05-22
More info
Maldives (NOAA CRW virtual station) · Maldives ecoregion mean=2.9°C-heating weeksA current-swept pinnacle known for parades of gray reef sharks, barracuda walls, and unicornfish squadrons rather than its coral, which computer vision puts at roughly 10% cover (methods disagree, 7.0-13%).
Sixteen independent survey stations shown with the program’s logo — click one to see how far it is from this site.
Three other CRD dive sites within 5 km shown in orange — click a marker to open its page.
20 of these 25 photographs are shown beside the text that discusses them under "Site description" below.
Site description
Setting
Kandooma Thila is where the current does the introductions.
General benthic features
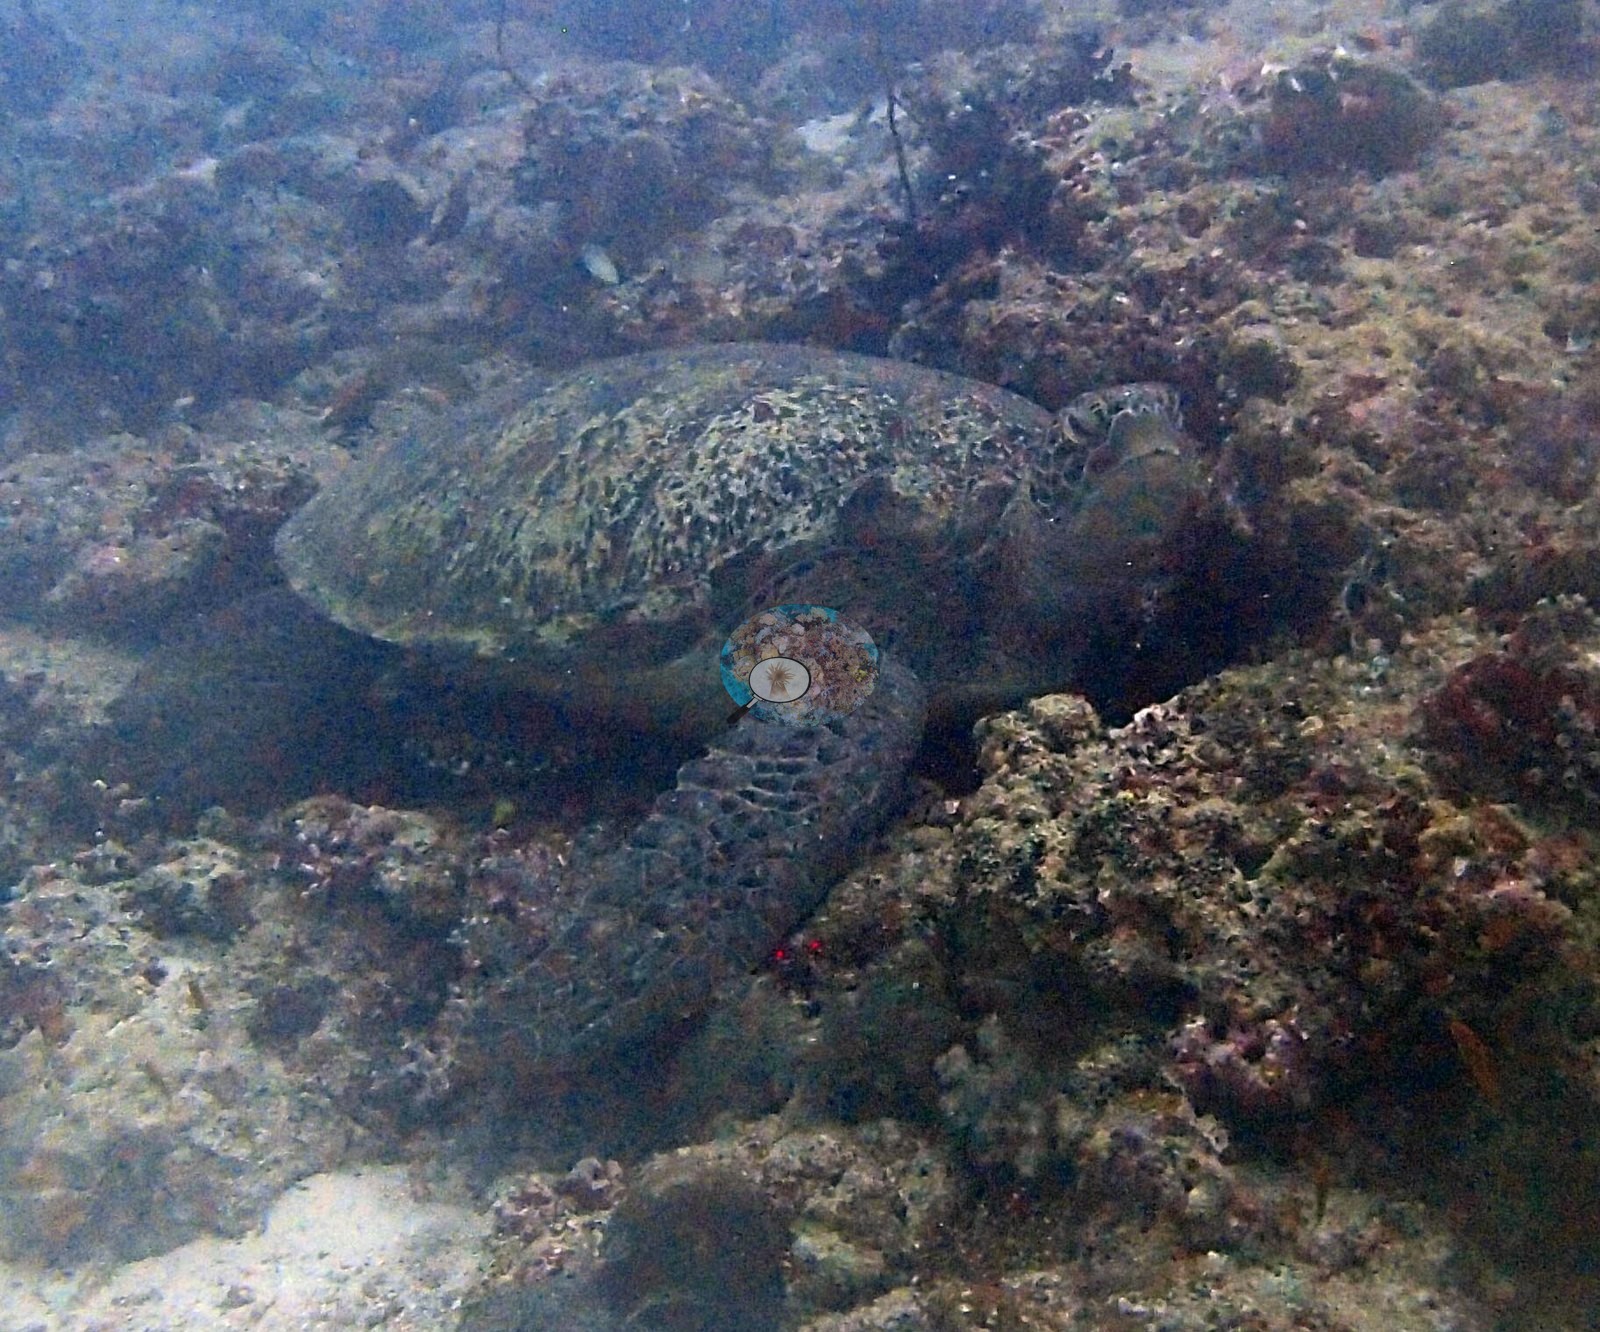
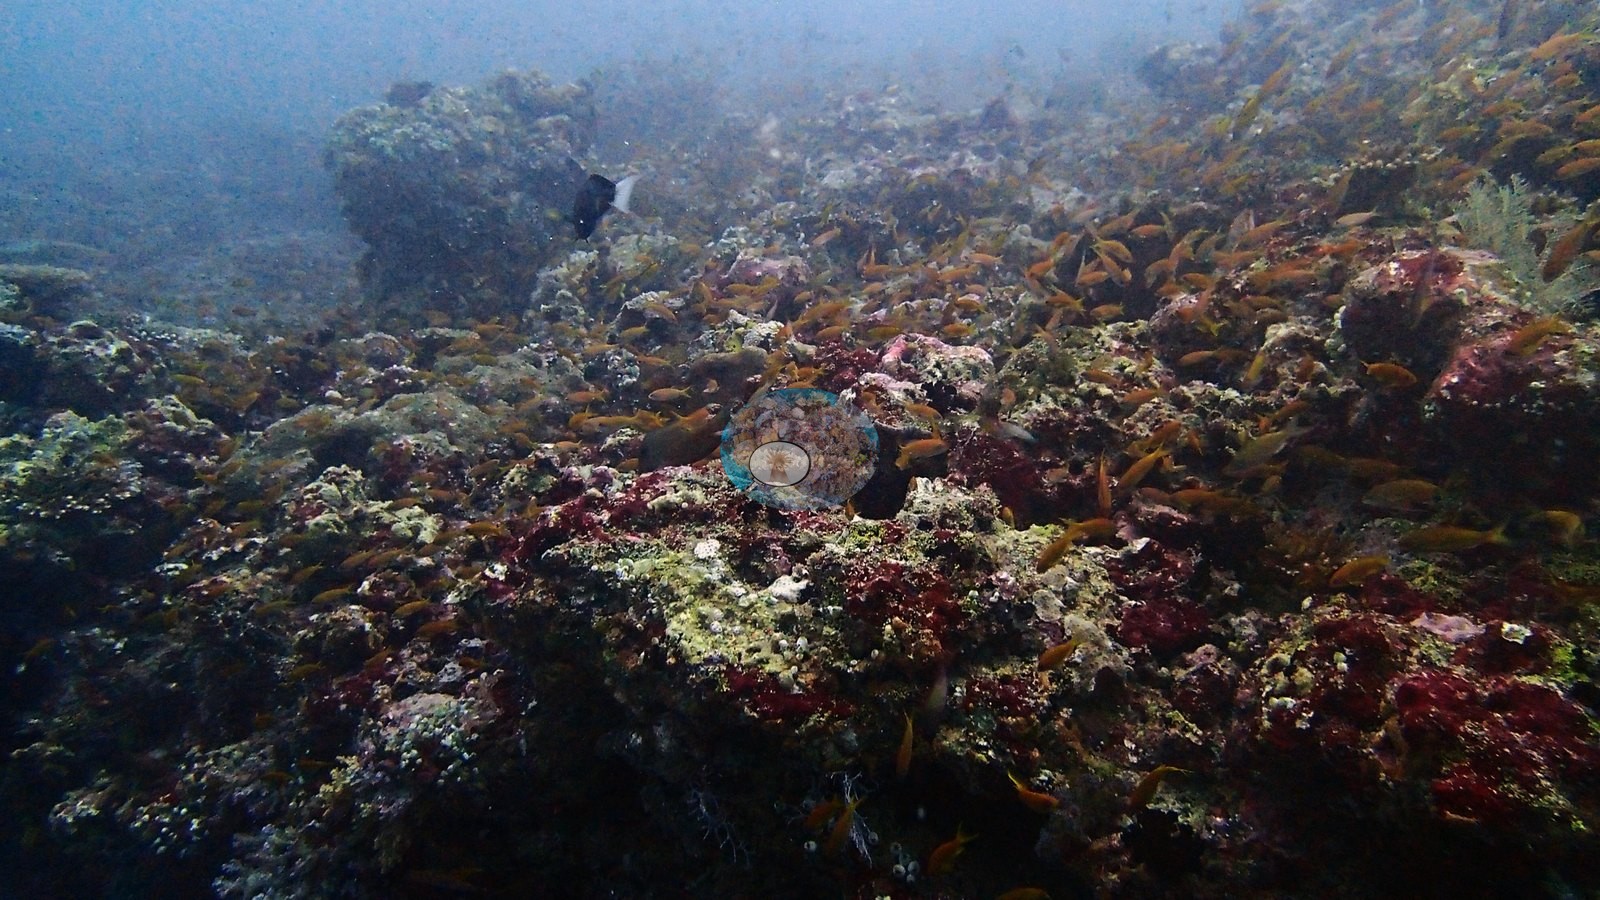
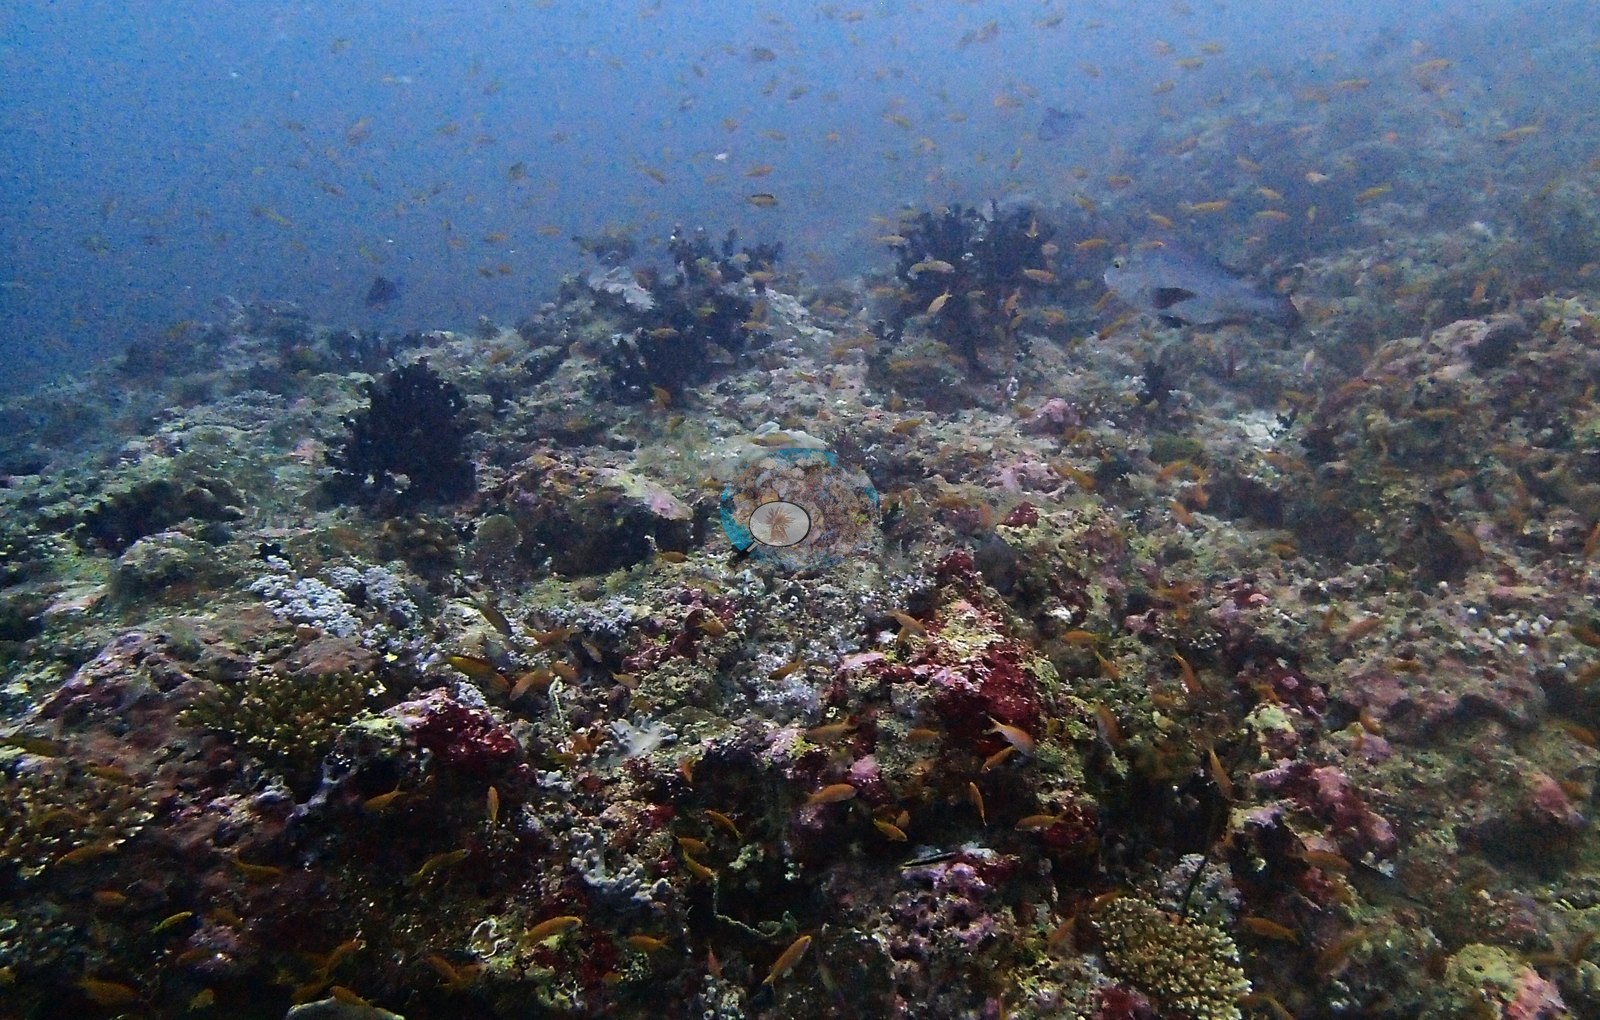
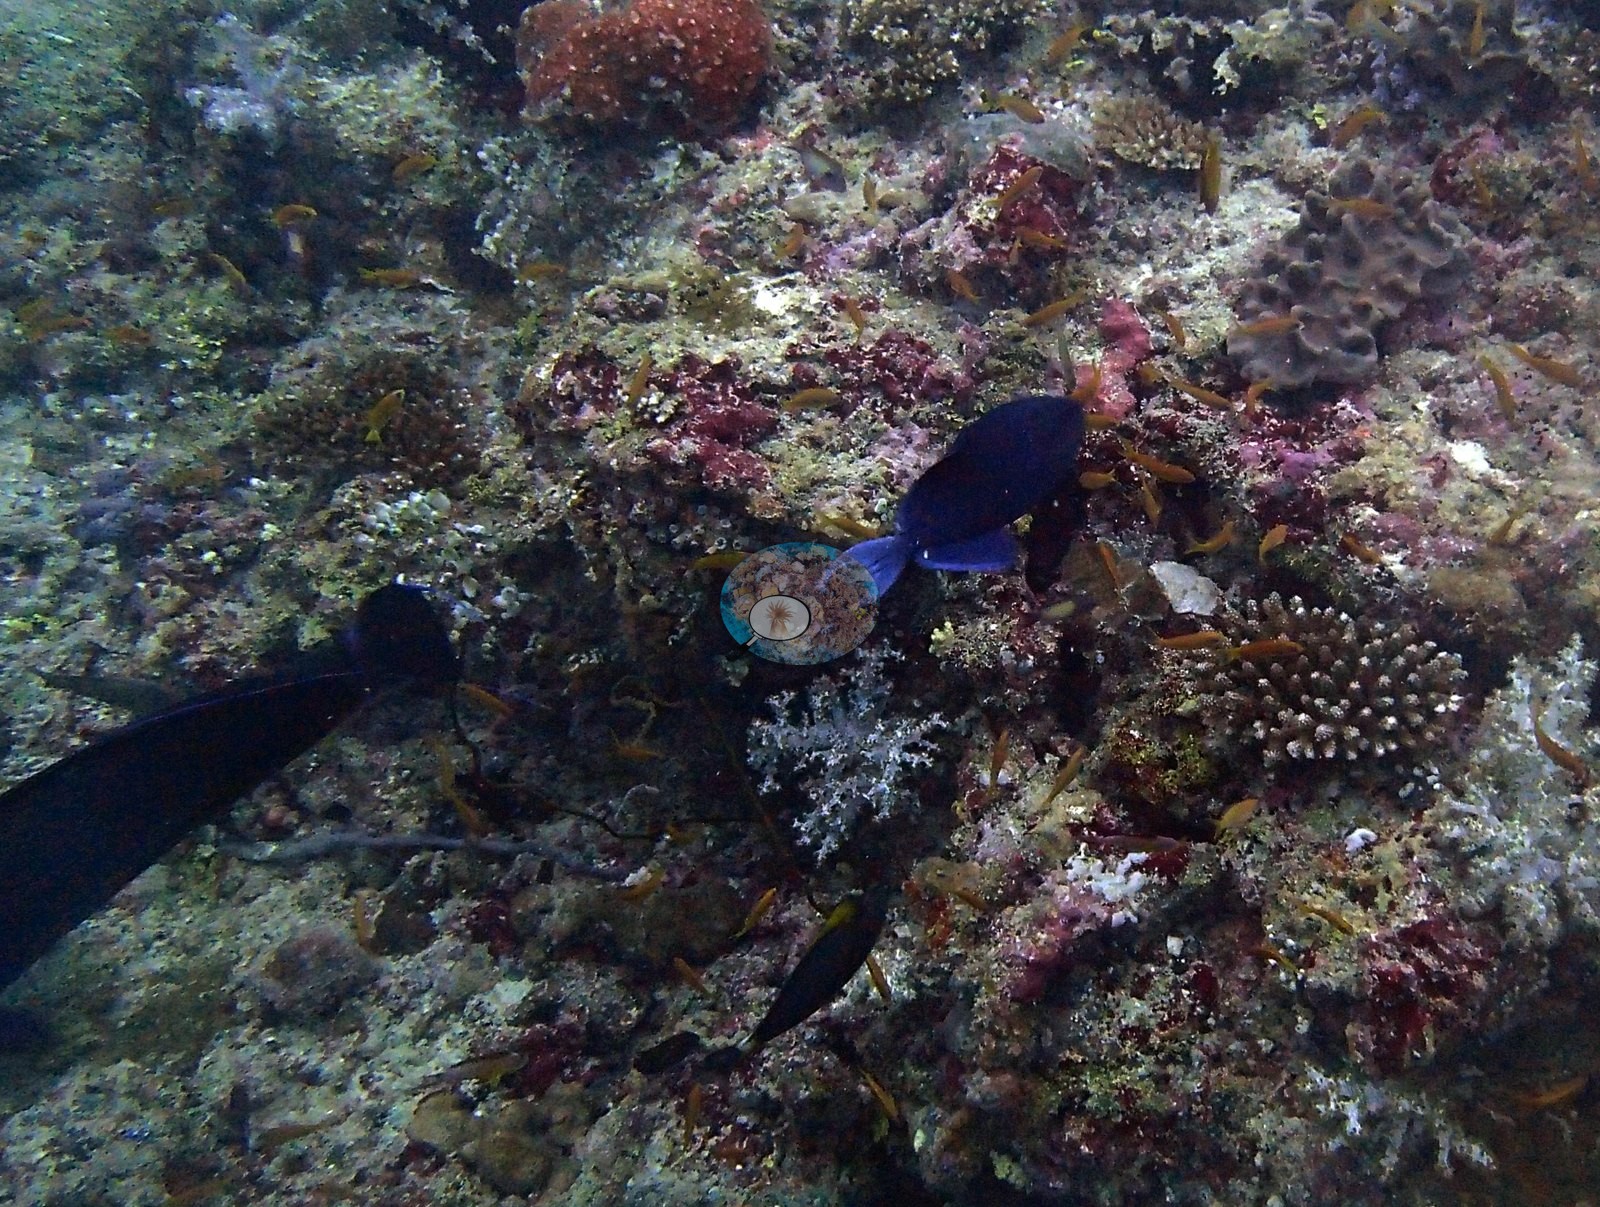
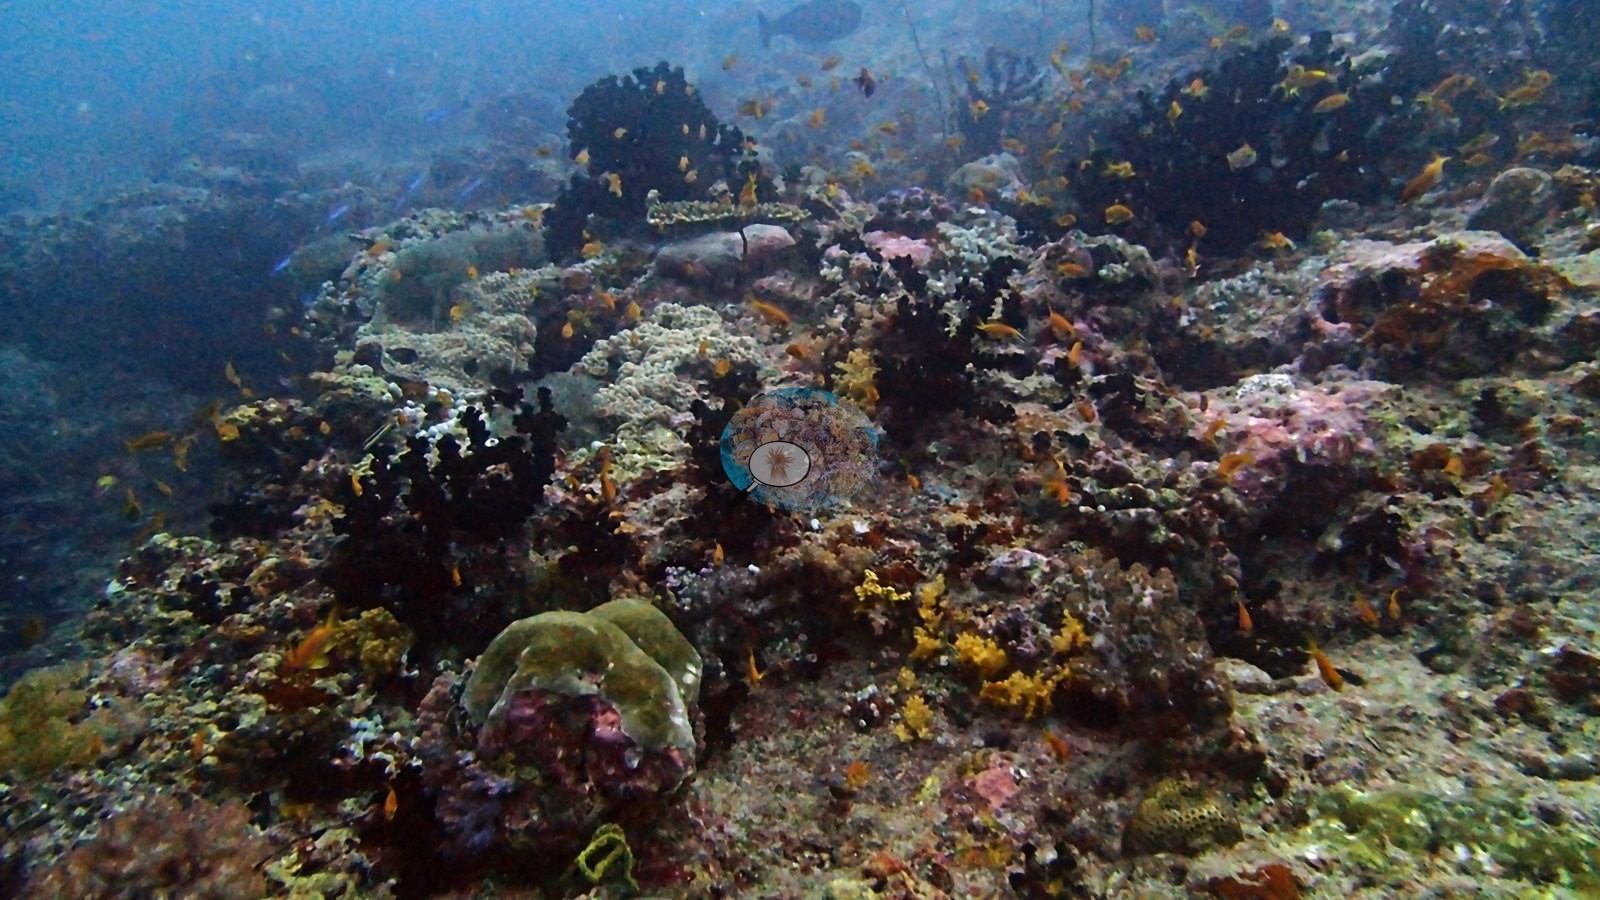
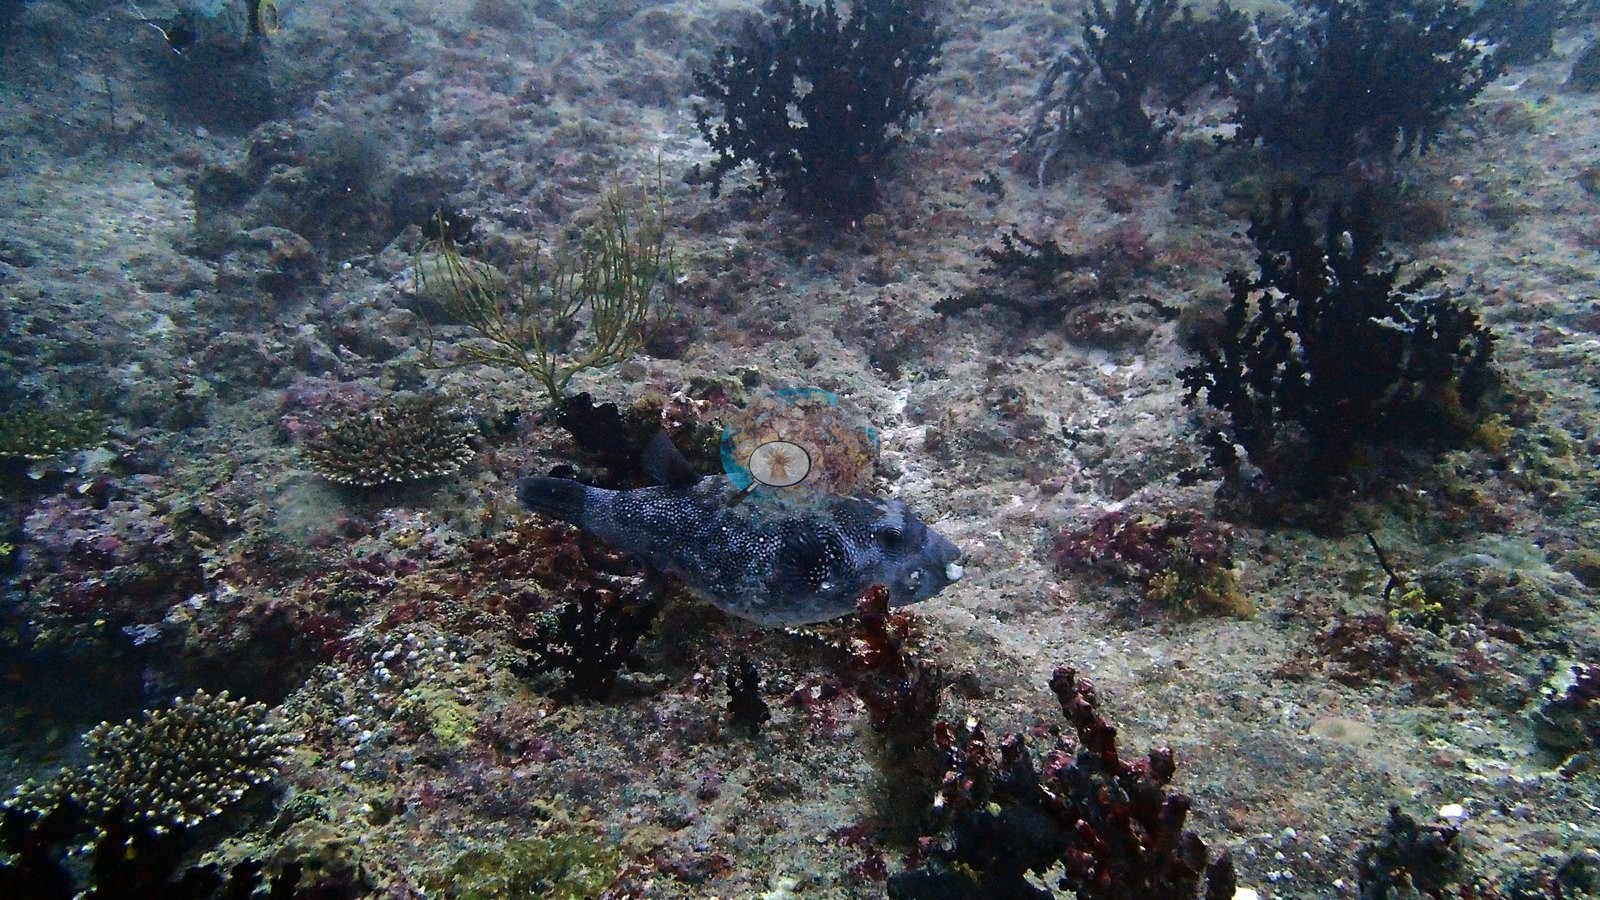
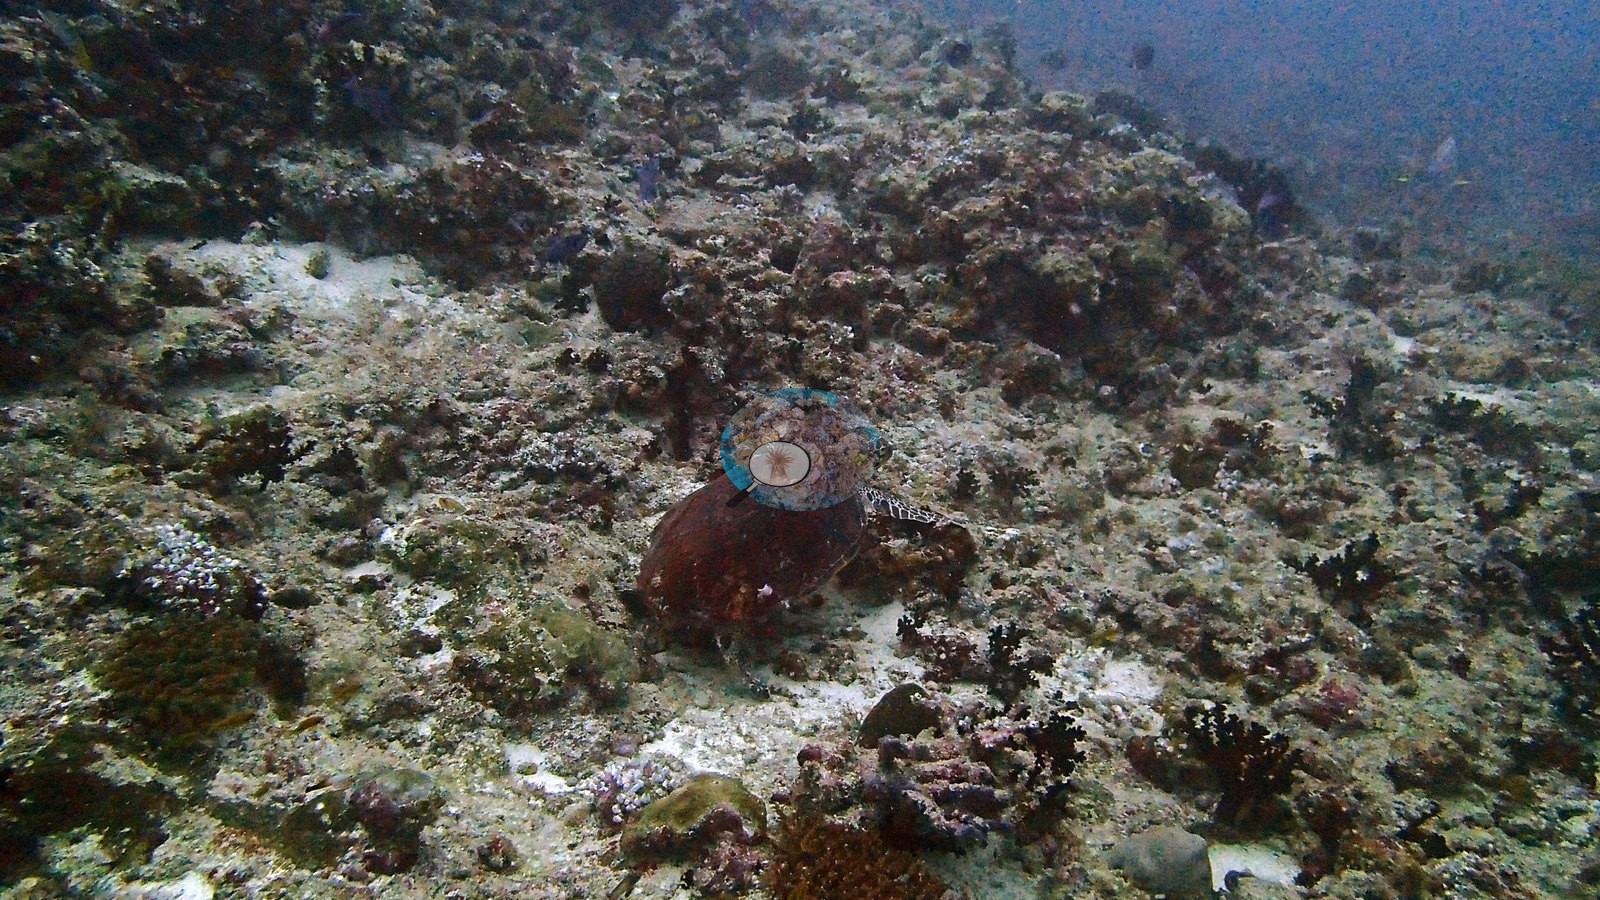
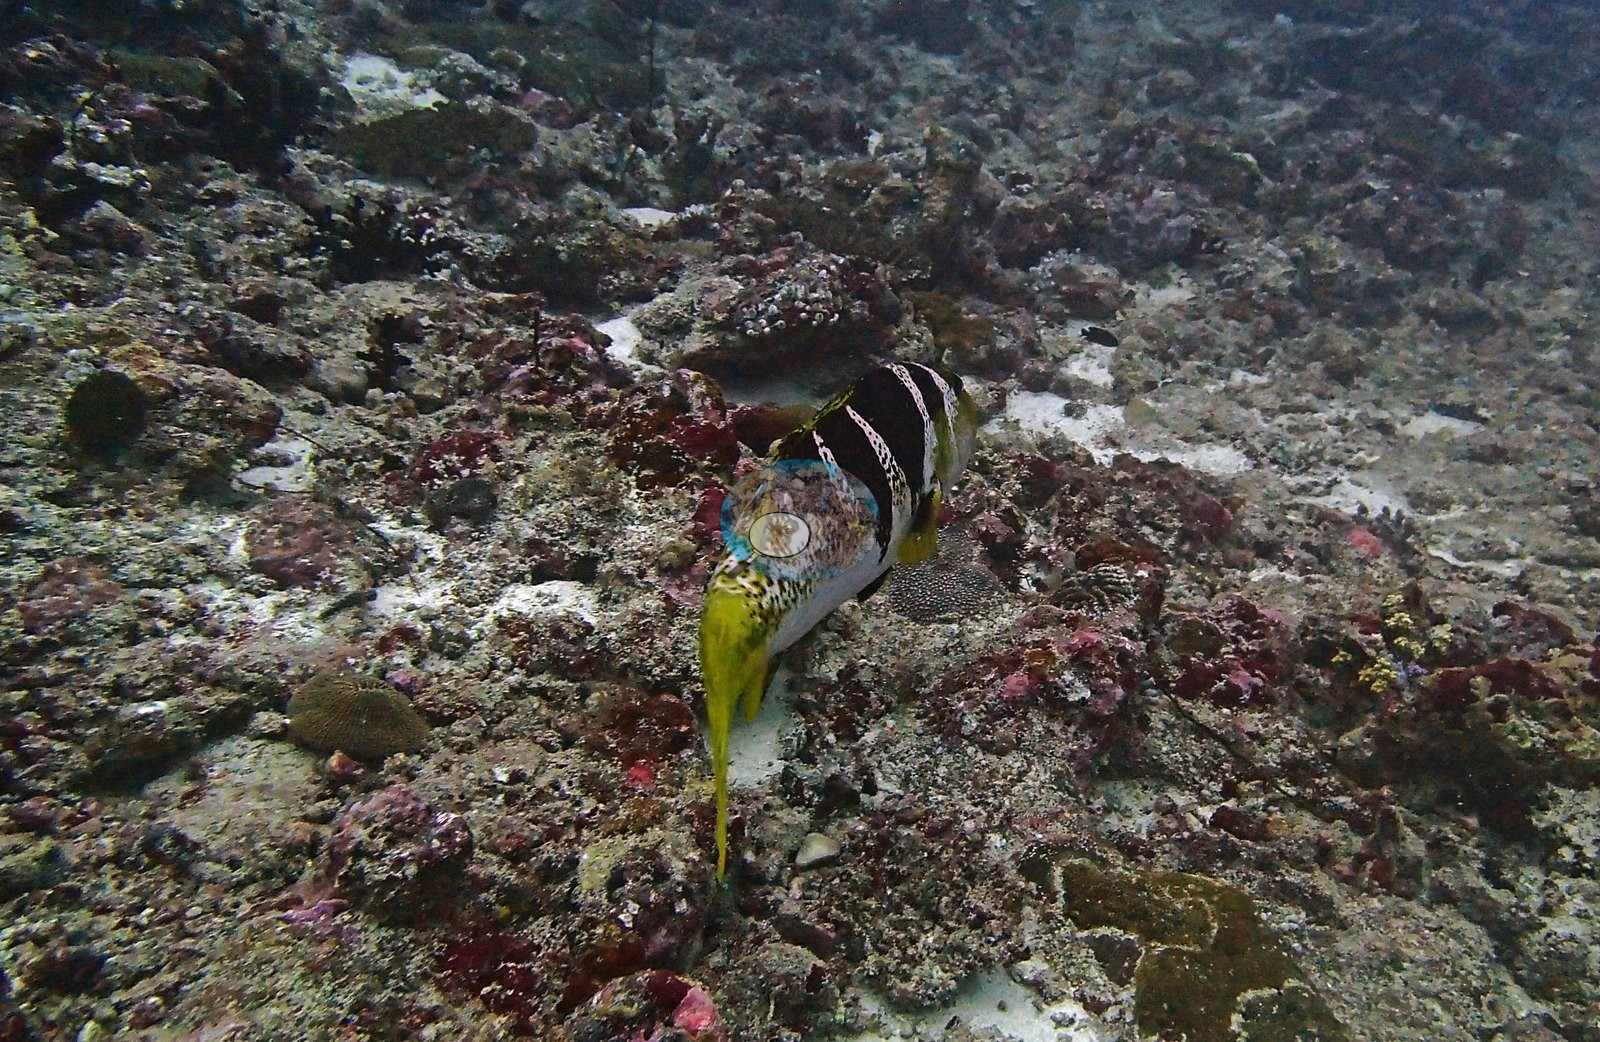
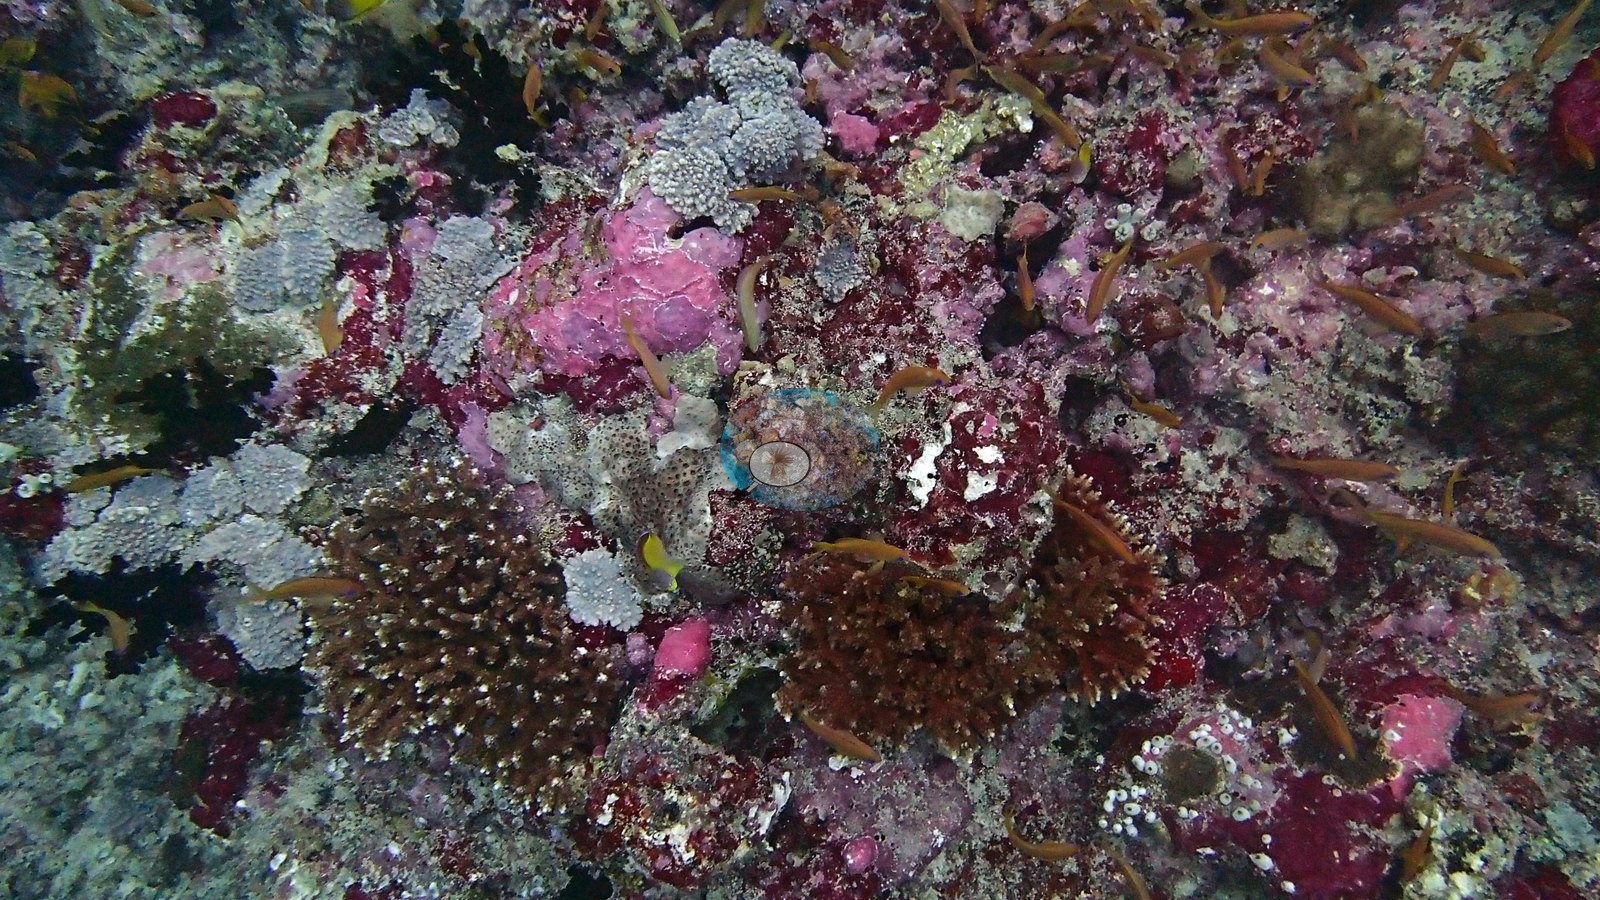
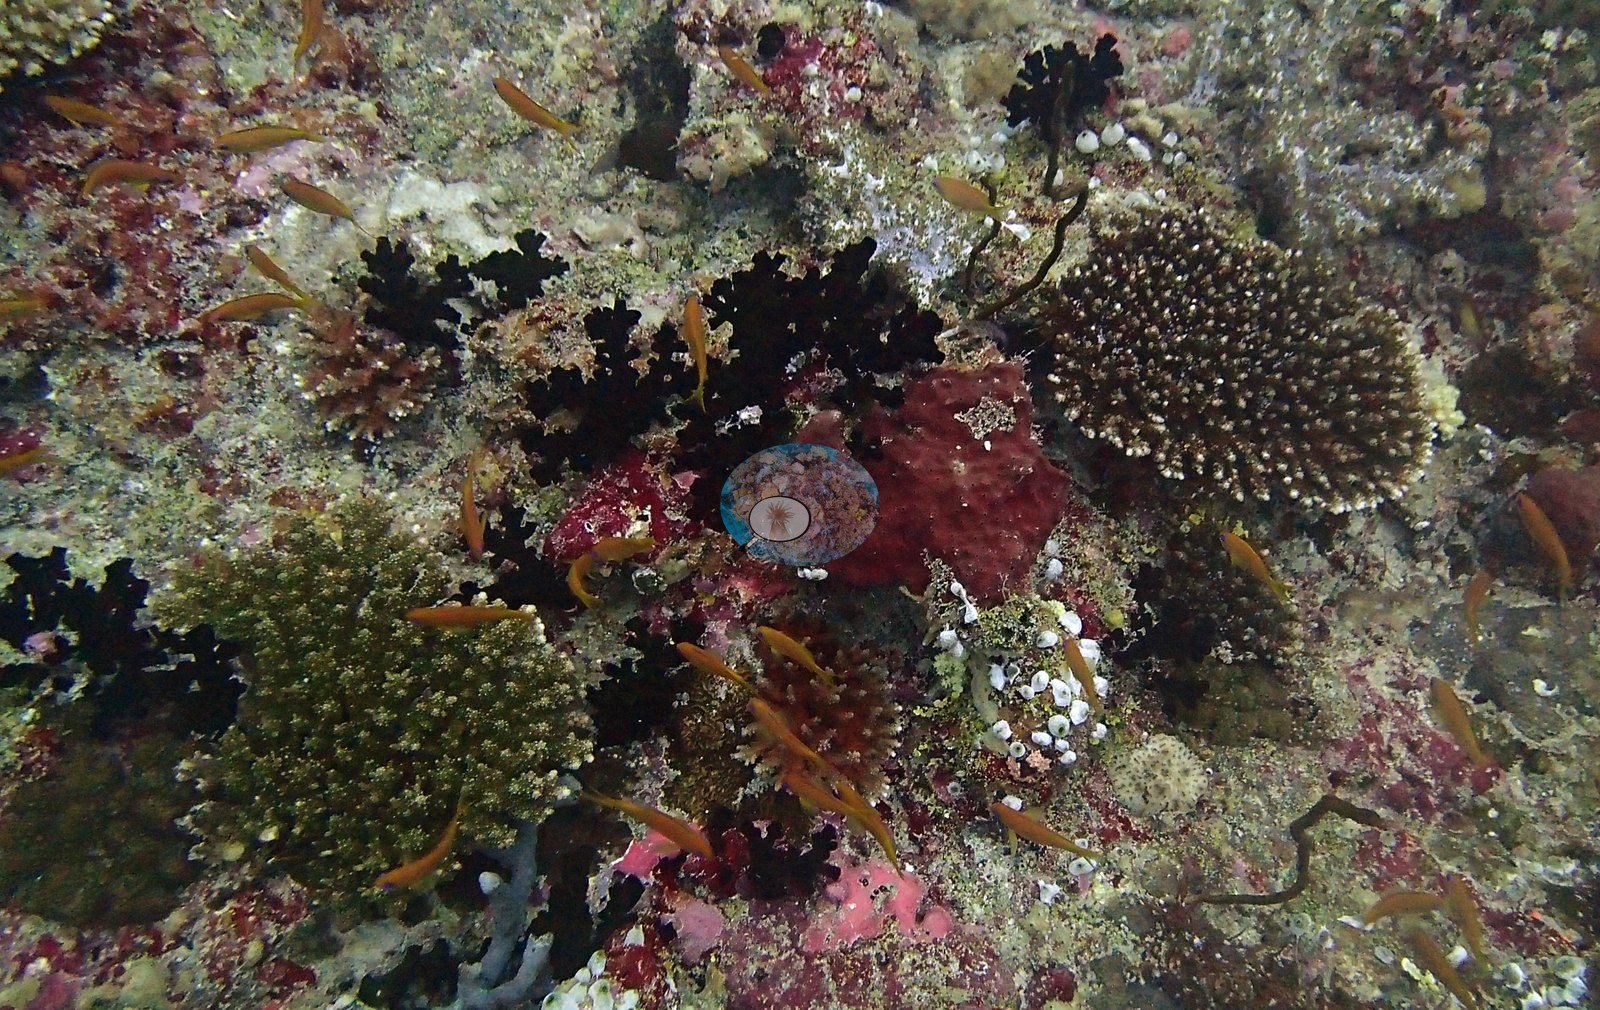
On the reef itself, pink coralline crusts and dark coral bushes frame the residents — a big turtle wedged in asleep, a striped oriental sweetlips with buttercup fins, a grumpy puffer parked between the branches, and a massive dome coral that has clearly seen decades of currents like today's (e.g., Image 9, Image 12, Image 14, Image 15, Image 16, Image 18, Image 21).
Coral cover
Coral cover: 10% — photo-derived, and the two methods broadly agree (13% vs 7.3%). This site's figure is the mean of two independent computer vision passes over Anderson's own frames: a DINOv3 calibrated point classifier reads 13.2% and a CoralSCOP computer vision reads 7.3%, a spread of 5.9 percentage points. The map publishes the mean so sites can be sorted against one another, but the honest statement of what is known here is the 7.3–13% range: the two products have different denominators and should not be treated as one measurement. He is actively comparing CoralSCOP and DINOv3 against newer CV models and will swap in an updated figure here once a more reliable model is found.
Stressors
No crown-of-thorns starfish (COTS) or other corallivores evident.
Fish and other fauna
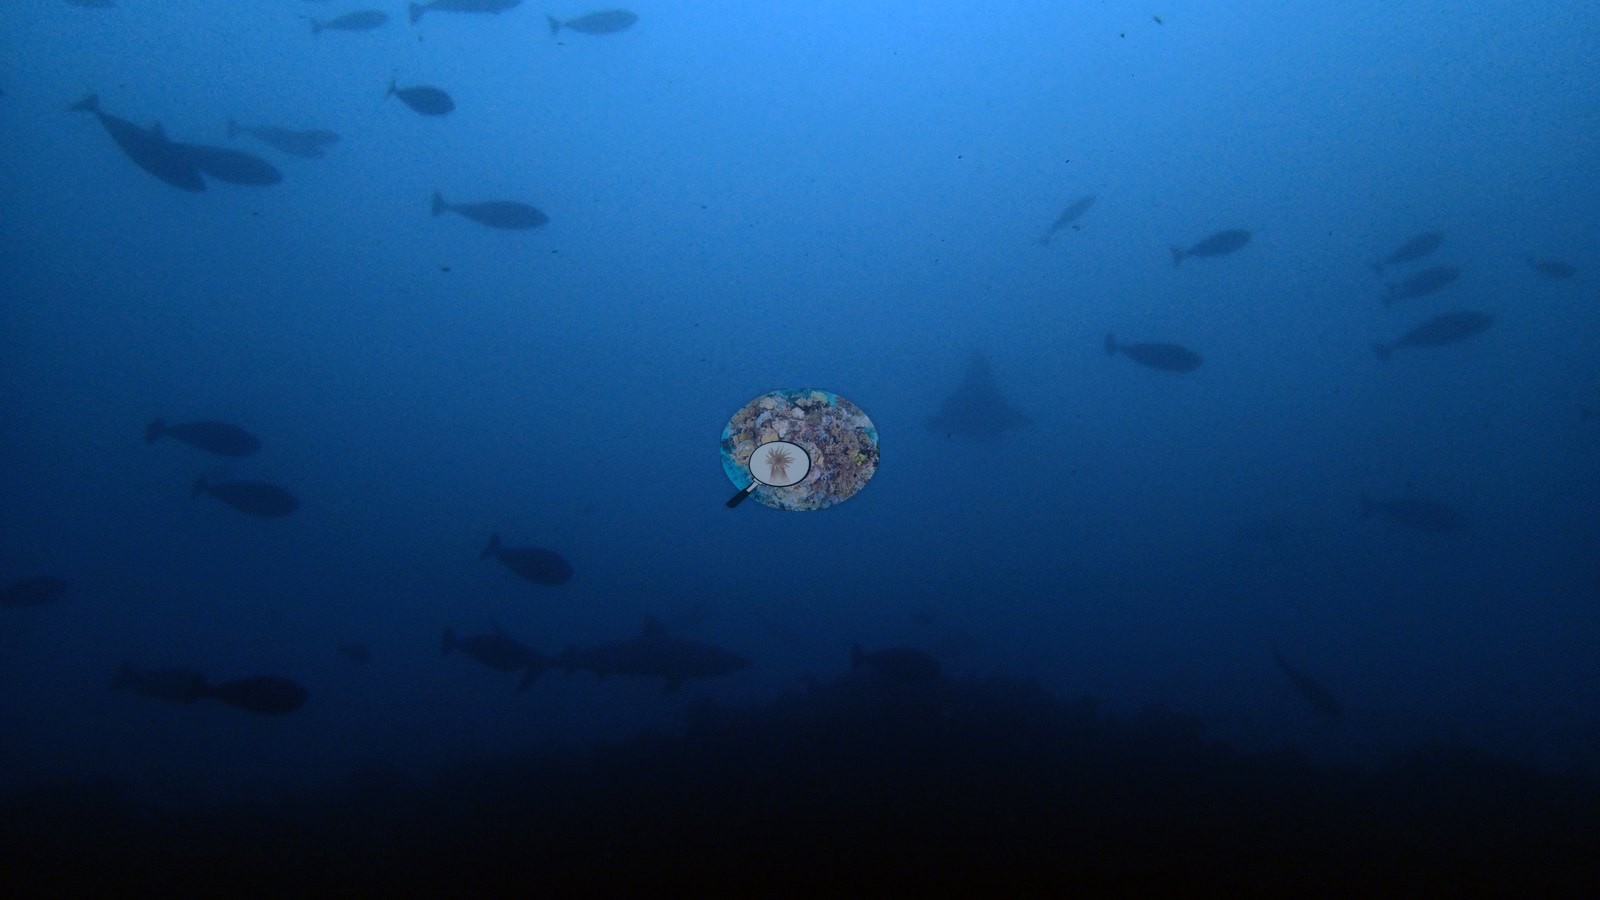
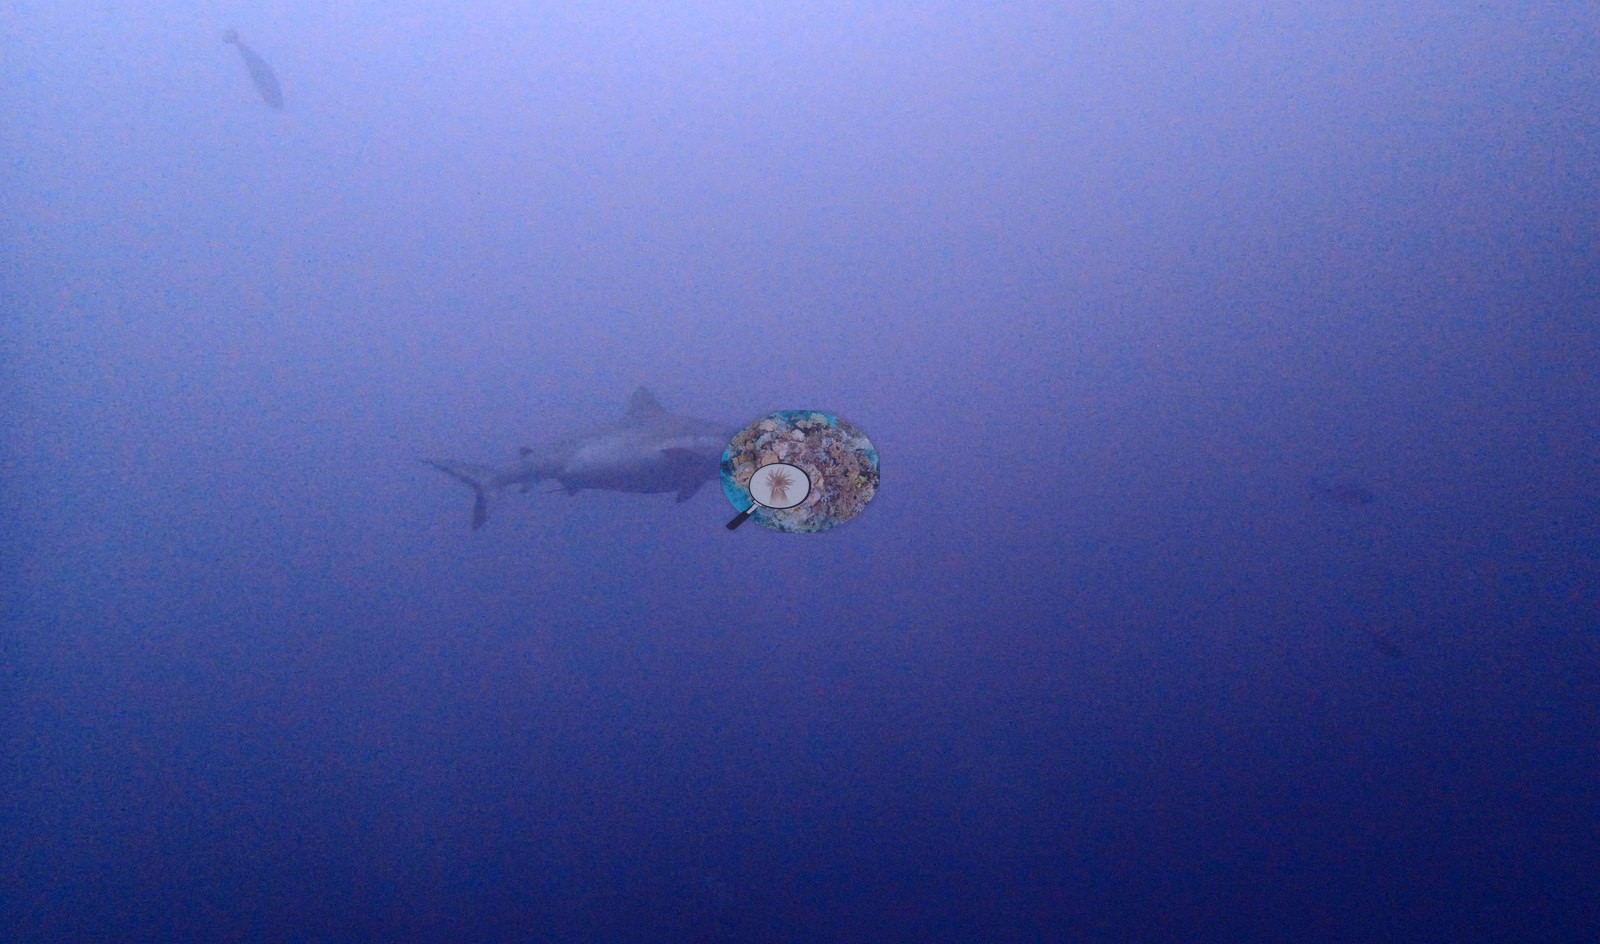
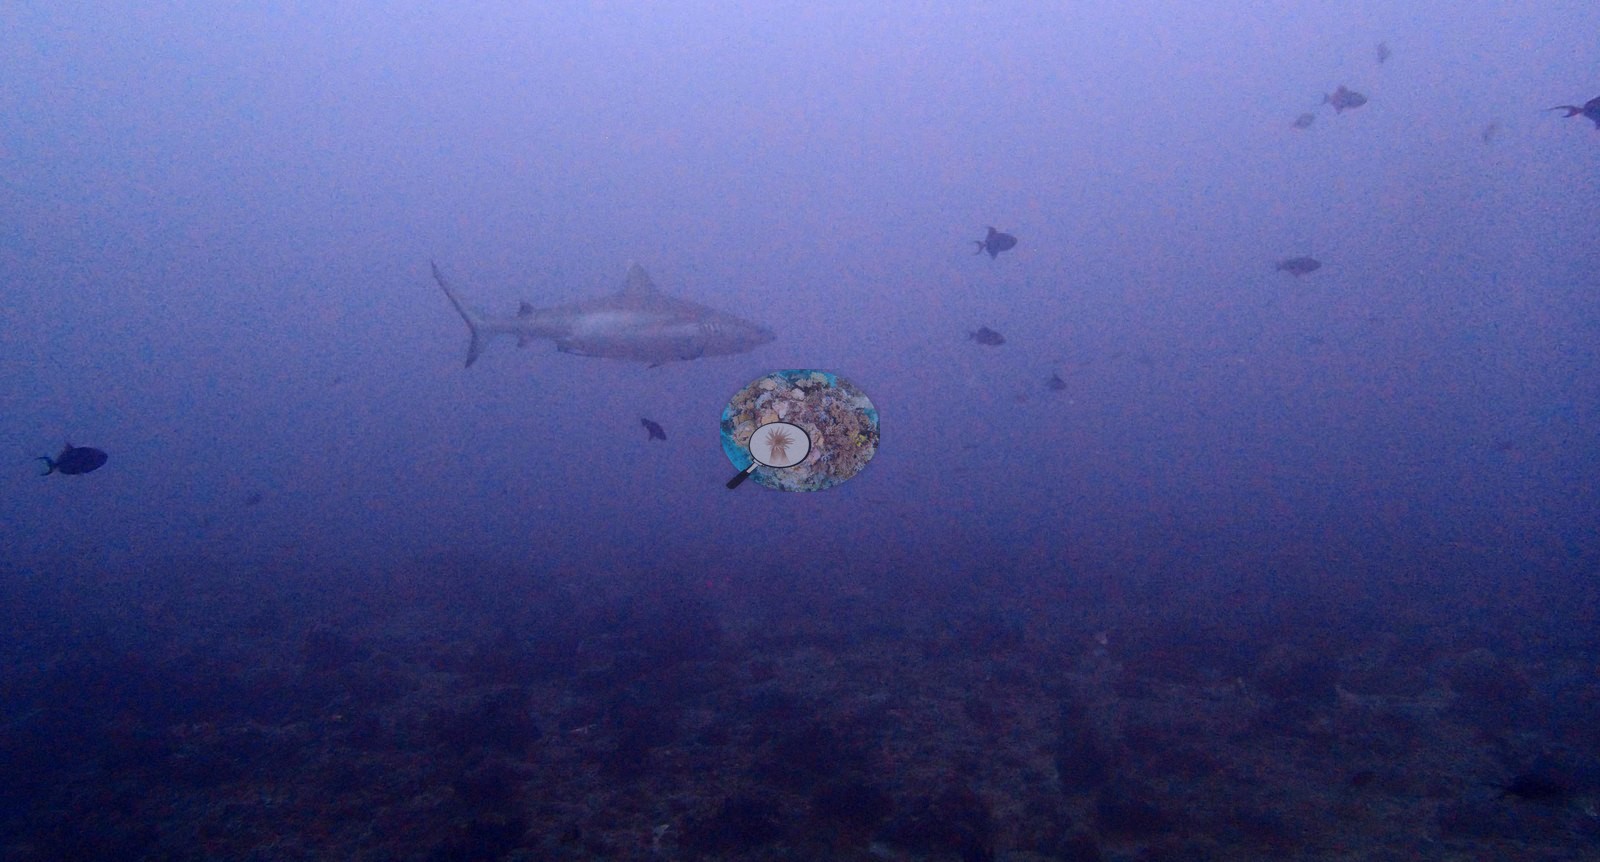
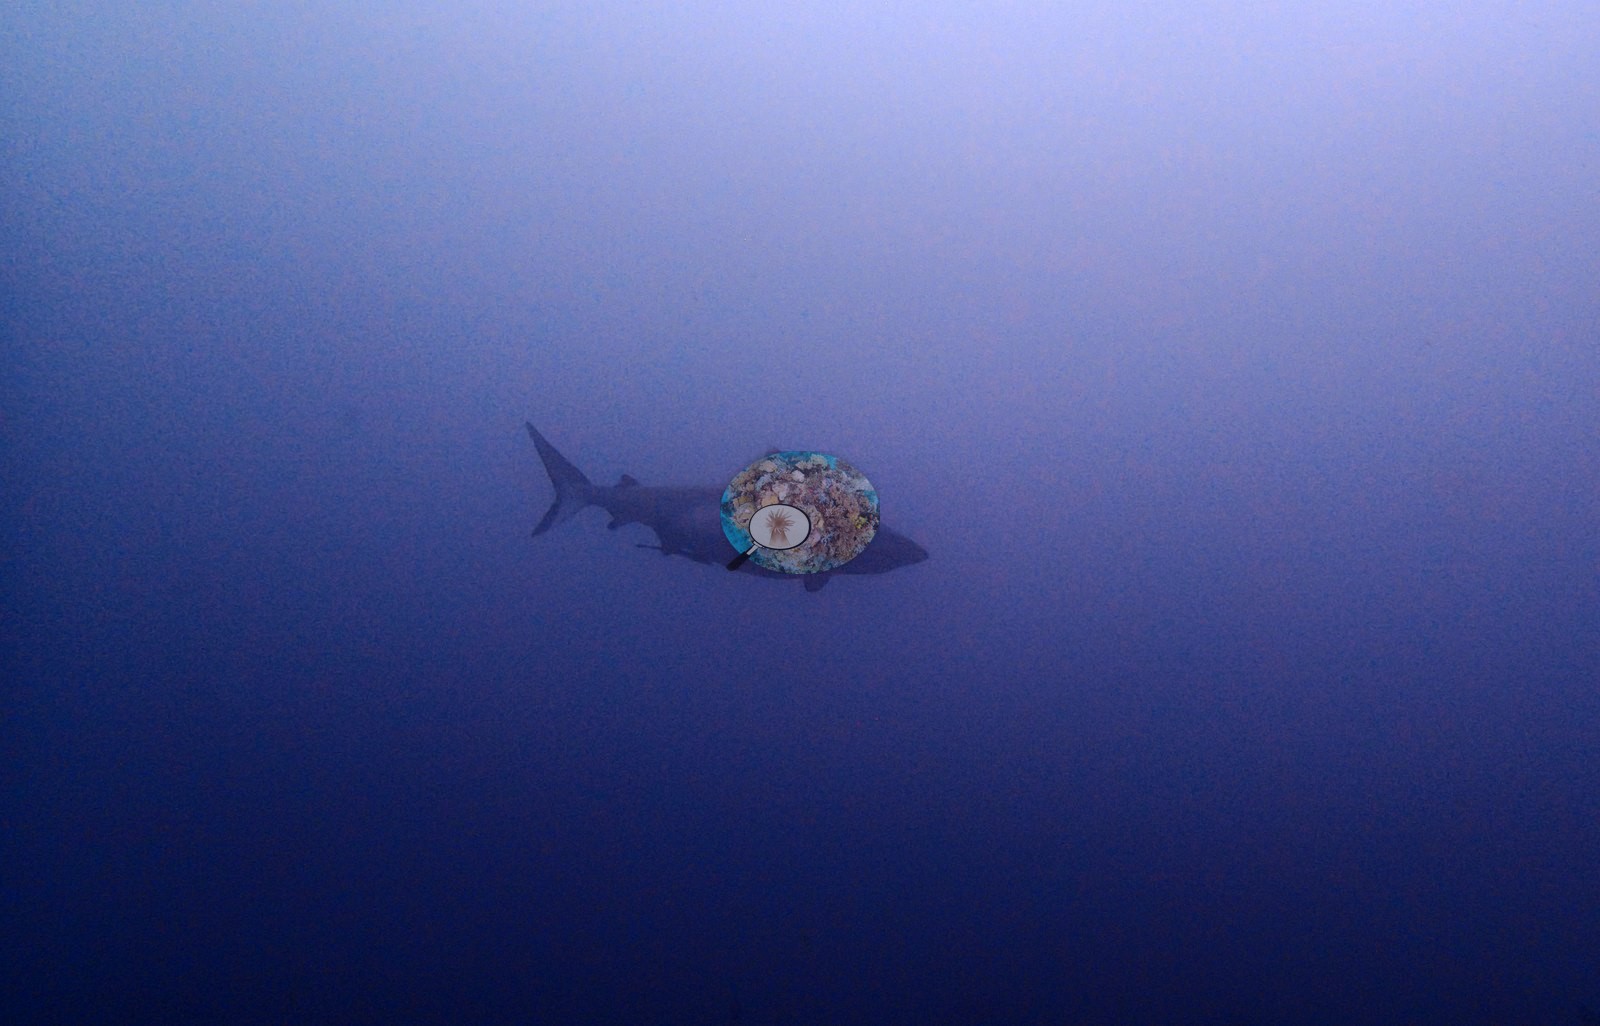
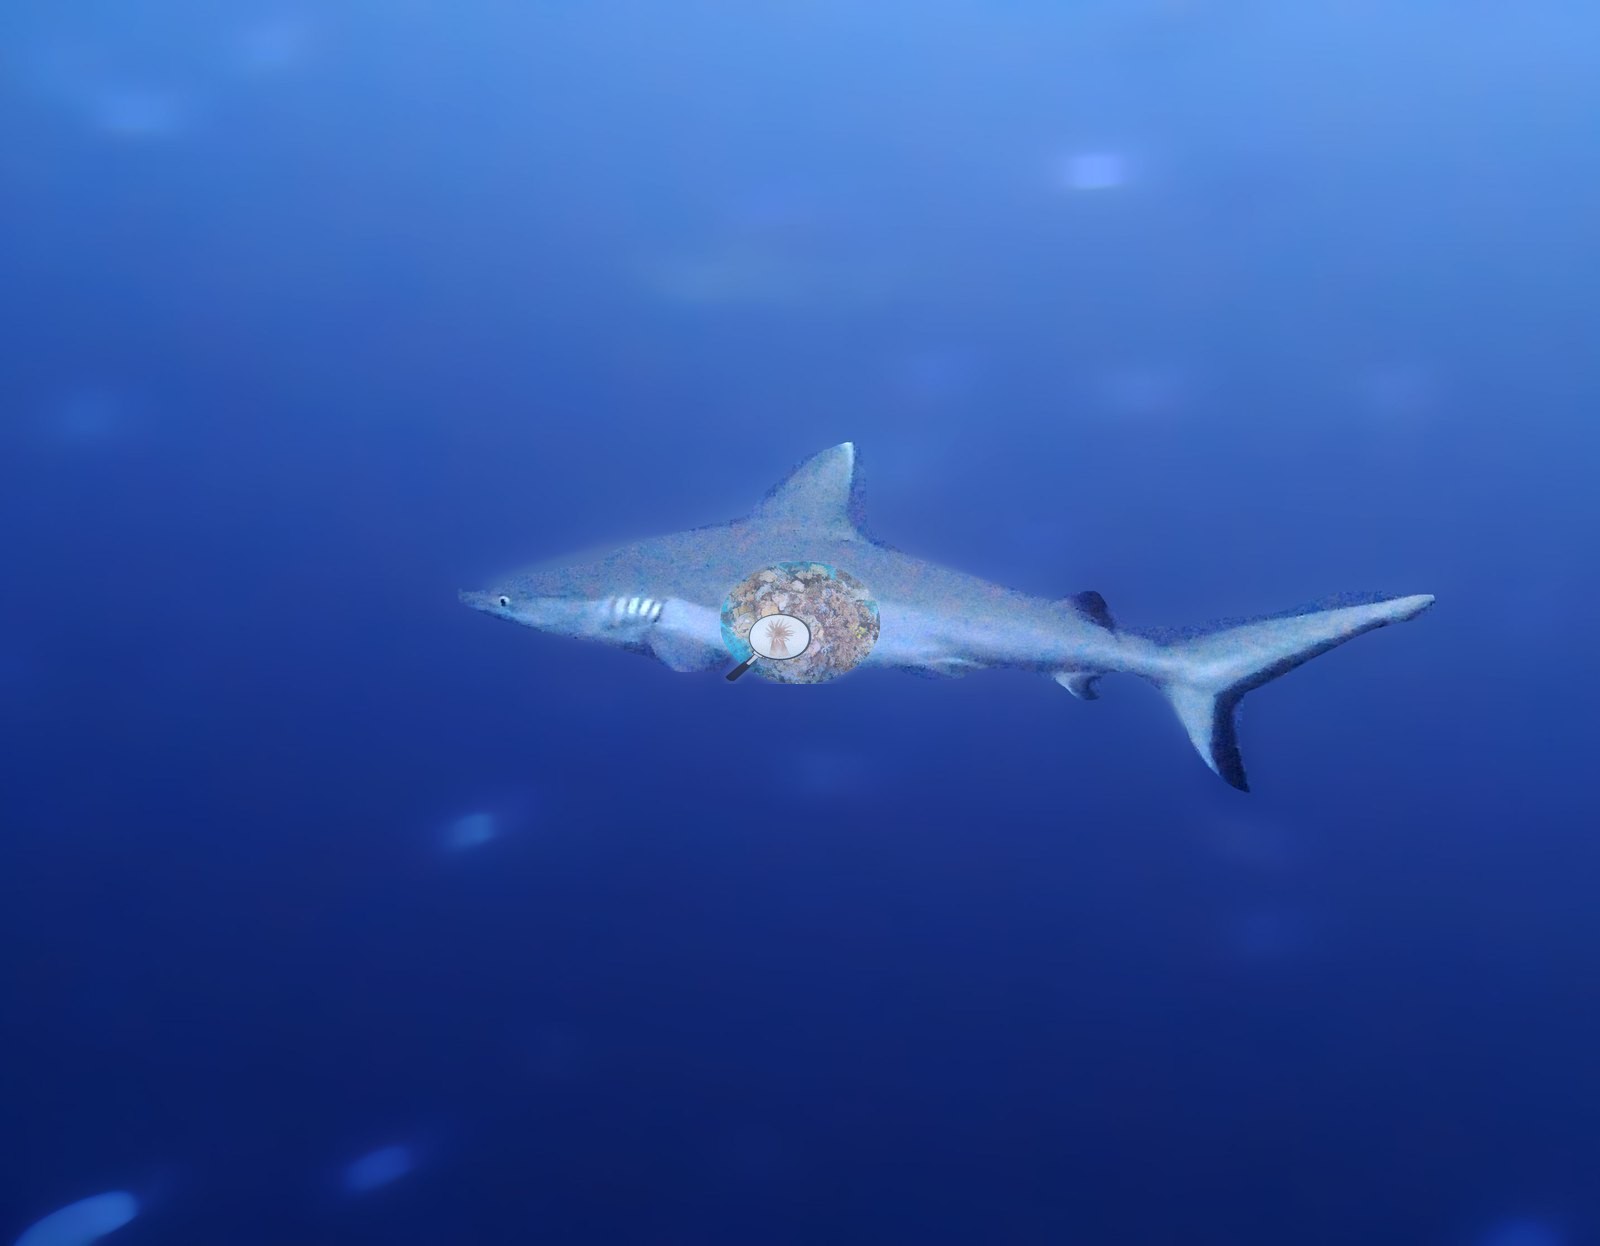
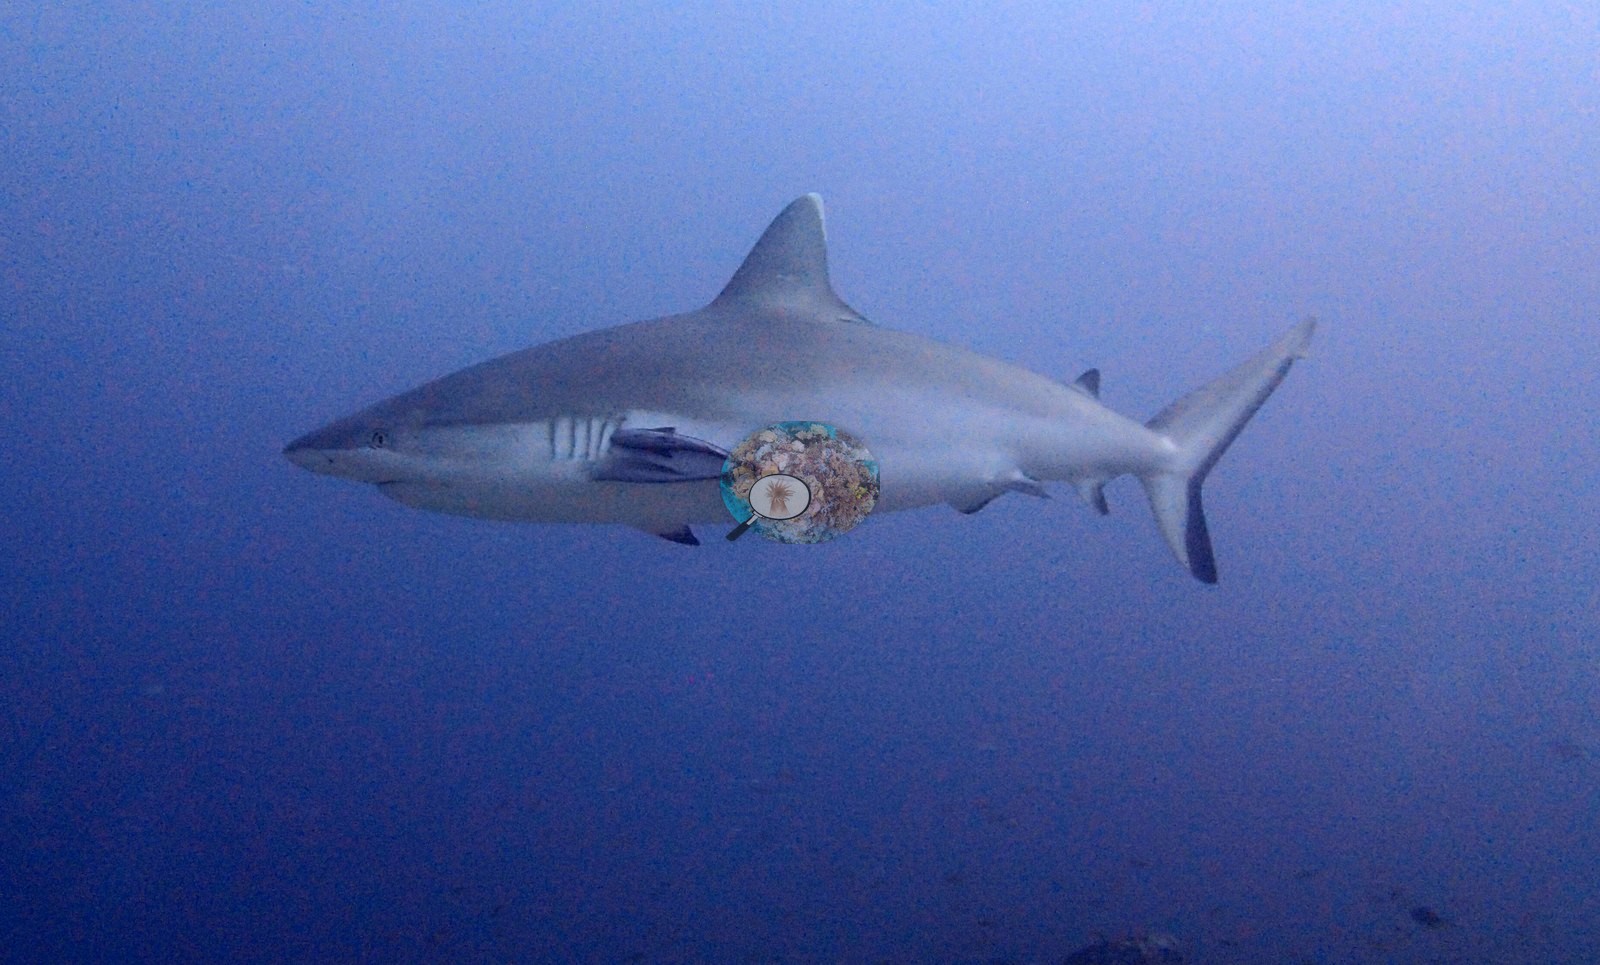
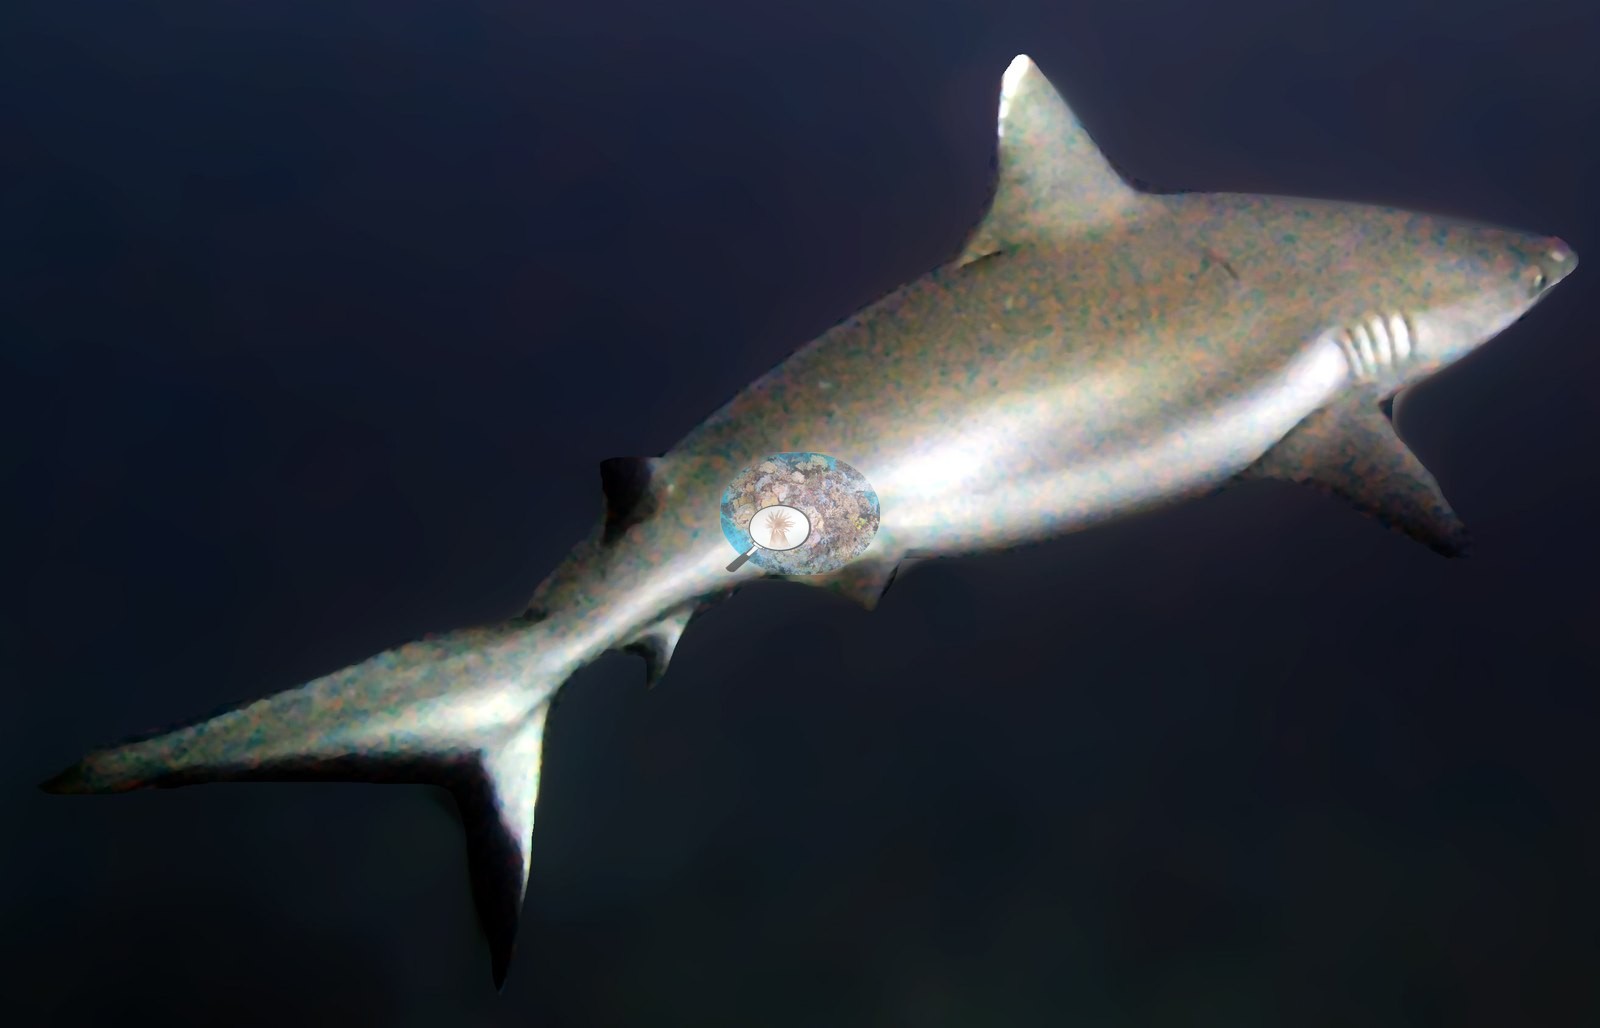
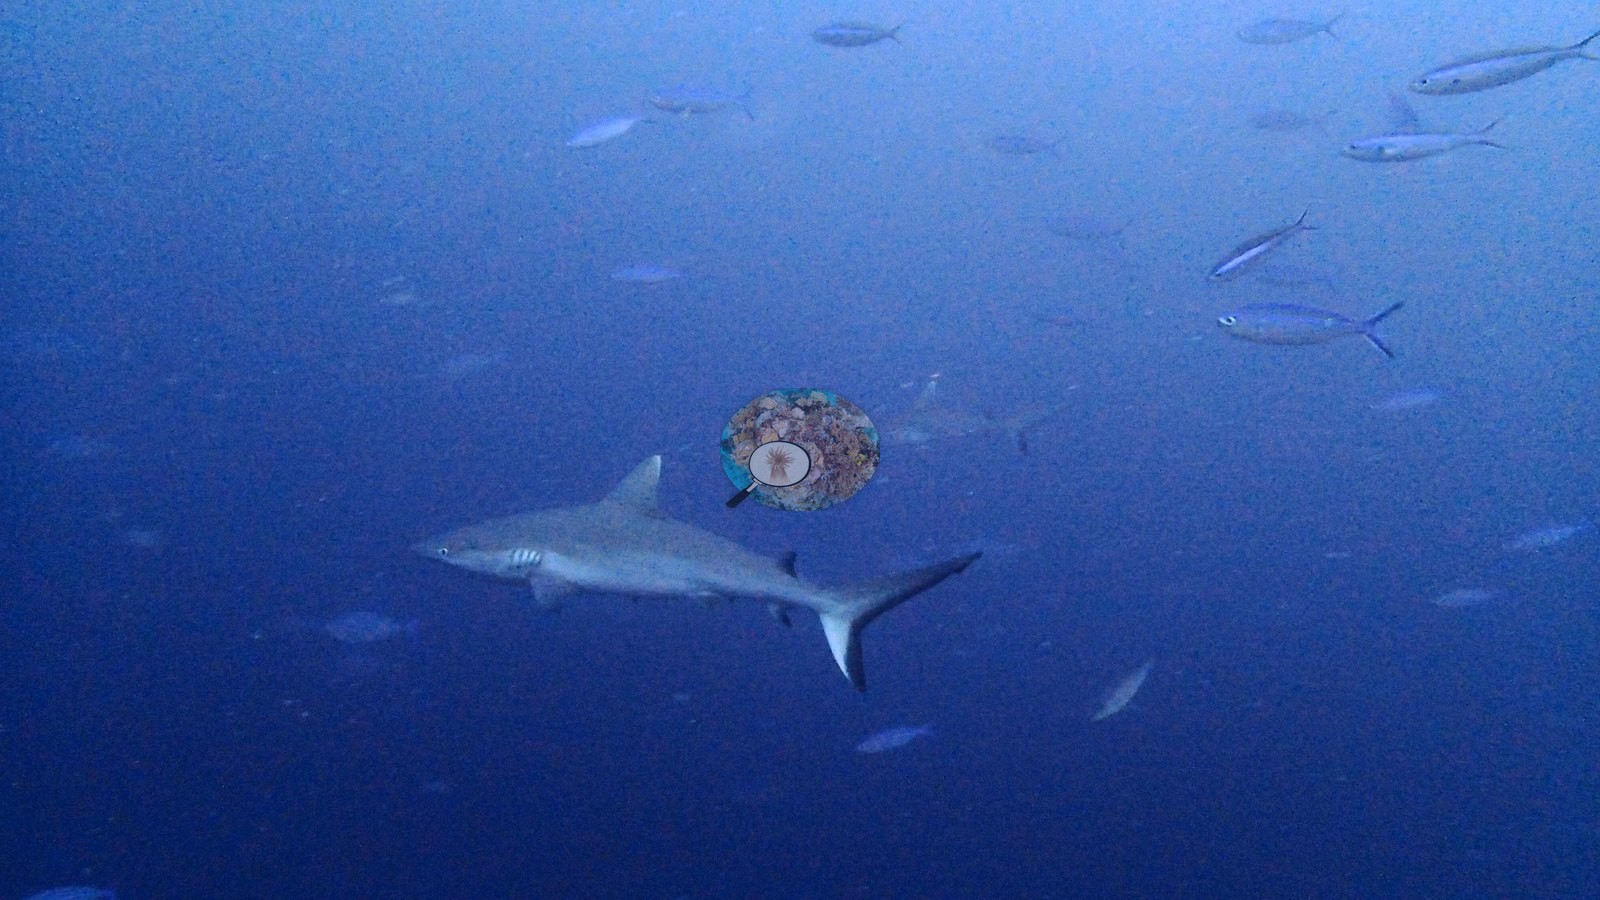
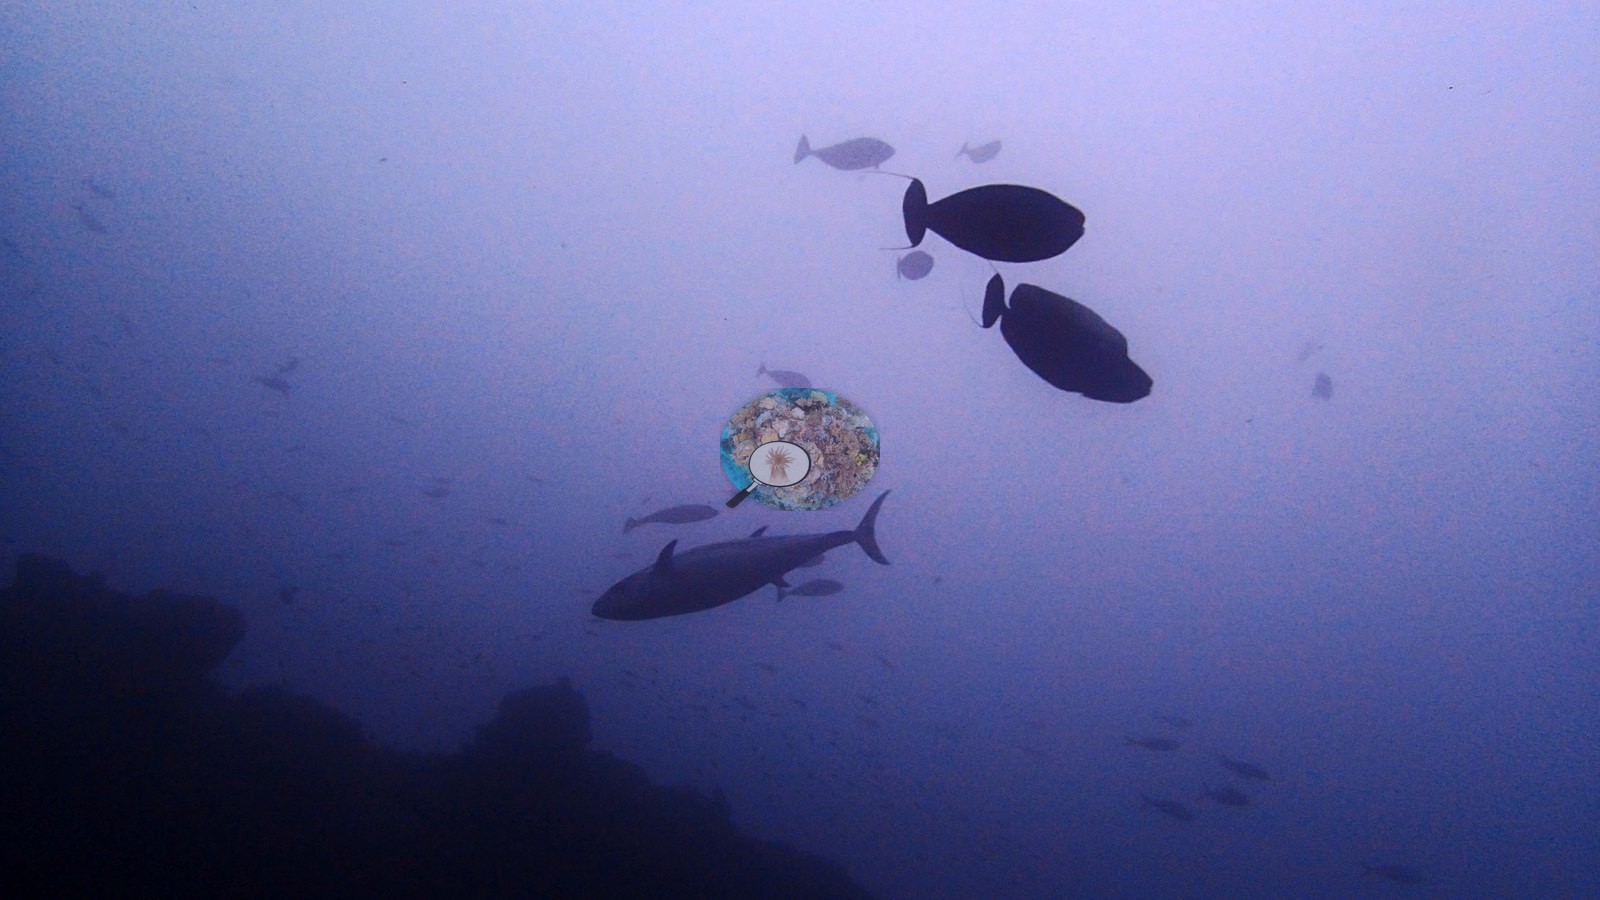
Two dives here — one at first light, one in afternoon glass — produced a parade of gray reef sharks, from hazy dawn silhouettes to a spotlight-crisp frontal pass, one shark trailing a retinue of little jacks (e.g., Image 4, Image 5, Image 22, Image 10, Image 24, Image 25, Image 11).
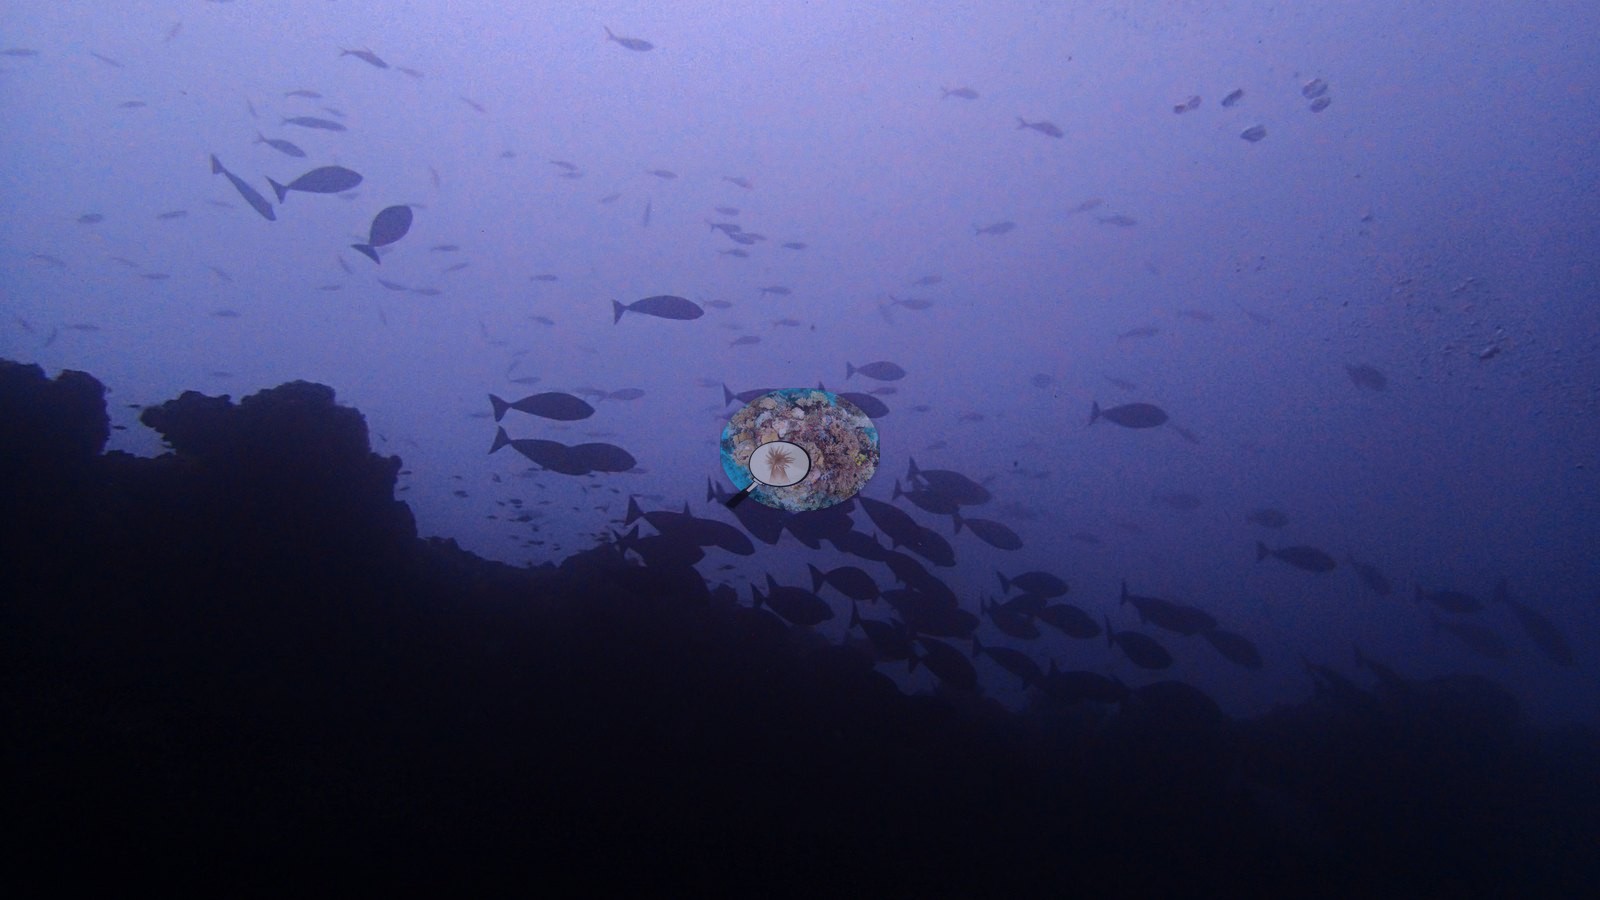
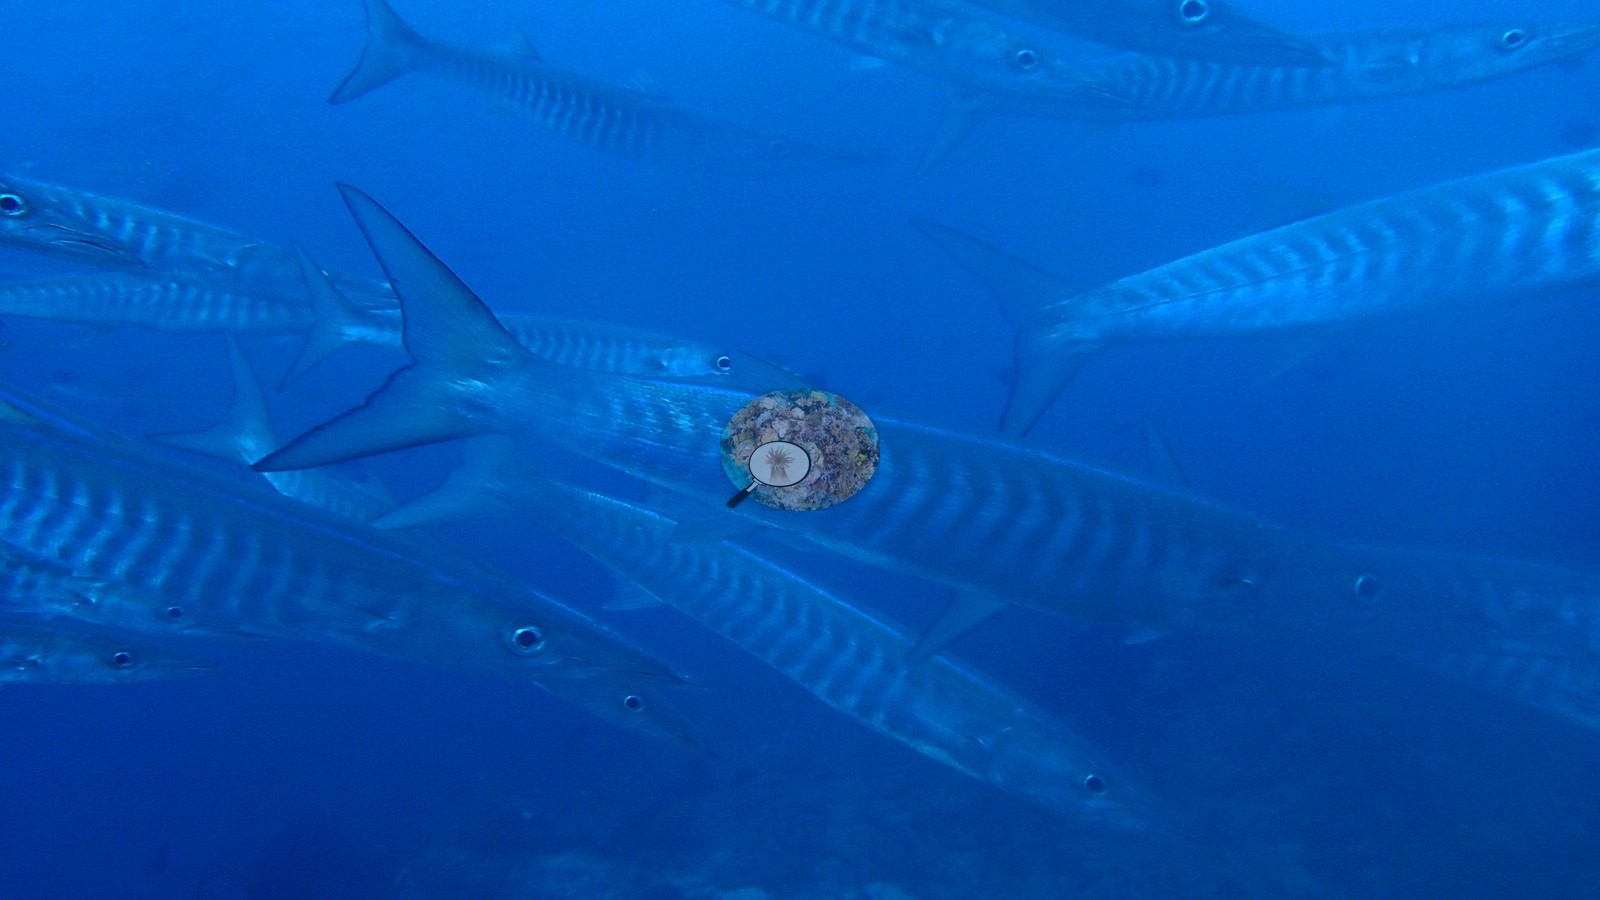
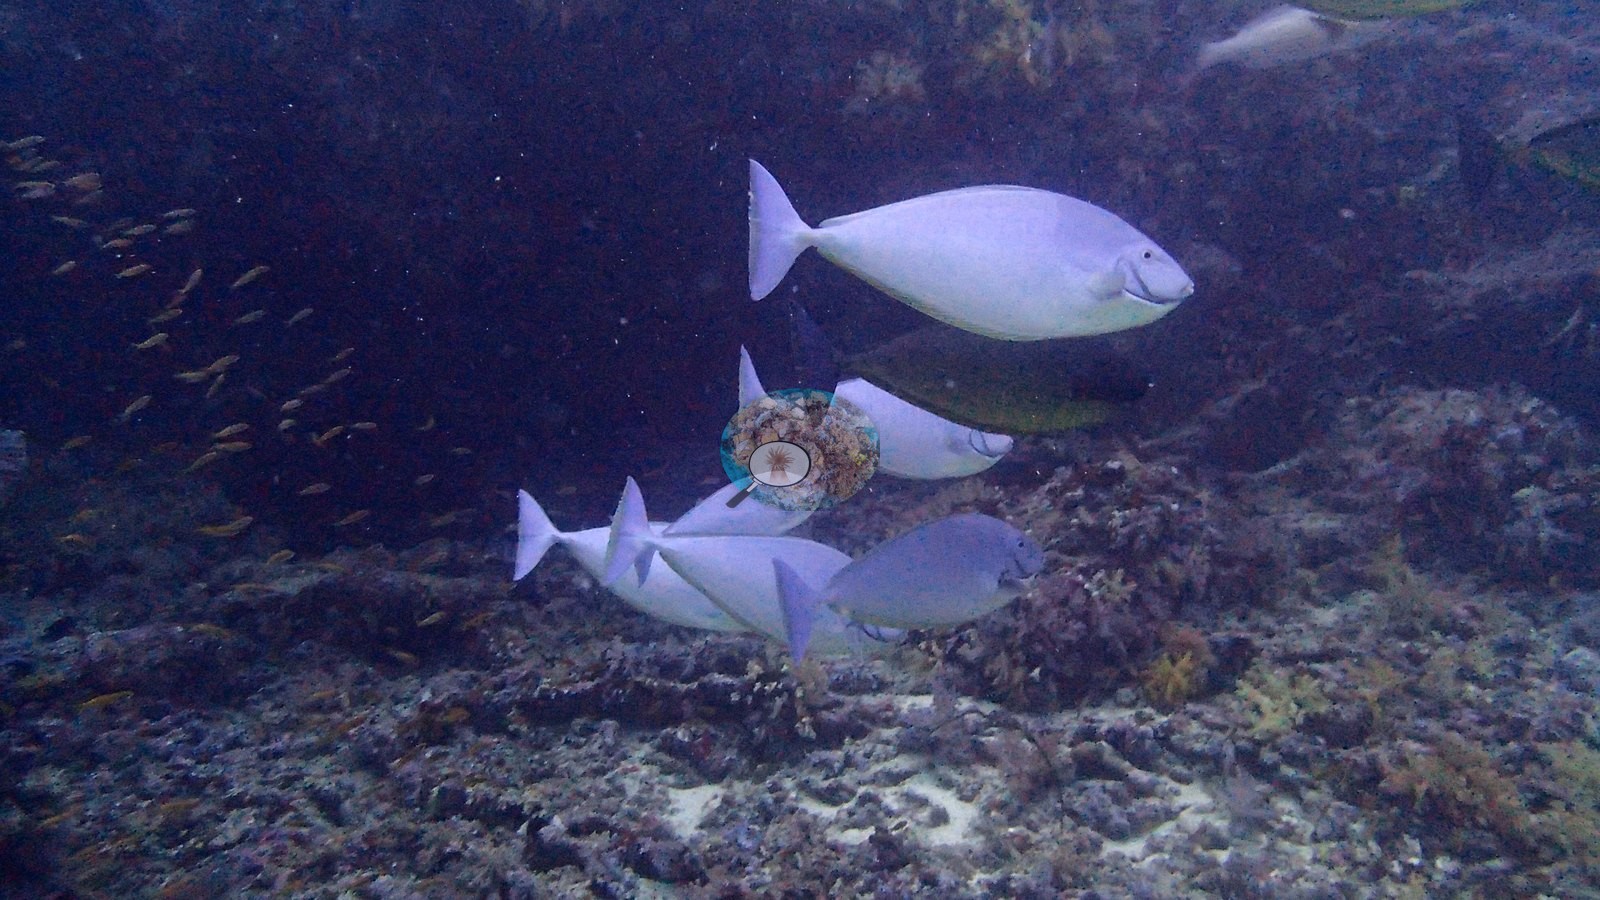
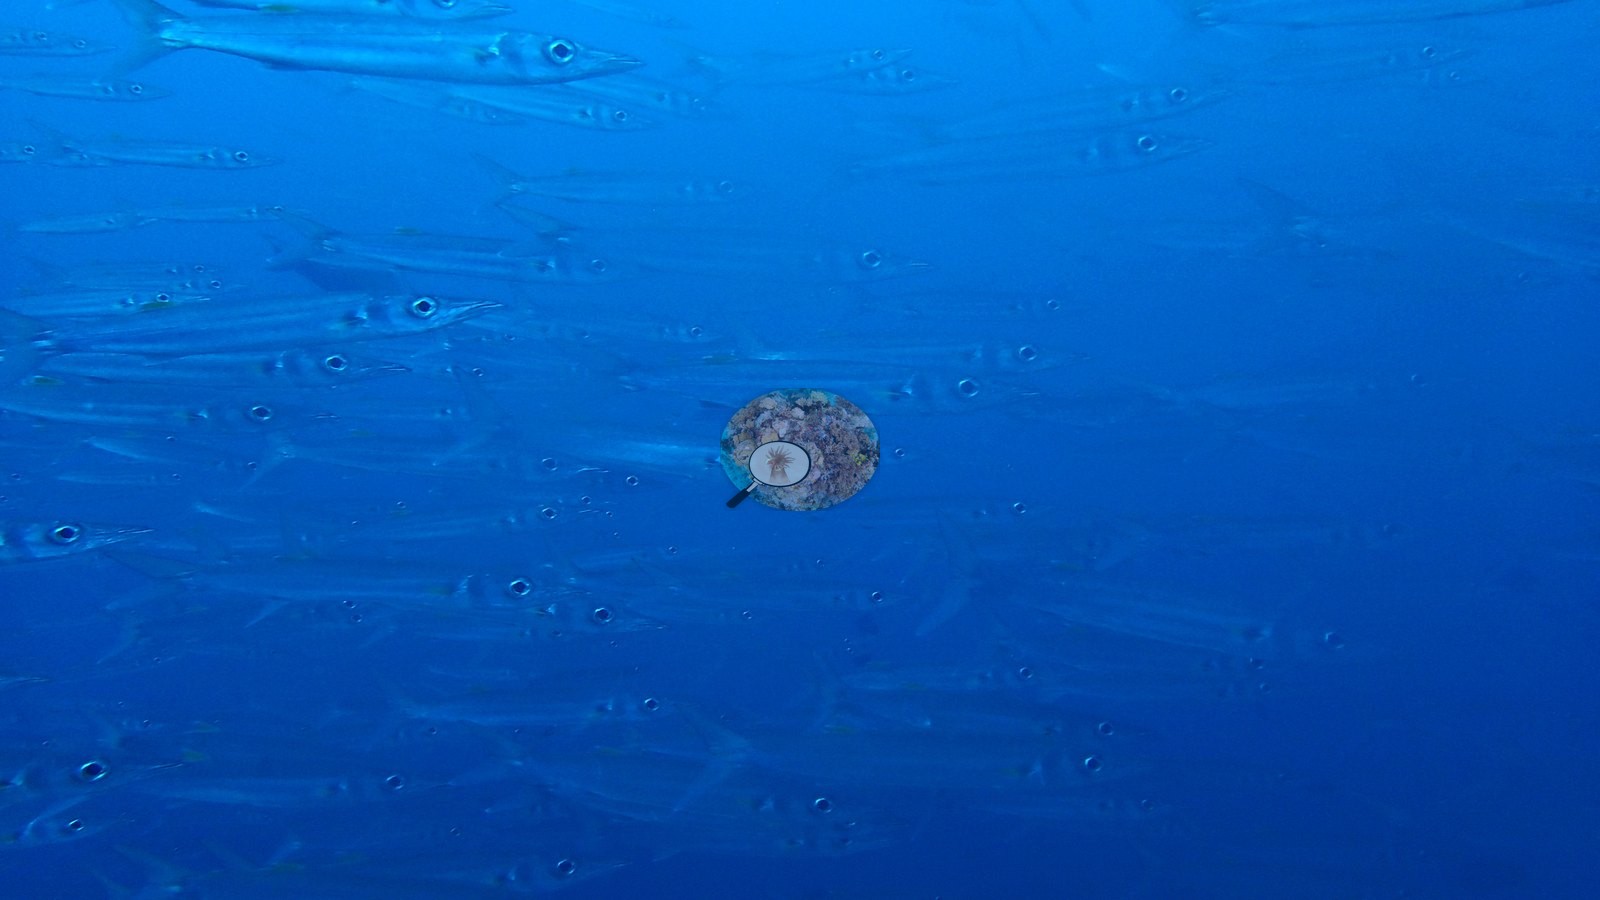
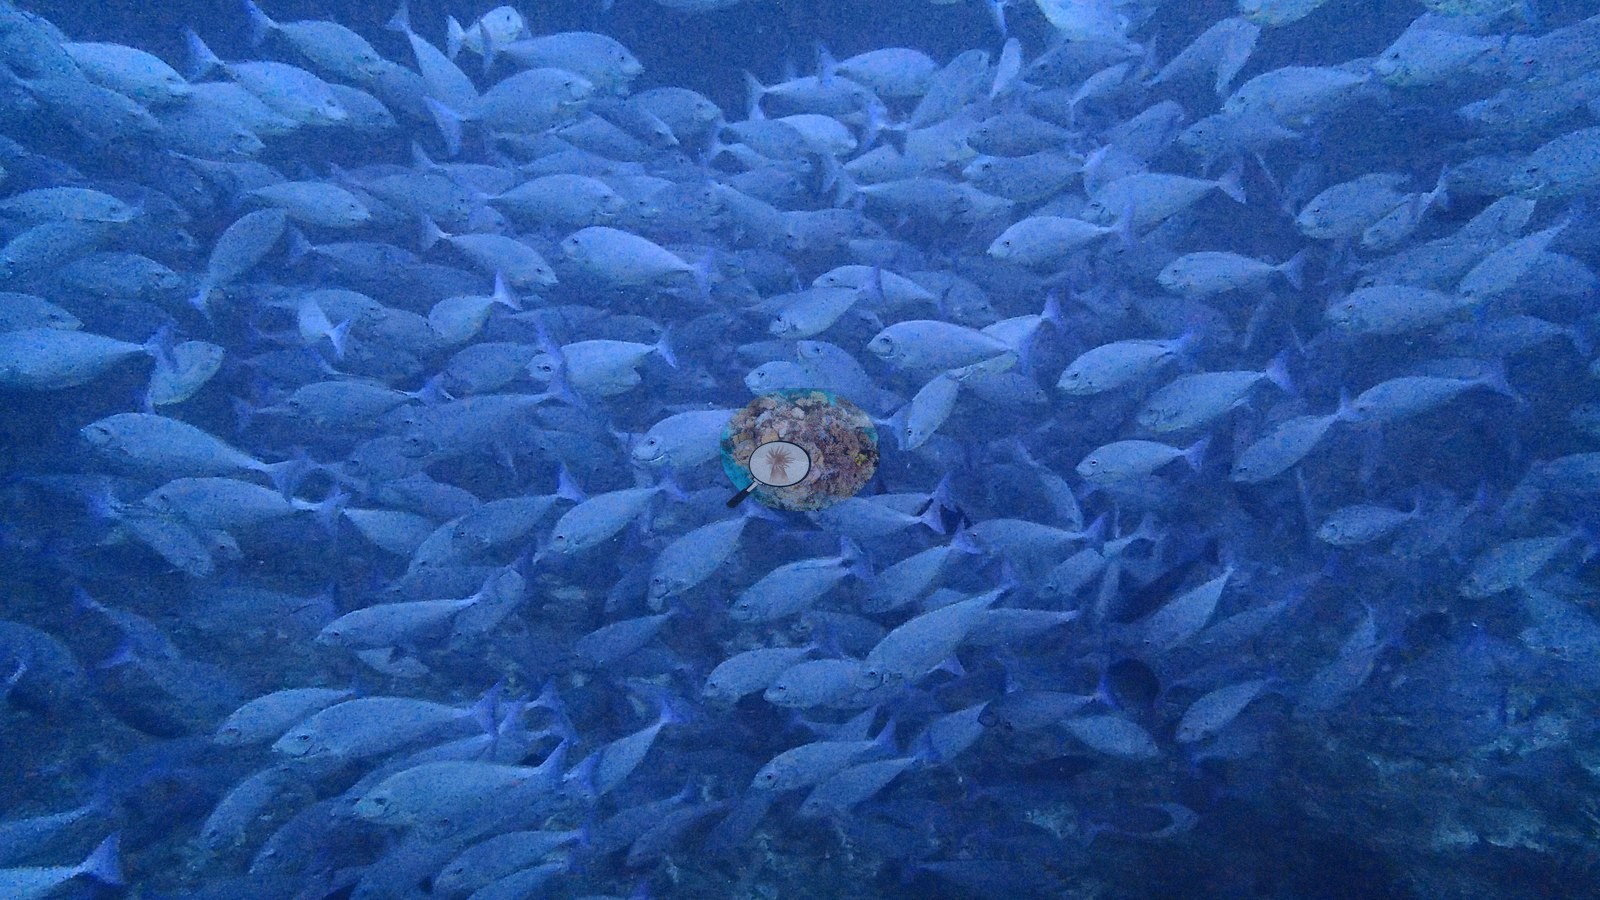
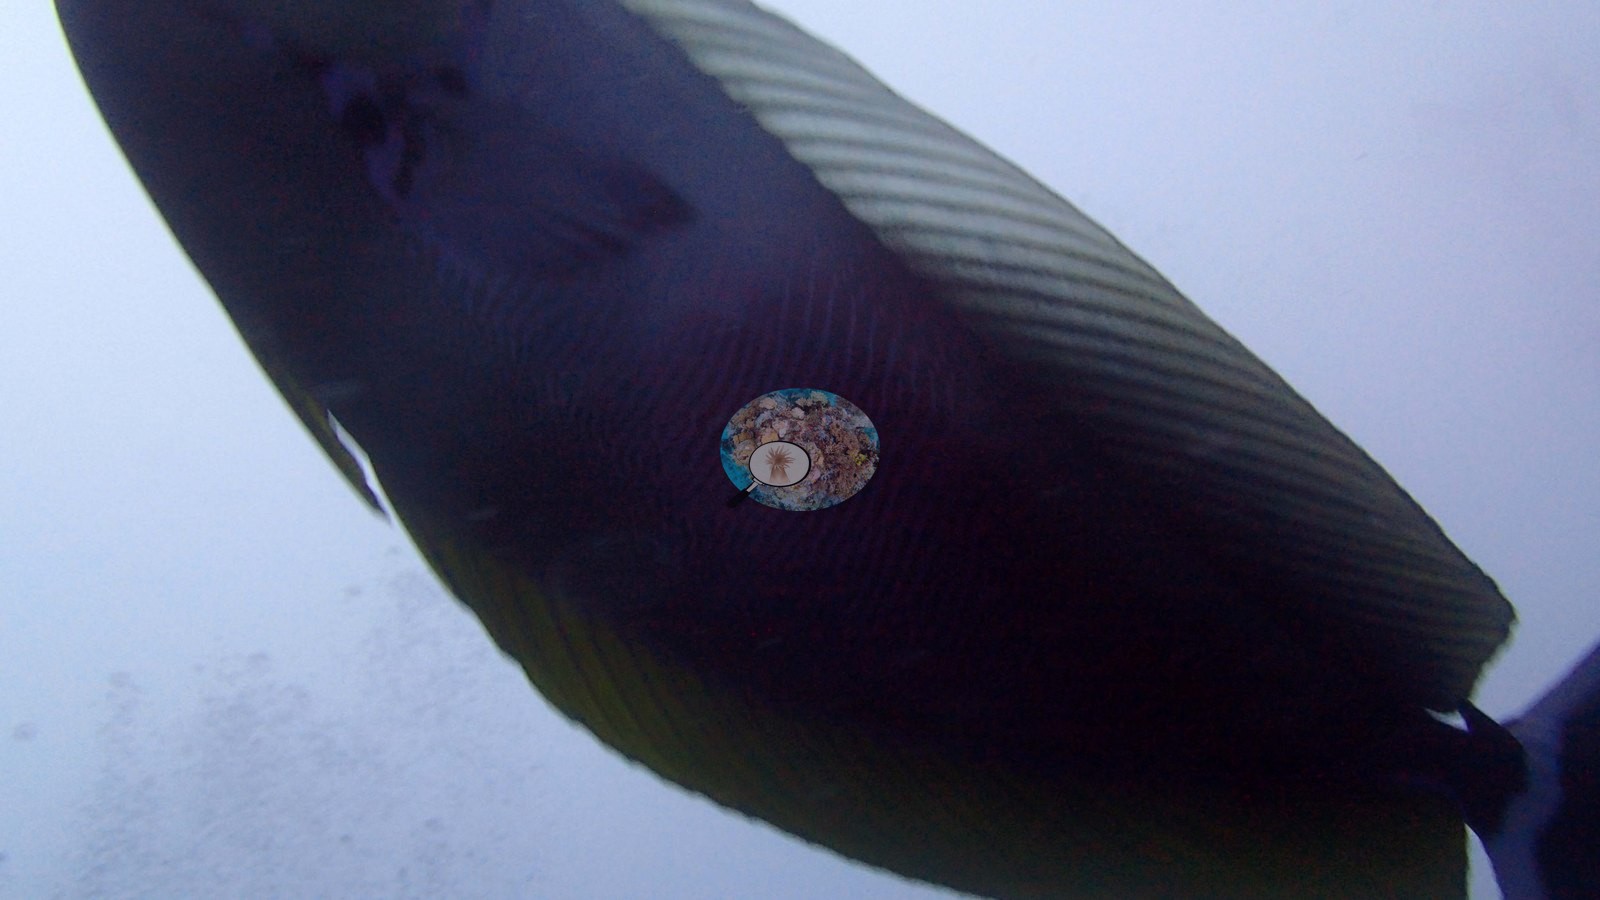
The pinnacle's edges churned with life: a chevron wall of barracuda, horned unicornfish squadrons, dense blue riverine schools of fusiliers, and surgeonfish darting up to chase divers' bubbles (e.g., Image 6, Image 1, Image 2, Image 7, Image 13, Image 23).
Comparisons with other data
No independent survey was made at this exact site; the nearest ones are listed in the table below.
CV model comparison
More info
As of September 2026 no computer-vision method estimates coral cover accurately on new images, so treat this as indicative rather than a measurement; it is revised as the methods improve.More info
The published figure is the mean of the two methods.| Method | Hard-coral cover (%) |
|---|---|
| In-house DINOv3 | 13.2 |
| CoralSCOP | 7.3 |
| Mean (± SD) | 10.2 ± 4.2 |
| Range | 7.3–13.2 |
Mean ± SD and range are across the computer-vision methods shown.
Independent surveys nearby
| Agency / program | Year(s) | Stations / distance | Link |
|---|---|---|---|
| Montefalcone et al. (2020) | 2015–2019 | 4 stations, 0.81–3.76 km | Records ↓ |
| Re E.* | 2026 | 1 station, 2.11 km | Records ↓ |
| Reef Check | 2012–2025 | 10 stations, 0.48–3.54 km | Records ↓ |
| XL Catlin Seaview Survey | 2015 | 1 station, 4.85 km | Records ↓ |
 Dr. Coral (CRD)Year-average (no detectable trend)
Within 5 km, 16 independent survey stations recorded hard coral cover in 47 records between 2012 and 2026. Of the 9 stations surveyed in more than one year, 2 declined, 3 increased, and 4 changed by less than 5 percentage points between their first and latest surveys. The longest record, Guraidhoo backreef (Reef Check, 1.81 km away), went from 28% in 2019 to 25% in 2025. Surveys since 2021 average 25% (range 16–31%, n=10). This site's own estimate (10%) is indistinguishable from the recent range (16–31%): the 5.4-point gap is inside the ±7 percentage-point noise between methods; the methods differ, so the comparison is context, not a like-for-like test.
Collected by other programs using different methods (Reef Check uses point-intercept transects; the XL Catlin Seaview Survey uses photo-transects with automated image annotation. *Conducted by citizen scientists), so these are context for the figures above, not a like-for-like comparison. Where a station was surveyed more than once the range is shown. Station names are not dive-site names. Values marked best patch exceed 70%: surveyors usually chose the richest area, so they are not site means.
Show all 16 independent survey records
| Agency | Site / location | Date | Hard coral cover (%) | Distance | Link |
|---|---|---|---|---|---|
| Reef Check | Biyadhoo House Reef | 2012 | 18% (3 surveys) | 3.22 km | — |
| Montefalcone et al. (2020) | Villivaru Kuda Giri | 2015–2019 | 8.0–51% (4 surveys) | 3.76 km | HeatCRD database |
| Montefalcone et al. (2020) | Guraidhoo Kuda Giri | 2015–2016 | 12–83% (2 surveys) best patch | 3.76 km | HeatCRD database |
| XL Catlin Seaview Survey | transect 37036 | 2015 | 38% | 4.85 km | — |
| Montefalcone et al. (2020) | Kandooma Beyru | 2016–2019 | 7.7–34% (3 surveys) | 0.81 km | HeatCRD database |
| Montefalcone et al. (2020) | Maadhu Faru Beyru | 2016–2017 | 18–45% (2 surveys) | 1.57 km | HeatCRD database |
| Reef Check | Guraidhoo Corner | 2017 | 21% (2 surveys) | 1.75 km | — |
| Reef Check | Kandooma Beyru | 2018–2019 | 18–30% (4 surveys) | 0.48 km | — |
| Reef Check | Villivaru Giri | 2018 | 8.8% (2 surveys) | 3.21 km | — |
| Reef Check | Guraidhoo backreef | 2019–2025 | 20–28% (6 surveys) | 1.81 km | — |
| Reef Check | Guridhoo outer | 2019–2022 | 16–20% (3 surveys) | 2.08 km | — |
| Reef Check | Villivaru Kuda Giri | 2019 | 24% (2 surveys) | 3.54 km | — |
| Reef Check | Guraidhoo Backreef | 2024 | 31% (2 surveys) | 1.82 km | — |
| Reef Check | Guraidhoo Banana | 2024–2025 | 25–27% (4 surveys) | 1.88 km | — |
| Reef Check | Guraidhoo Forereef | 2024–2025 | 25–26% (4 surveys) | 2.20 km | — |
| Re E.* | Banana_Reef | 2026 | 29% (3 images) | 2.11 km | Re E. 2026. AquaReef Project - Maldives. MERMAID |
Data & links
All images from Coral Reef Diagnostics. Data are from Coral Reef Diagnostics and the organizations named in the data-sources table above.
© Coral Reef Diagnostics.