
Maldives - Dhega Thila

Part of the regional summaries: Maldives - Central (Male Atolls / Ari / Vaavu) and Maldives
More info
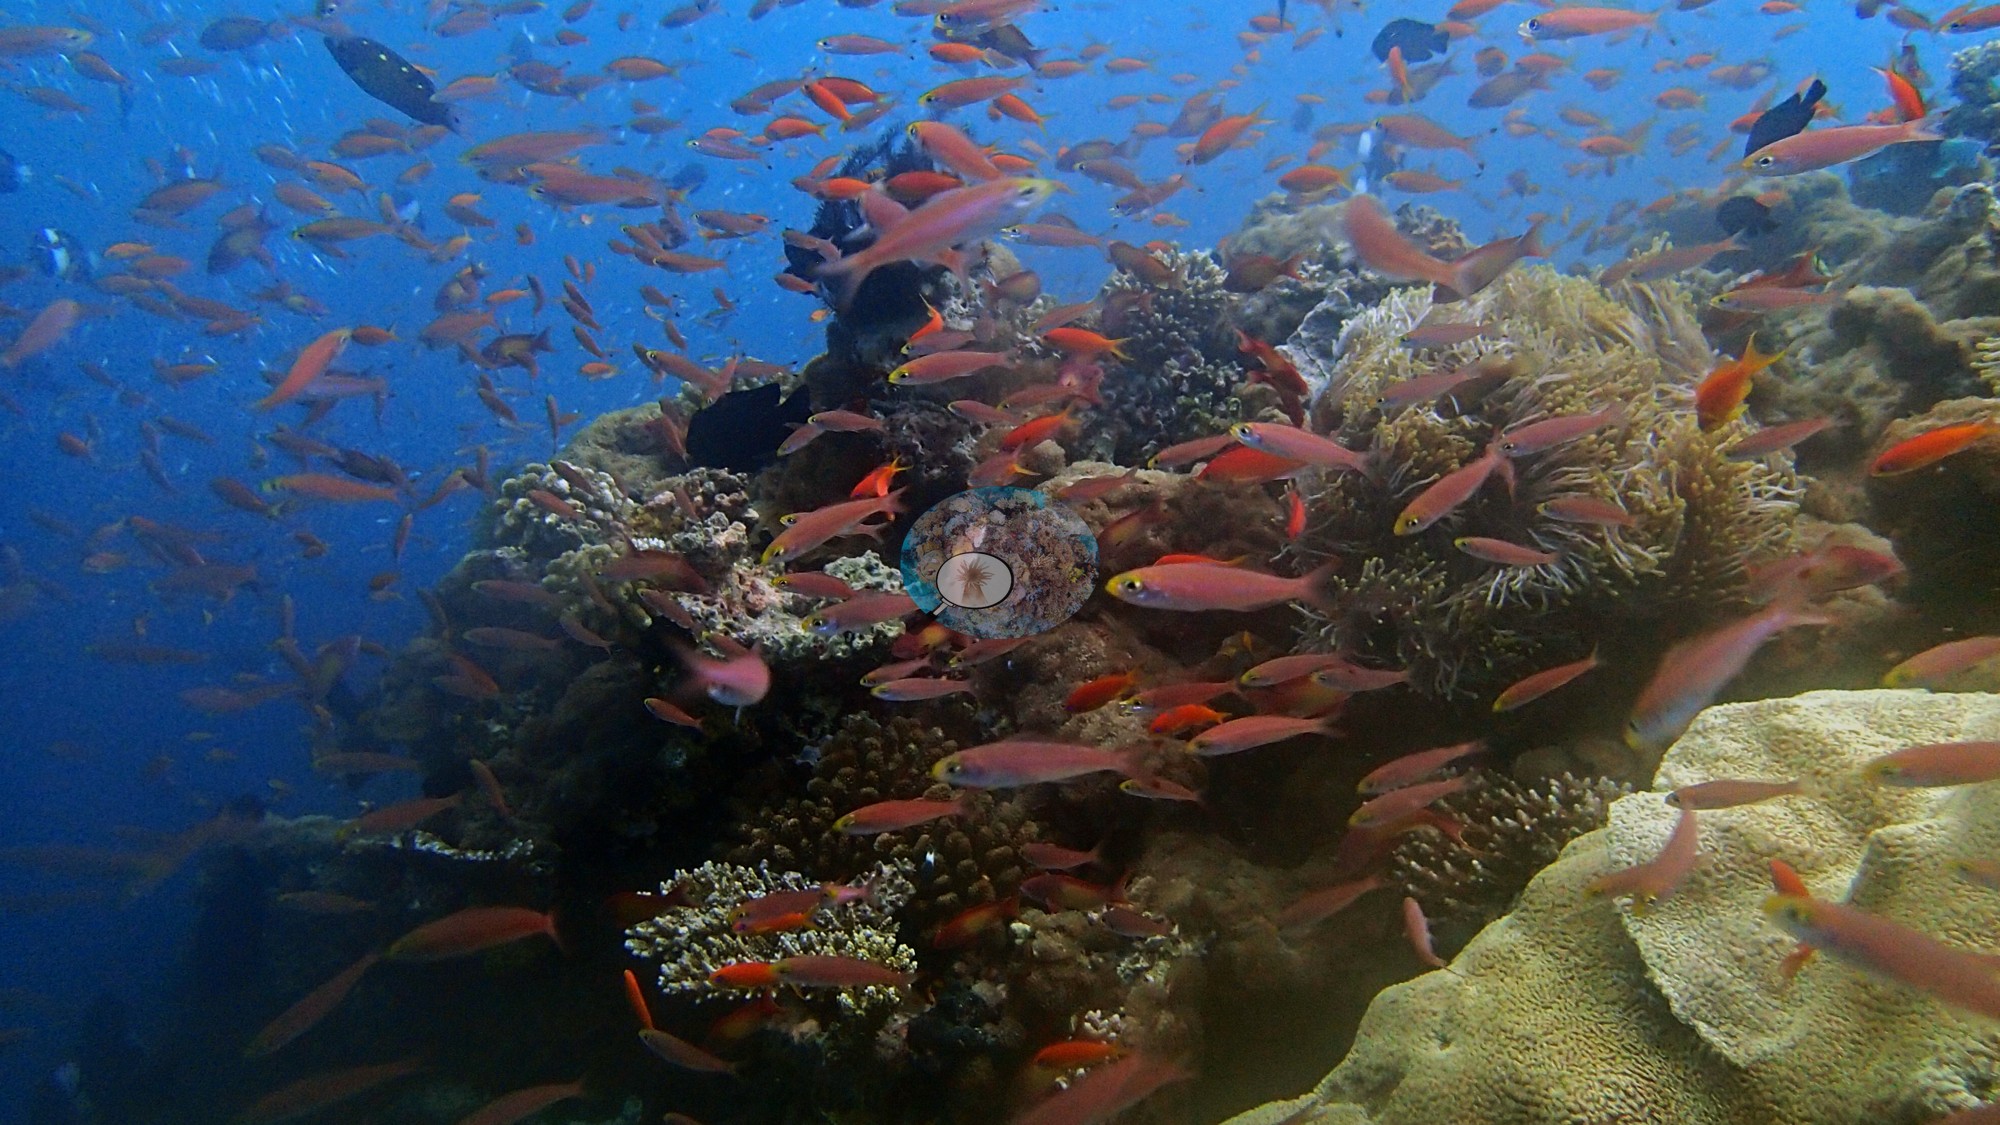
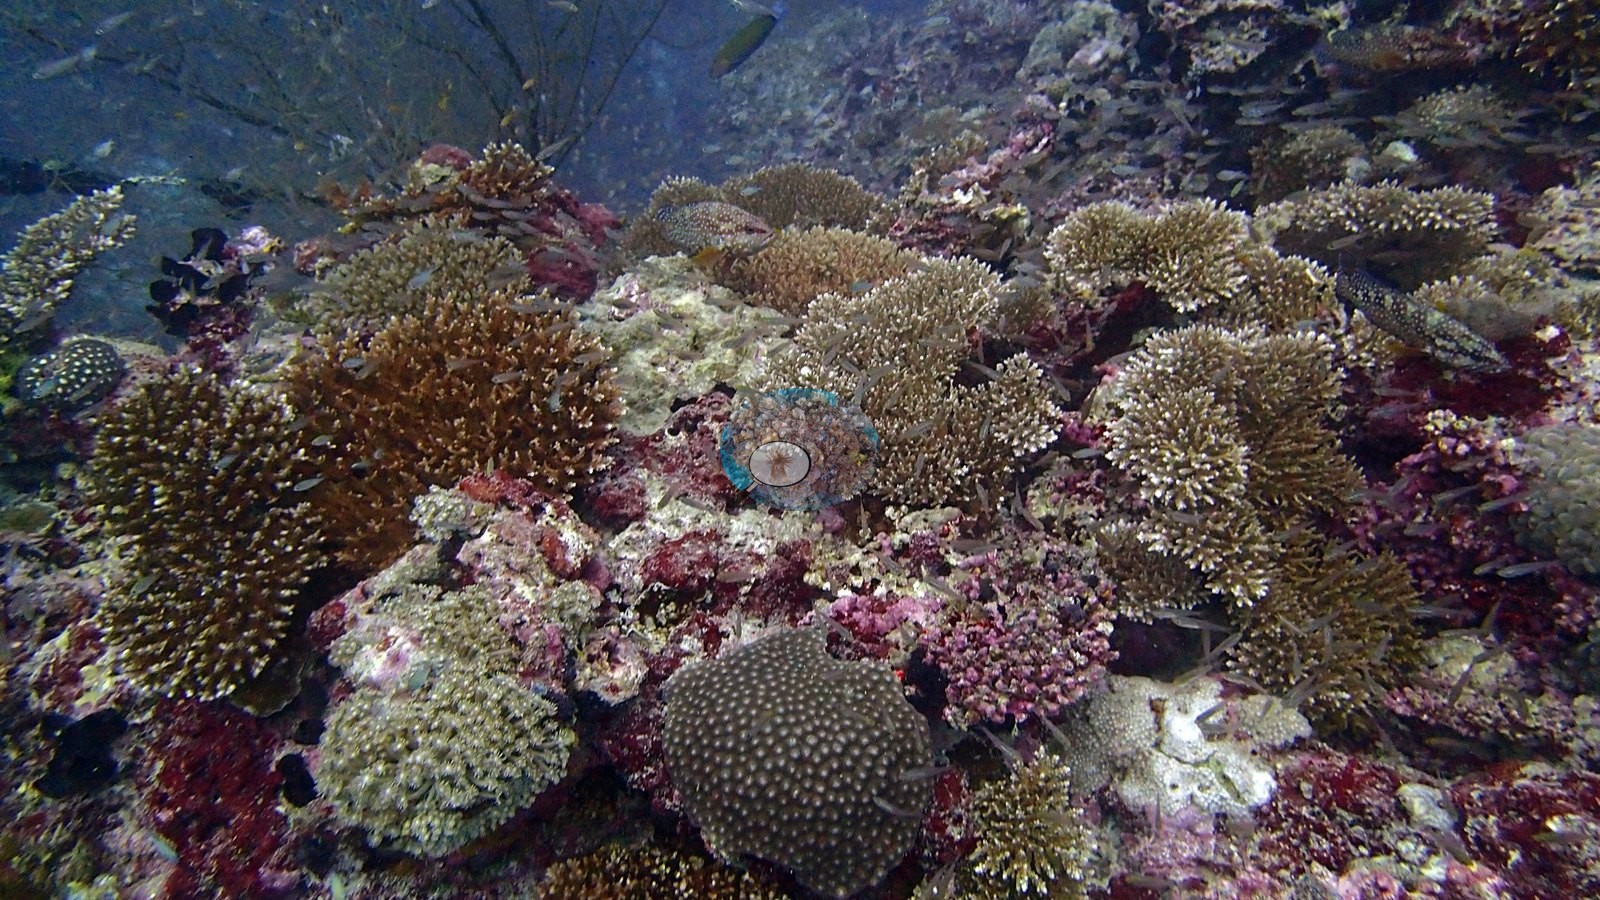
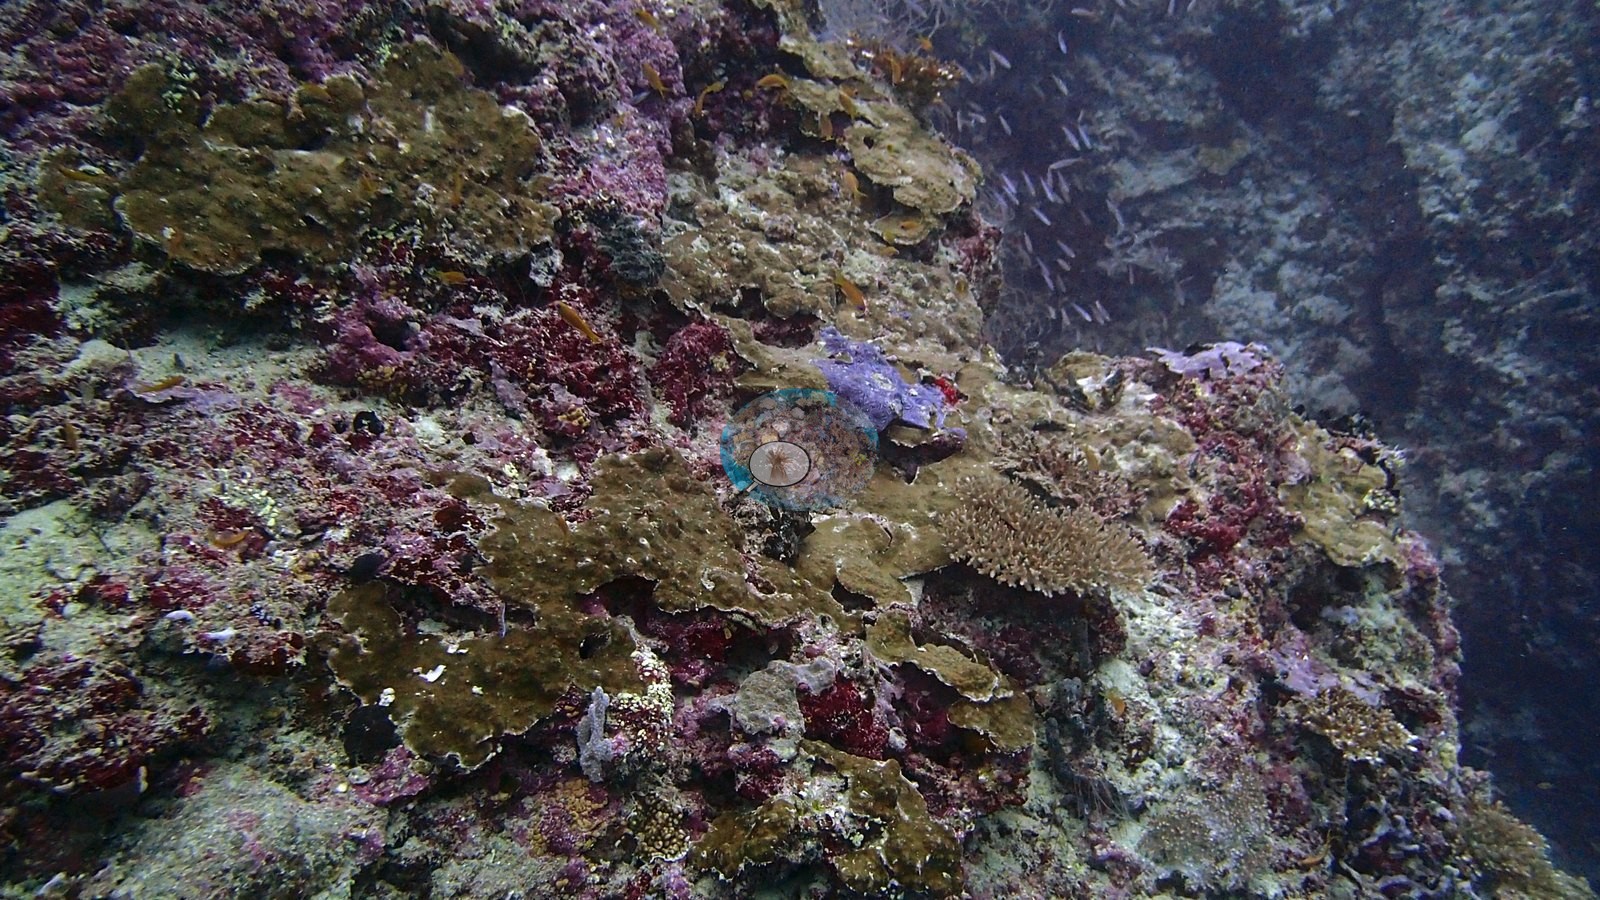
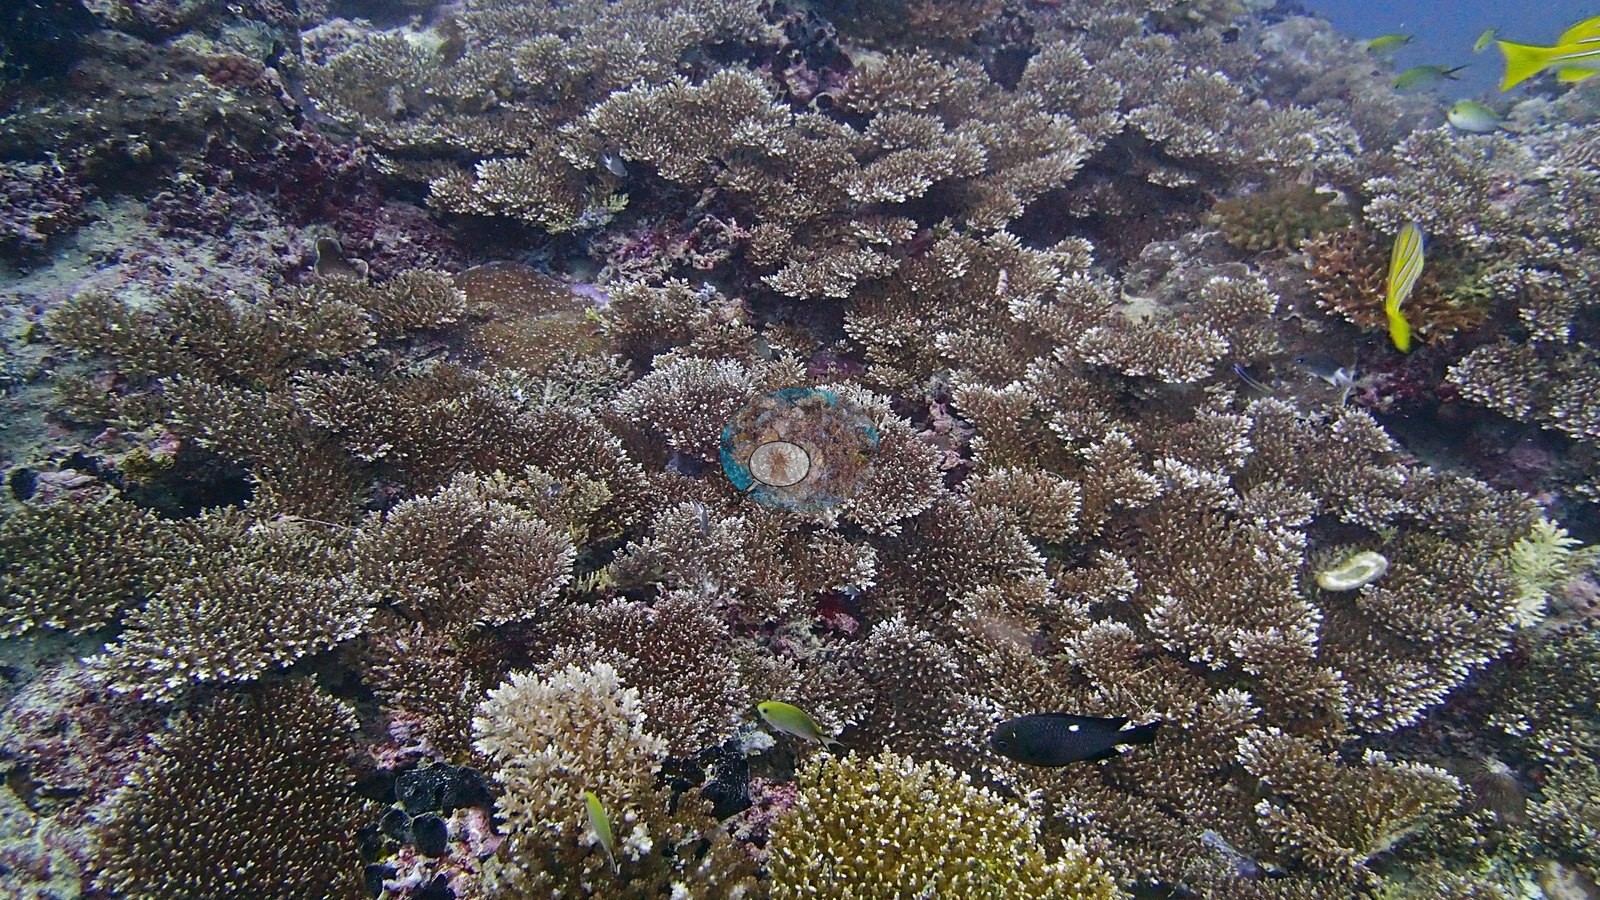
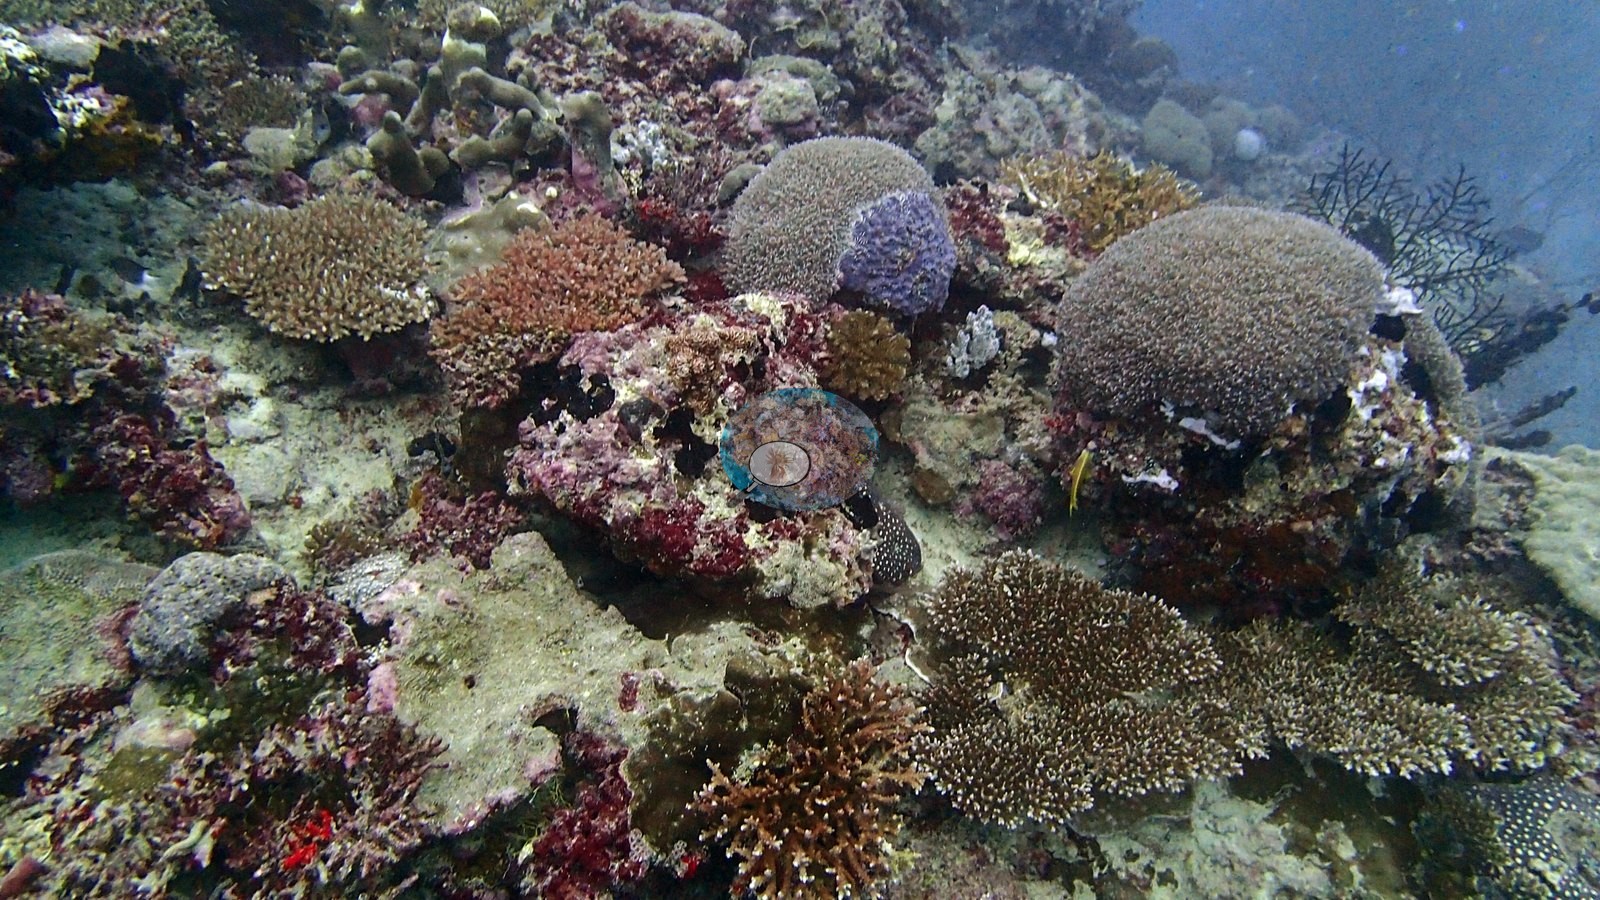
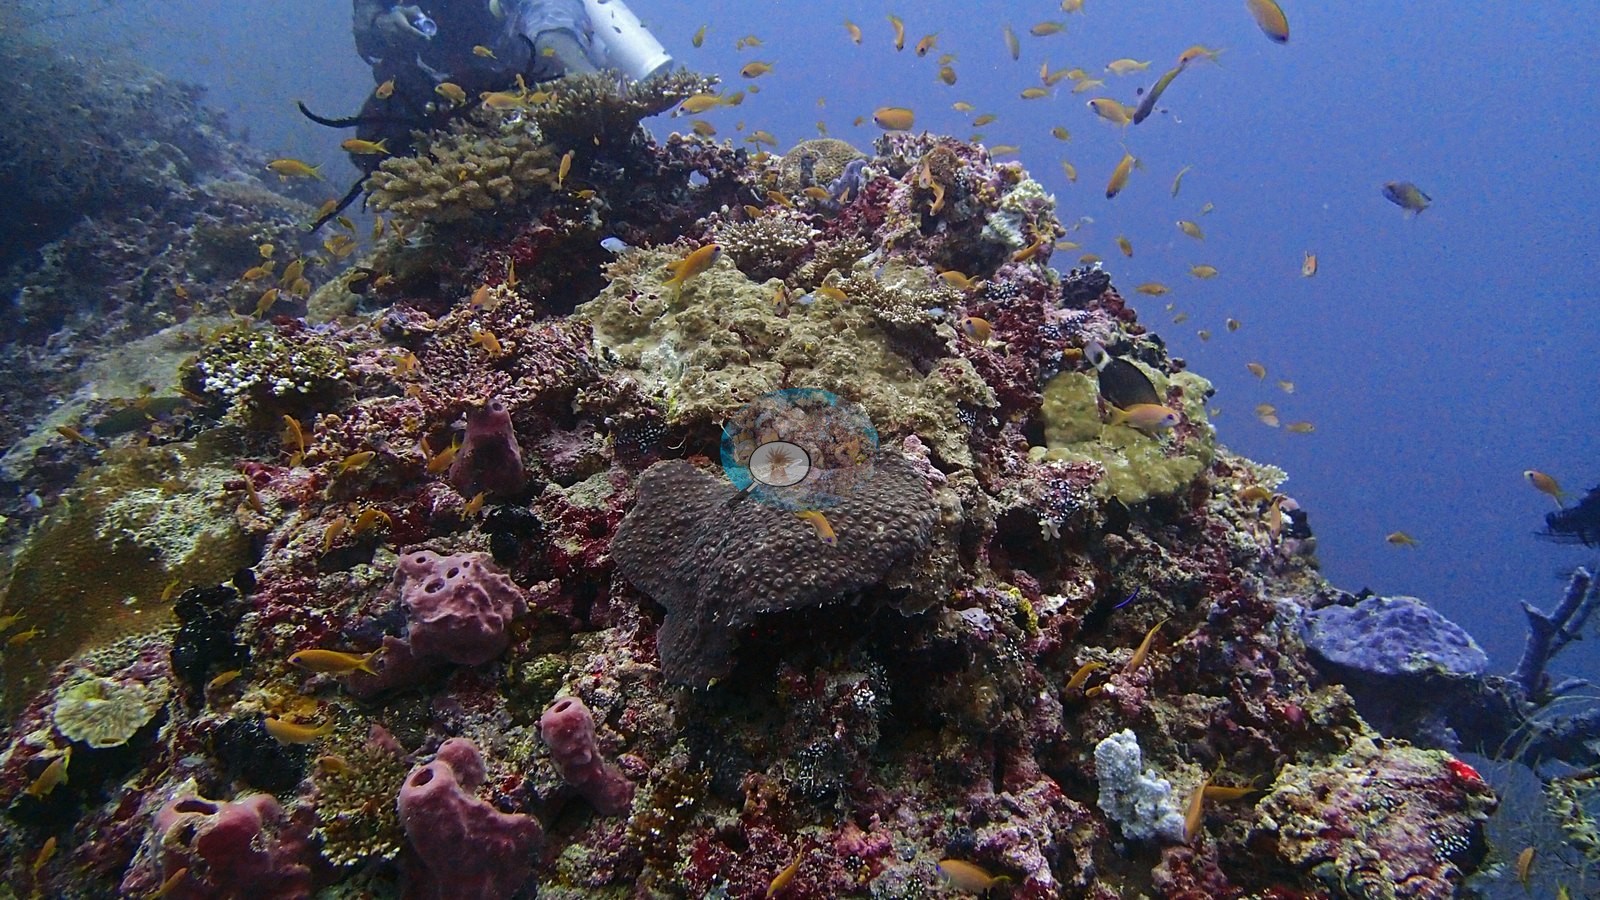
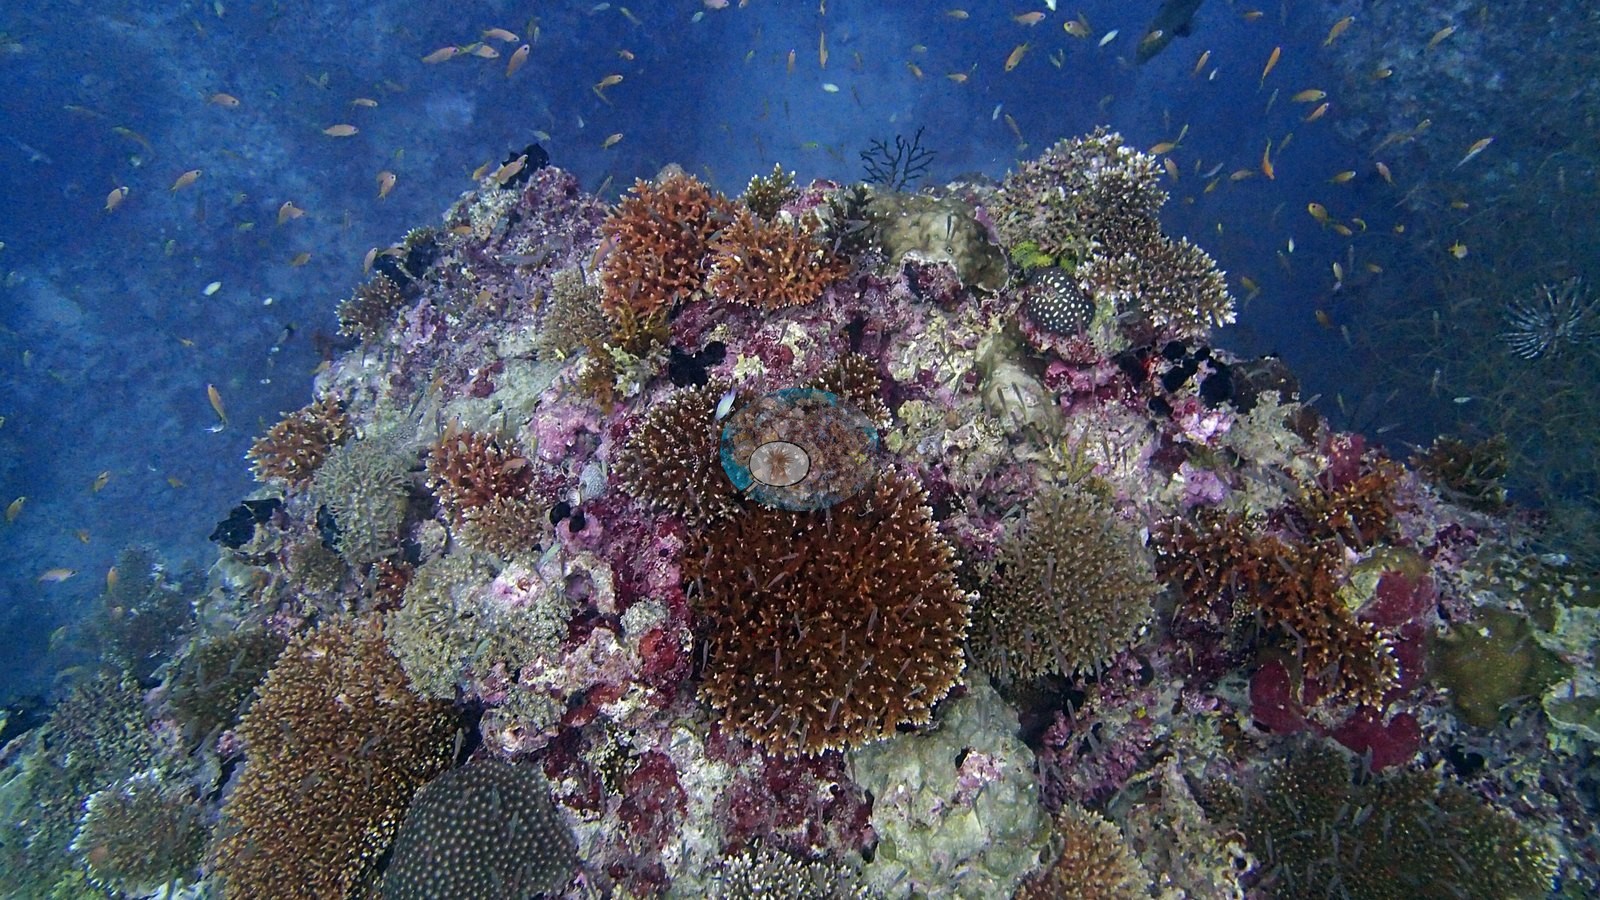
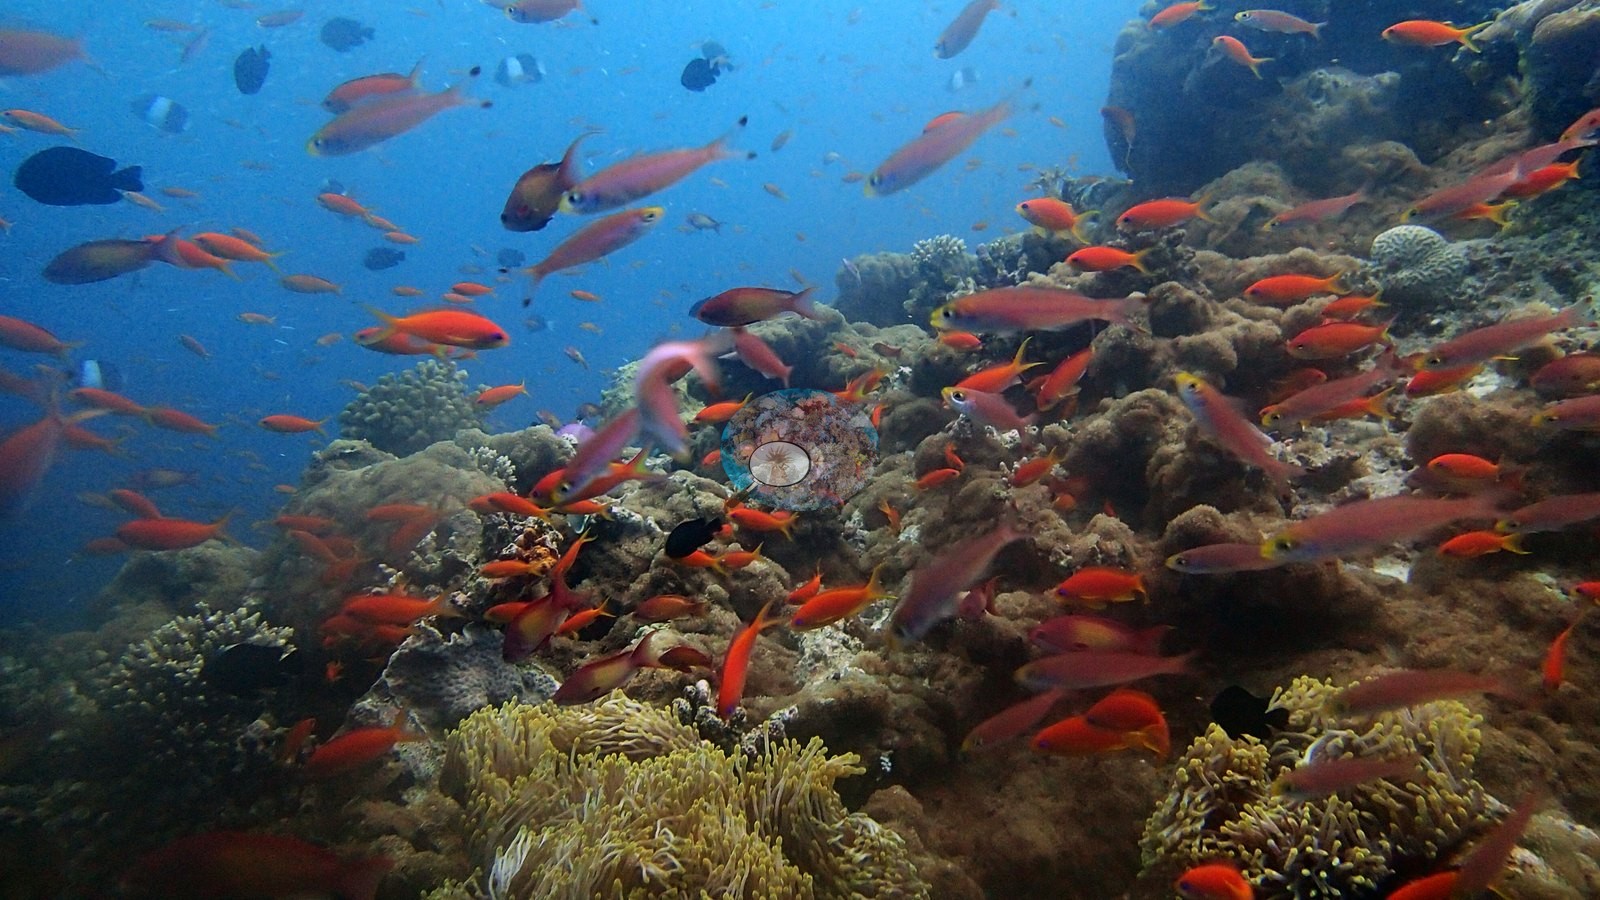
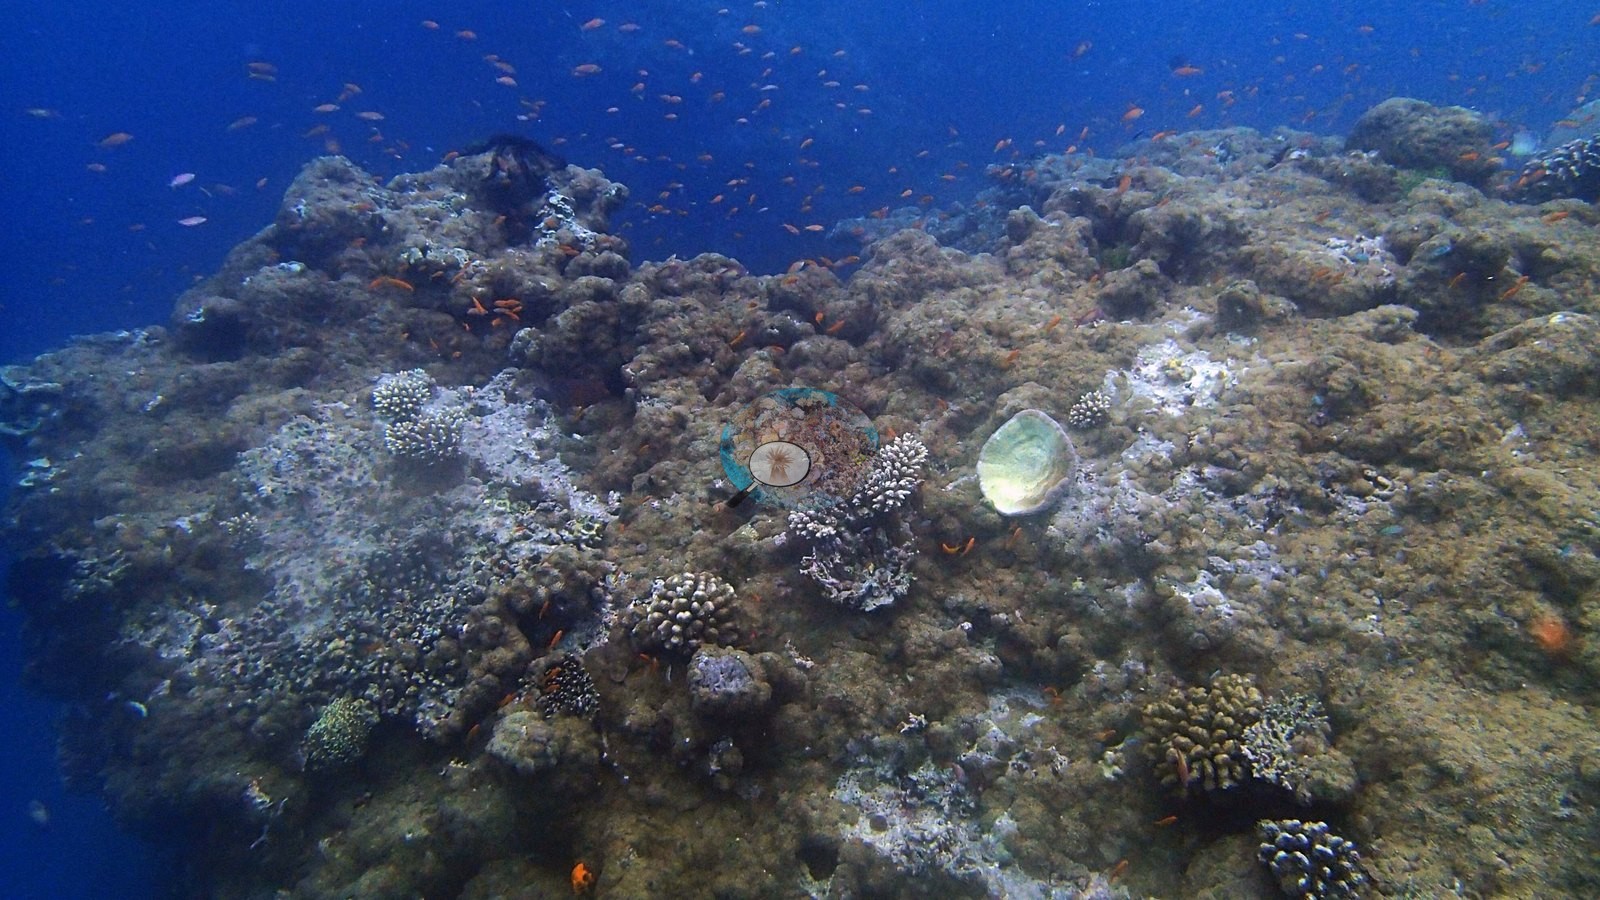
Maldives (NOAA CRW virtual station) · Maldives ecoregion mean=2.9°C-heating weeksA pinnacle crown packed edge to edge with staghorn and table corals under a permanent haze of anthias, with standout macro life including a black-and-blue nudibranch and bubble-tip anemones - among the most biodiverse sites of the trip. Computer vision cover estimate is 21-25%, averaging 23%.
One independent survey station shown with the program’s logo — click one to see how far it is from this site.
20 of these 50 photographs are shown beside the text that discusses them under "Site description" below.
Site description
Setting
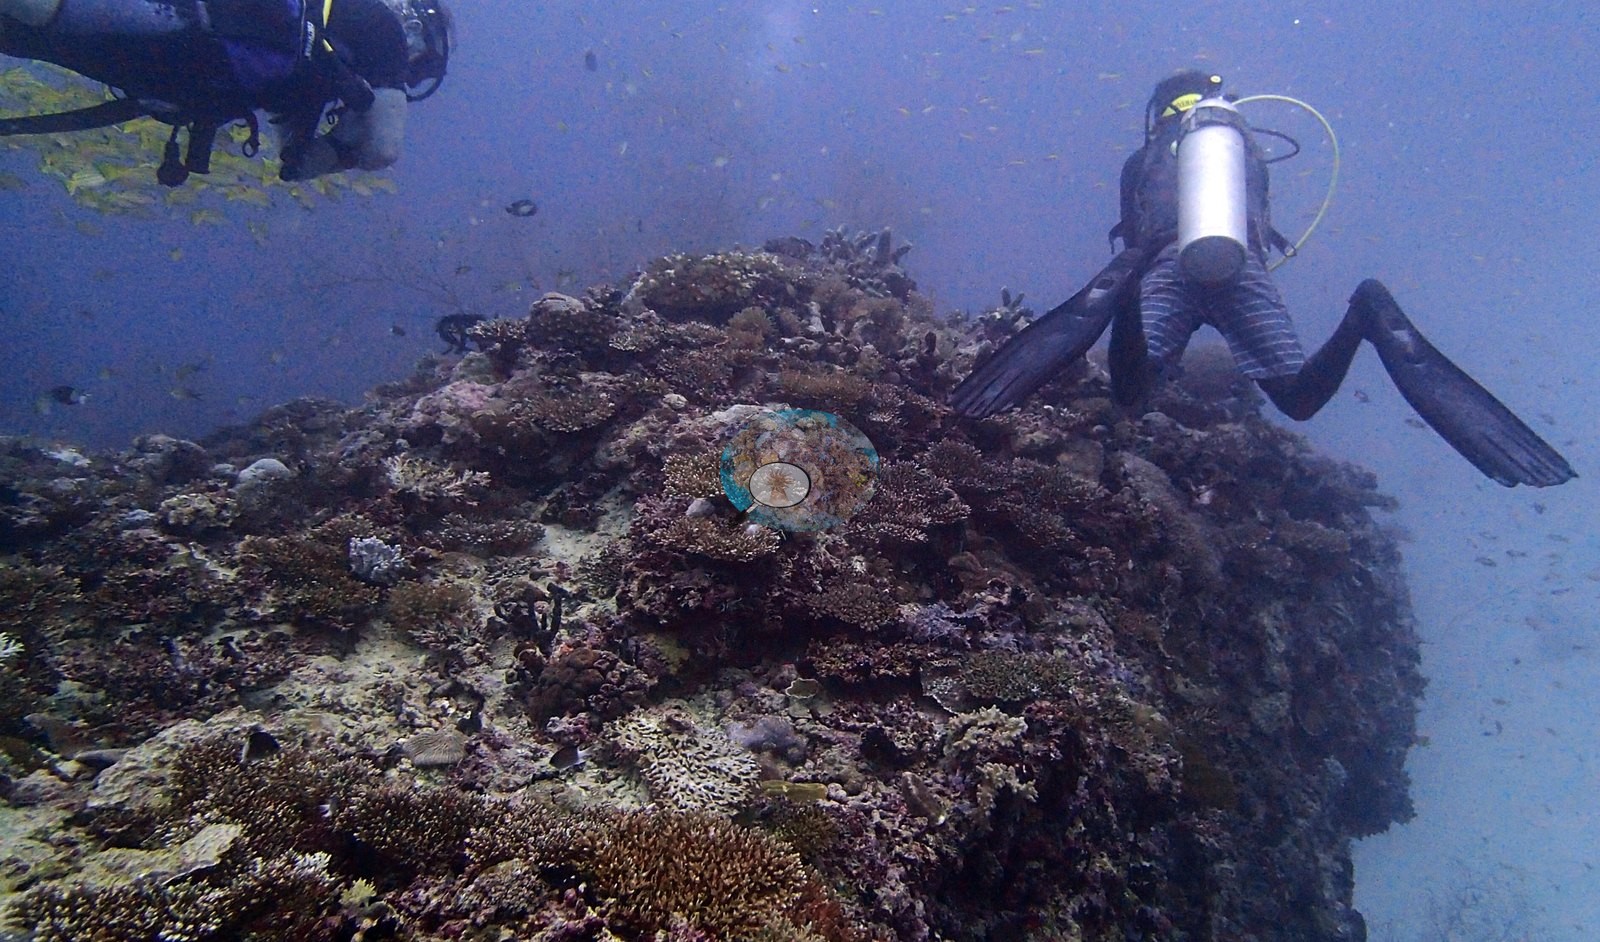
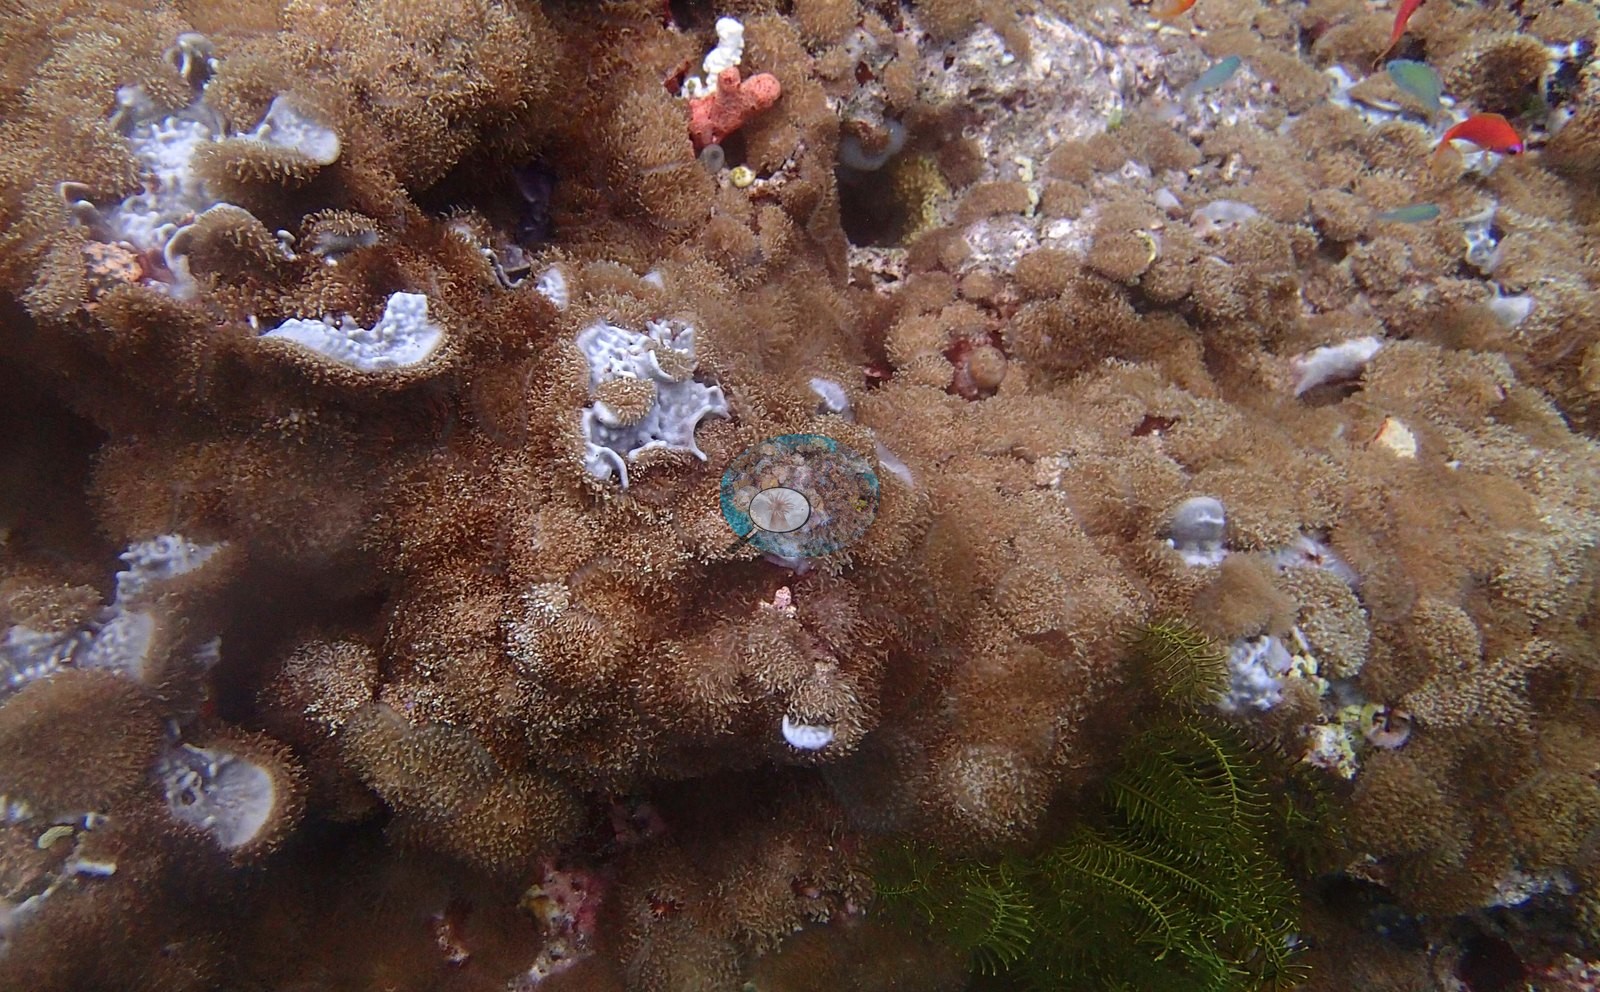
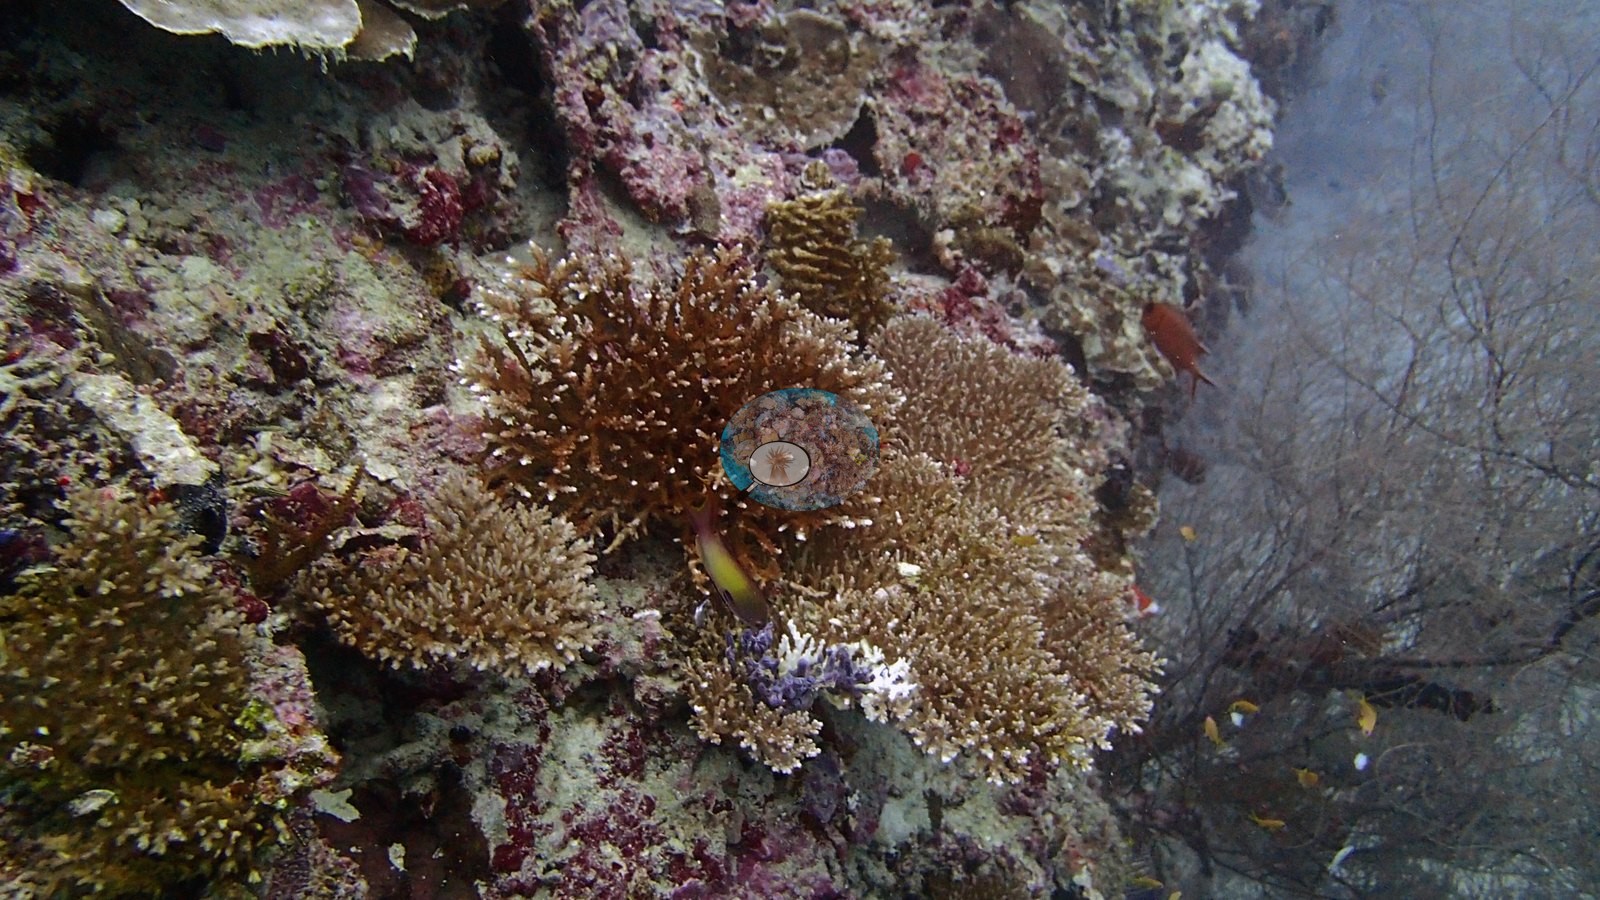
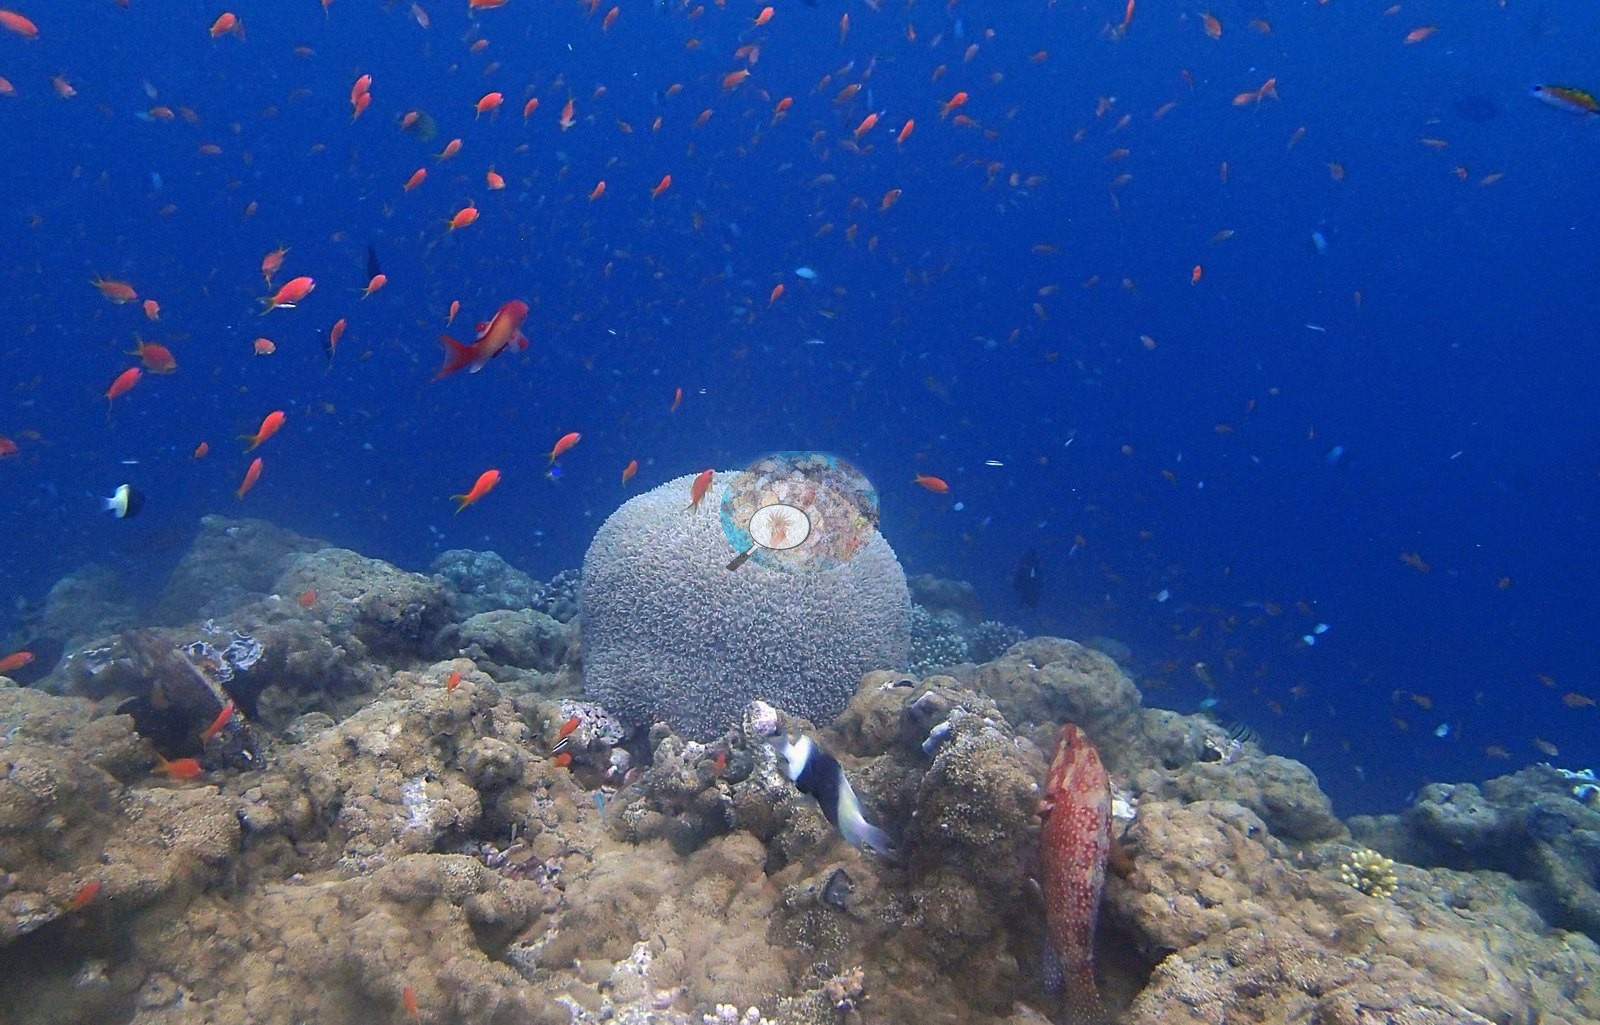
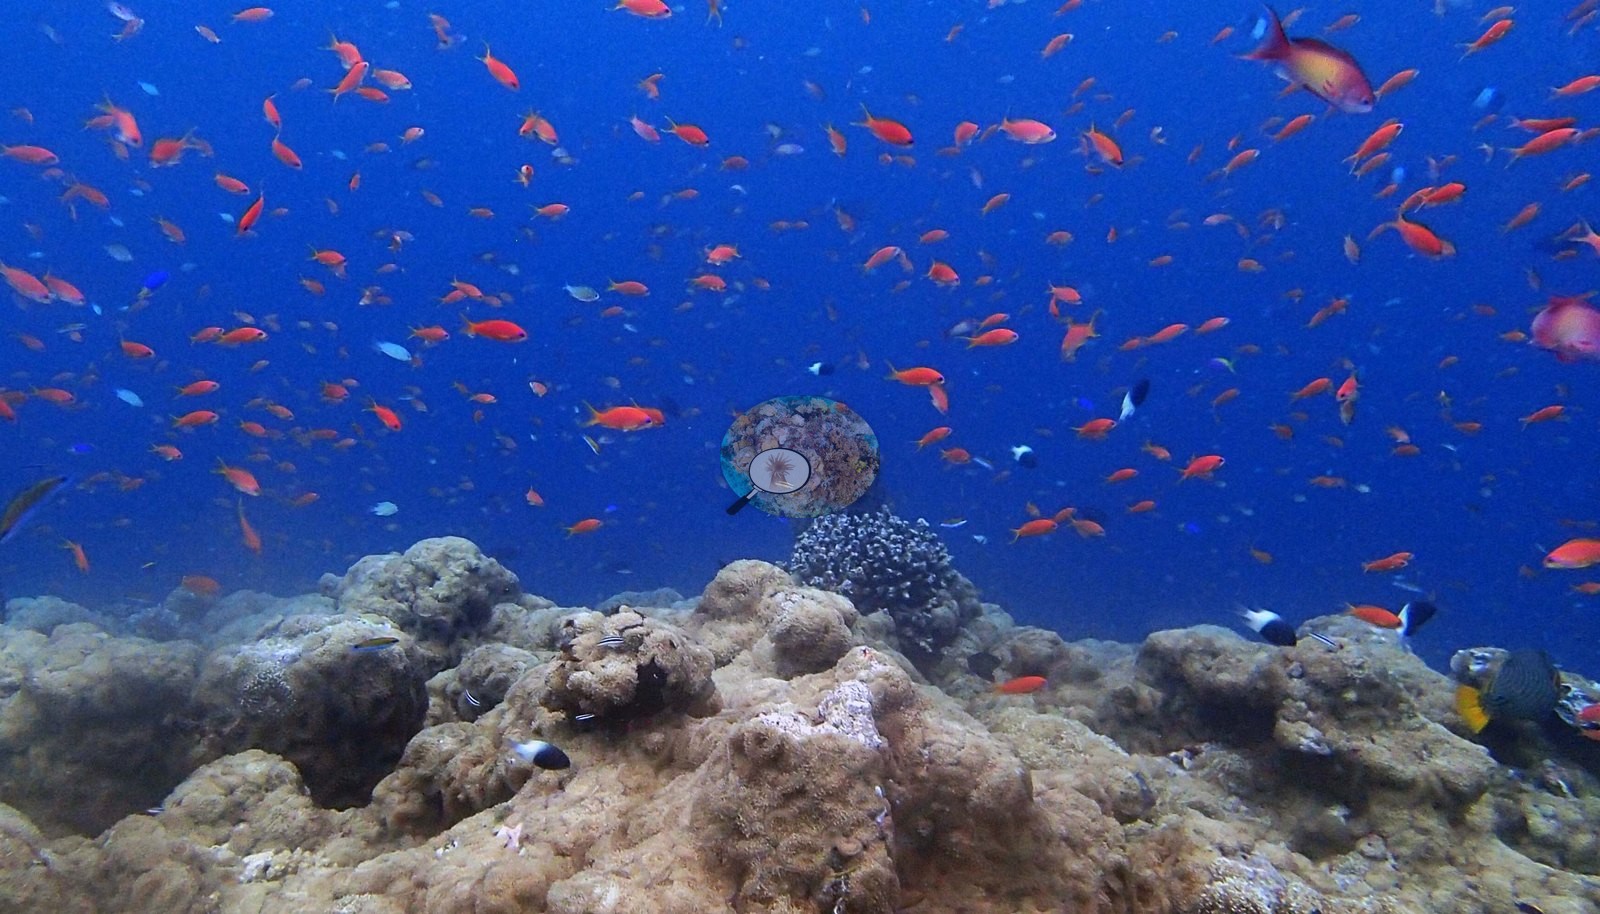
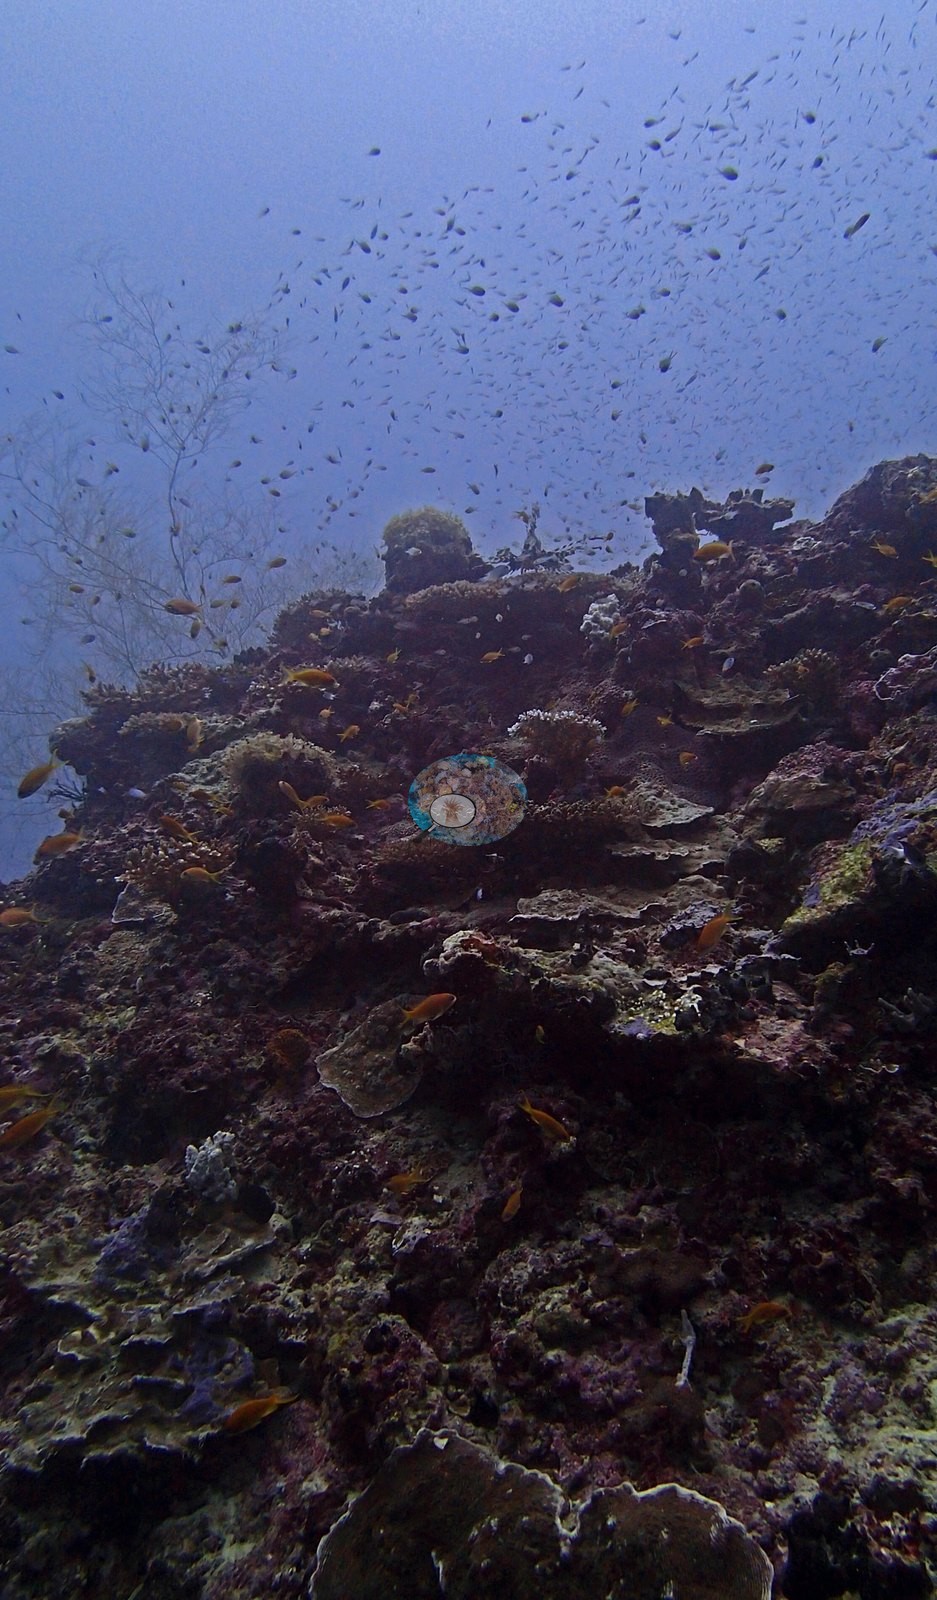
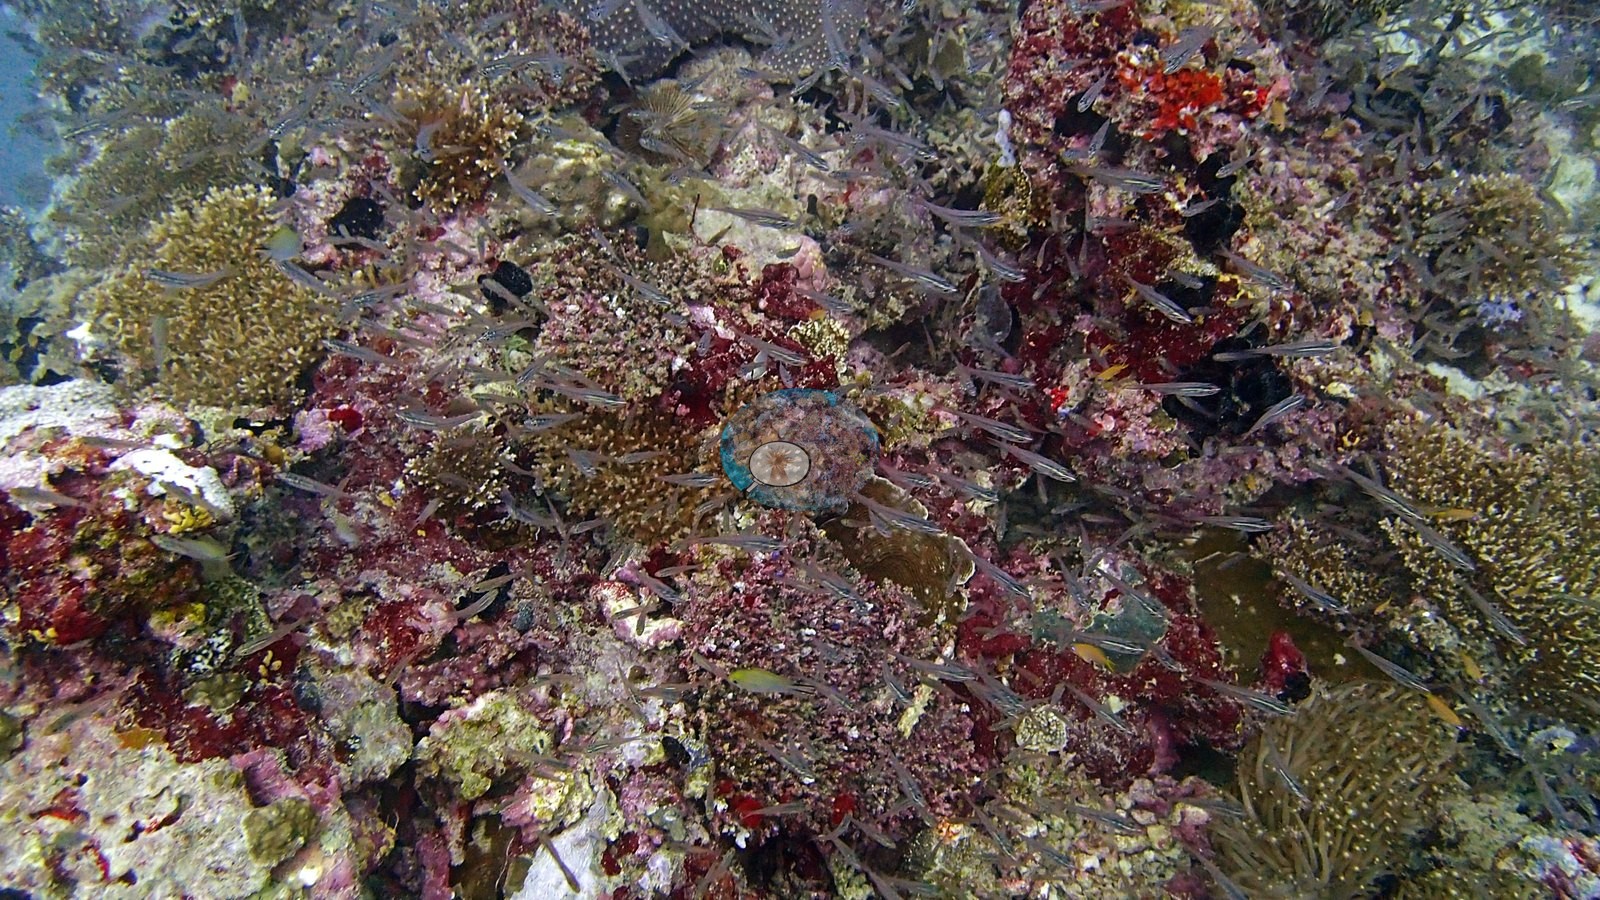
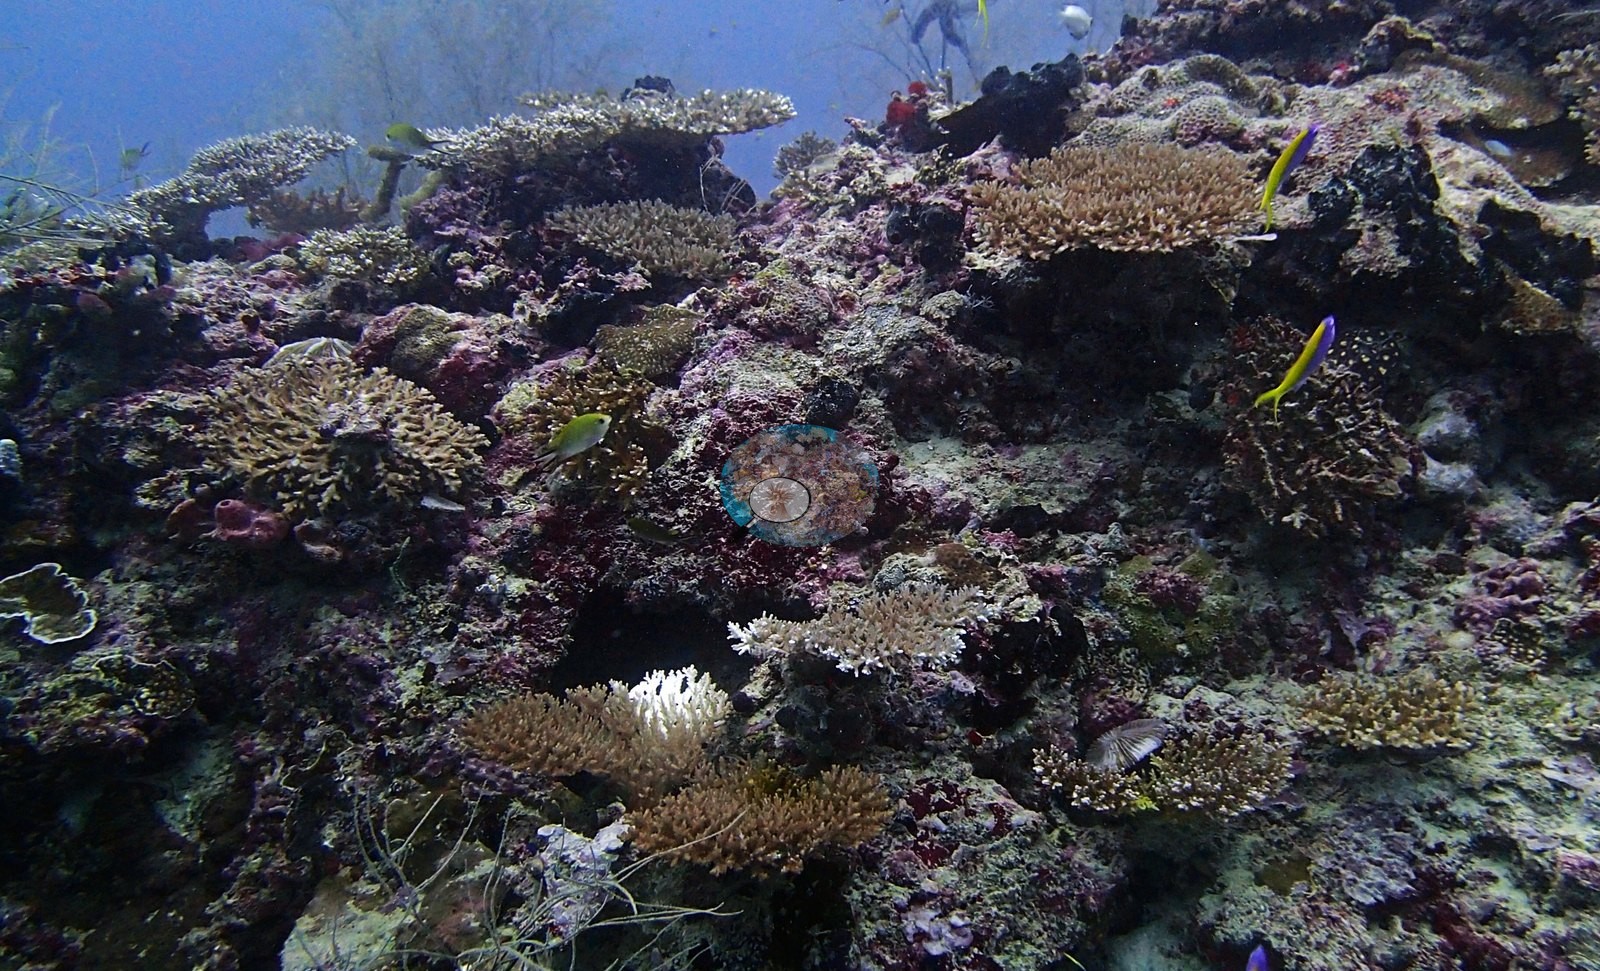
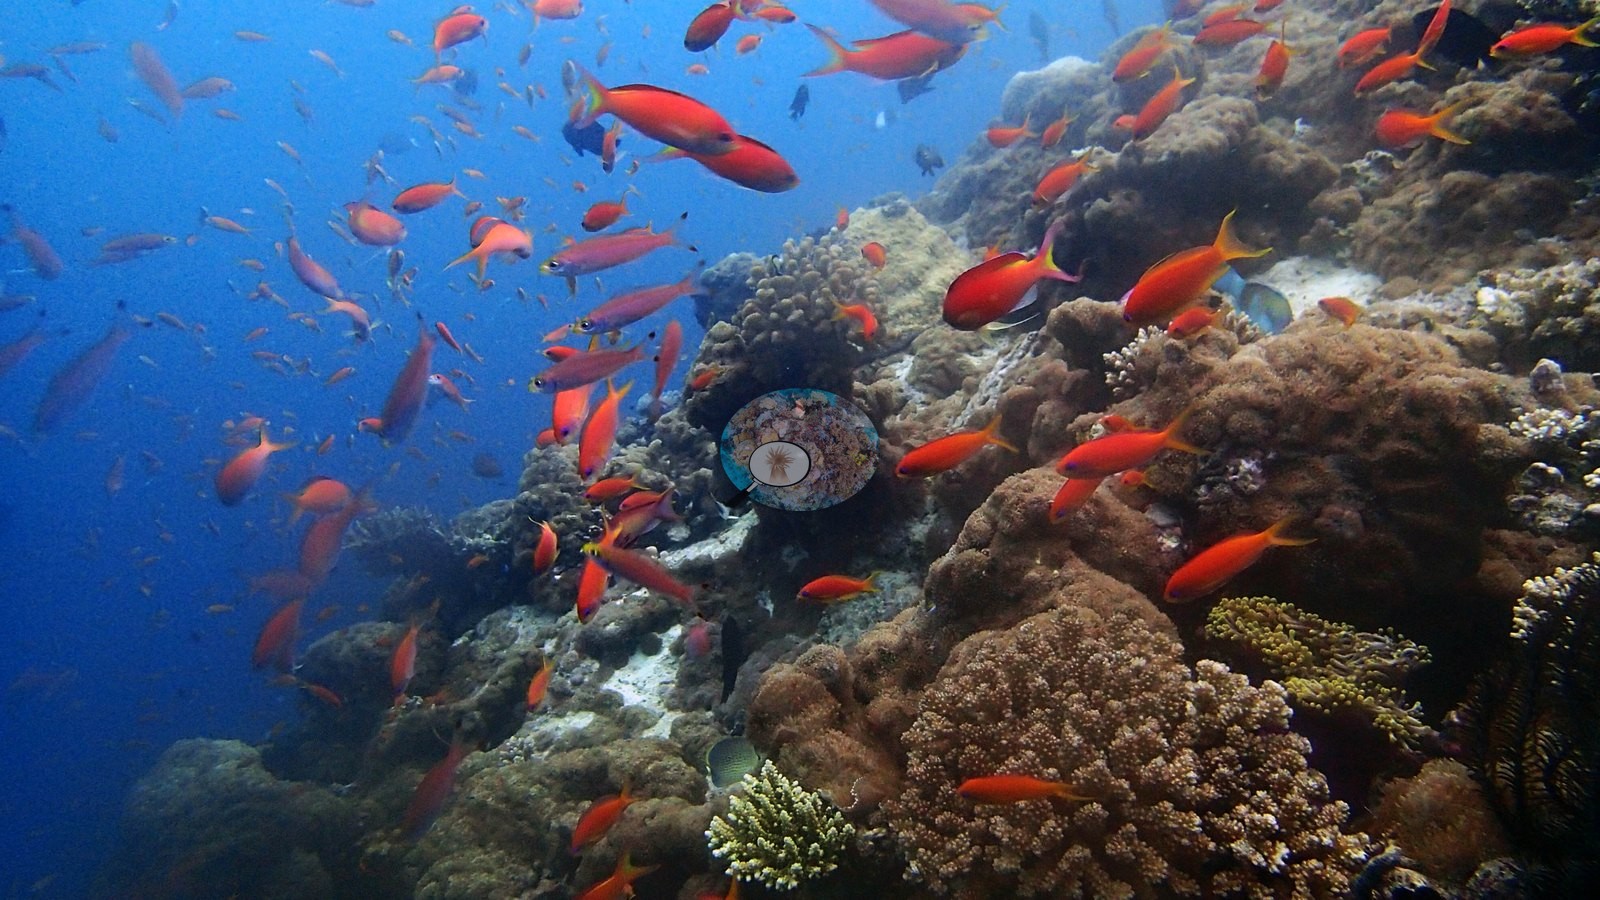
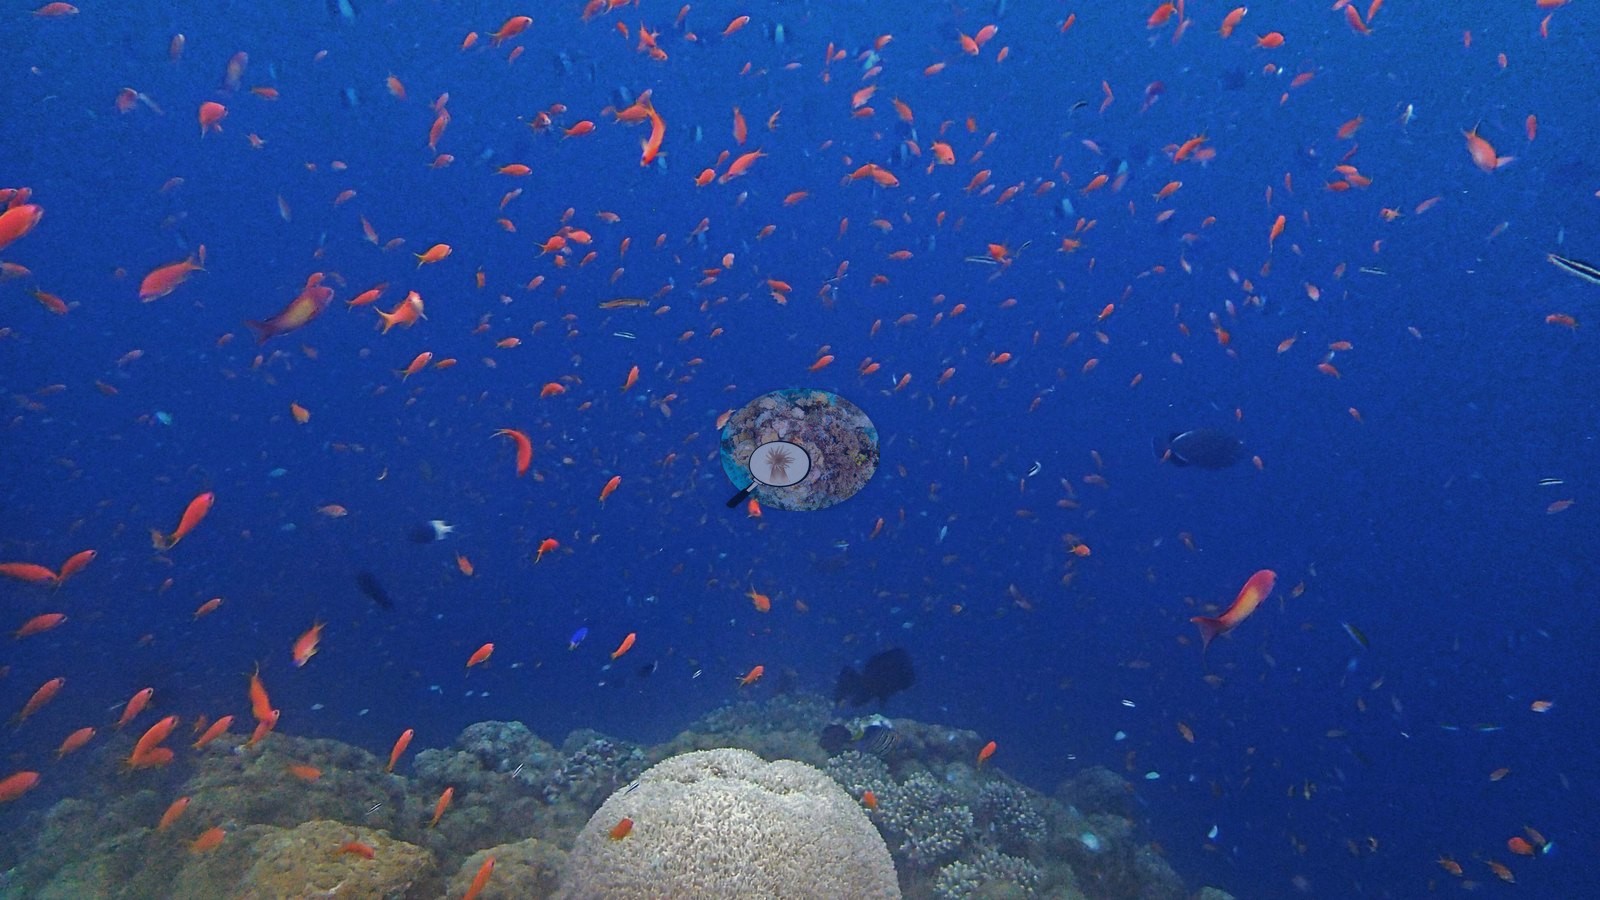
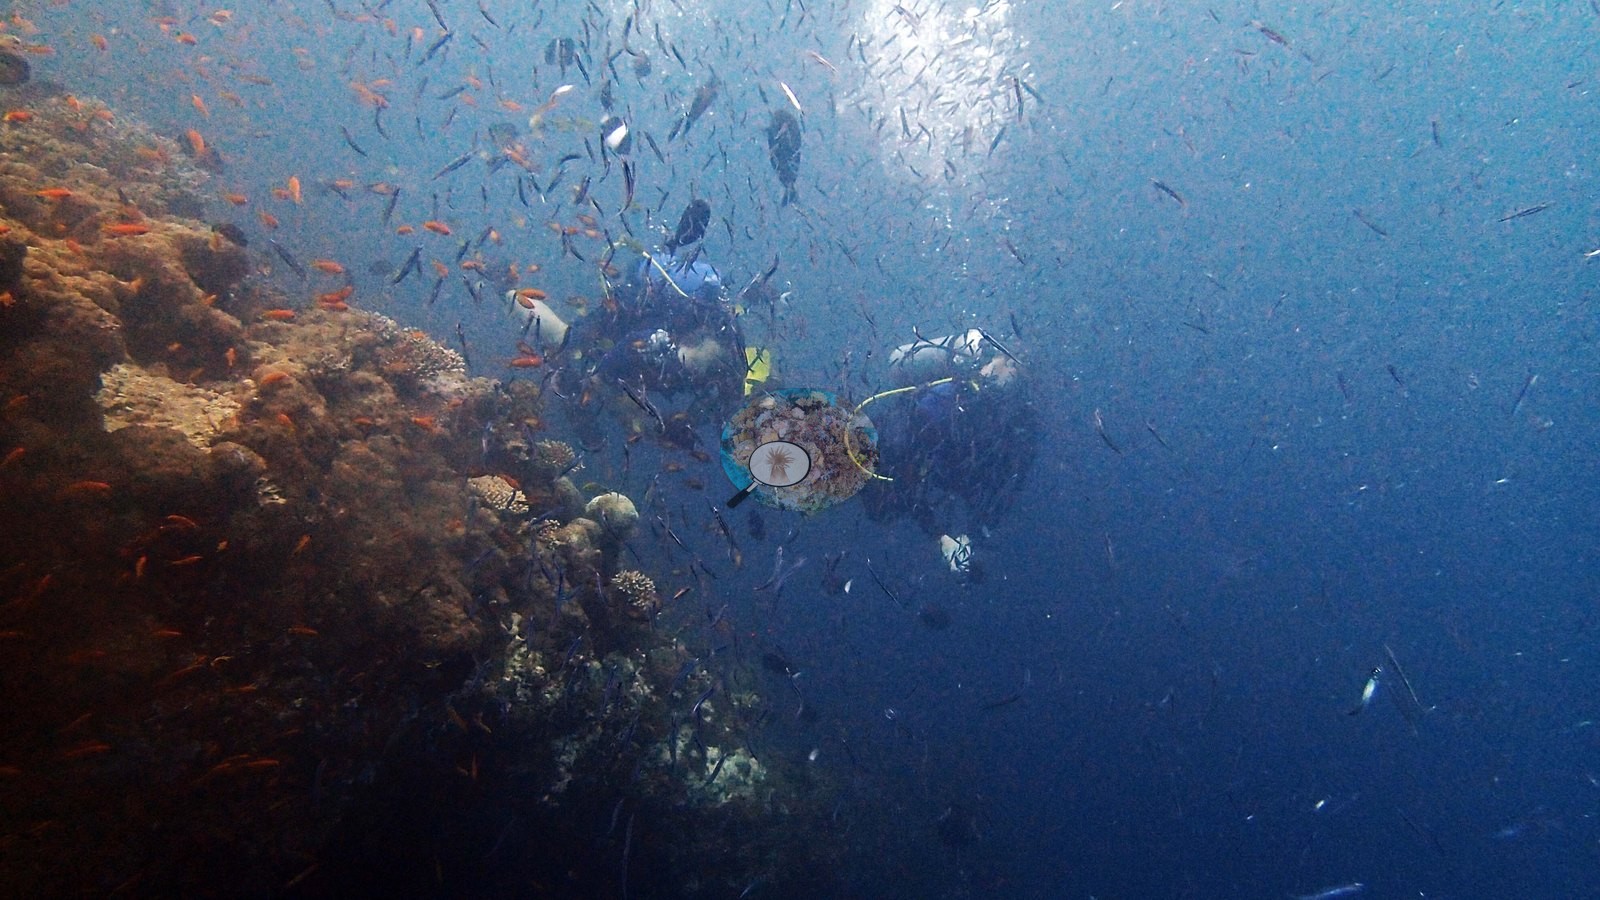
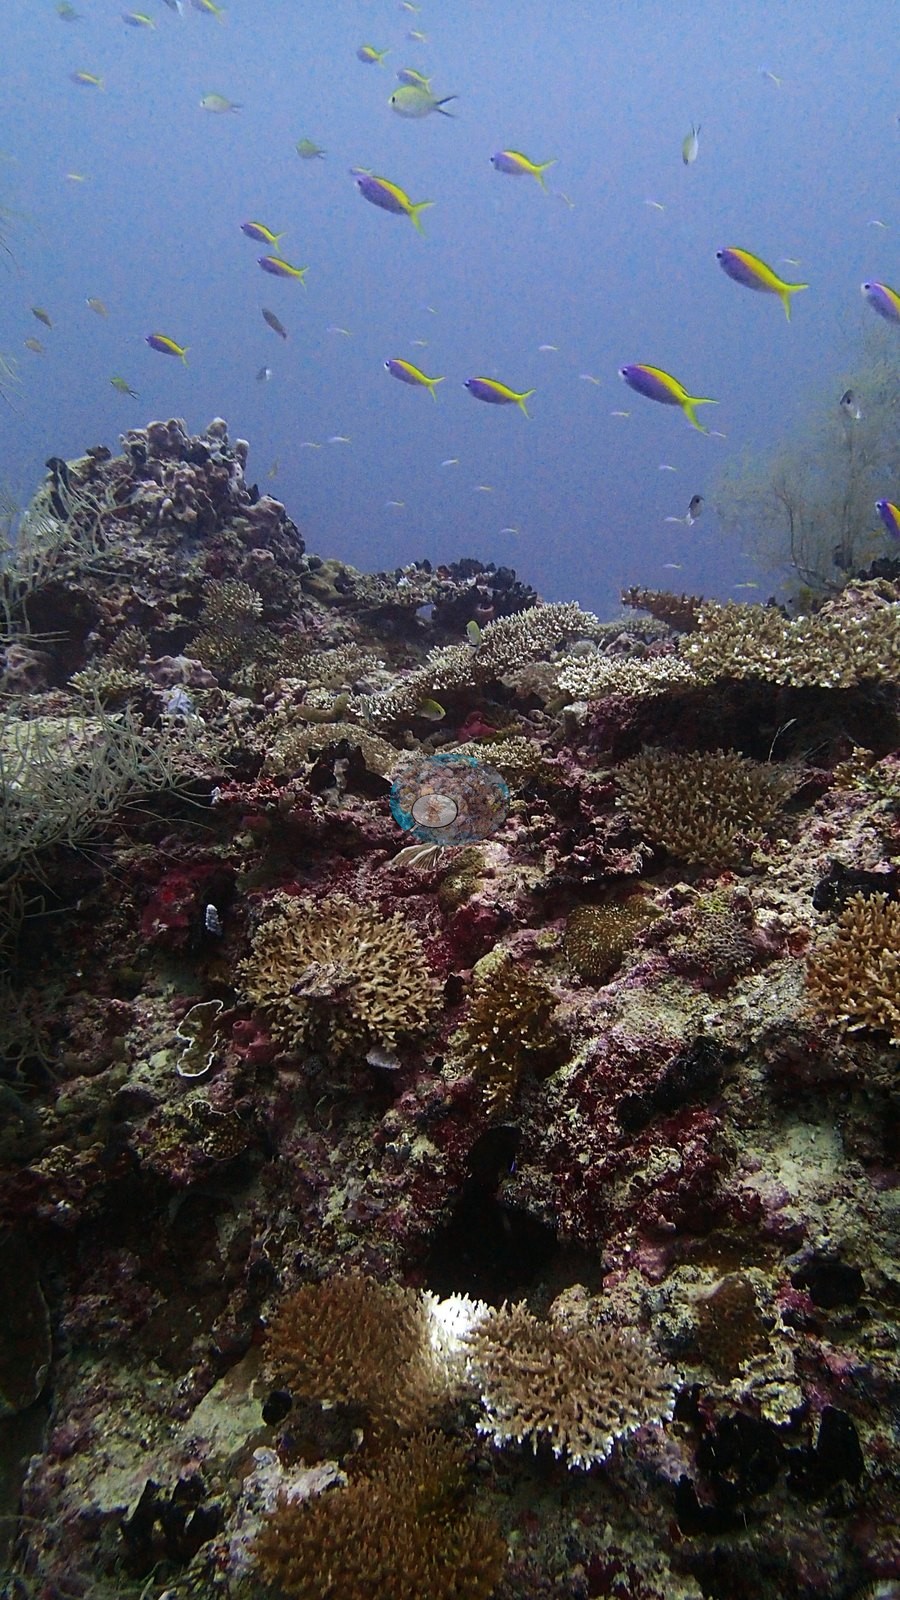
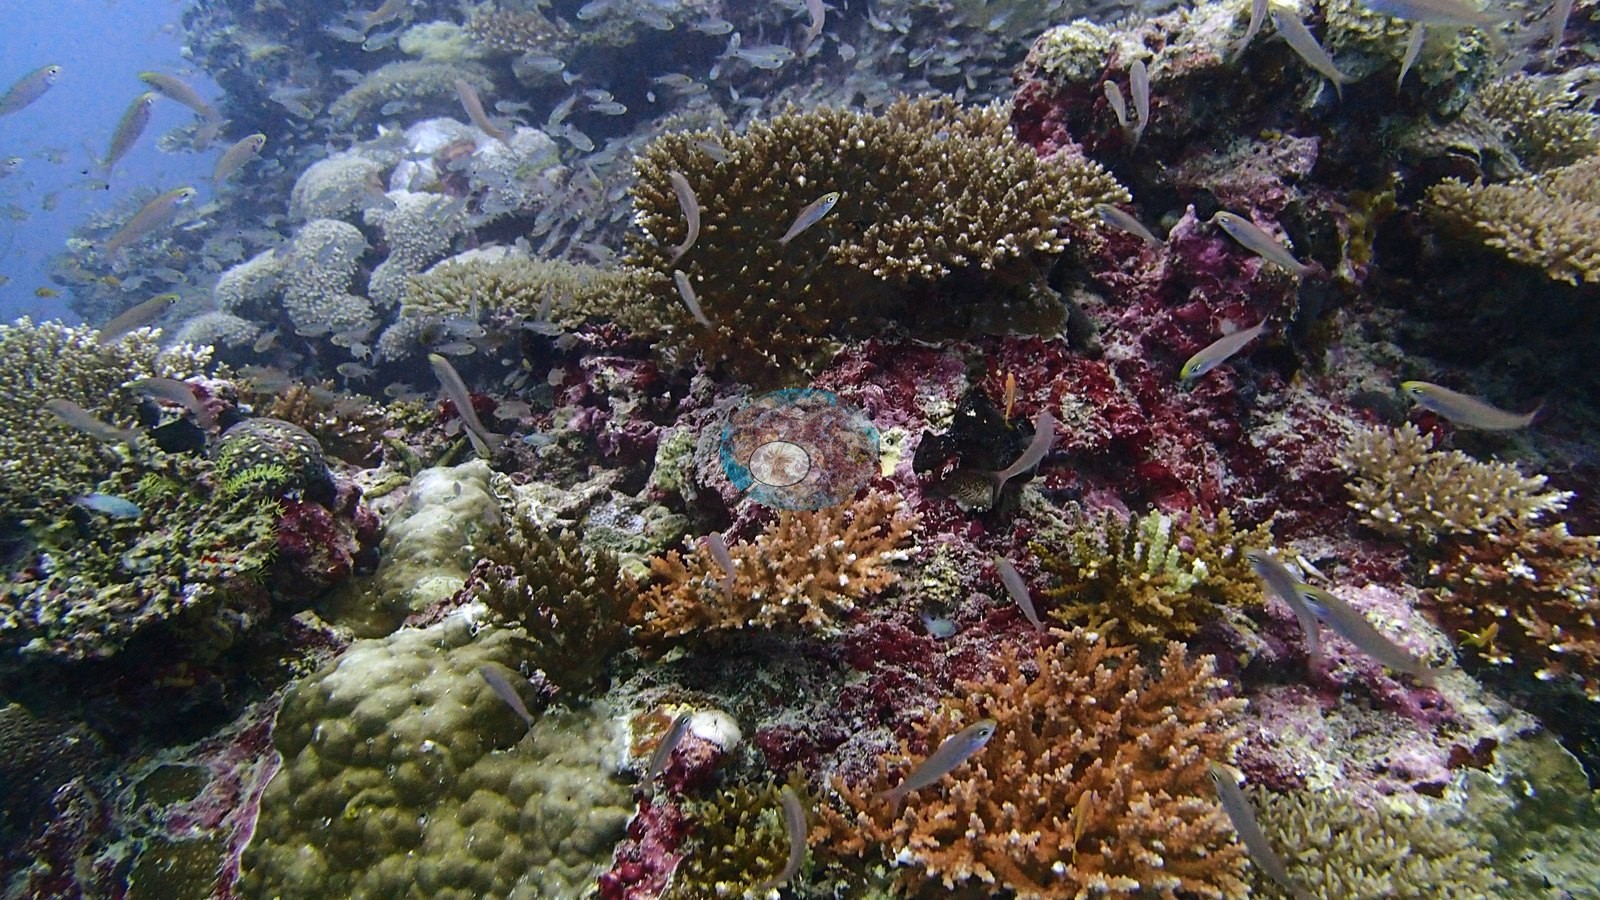
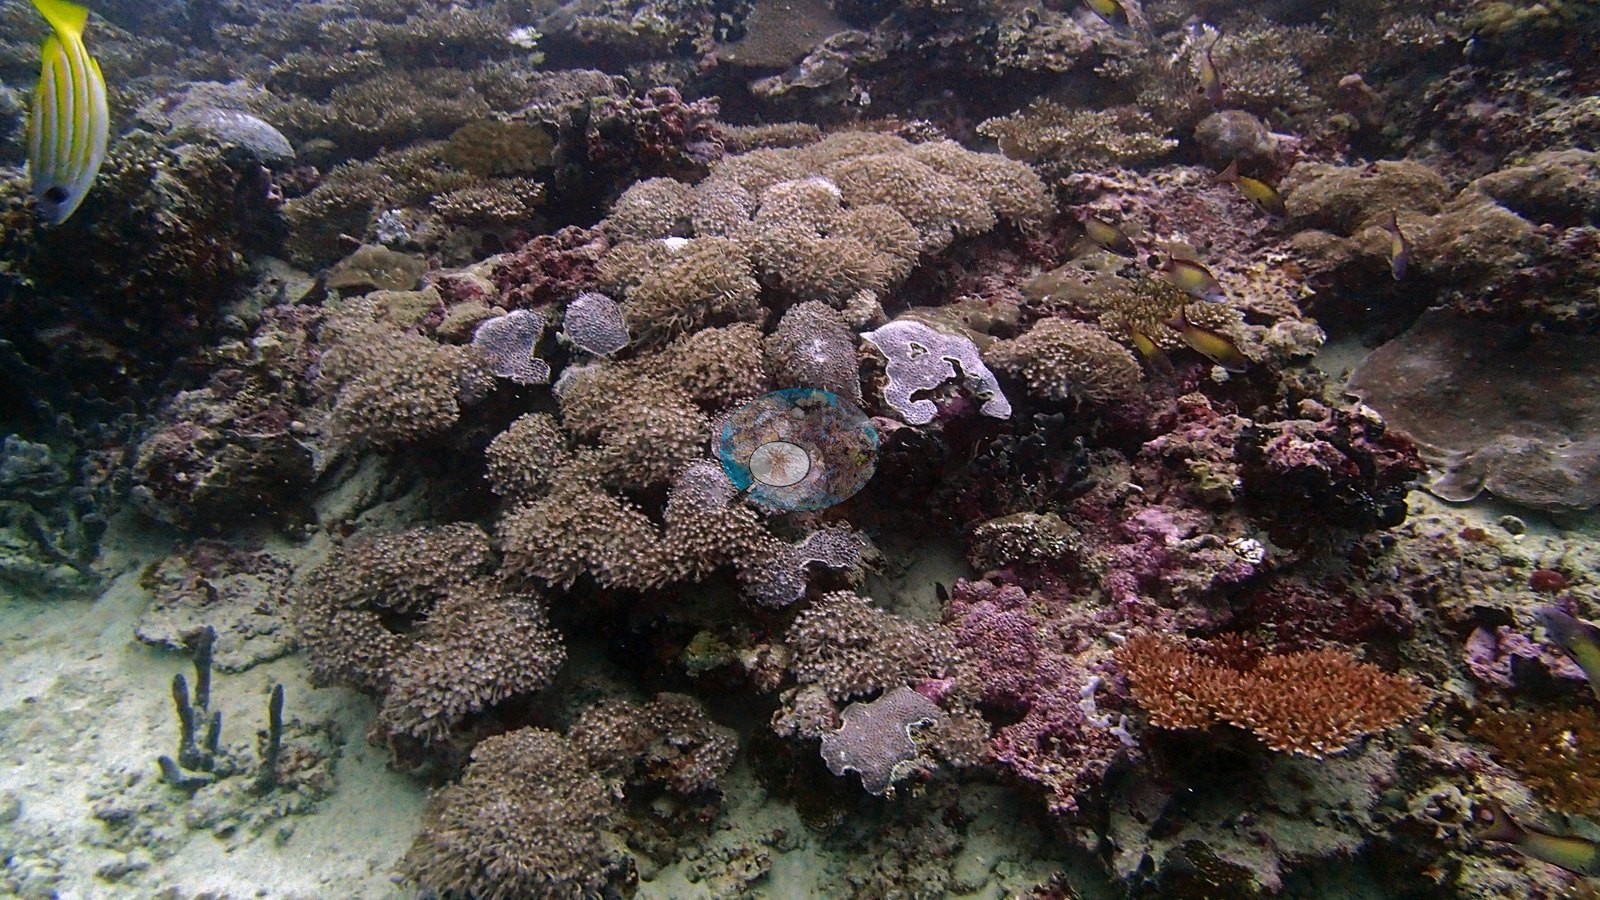
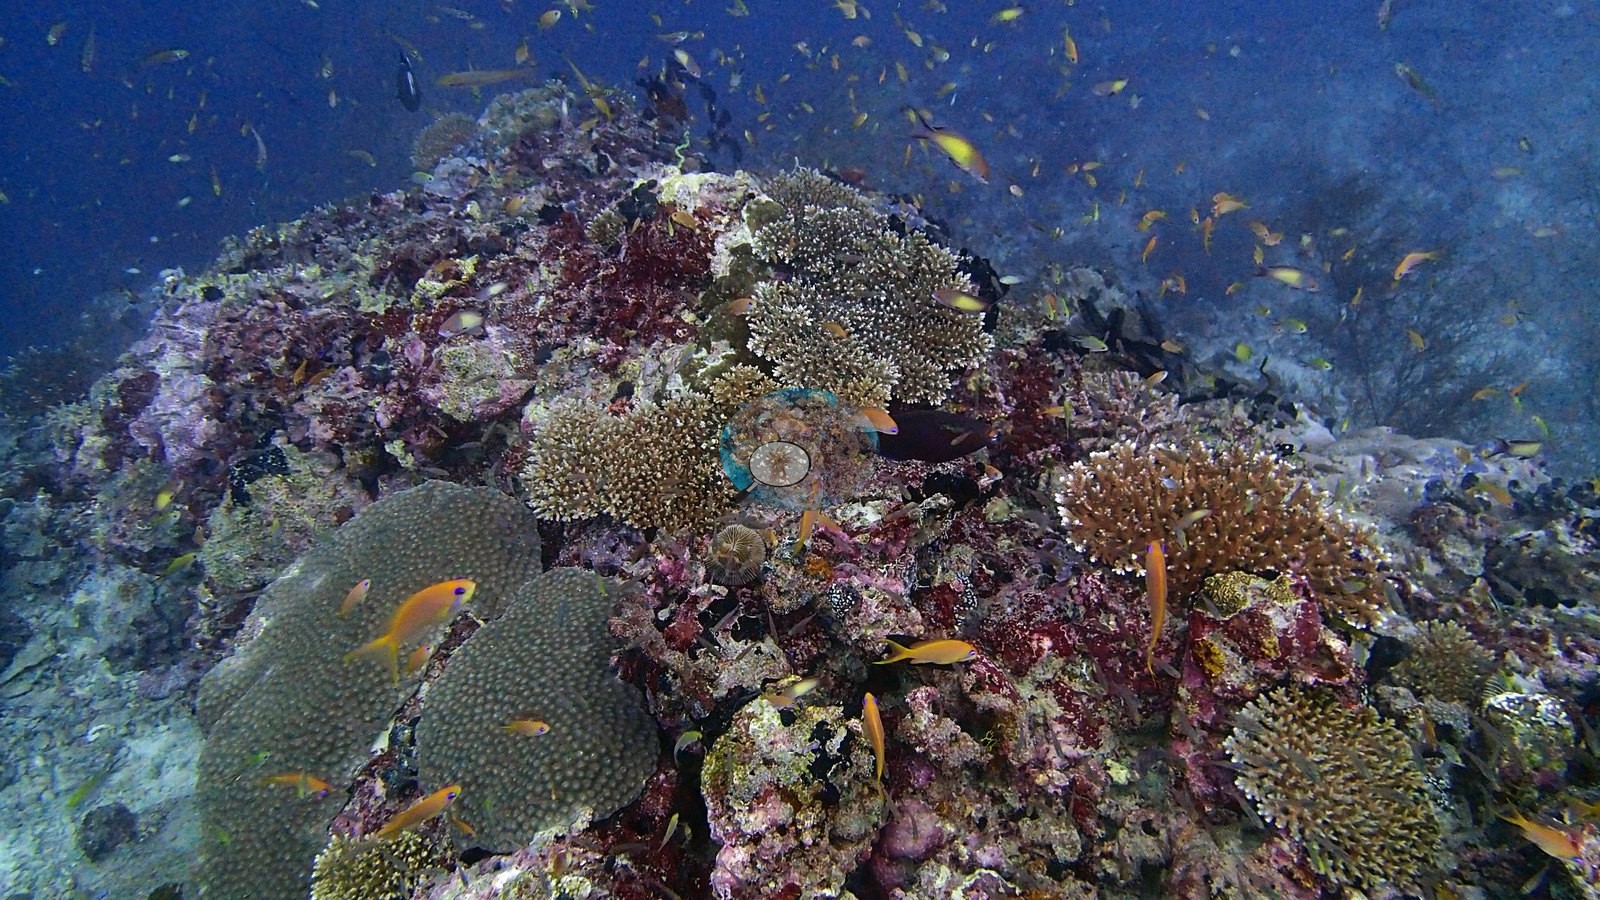
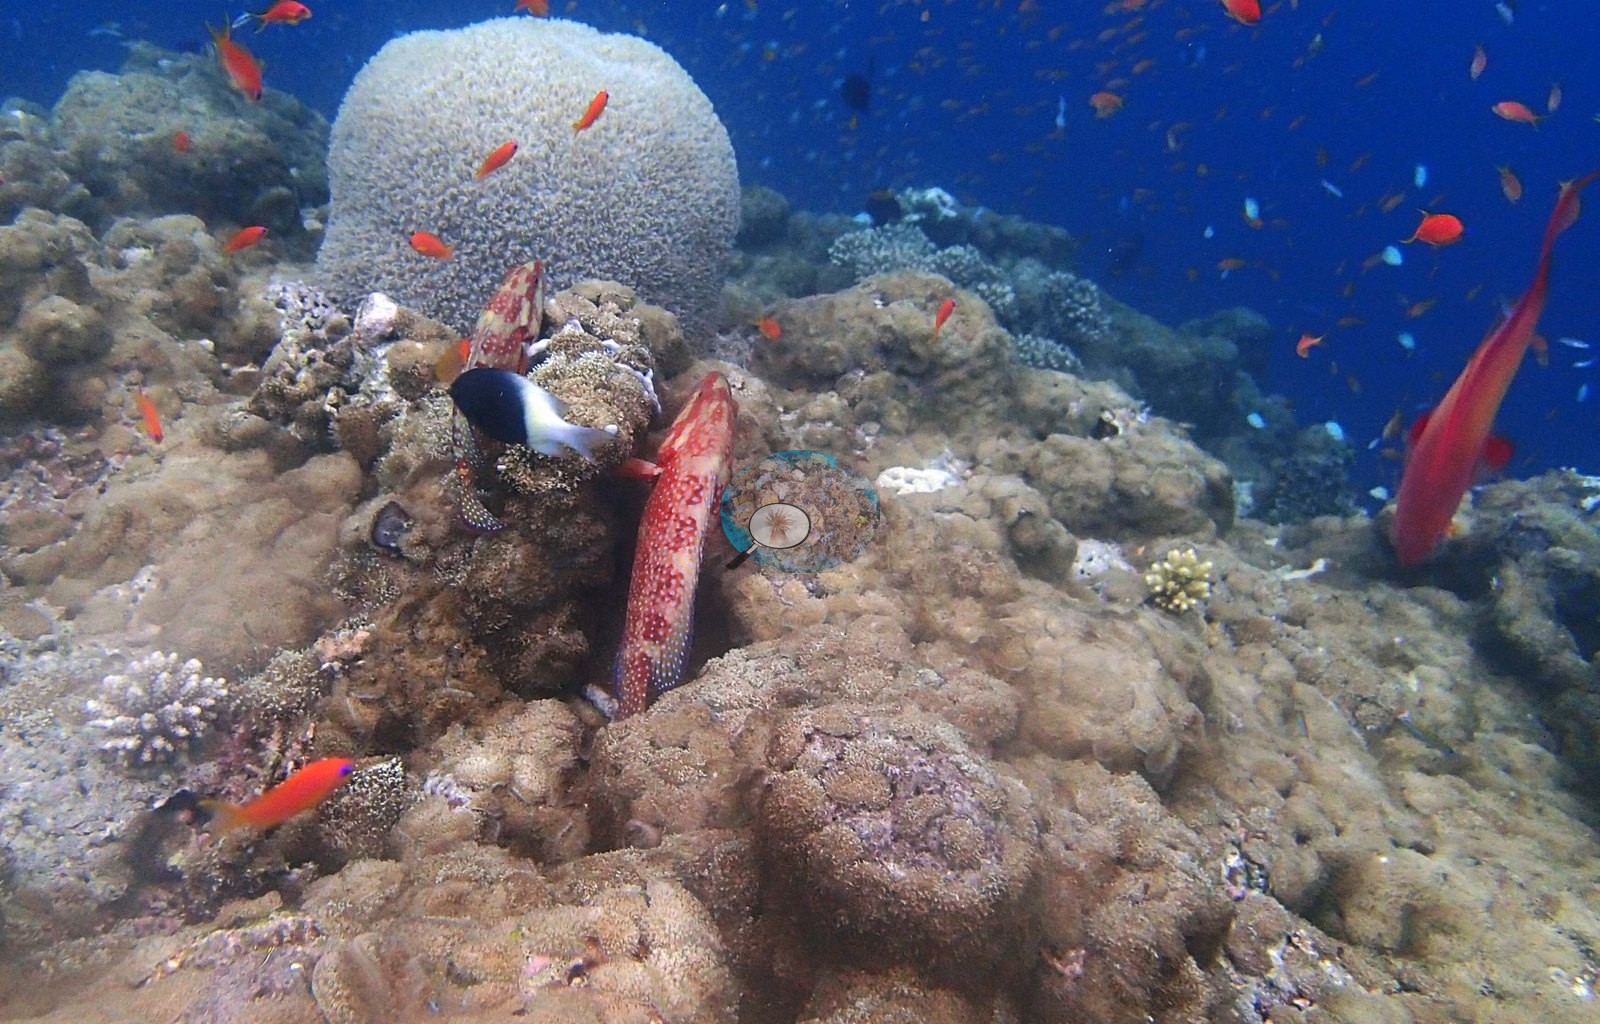
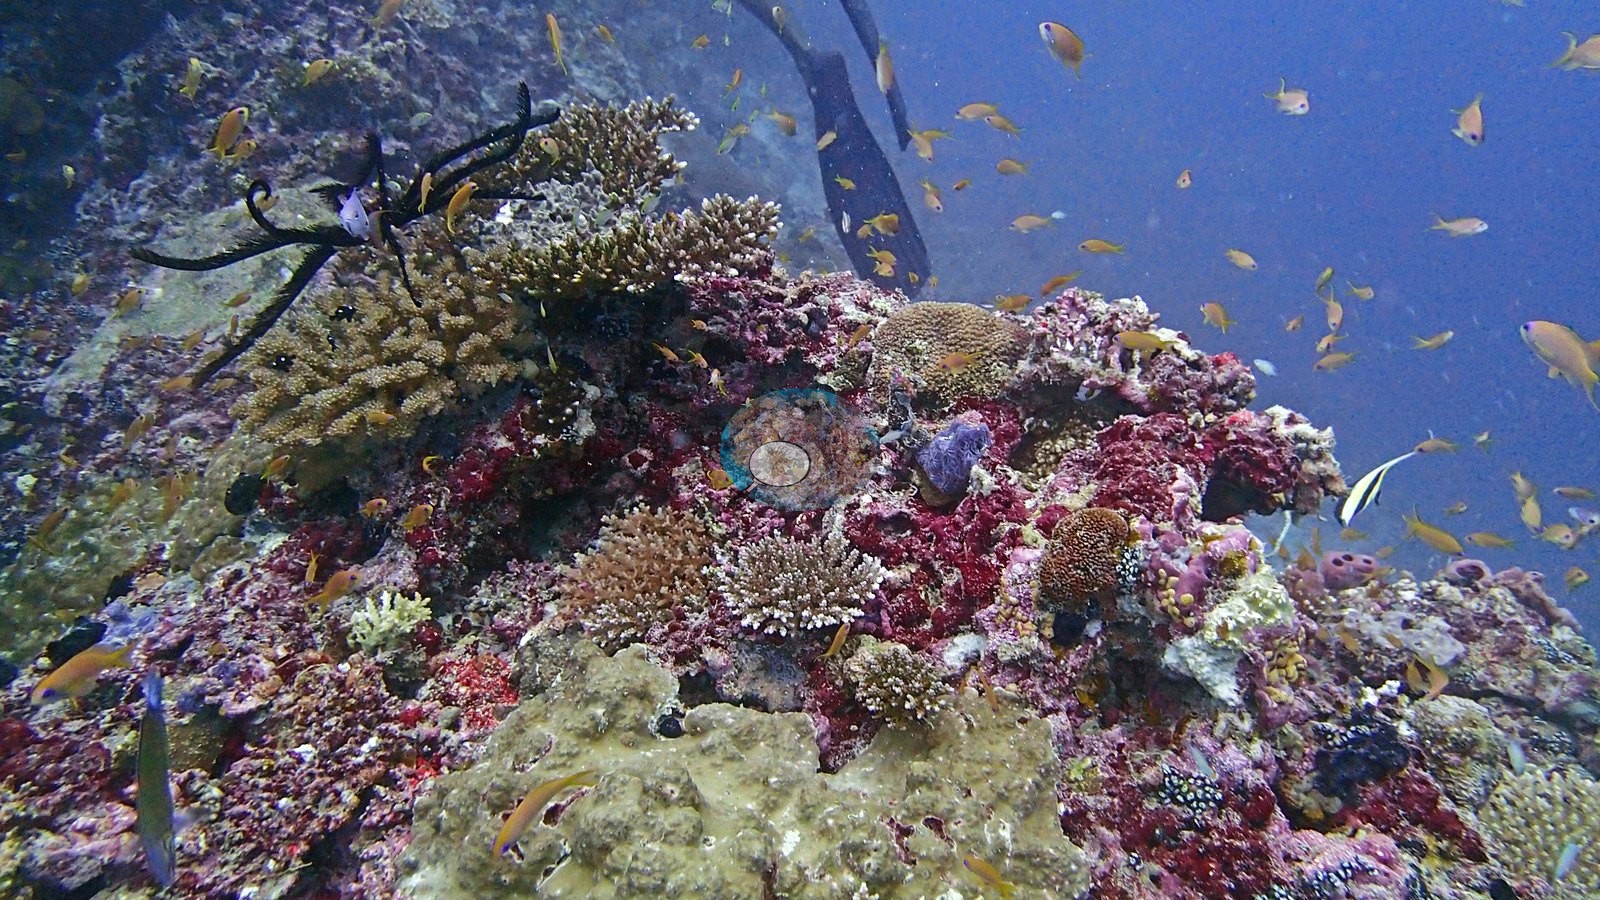
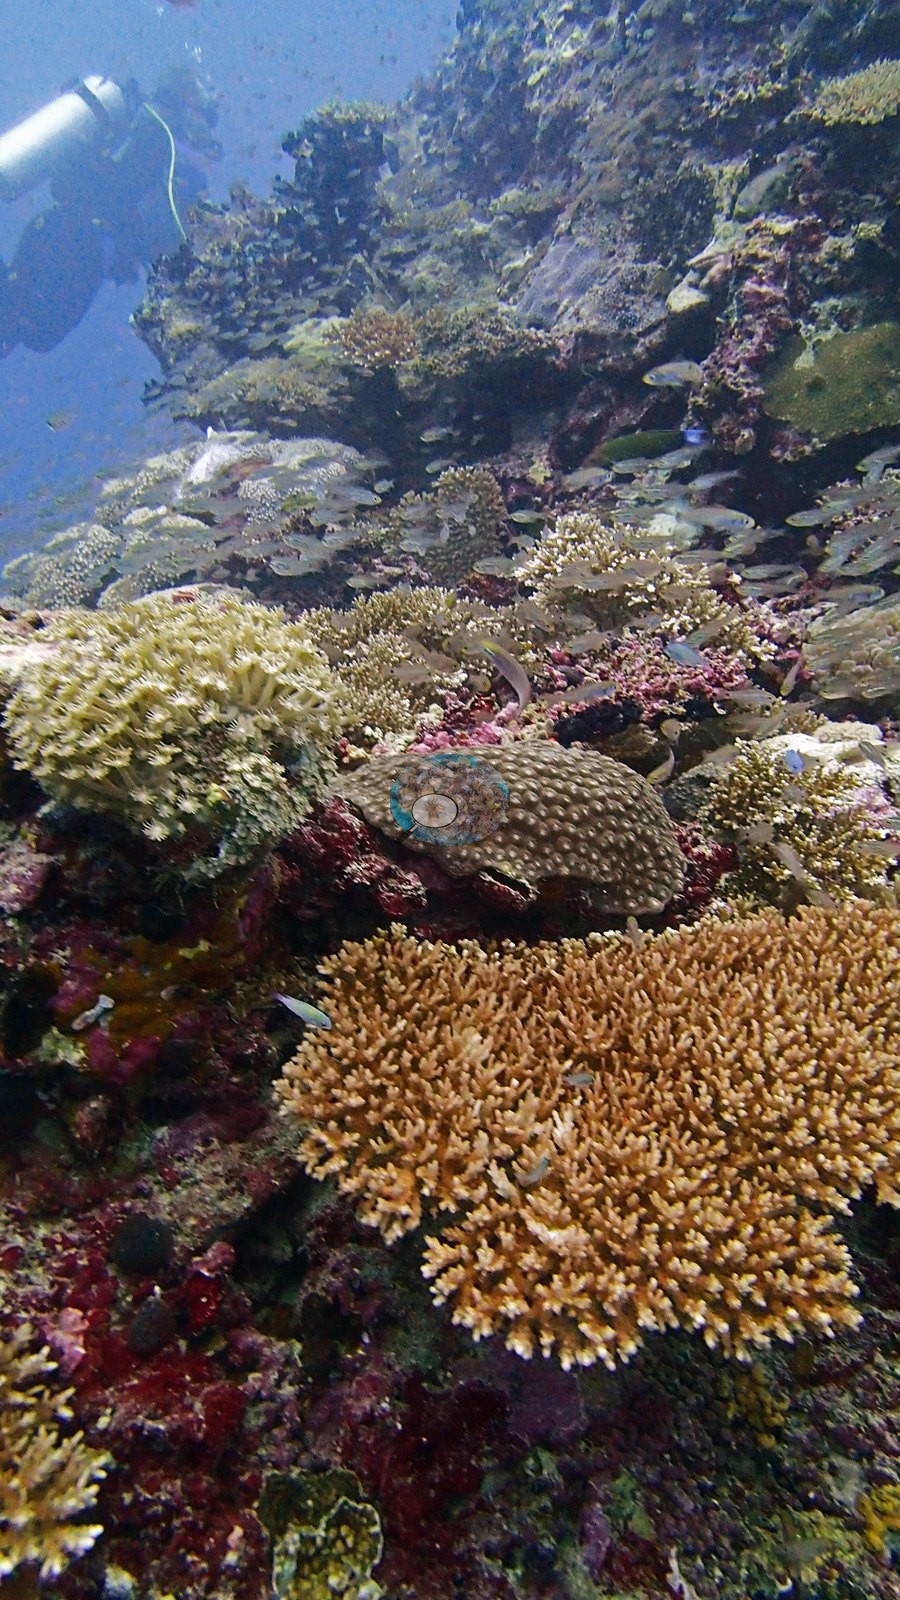
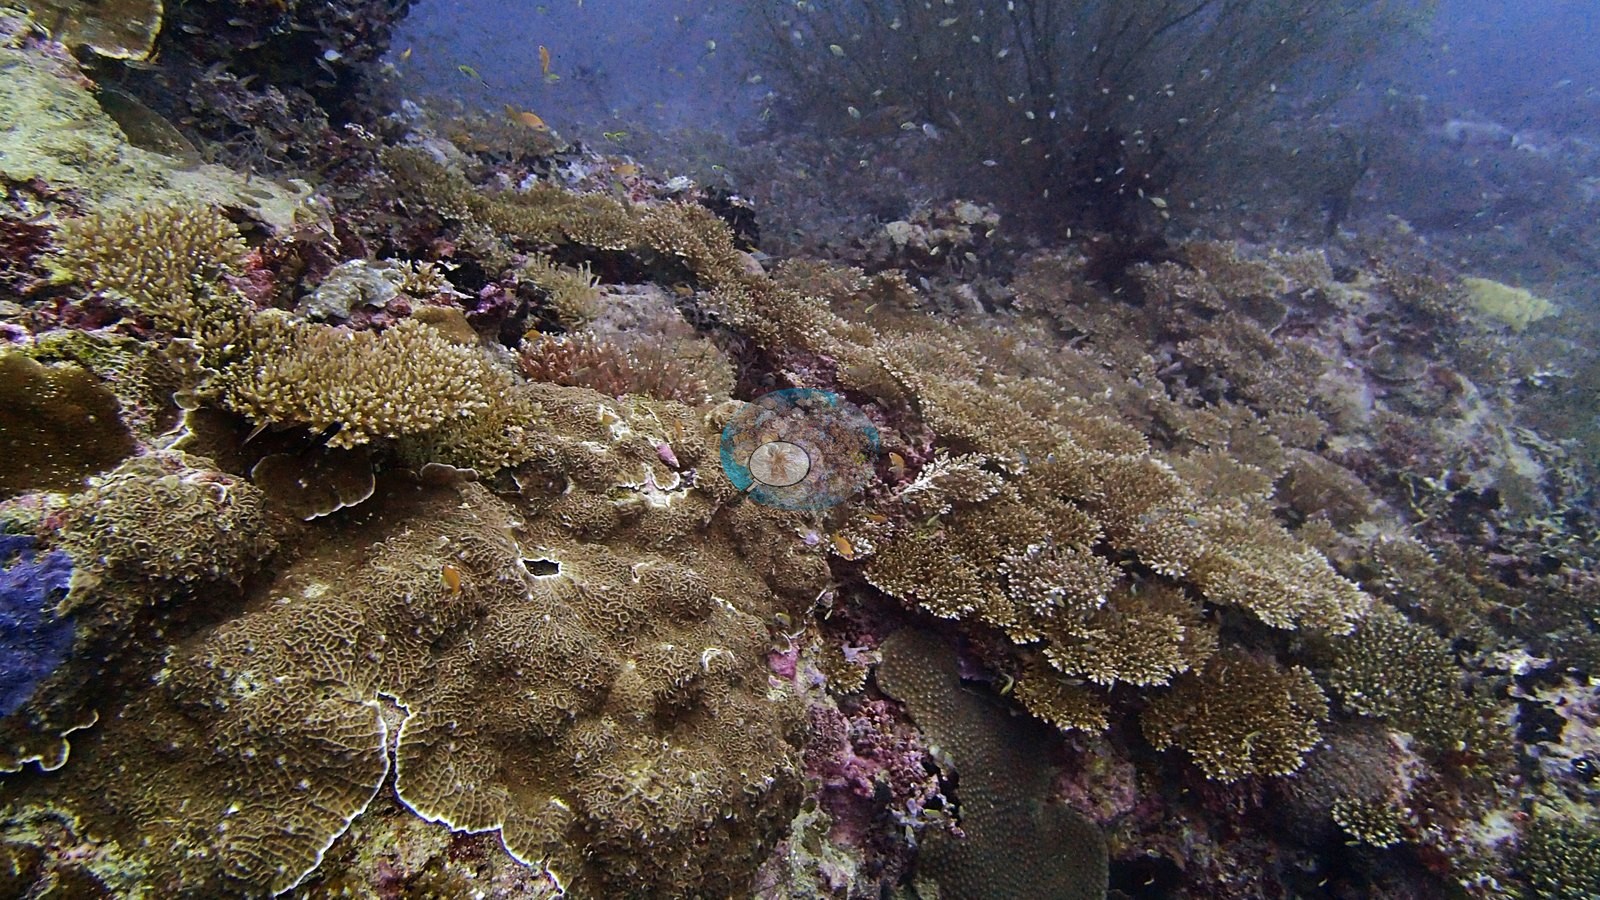
A pinnacle that seems to have shrugged off the bad years: its crown is a genuine coral garden, staghorn and table colonies packed edge to edge, smothered under a permanent orange blizzard of anthias (e.g., Image 1, Image 3, Image 5, Image 6, Image 7, Image 15, Image 16, Image 18, Image 23).
General benthic features
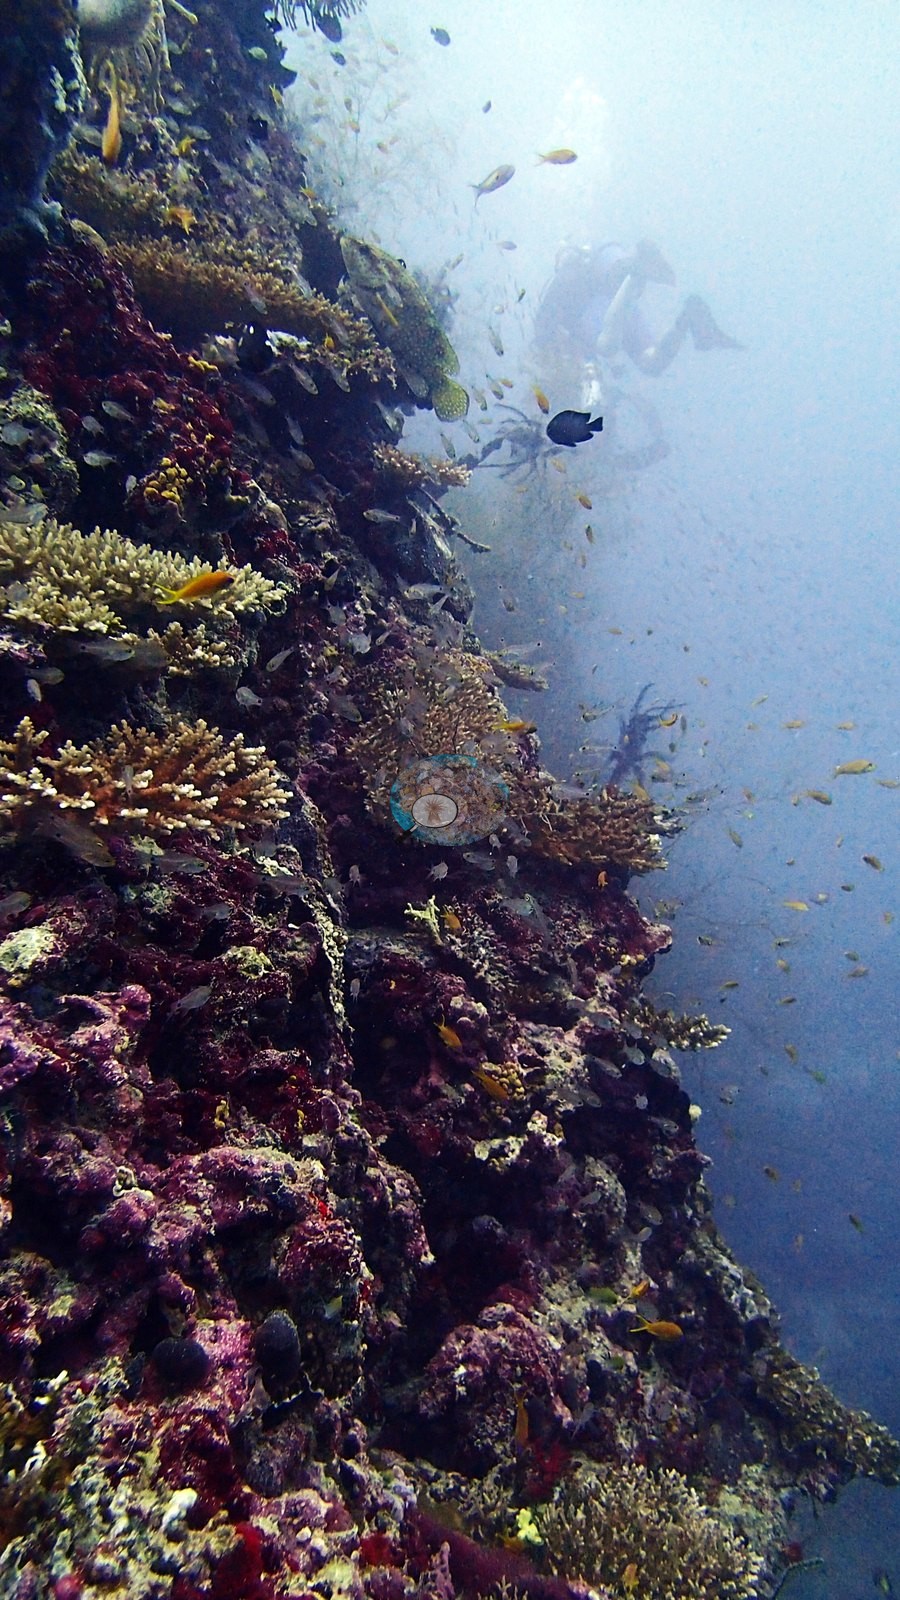
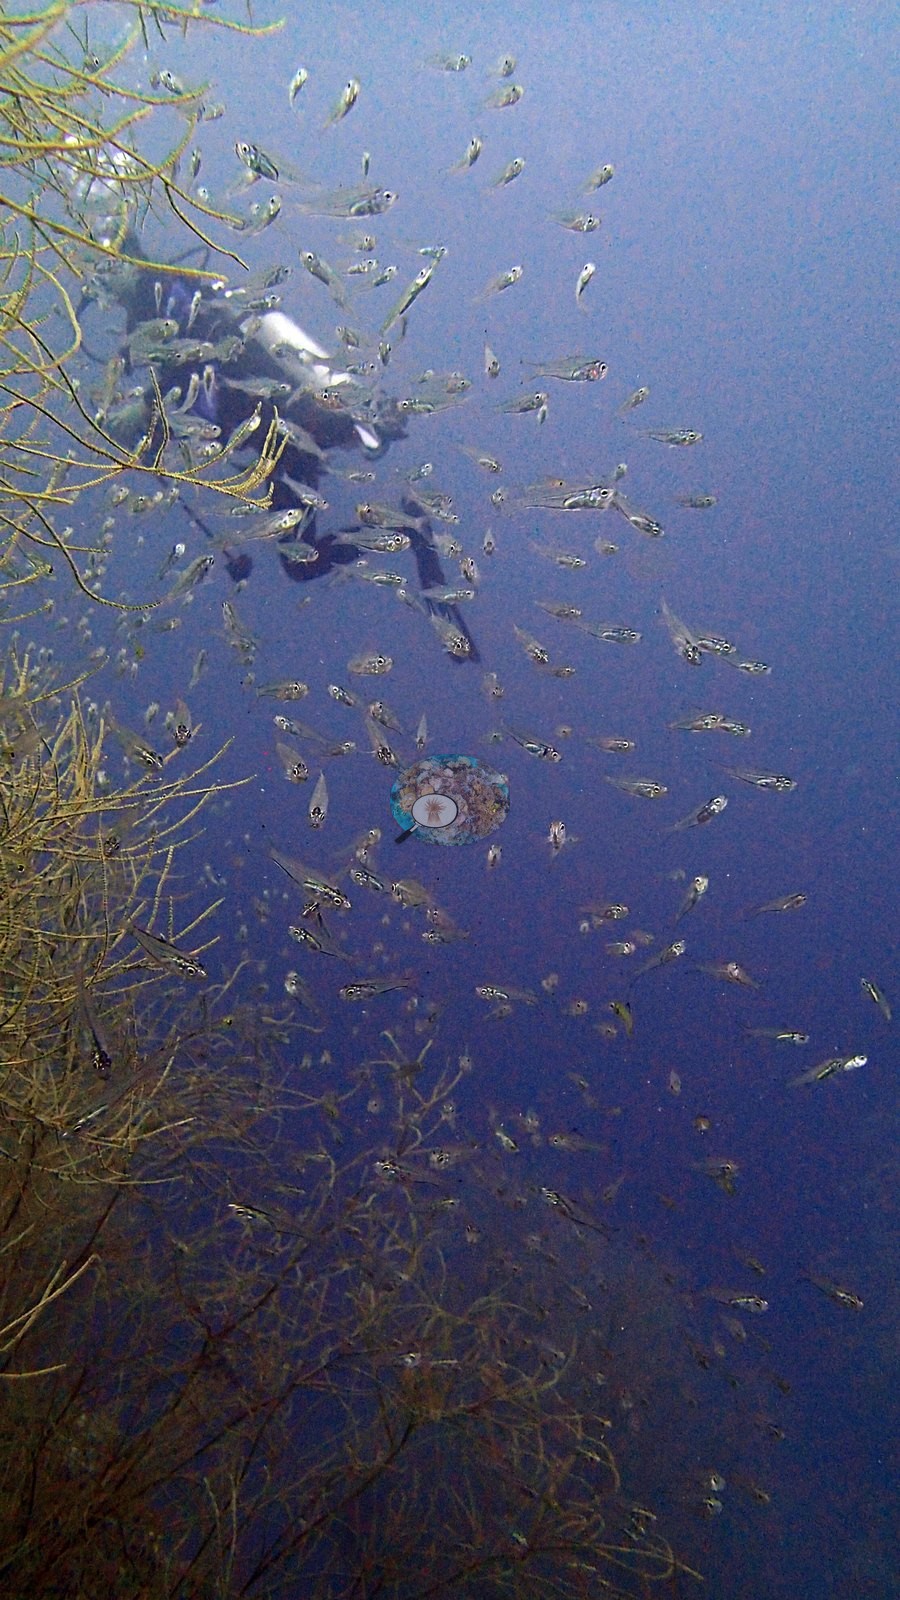
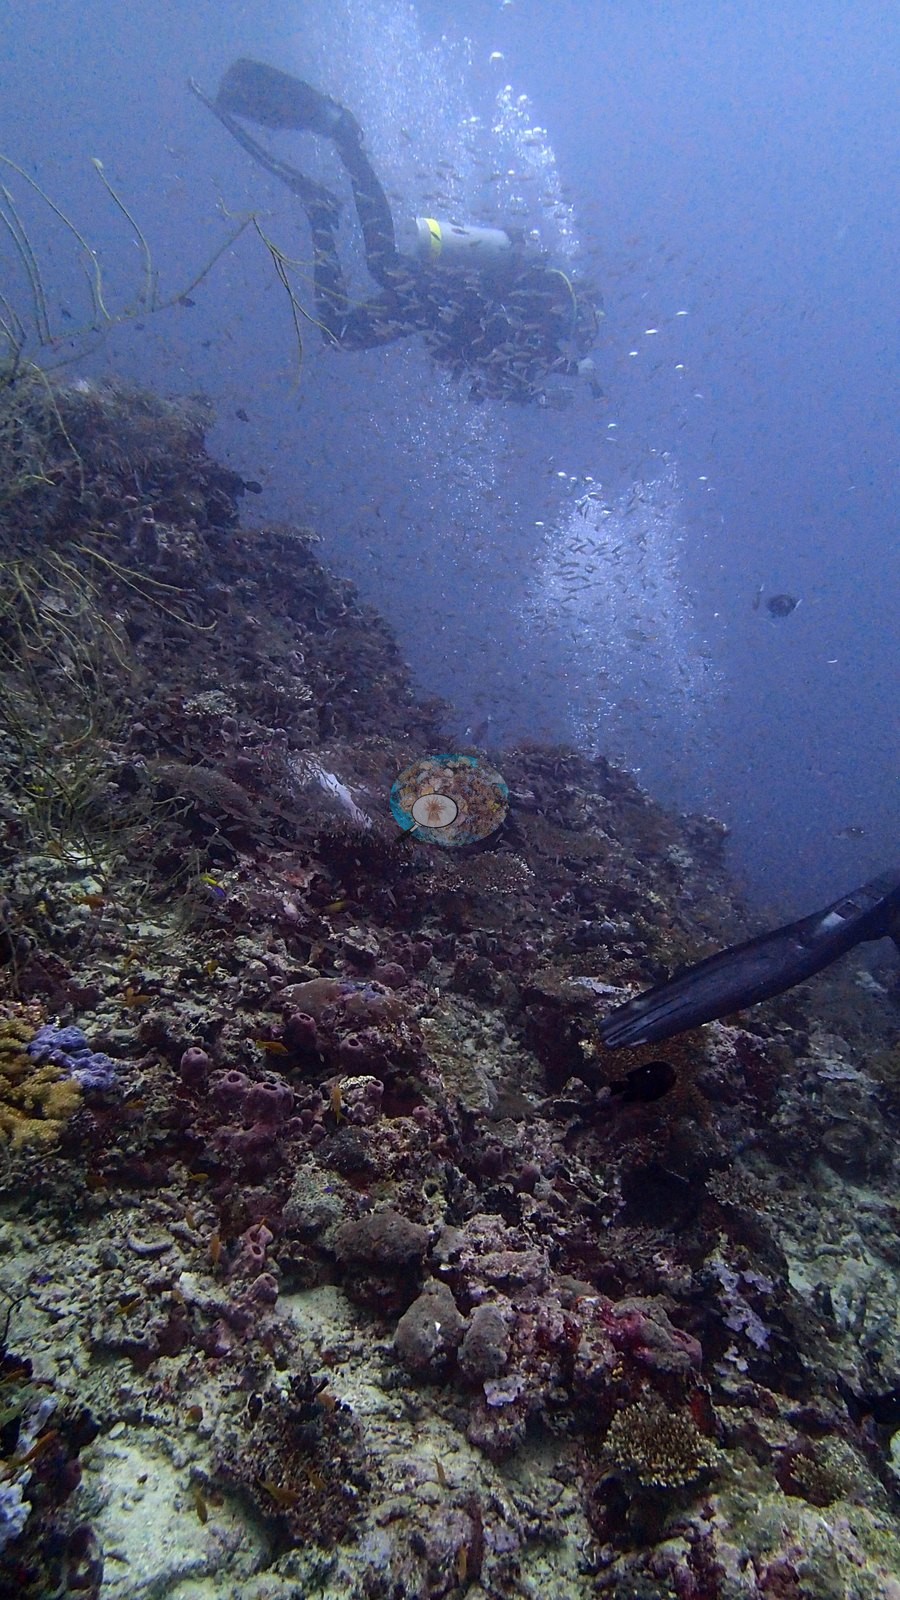
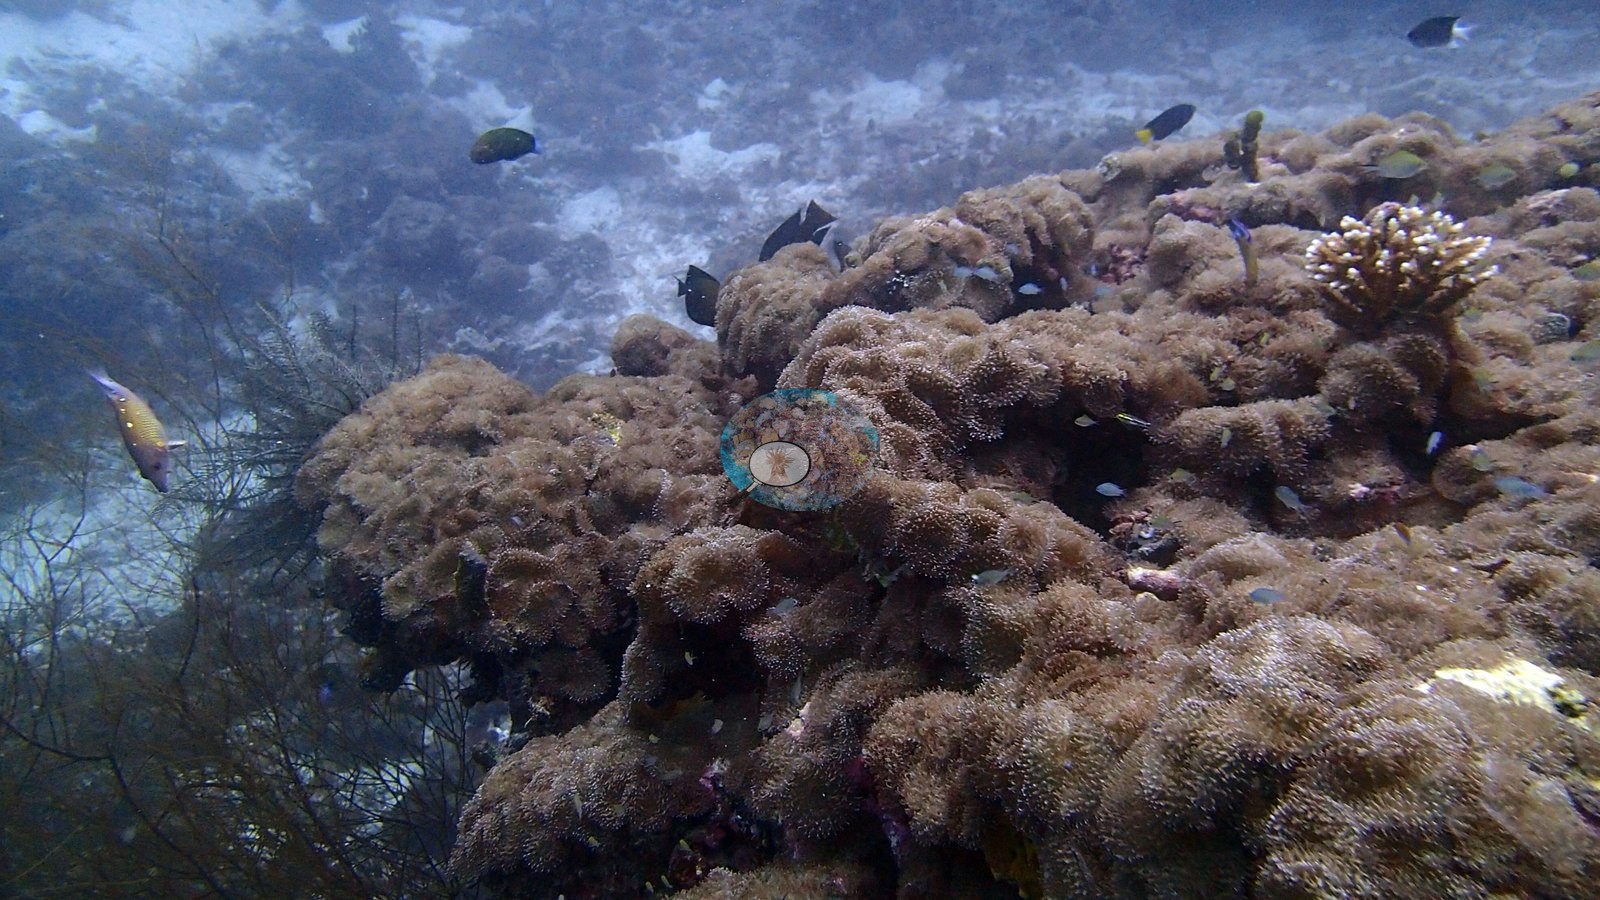
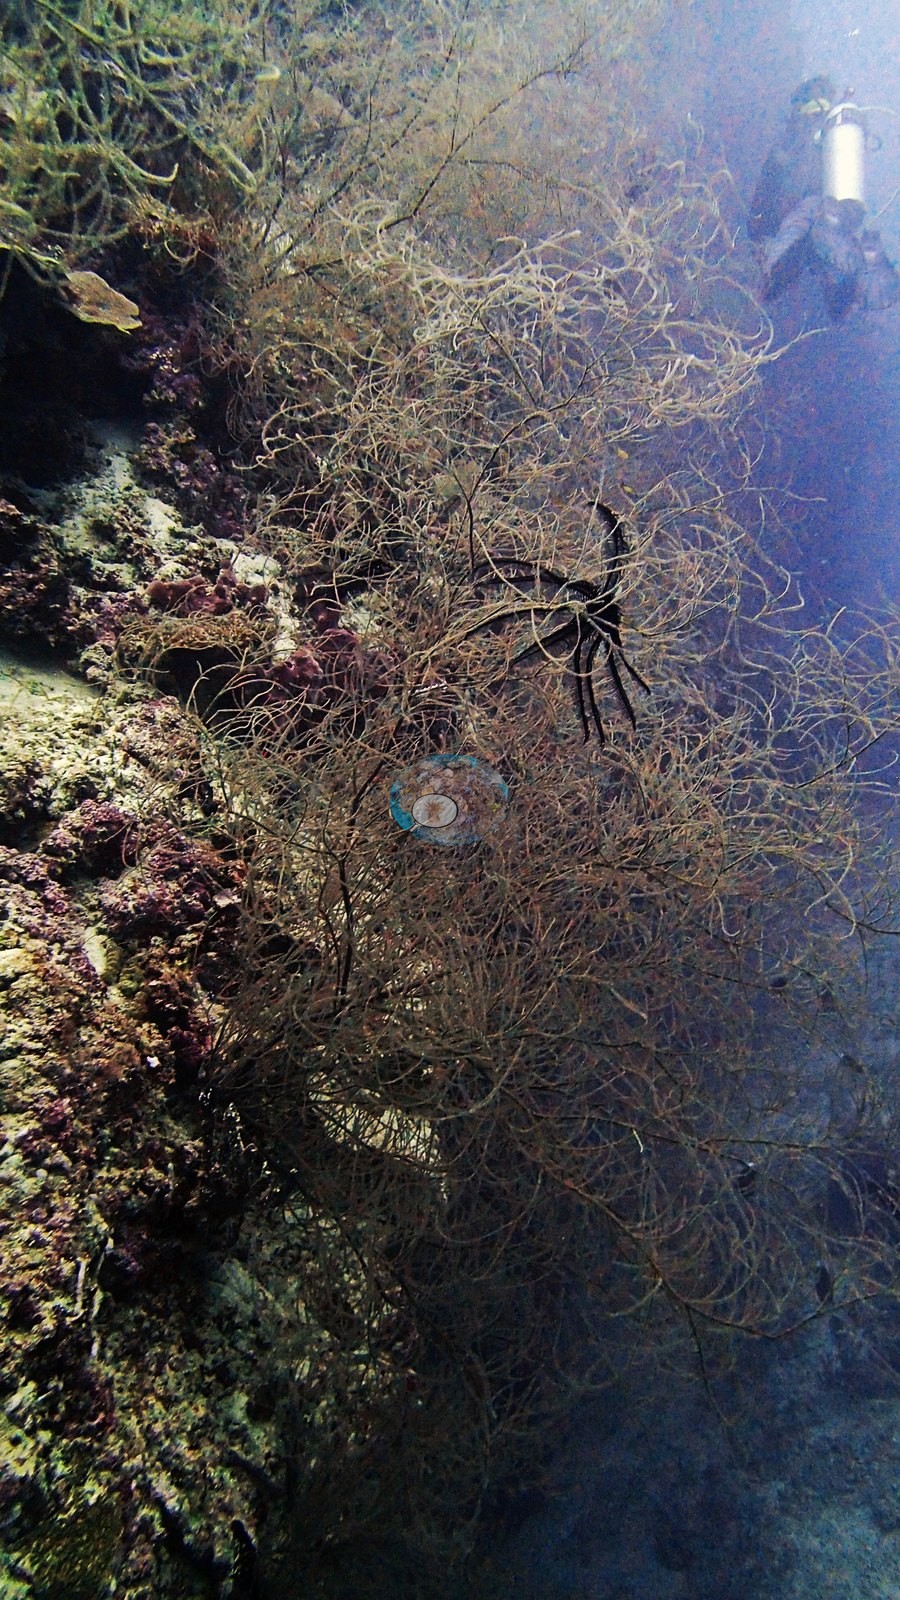
Add crinoid-laden black coral bushes on the deep side and you have the most biodiverse hour of the trip's final days (e.g., Image 2, Image 8).
Coral cover
Coral cover: 23% — photo-derived, and the two methods broadly agree (25% vs 21%). This site's figure is the mean of two independent computer vision passes over Anderson's own frames: a DINOv3 calibrated point classifier reads 25.2% and a CoralSCOP computer vision reads 20.8%, a spread of 4.4 percentage points. The map publishes the mean so sites can be sorted against one another, but the honest statement of what is known here is the 21–25% range: the two products have different denominators and should not be treated as one measurement.
Stressors
No crown-of-thorns starfish (COTS) or other corallivores evident.
Fish and other fauna
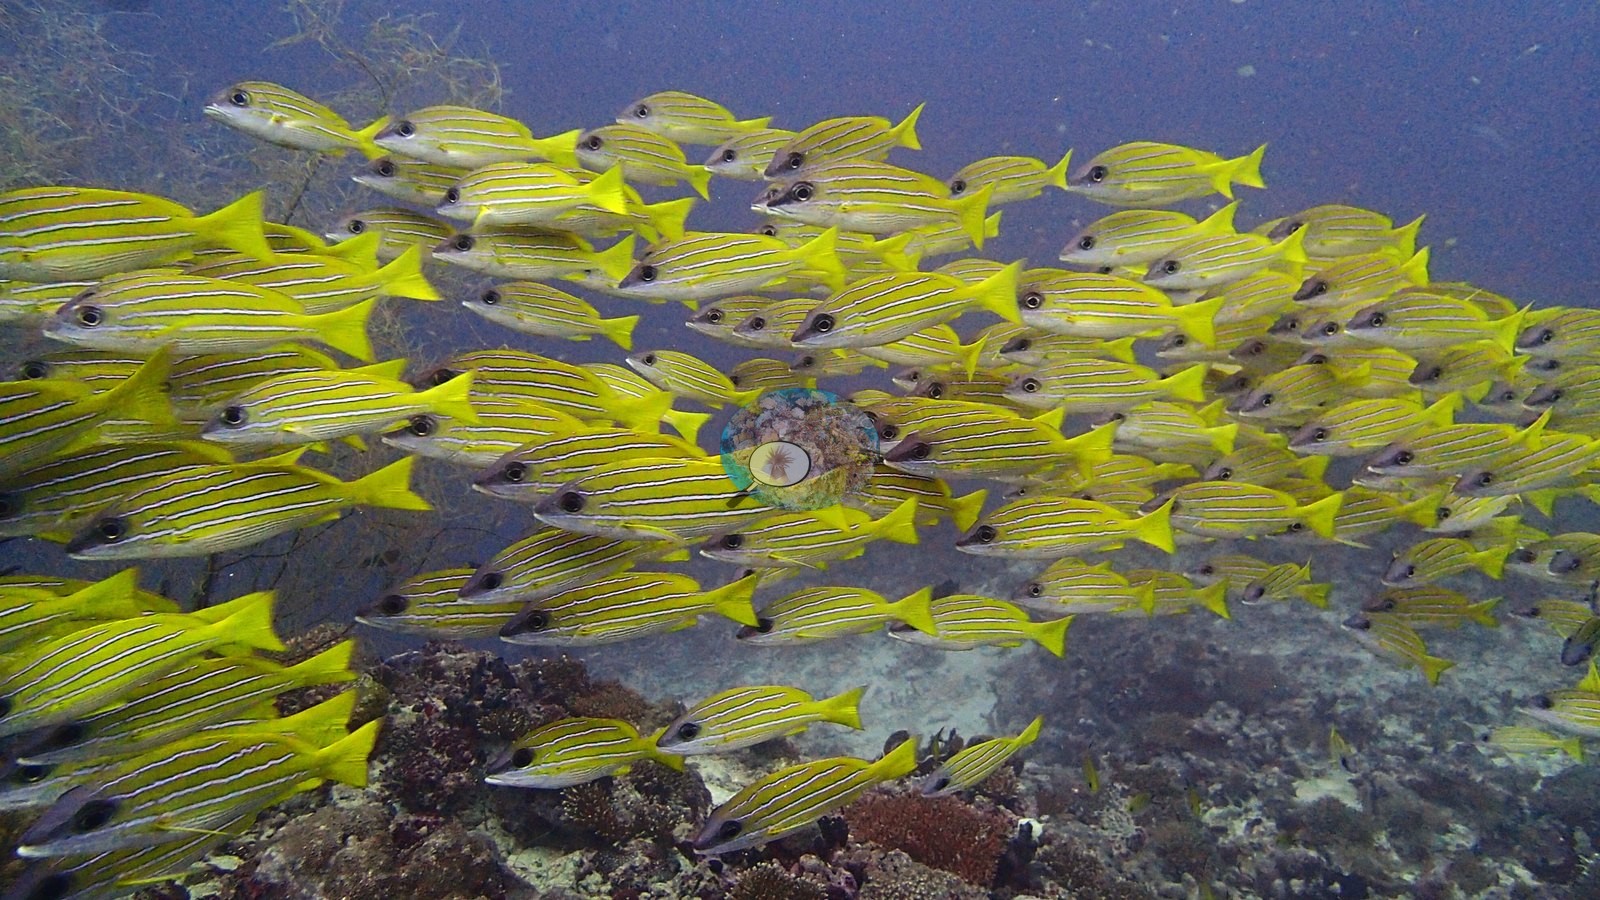
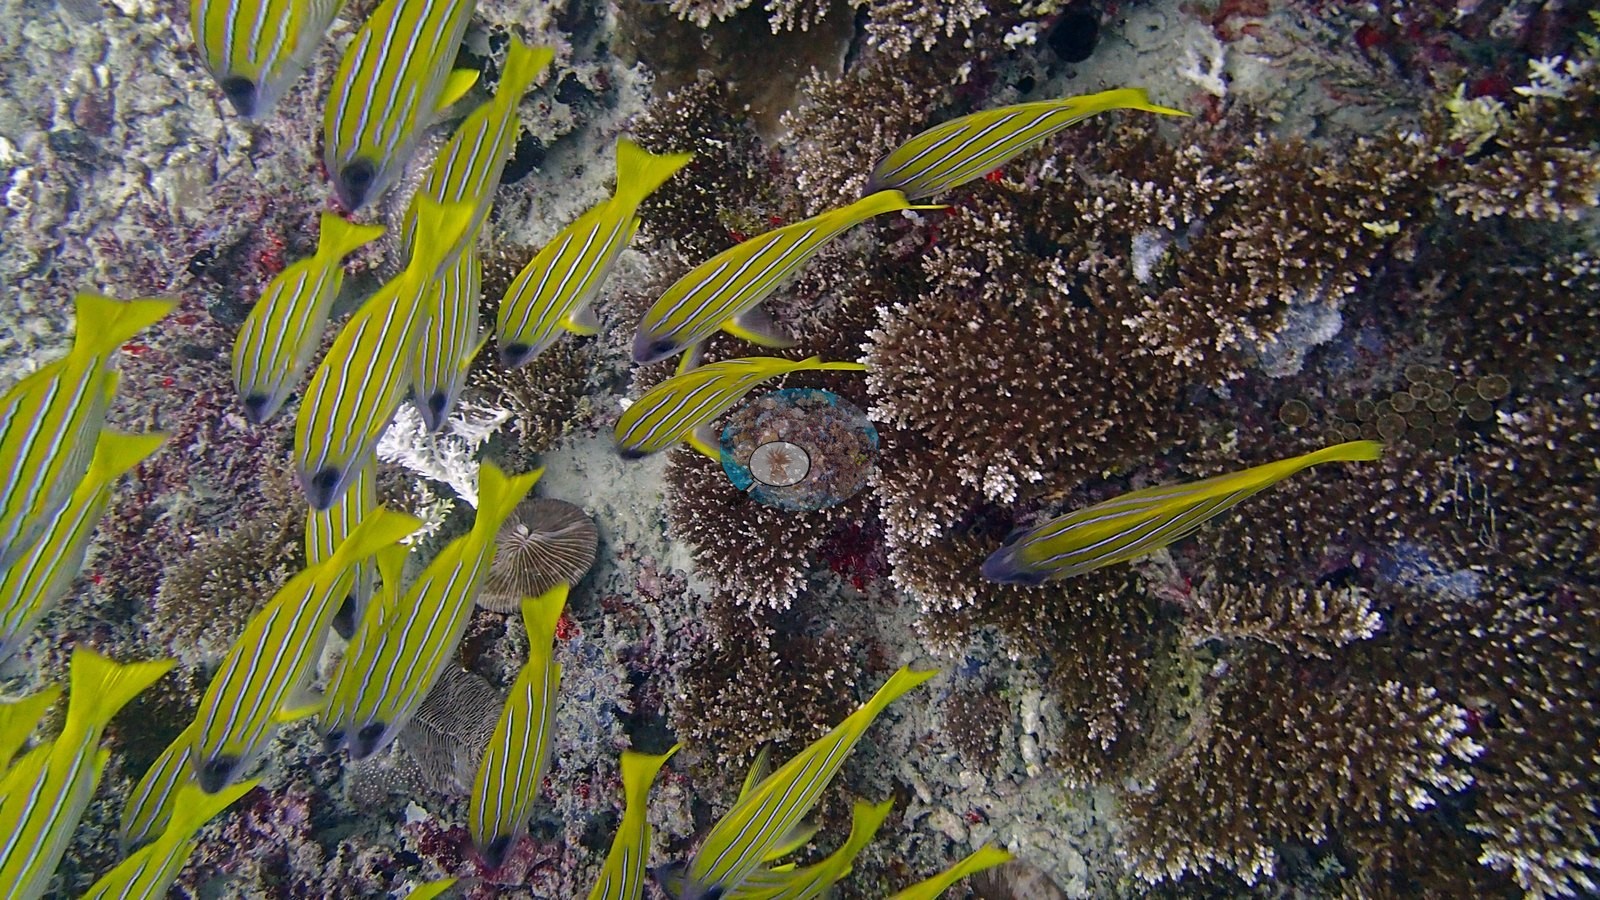
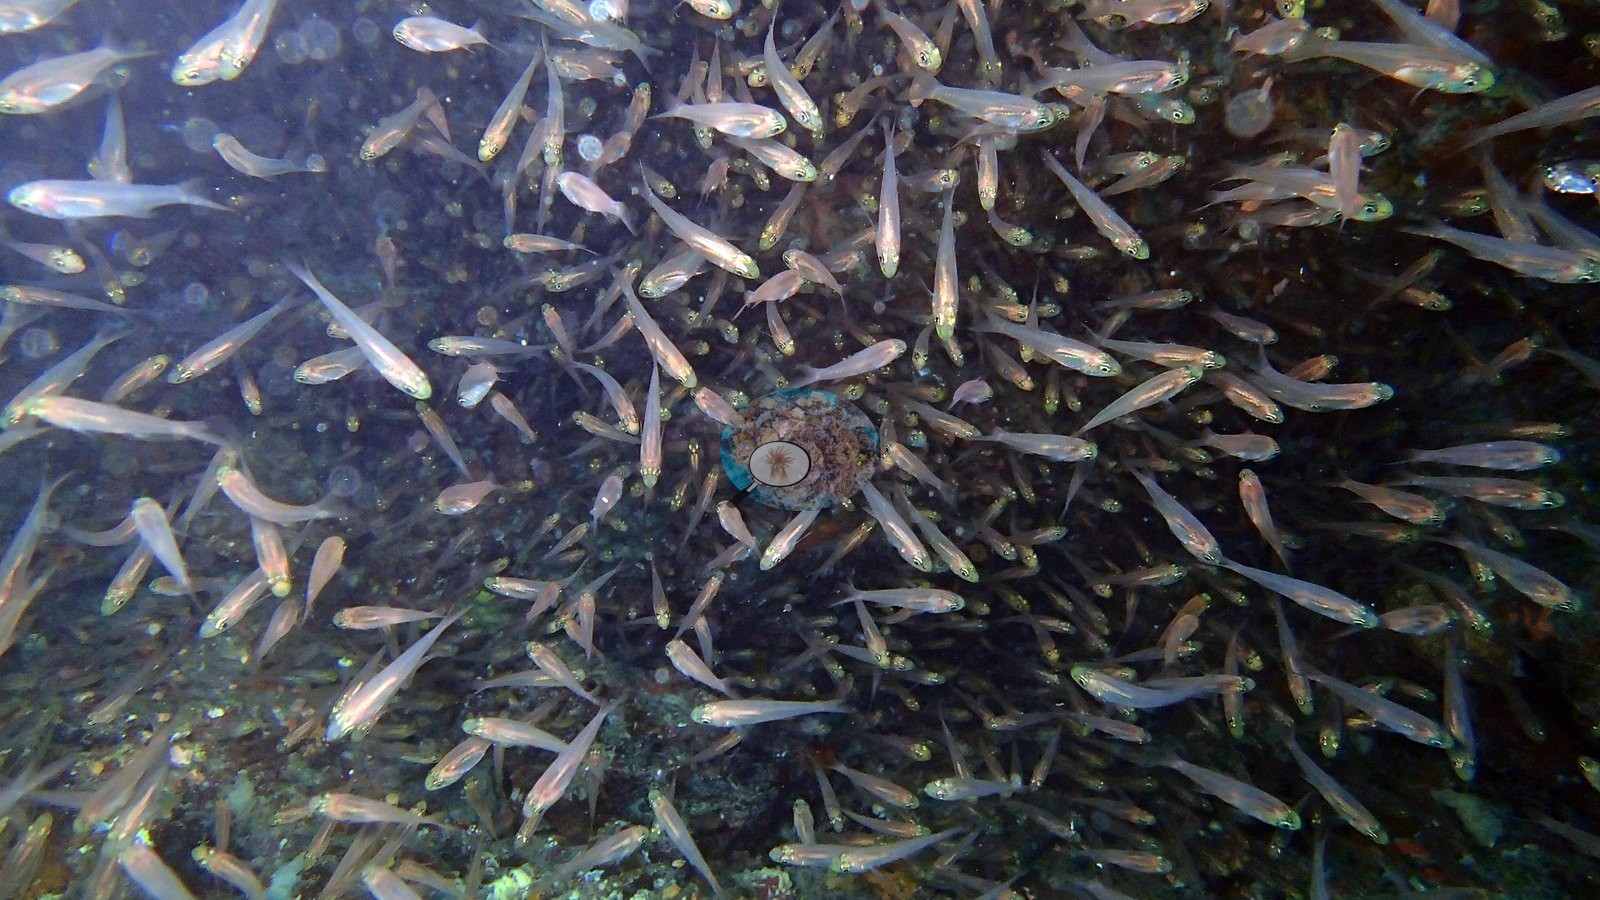
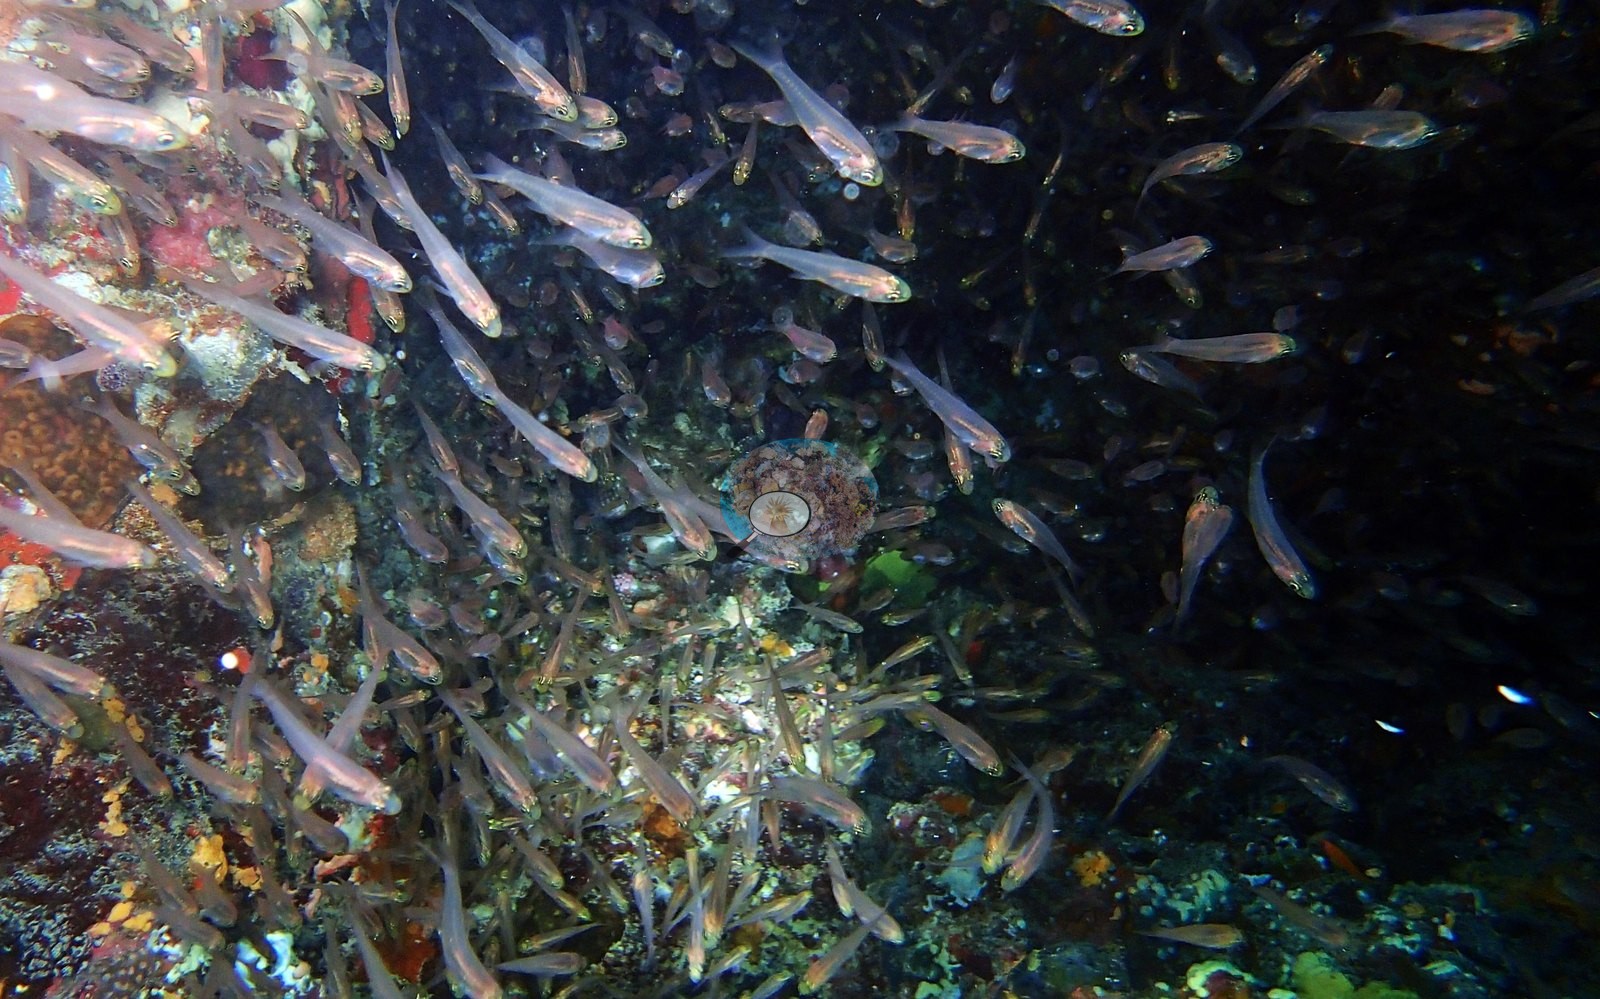
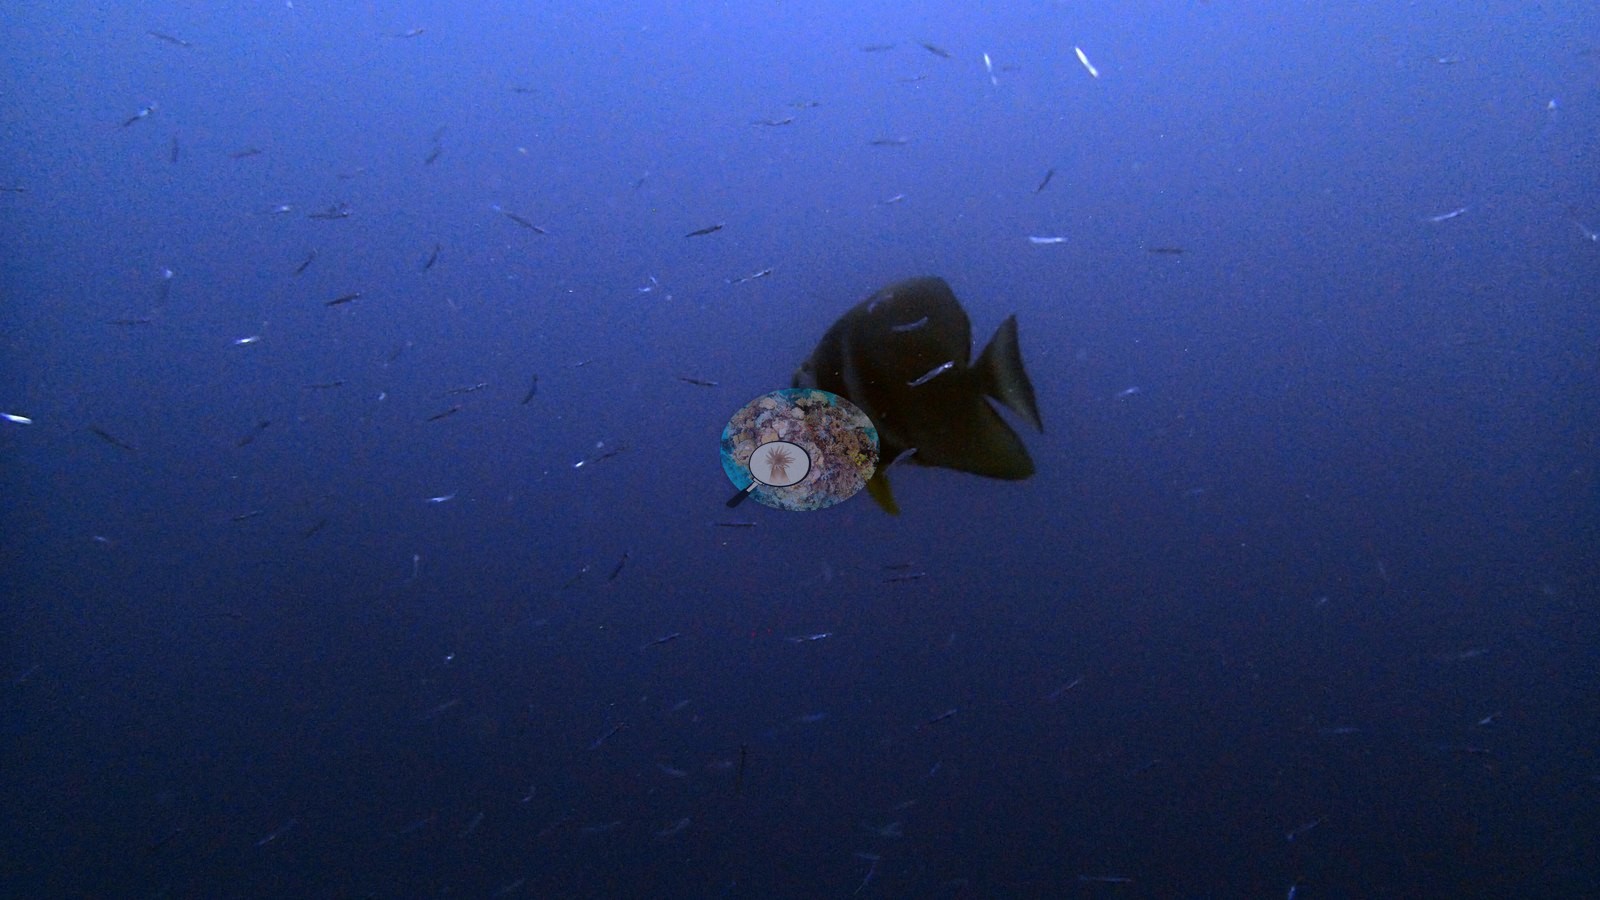
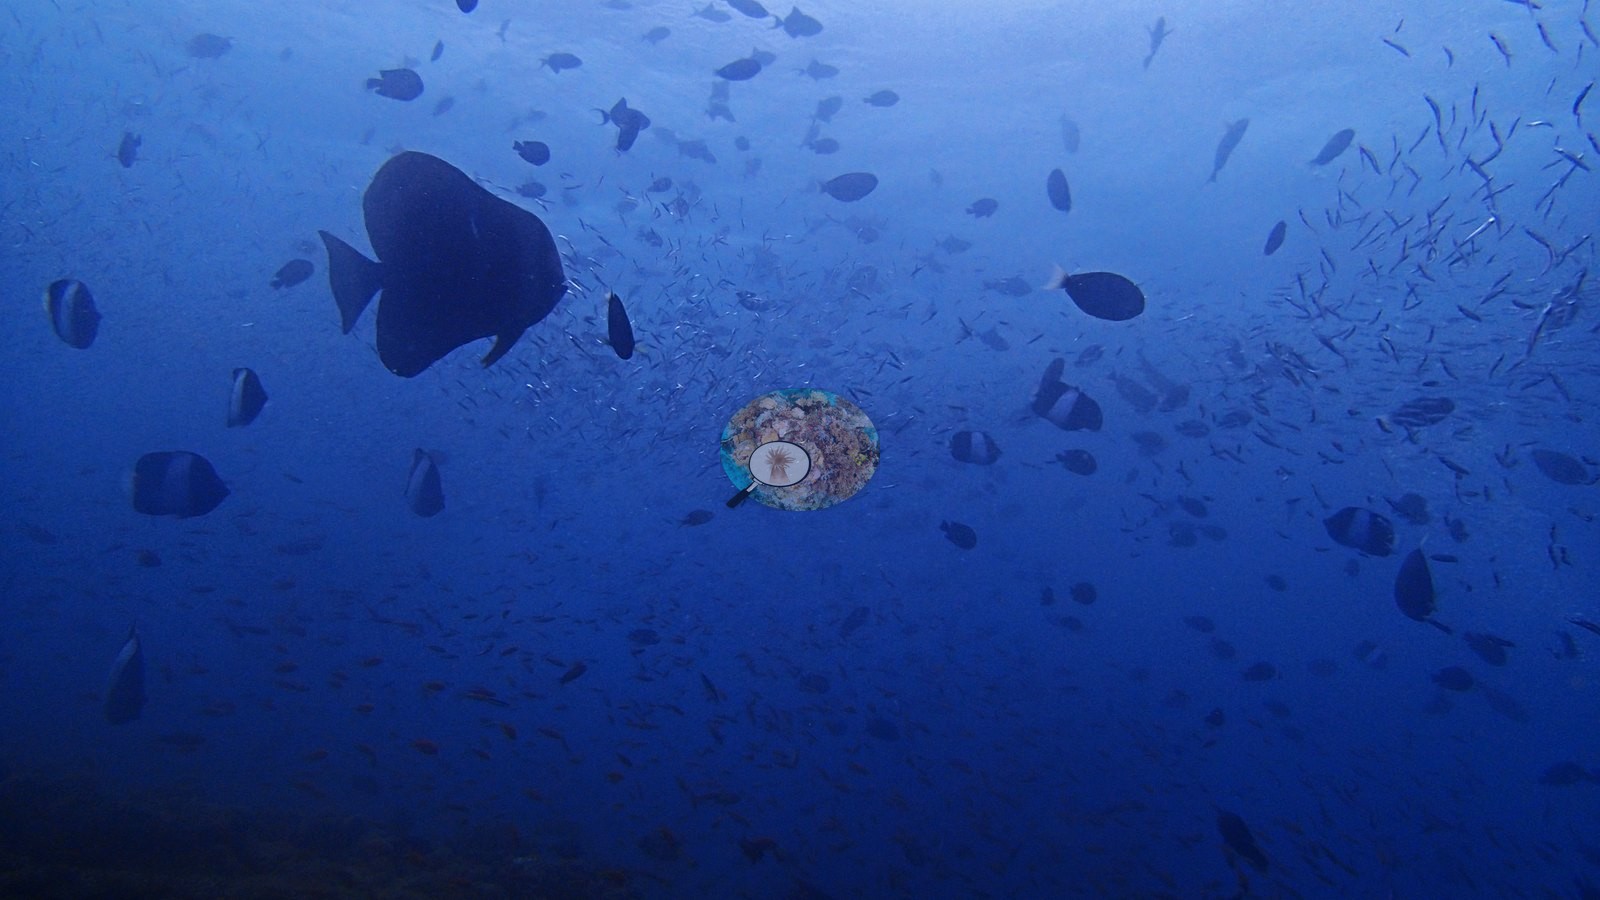
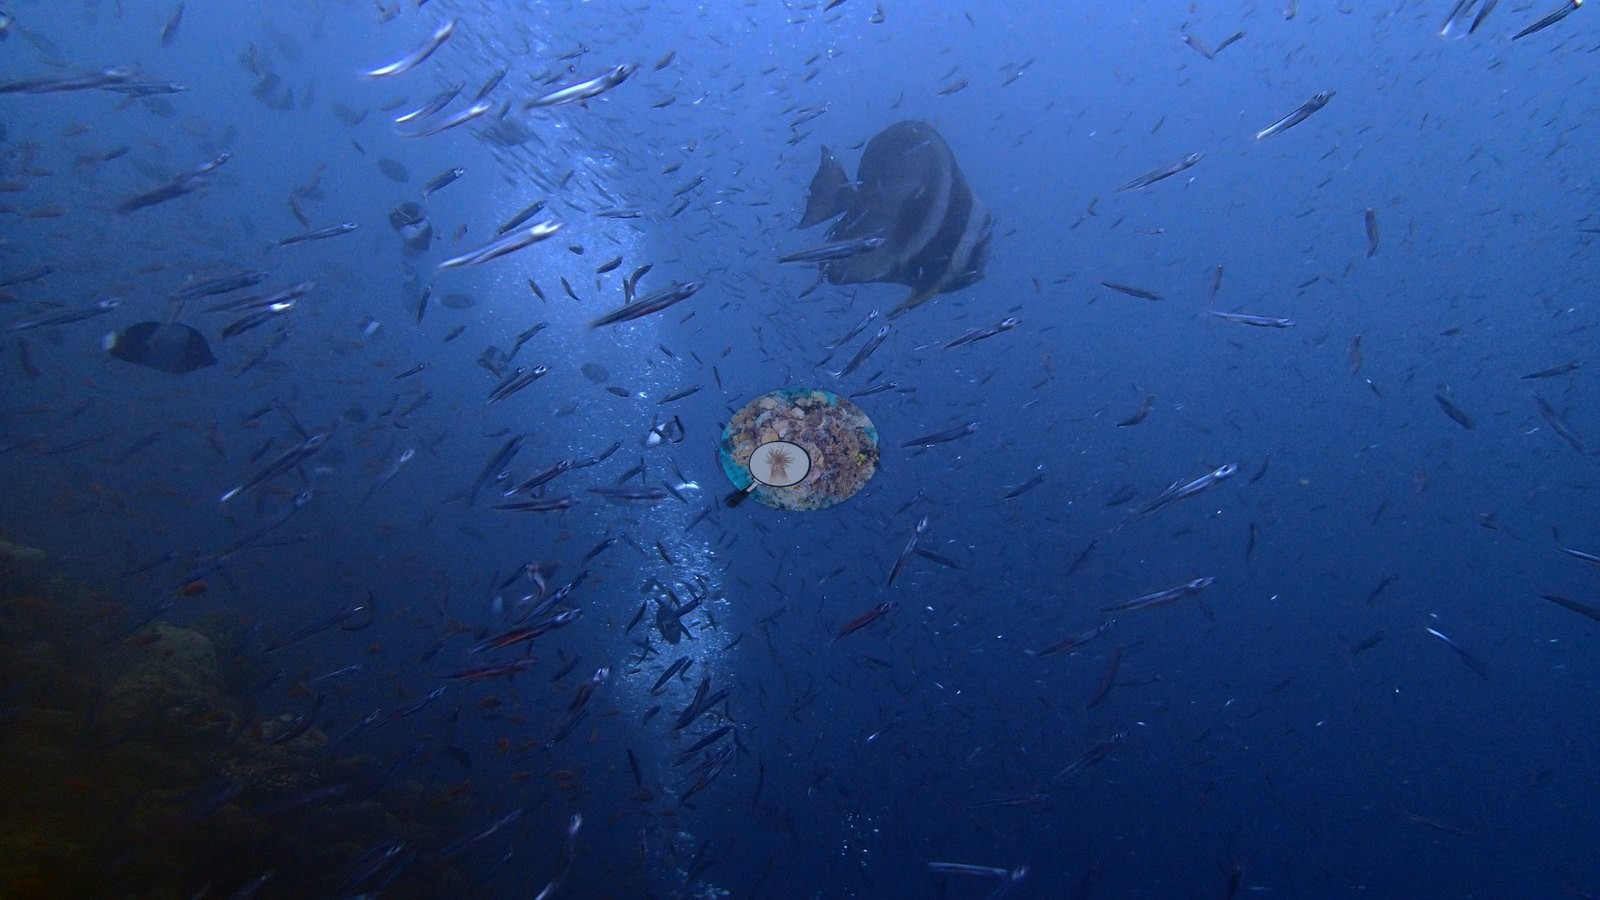
Silversides pour off the ledges in glittering curtains, bluestripe snapper mass in golden blocks, and batfish drift overhead like kites (e.g., Image 13, Image 14, Image 17, Image 19, Image 20).
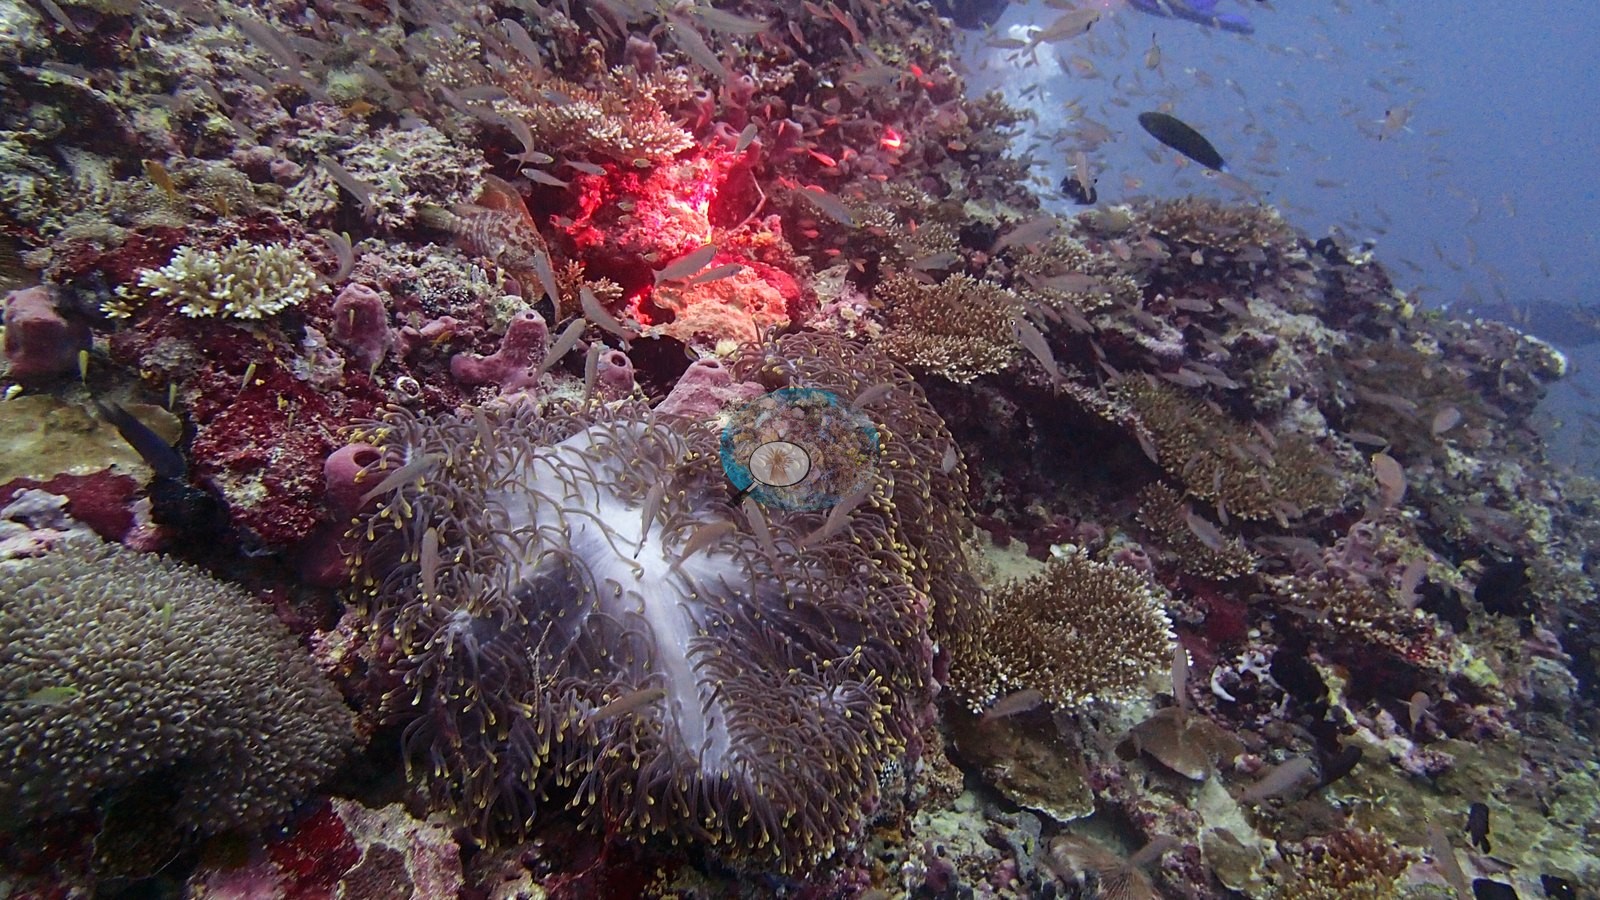
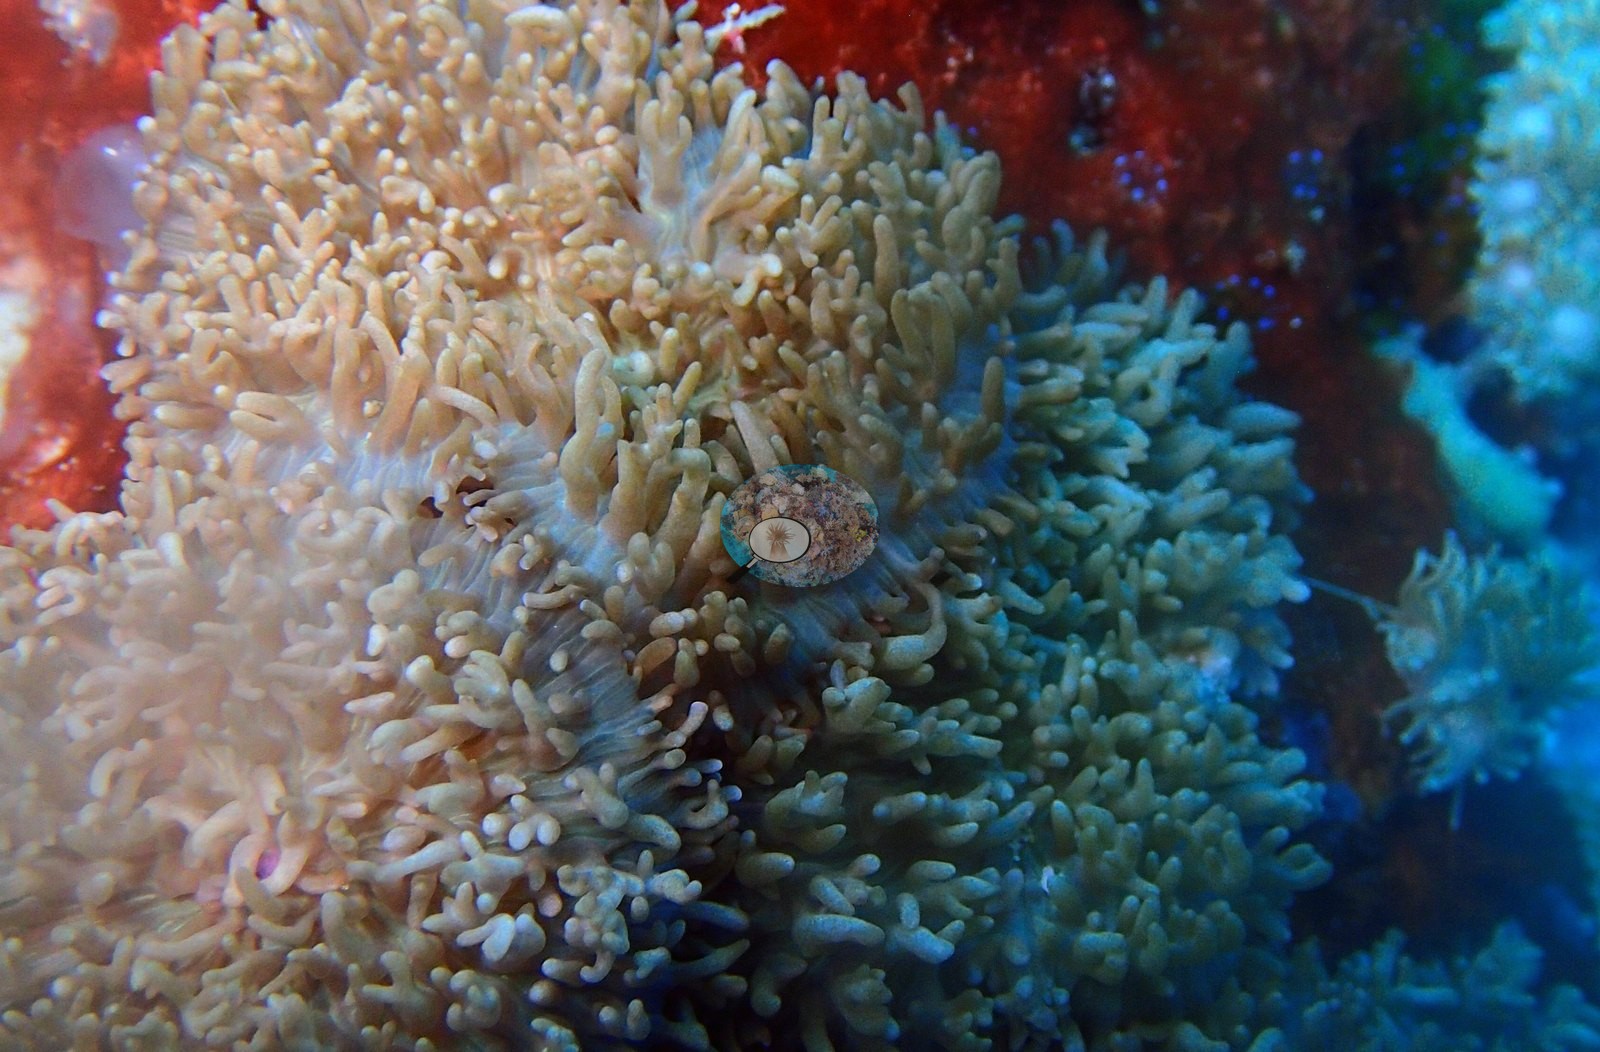
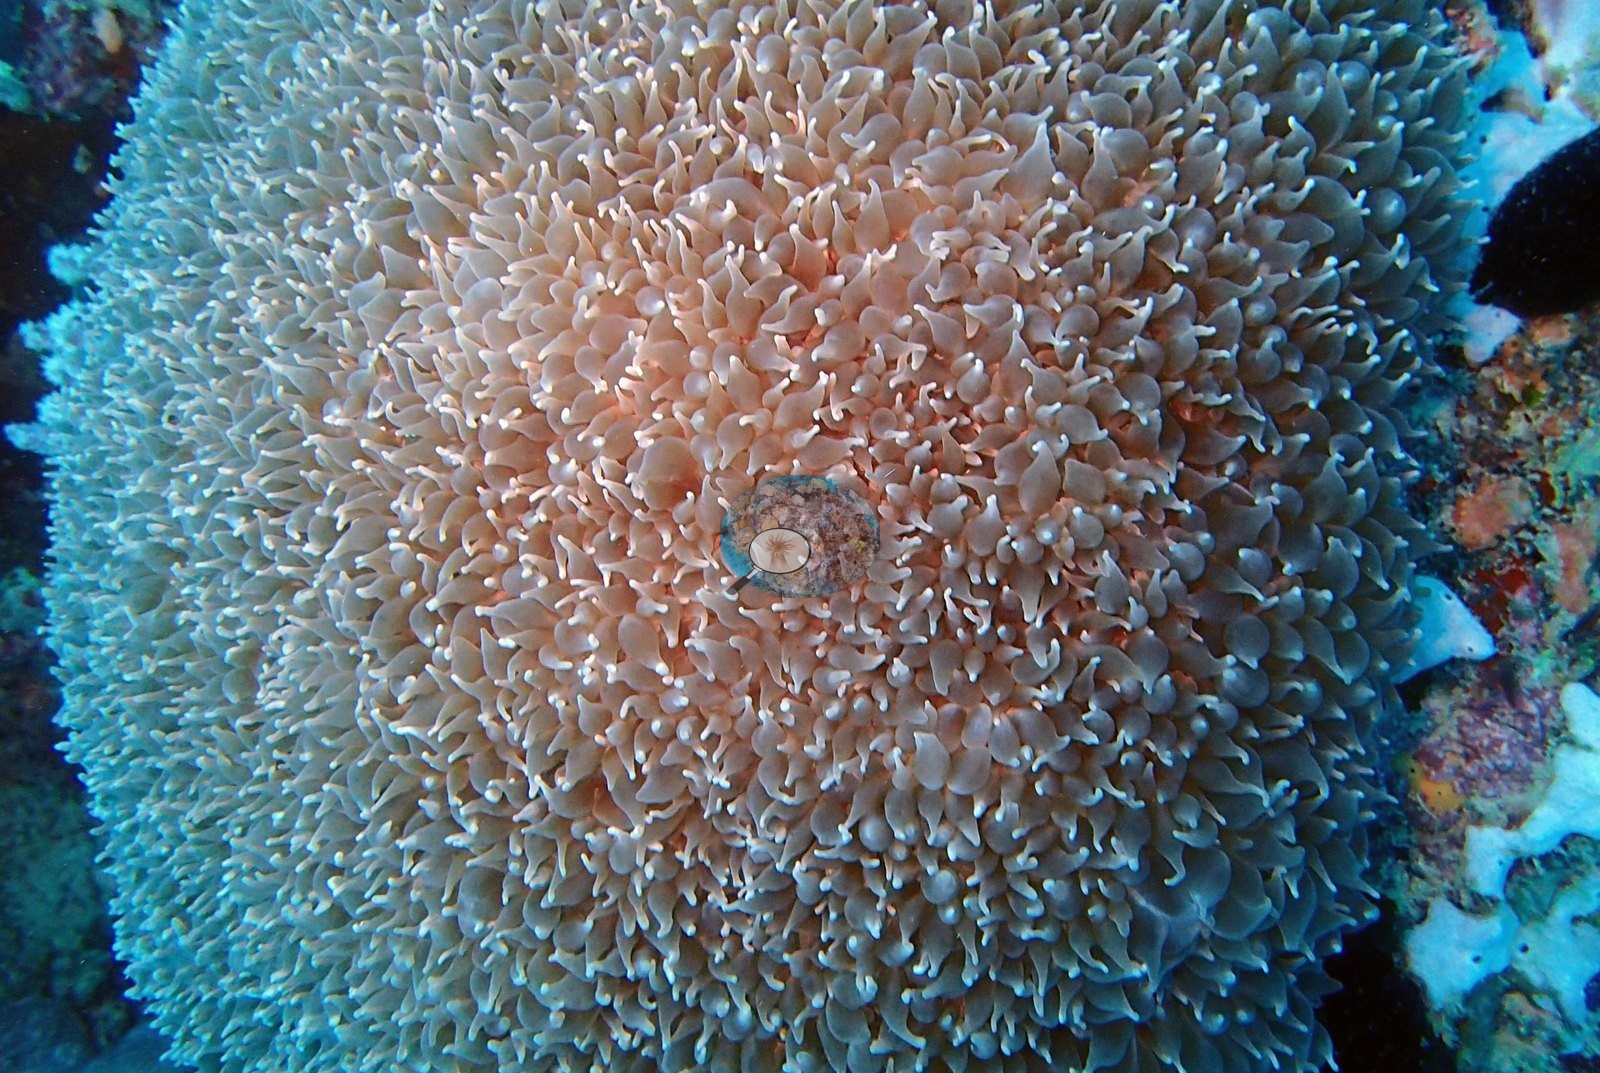
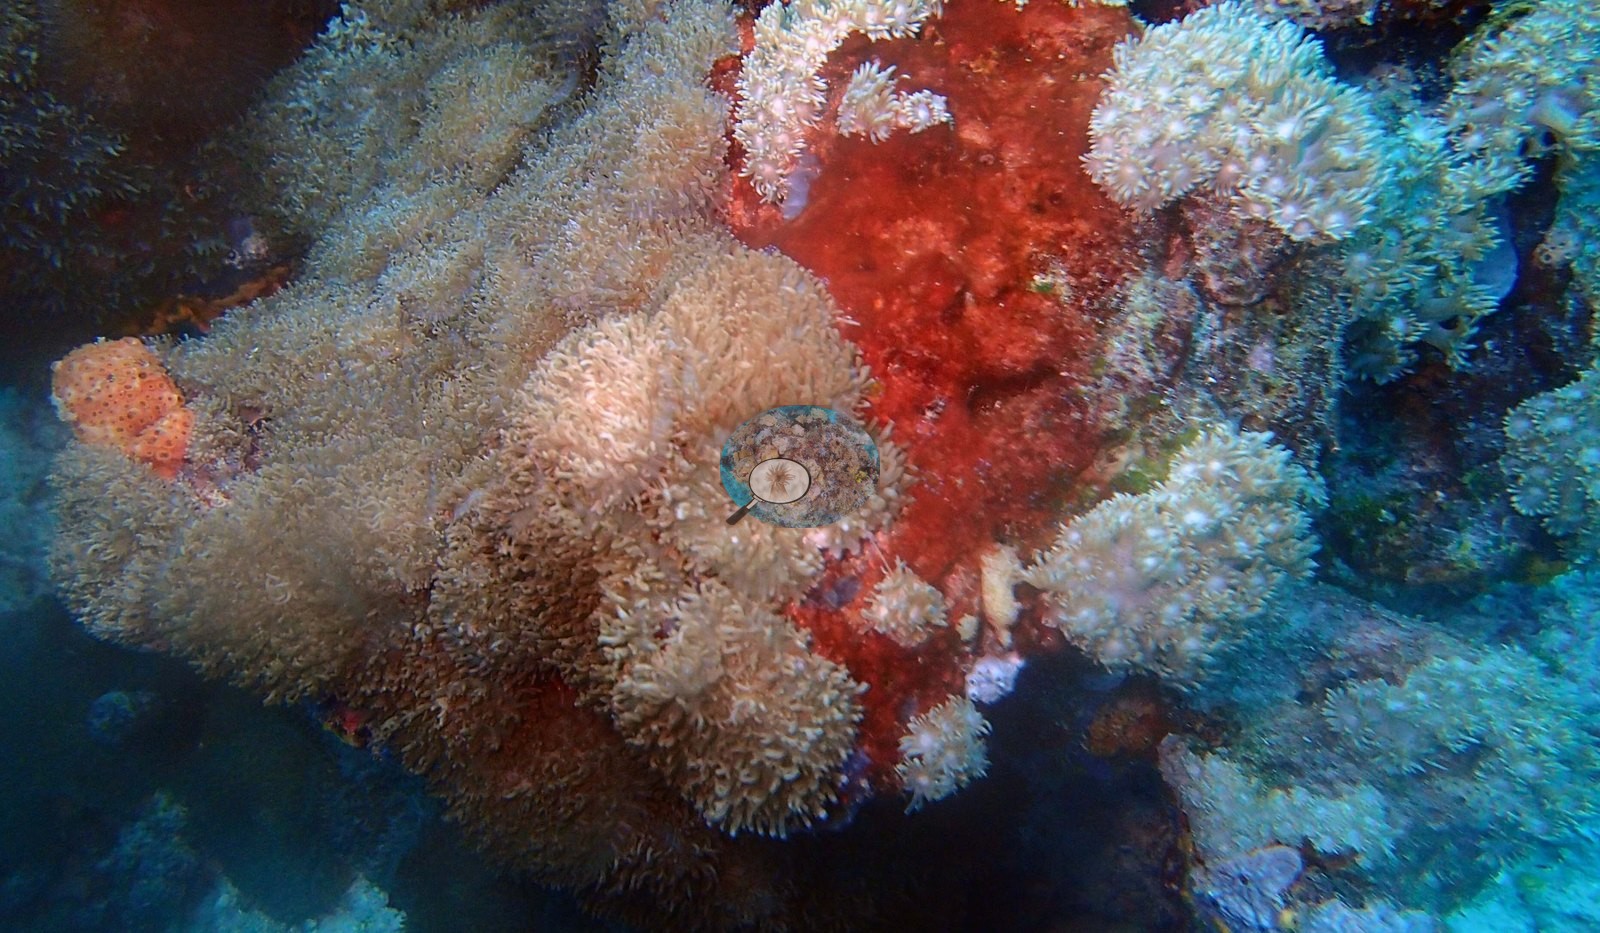
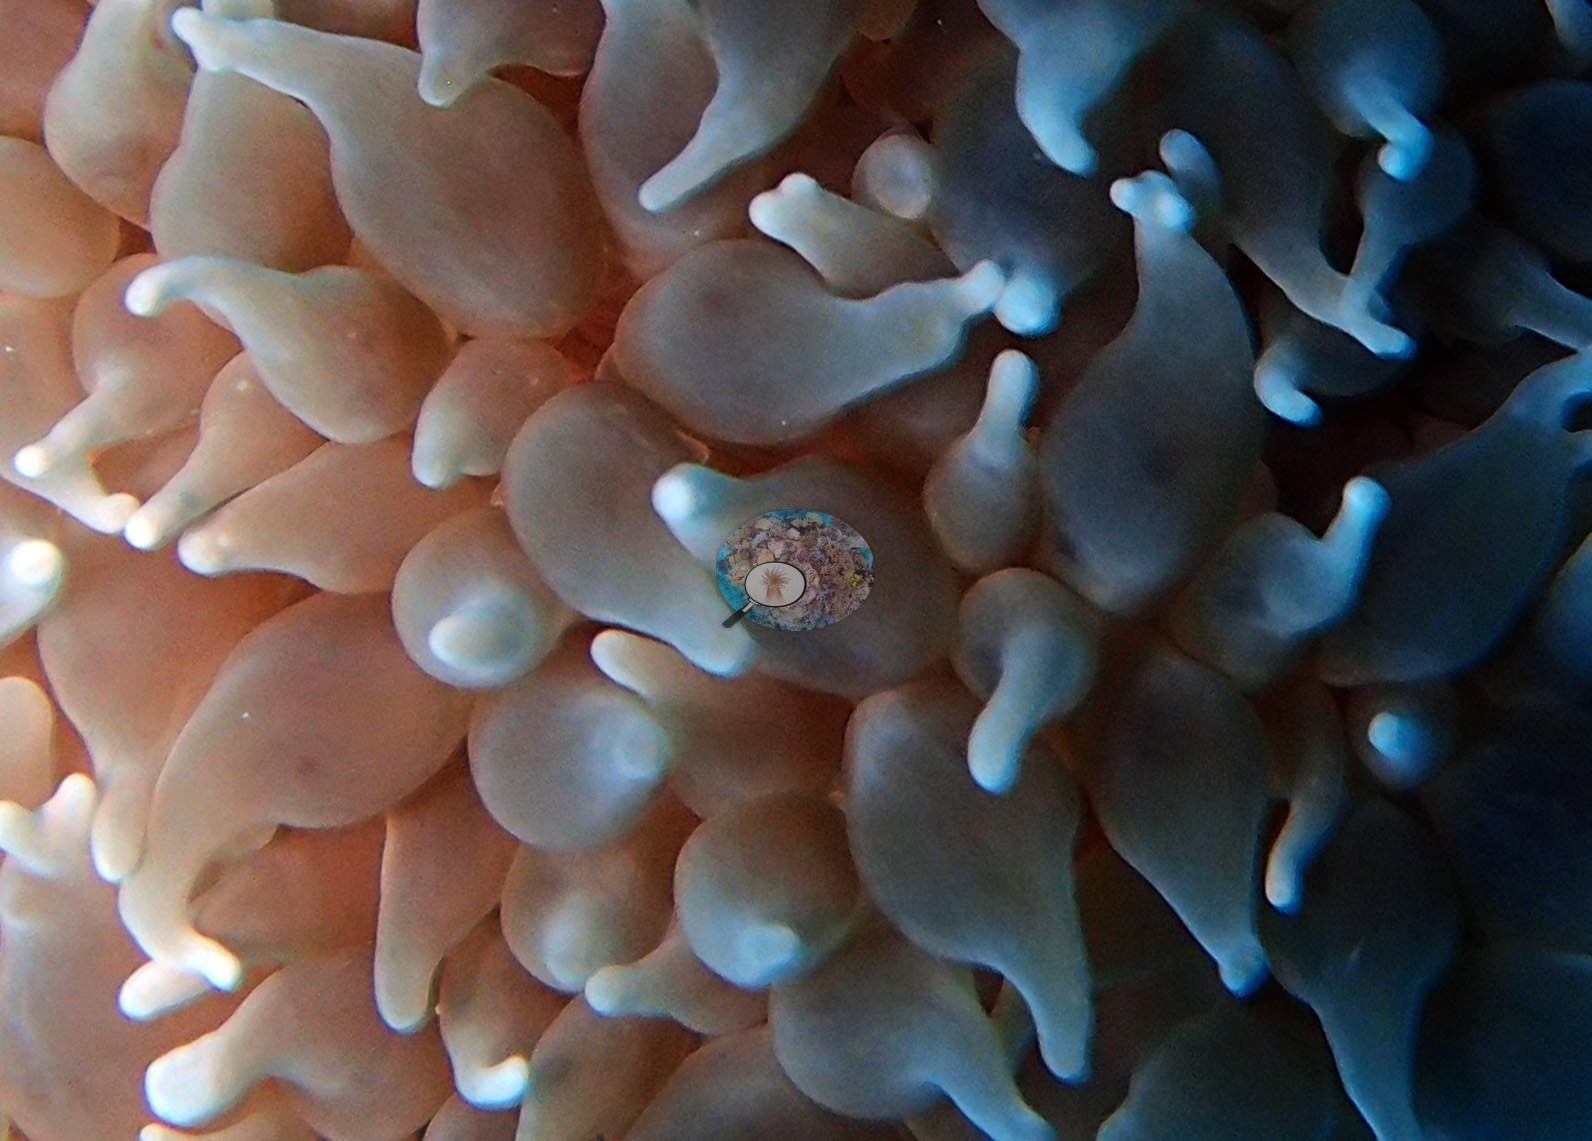
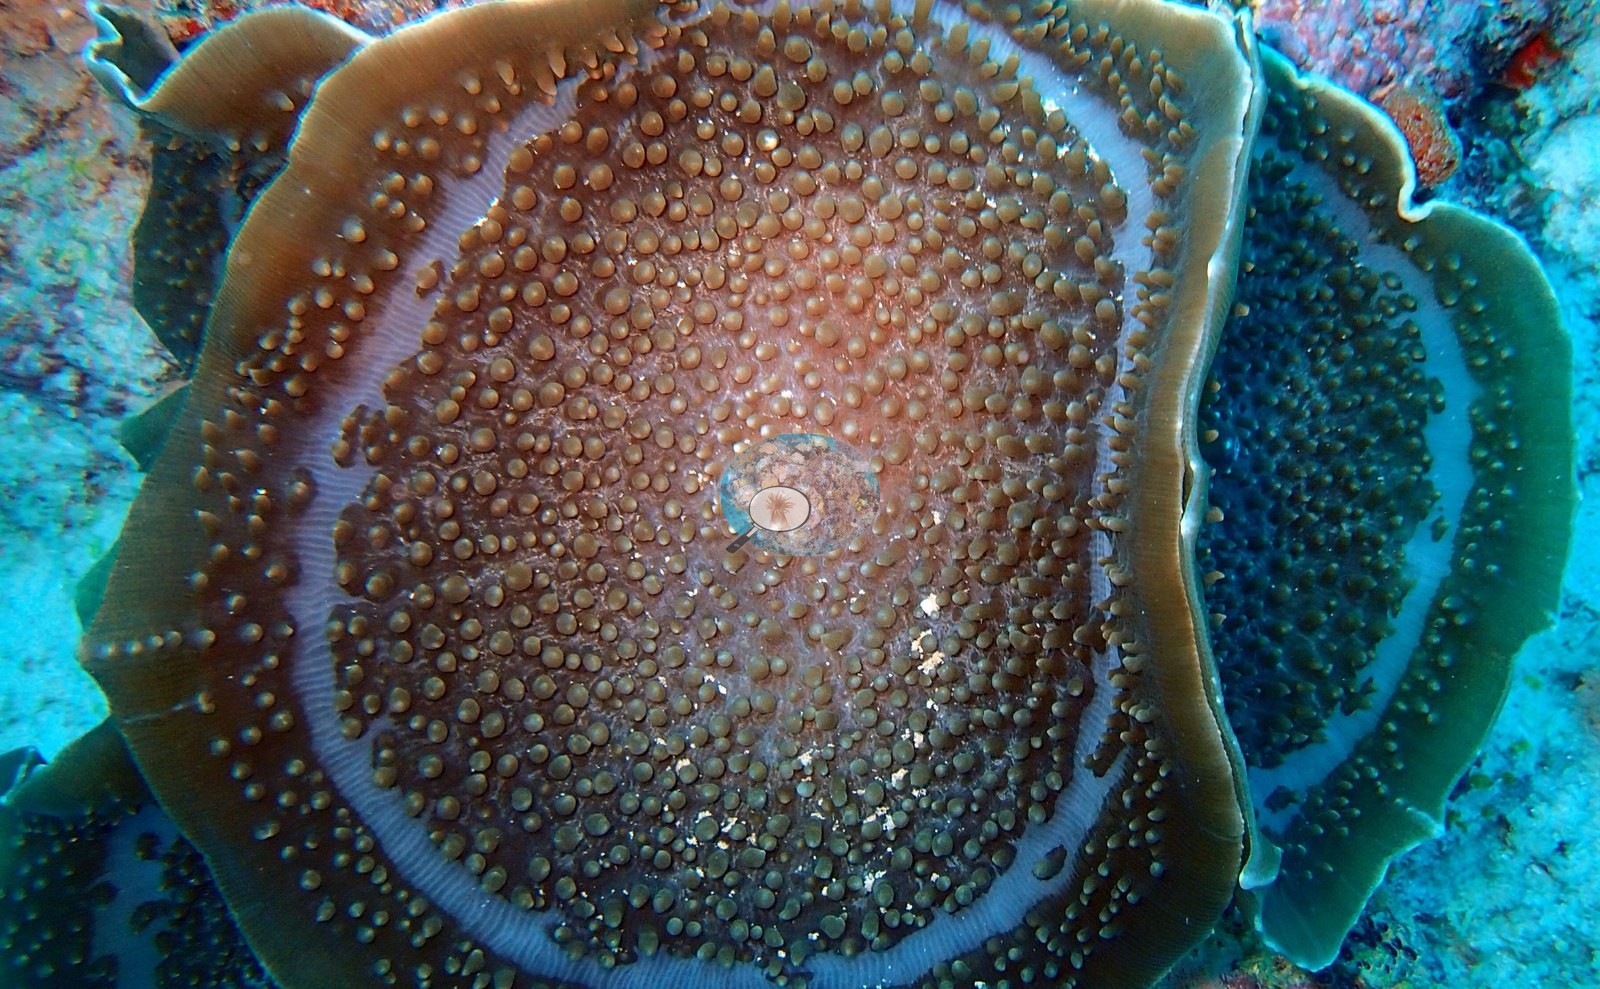
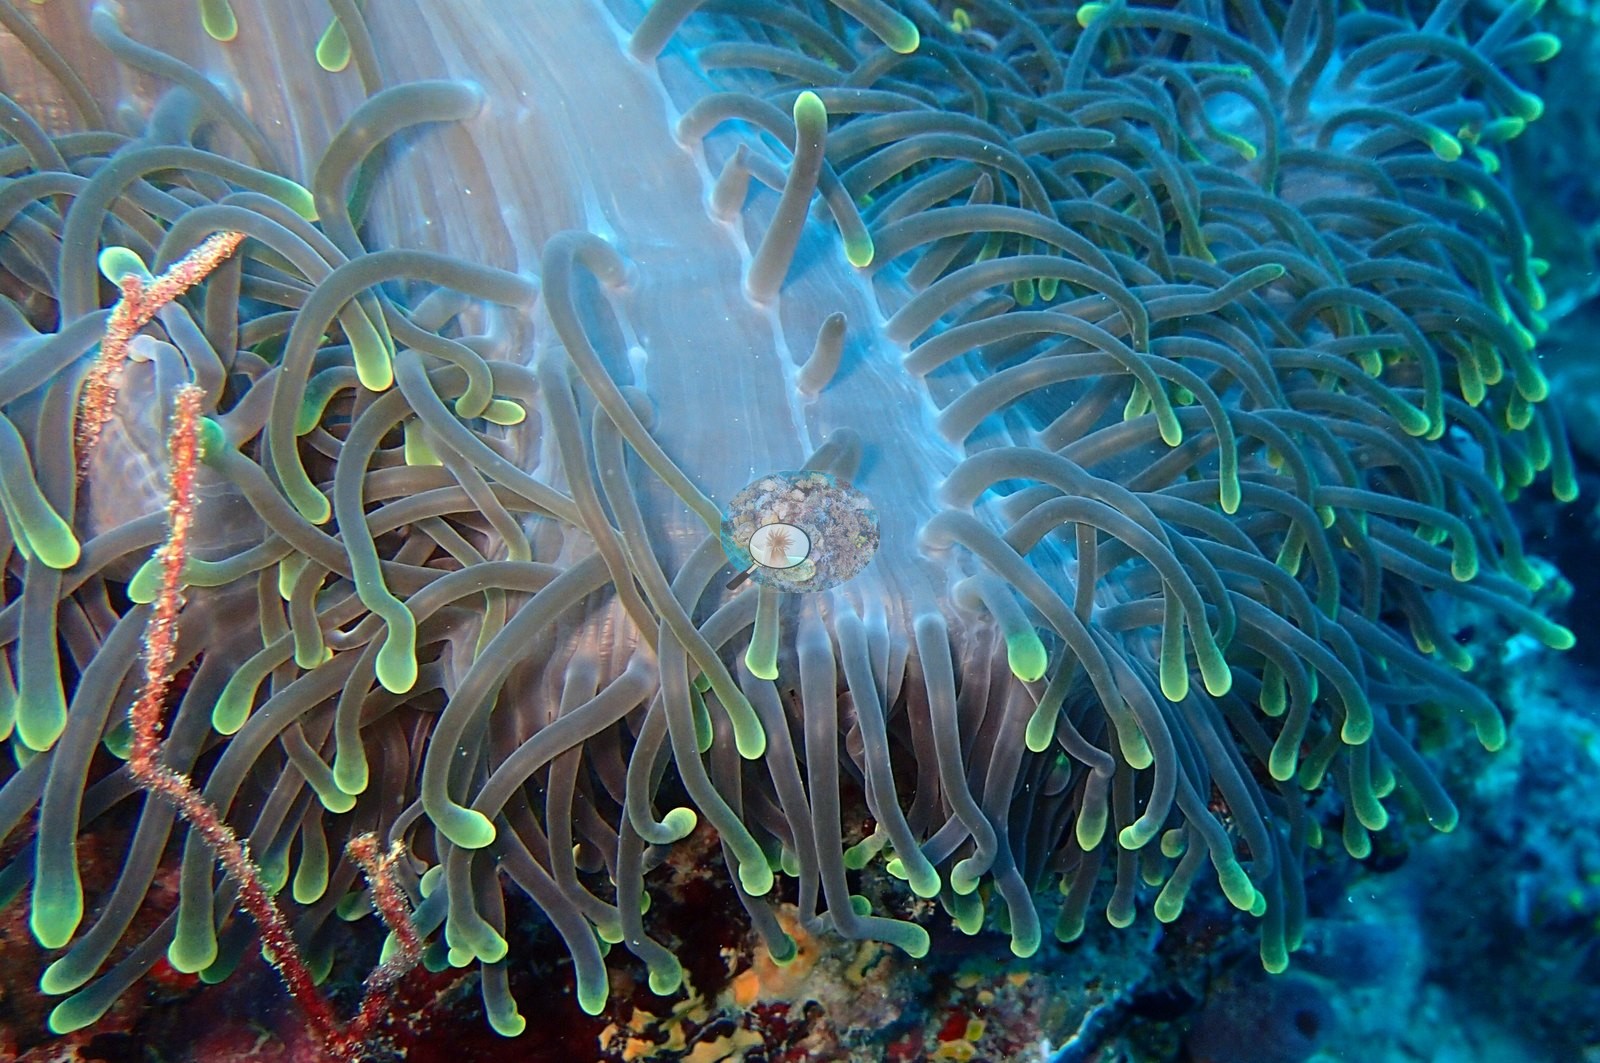
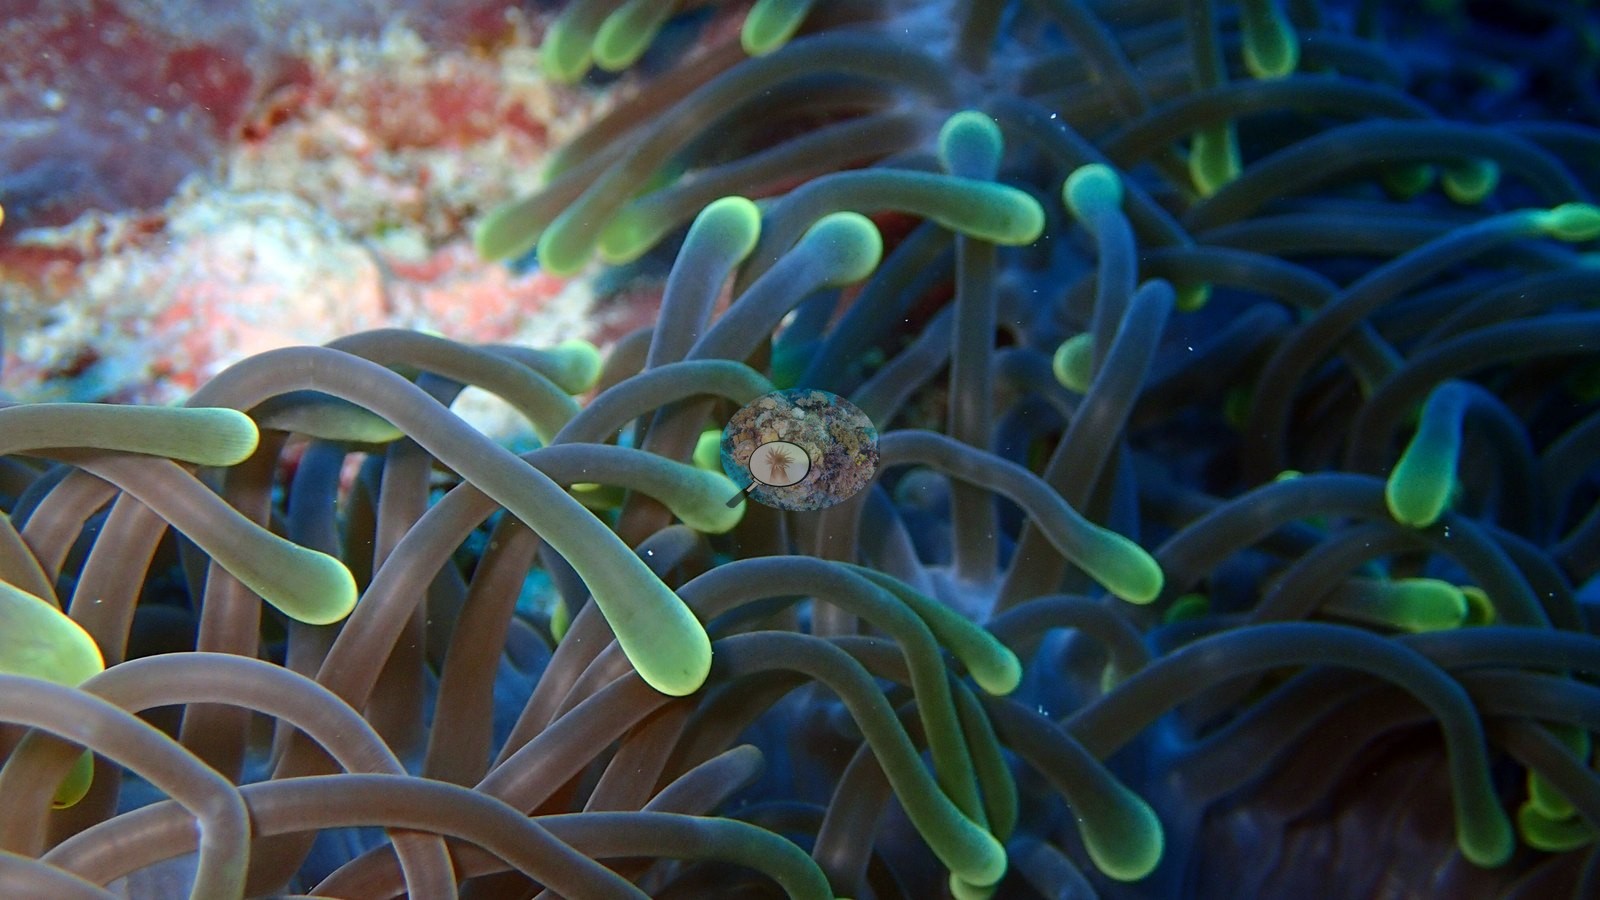
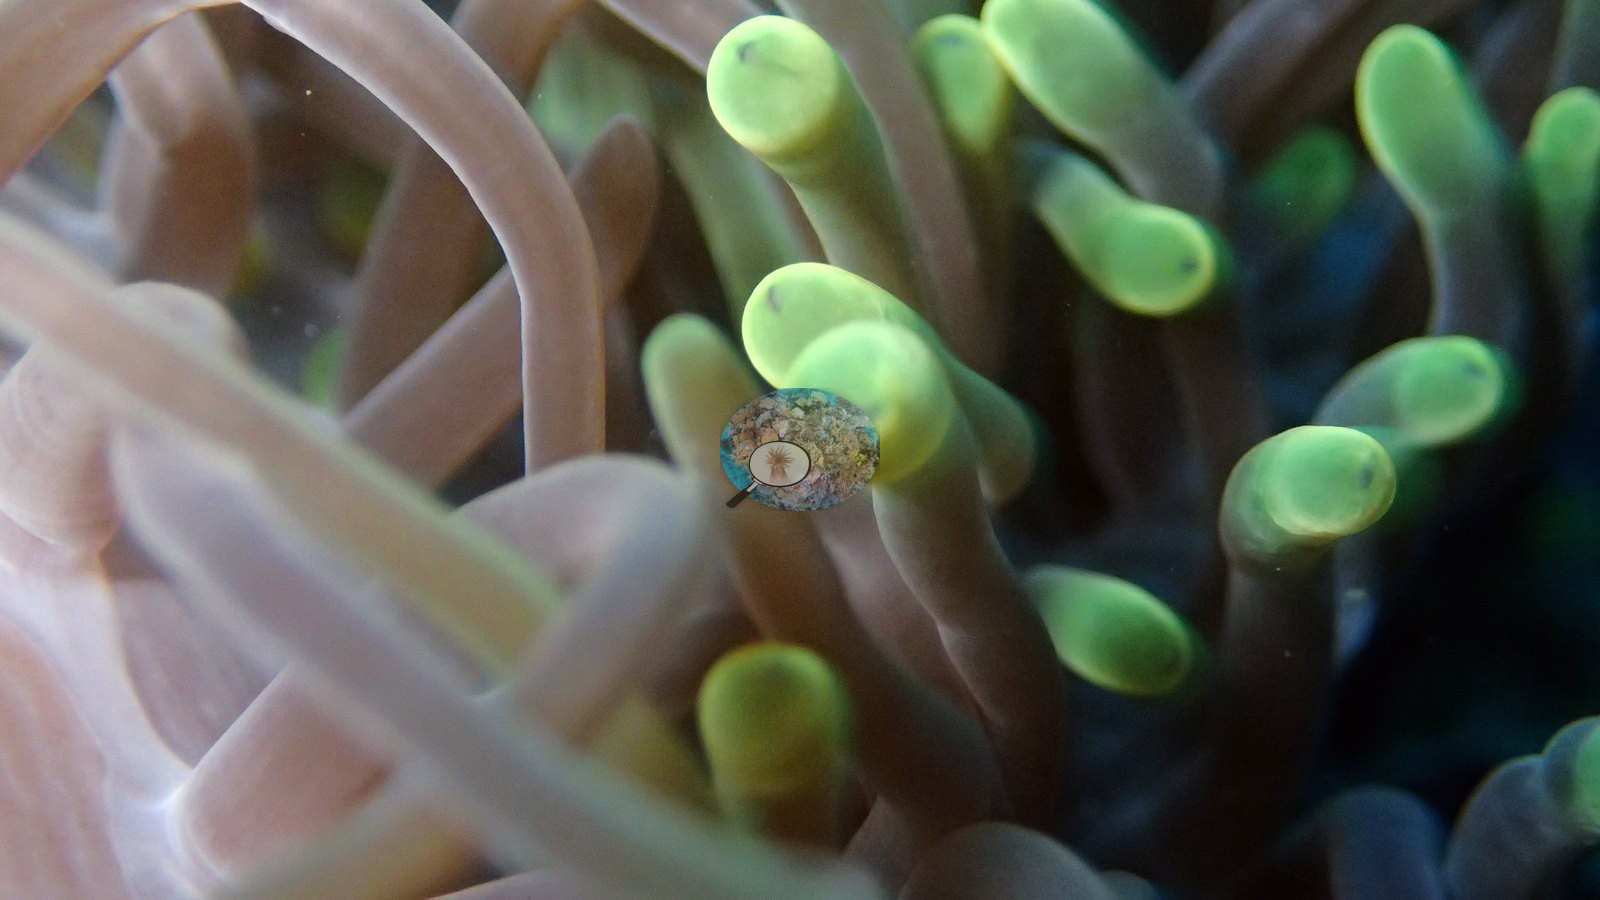
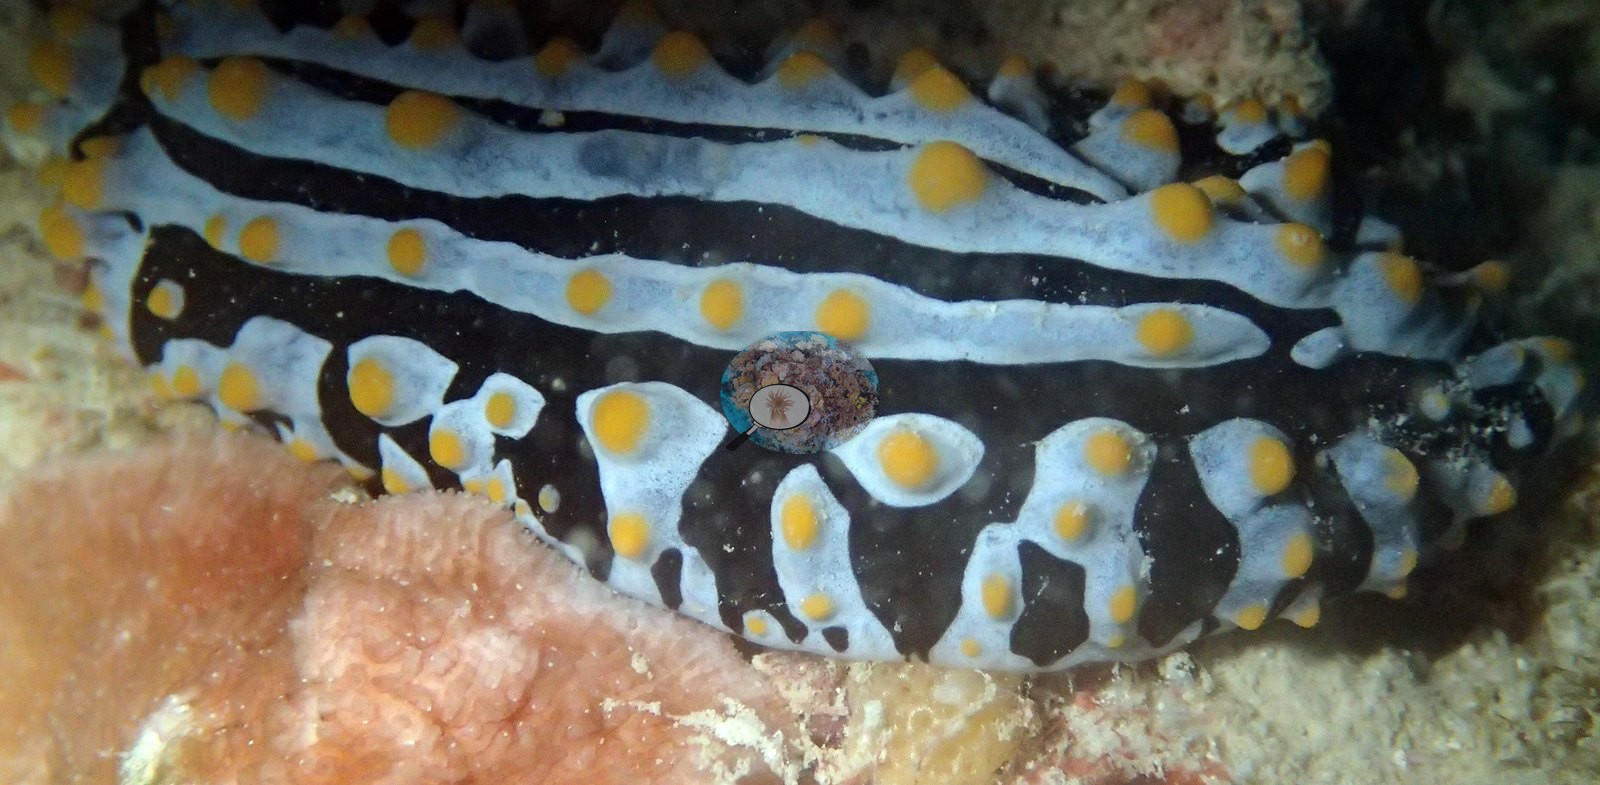
But the close-ups are the treasure here — anemones filling whole frames with green-tipped tentacles, their neighbors sporting swollen bubble-tips in pink; giant disc corals like patterned dinner plates; a wire coral's tiny zig-zag polyps; and a showstopper nudibranch striped in black and sky-blue with orange-studded ridges (e.g., Image 10, Image 11, Image 24, Image 25).
Comparisons with other data
No independent survey was made at this exact site; the nearest ones are listed in the table below.
CV model comparison
More info
As of September 2026 no computer-vision method estimates coral cover accurately on new images, so treat this as indicative rather than a measurement; it is revised as the methods improve.More info
The published figure is the mean of the two methods.| Method | Hard-coral cover (%) |
|---|---|
| In-house DINOv3 | 25.2 |
| CoralSCOP | 20.8 |
| Mean (± SD) | 23.0 ± 3.1 |
| Range | 20.8–25.2 |
Mean ± SD and range are across the computer-vision methods shown.
Independent surveys nearby
| Agency / program | Year(s) | Stations / distance | Link |
|---|---|---|---|
| Reef Check | 2006 | 1 station, 3.76 km | Records ↓ |
| Saponari L | 2016–2018 | 1 station, 1.58 km | Records ↓ |
 Dr. Coral (CRD)
Within 5 km, 2 independent survey stations recorded hard coral cover in 2 surveys between 2006 and 2018. The most recent nearby survey is from 2018, so these values predate recent heat stress. This site's own estimate (23%) sits within the range of these surveys (14–36%); the methods differ, so the comparison is context, not a like-for-like test.
Collected by other programs using different methods (Reef Check uses point-intercept transects), so these are context for the figures above, not a like-for-like comparison. Where a station was surveyed more than once the range is shown. Station names are not dive-site names.
| Agency | Site / location | Date | Hard coral cover (%) | Distance | Link |
|---|---|---|---|---|---|
| Reef Check | Panettone Reef | 2006 | 36% | 3.76 km | — |
| Saponari L | Thudufushi, South Ari Atoll (shallow reef flat + crest) | ~2018 ("around 2 years after a coral bleaching event in 2016"; exact month not stated in the retrieved text) | 14% | 1.58 km | — |
Data & links
All images from Coral Reef Diagnostics. Data are from Coral Reef Diagnostics and the organizations named in the data-sources table above.
© Coral Reef Diagnostics.