
Maldives - Maafushi

Part of the regional summaries: Maldives - Central (Male Atolls / Ari / Vaavu) and Maldives
More info
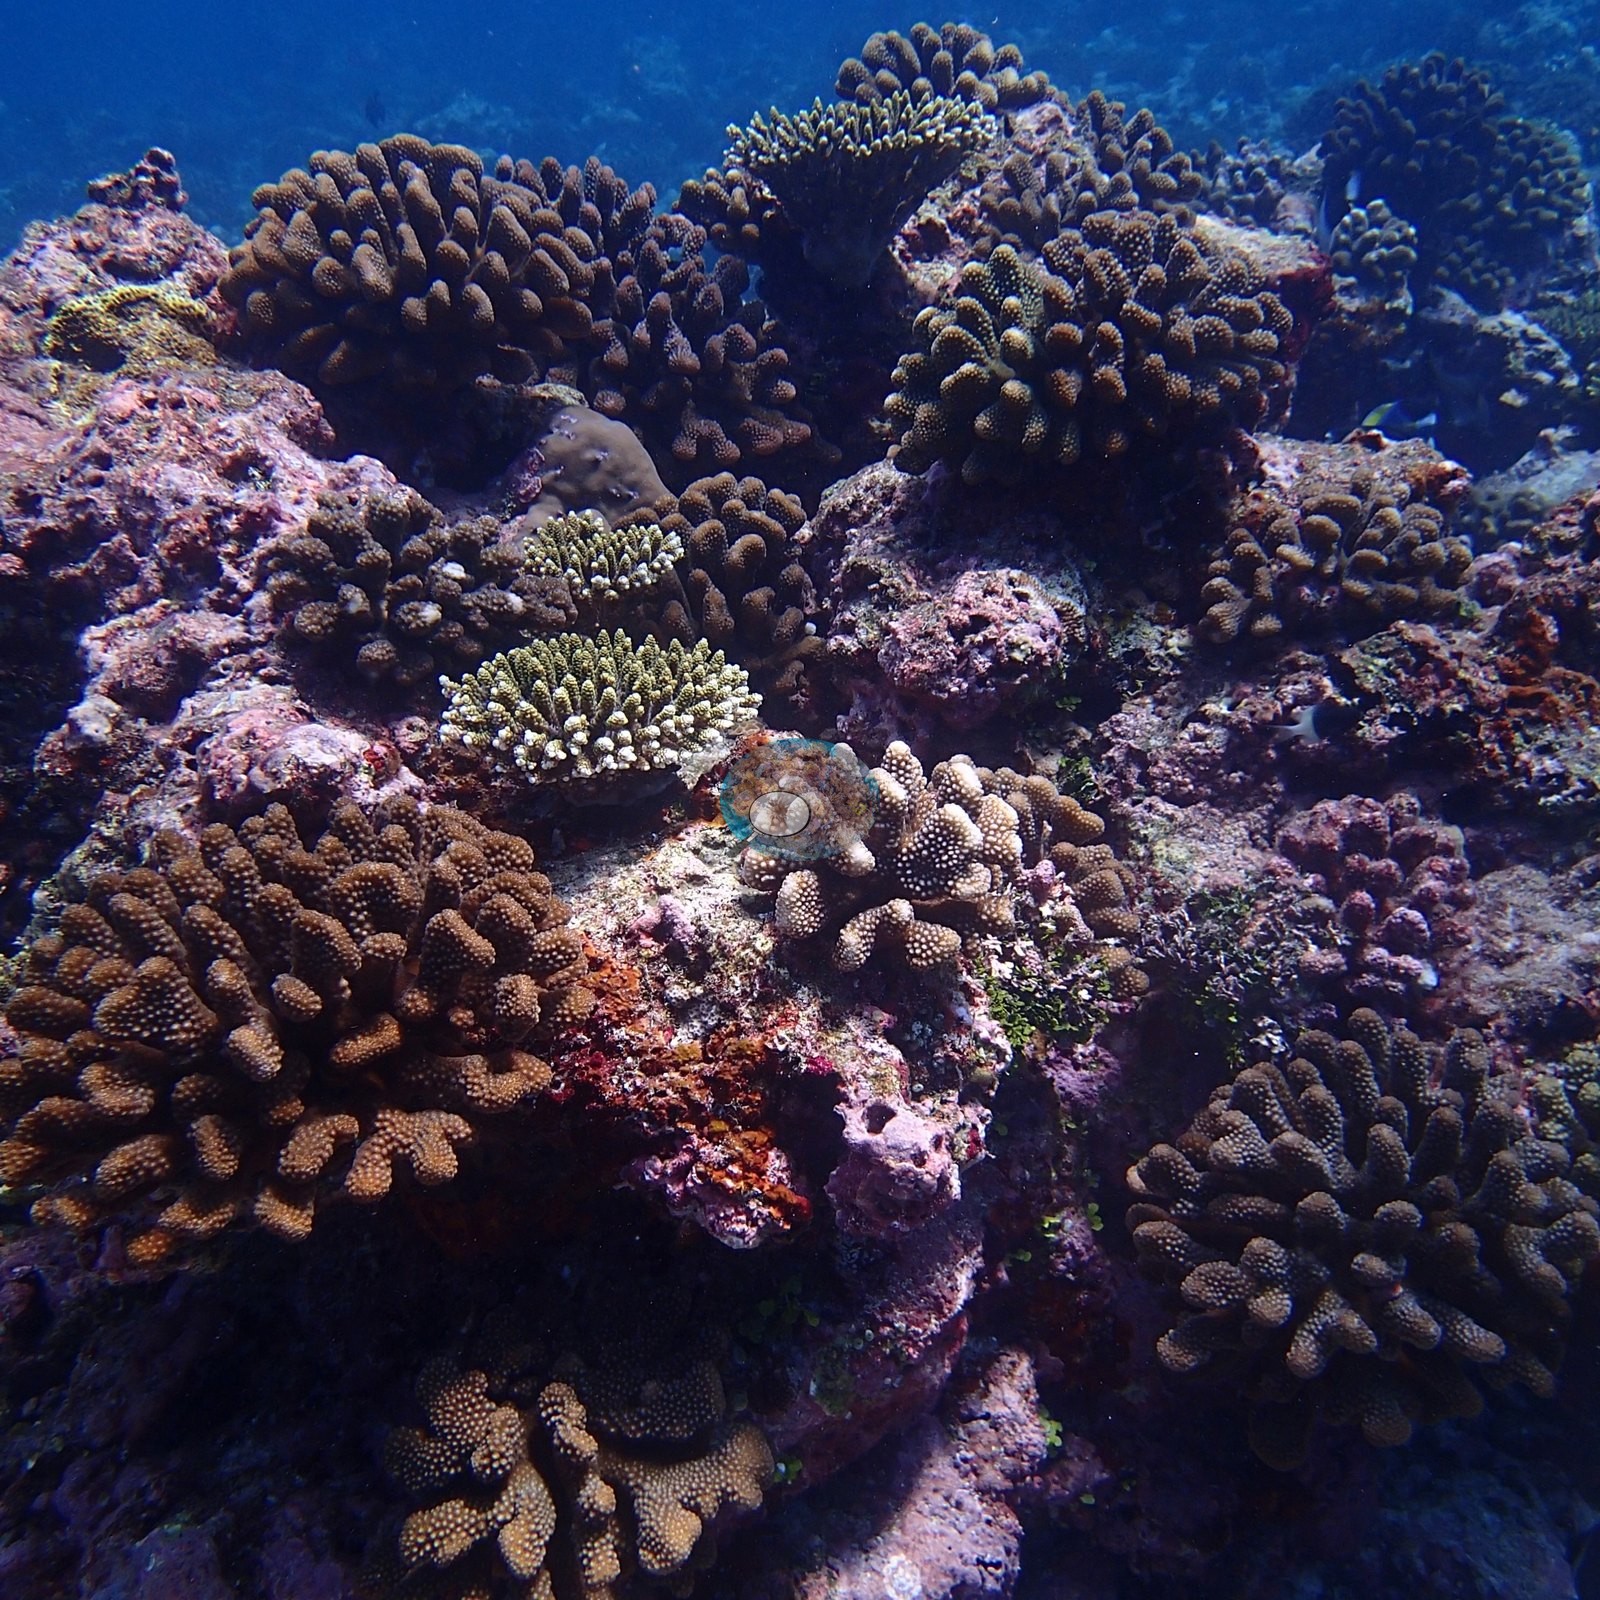
Maldives (NOAA CRW virtual station) · Maldives ecoregion mean=2.9°C-heating weeksA densely packed Maldivian reef slope of lime-green staghorn thickets and cauliflower corals, photographed in January 2016 - months before an April El Nino bleaching event left roughly 95% of Maafushi's colonies bleached. Computer vision estimates put cover in the low-20s to low-40s percent range (mean 31%), with the two methods disagreeing substantially.
Seven independent survey stations shown with the program’s logo — click one to see how far it is from this site.
Six other CRD dive sites within 5 km shown in orange — click a marker to open its page.
22 of these 50 photographs are shown beside the text that discusses them under "Site description" below.
Site description
Setting
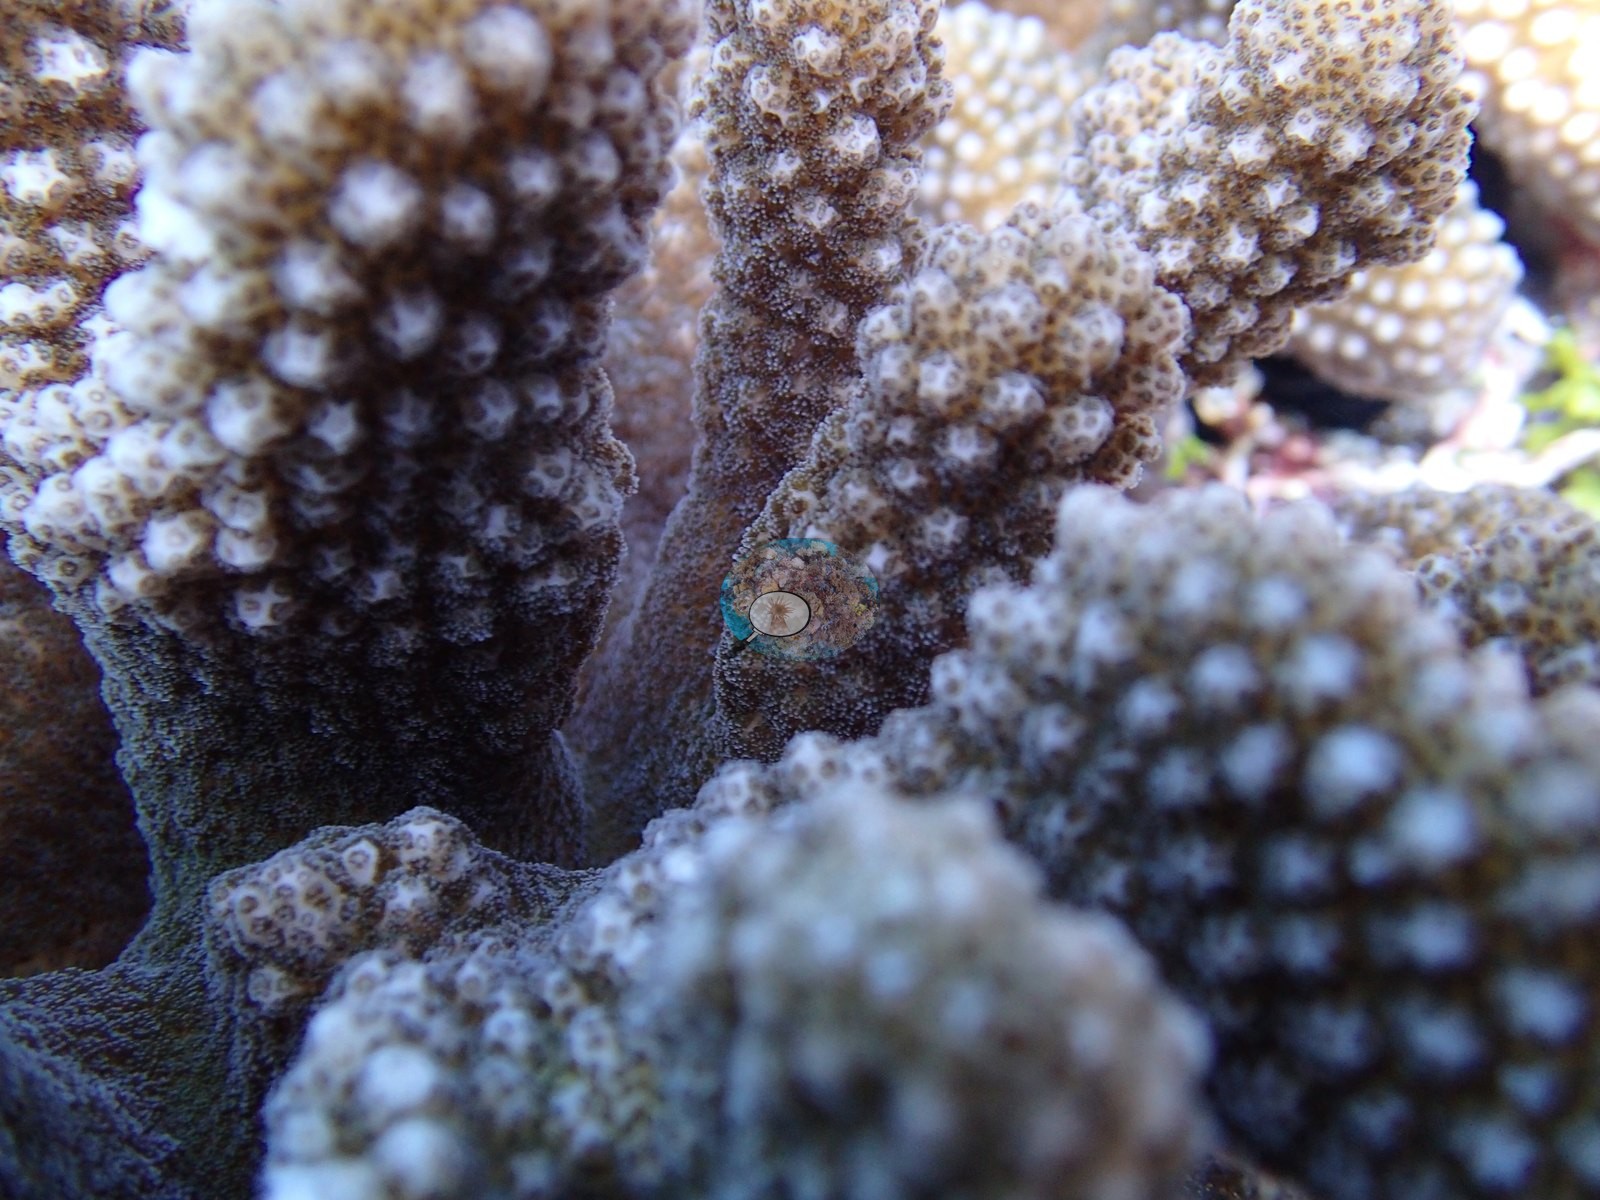
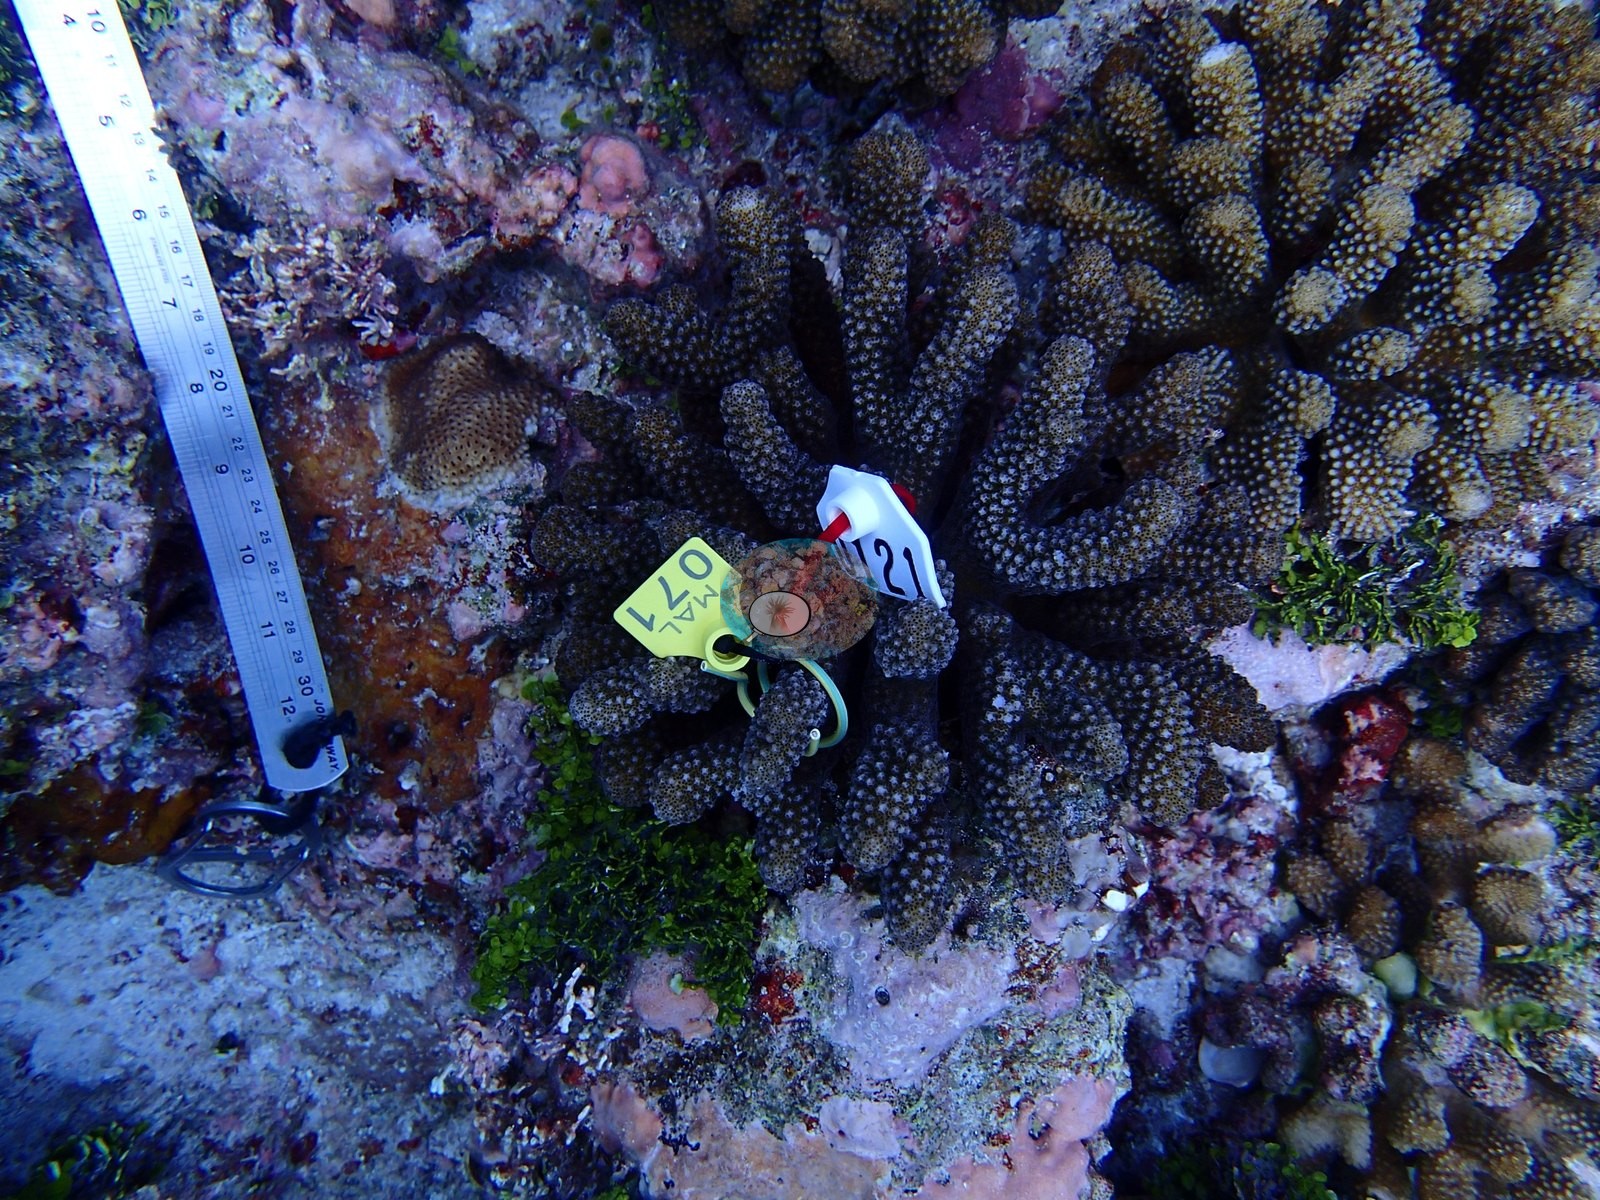
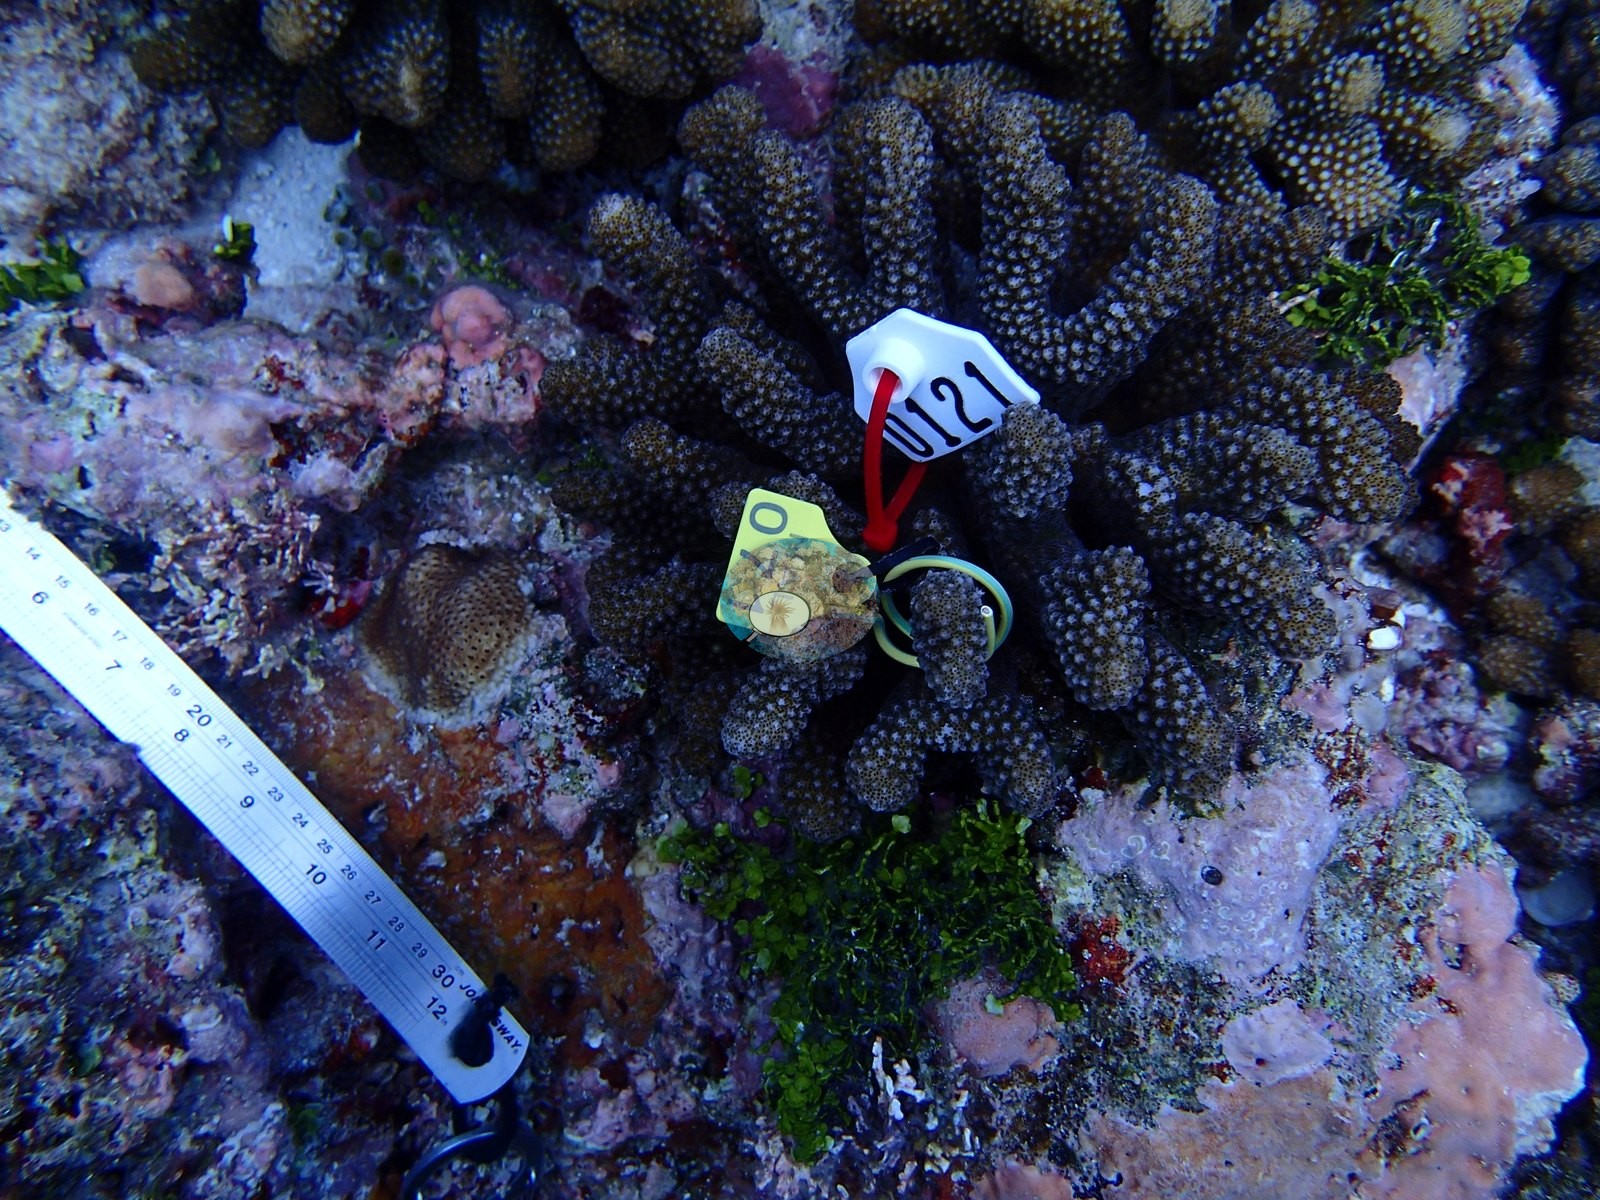
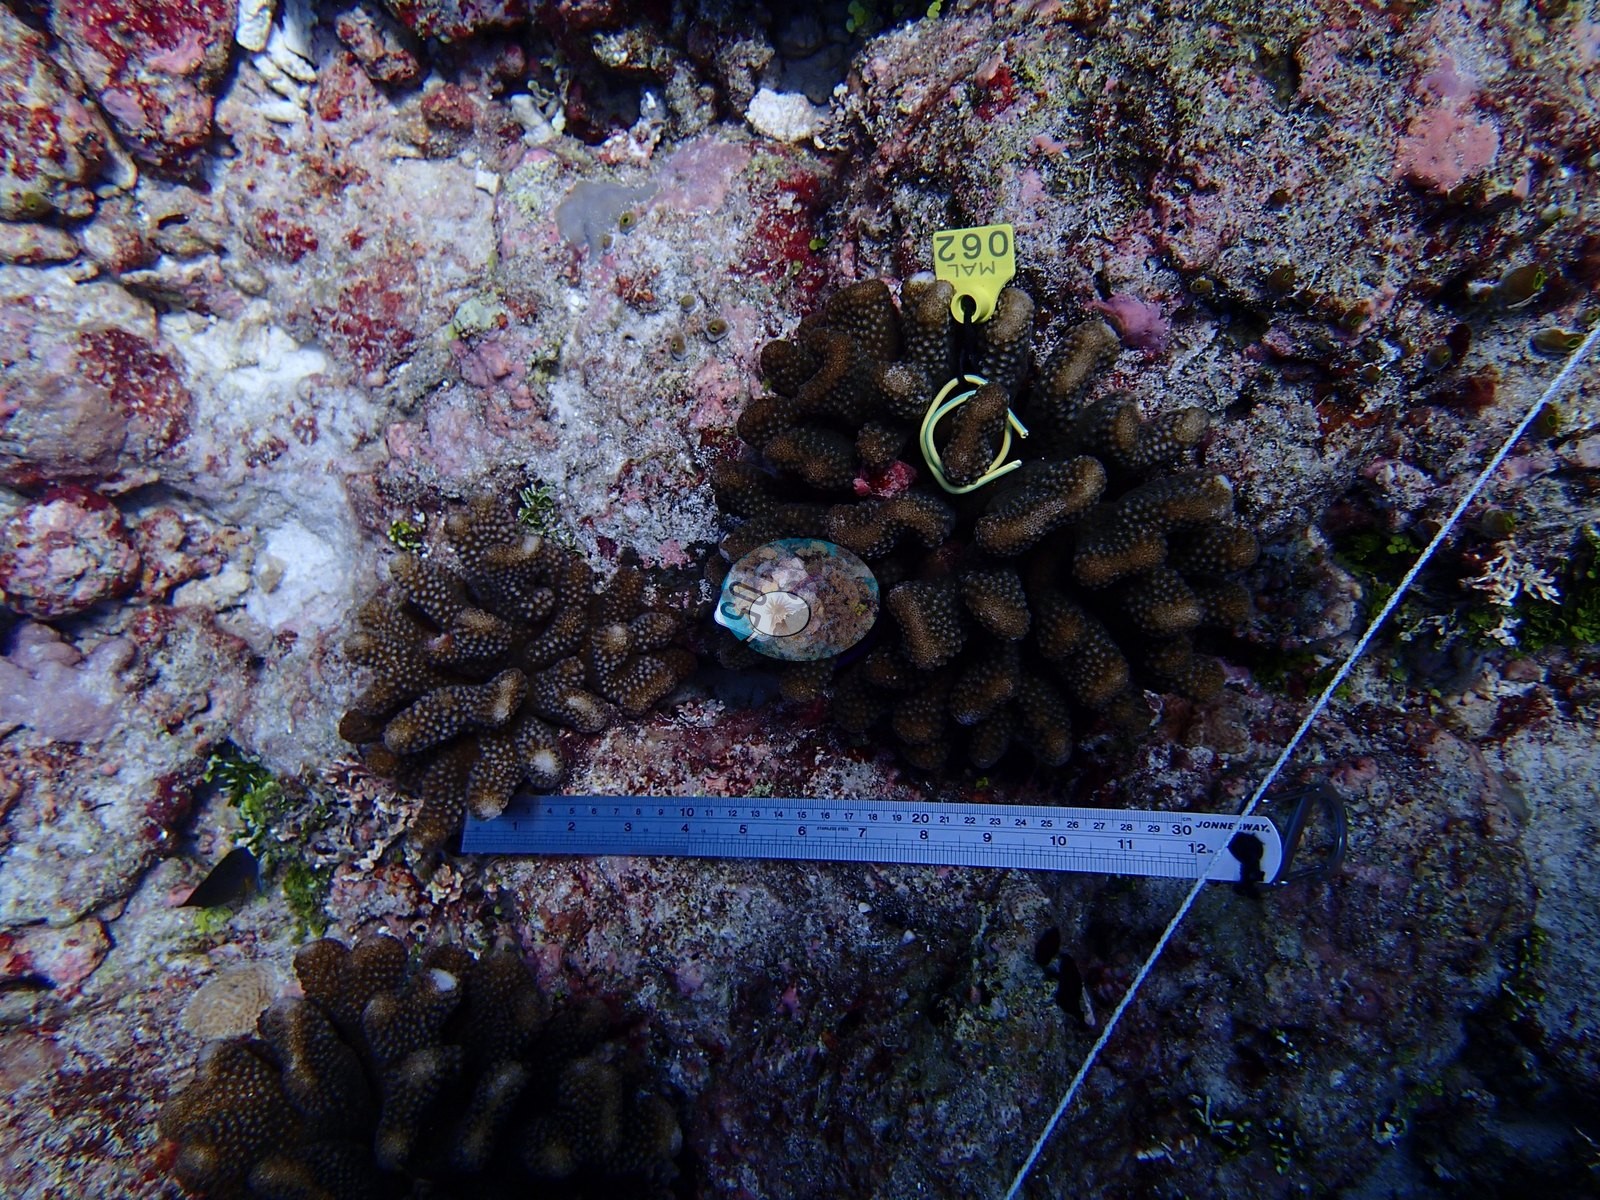
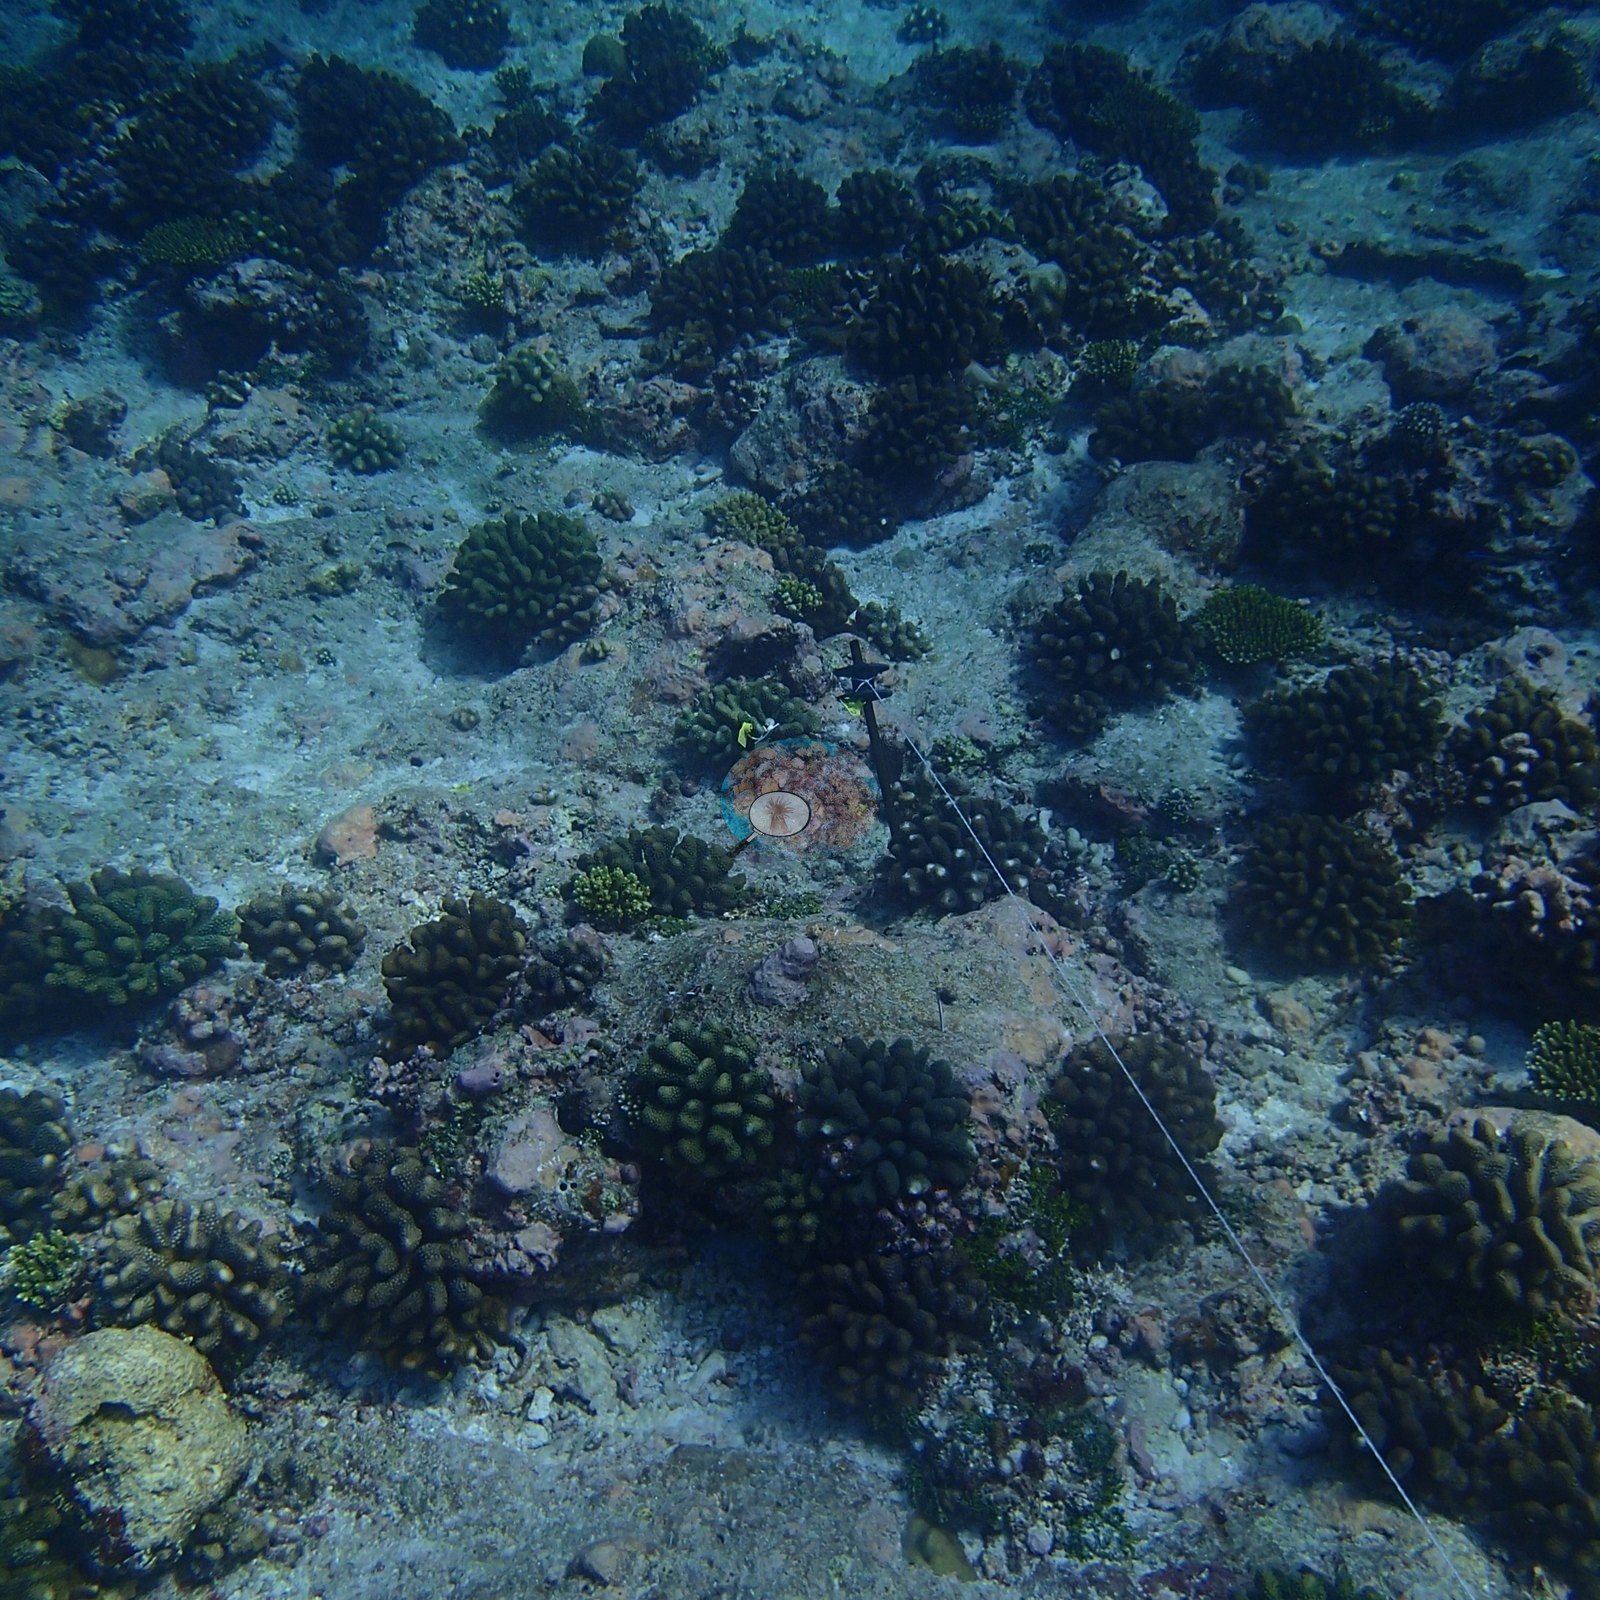
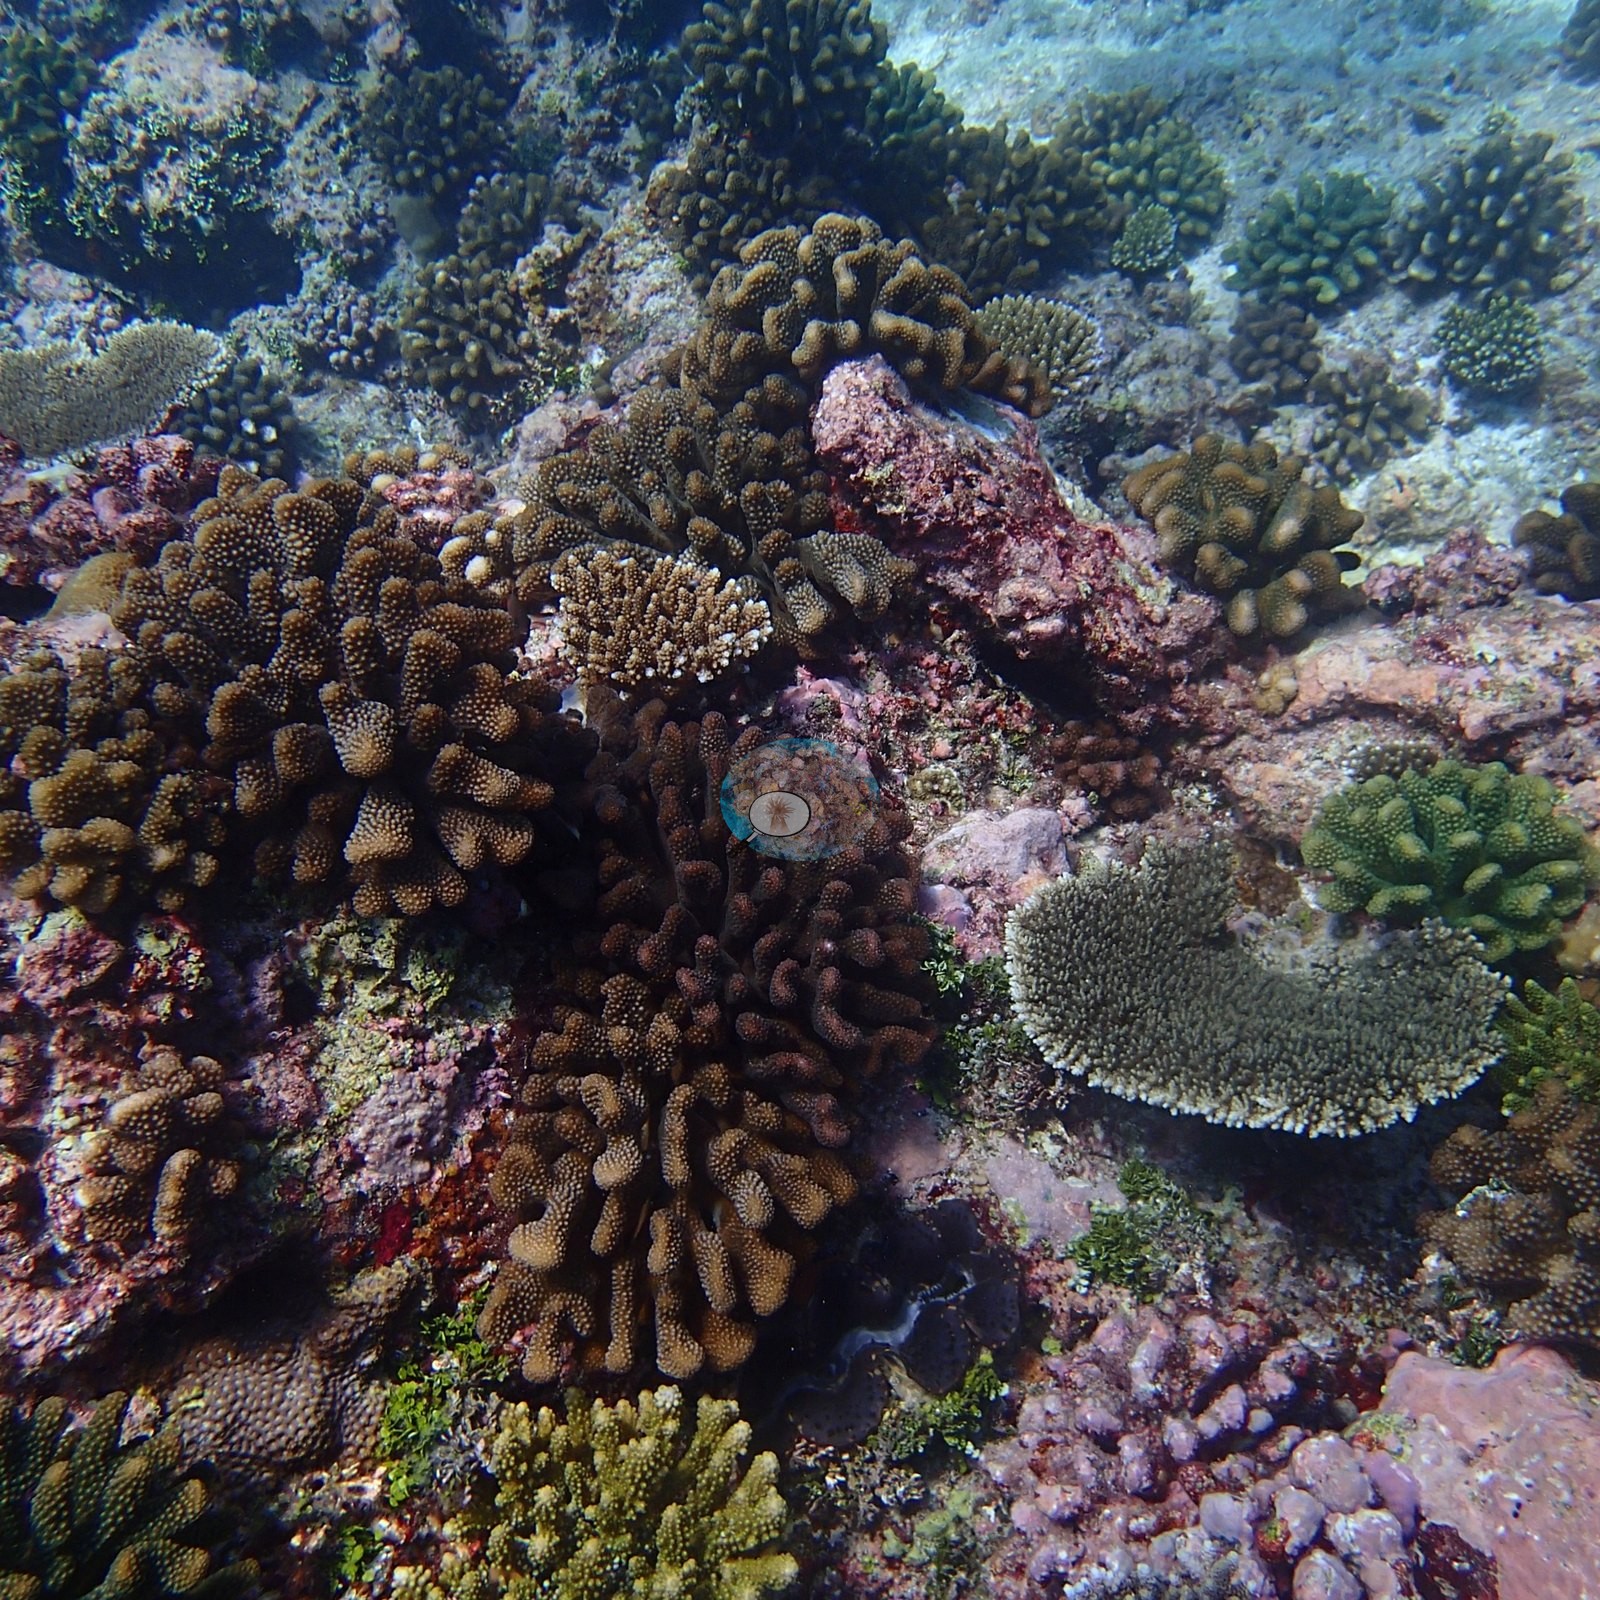
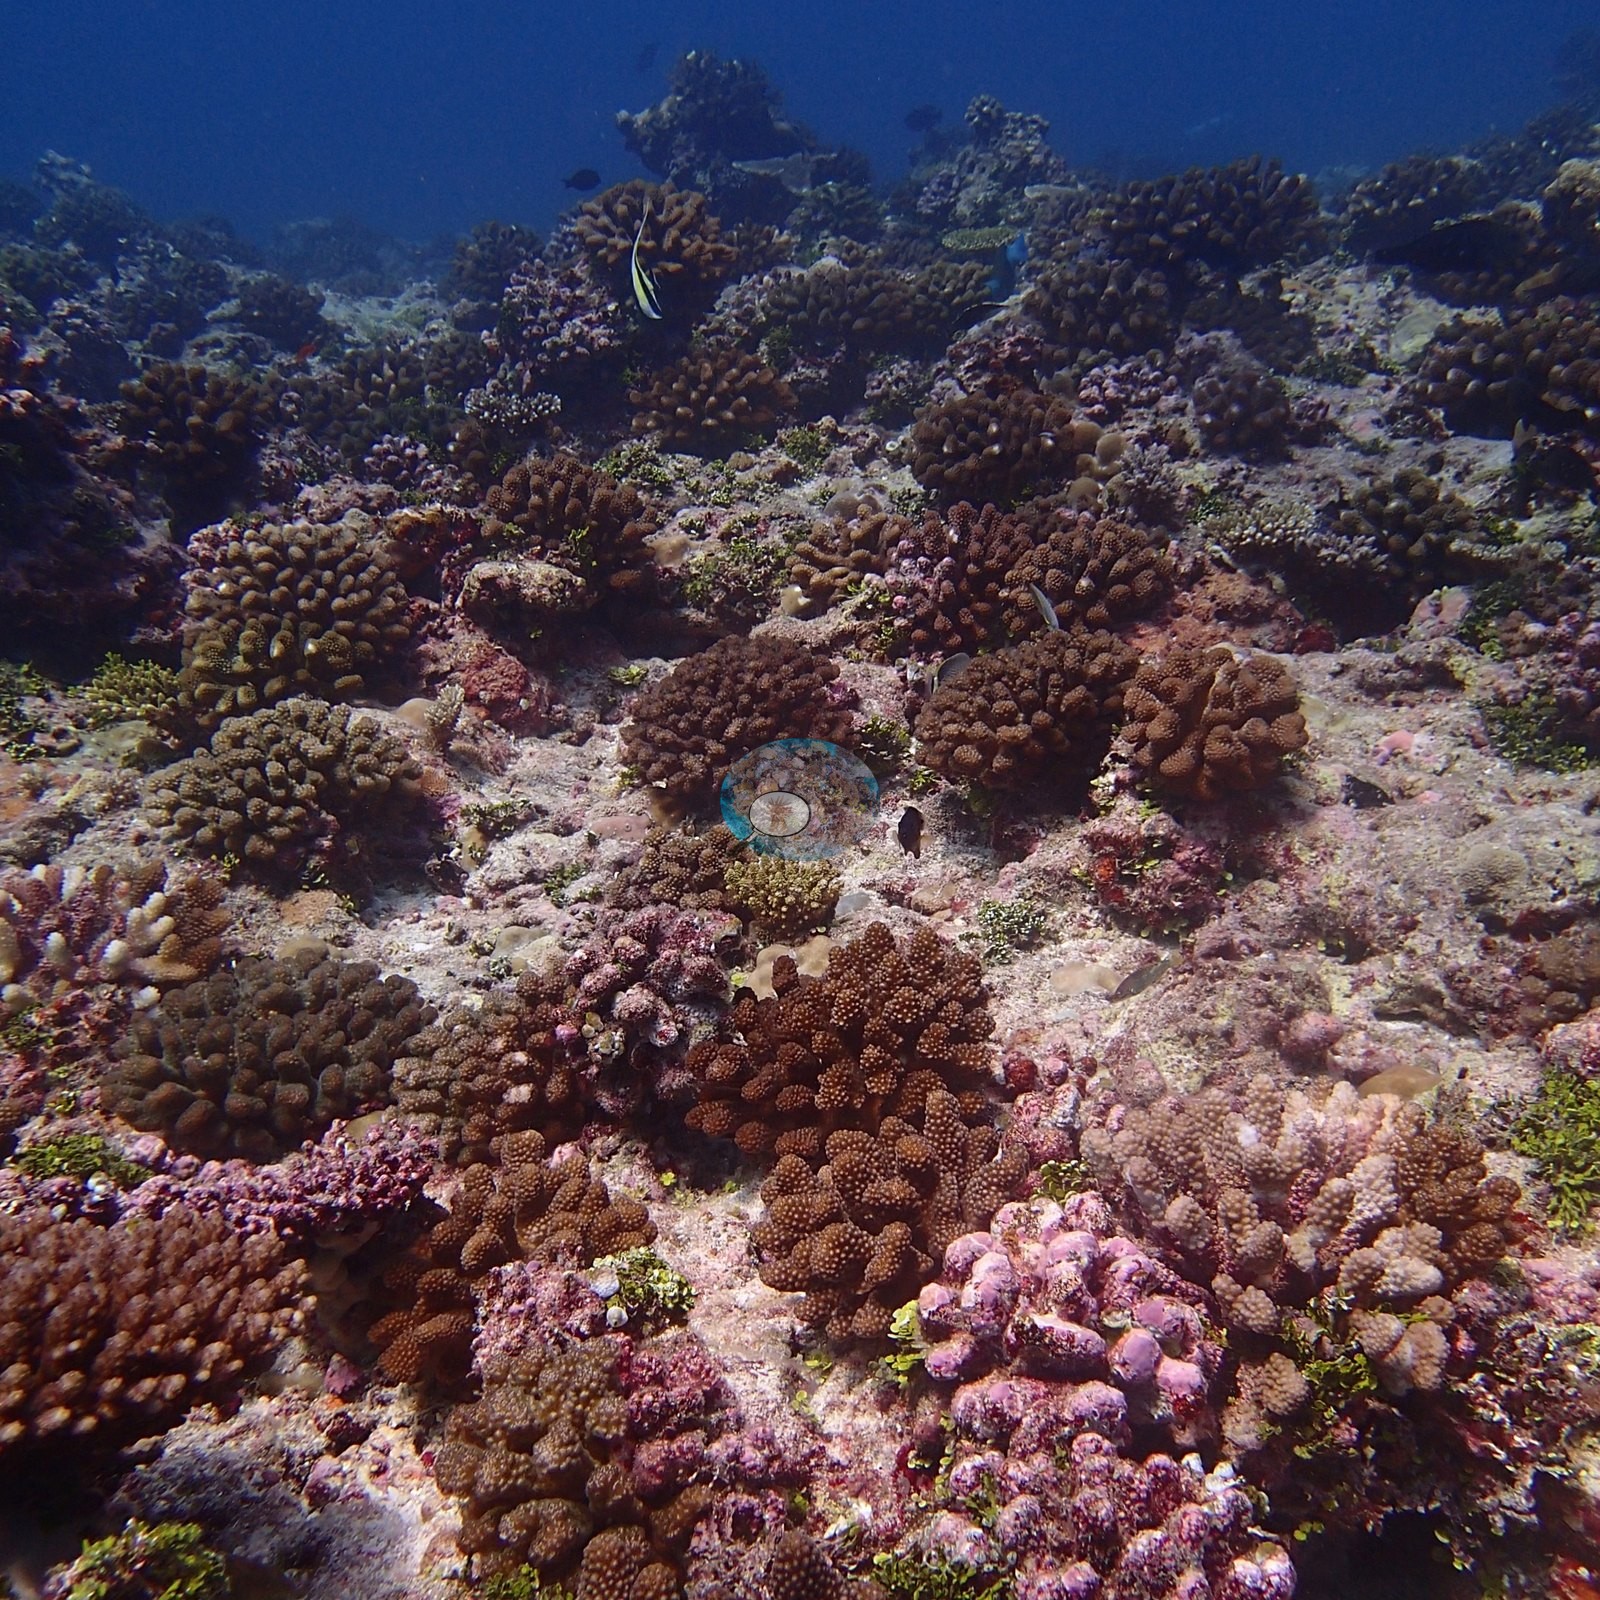
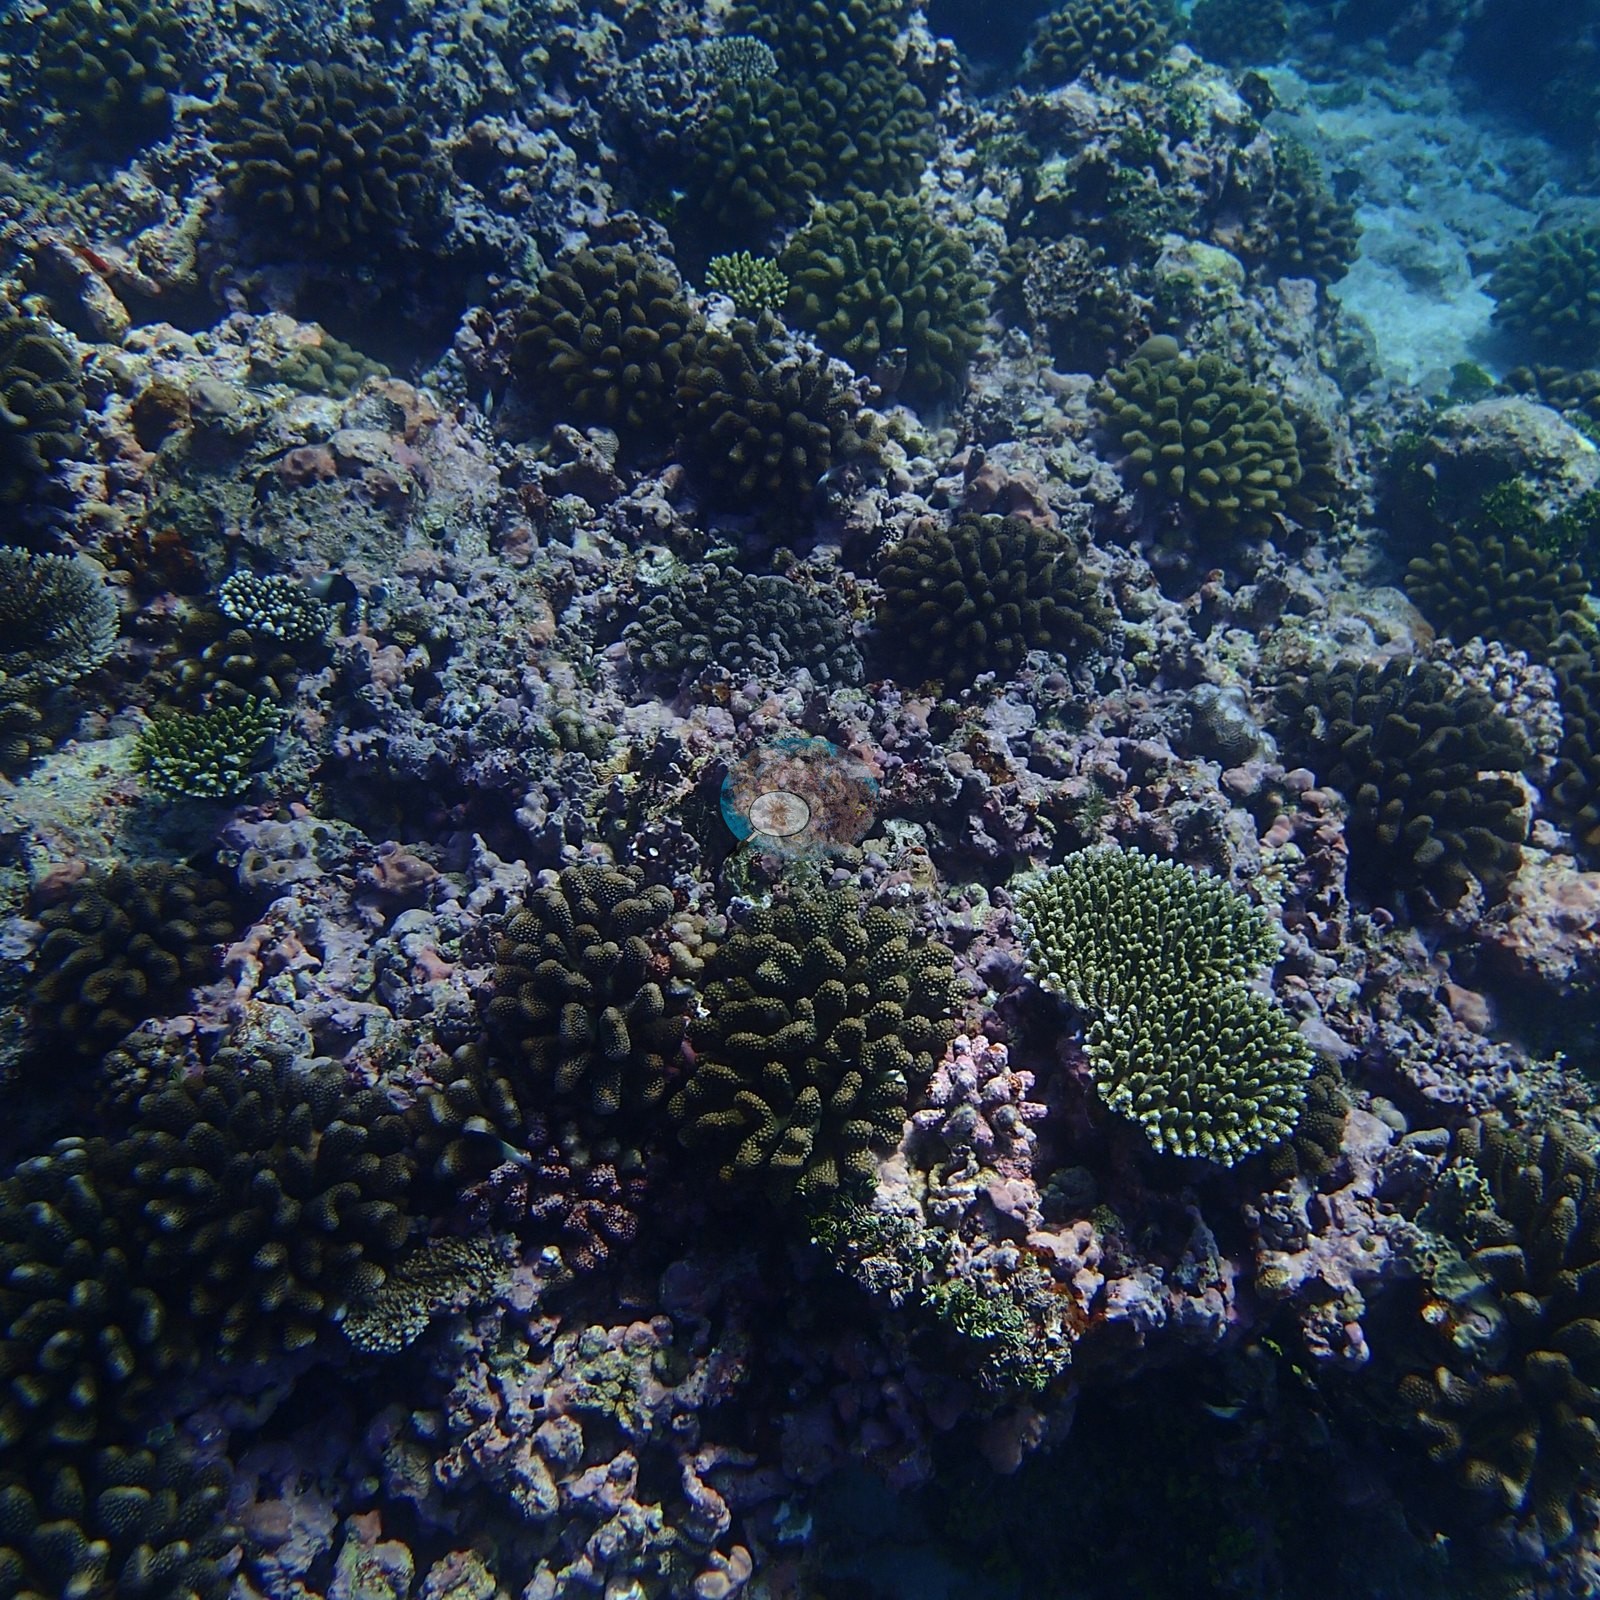
Off Maafushi the reef is crowded: a rugged limestone slope plated in pink coralline algae and packed almost shoulder to shoulder with corals, falling away into open blue on its seaward edge (e.g., Image 15, Image 21, Image 22, Image 23, Image 24, Image 25).
General benthic features
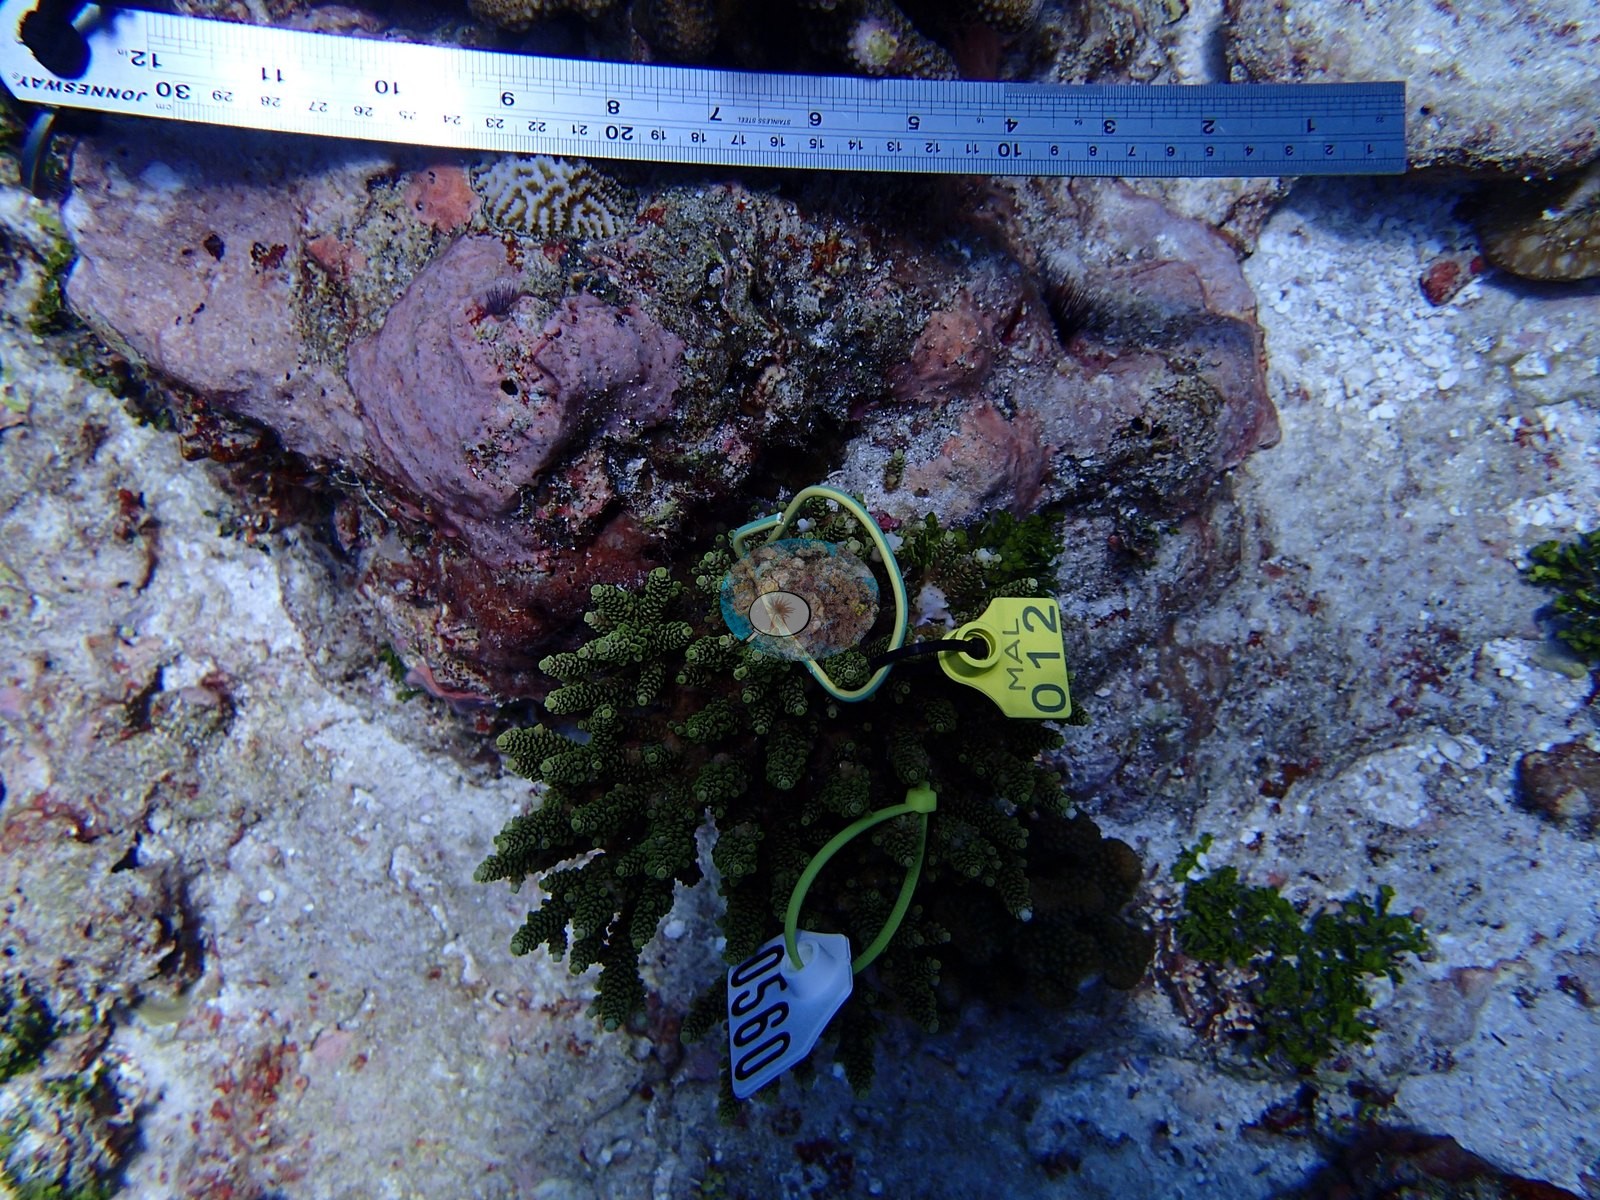
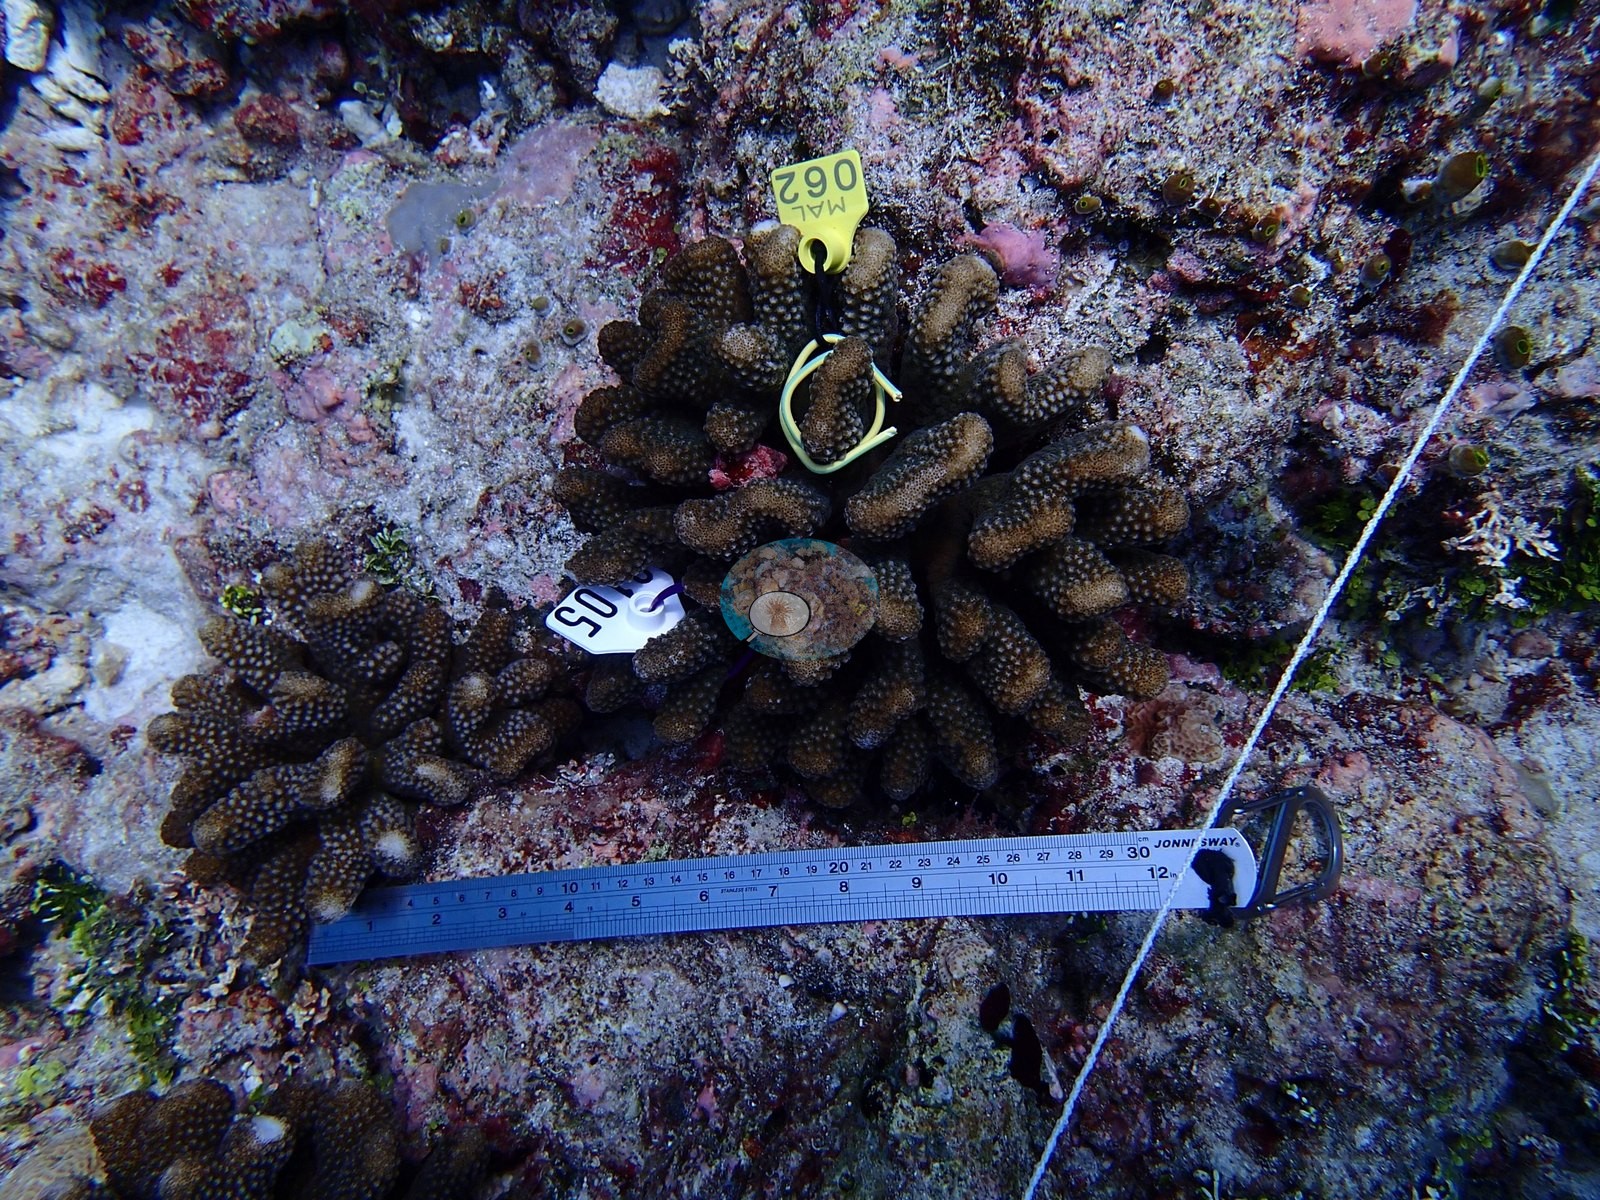
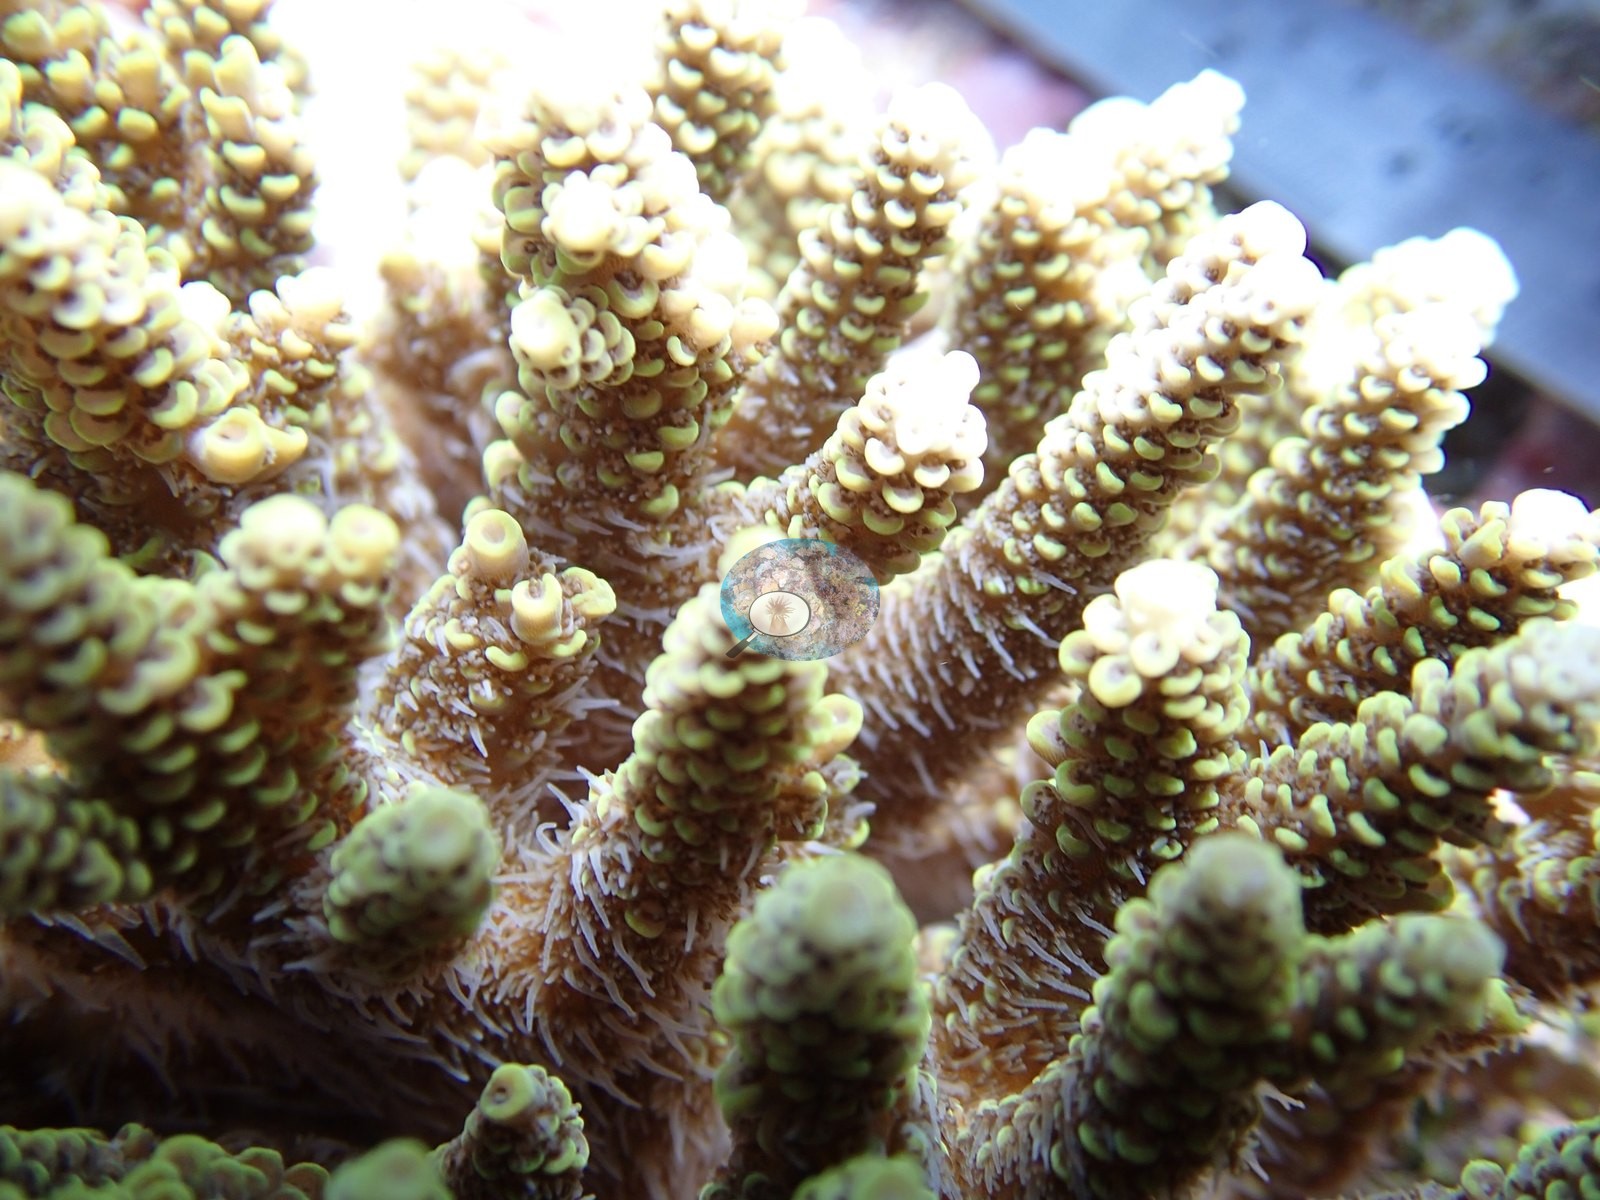
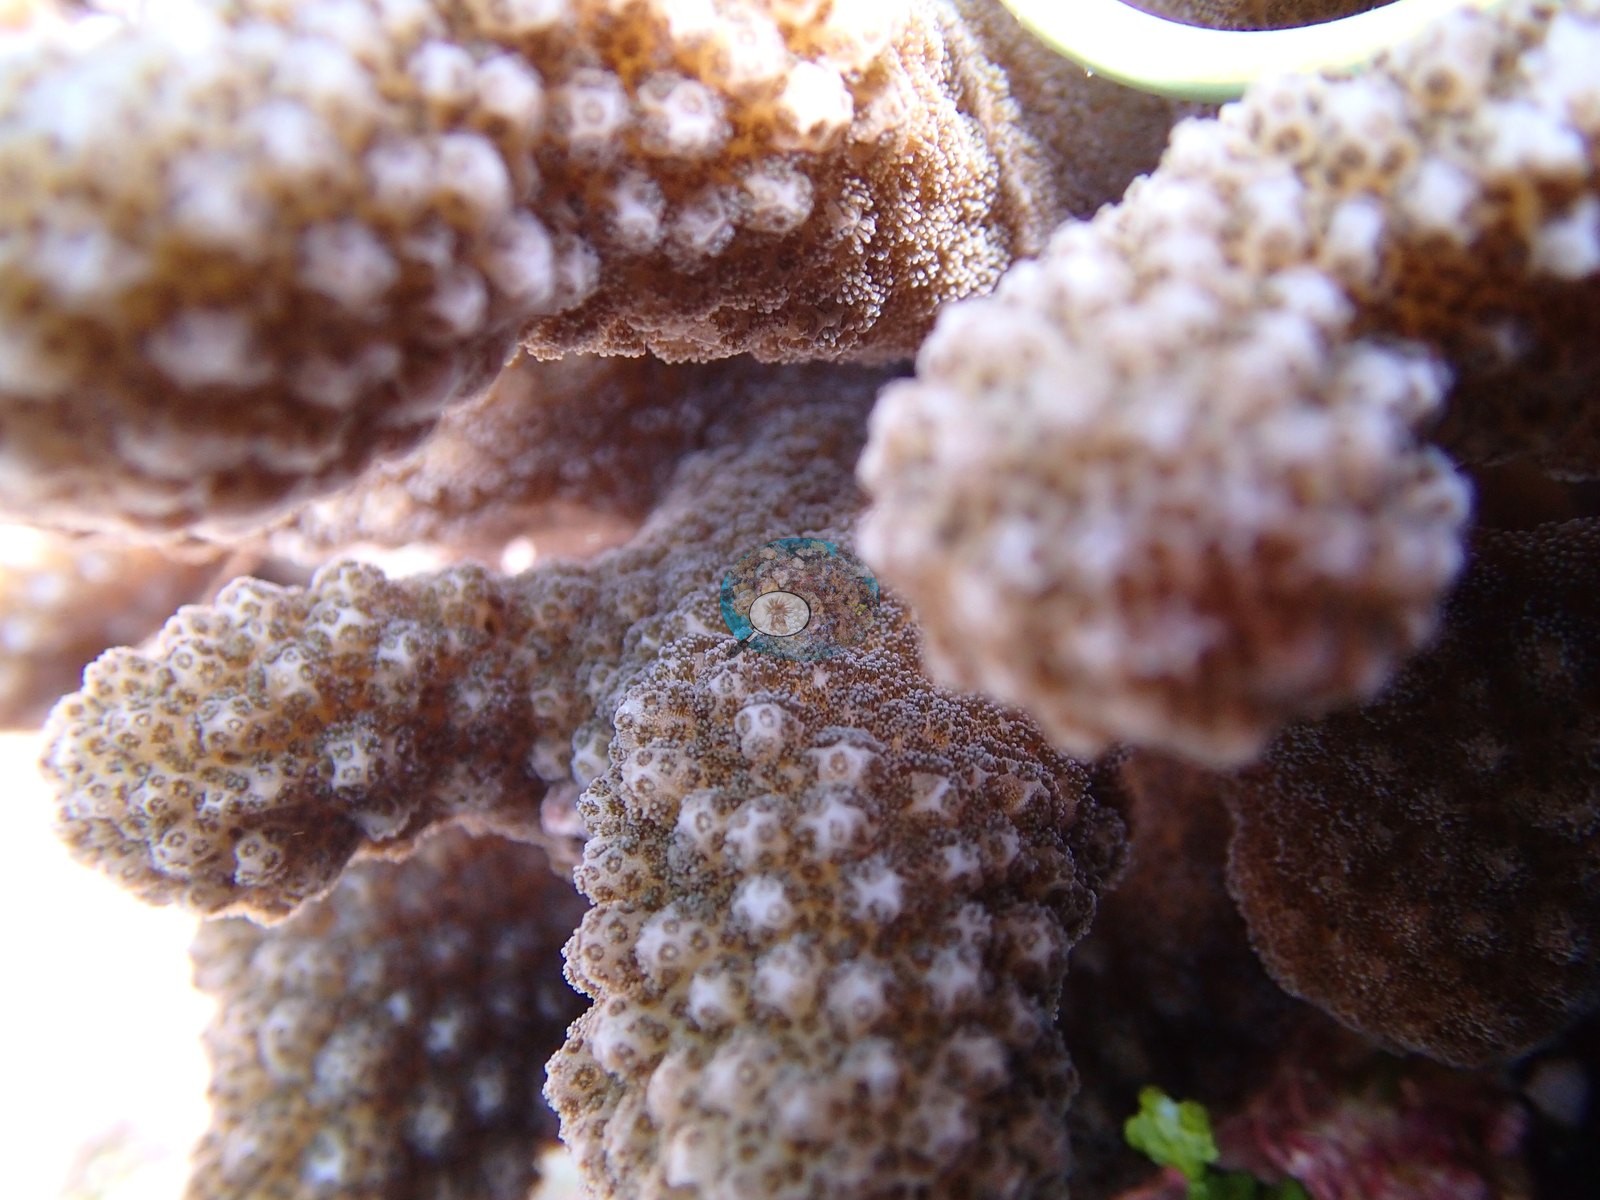
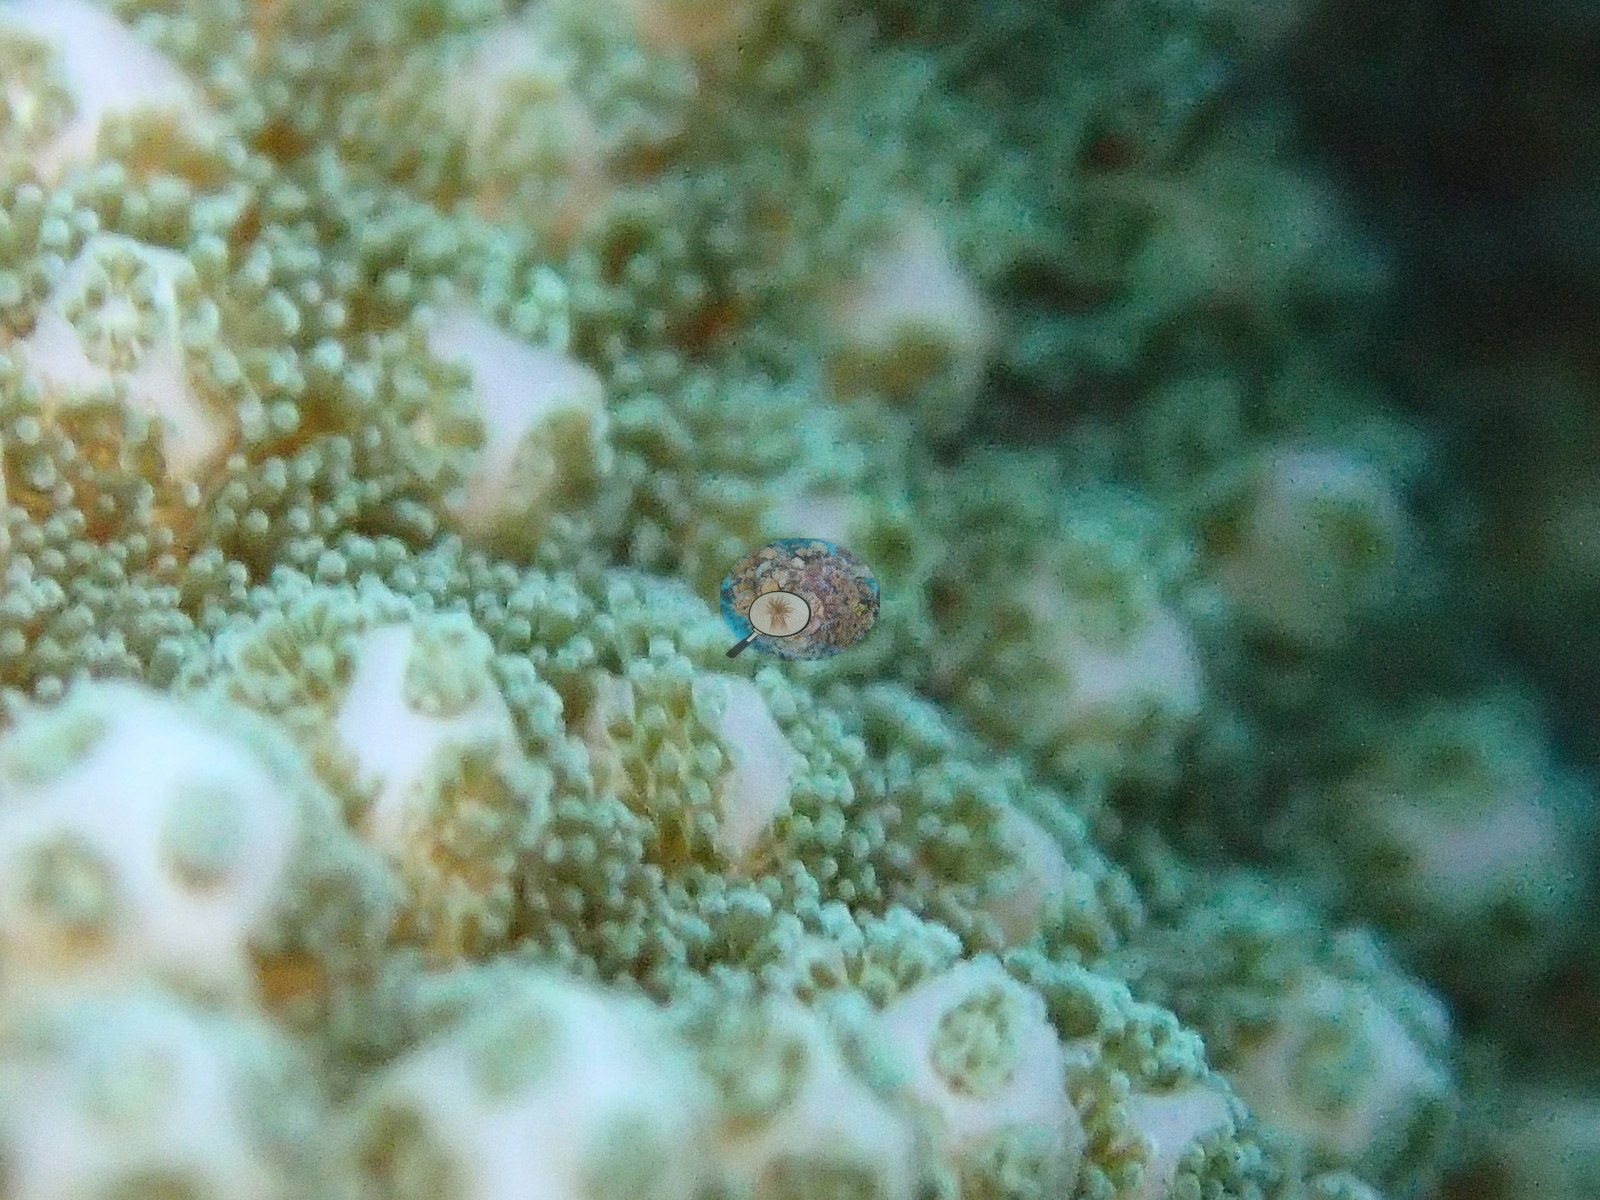
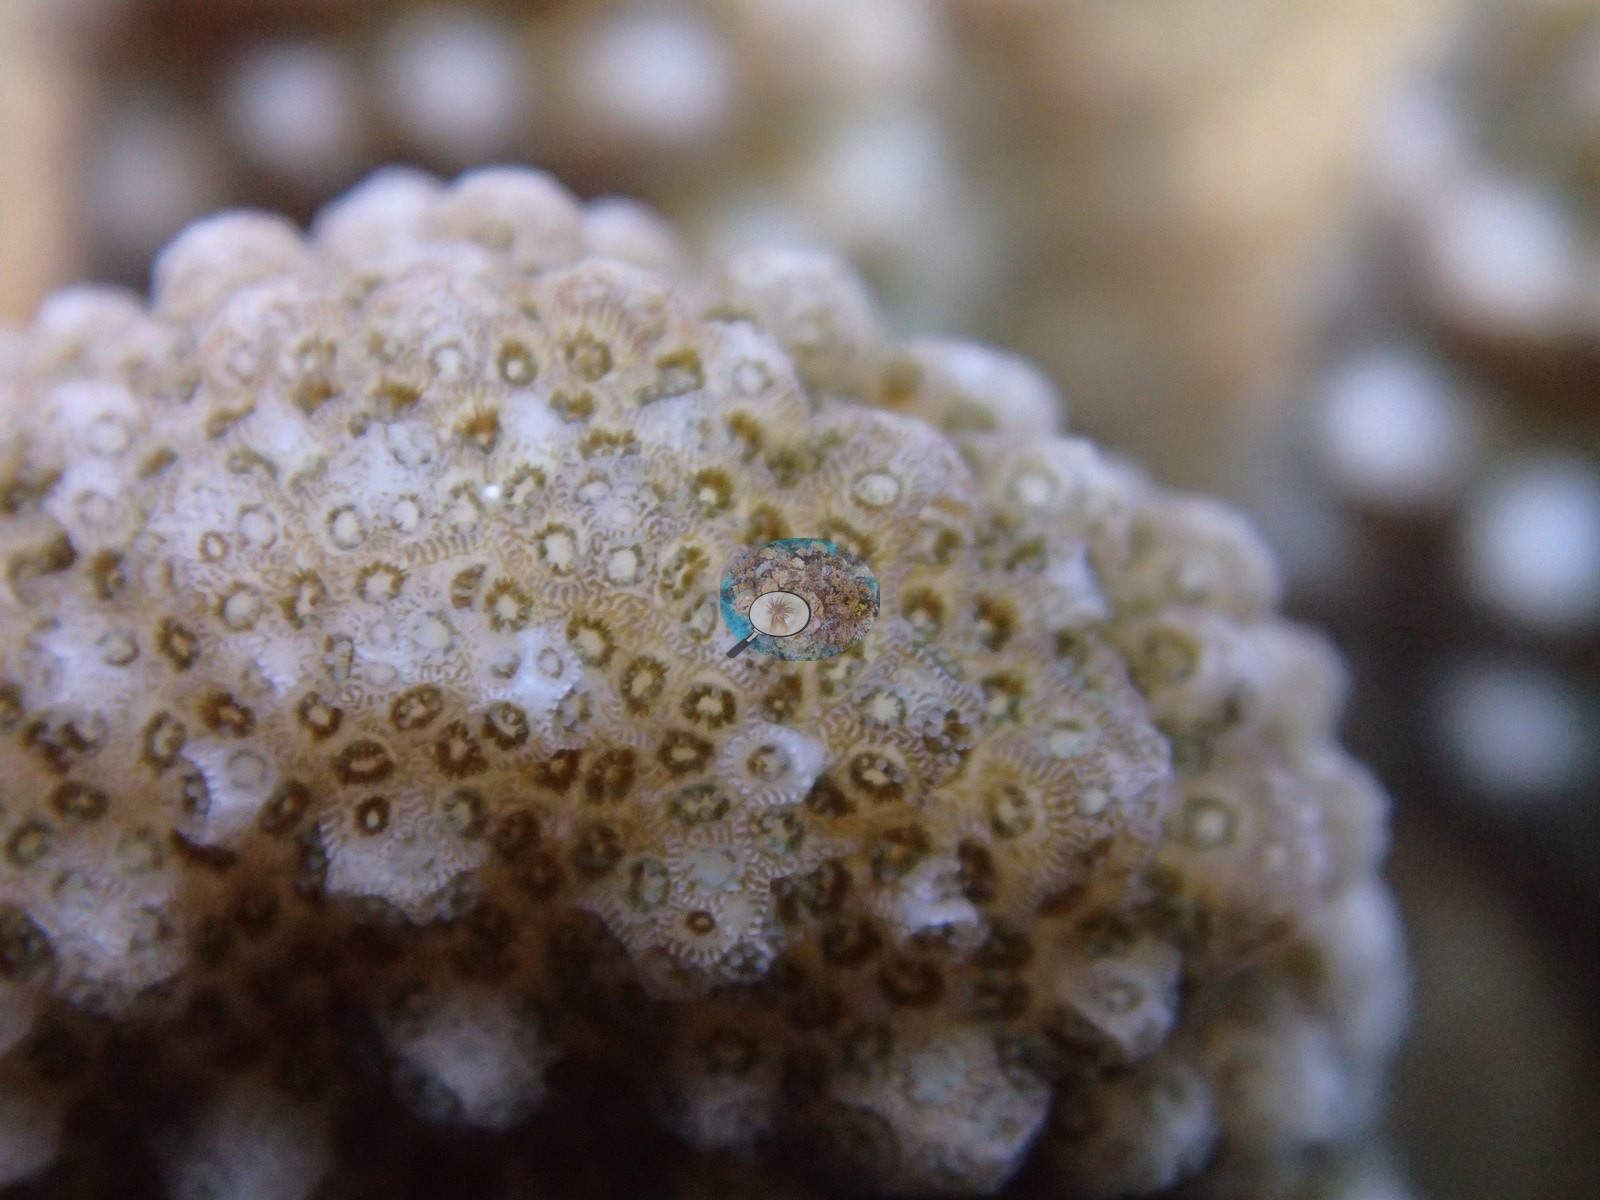
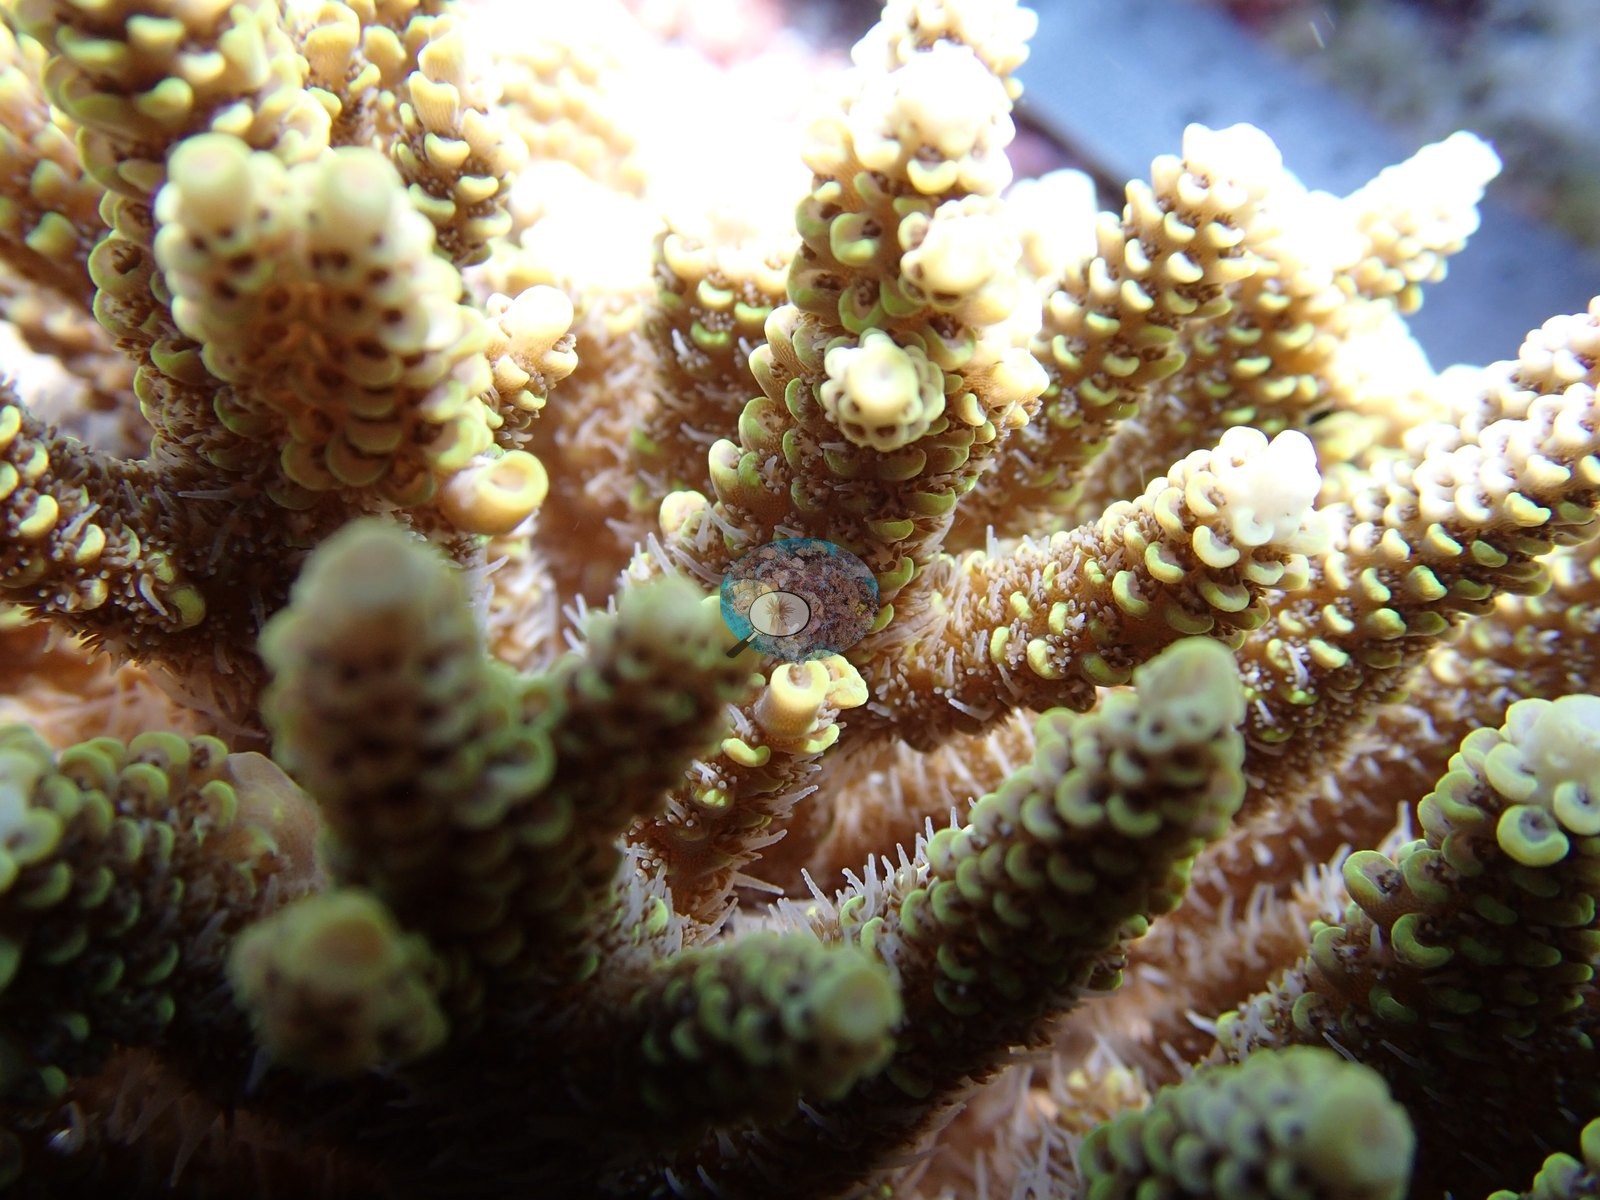
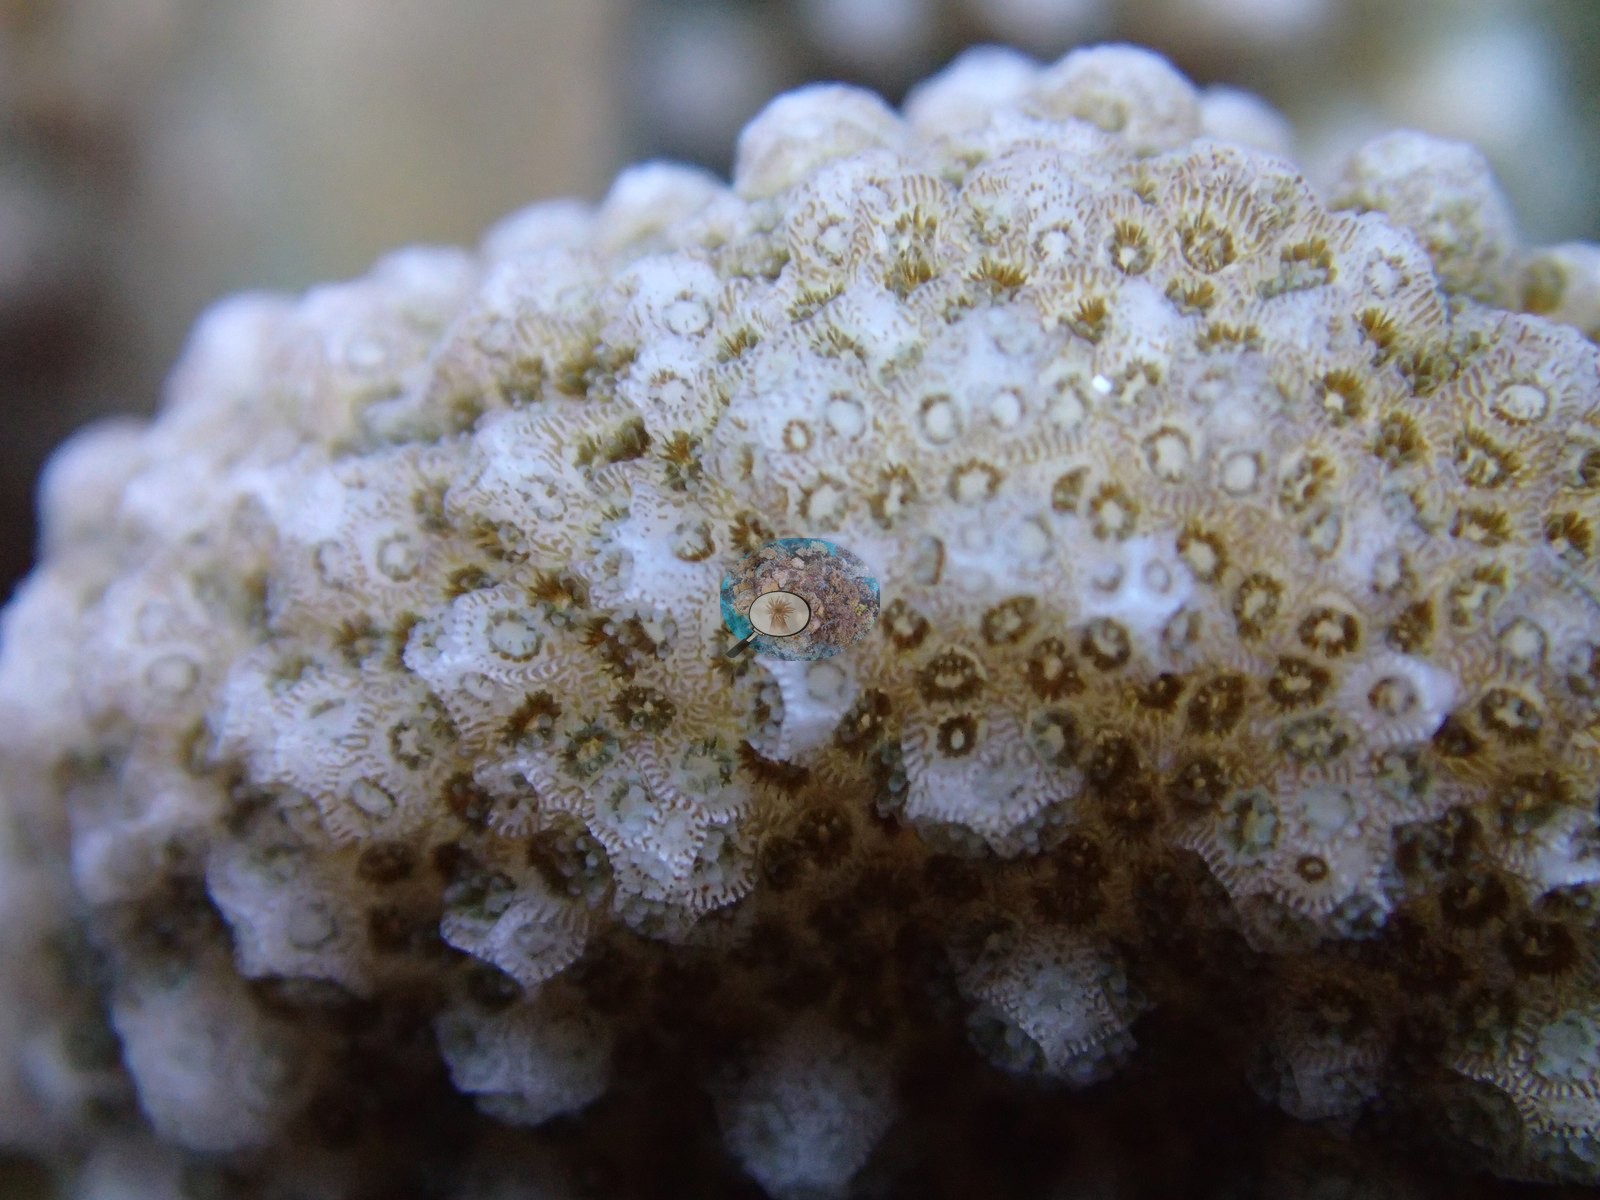
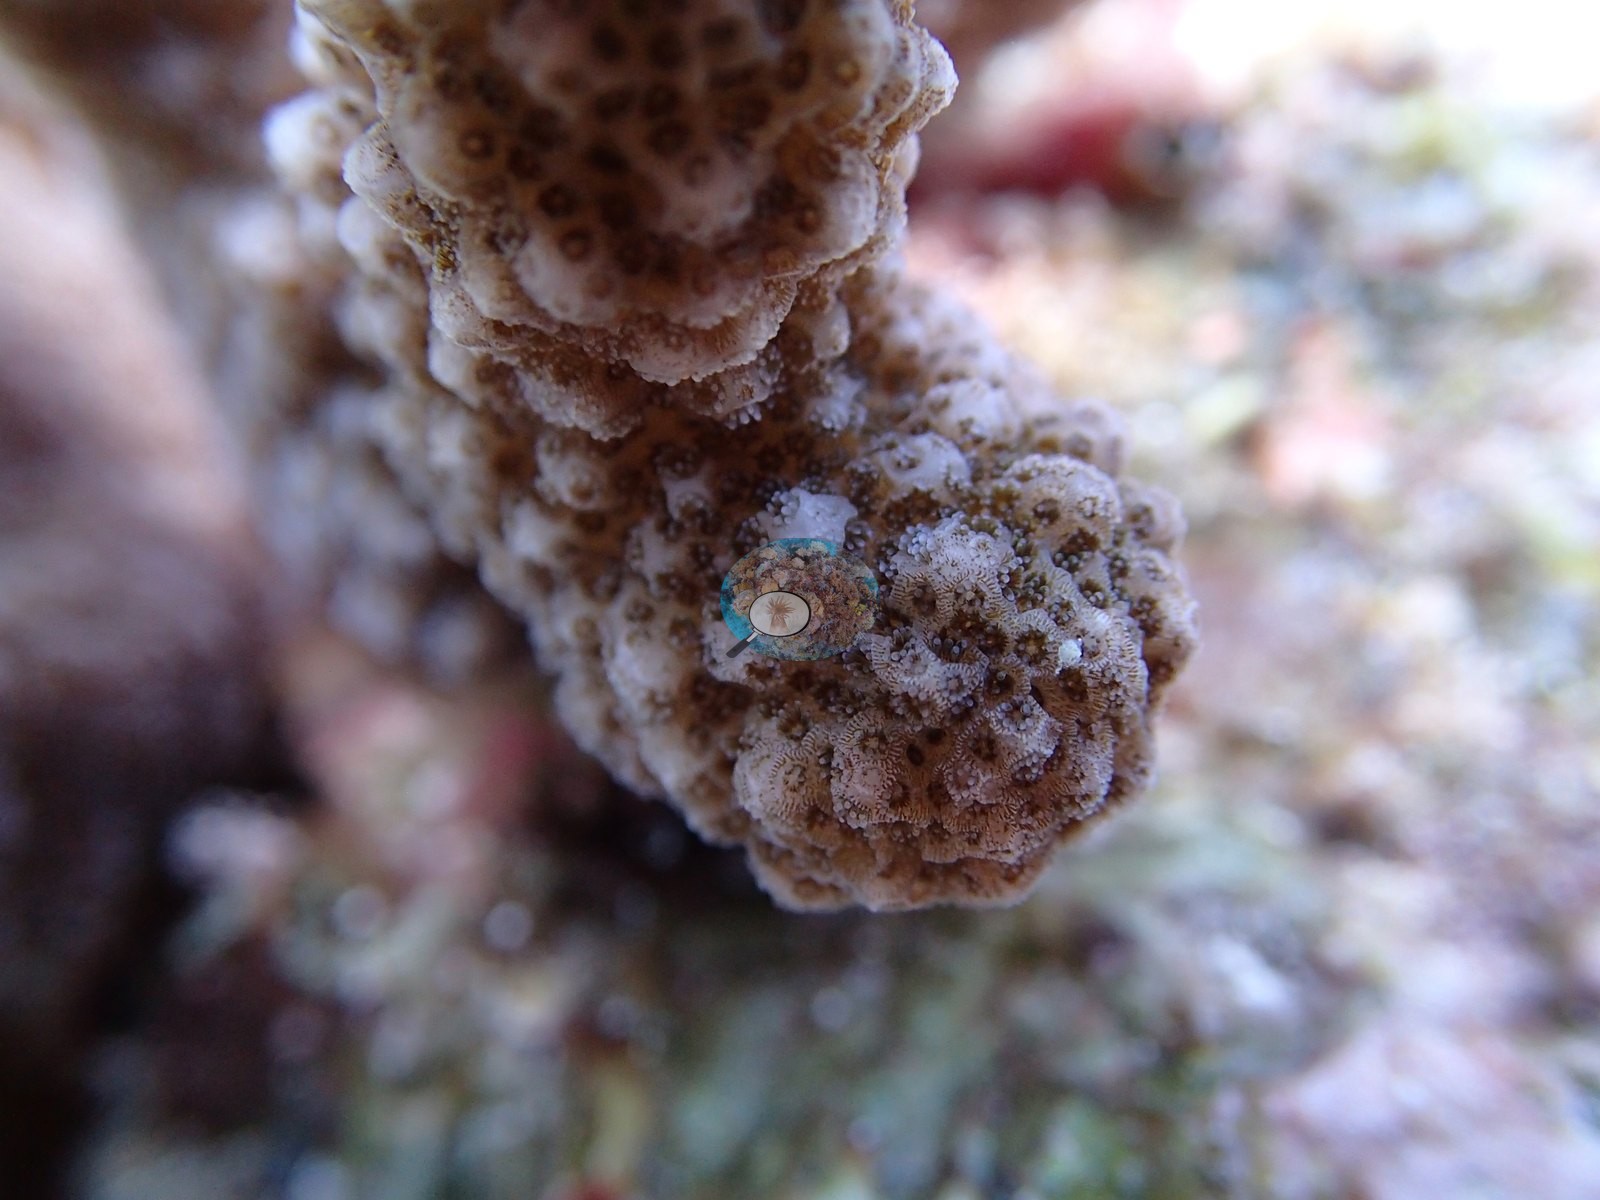
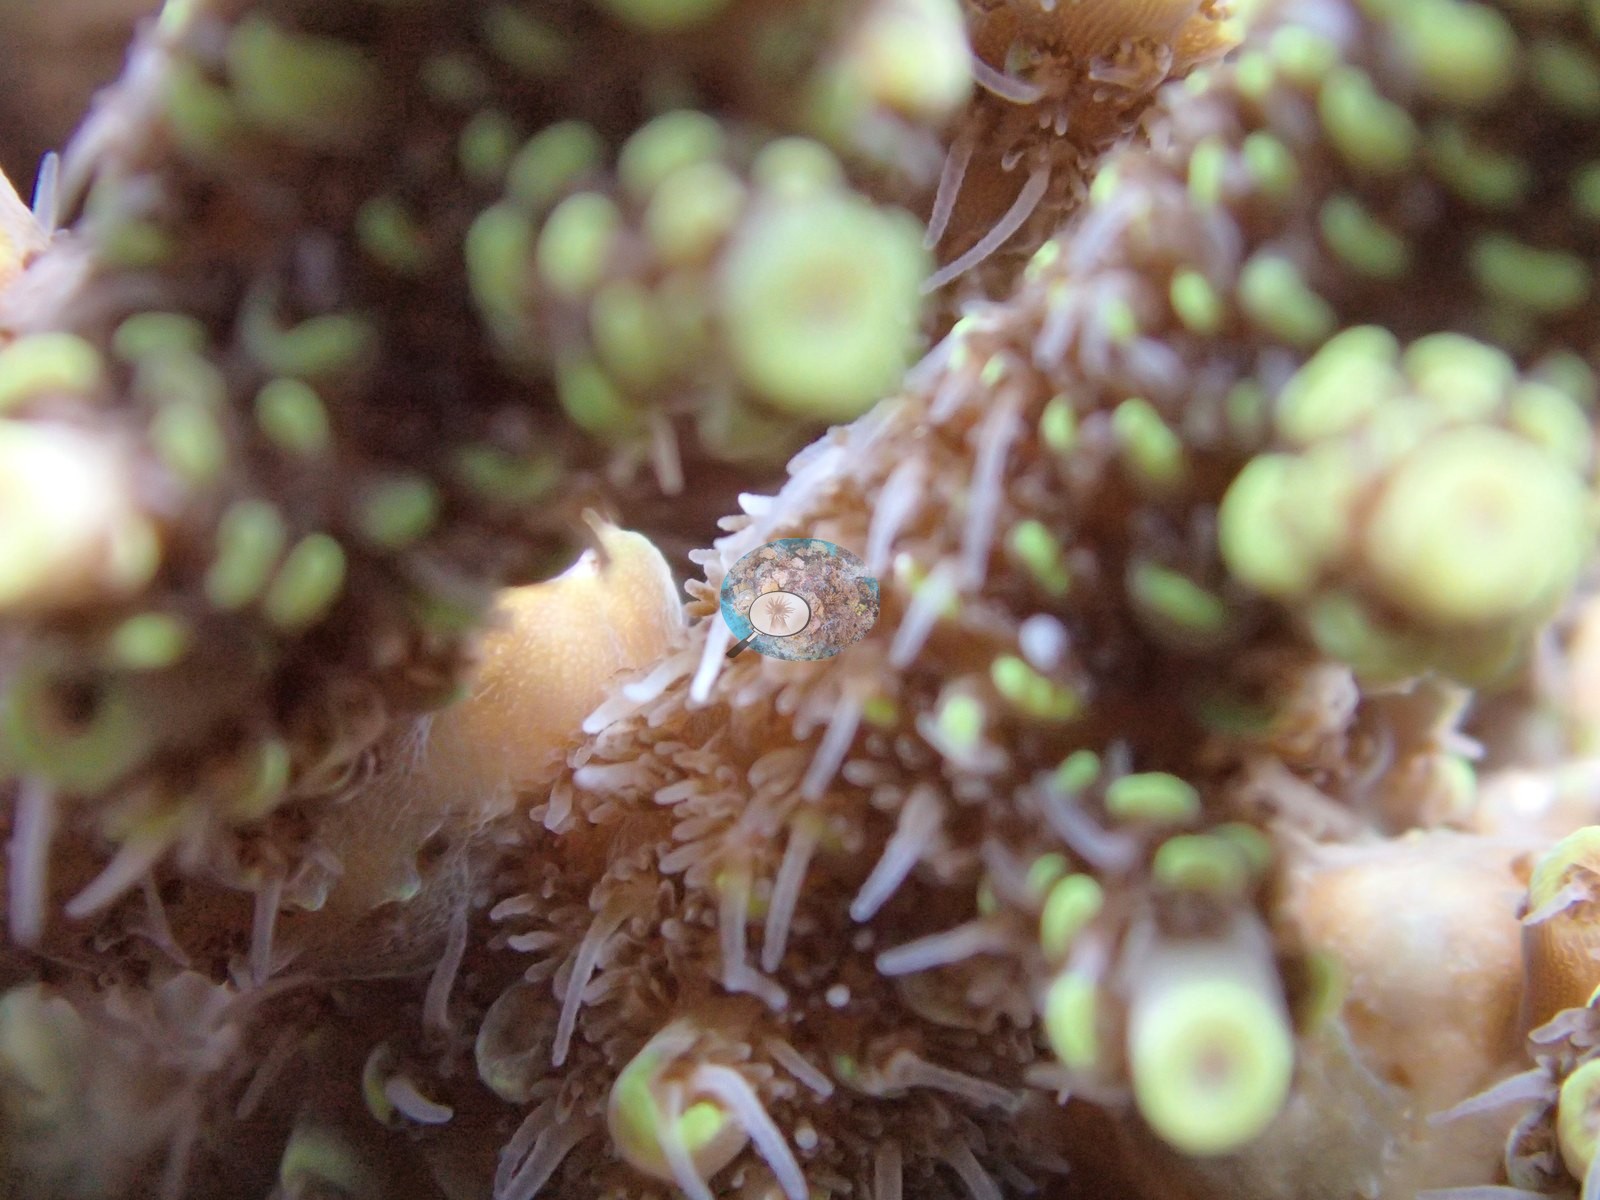
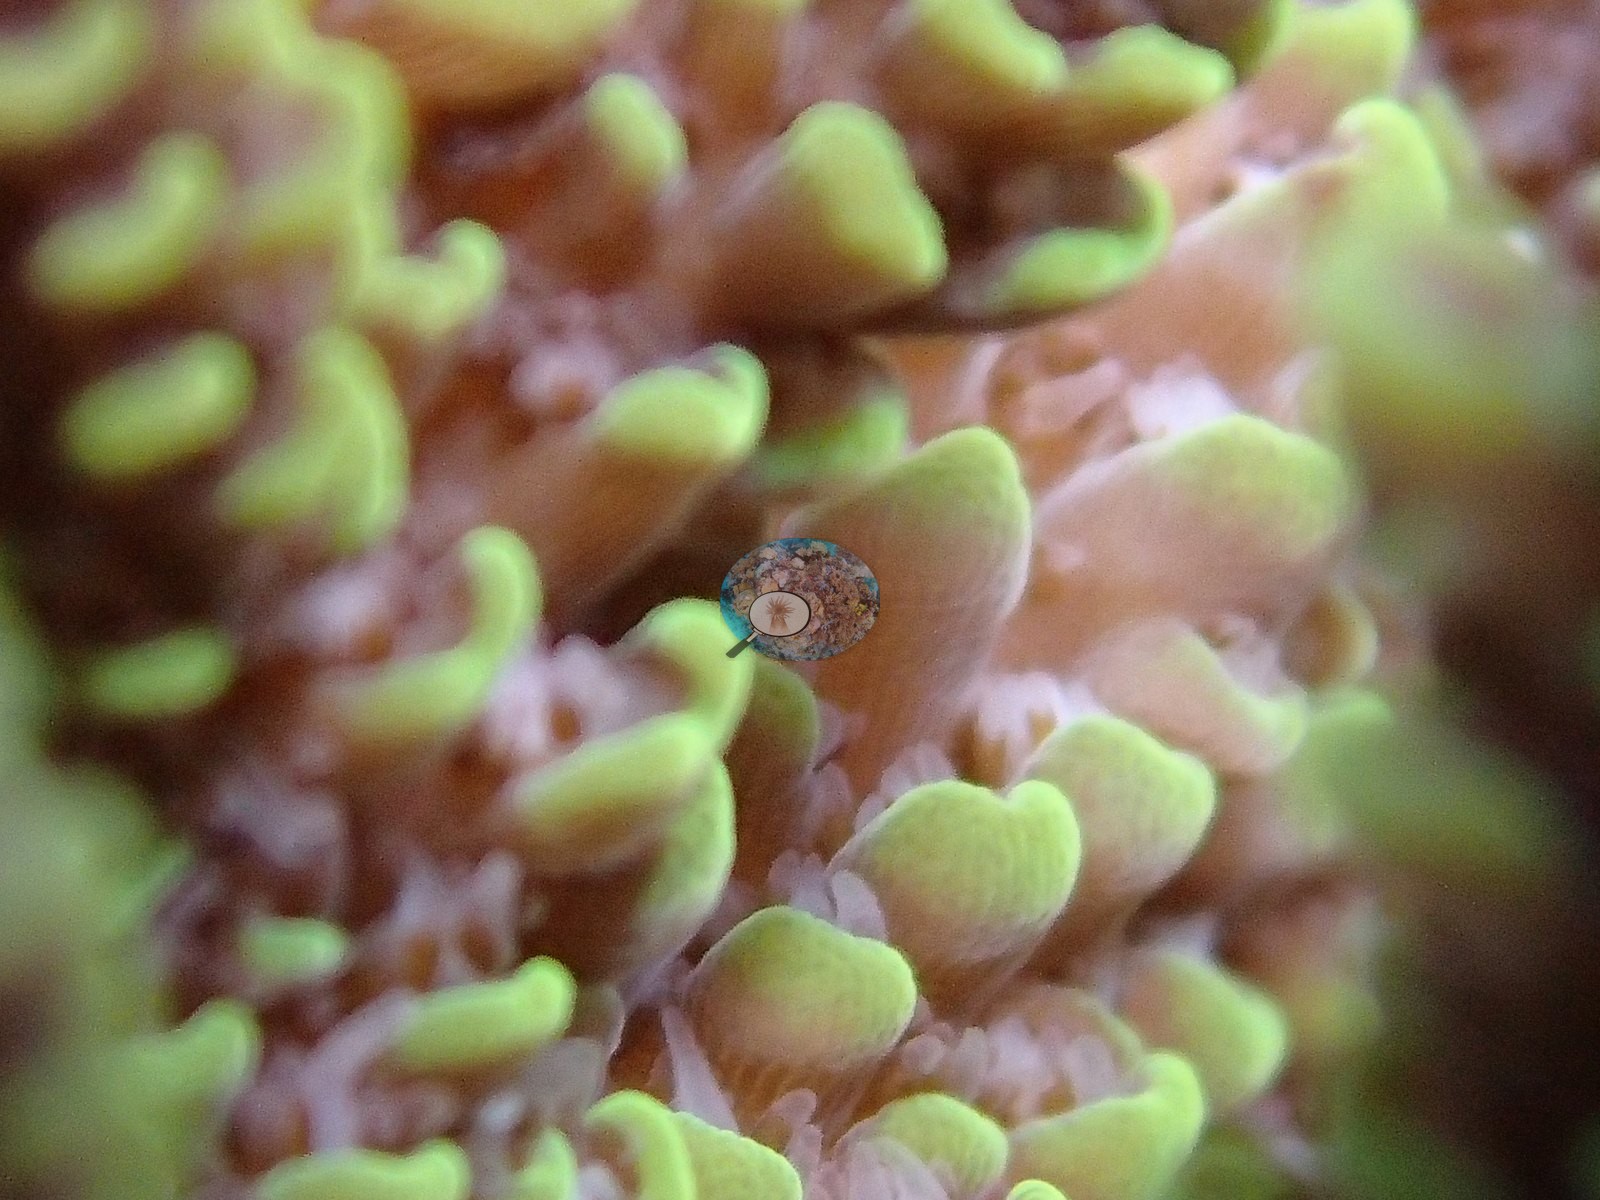
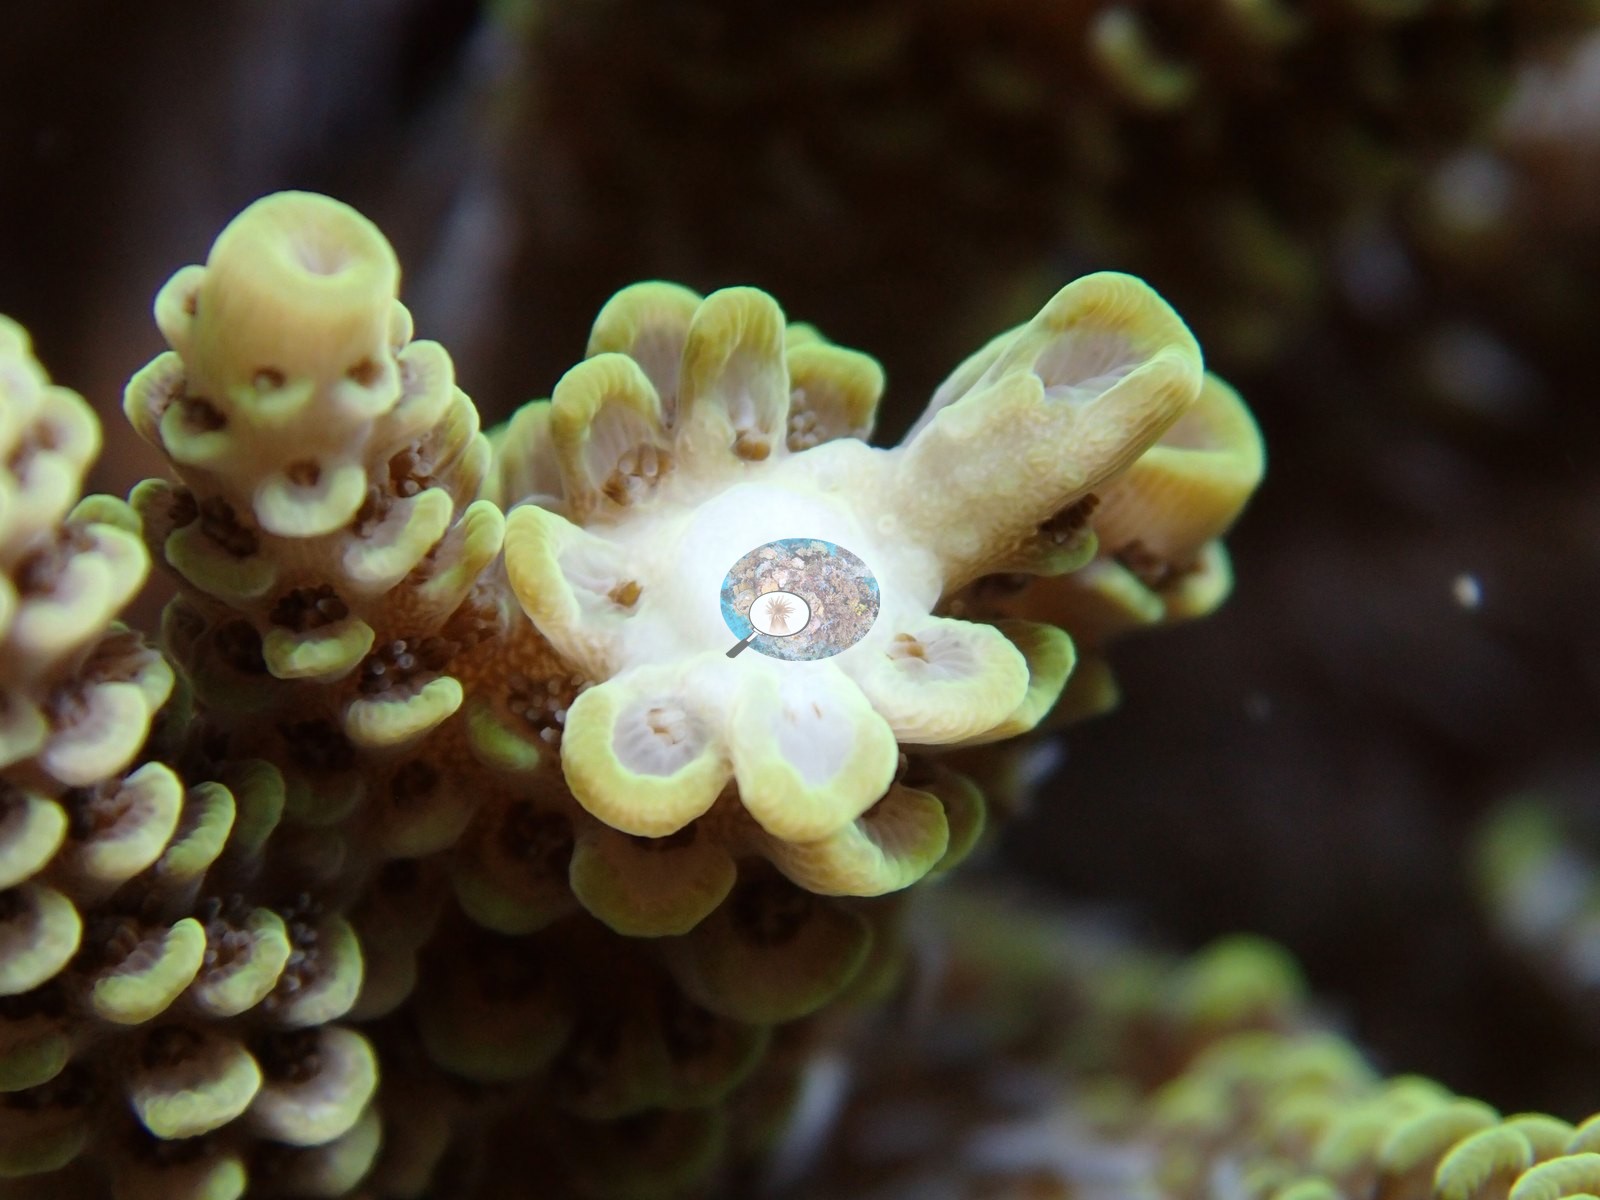
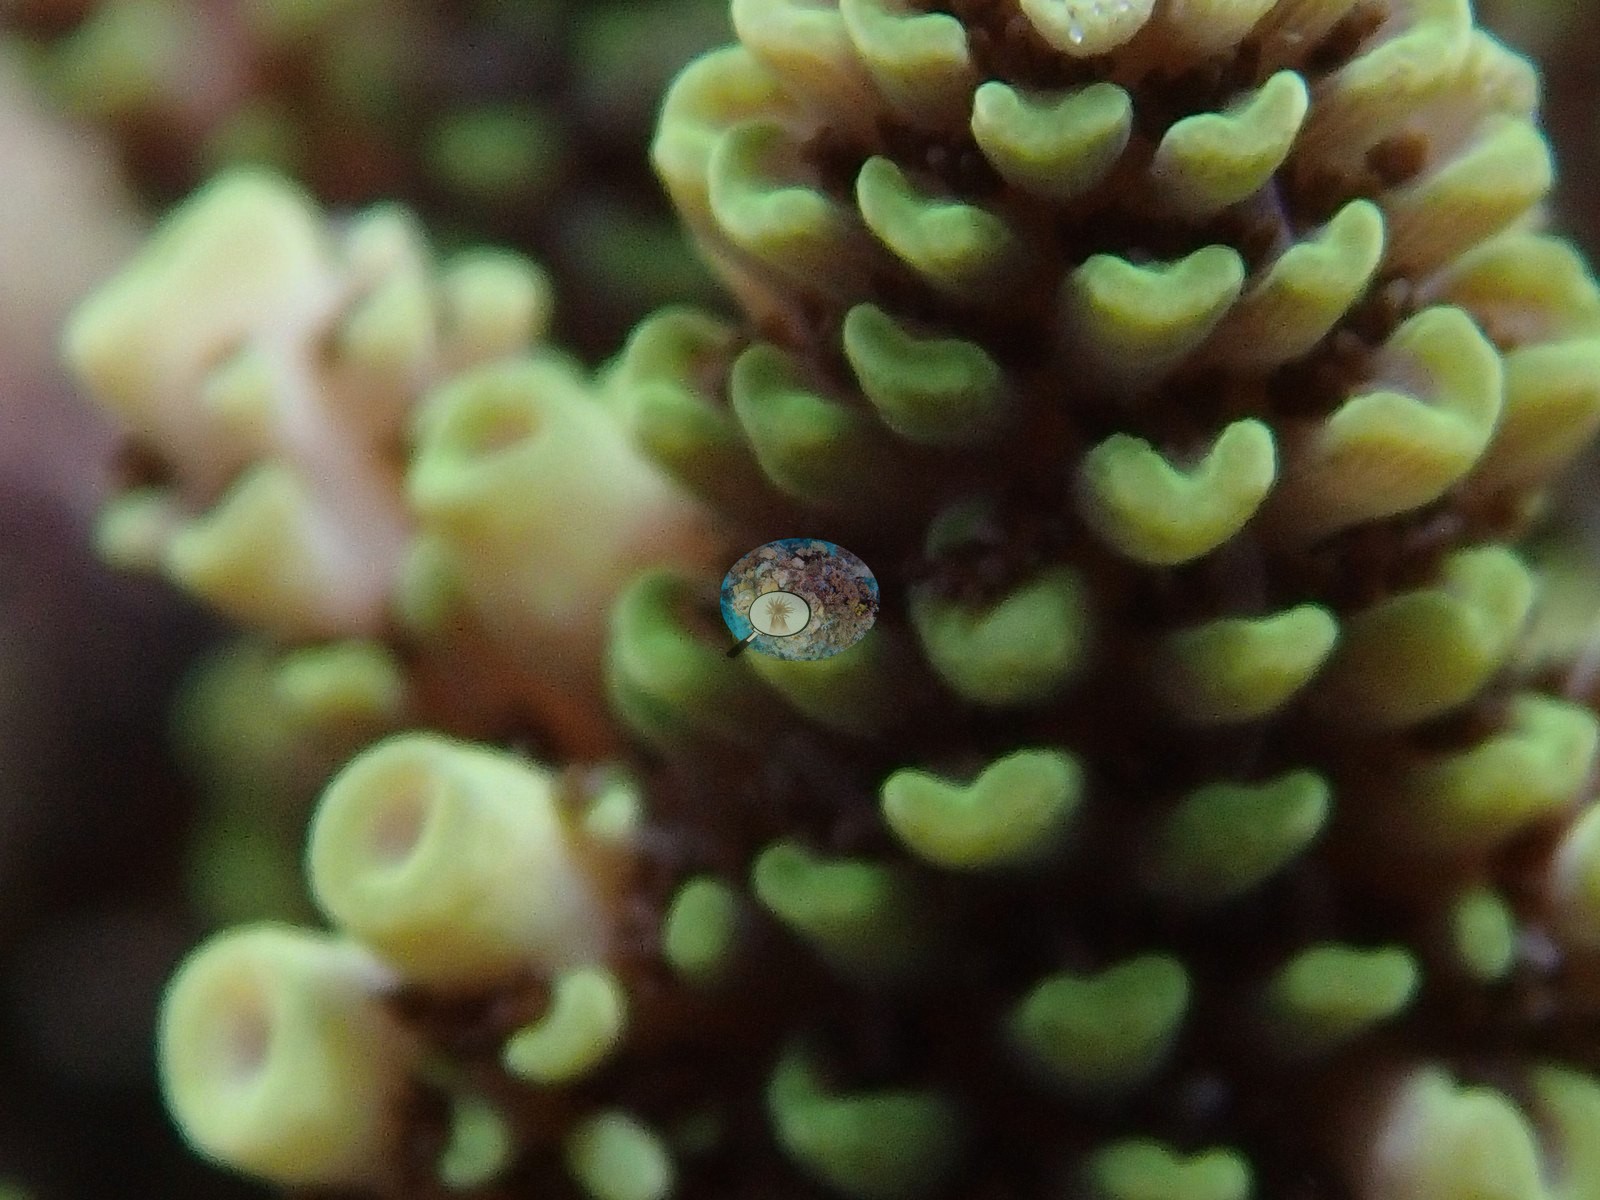
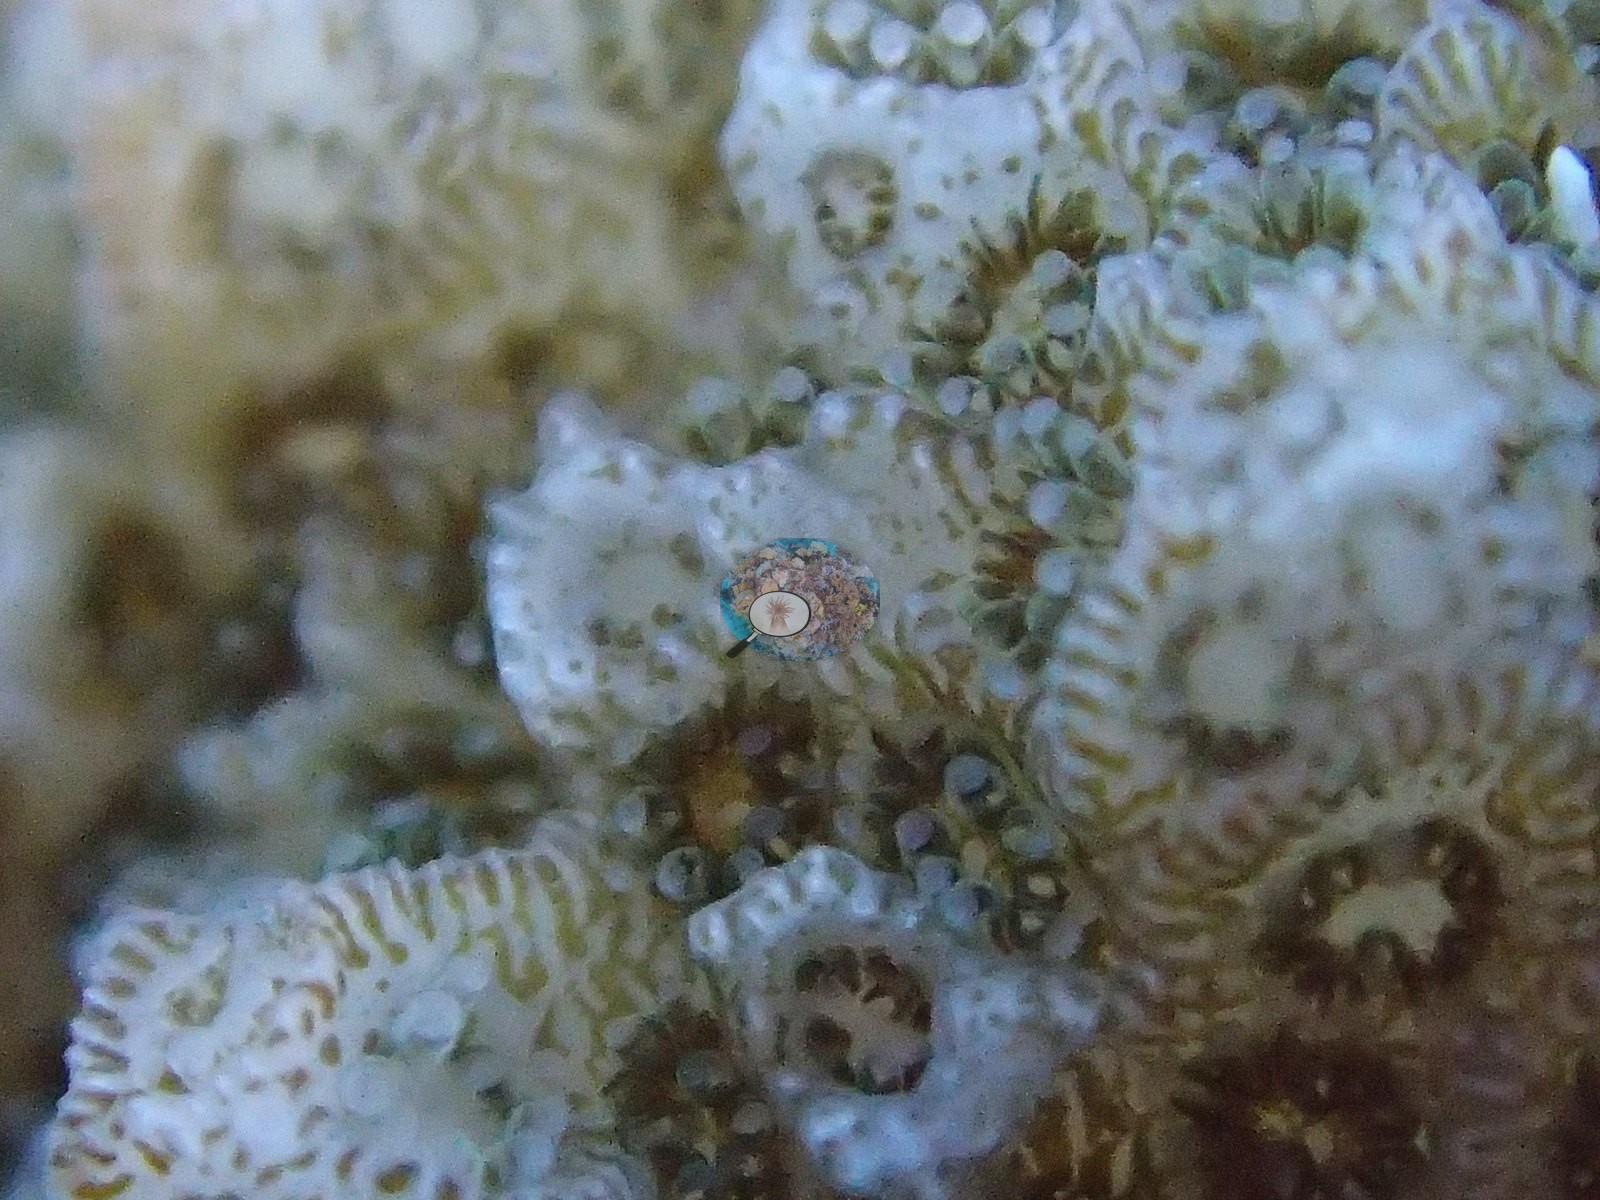
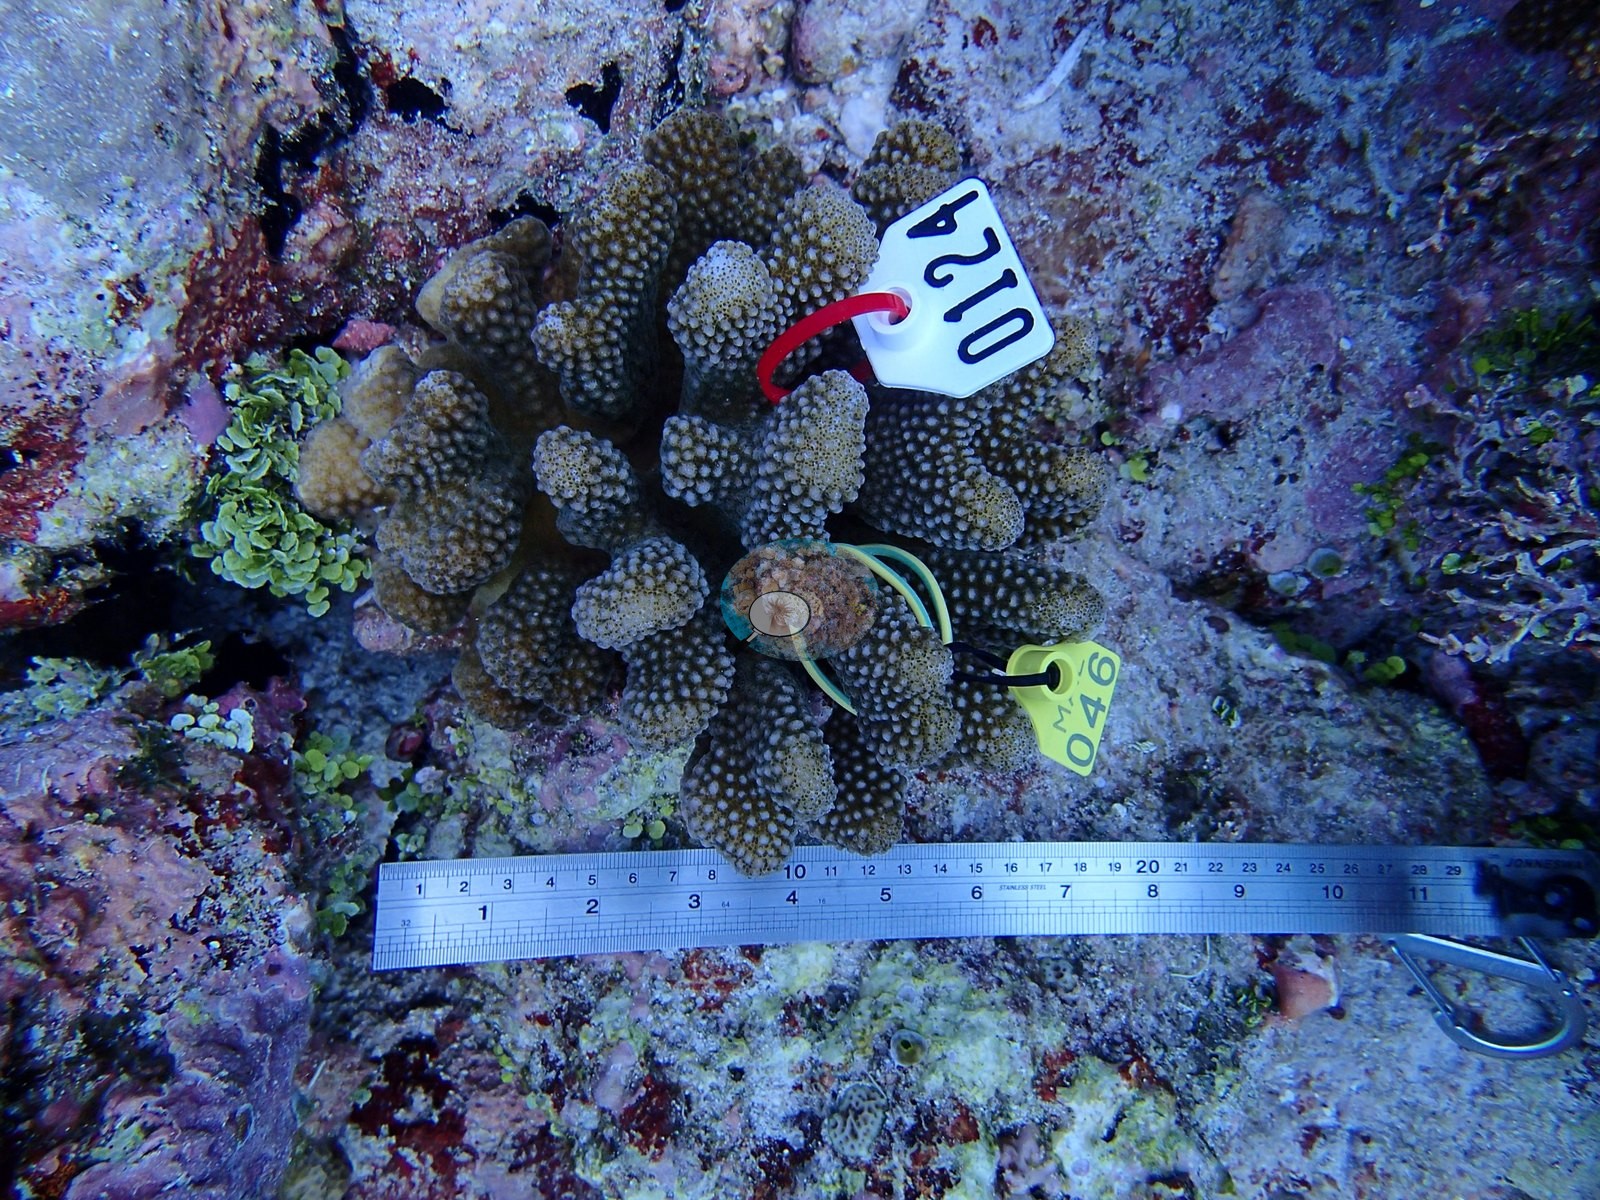
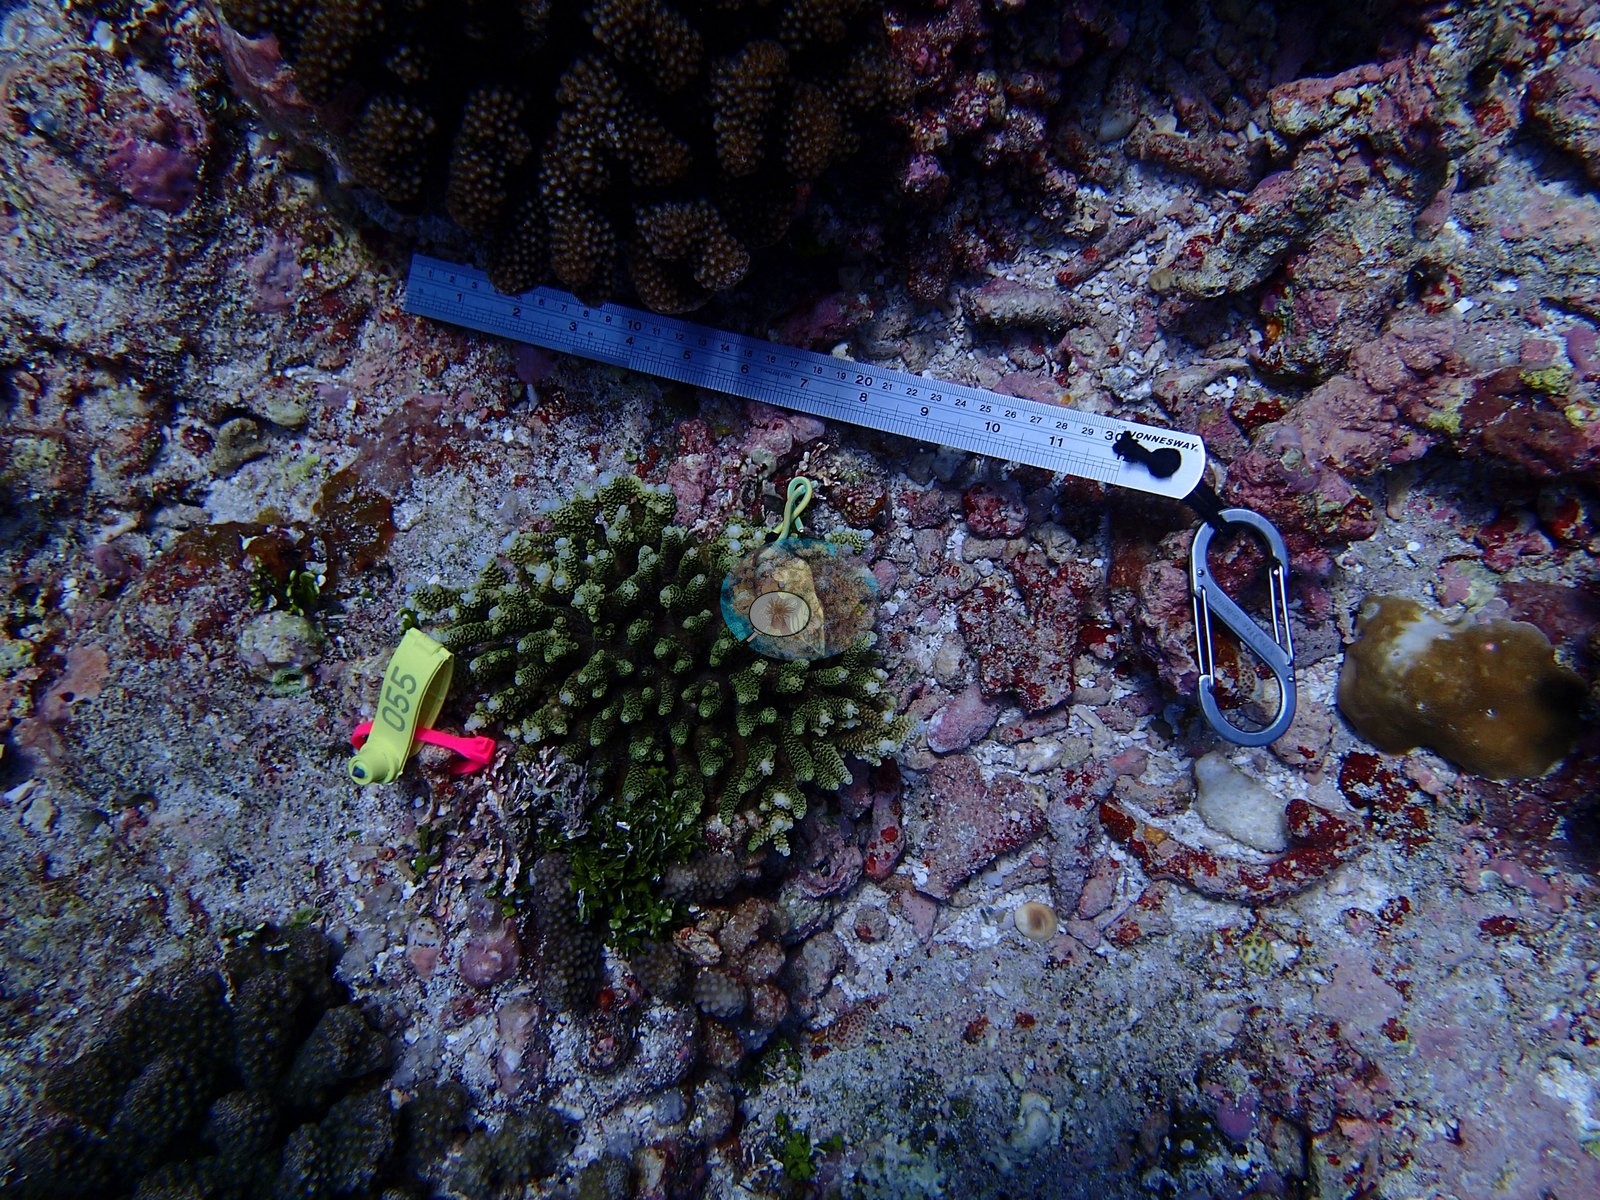
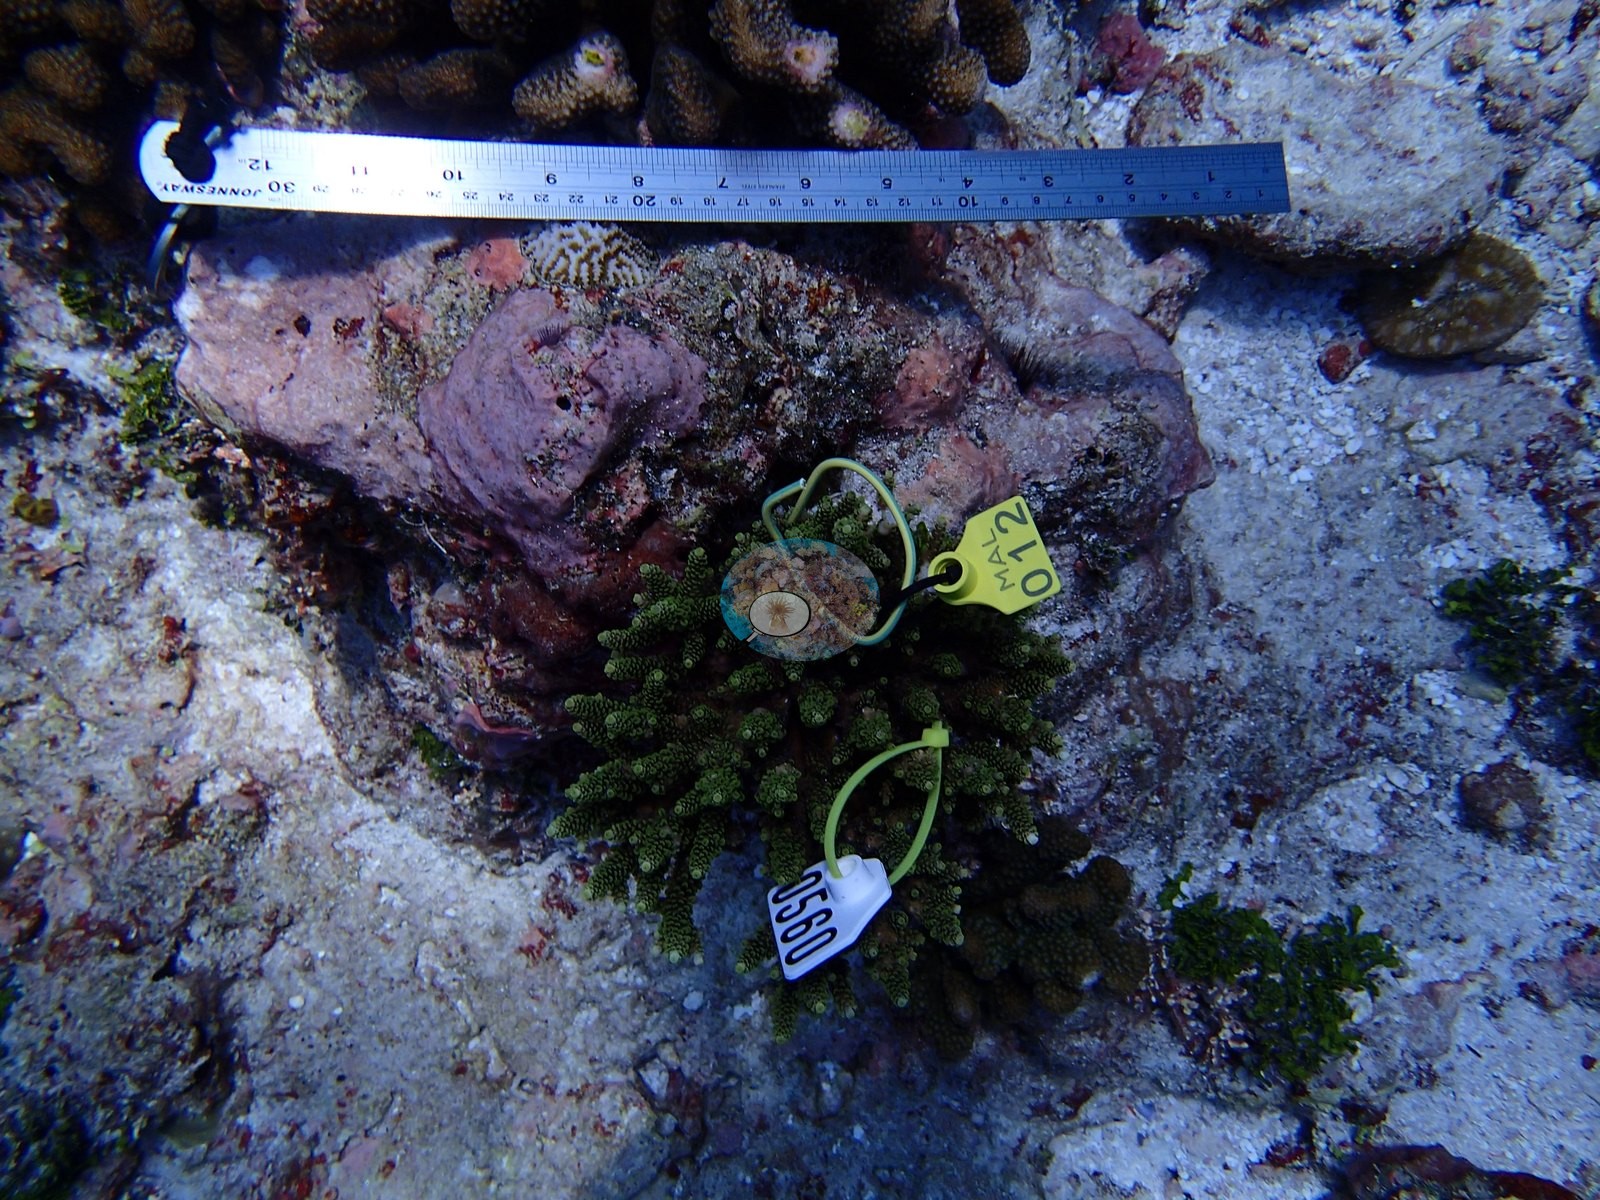
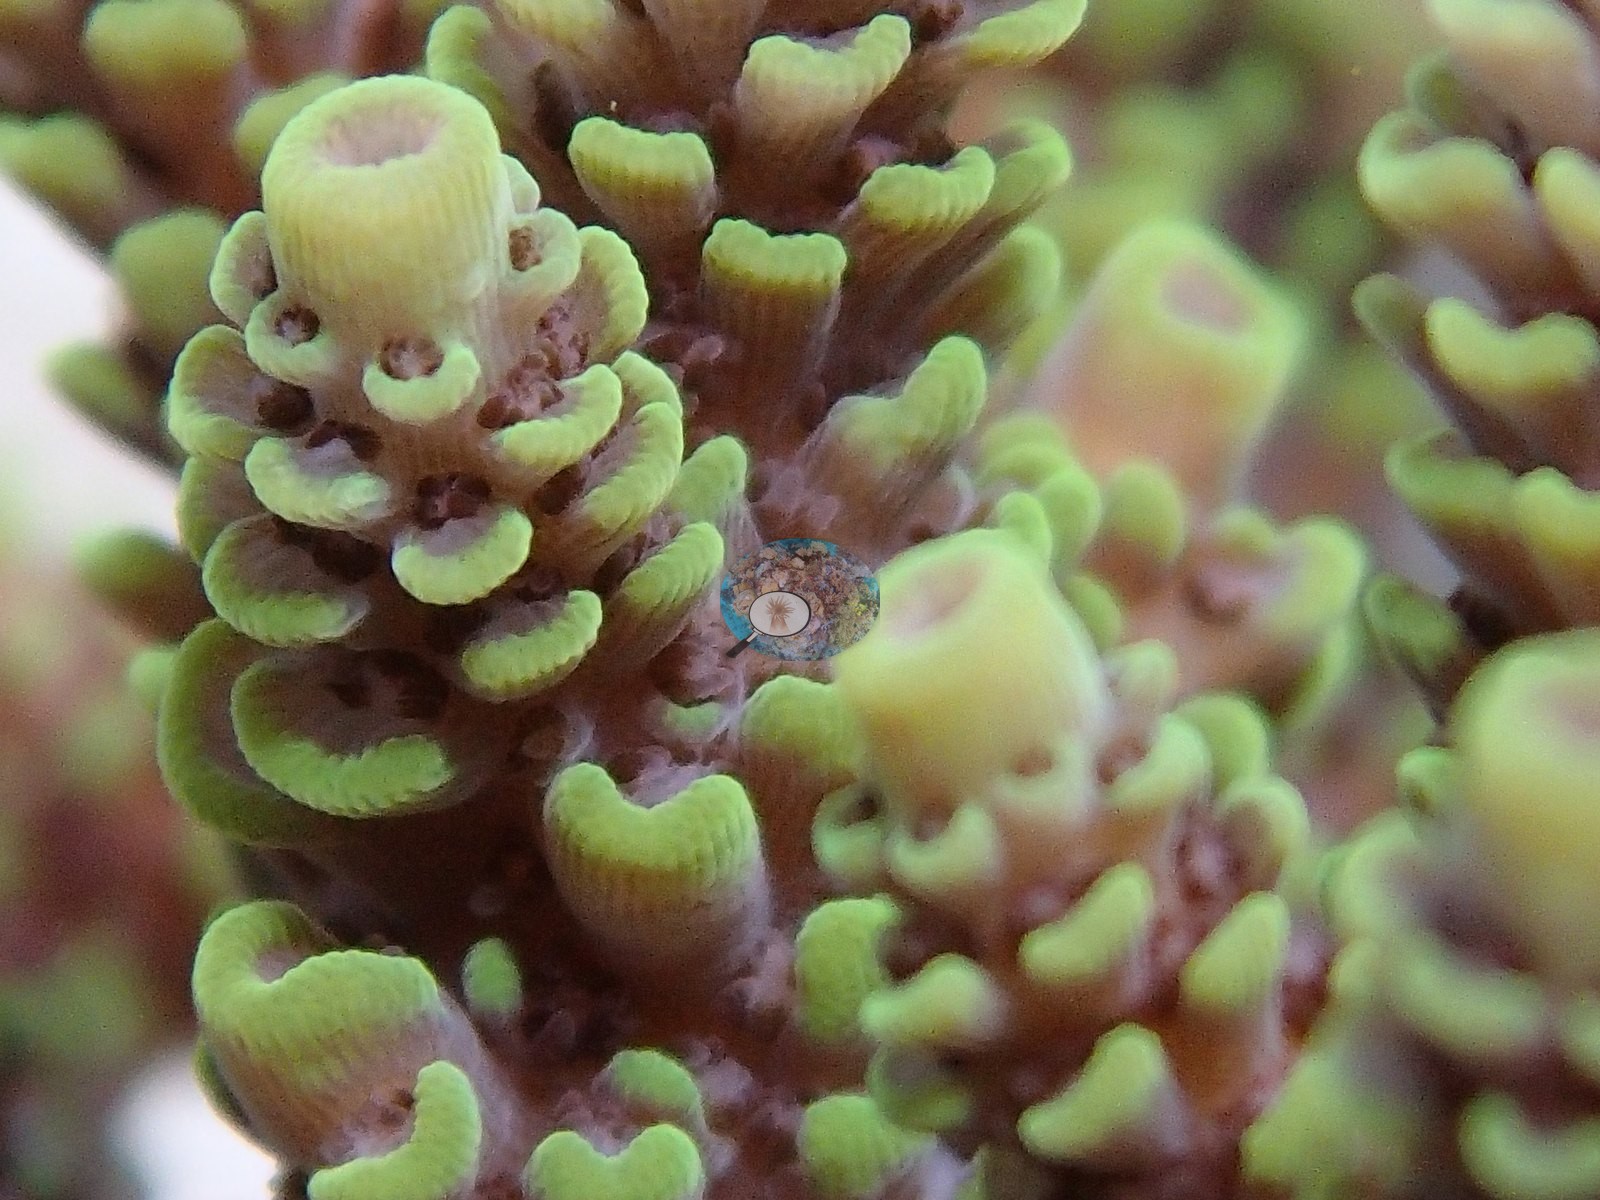
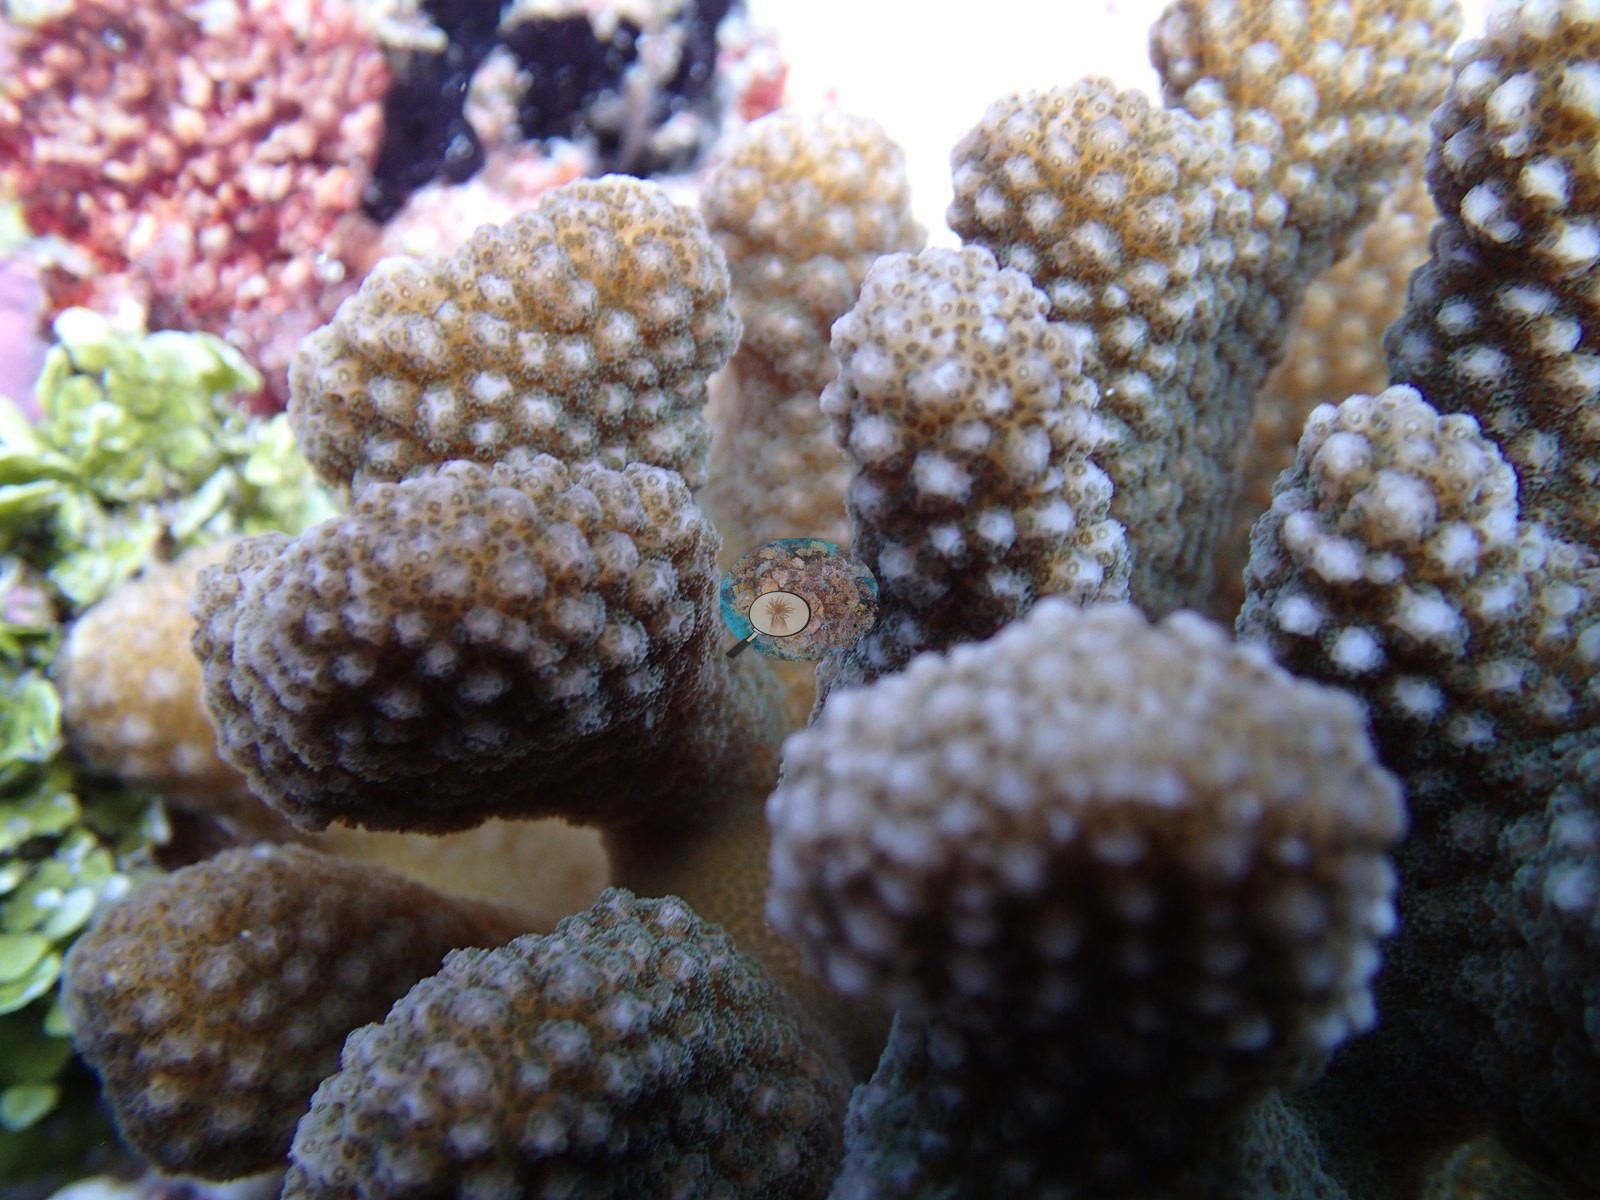
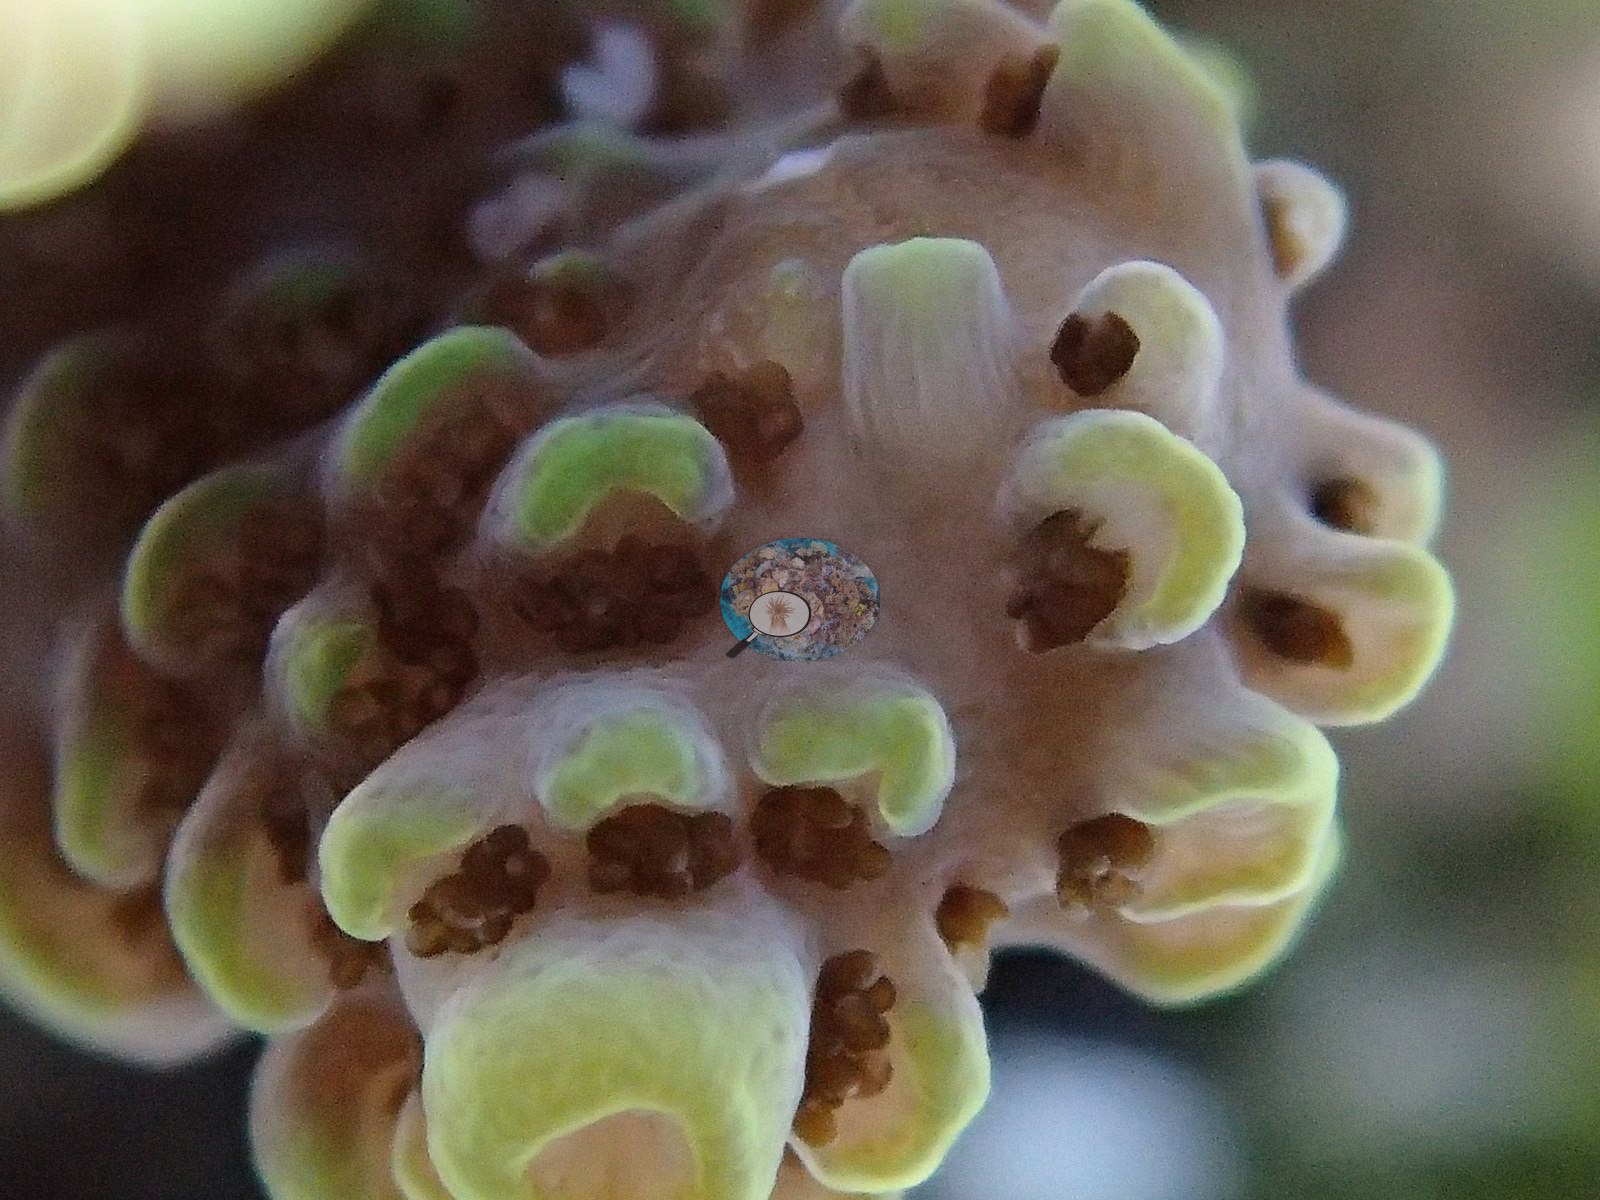
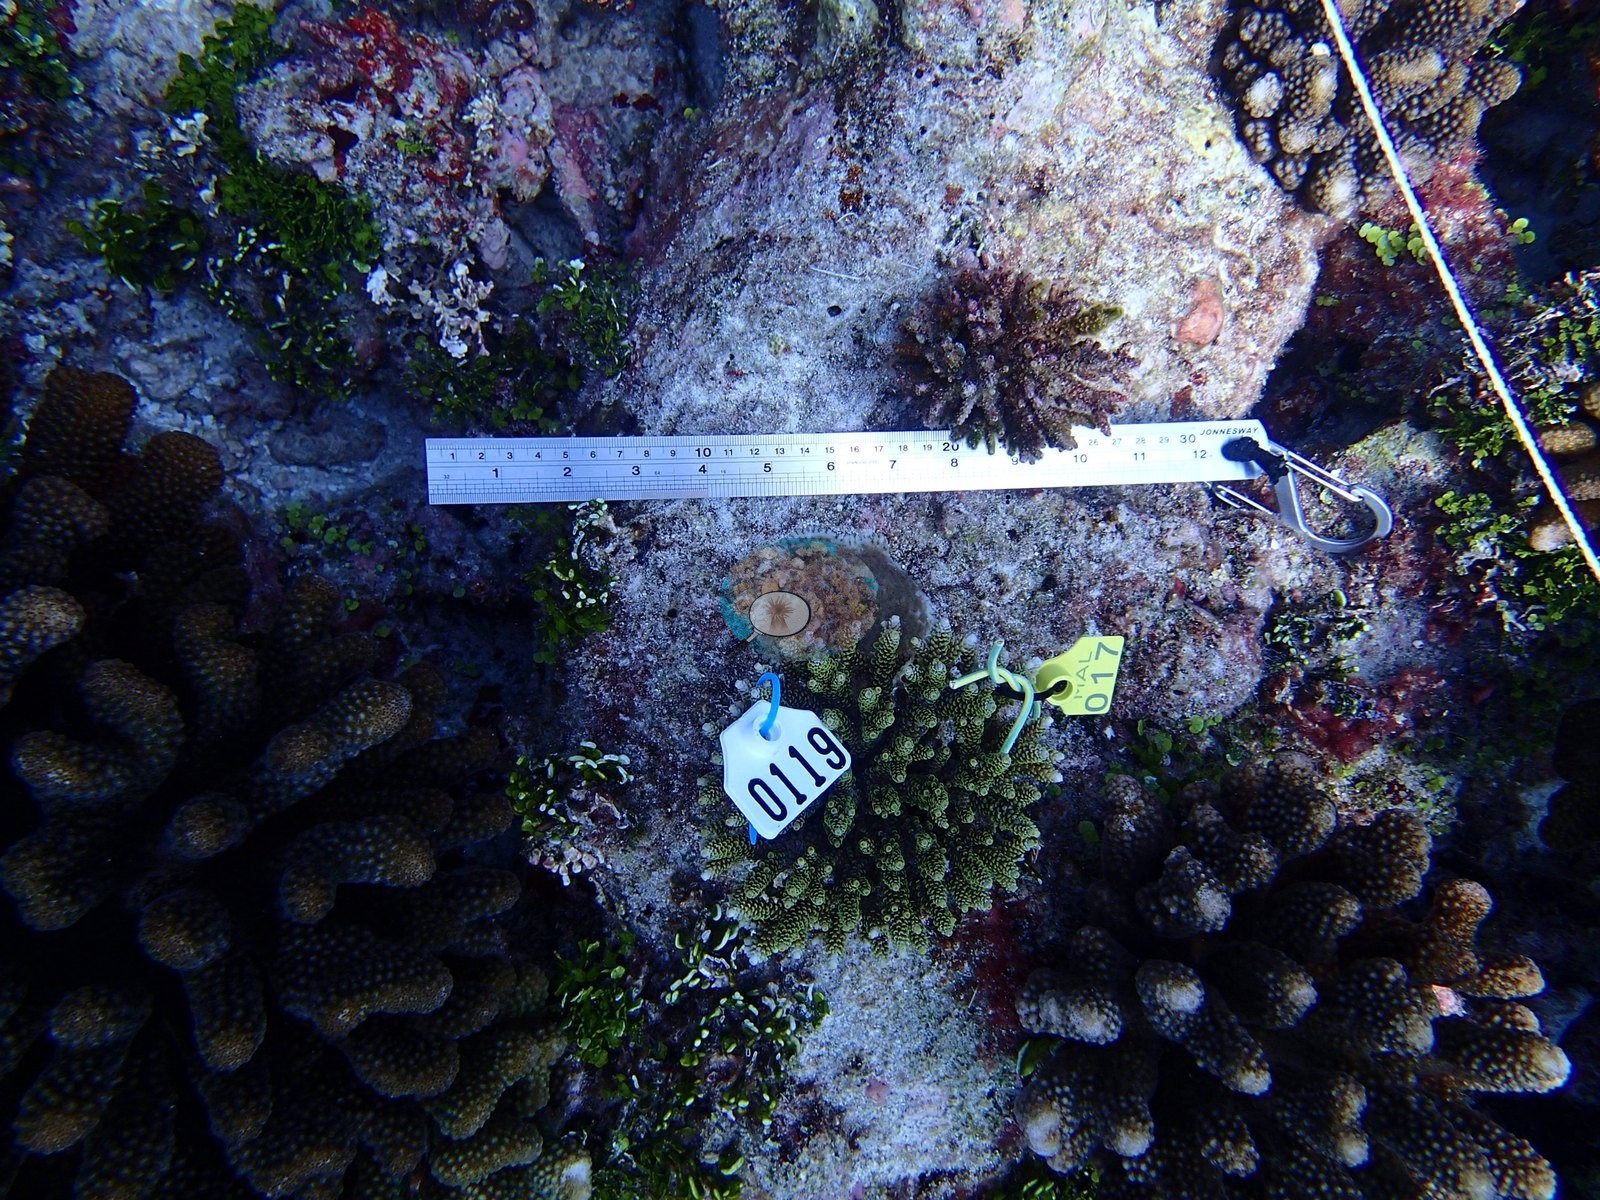
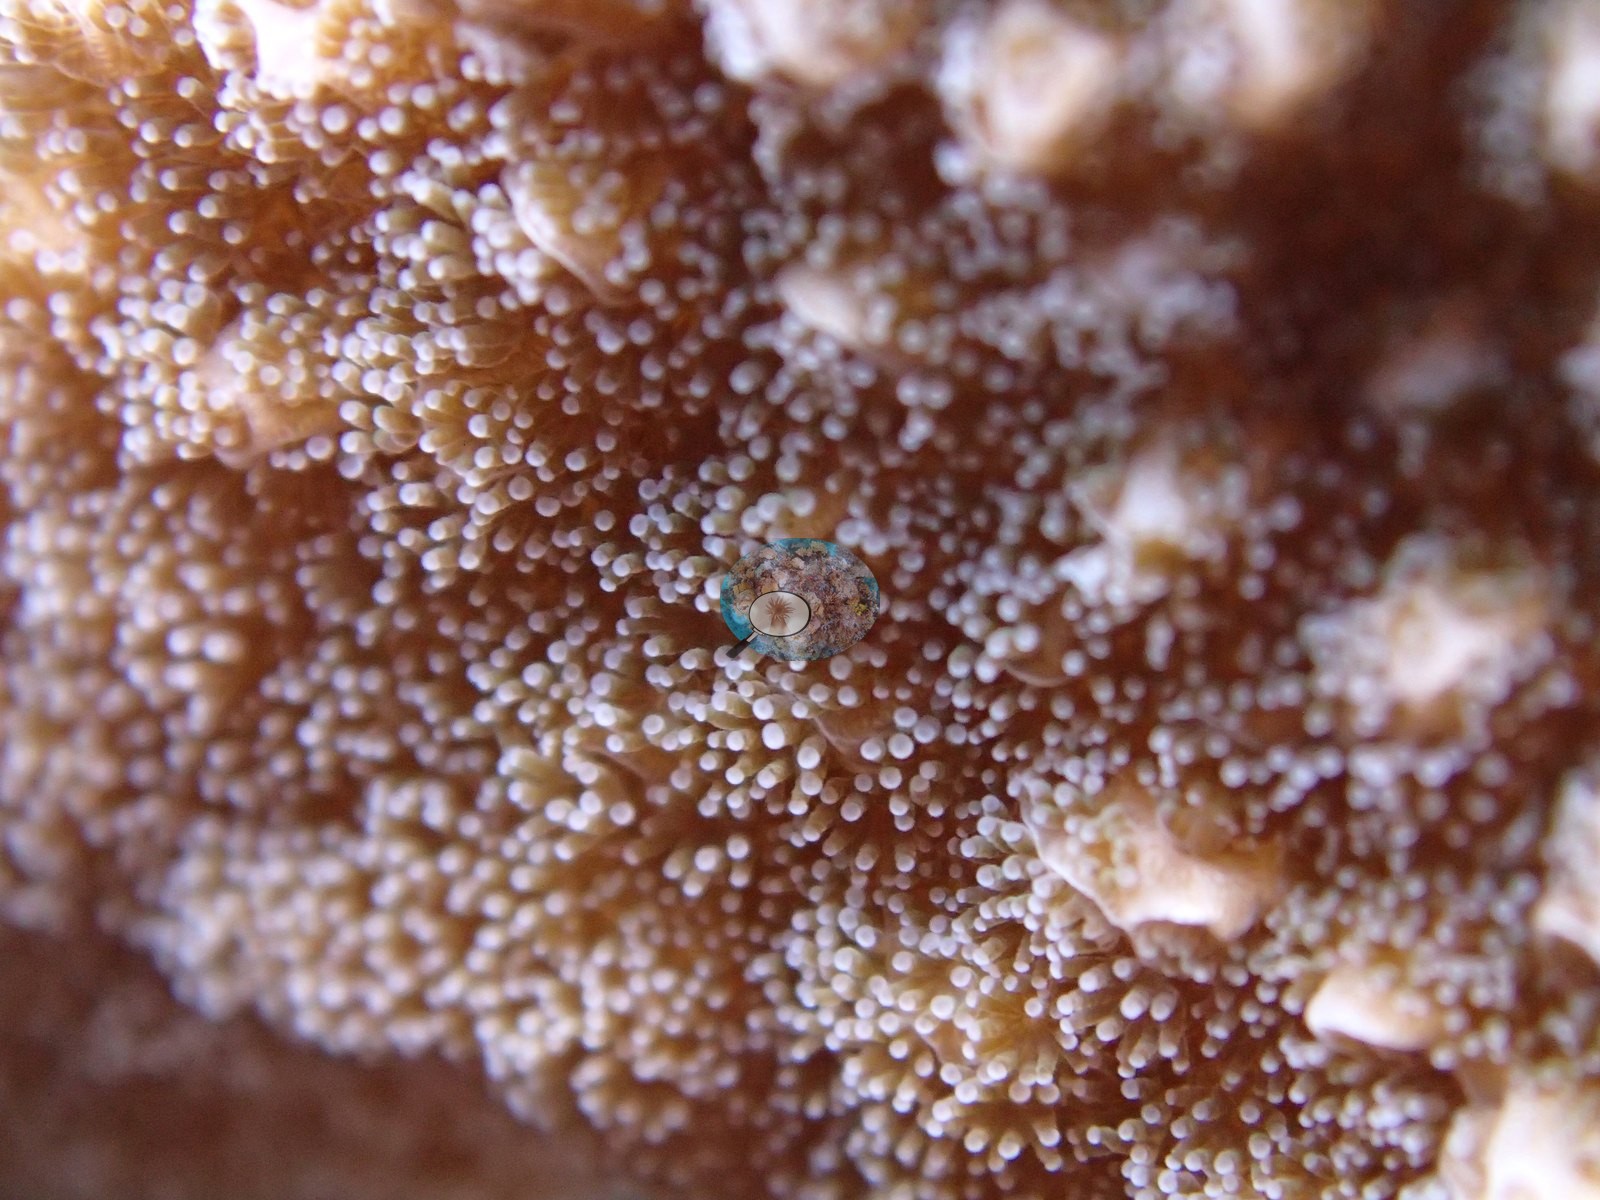
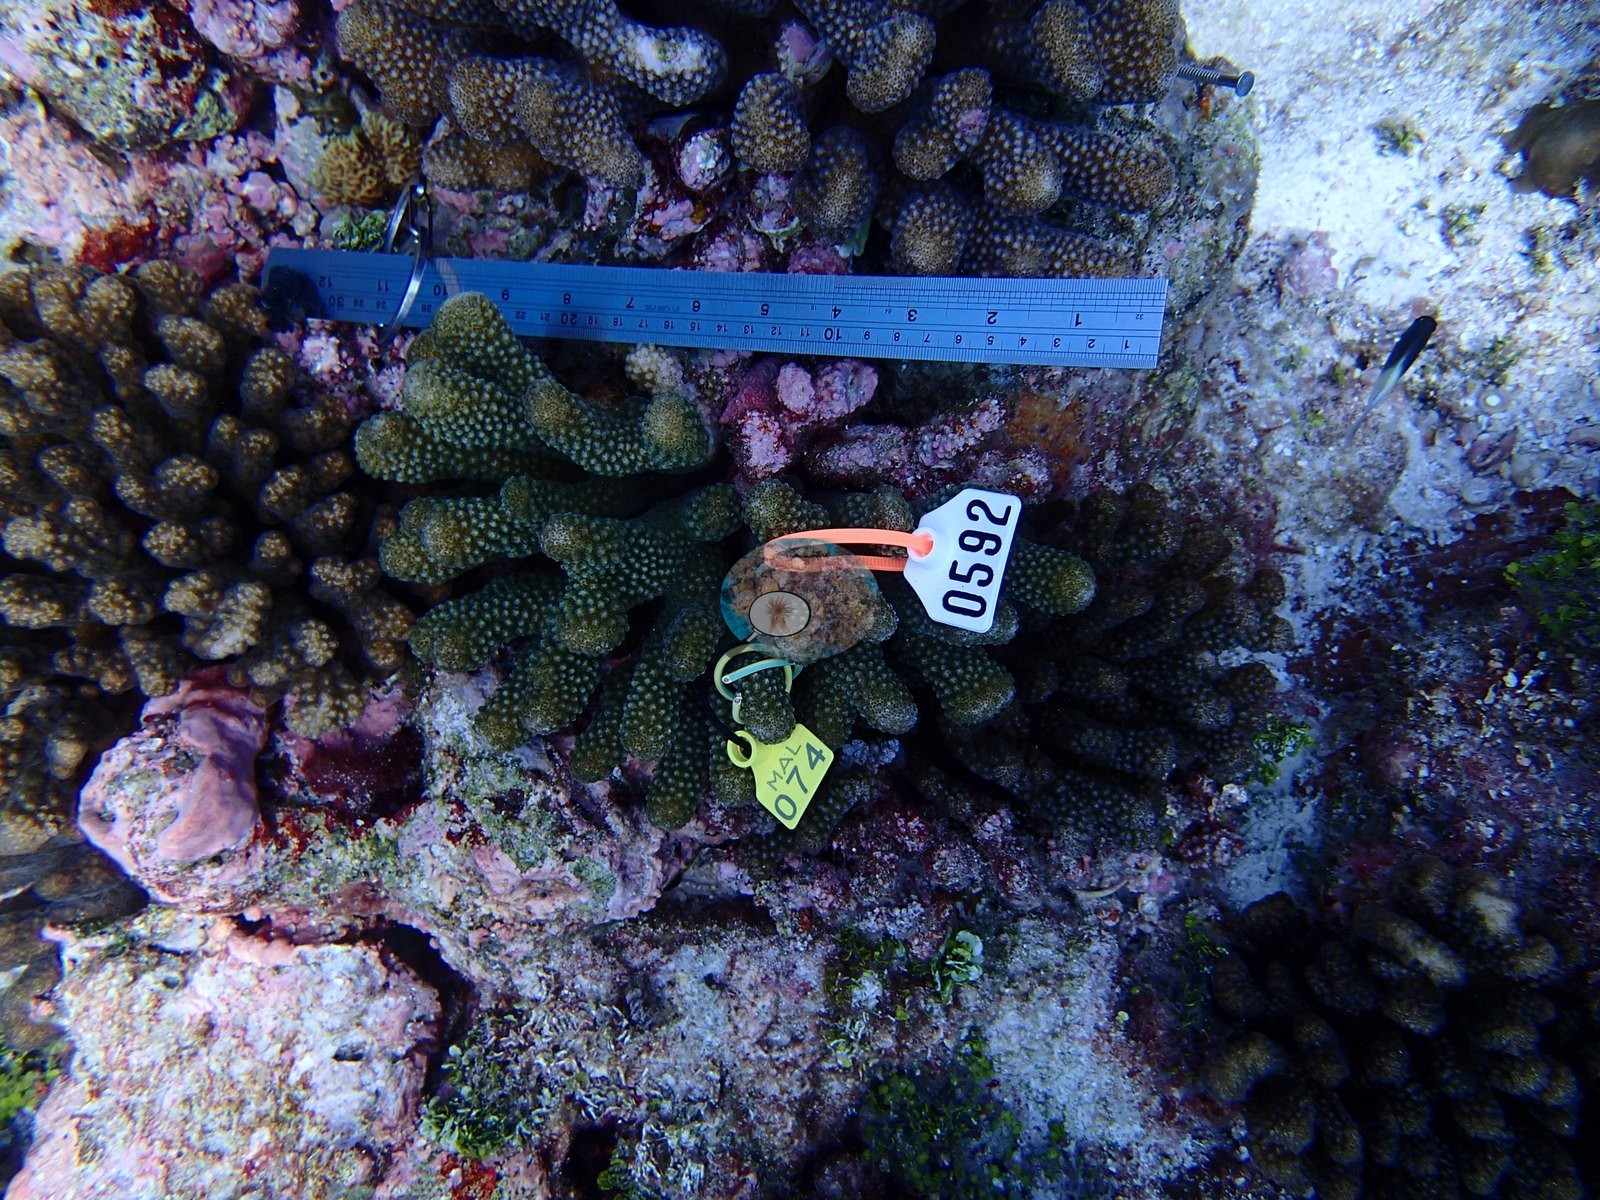
Chocolate- and orange-brown cauliflower colonies compatible with Pocillopora dominate, but look closer and the bushy thickets compatible with Acropora steal the show — their corallites glow an improbable lime-green, each branch tipped with a smooth ivory bud of brand-new growth (e.g., Image 2, Image 4, Image 5, Image 8, Image 9, Image 10, Image 12, Image 16, Image 19, Image 20).
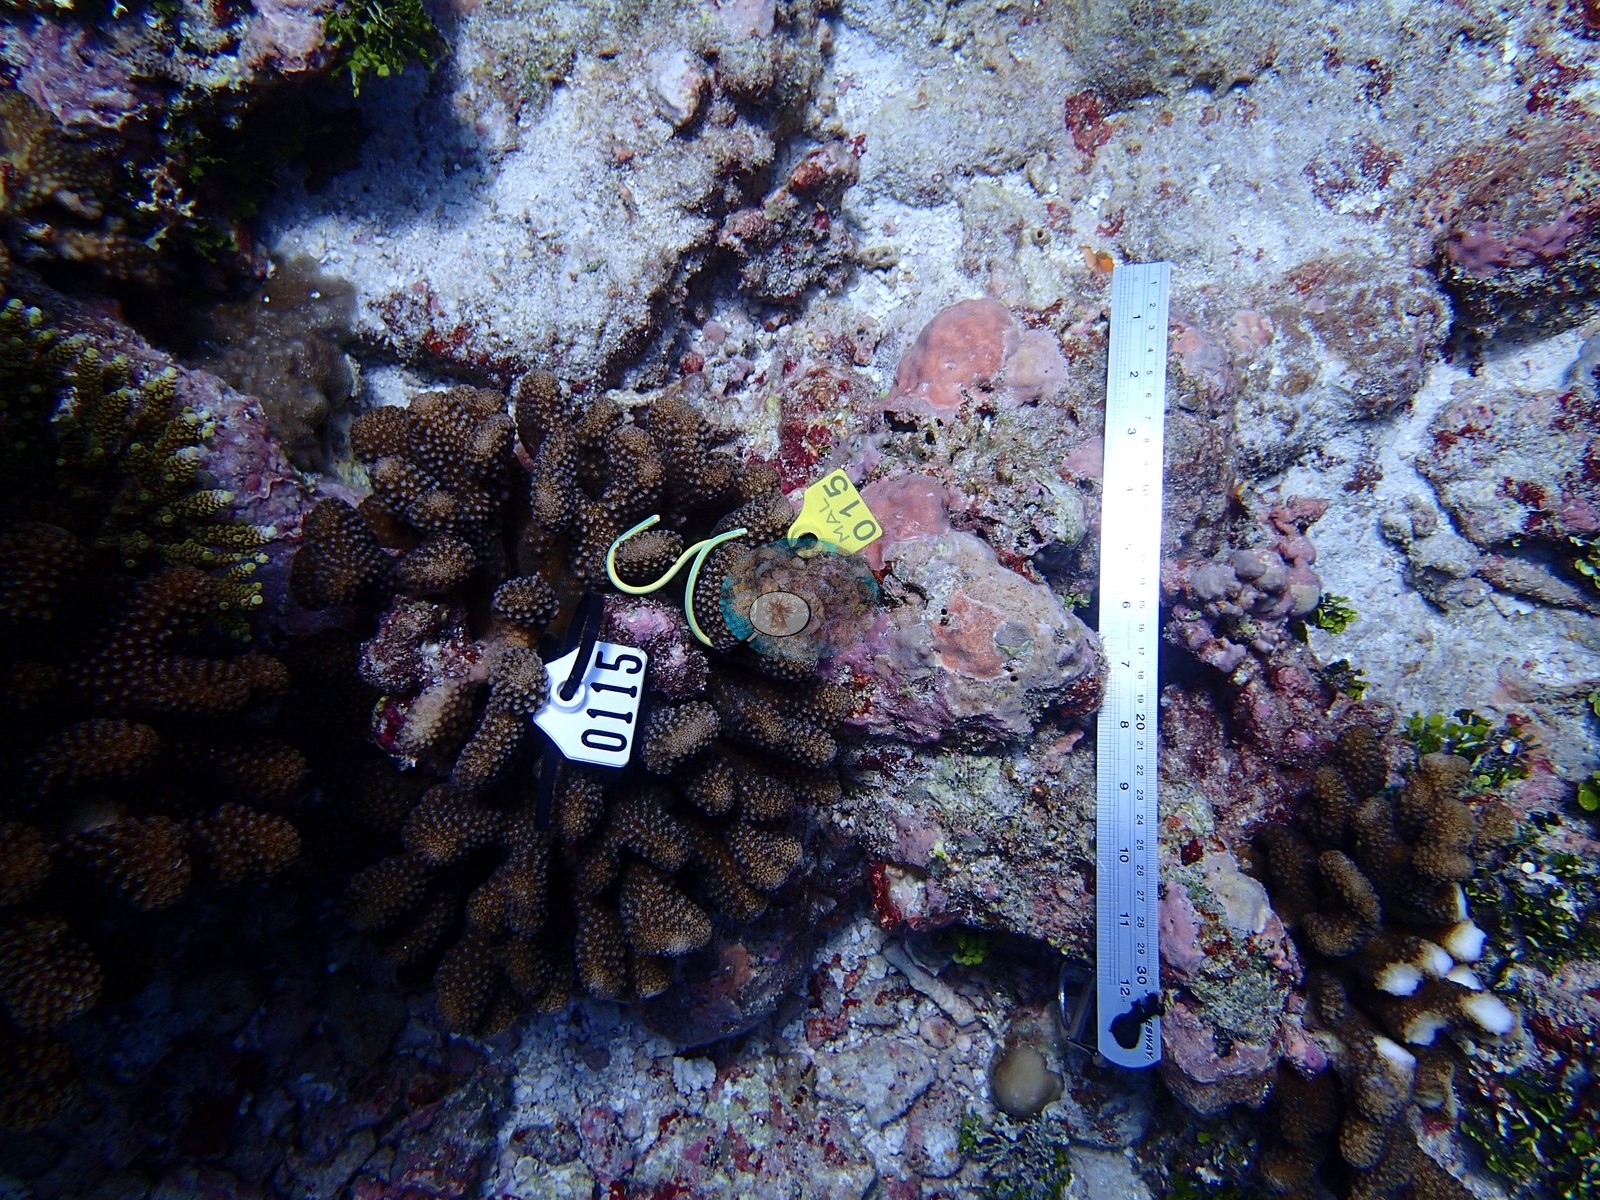
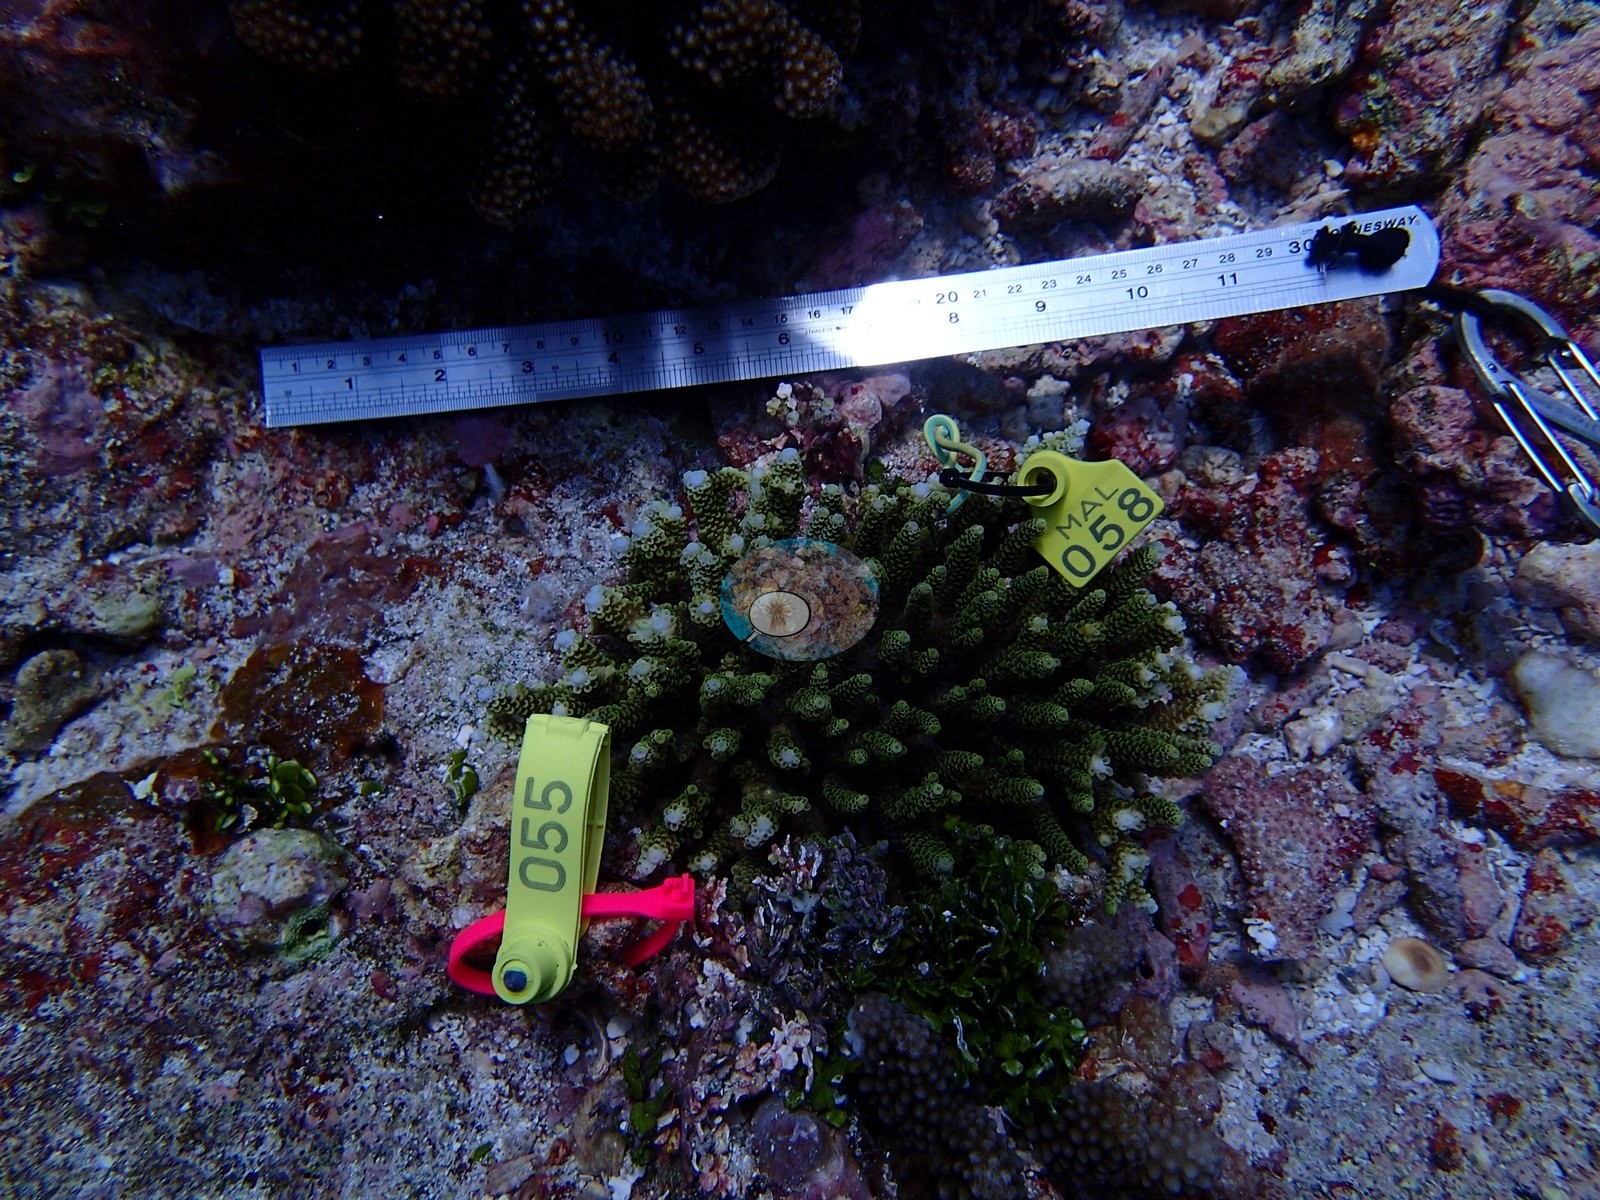
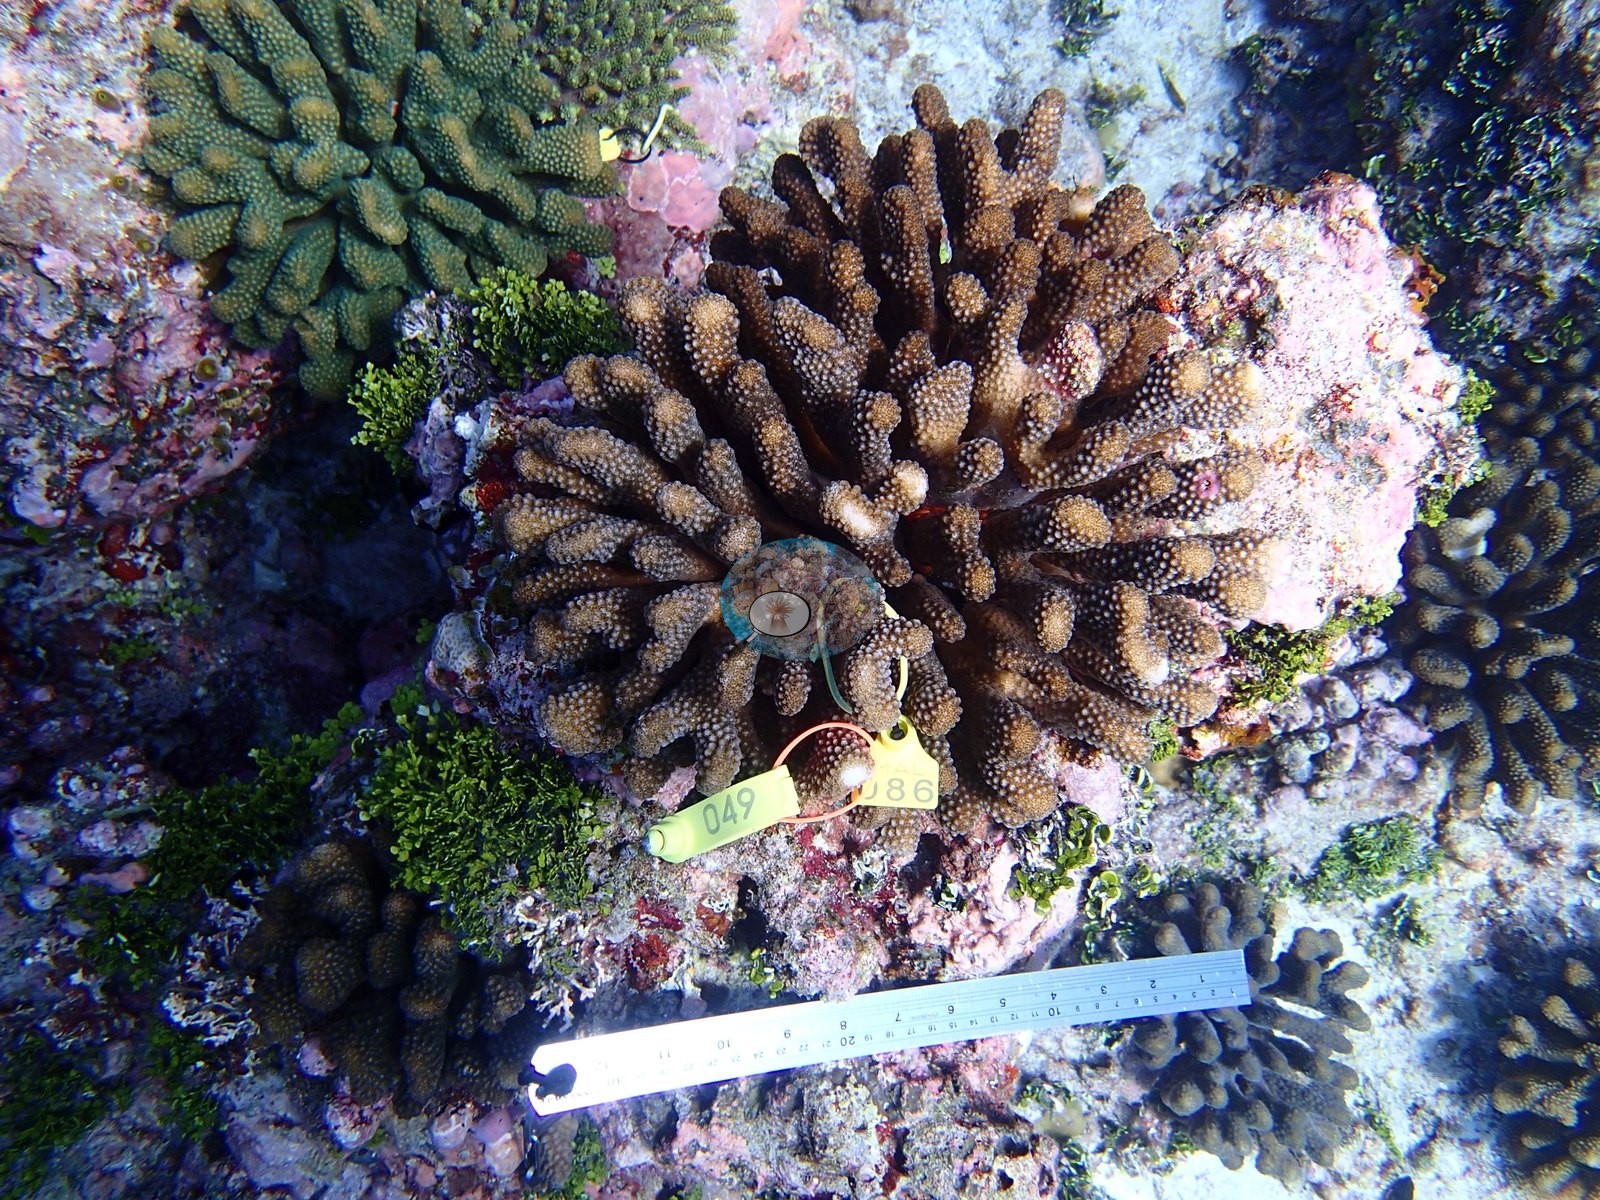
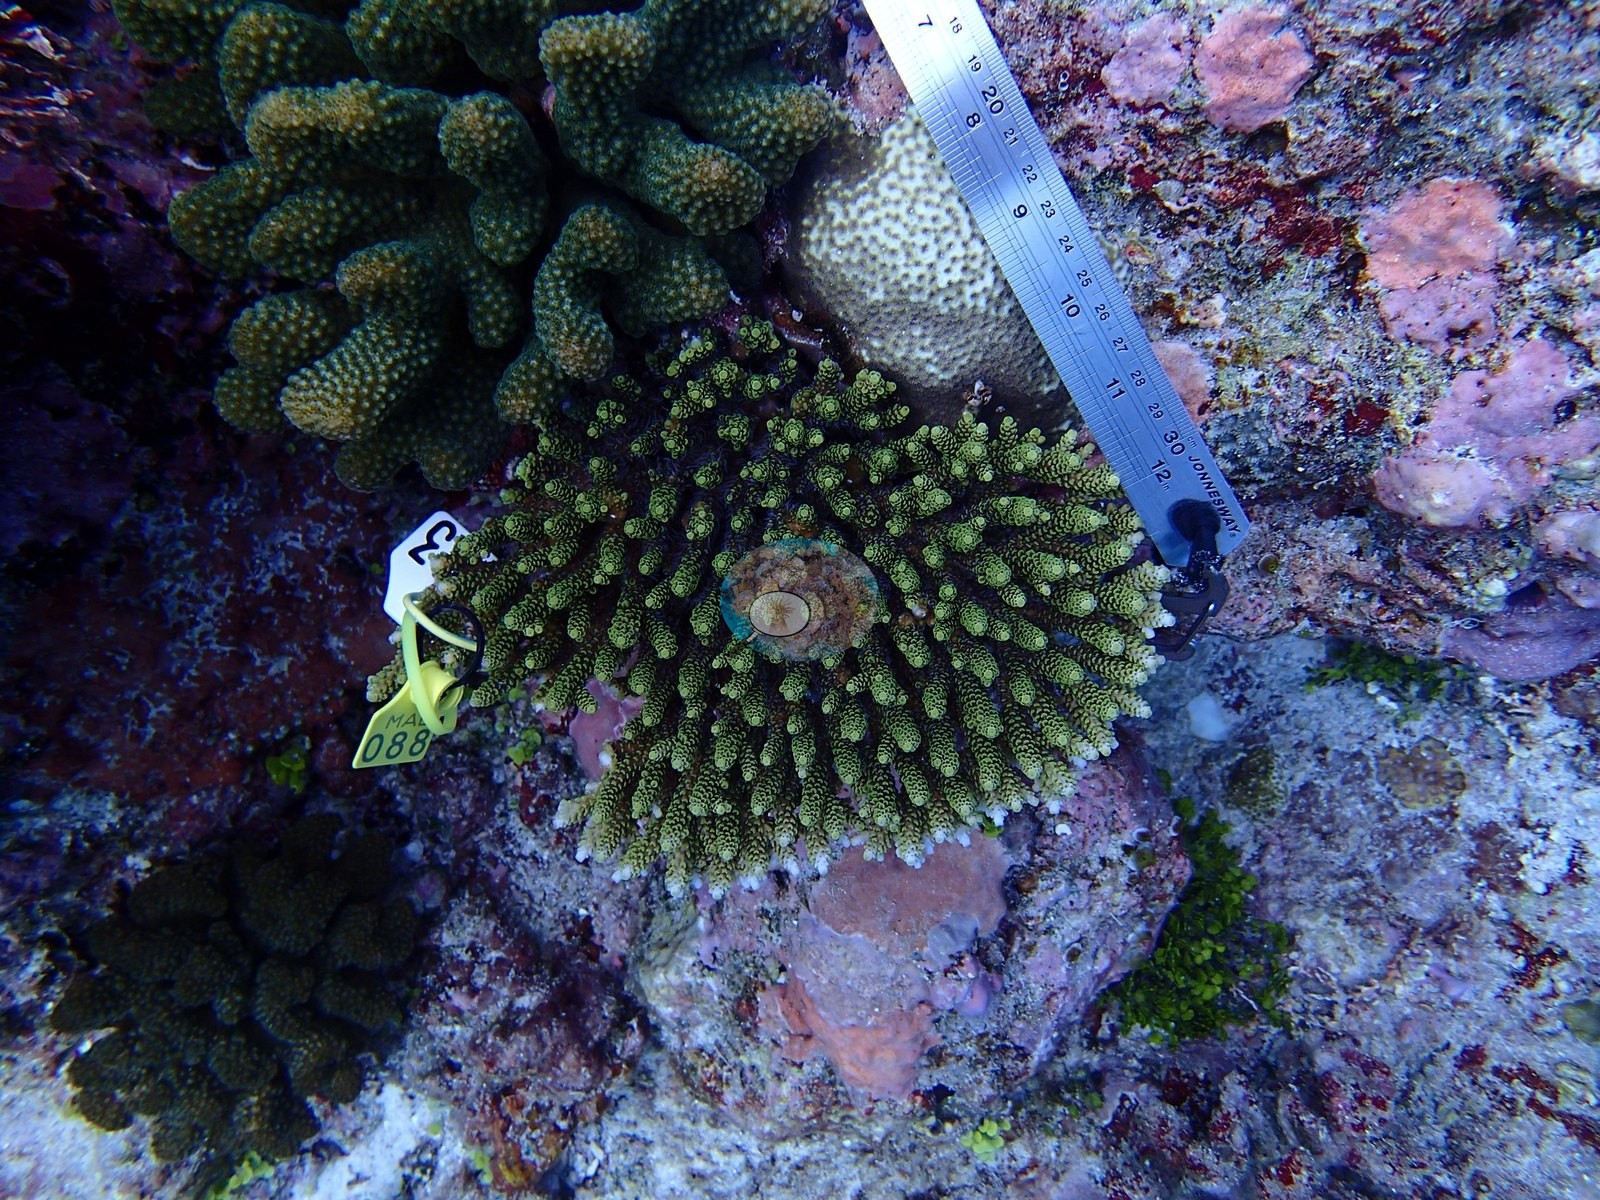
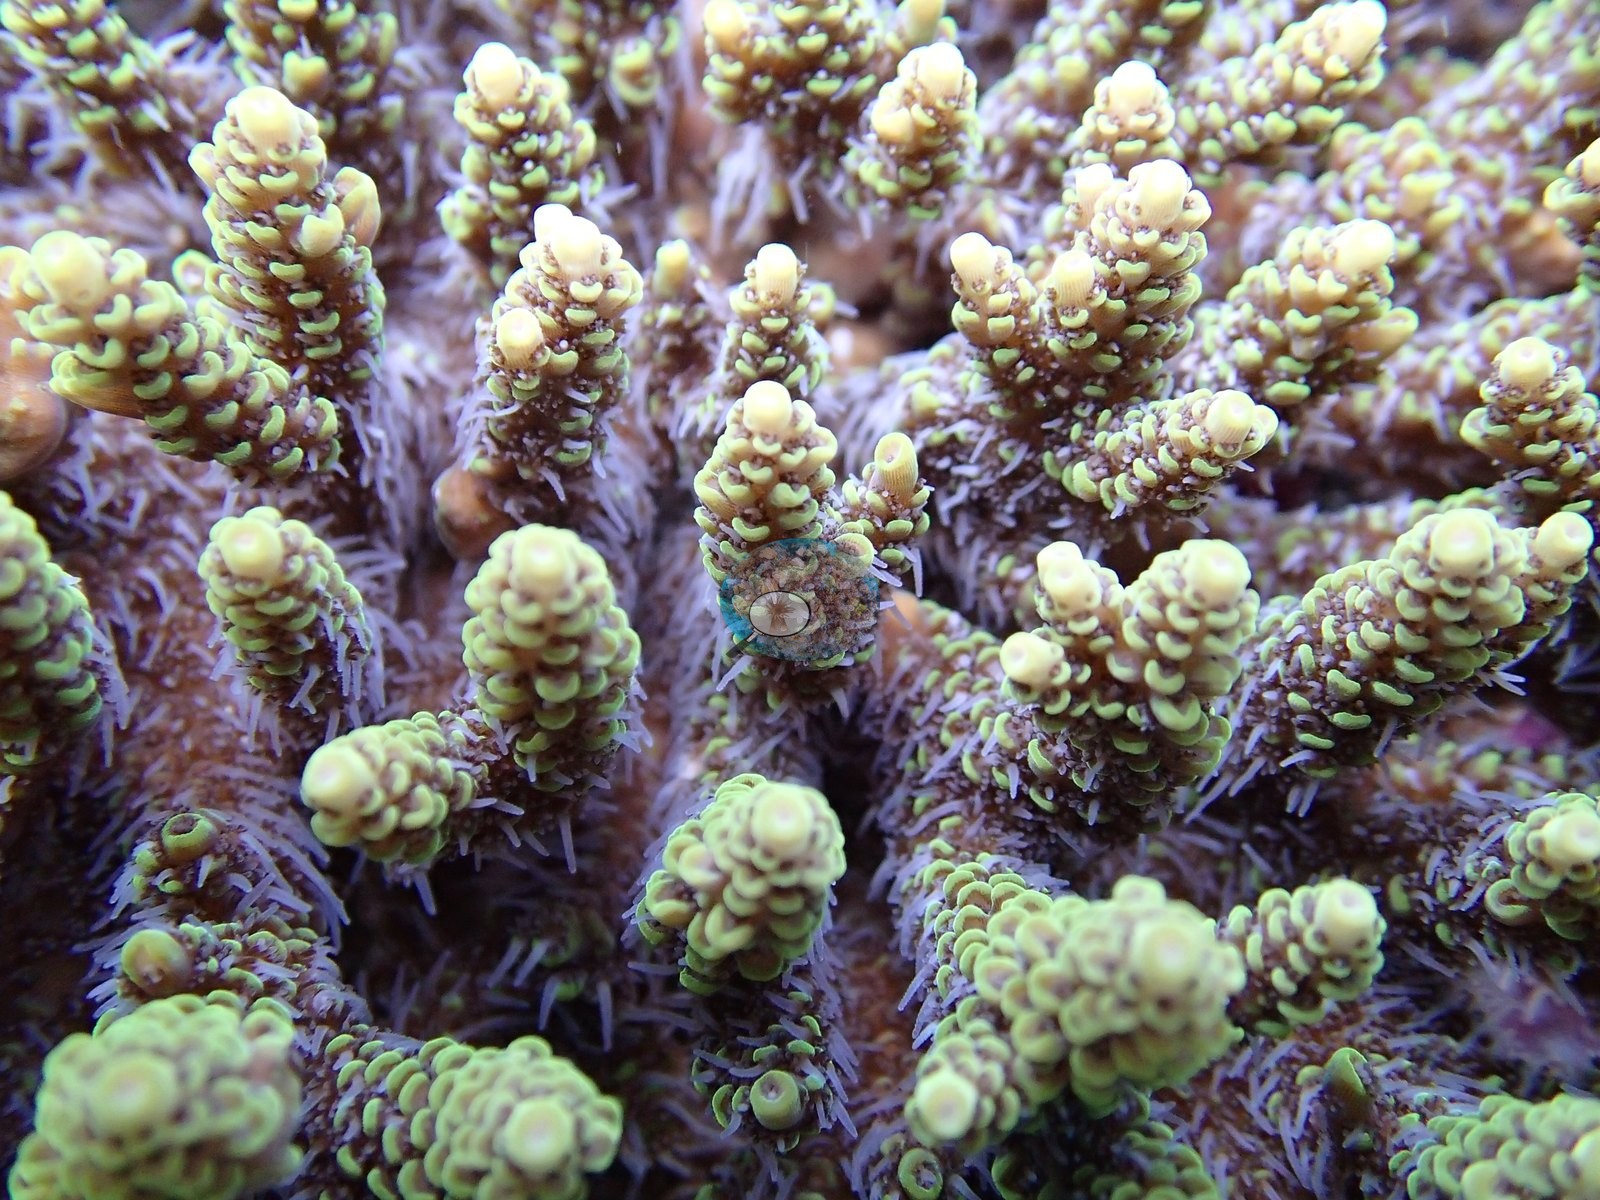
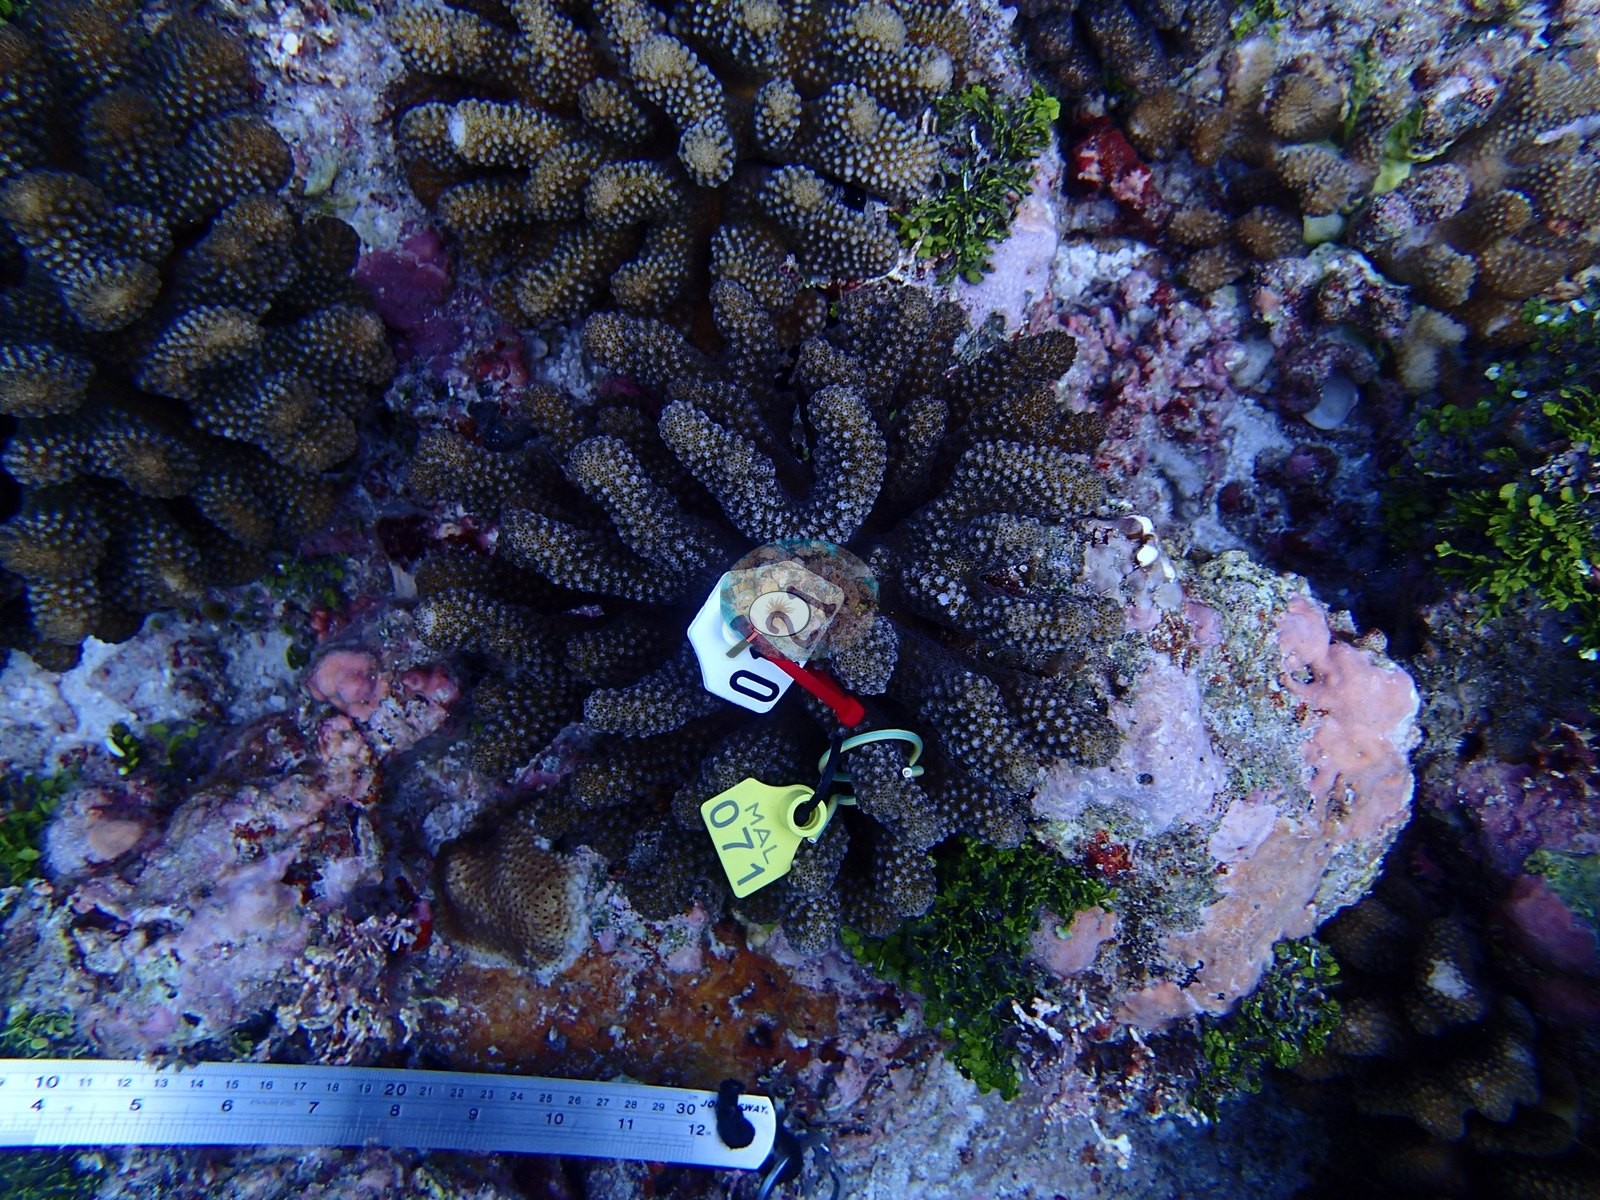
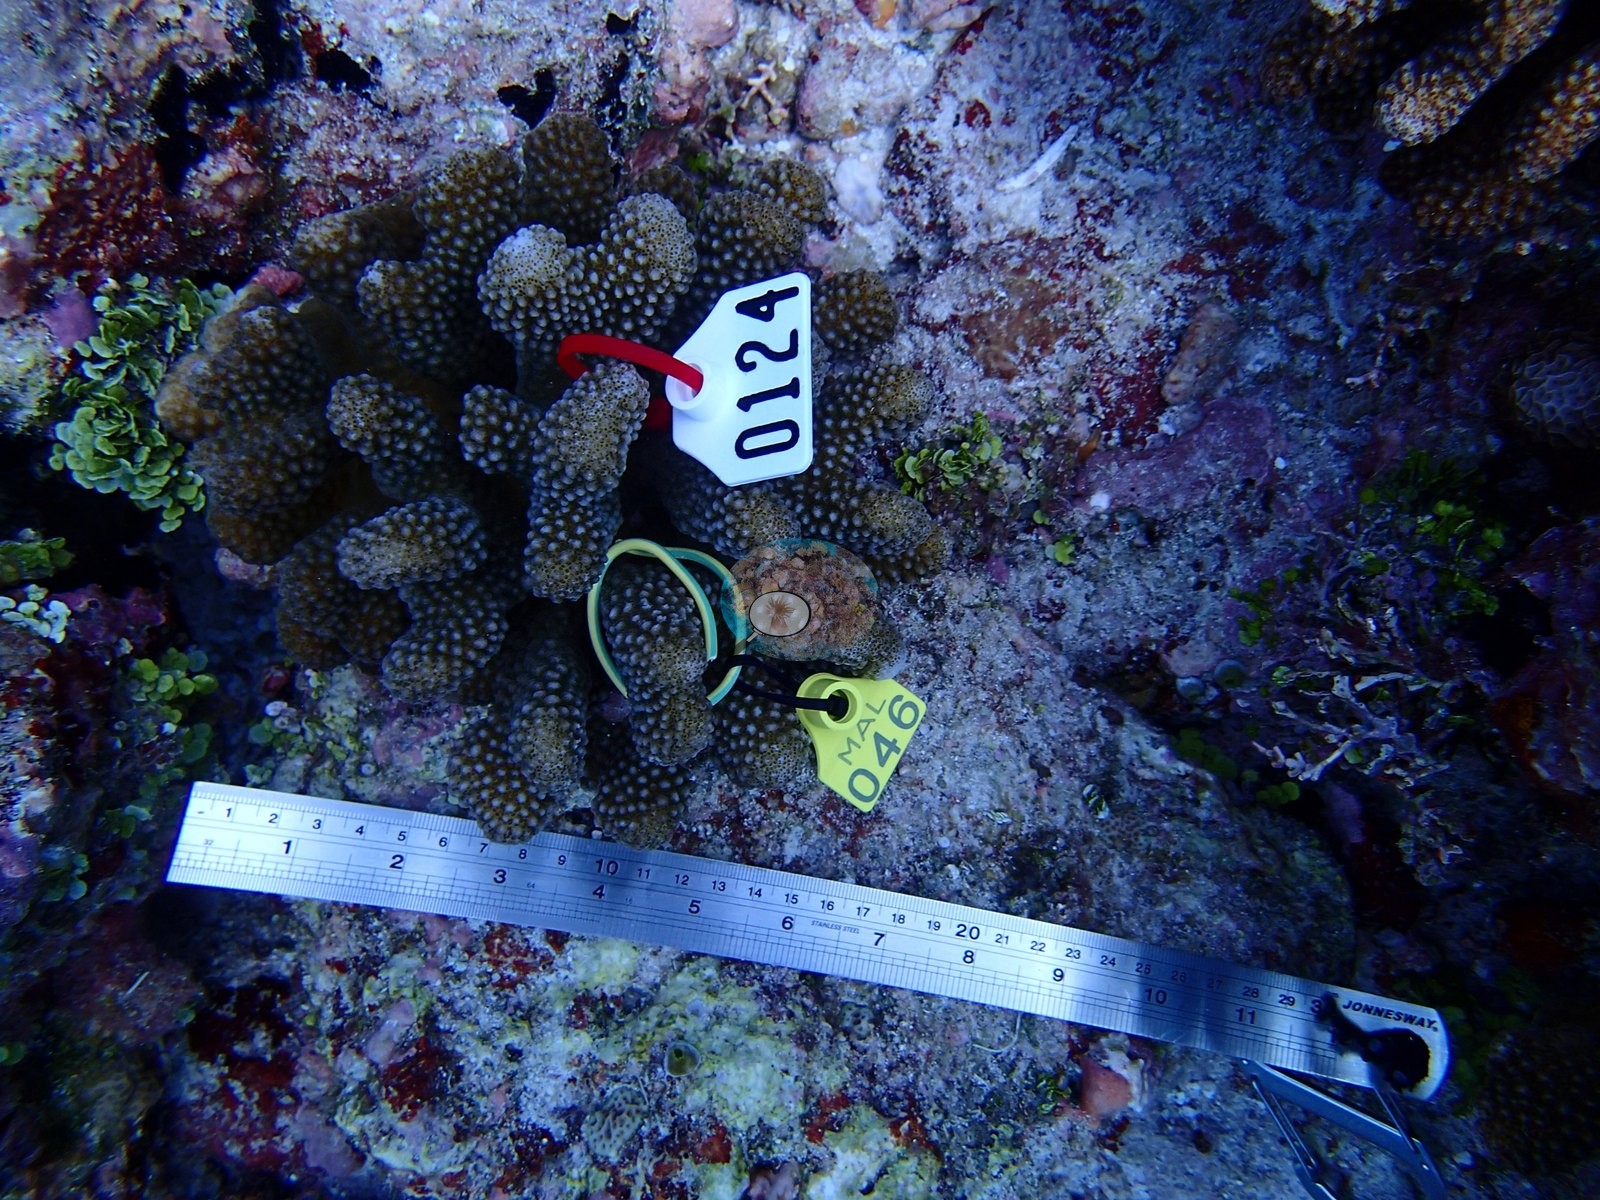
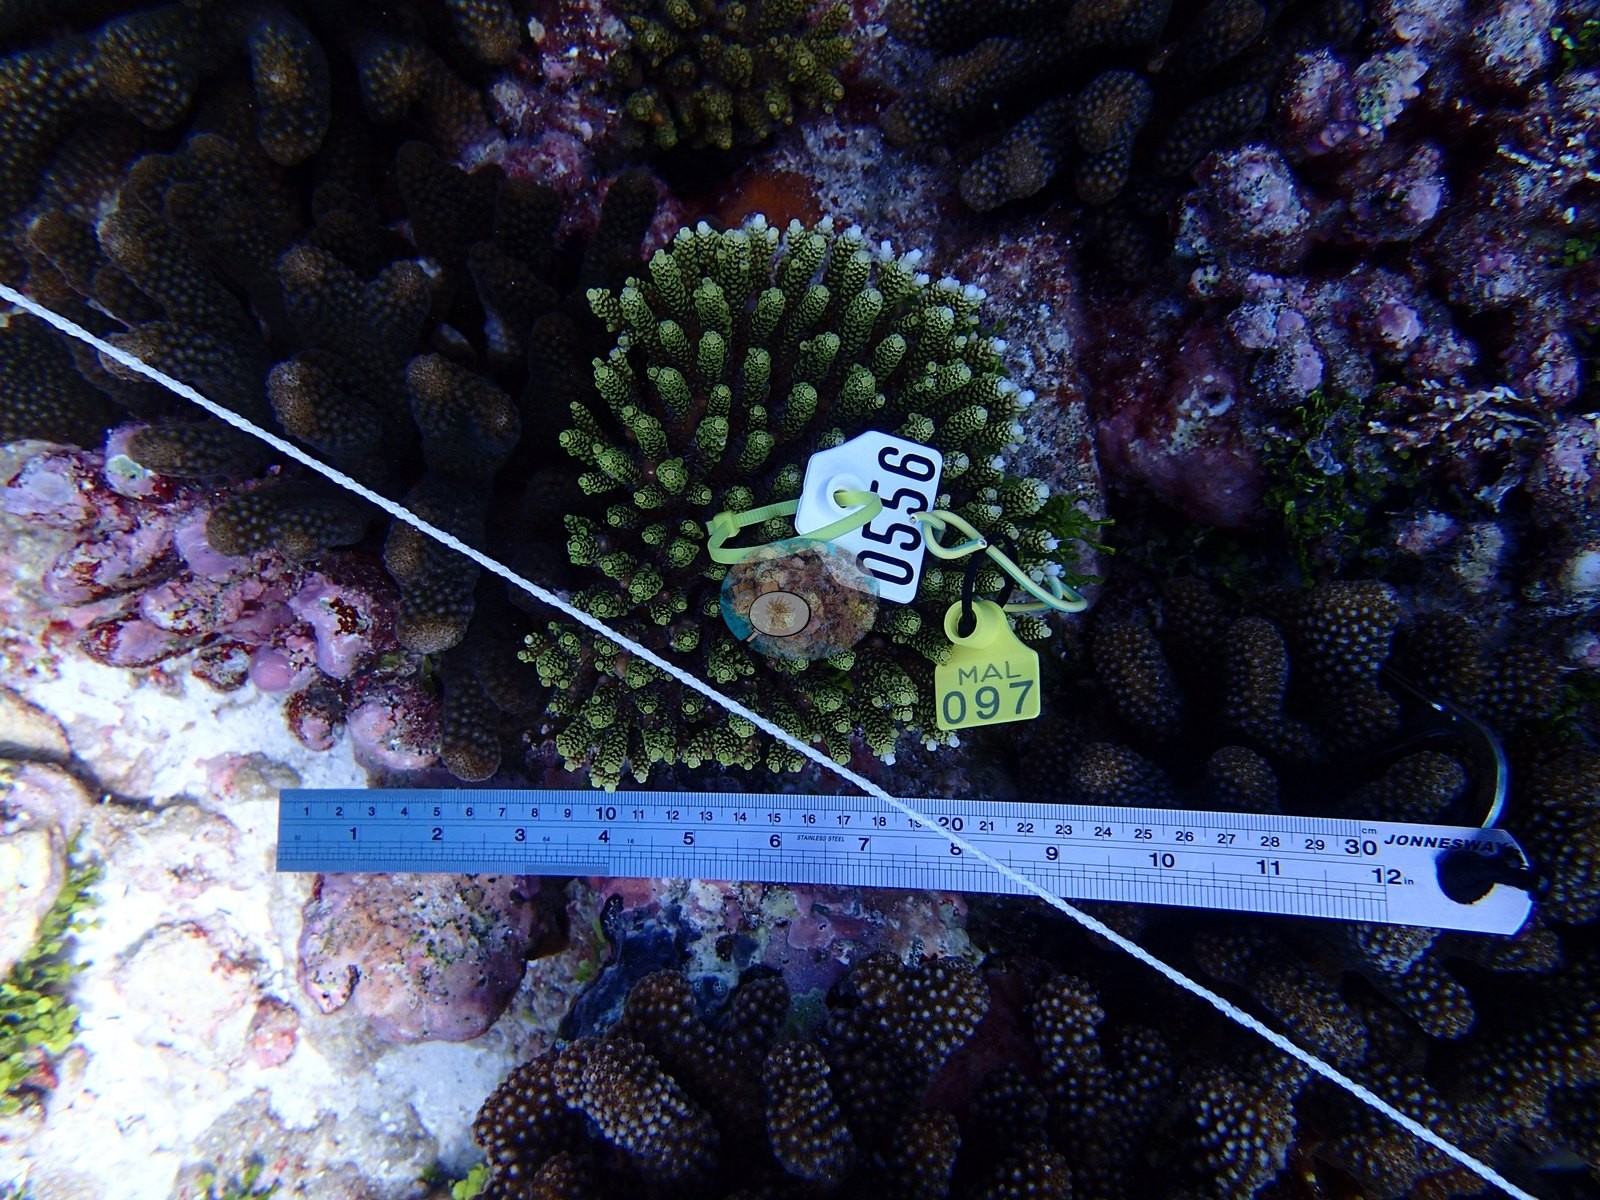
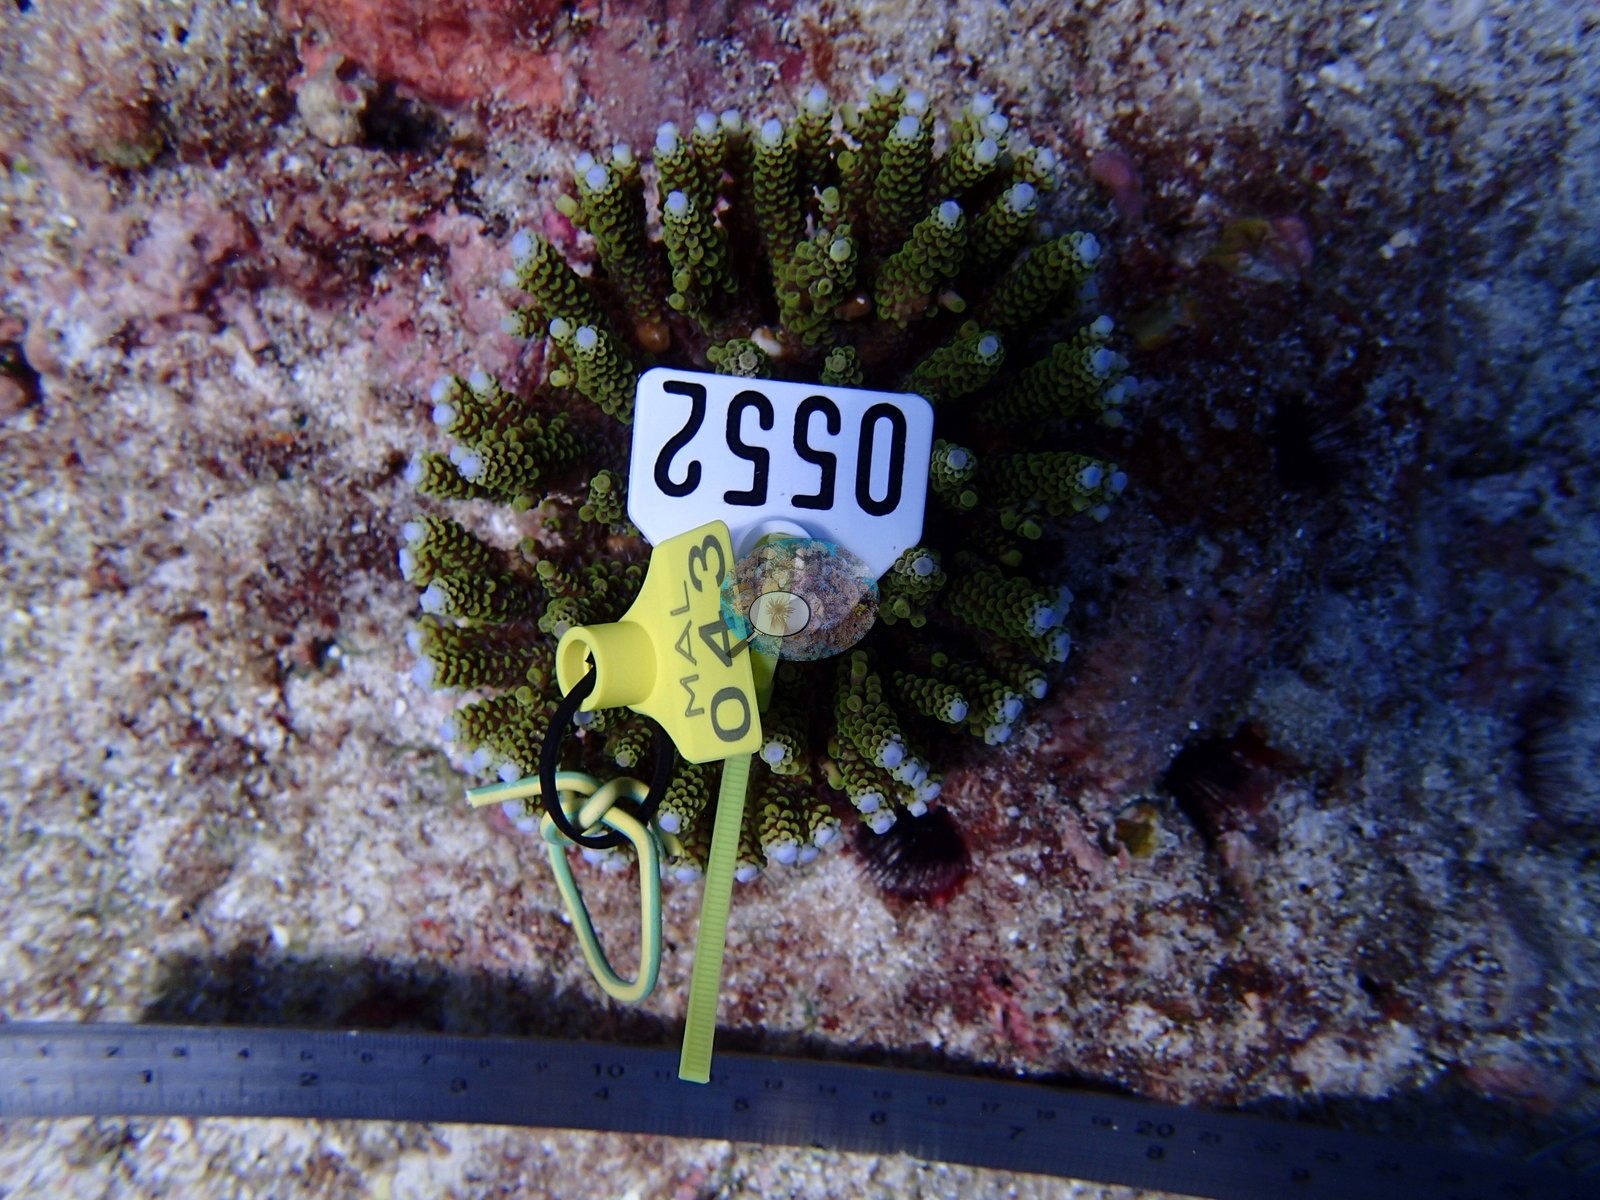
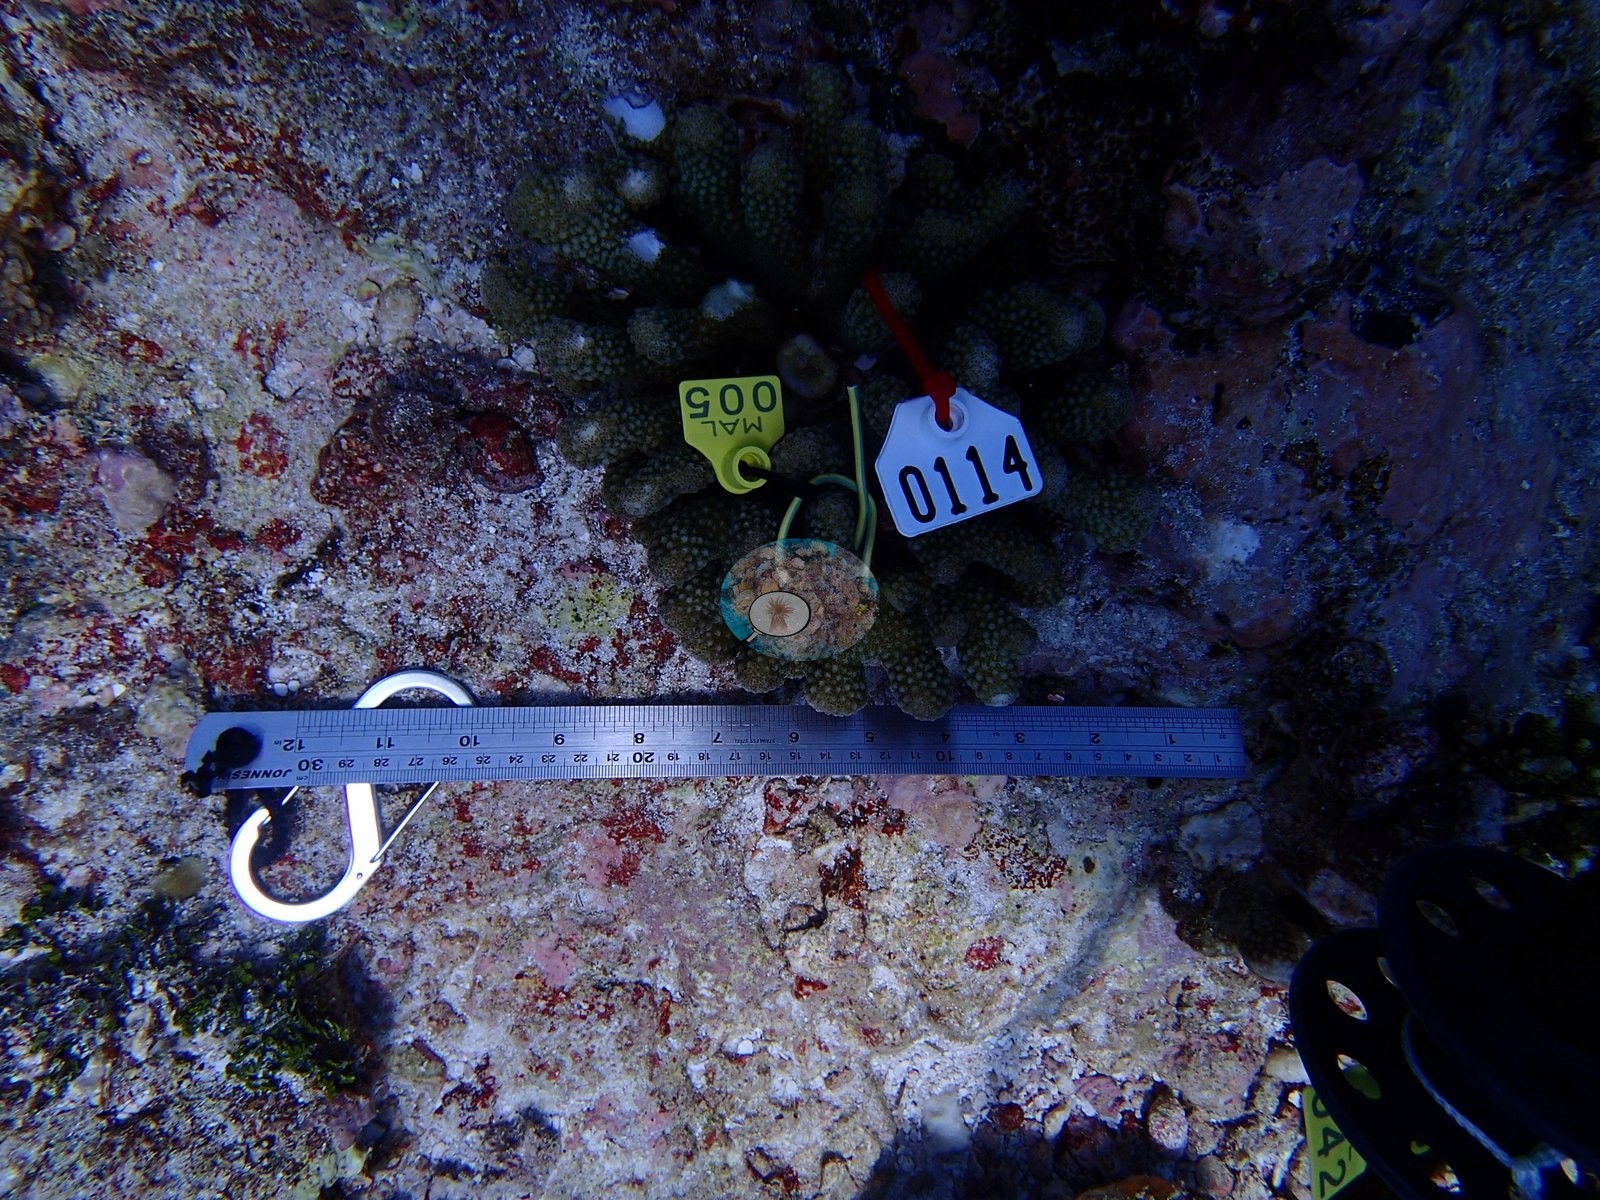
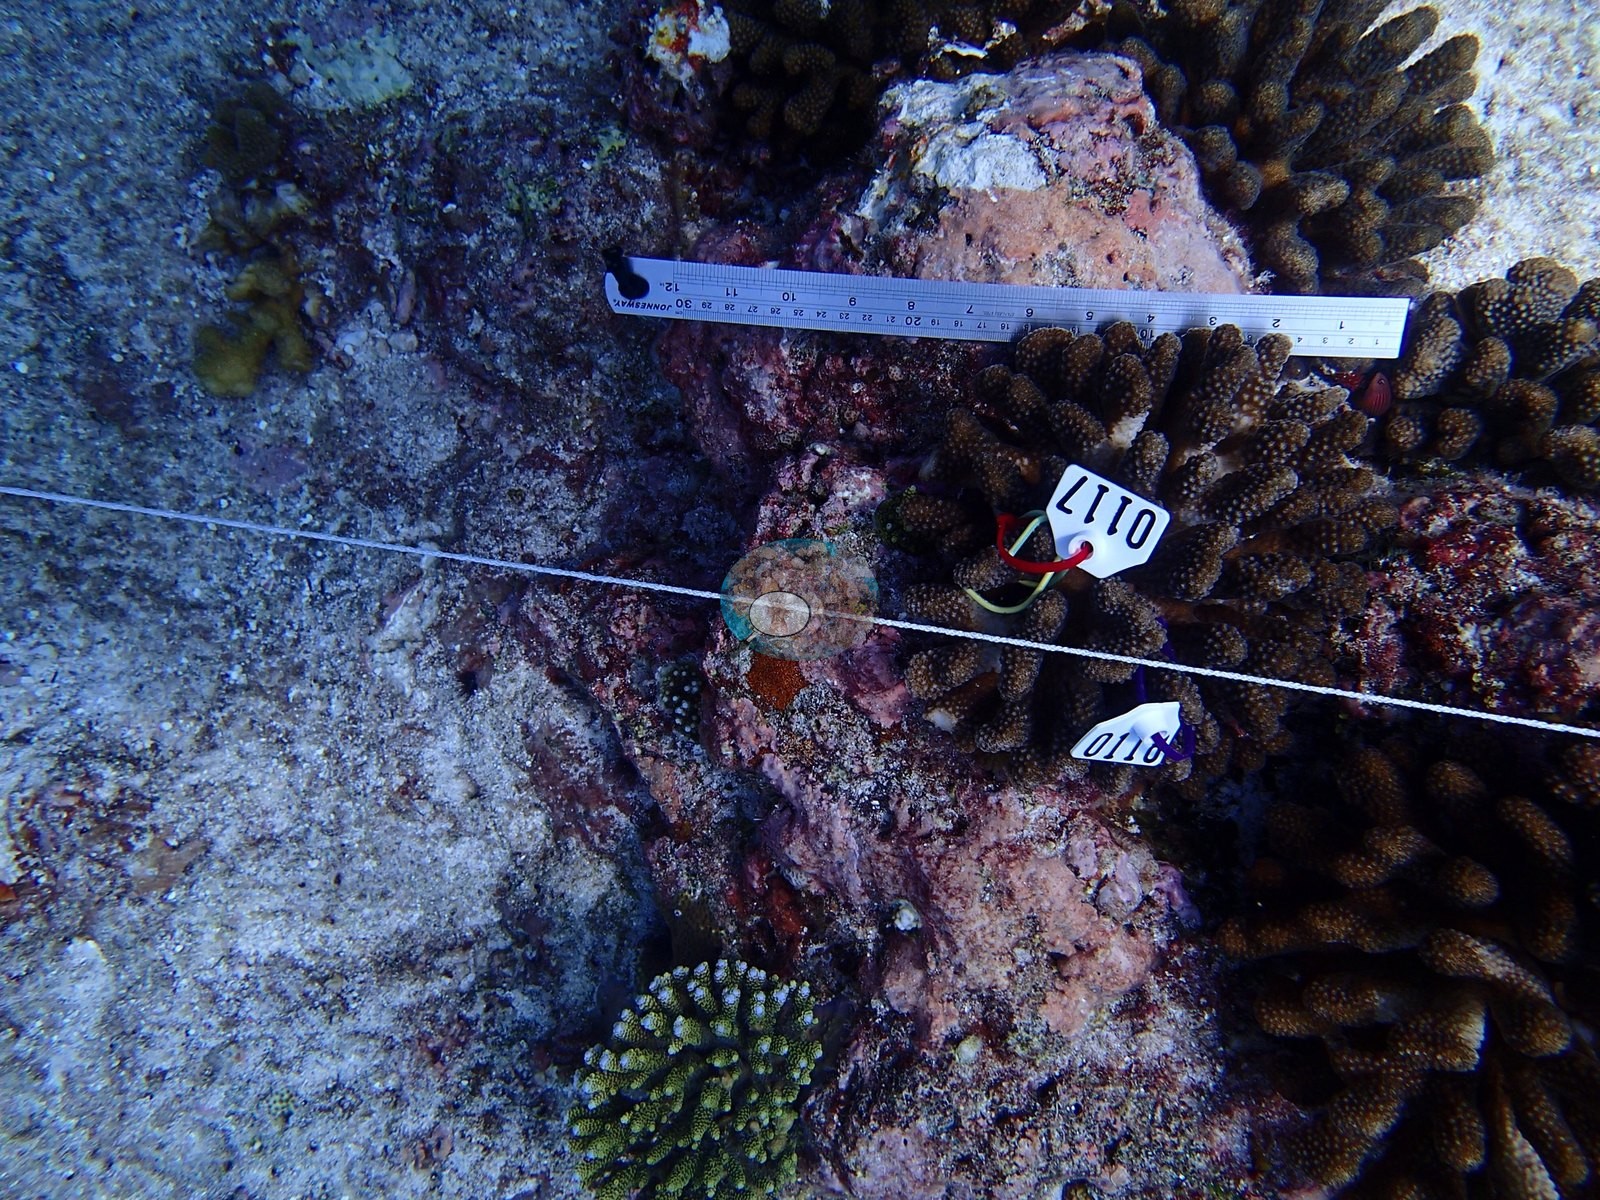
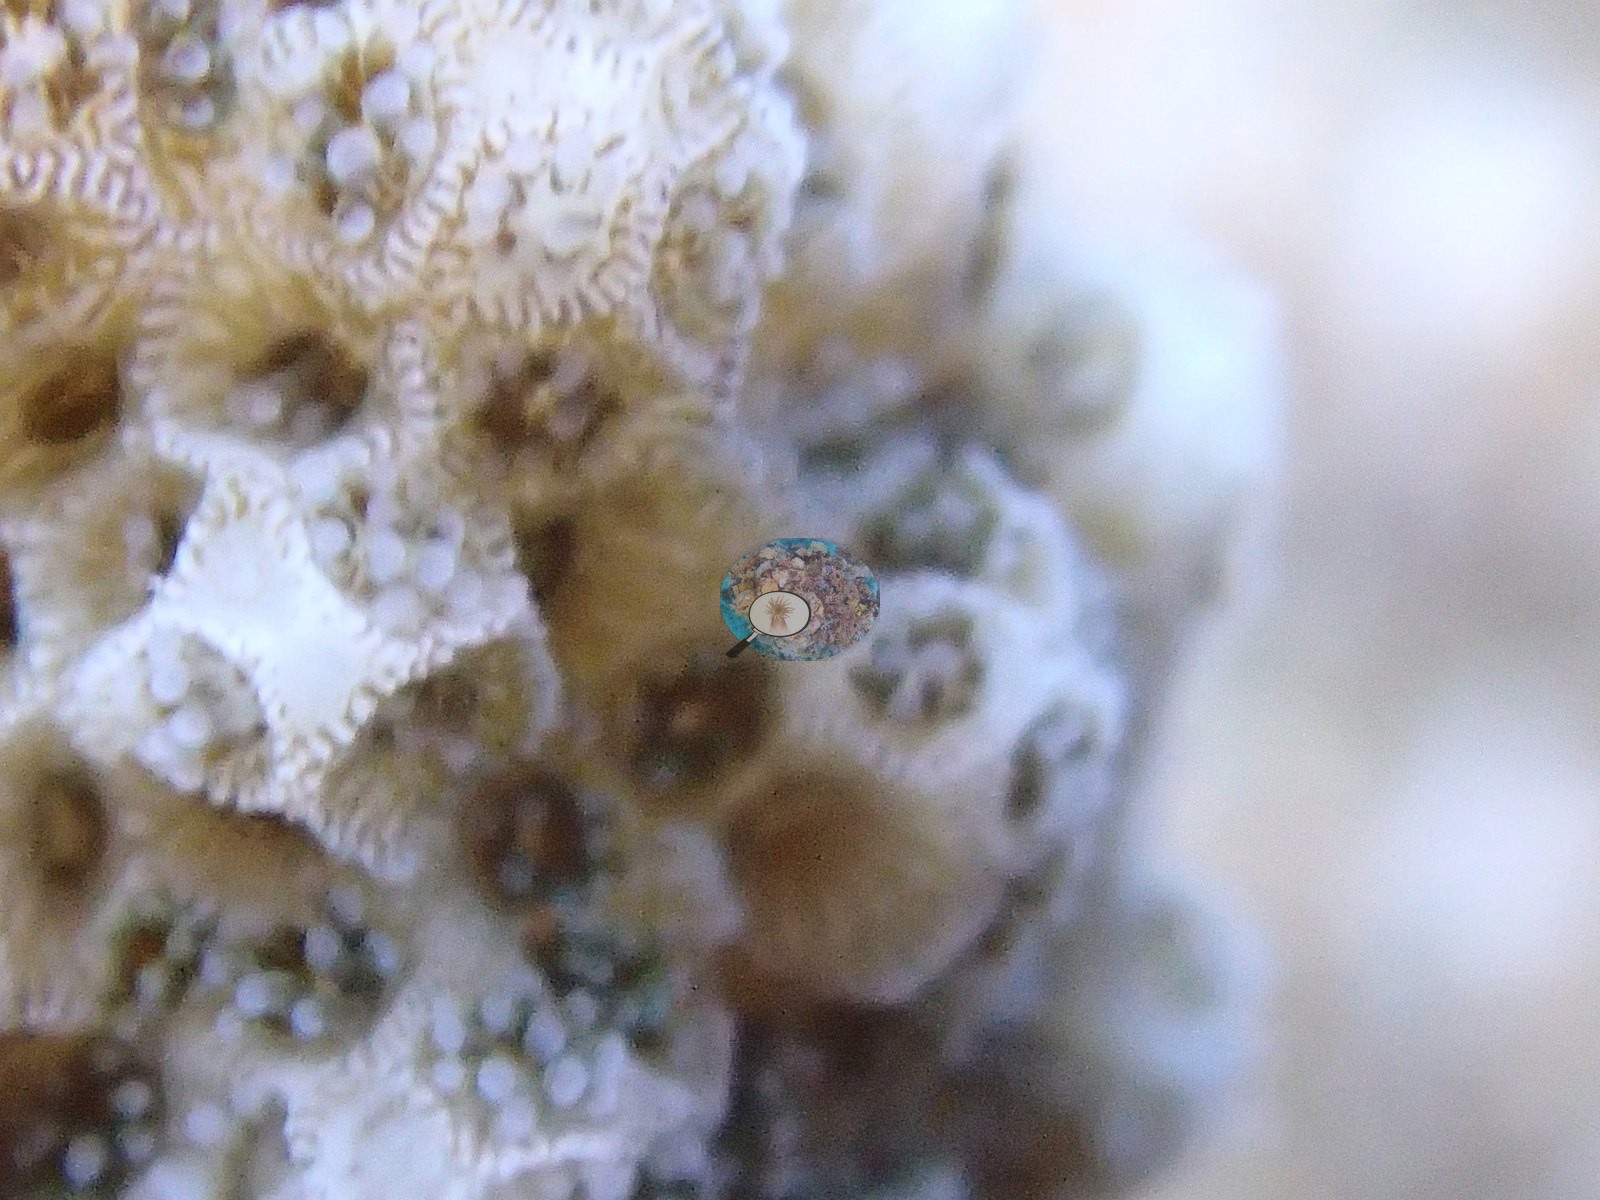
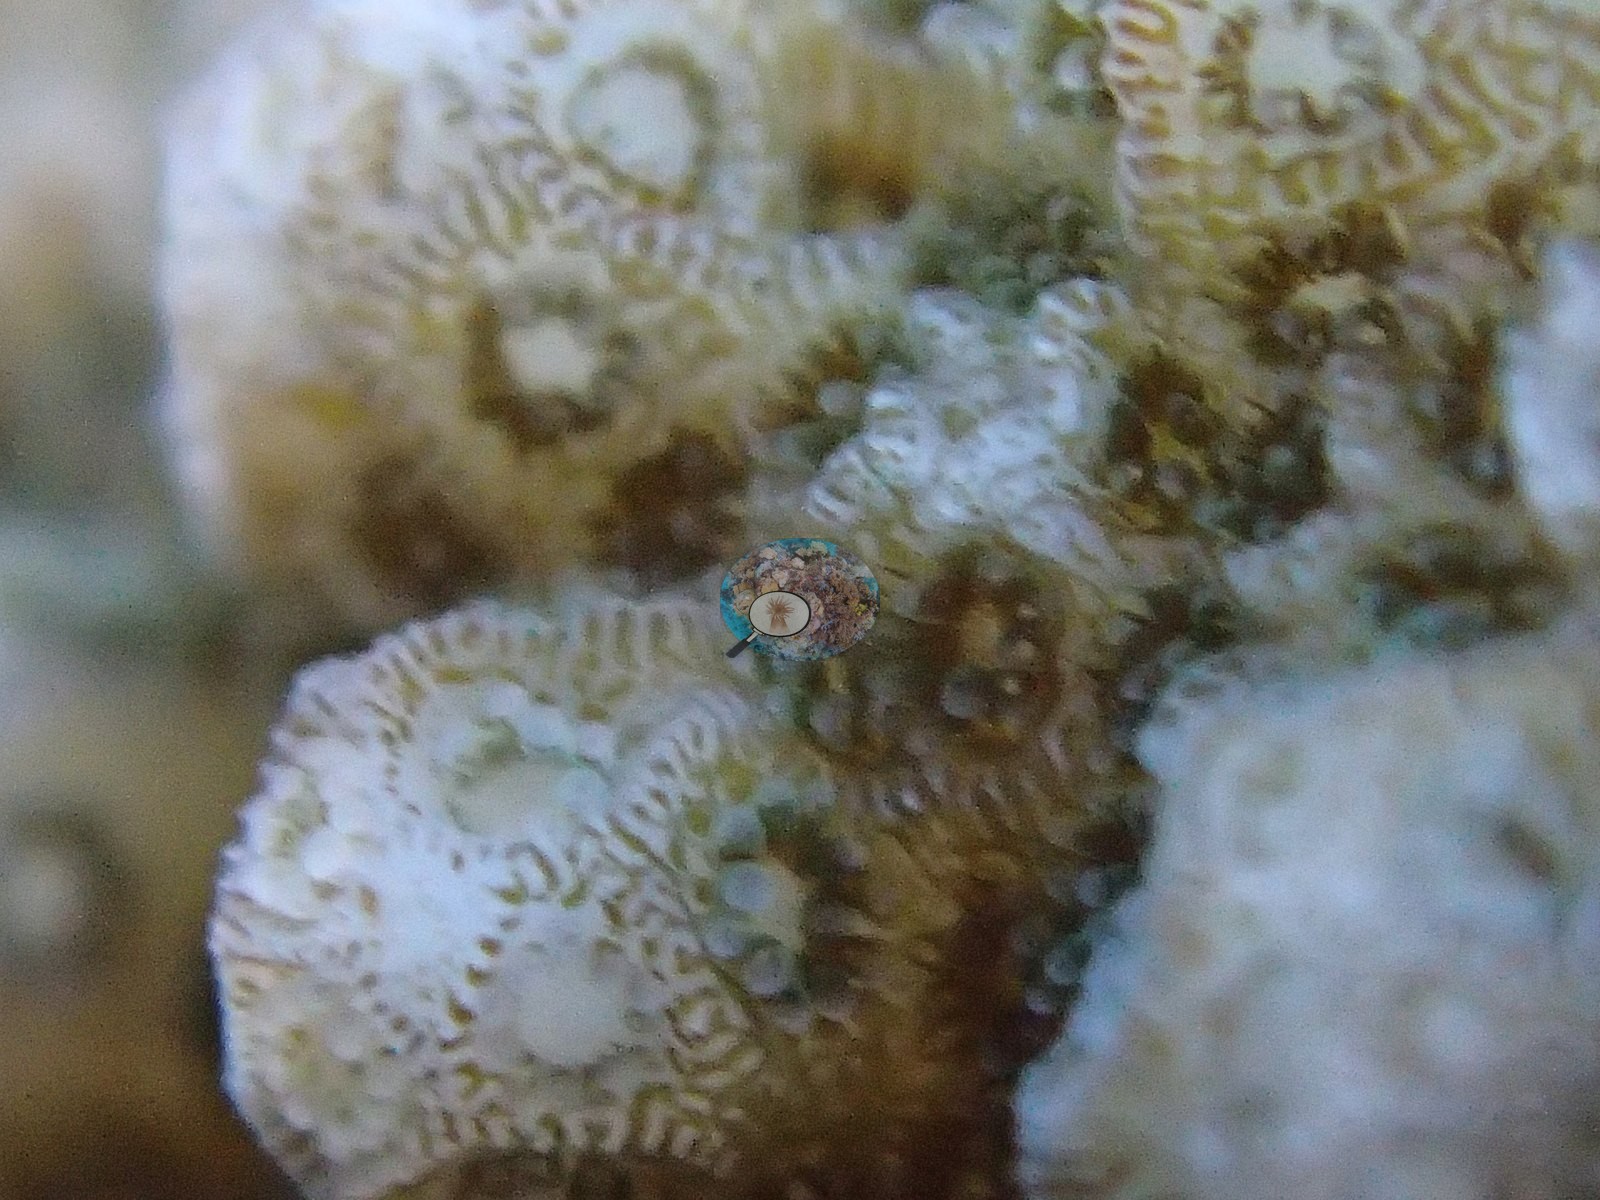
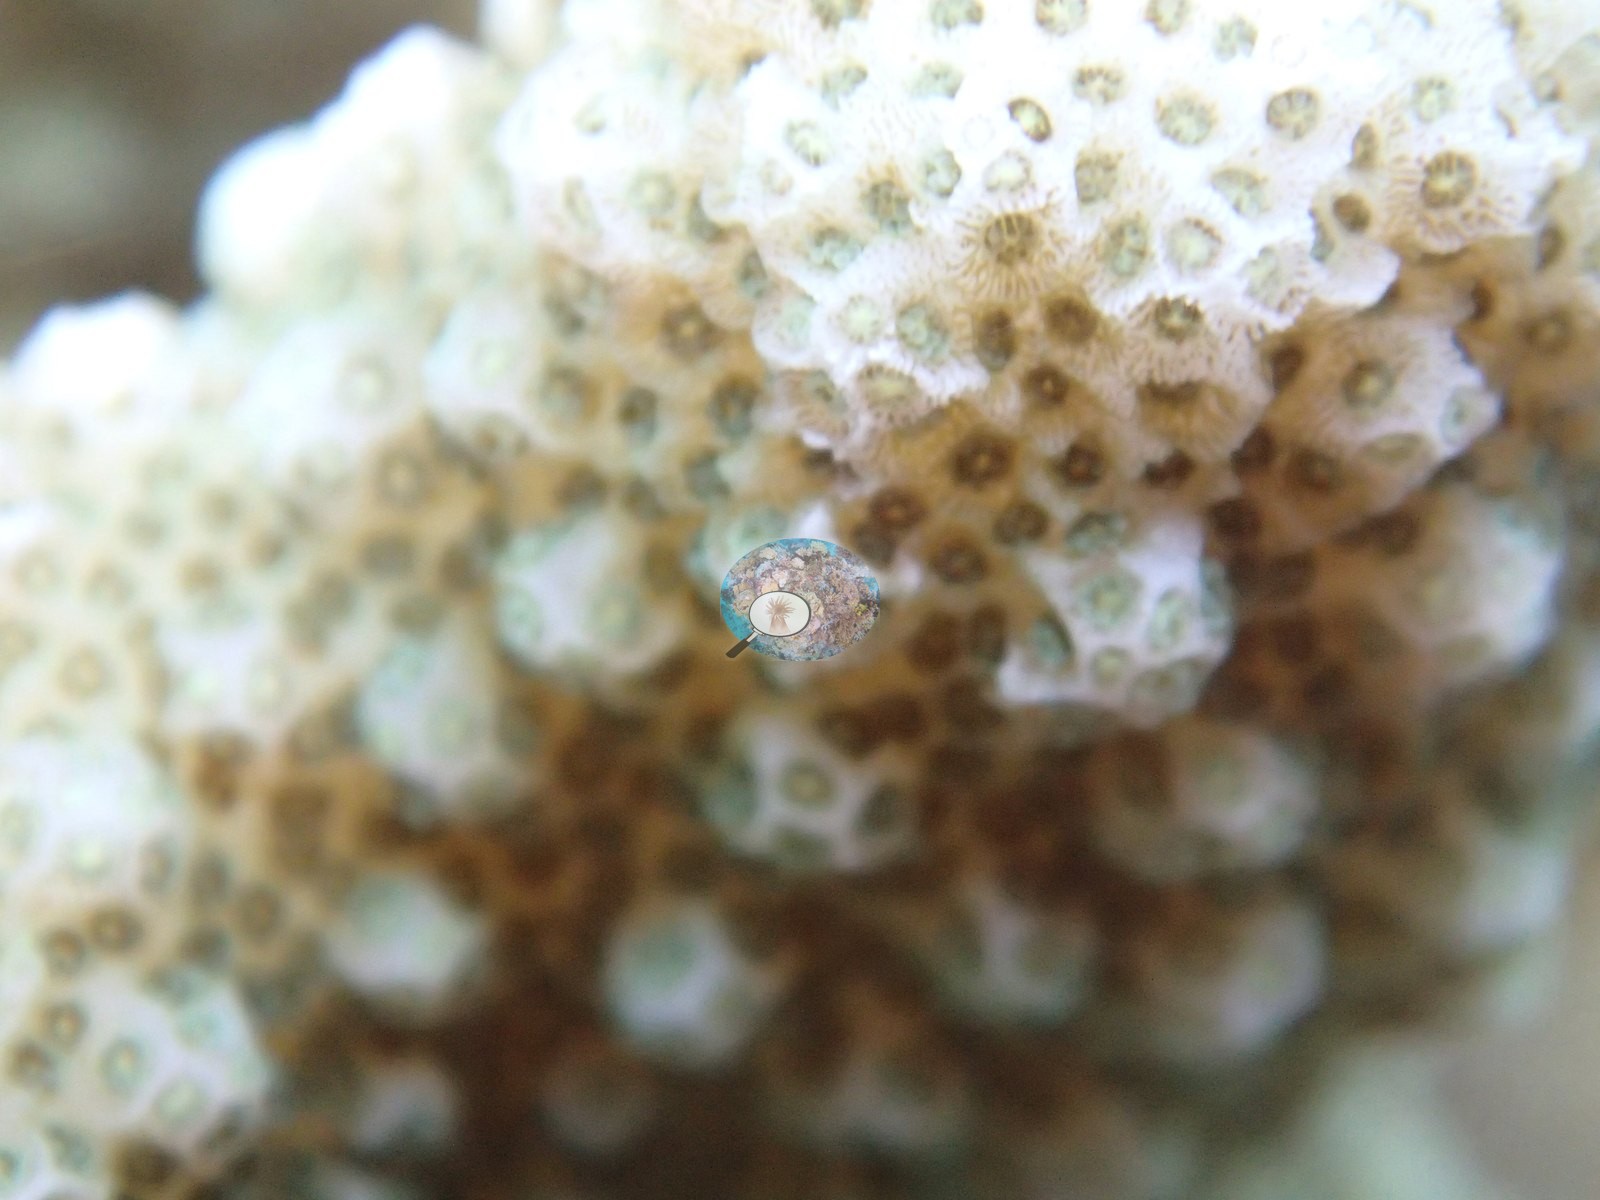
Honeycomb-patterned mounds compatible with Goniastrea fill the gaps, and in one memorable January frame a boldly spotted moray, compatible with the honeycomb moray, lay draped across the colony field in broad daylight (e.g., Image 3, Image 6, Image 11, Image 14, Image 18).
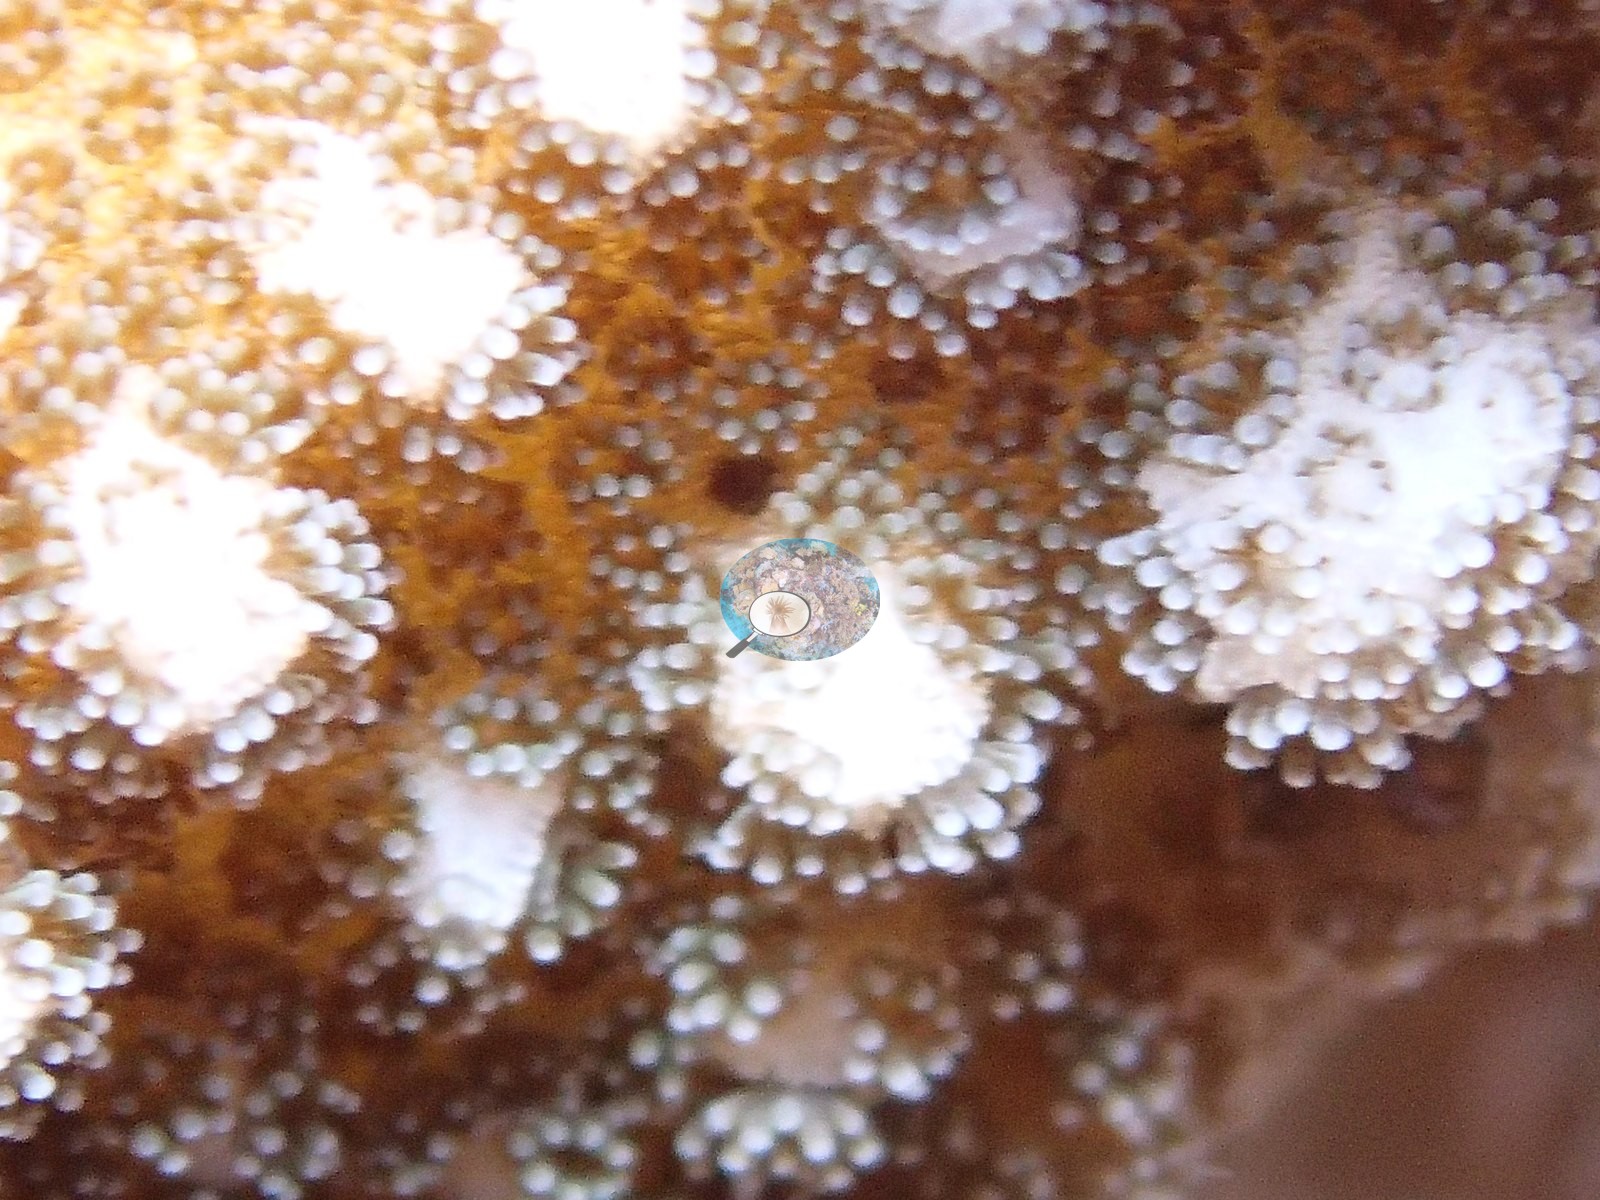
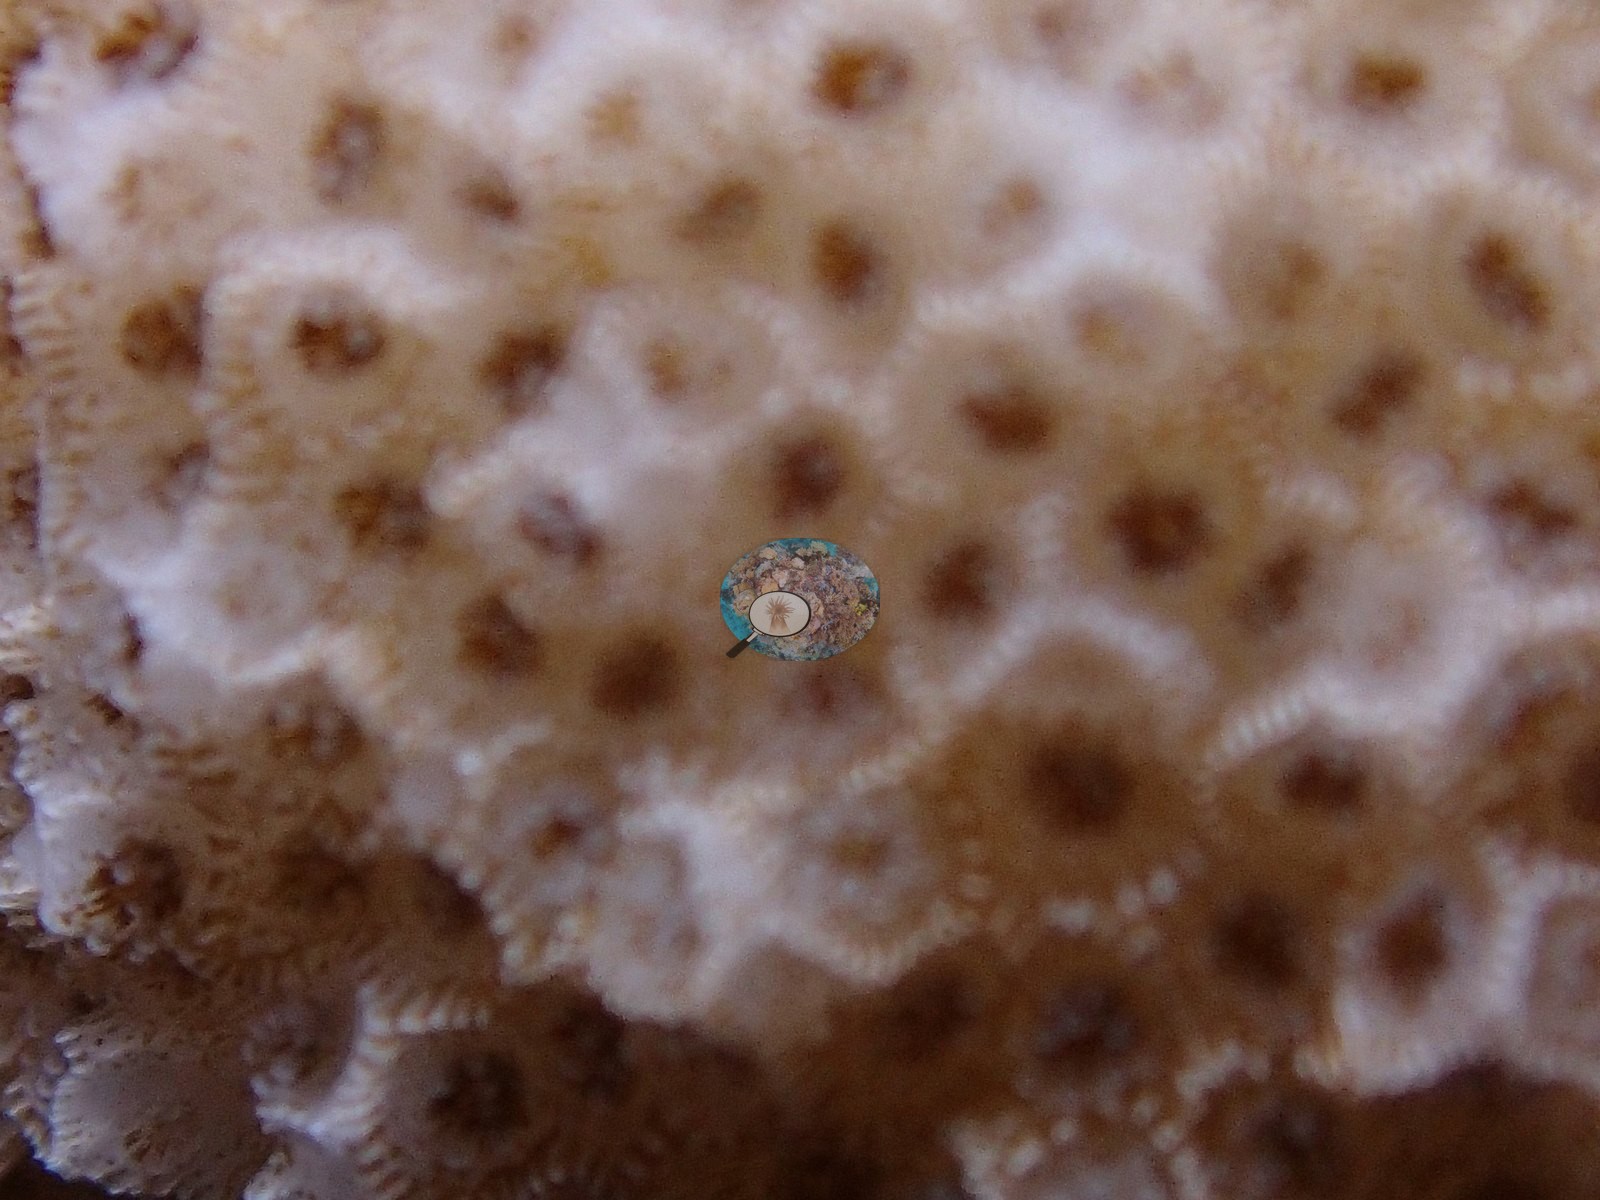
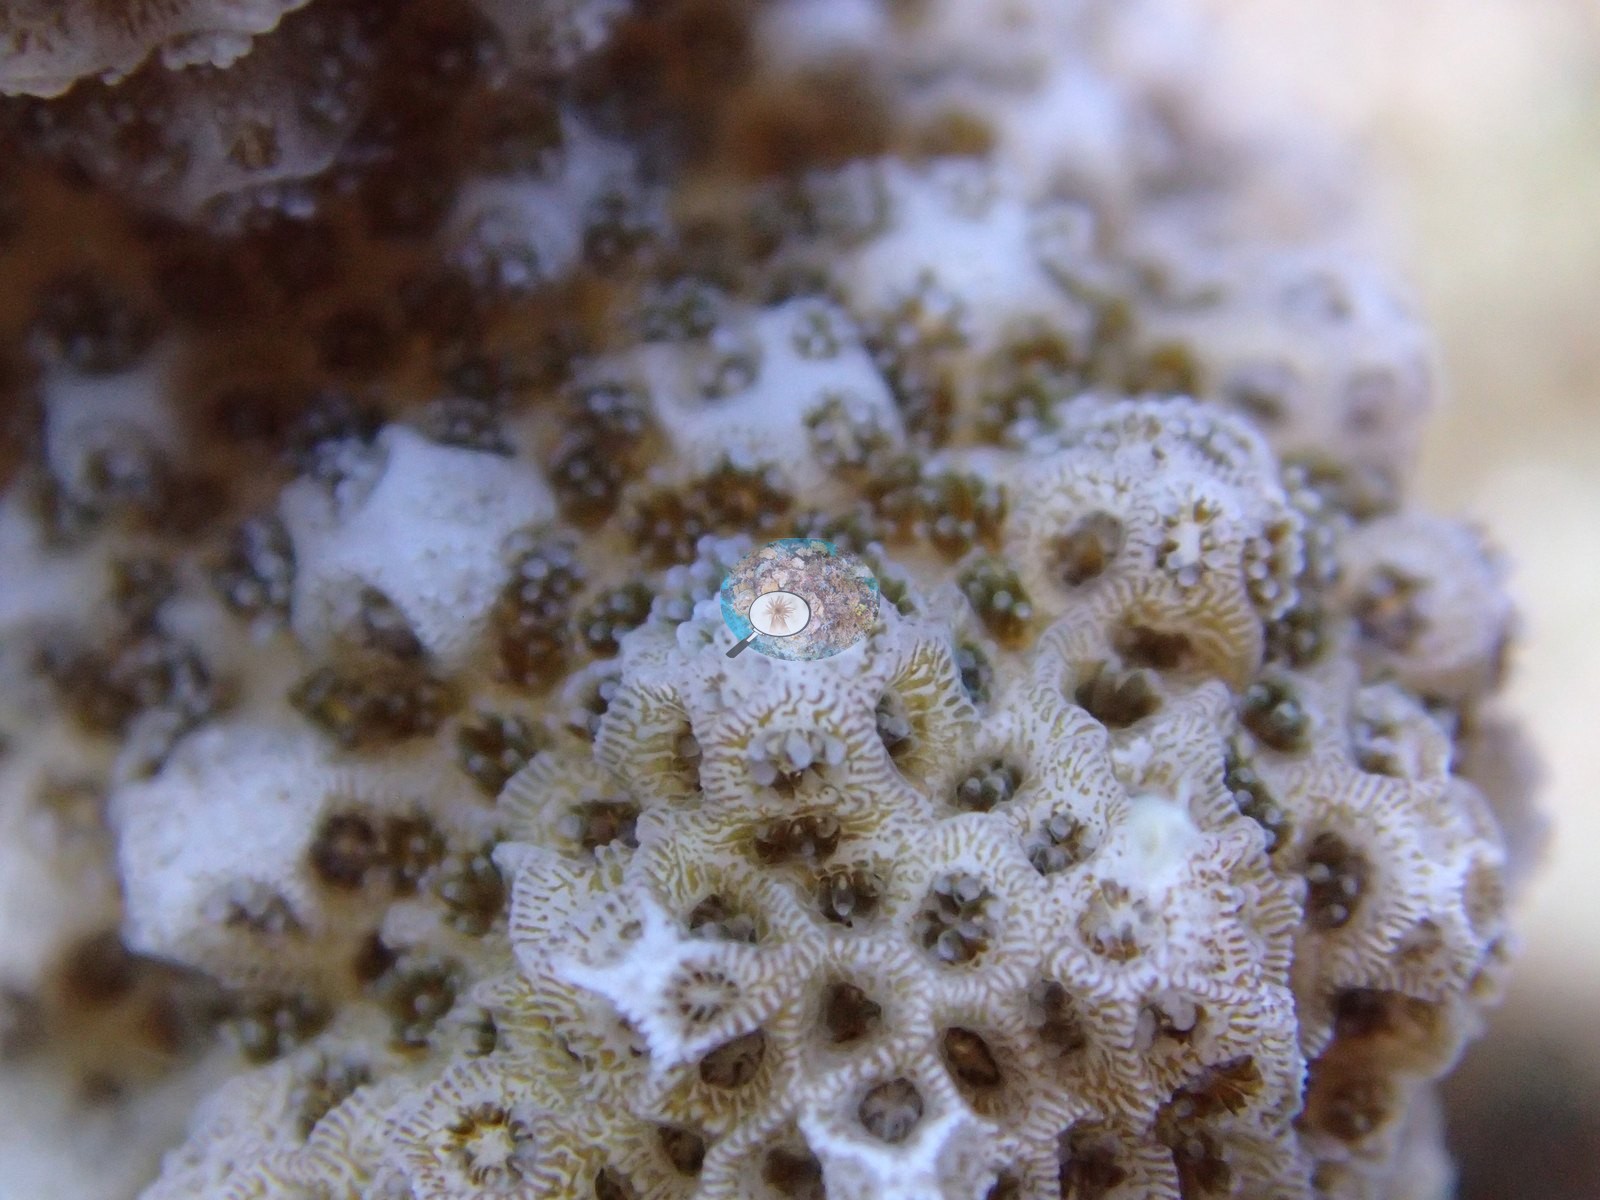
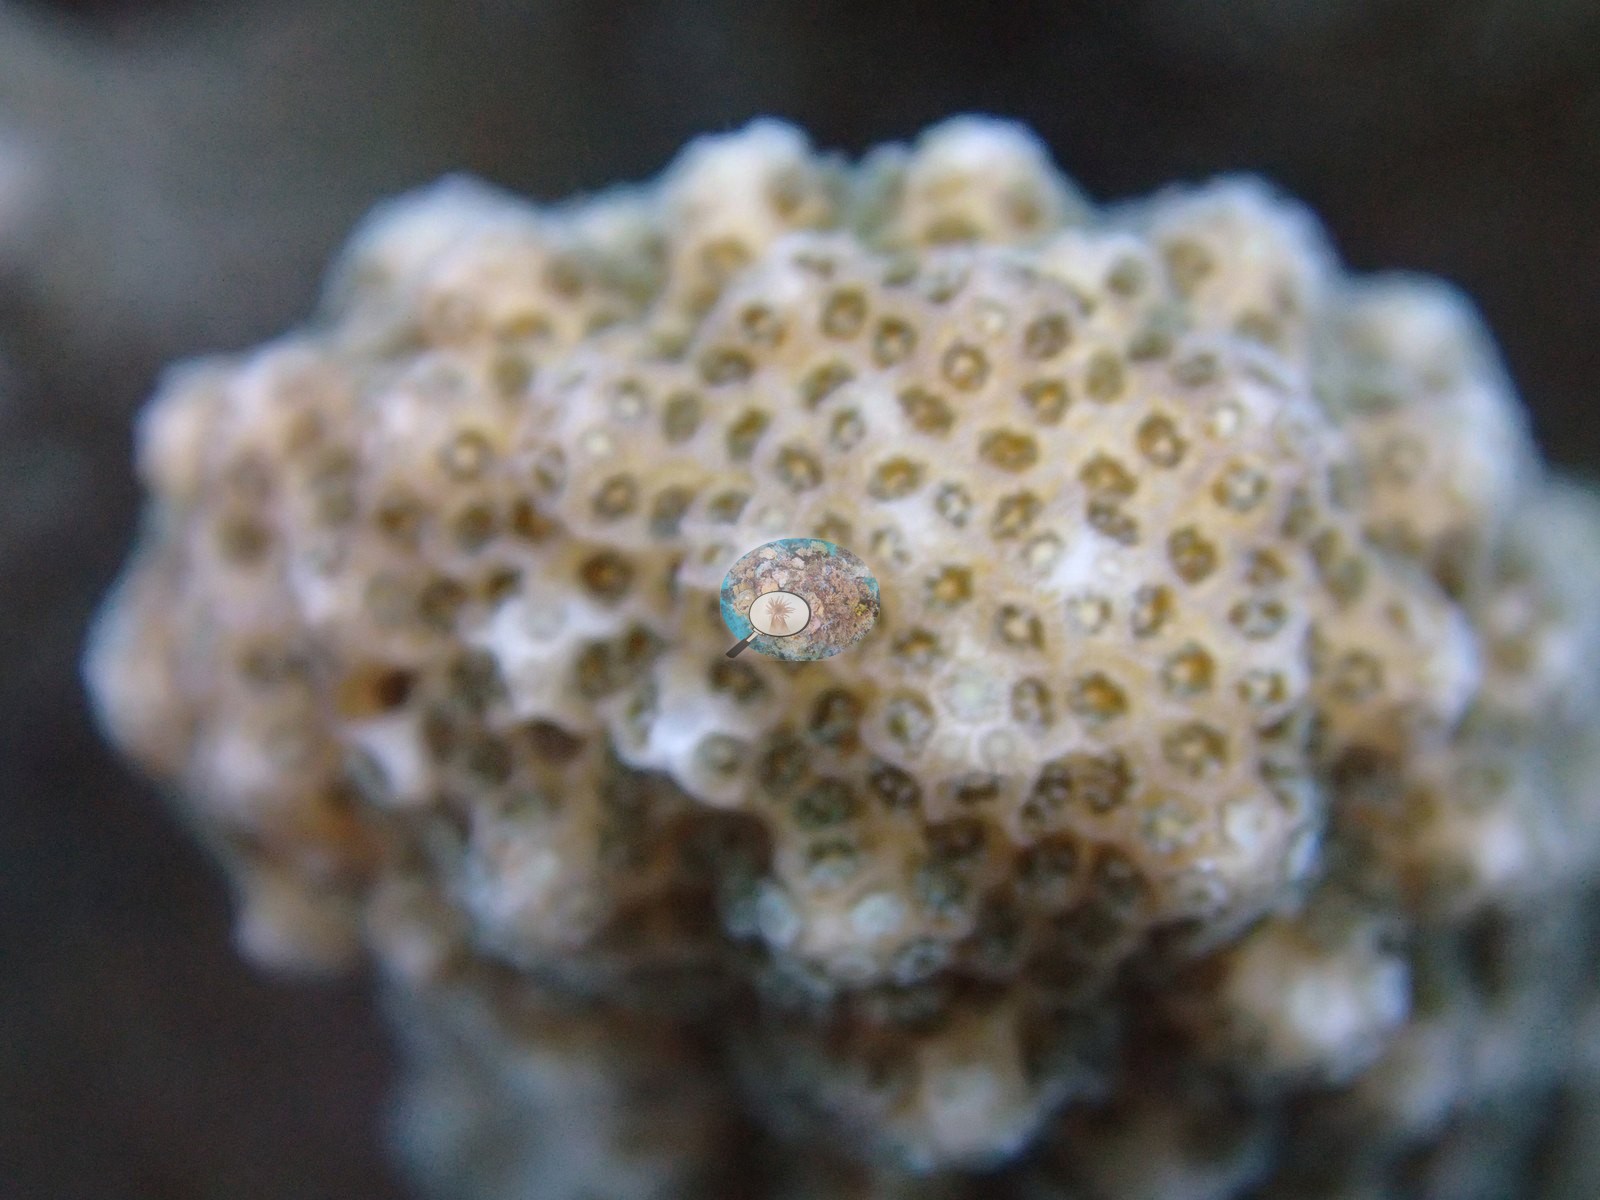
Coral cover
Coral cover: 31% — photo-derived, and the two methods disagree by 18.9 pp; treat cover as a range (21–40%). This site's figure is the mean of two independent computer vision passes over Anderson's own frames: a DINOv3 calibrated point classifier reads 21.2% and a CoralSCOP computer vision reads 40.1%, a spread of 18.9 percentage points. The map publishes the mean so sites can be sorted against one another, but the honest statement of what is known here is the 21–40% range: the two products have different denominators and should not be treated as one measurement.
Stressors
These research photos from January 2016 caught Maafushi vibrant and densely alive — months before the April El Niño resurvey found roughly 95% of its coral colonies bleached (e.g., Image 7).
No crown-of-thorns starfish (COTS) or other corallivores evident.
Comparisons with other data
No independent survey was made at this exact site; the nearest ones are listed in the table below.
CV model comparison
More info
As of September 2026 no computer-vision method estimates coral cover accurately on new images, so treat this as indicative rather than a measurement; it is revised as the methods improve.More info
The published figure is the mean of the two methods.| Method | Hard-coral cover (%) |
|---|---|
| In-house DINOv3 | 21.2 |
| CoralSCOP | 40.1 |
| Mean (± SD) | 30.6 ± 13 |
| Range | 21.2–40.1 |
Mean ± SD and range are across the computer-vision methods shown.
Independent surveys nearby
| Agency / program | Year(s) | Stations / distance | Link |
|---|---|---|---|
| Montefalcone et al. (2020) | 2016–2019 | 1 station, 3.50 km | Records ↓ |
| Reef Check | 2012–2025 | 4 stations, 3.72–5.00 km | Records ↓ |
| XL Catlin Seaview Survey | 2015–2017 | 2 stations, 1.43–2.08 km | Records ↓ |
 Dr. Coral (CRD)Year-average (no detectable trend)
Within 5 km, 7 independent survey stations recorded hard coral cover in 19 records between 2012 and 2025. Of the 4 stations surveyed in more than one year, 2 increased and 2 changed by less than 5 percentage points between their first and latest surveys. The longest record, Guraidhoo backreef (Reef Check, 5.00 km away), went from 28% in 2019 to 25% in 2025. Surveys since 2021 average 28% (range 25–31%, n=2). This site's own estimate (31%) sits within the recent range (25–31%); the methods differ, so the comparison is context, not a like-for-like test.
Collected by other programs using different methods (Reef Check uses point-intercept transects; the XL Catlin Seaview Survey uses photo-transects with automated image annotation), so these are context for the figures above, not a like-for-like comparison. Where a station was surveyed more than once the range is shown. Station names are not dive-site names.
| Agency | Site / location | Date | Hard coral cover (%) | Distance | Link |
|---|---|---|---|---|---|
| Reef Check | Biyadhoo House Reef | 2012 | 18% (3 surveys) | 4.66 km | — |
| XL Catlin Seaview Survey | transect 37036 | 2015 | 38% | 1.43 km | — |
| XL Catlin Seaview Survey | transect 37035 | 2015–2017 | 5.5–7.1% (2 images) | 2.08 km | — |
| Montefalcone et al. (2020) | Kandooma Beyru | 2016–2019 | 7.7–34% (3 surveys) | 3.50 km | HeatCRD database |
| Reef Check | Kandooma Beyru | 2018–2019 | 18–30% (4 surveys) | 3.72 km | — |
| Reef Check | Guraidhoo backreef | 2019–2025 | 25–28% (4 surveys) | 5.00 km | — |
| Reef Check | Guraidhoo Backreef | 2024 | 31% (2 surveys) | 4.91 km | — |
Data & links
All images from Coral Reef Diagnostics. Data are from Coral Reef Diagnostics and the organizations named in the data-sources table above.
© Coral Reef Diagnostics.