
Maldives - Ghuli Faru

Part of the regional summaries: Maldives - Central (Male Atolls / Ari / Vaavu) and Maldives
More info
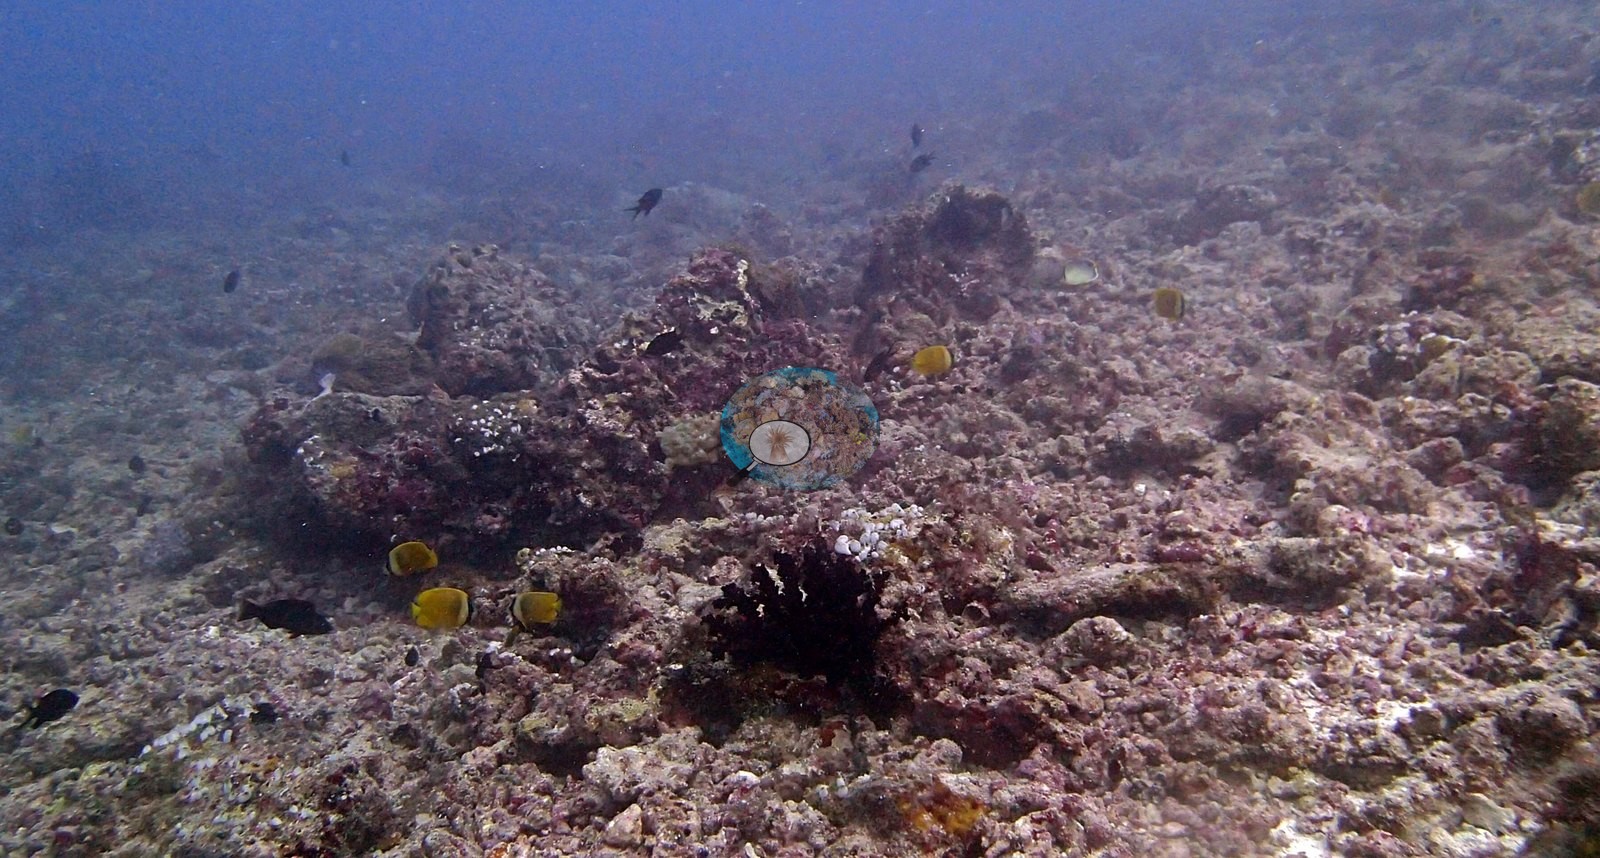
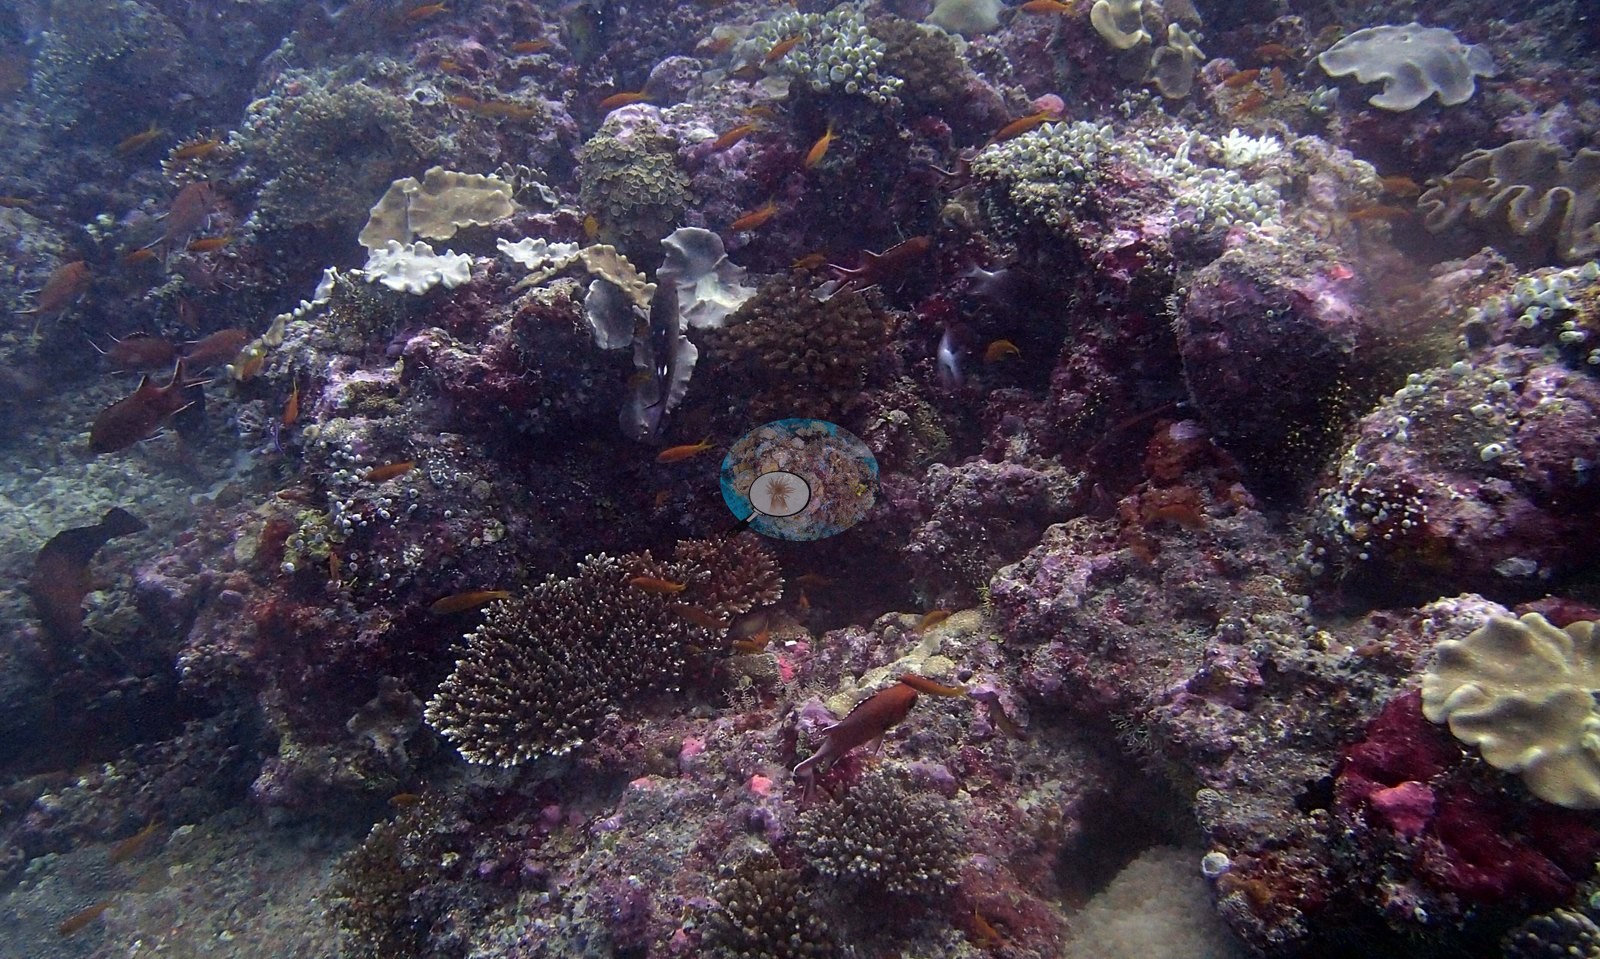
Maldives (NOAA CRW virtual station) · Maldives ecoregion mean=2.9°C-heating weeksA fast, plankton-thick drift dive better known for its wildlife than its coral - a coffee-table-sized bumphead parrotfish, a Napoleon wrasse, spotted eagle rays, and a river of snappers, all in poor visibility. Coral cover here is modest, with computer vision estimating around 11.5%.
Three independent survey stations shown with the program’s logo — click one to see how far it is from this site.
Eight other CRD dive sites within 5 km shown in orange — click a marker to open its page.
7 of these 23 photographs are shown beside the text that discusses them under "Site description" below.
Site description
Setting
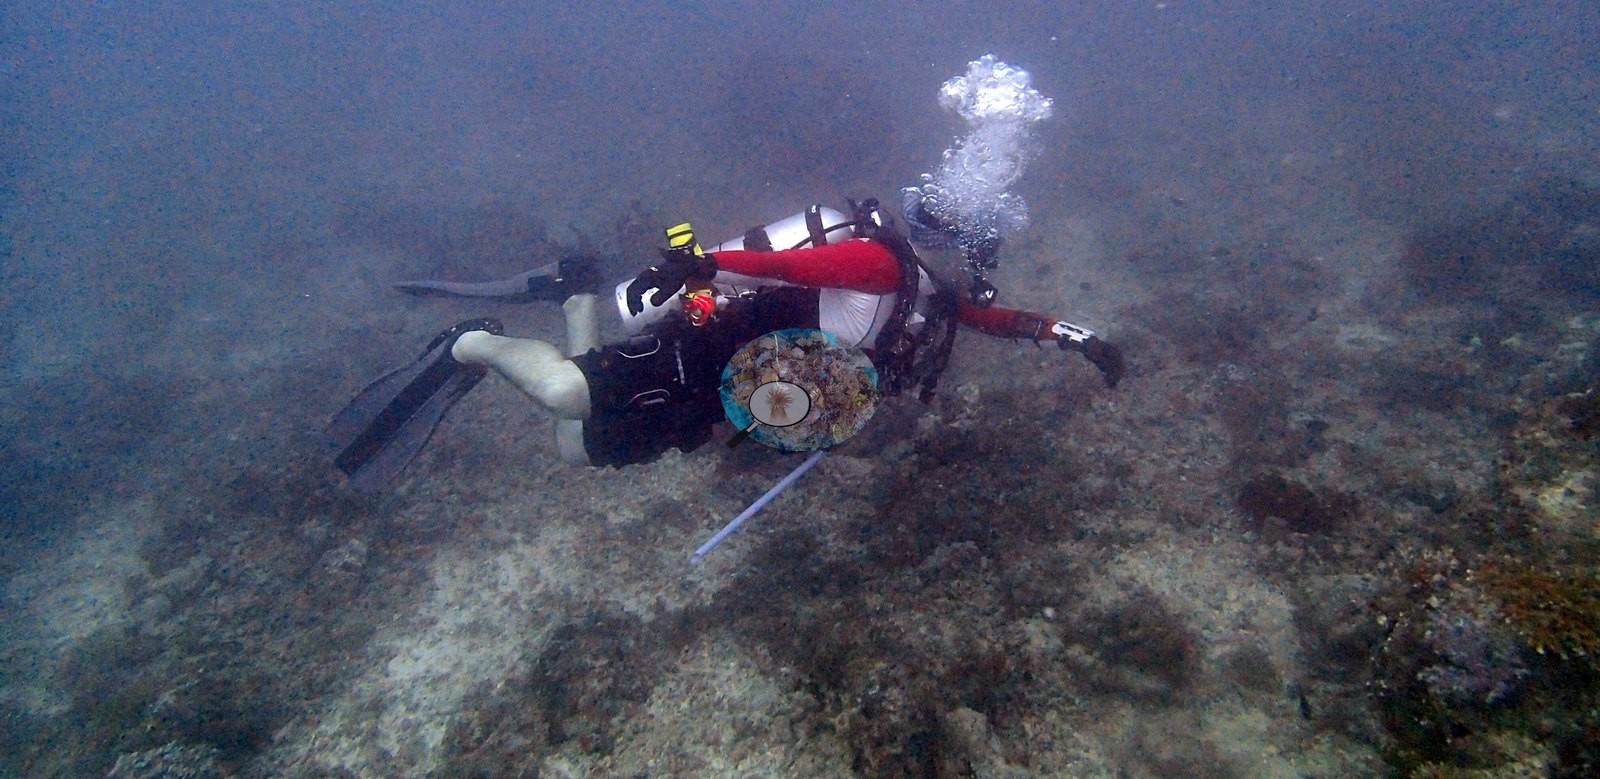
The water at Ghuli Faru was thick with plankton and moving like a freight train — one photo shows a diver pinned flat, bubbles streaming sideways — and that soup is exactly why the big animals came.
General benthic features
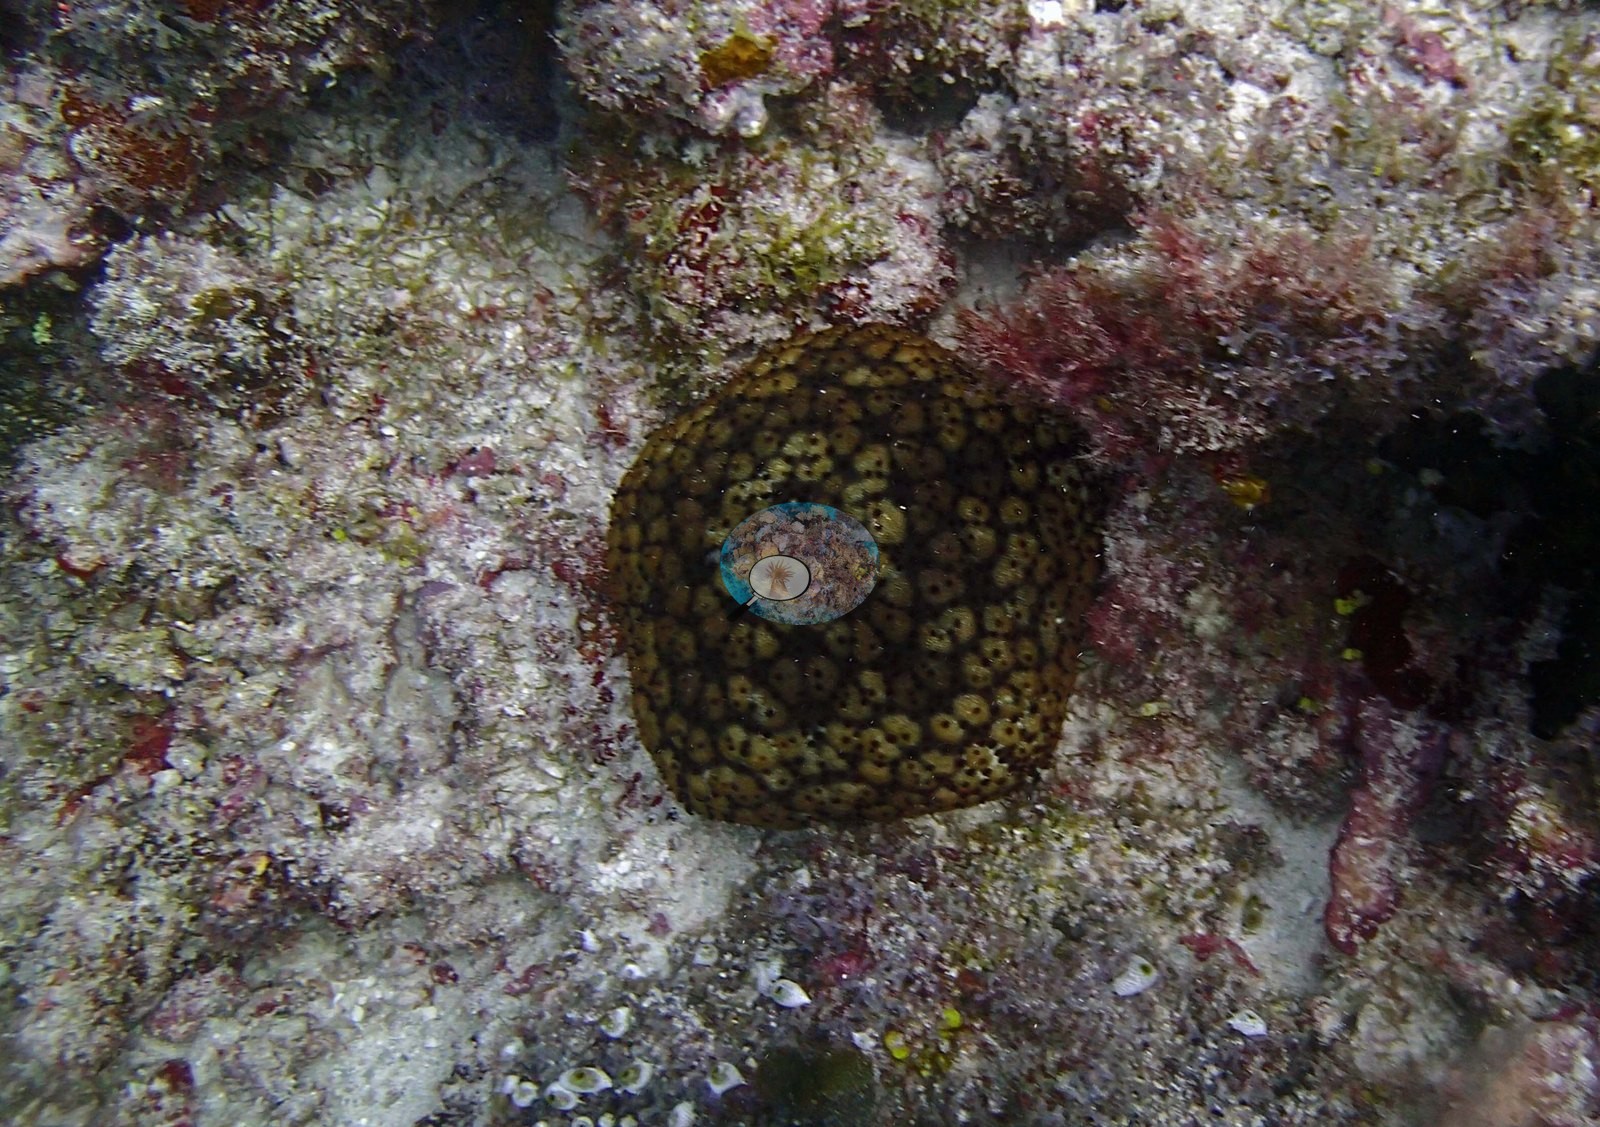
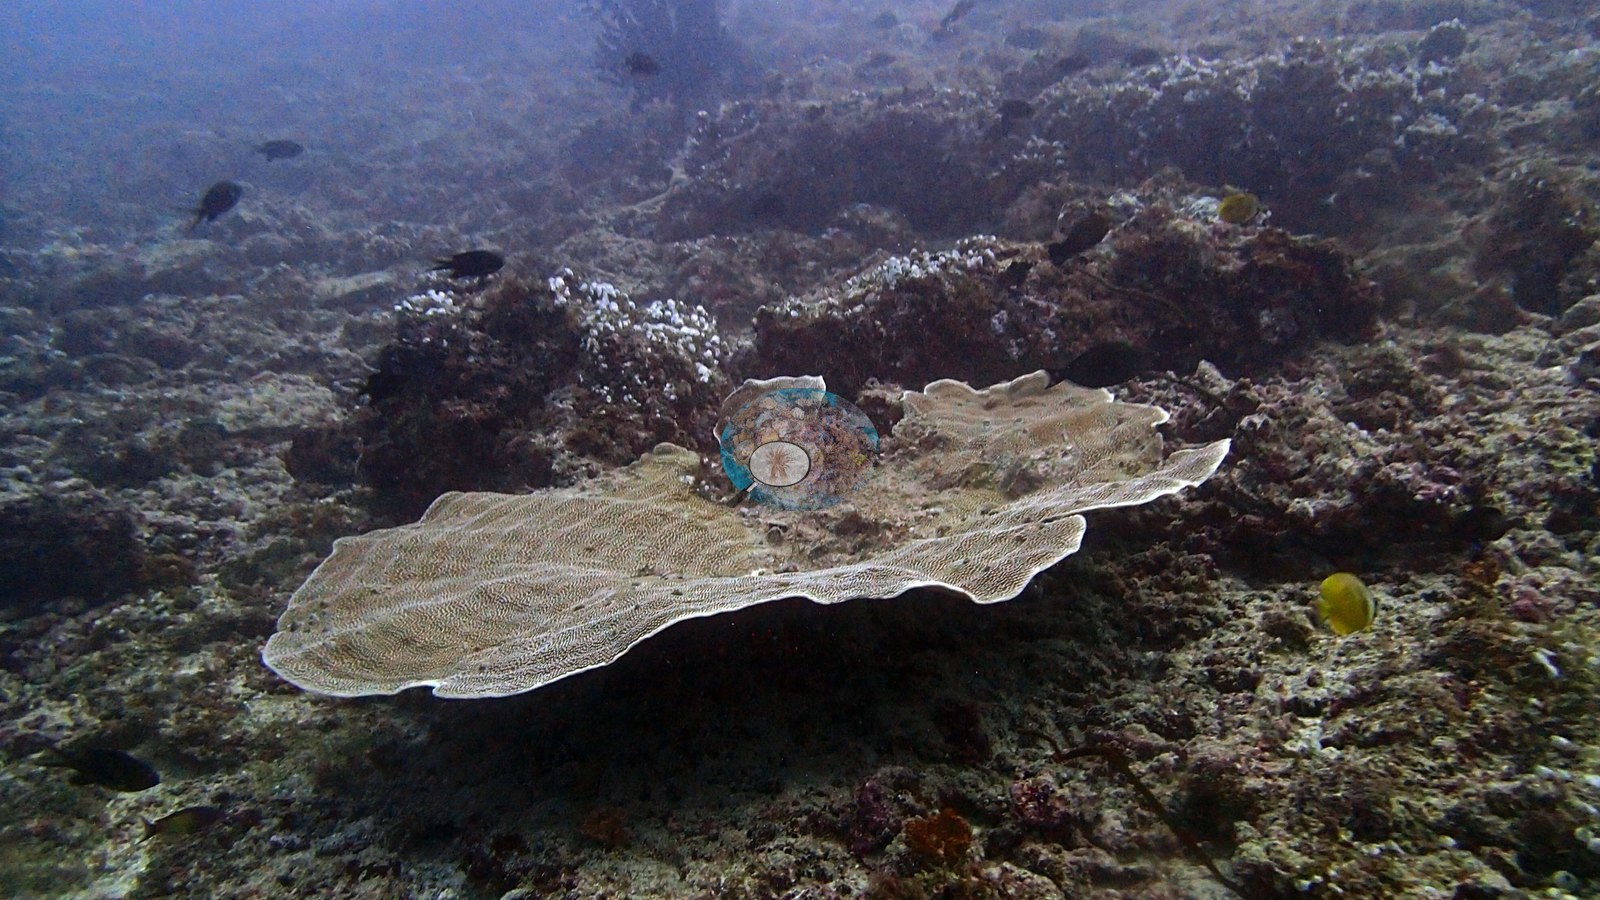
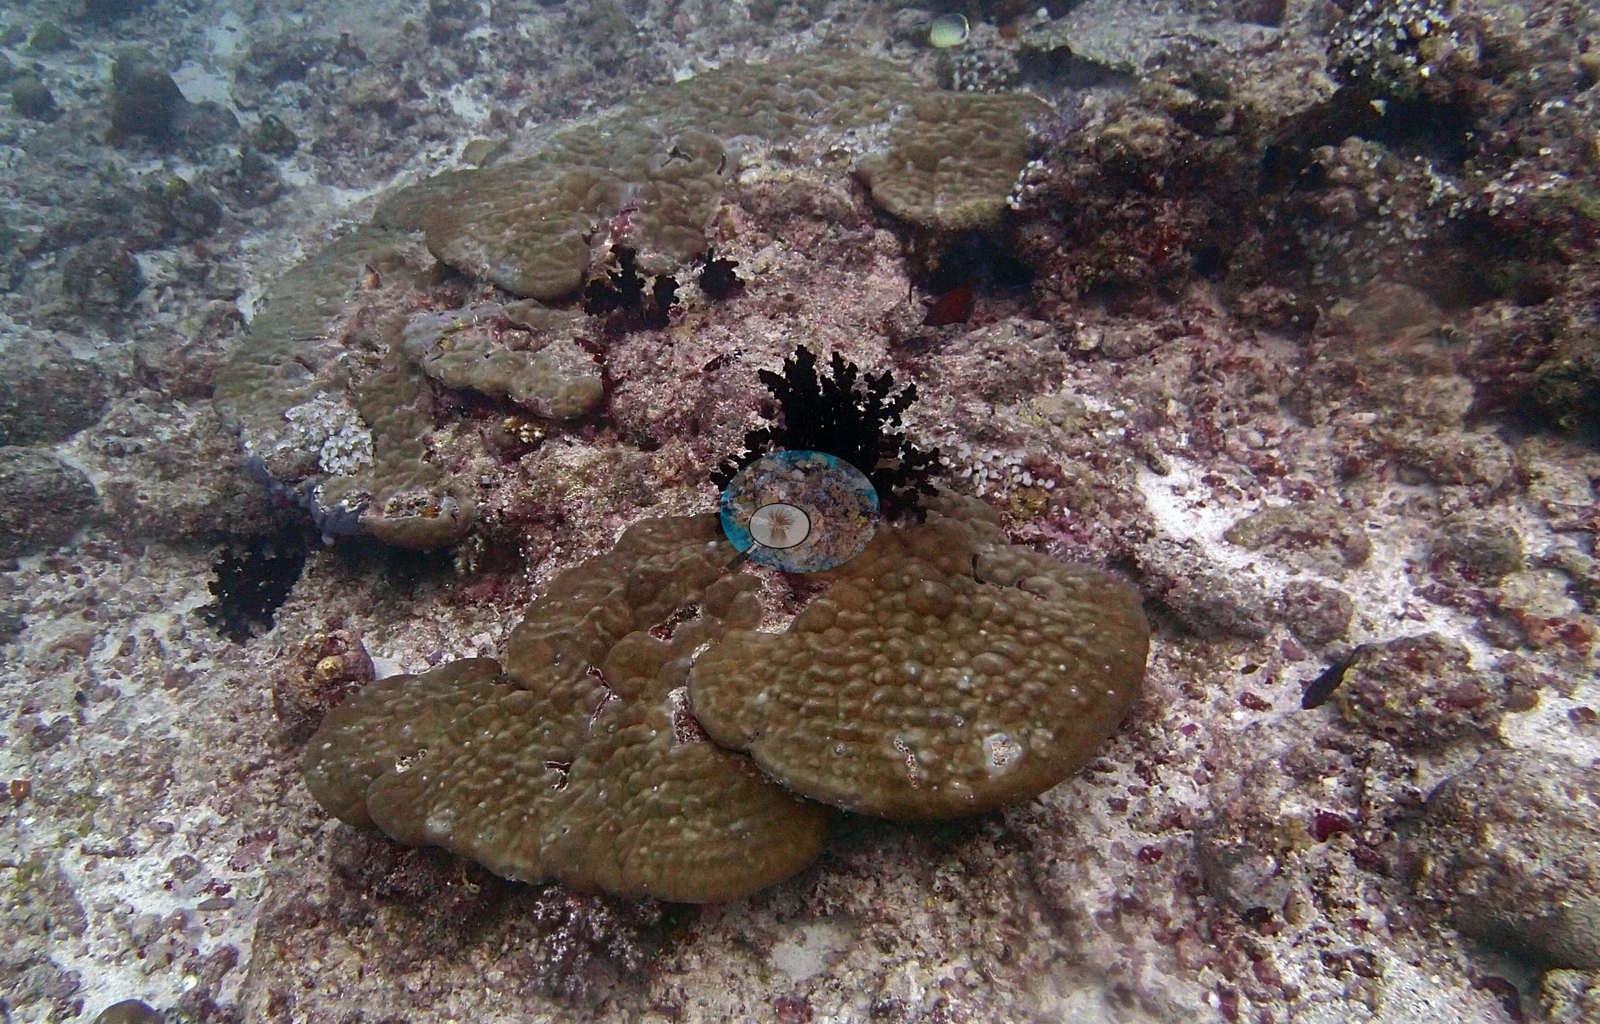
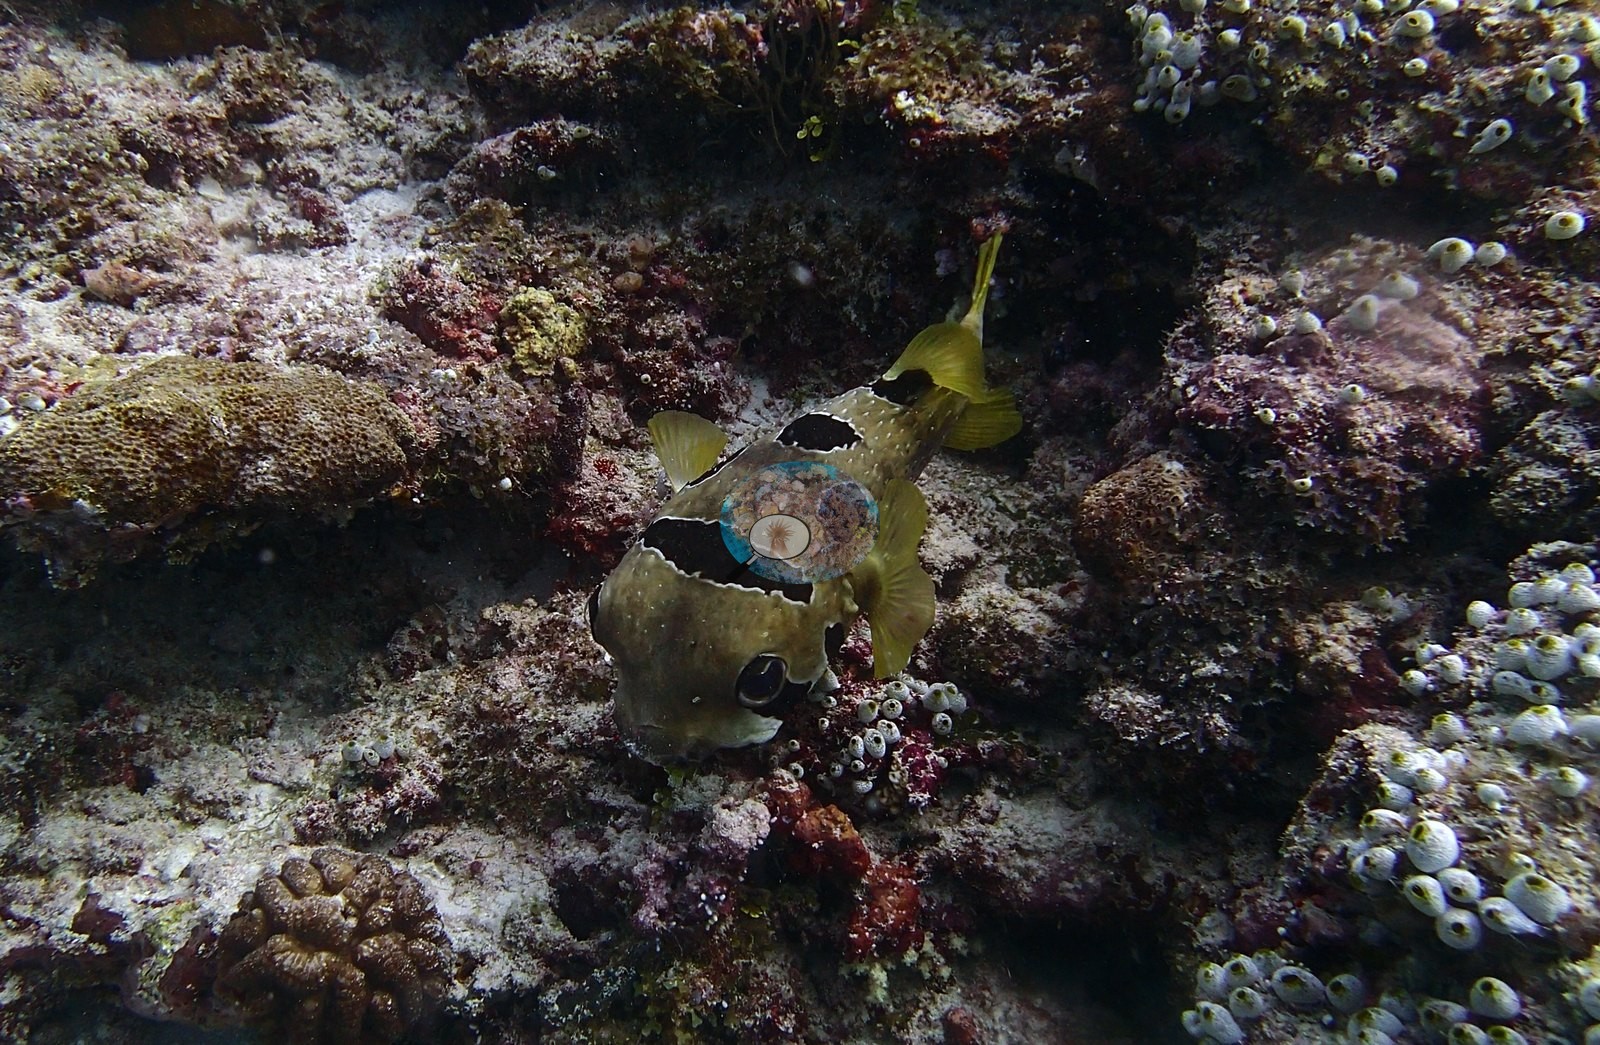
Between fly-bys, whip corals leaned hard into the current beside an unfurled black crinoid, and a blotchy map-type puffer sat out the chaos wedged among the corals (e.g., Image 24).
Coral cover
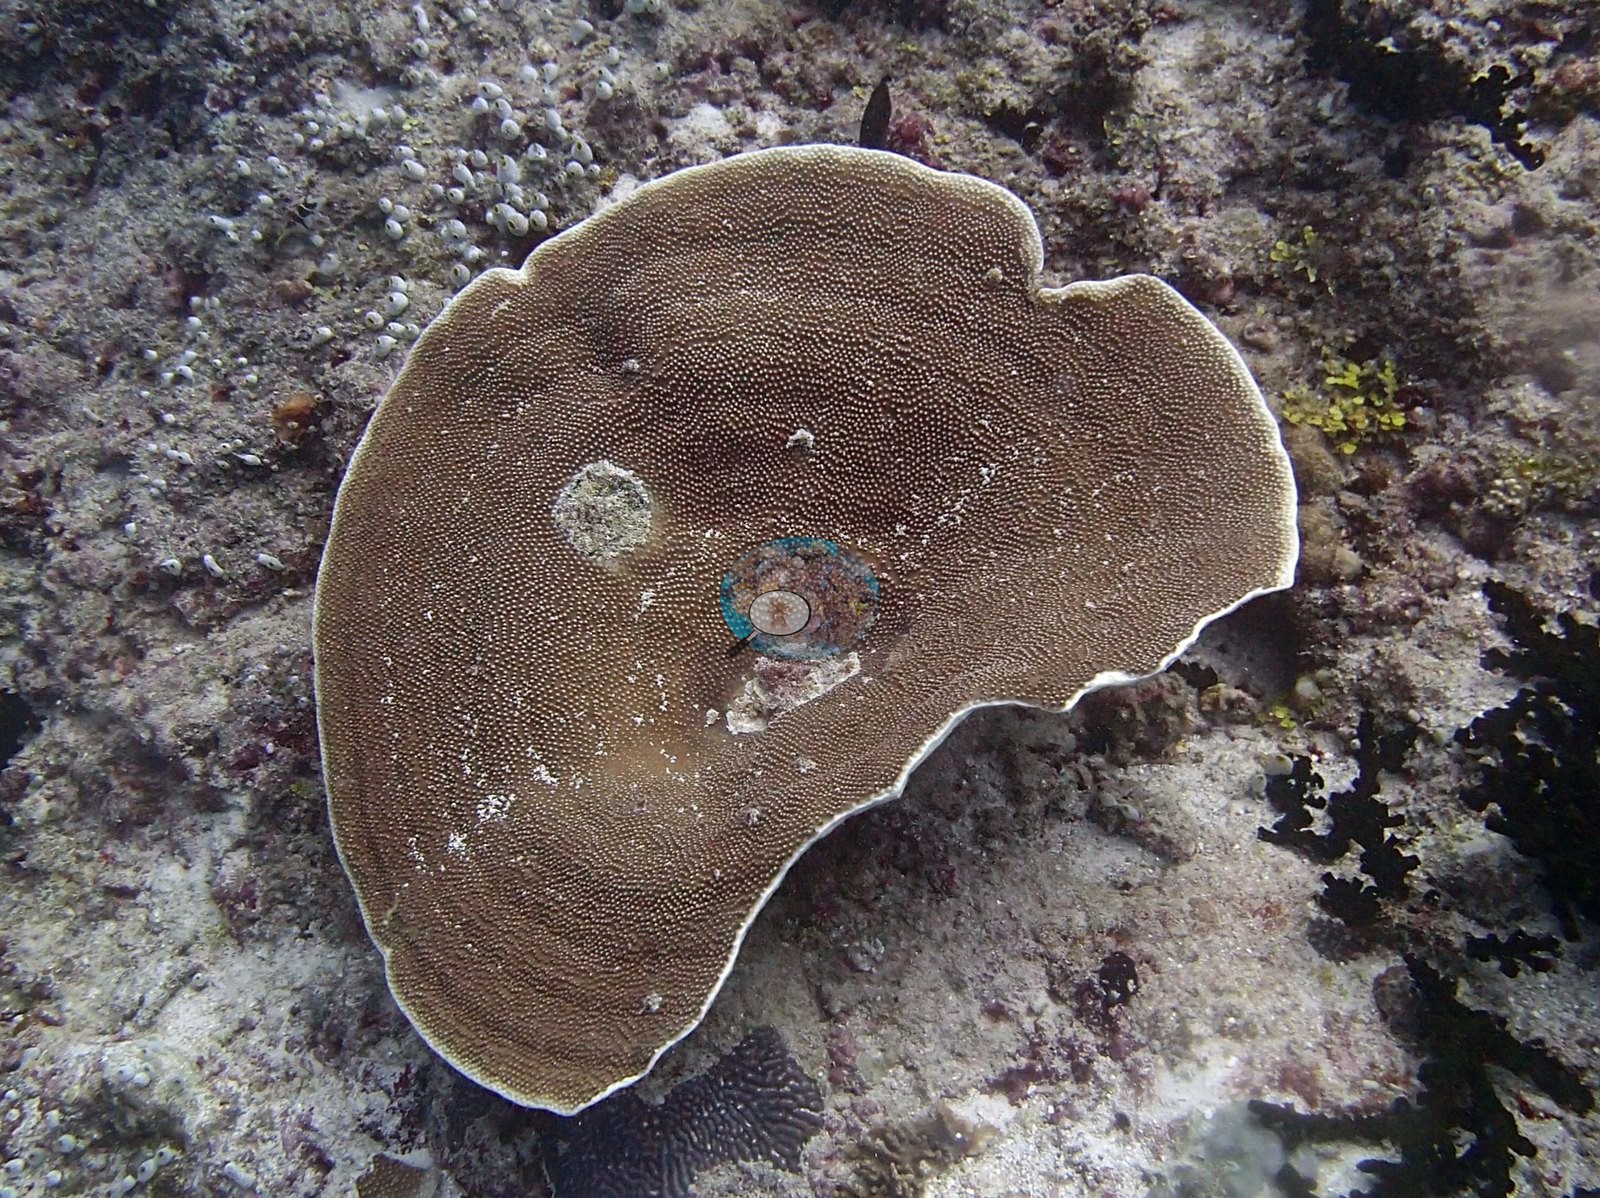
Coral cover: 12% — photo-derived, and the two methods broadly agree (10% vs 13%). This site's figure is the mean of two independent computer vision passes over Anderson's own frames: a DINOv3 calibrated point classifier reads 10.3% and a CoralSCOP computer vision reads 12.7%, a spread of 2.4 percentage points. The map publishes the mean so sites can be sorted against one another, but the honest statement of what is known here is the 10–13% range: the two products have different denominators and should not be treated as one measurement.
Stressors
No crown-of-thorns starfish (COTS) or other corallivores evident.
Fish and other fauna
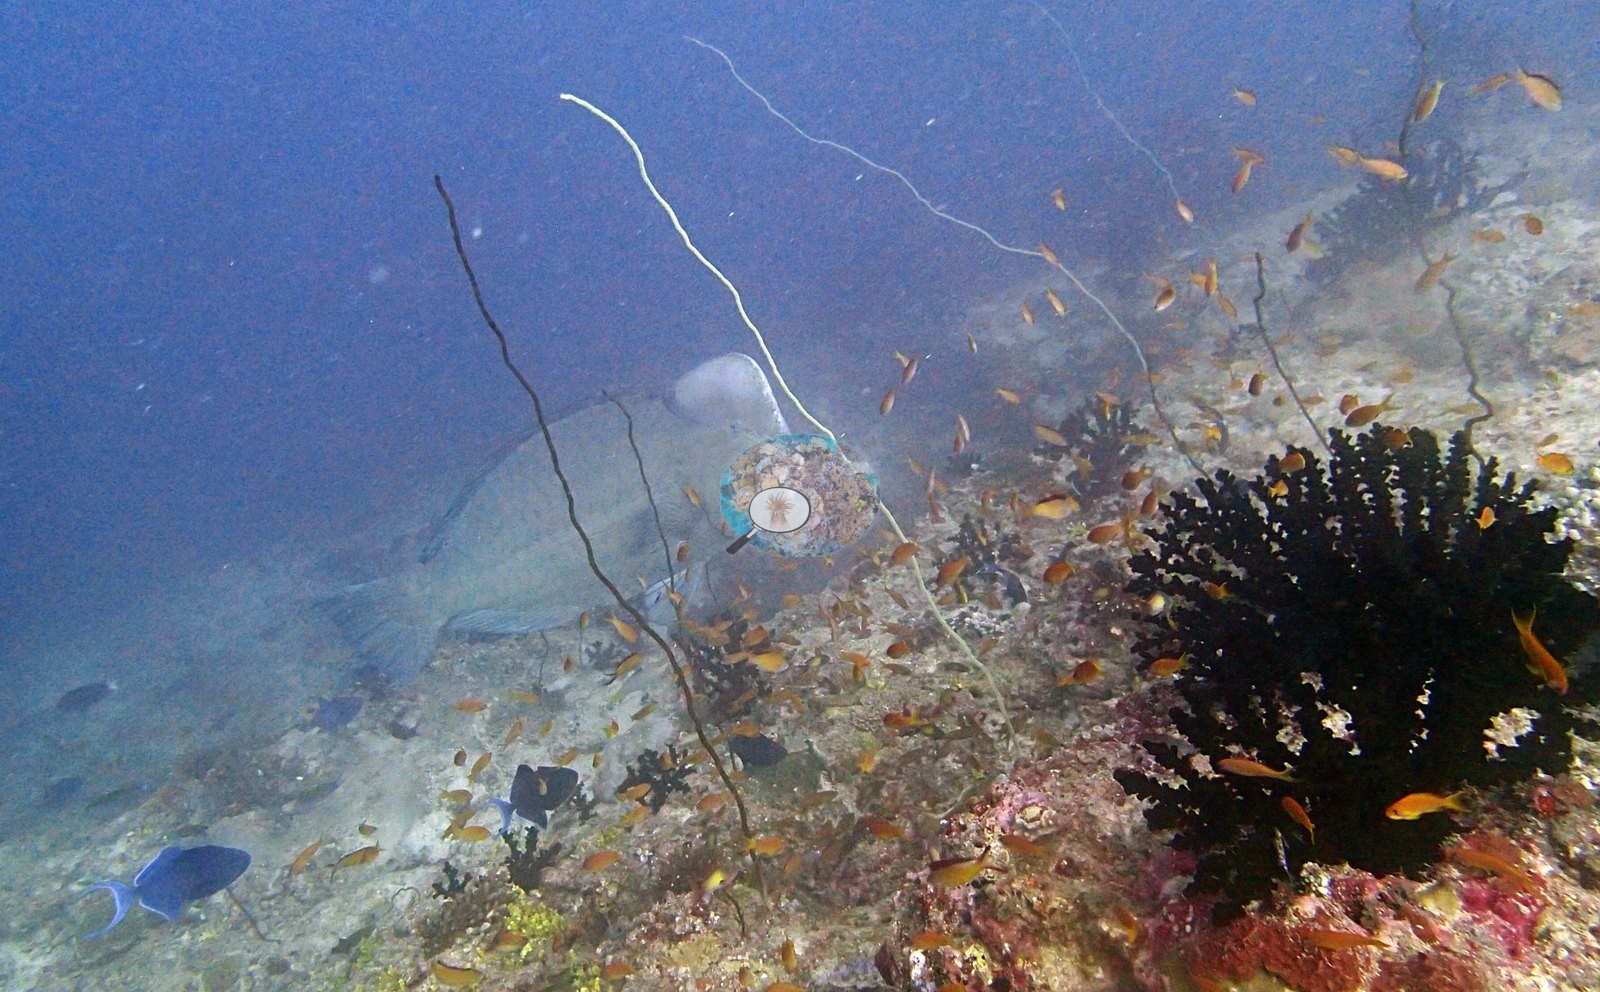
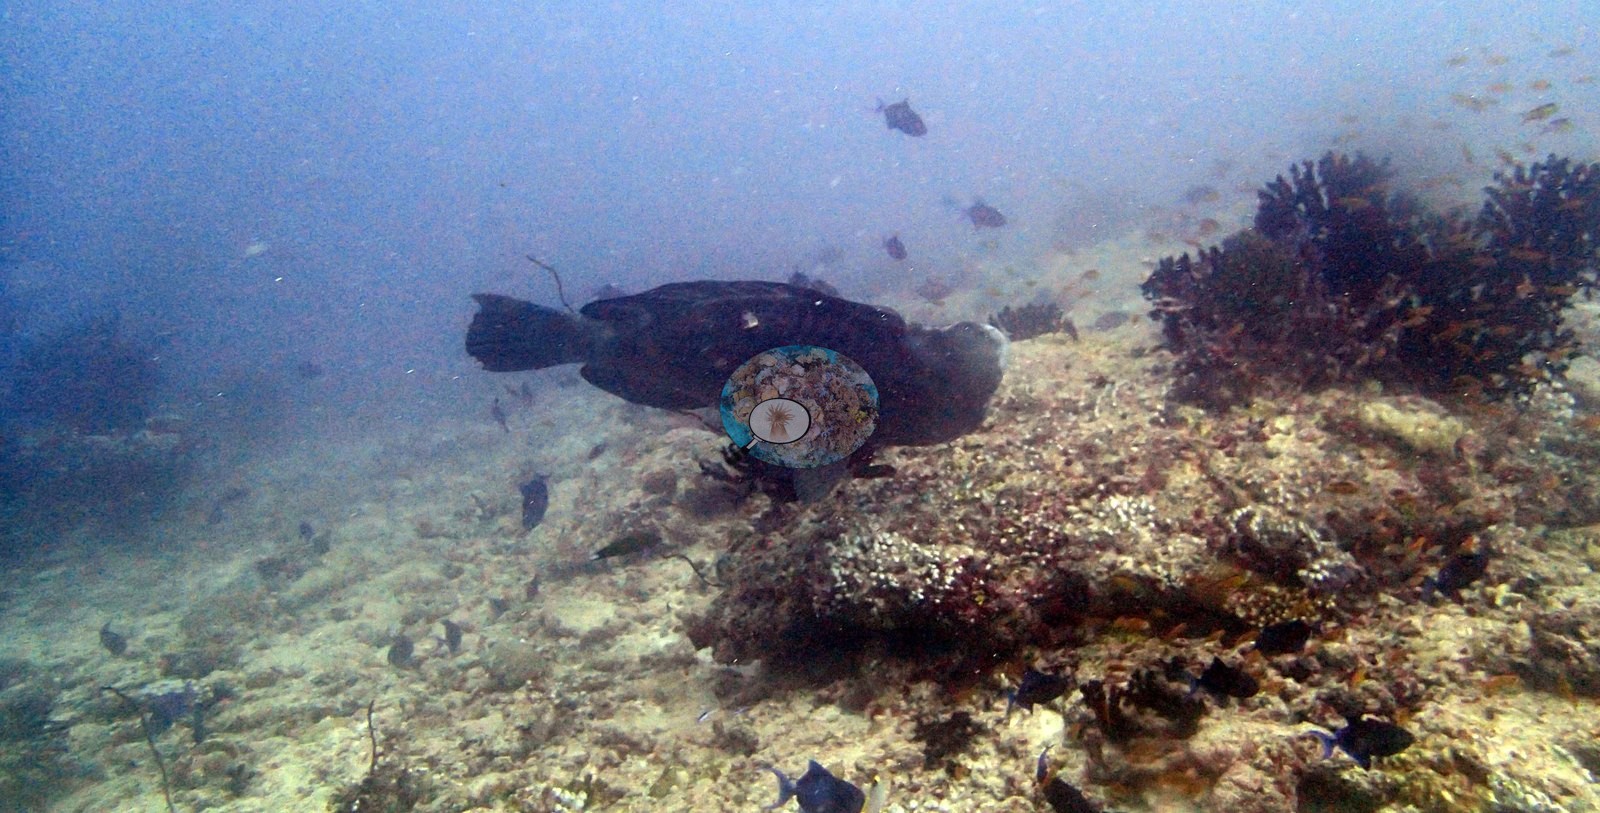
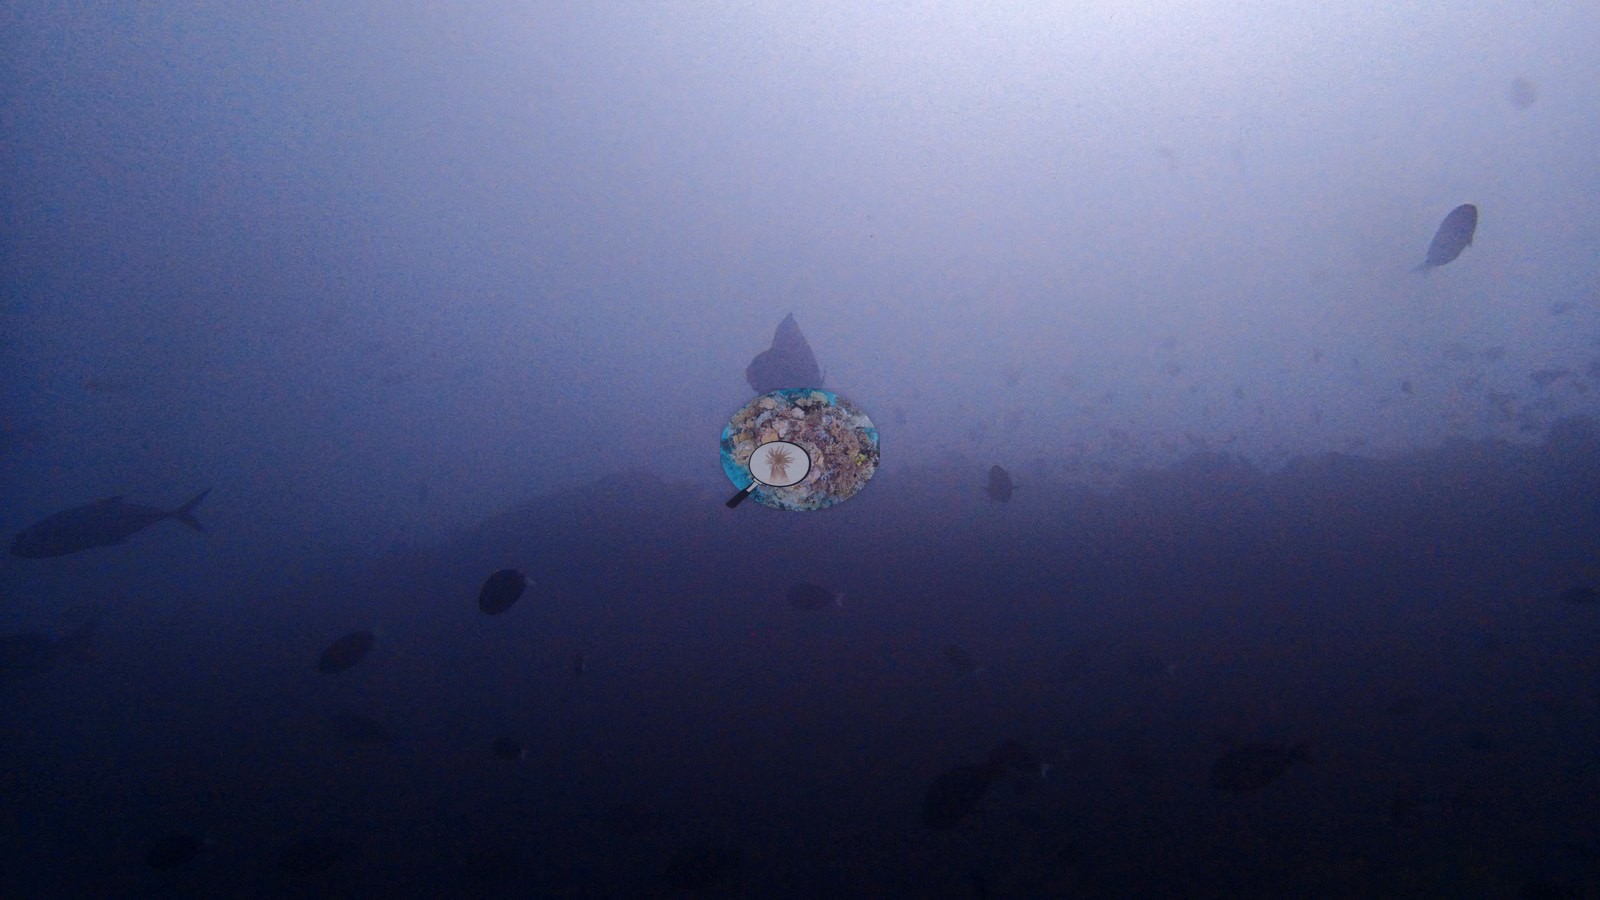
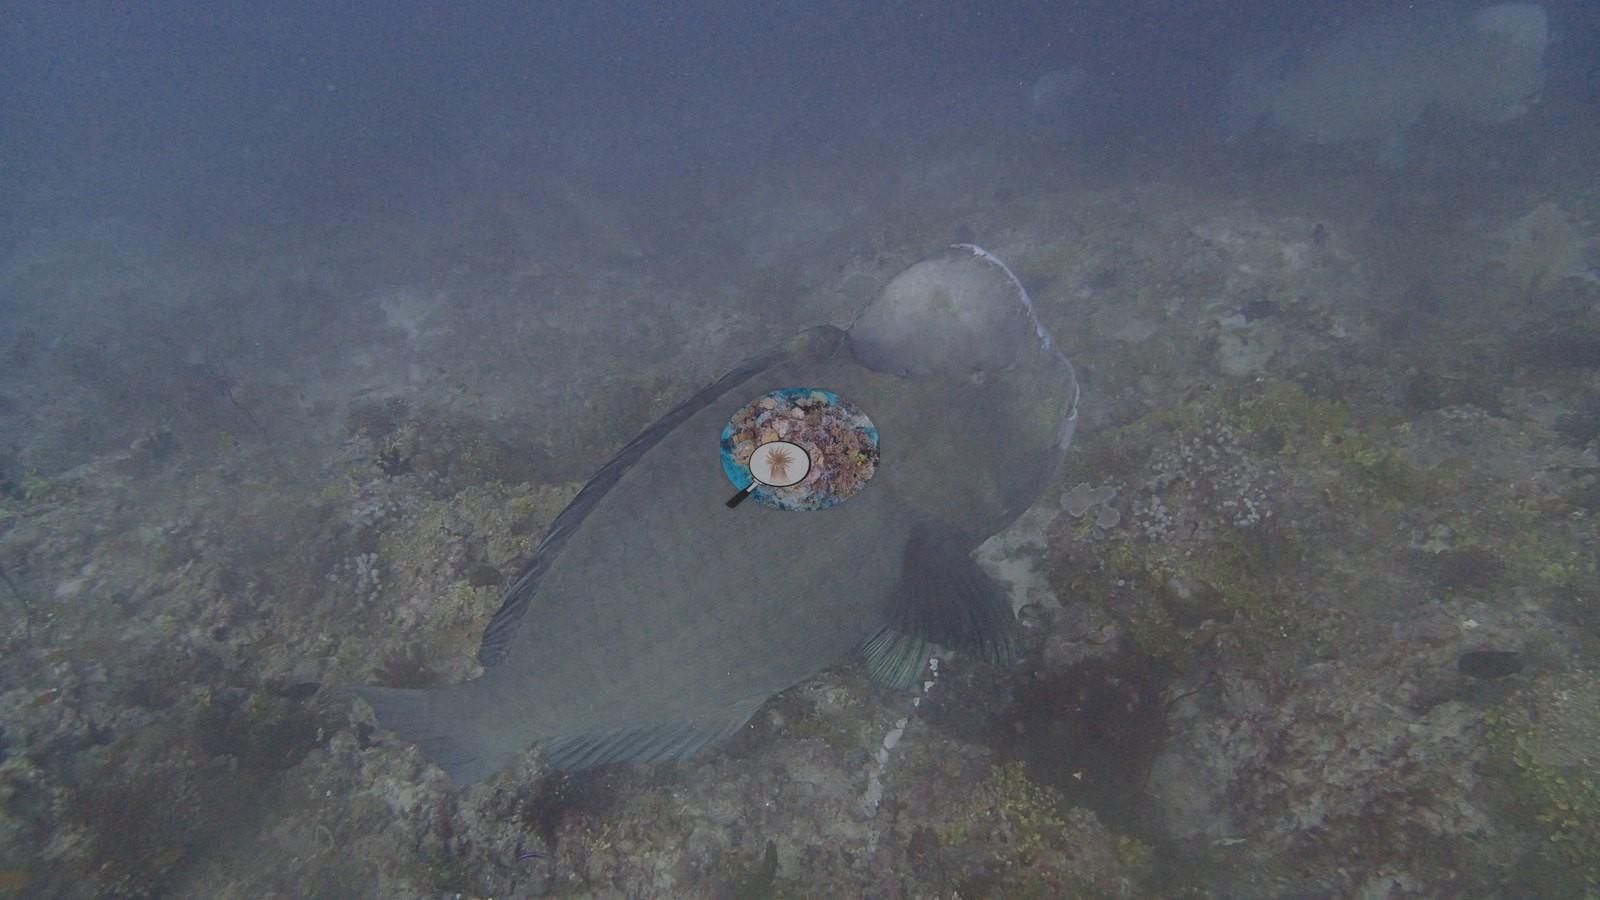
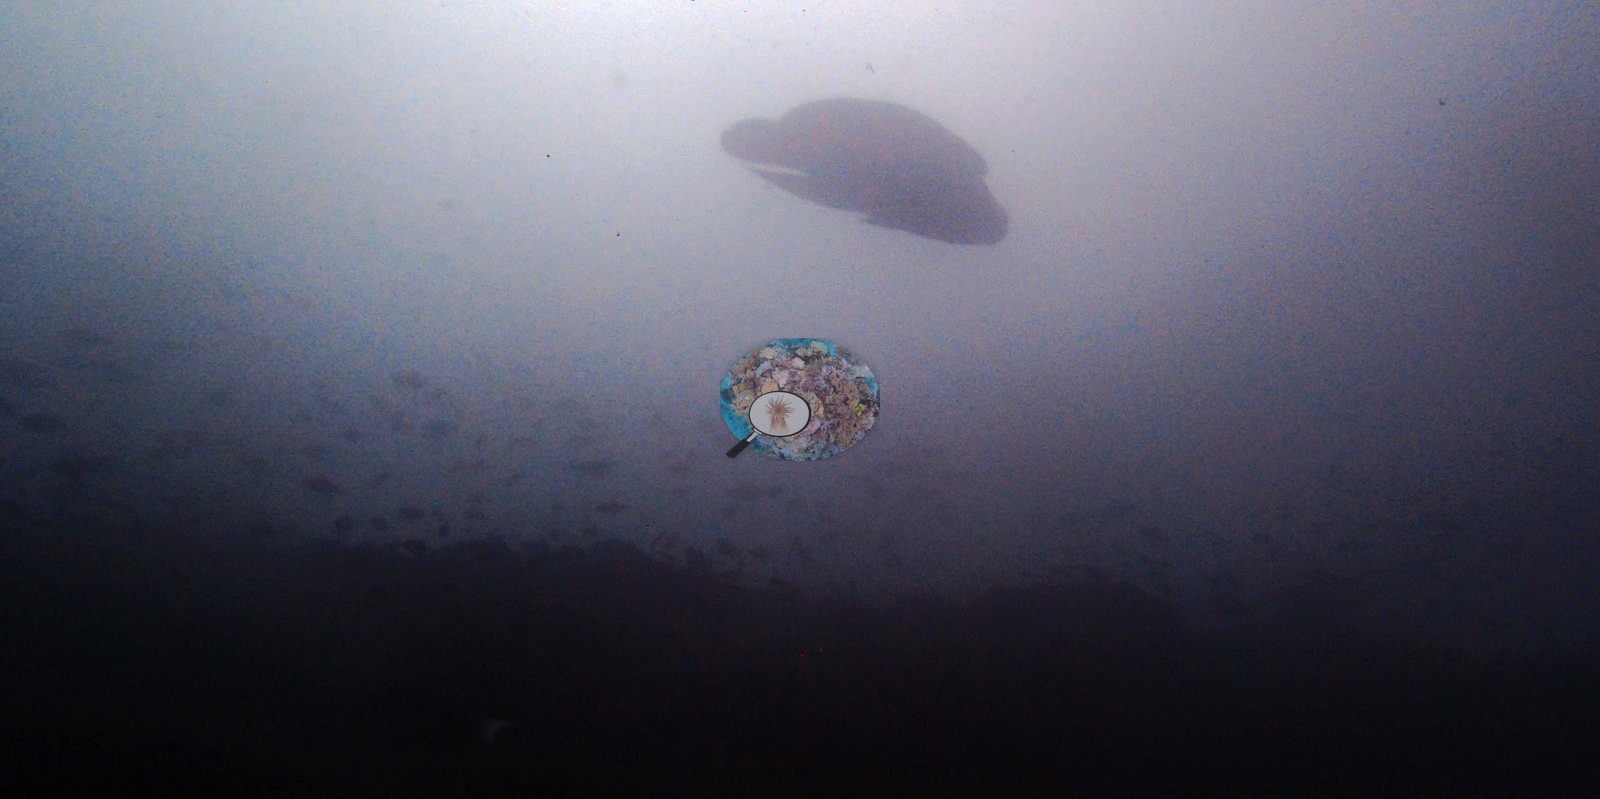
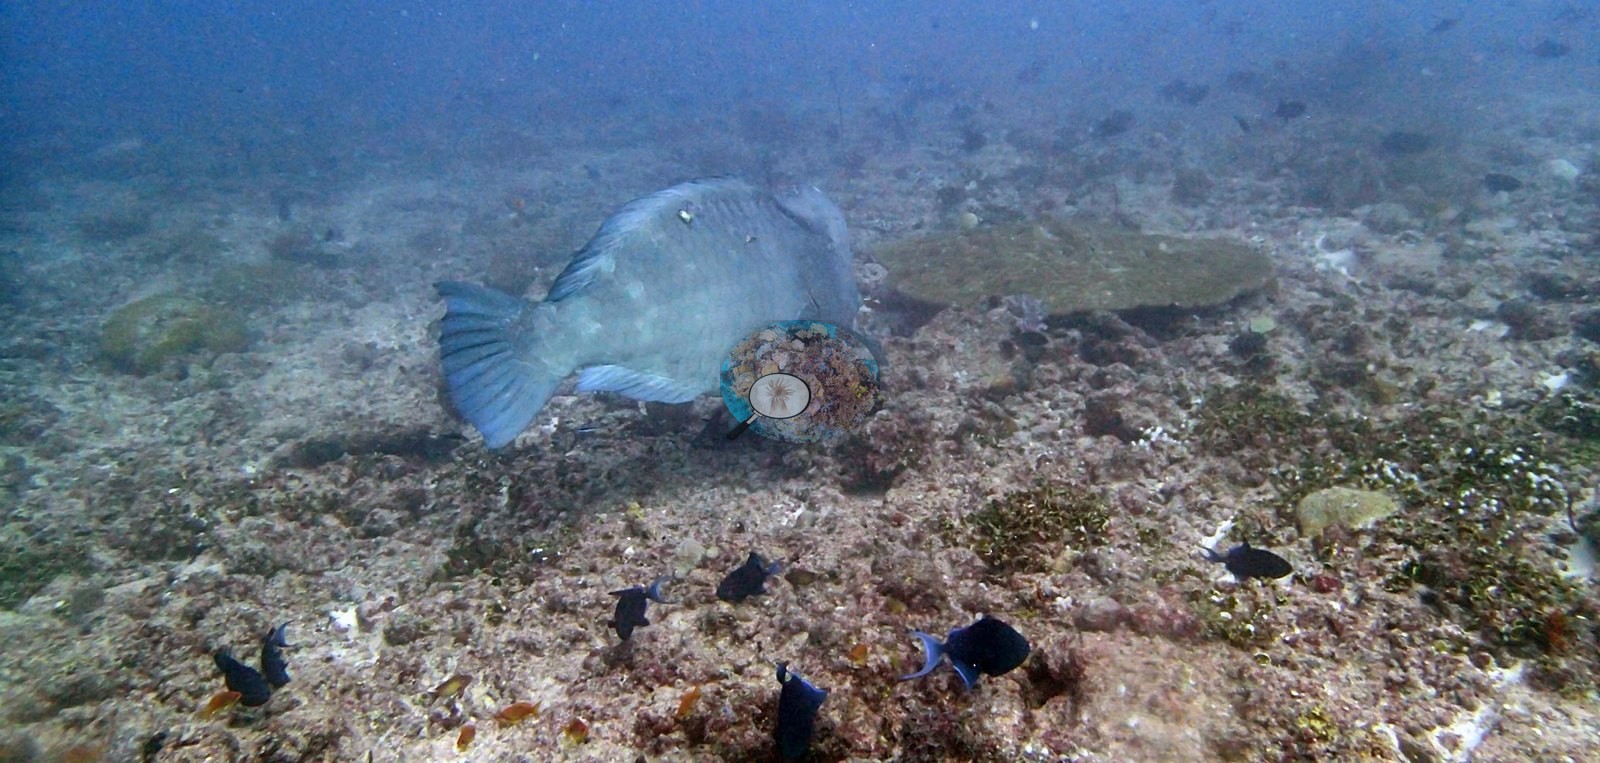
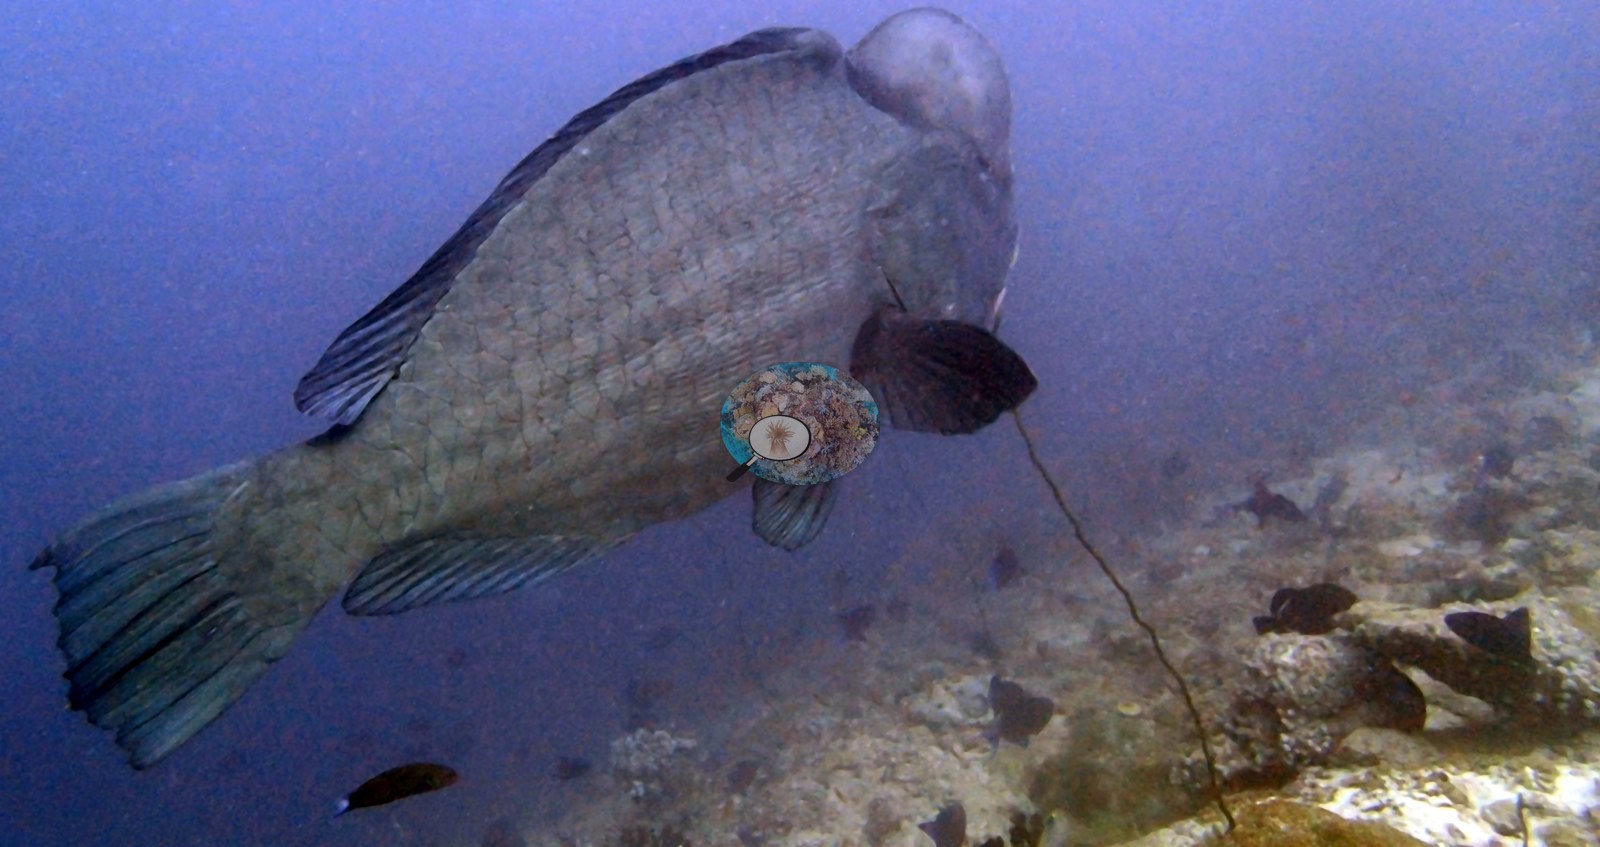
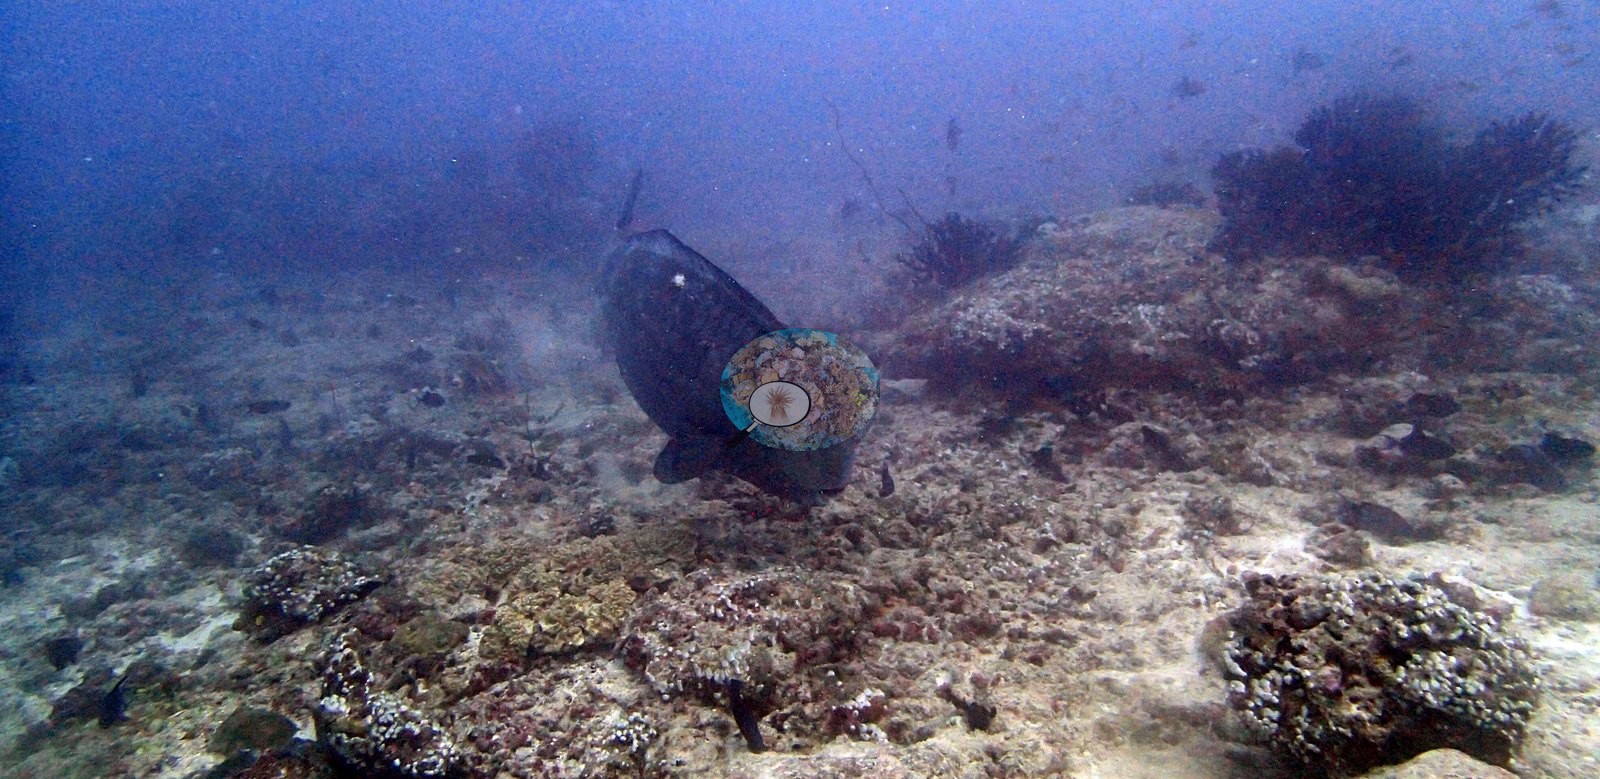
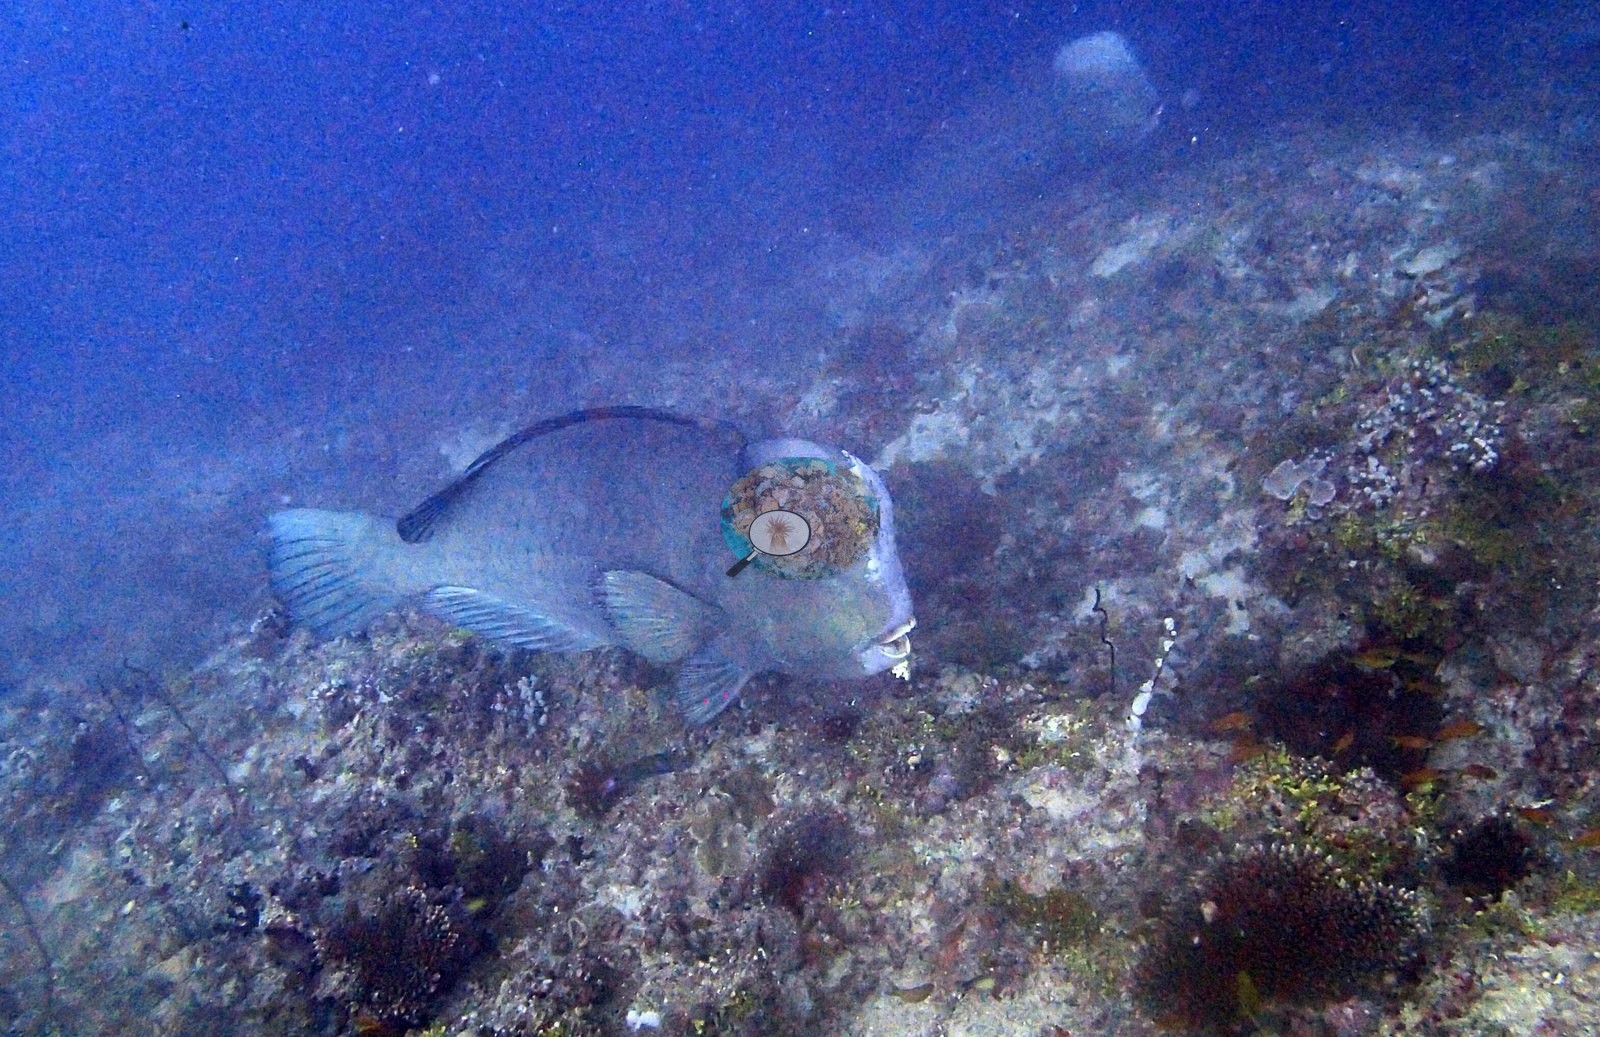
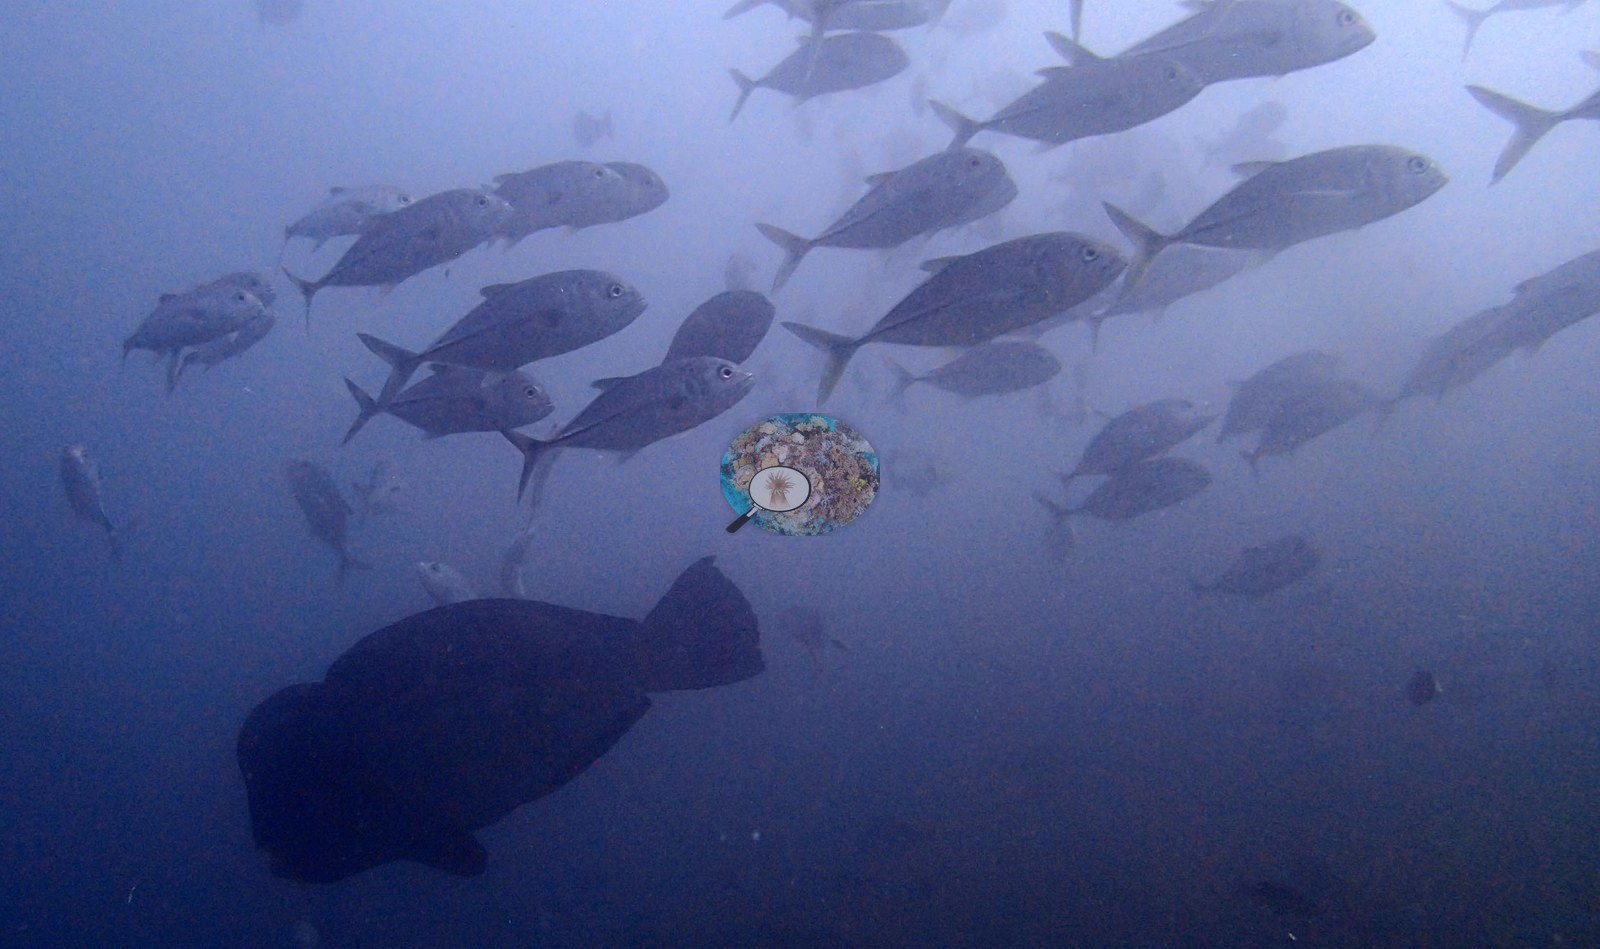
Out of the violet haze loomed the dive's monster: a bumphead parrotfish the size of a coffee table, photographed bulldozing the rubble and then point-blank, flank filling the frame (e.g., Image 6, Image 15).
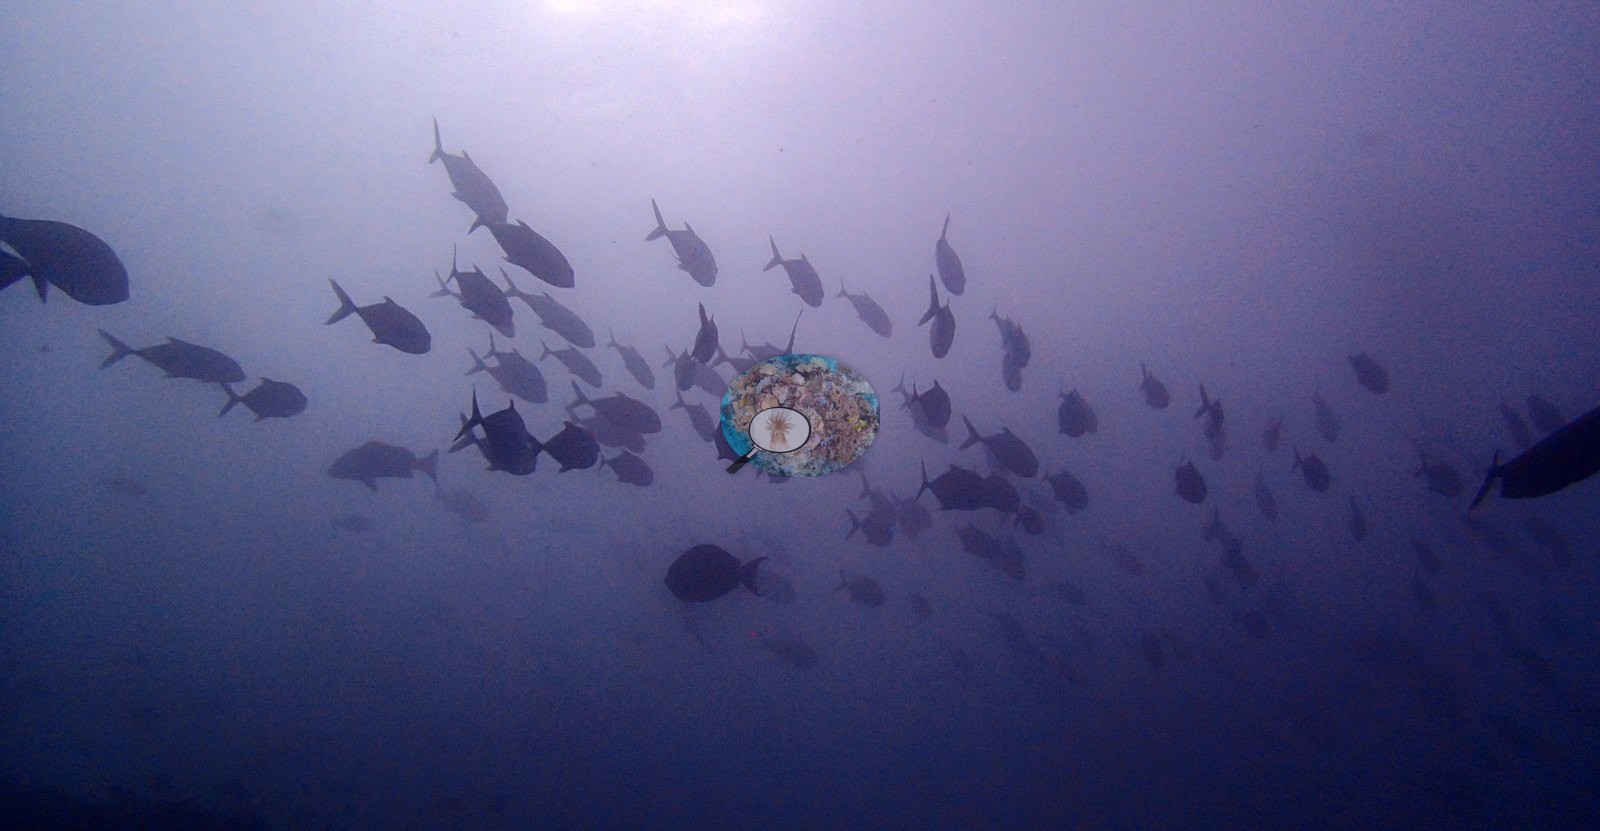
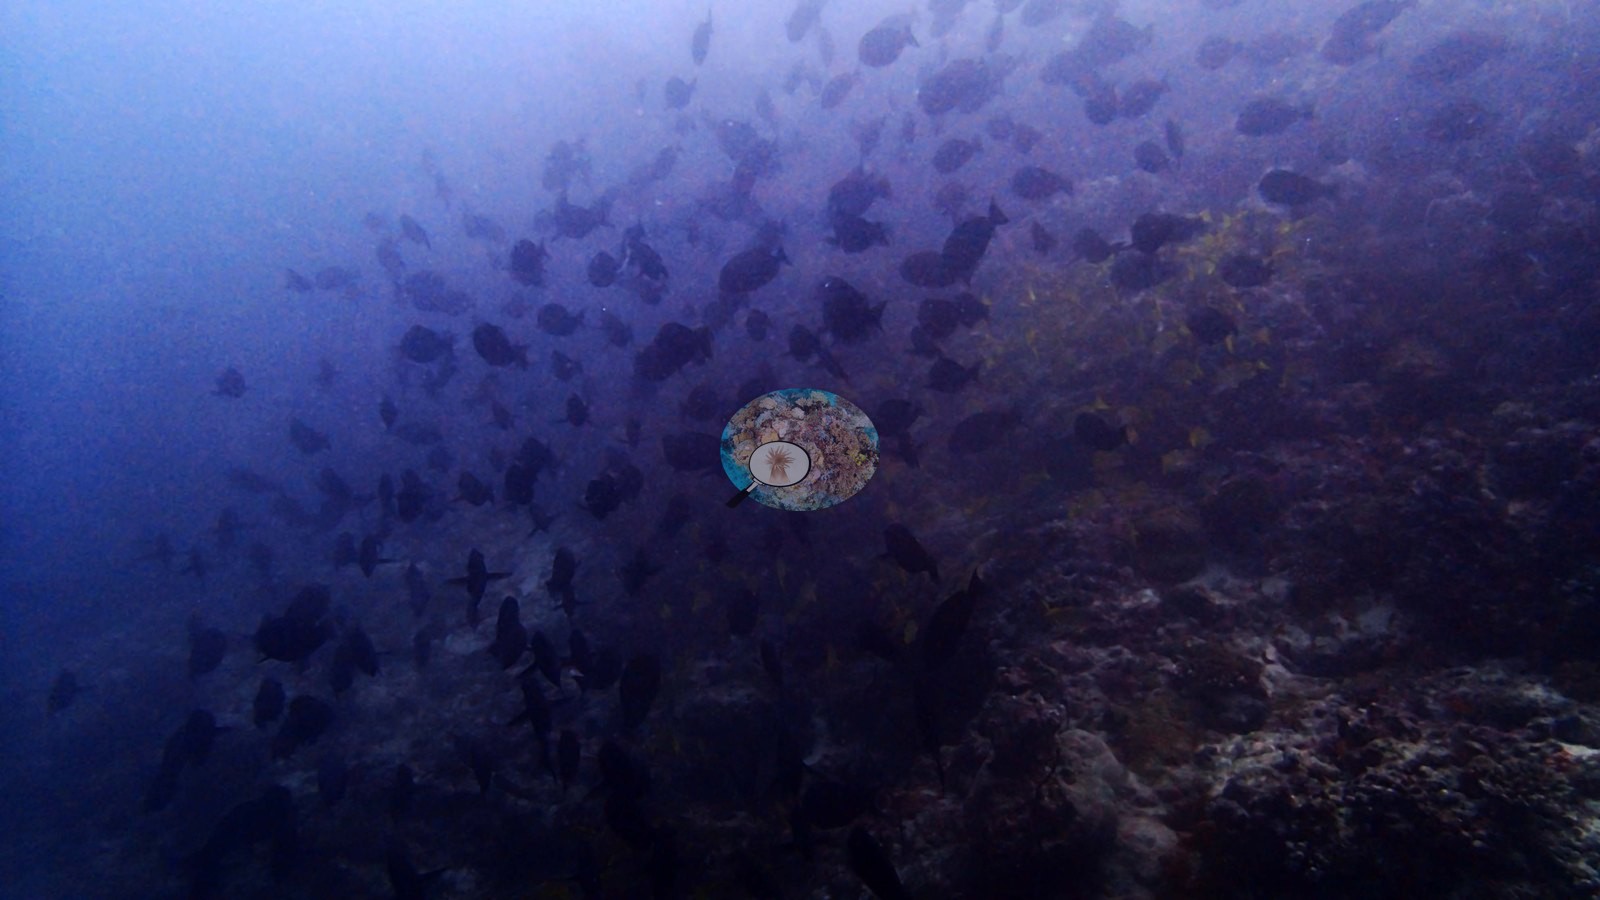
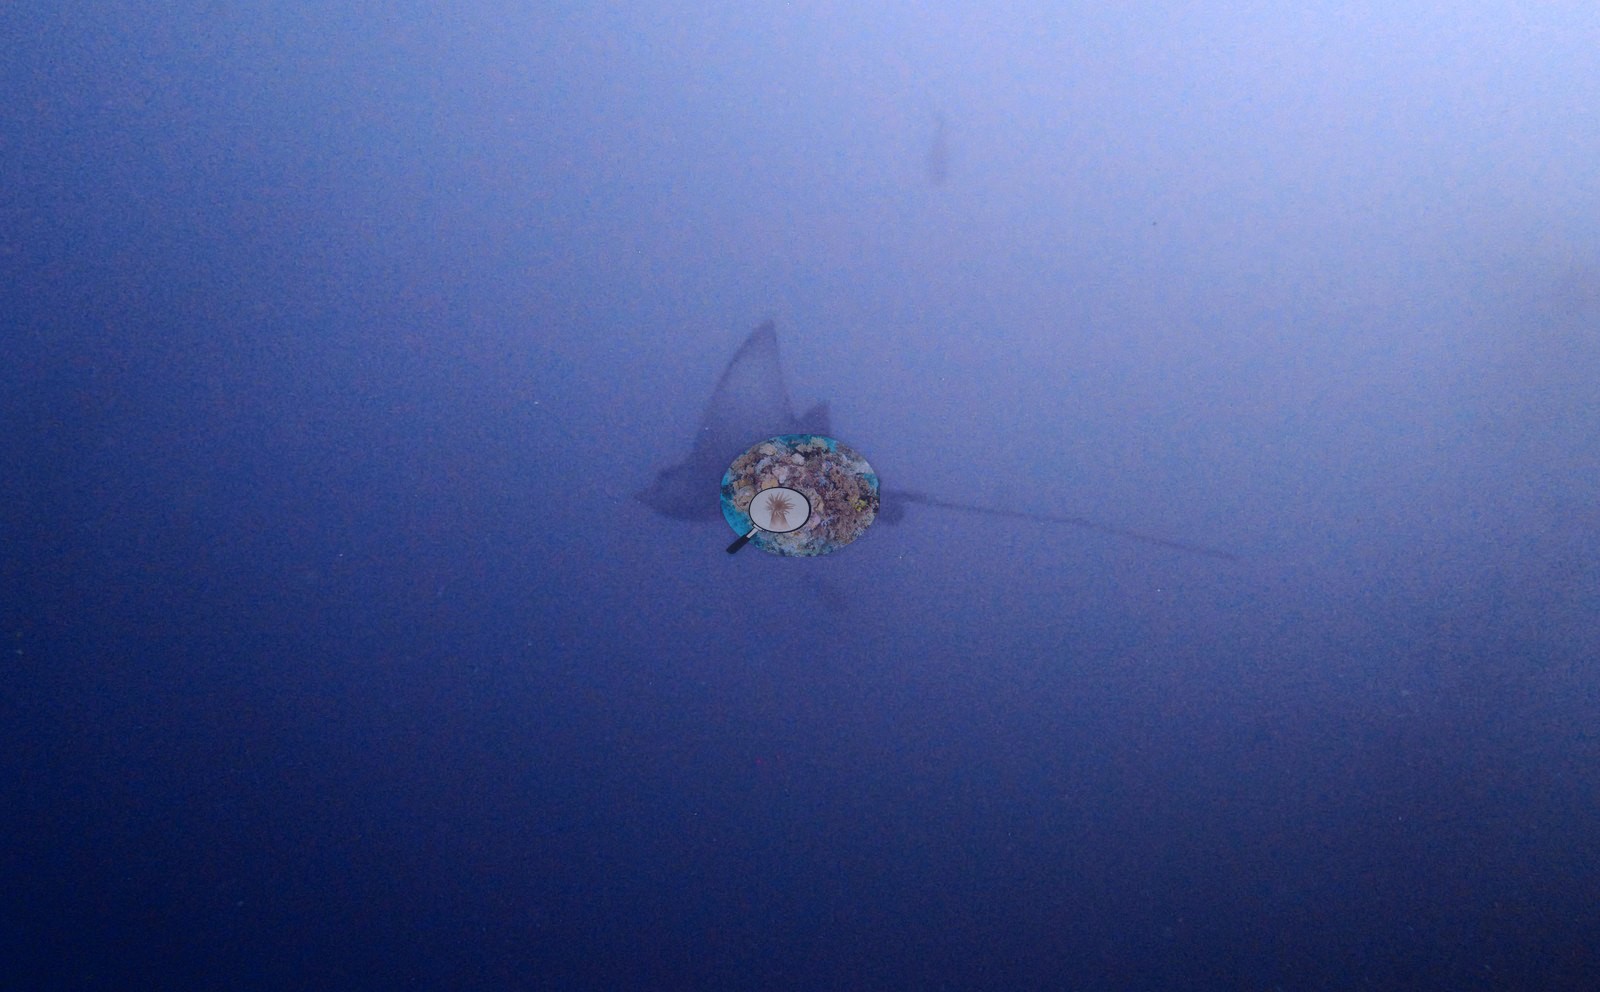
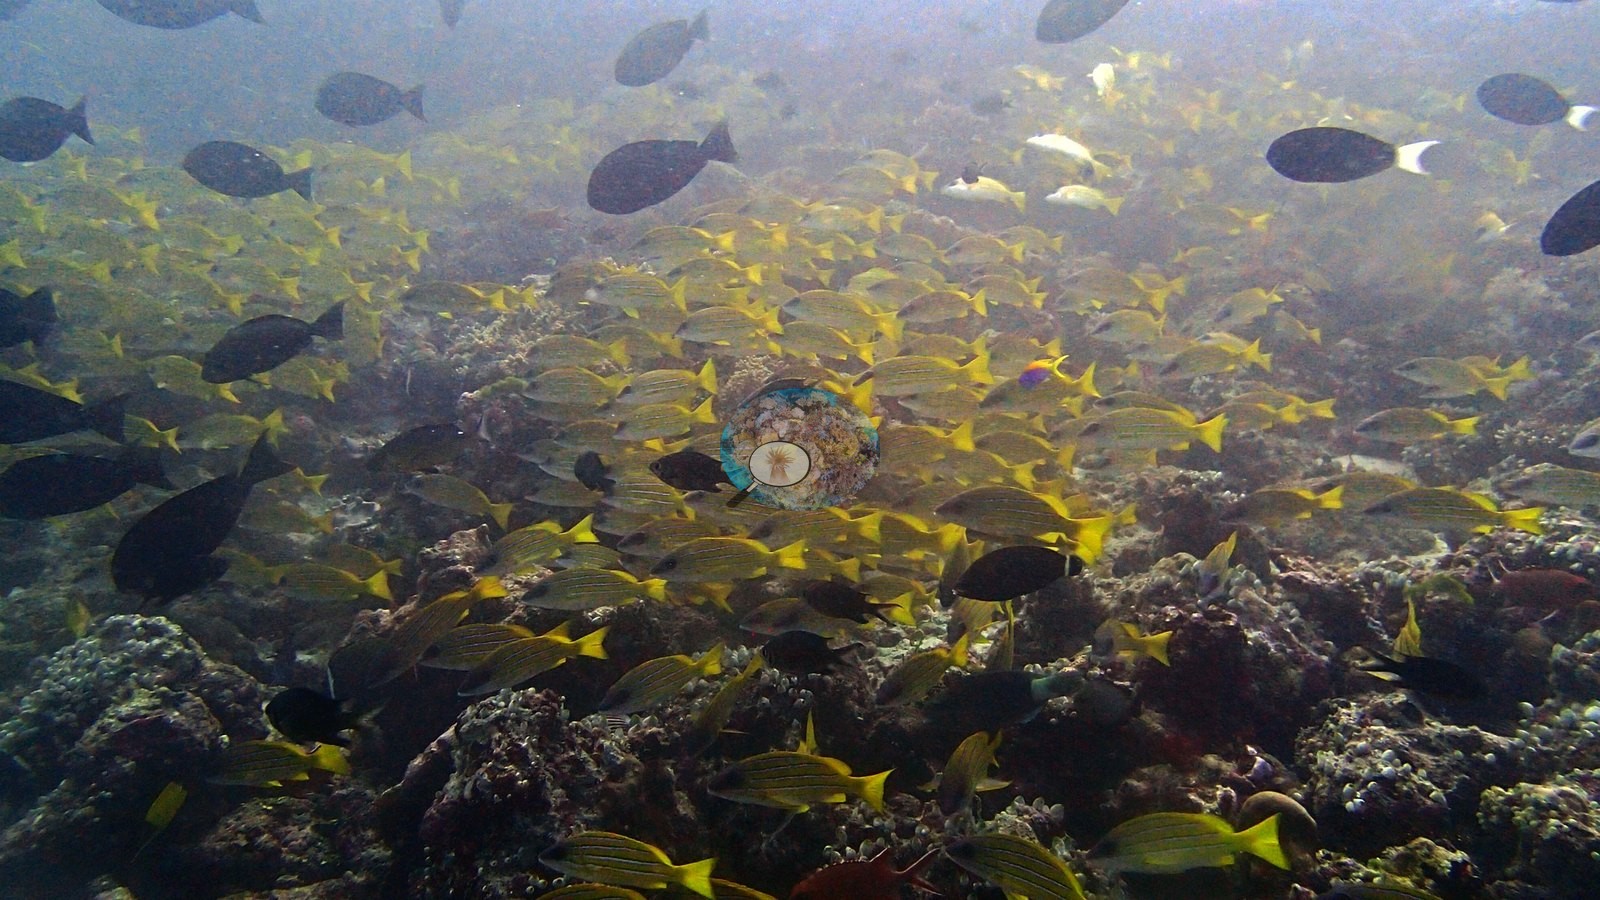
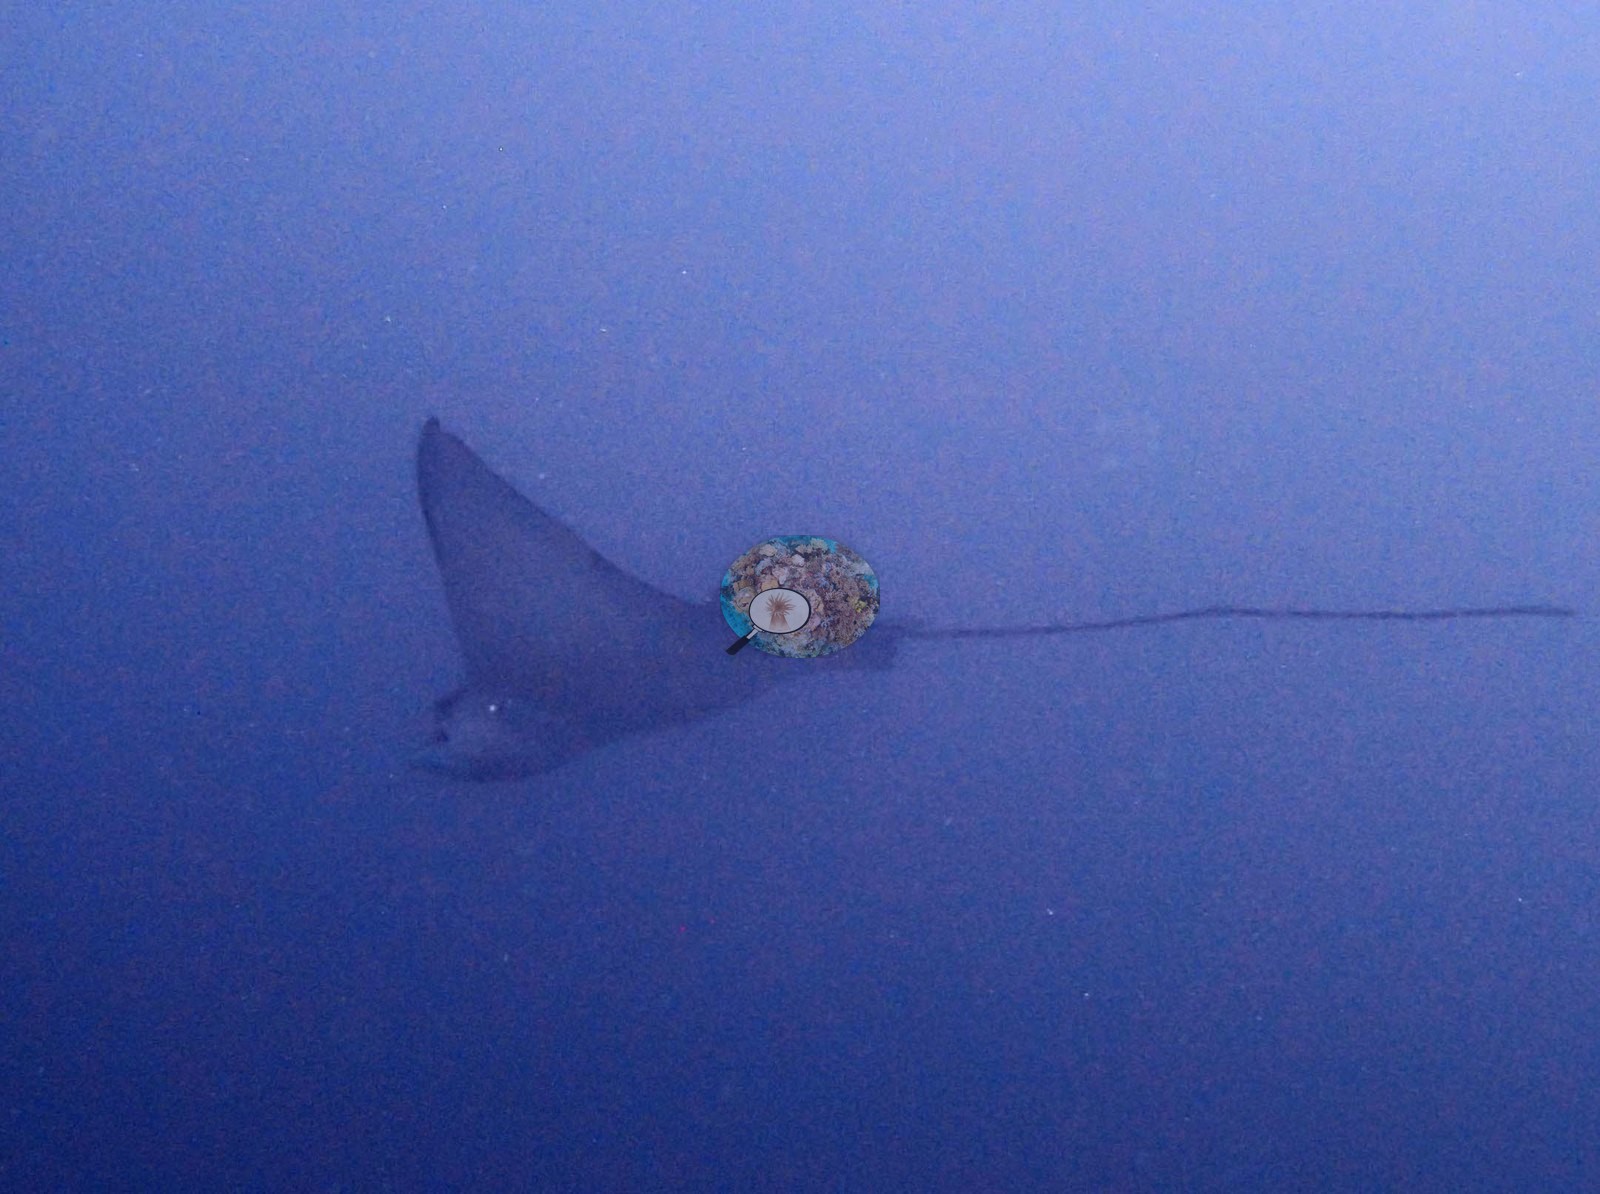
A Napoleon wrasse ghosted past twice, once trailing an entourage of jacks; spotted eagle rays sailed by on the edge of visibility; and a golden river of bluestripe-type snappers ran along the reef (e.g., Image 2, Image 9, Image 12, Image 17).
Comparisons with other data
A published figure above about 70% usually reflects the surveyors choosing the most coral-rich part of the reef, so read it as a best-patch number rather than a site mean.
Dive record
Twenty-eight minutes, barely any visibility — and one of the fishiest dives of the trip.
CV model comparison
More info
As of September 2026 no computer-vision method estimates coral cover accurately on new images, so treat this as indicative rather than a measurement; it is revised as the methods improve.More info
The published figure is the mean of the two methods.| Method | Hard-coral cover (%) |
|---|---|
| In-house DINOv3 | 10.3 |
| CoralSCOP | 12.7 |
| Mean (± SD) | 11.5 ± 1.7 |
| Range | 10.3–12.7 |
Mean ± SD and range are across the computer-vision methods shown.
Independent surveys nearby
| Agency / program | Year(s) | Stations / distance | Link |
|---|---|---|---|
| Montefalcone et al. (2020) | 2015 | 1 station, 1.16 km | Records ↓ |
| Reef Check | 2022 | 1 station, 0.98 km | Records ↓ |
| XL Catlin Seaview Survey | 2017 | 1 station, 5.00 km | Records ↓ |
 Dr. Coral (CRD)Year-average (no detectable trend)
Within 5 km, 3 independent survey stations recorded hard coral cover in 3 records between 2015 and 2022. One survey since 2021 recorded 19%. This site's own estimate (12%) sits 7.9 points below the recent value (19%); the methods differ, so the comparison is context, not a like-for-like test.
Collected by other programs using different methods (Reef Check uses point-intercept transects; the XL Catlin Seaview Survey uses photo-transects with automated image annotation), so these are context for the figures above, not a like-for-like comparison. Where a station was surveyed more than once the range is shown. Station names are not dive-site names. Values marked best patch exceed 70%: surveyors usually chose the richest area, so they are not site means.
| Agency | Site / location | Date | Hard coral cover (%) | Distance | Link |
|---|---|---|---|---|---|
| Montefalcone et al. (2020) | Cocoa Corner | 2015 | 76% best patch | 1.16 km | HeatCRD database |
| XL Catlin Seaview Survey | transect 37035 | 2017 | 5.5% | 5.00 km | — |
| Reef Check | Gulhi Island Backreef | 2022 | 19% | 0.98 km | — |
Data & links
All images from Coral Reef Diagnostics. Data are from Coral Reef Diagnostics and the organizations named in the data-sources table above.
© Coral Reef Diagnostics.