
Maldives - Stage

Part of the regional summaries: Maldives - Central (Male Atolls / Ari / Vaavu) and Maldives
More info
Maldives (NOAA CRW virtual station) · Maldives ecoregion mean=2.9°C-heating weeksStage is a shallow Maldivian coral flat of pale pavement and sand dotted every meter or so with sturdy cauliflower, staghorn, and honeycomb-type colonies, including one almost fluorescent-green branching coral. Photographed healthy along research transects in January 2016, the reef was hit hard when the El Nino heatwave peaked that April, with more than nine in ten colonies bleached.
Two independent survey stations shown with the program’s logo — click one to see how far it is from this site.
Eight other CRD dive sites within 5 km shown in orange — click a marker to open its page.
7 of these 41 photographs are shown beside the text that discusses them under "Site description" below.
Site description
Setting
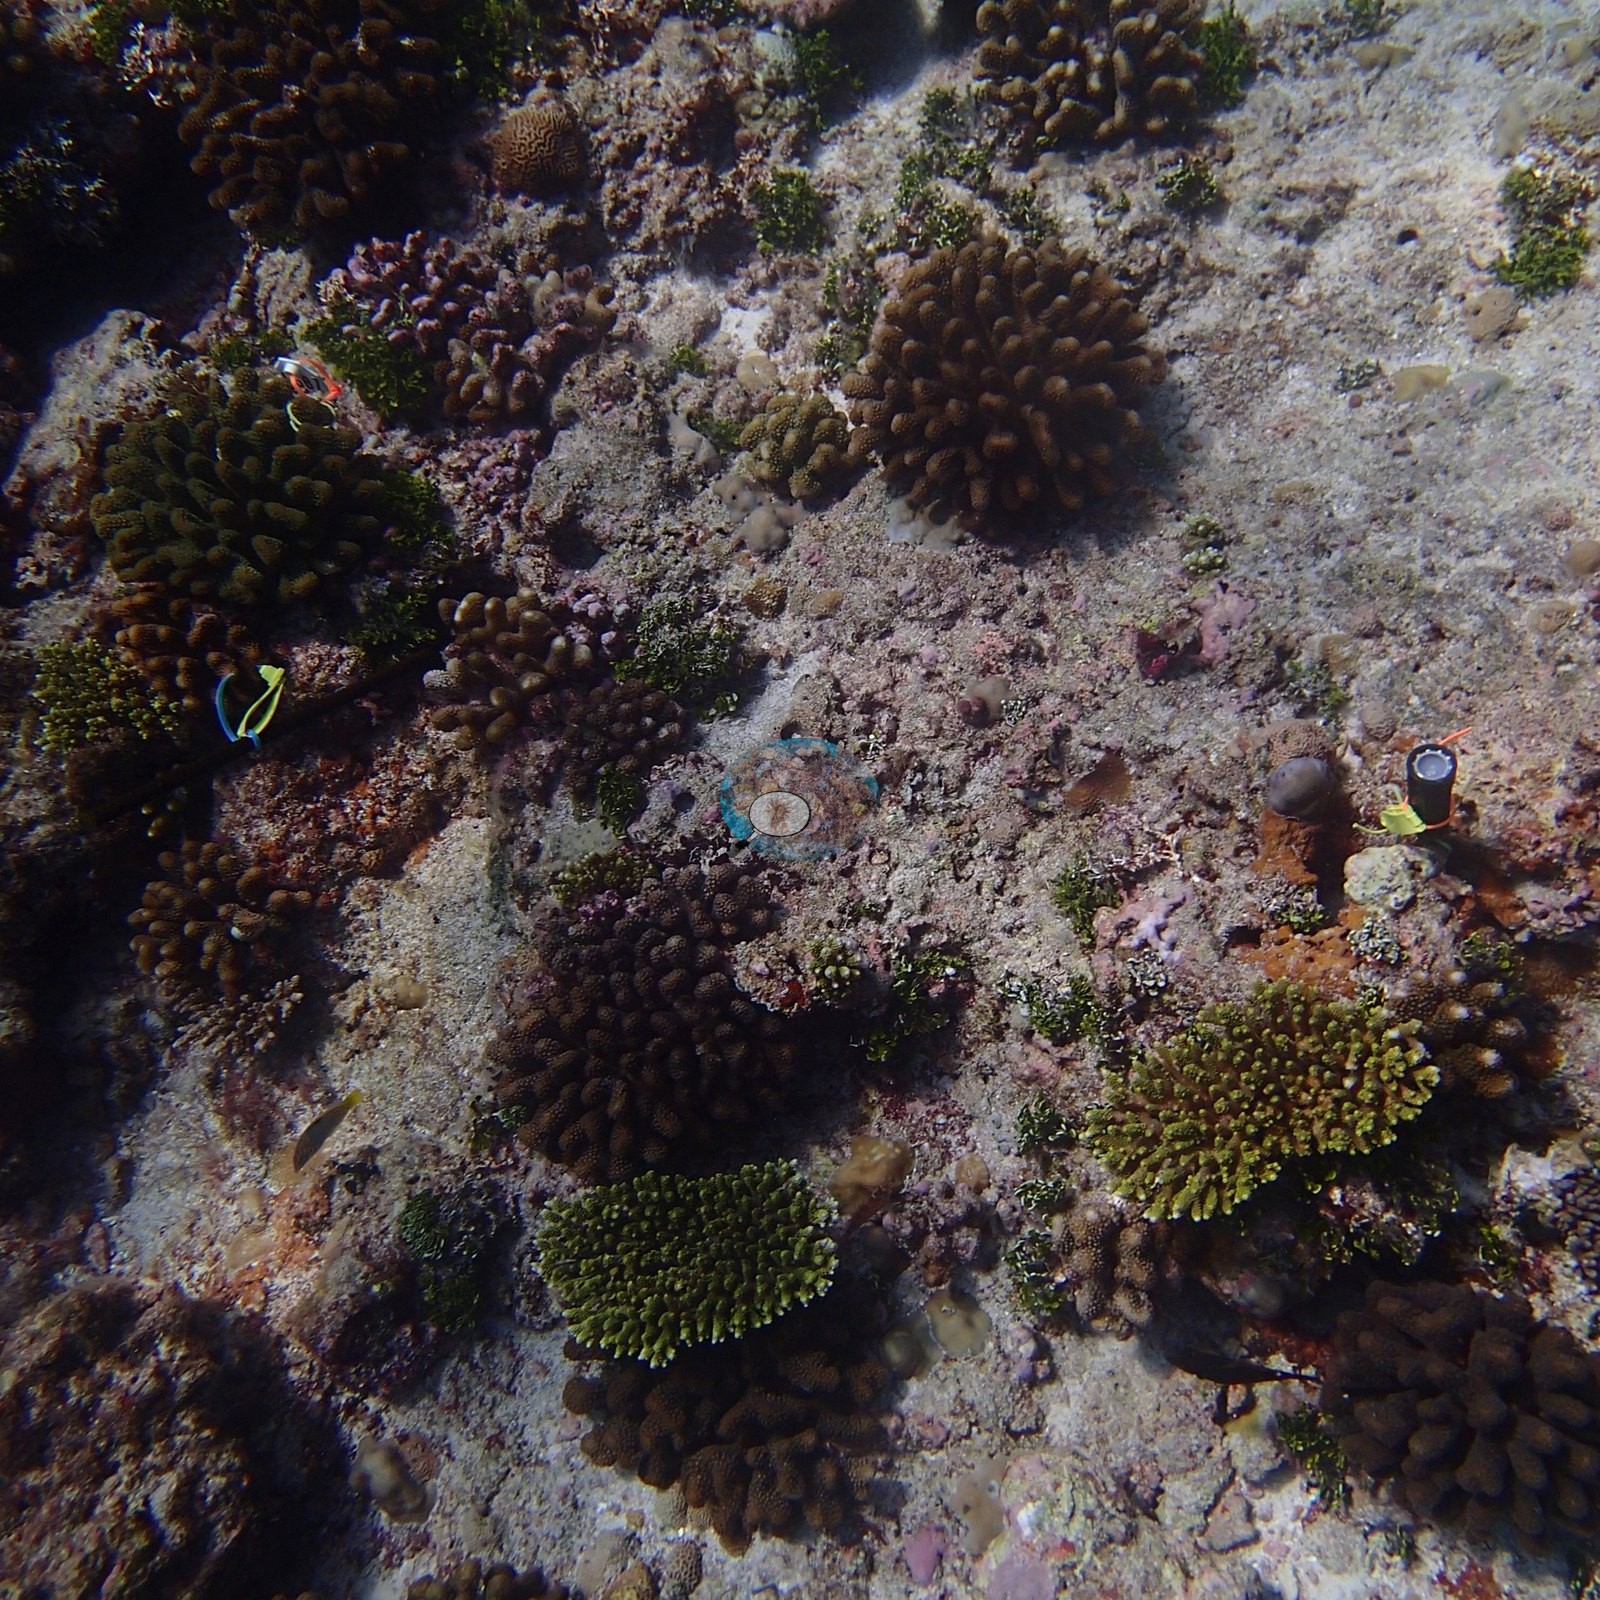
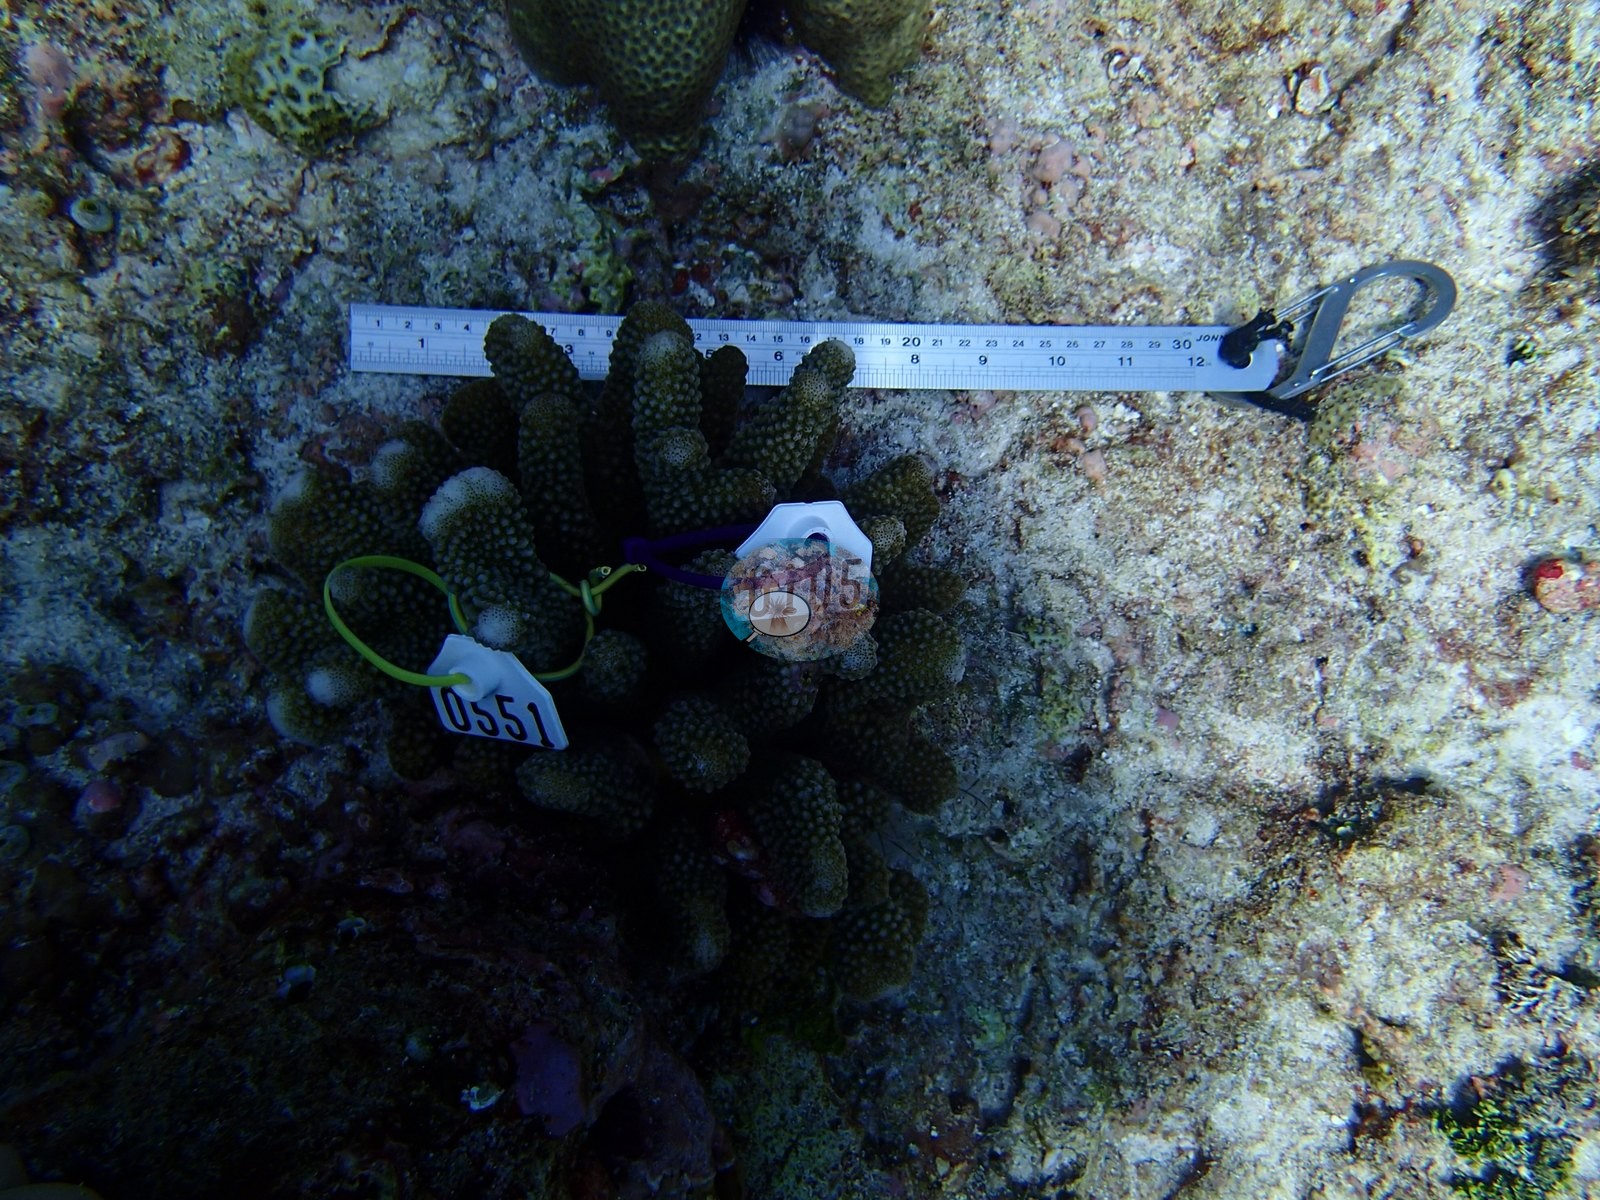
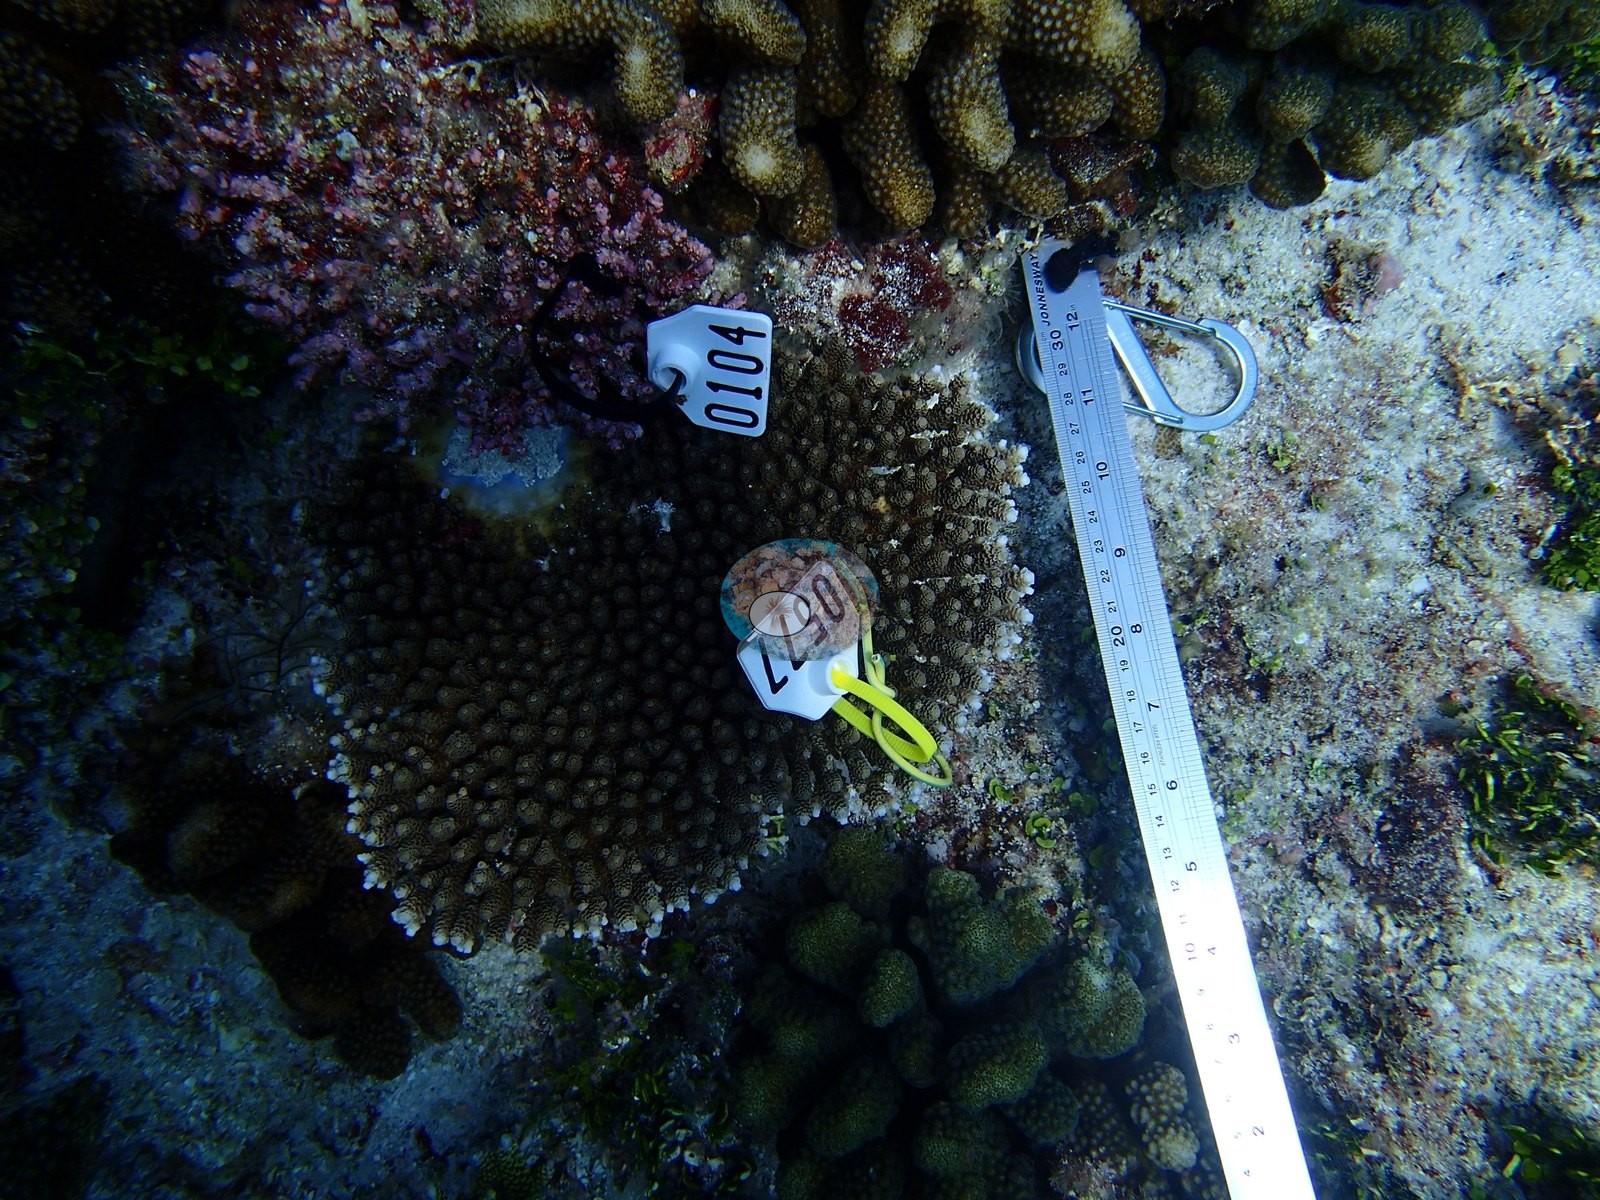
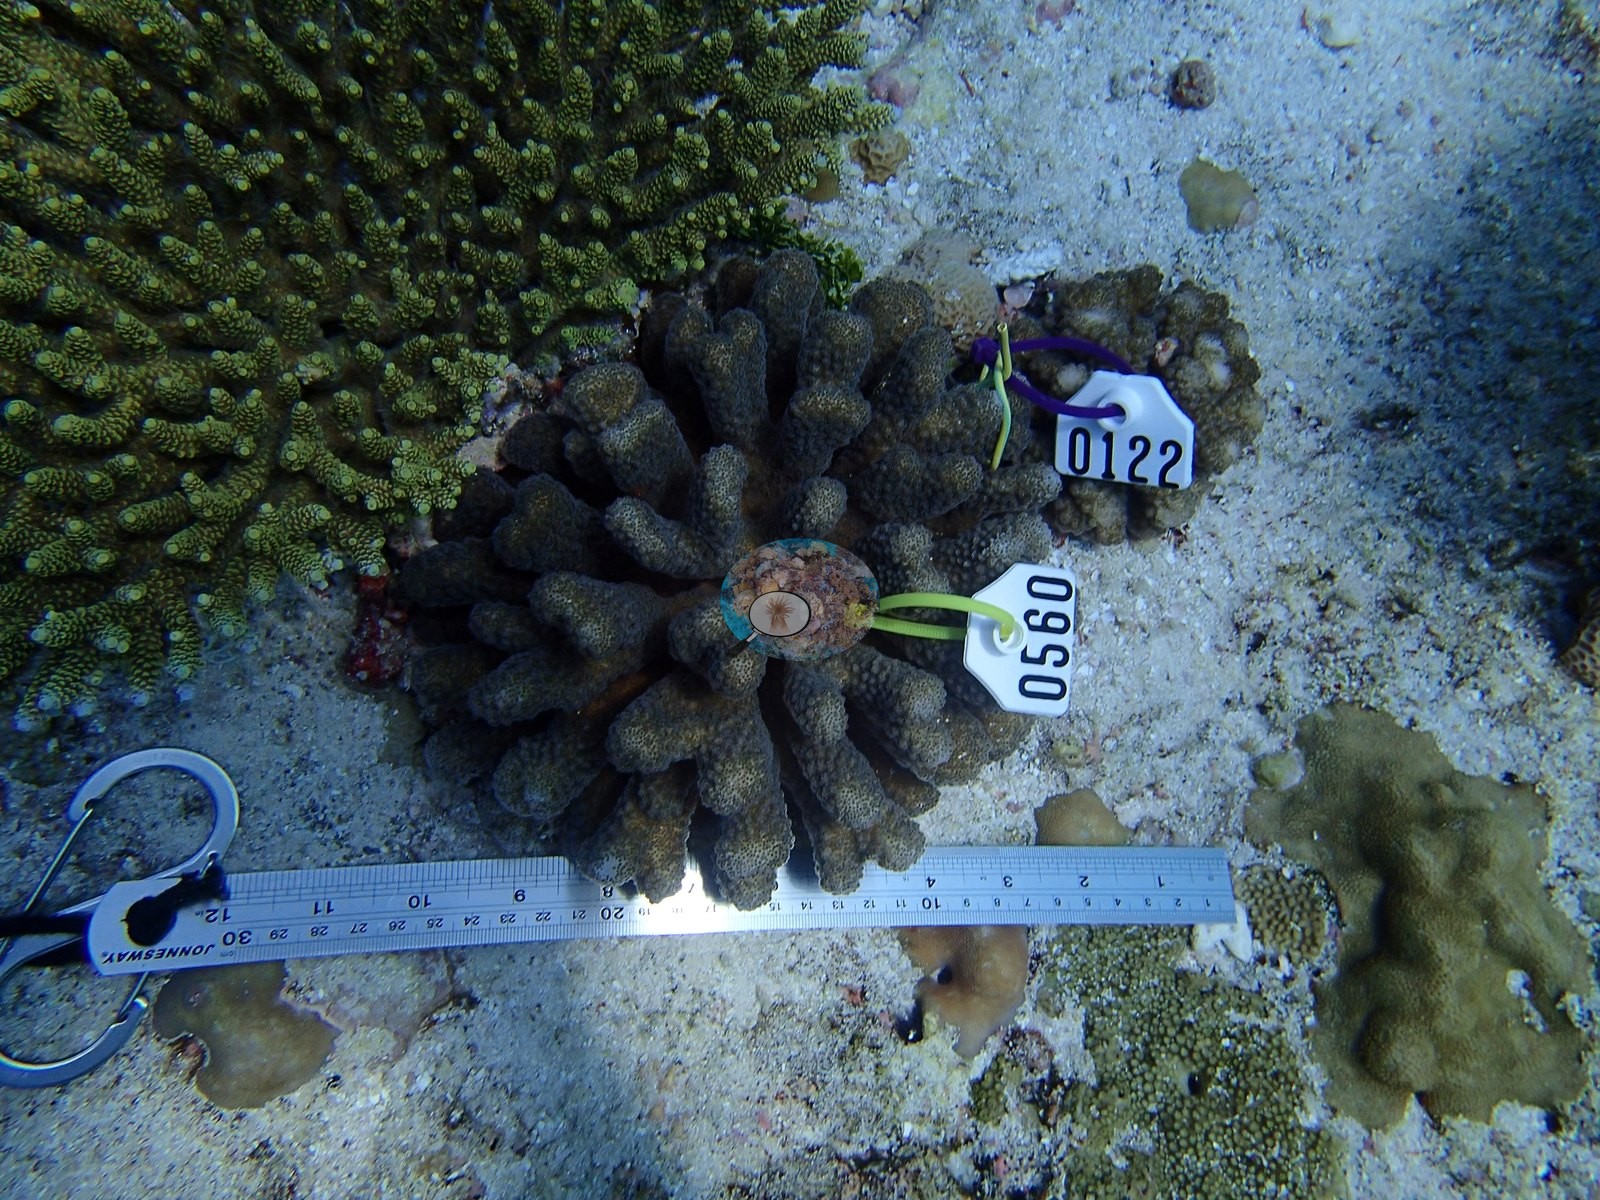
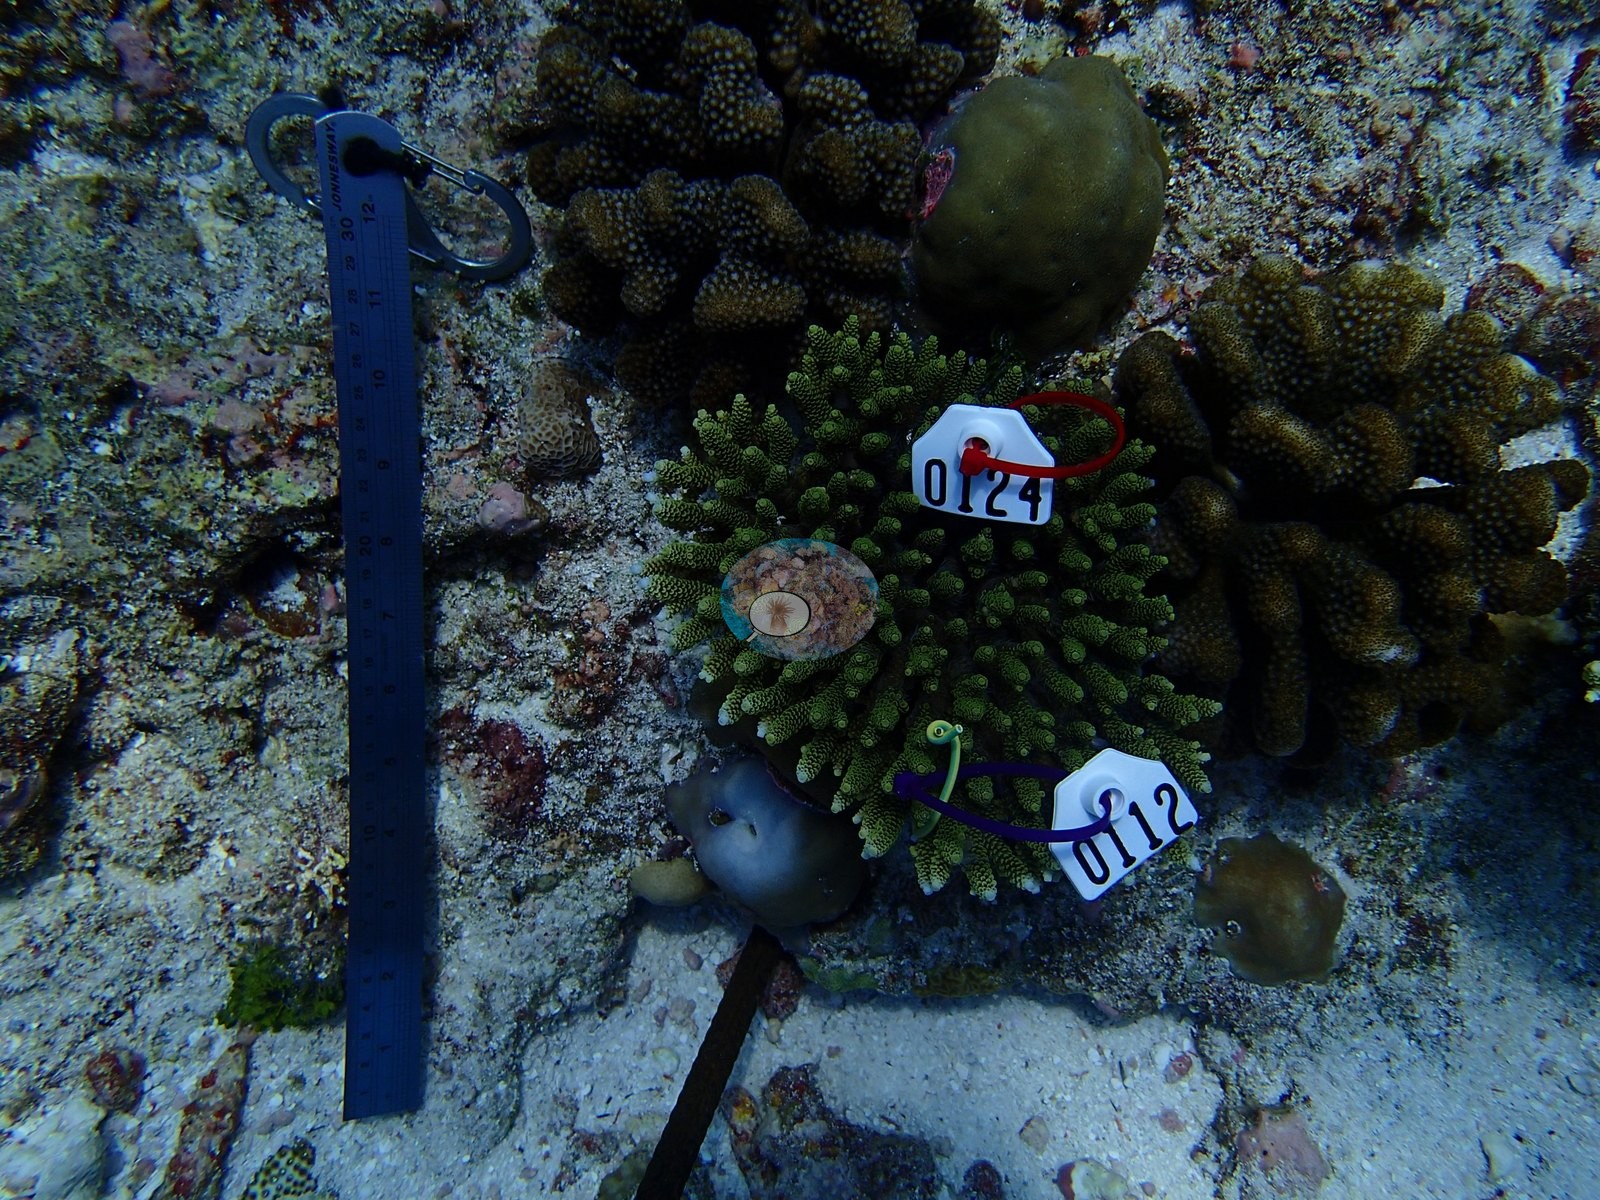
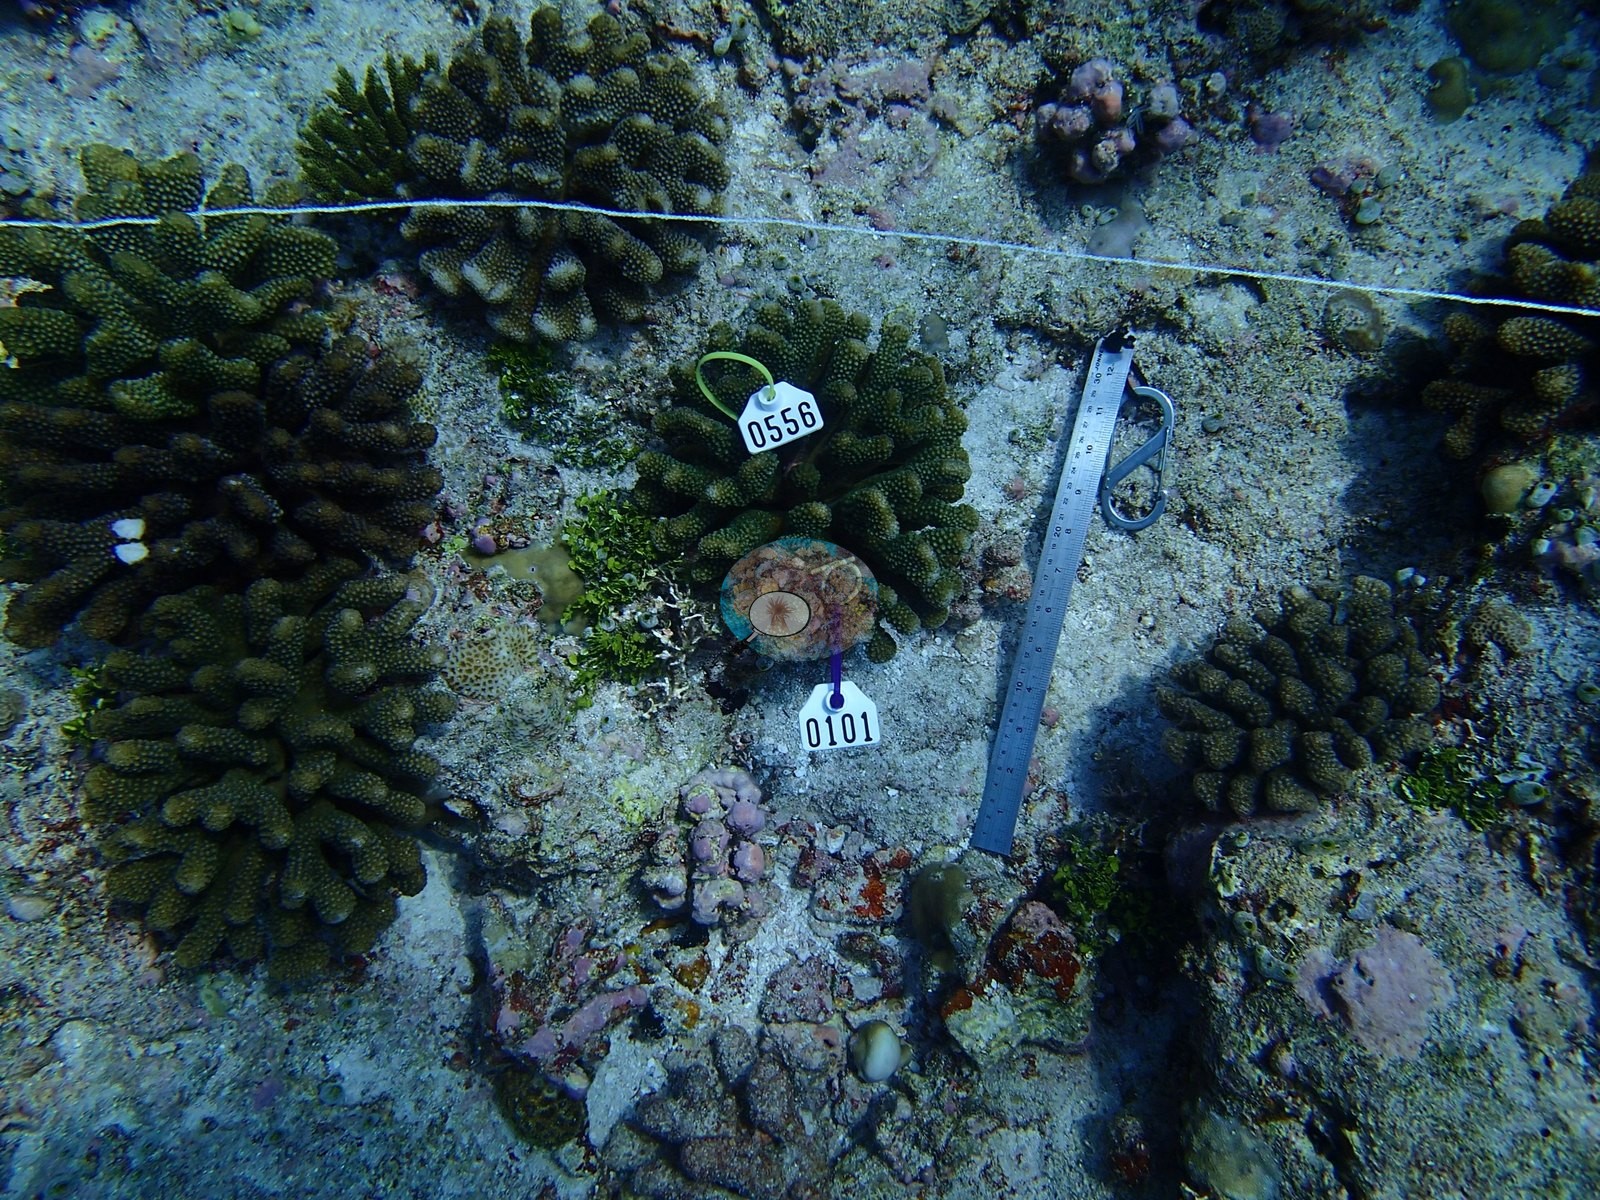
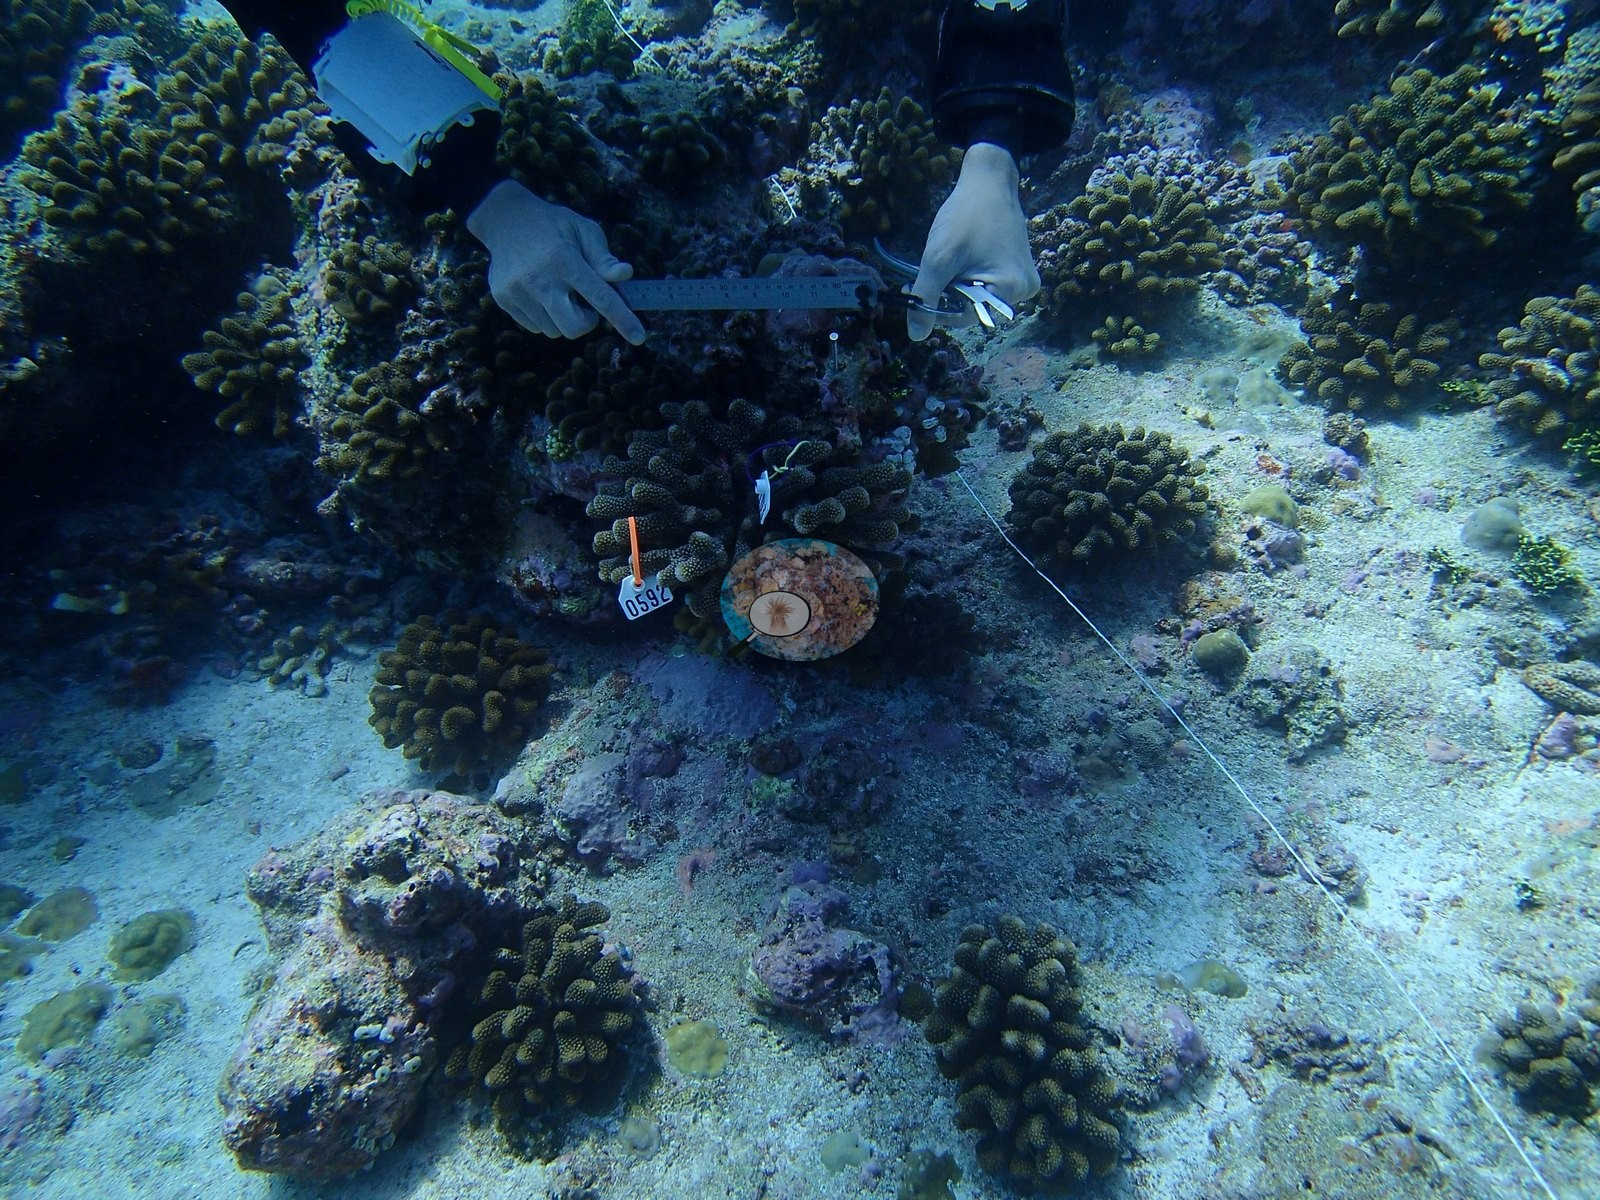
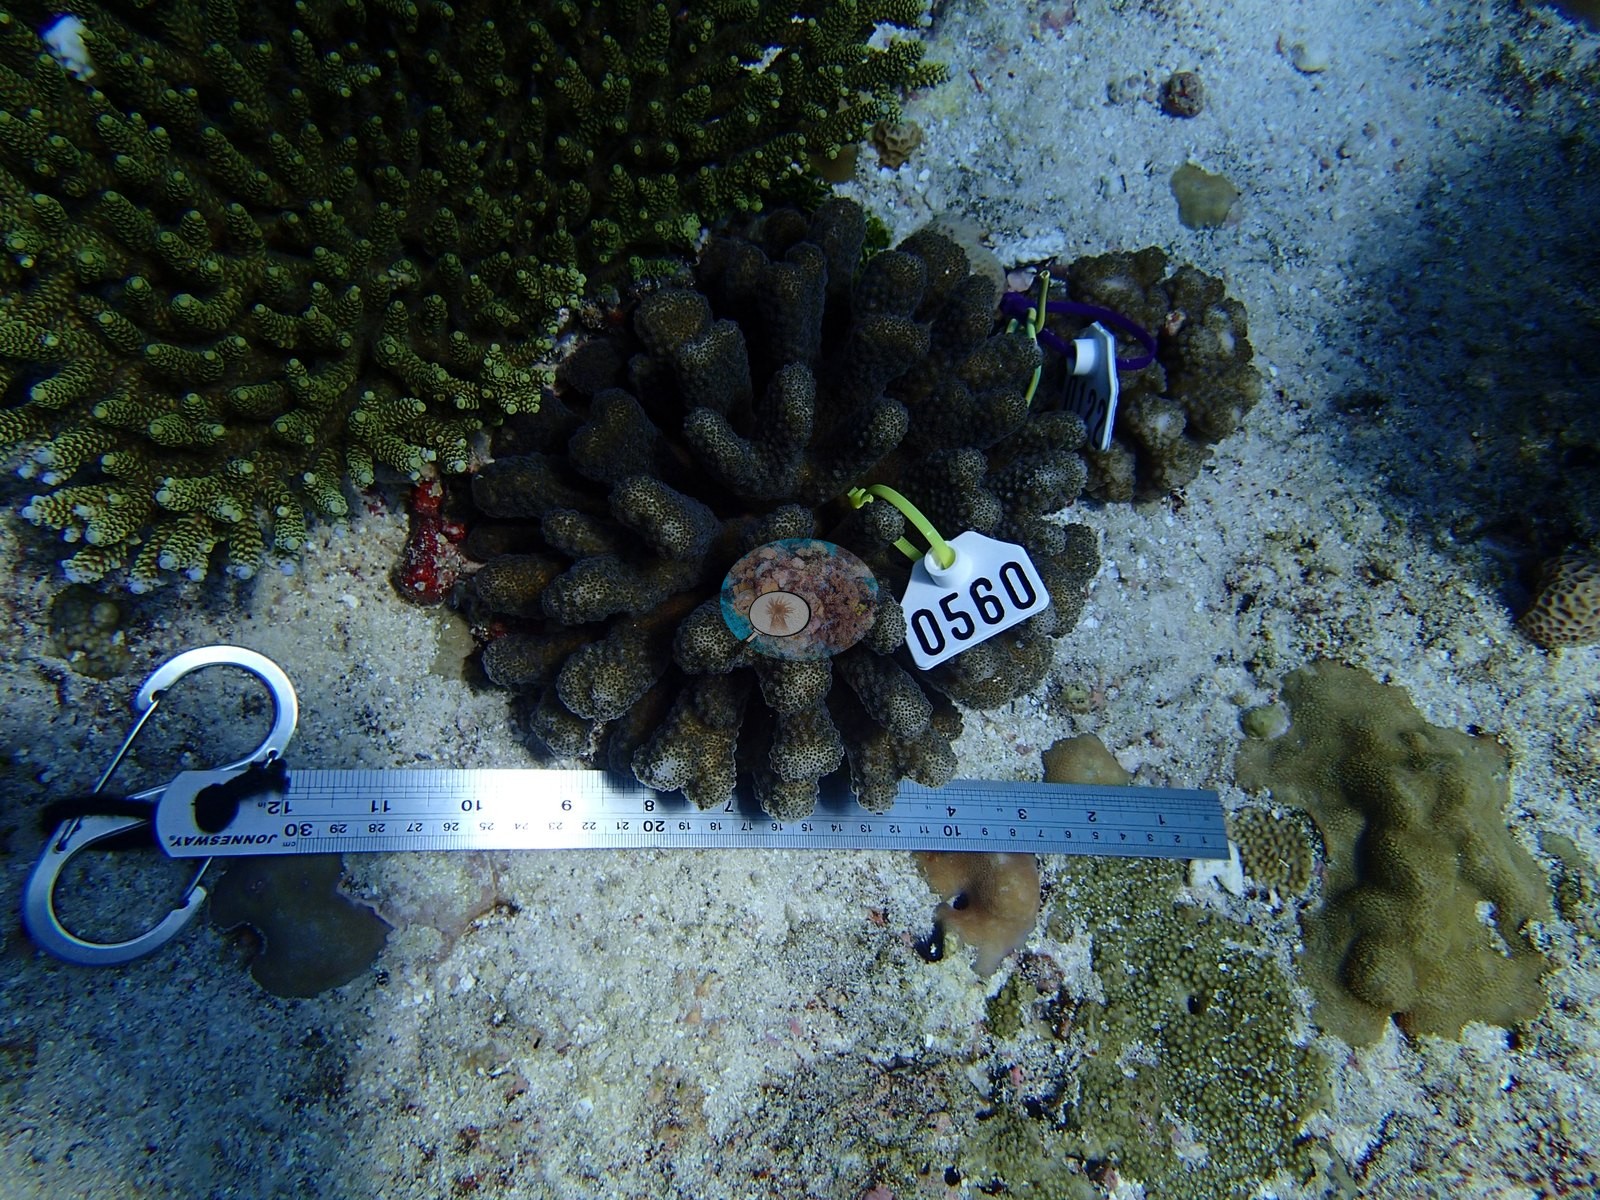
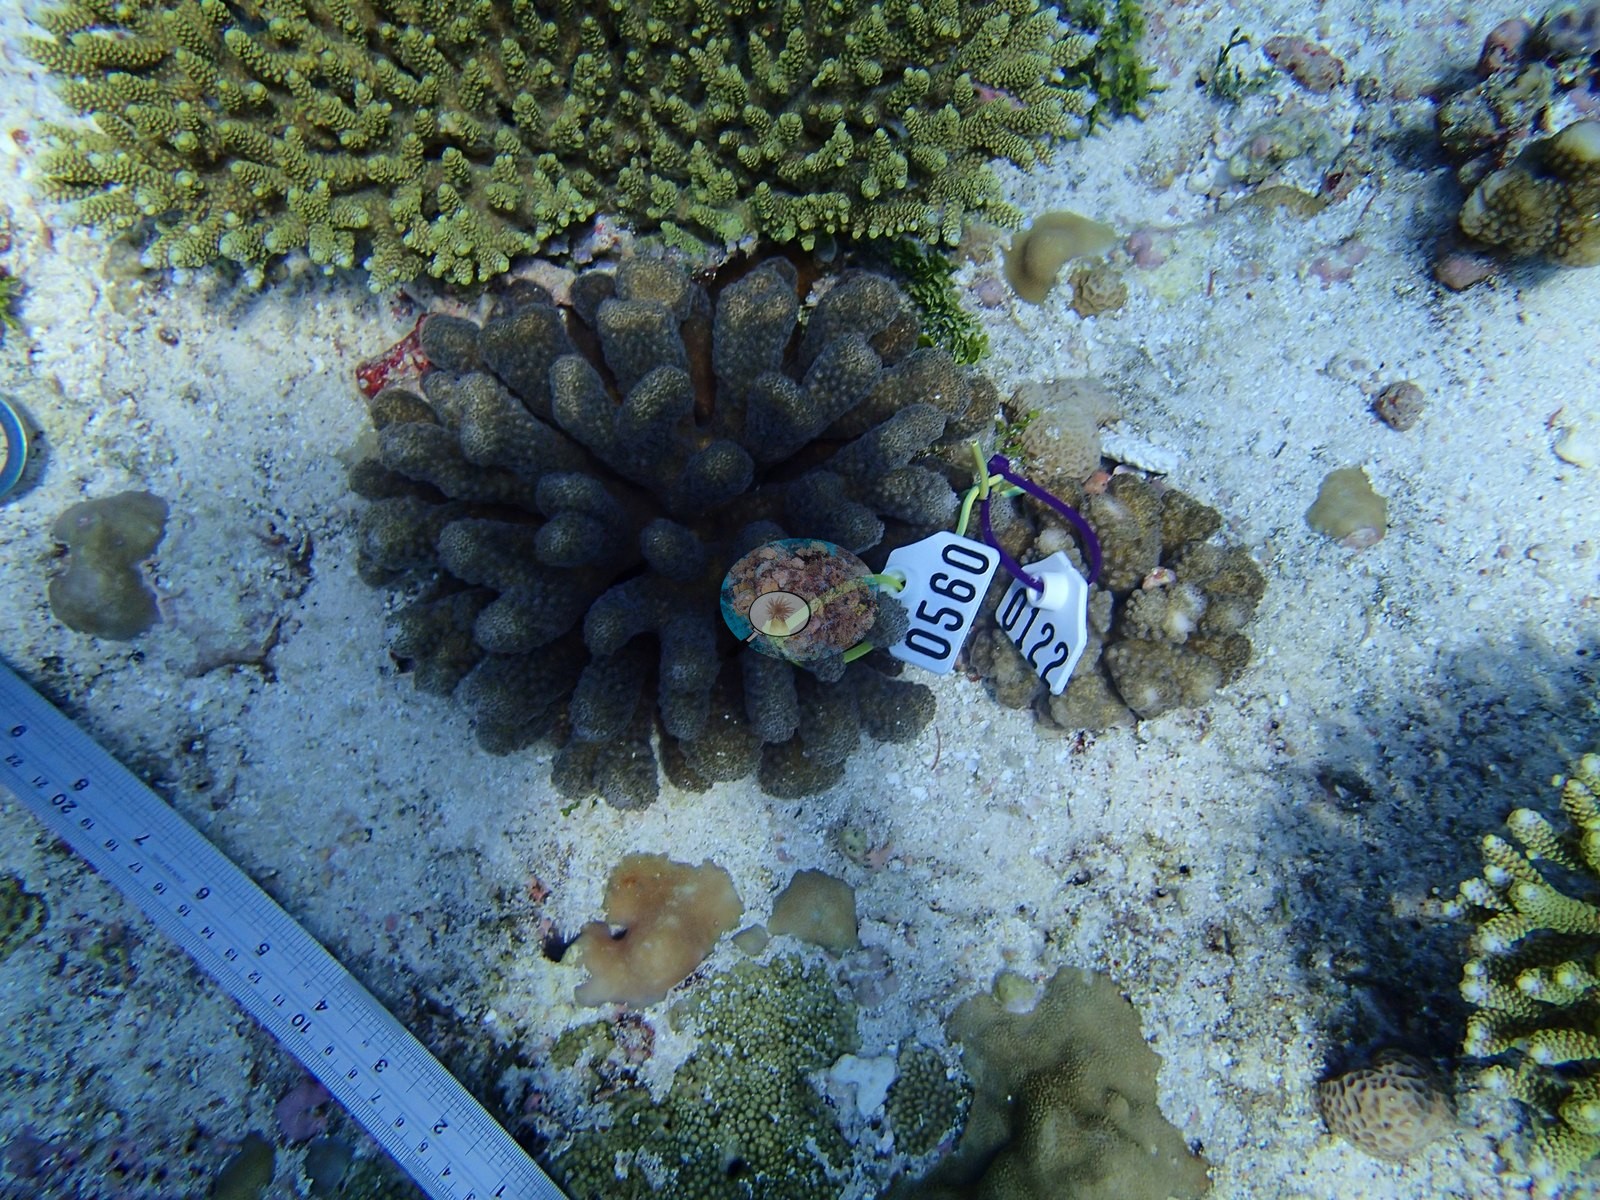
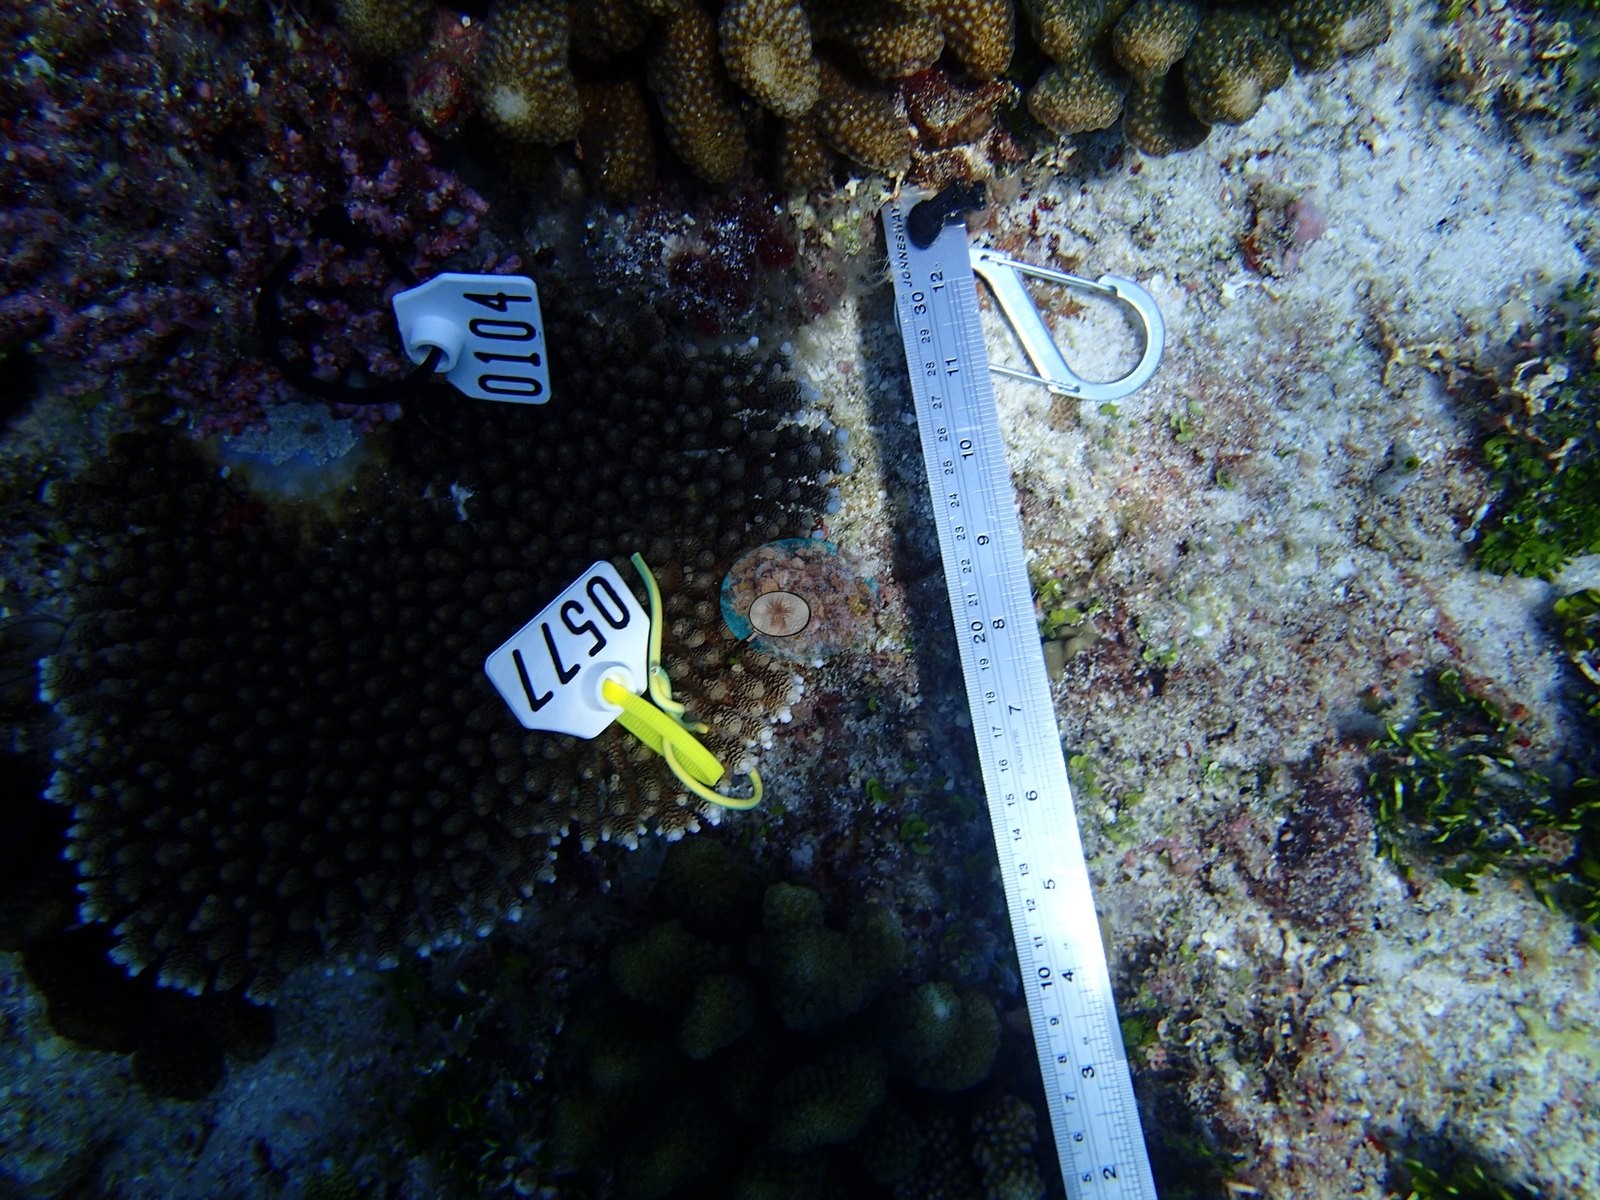
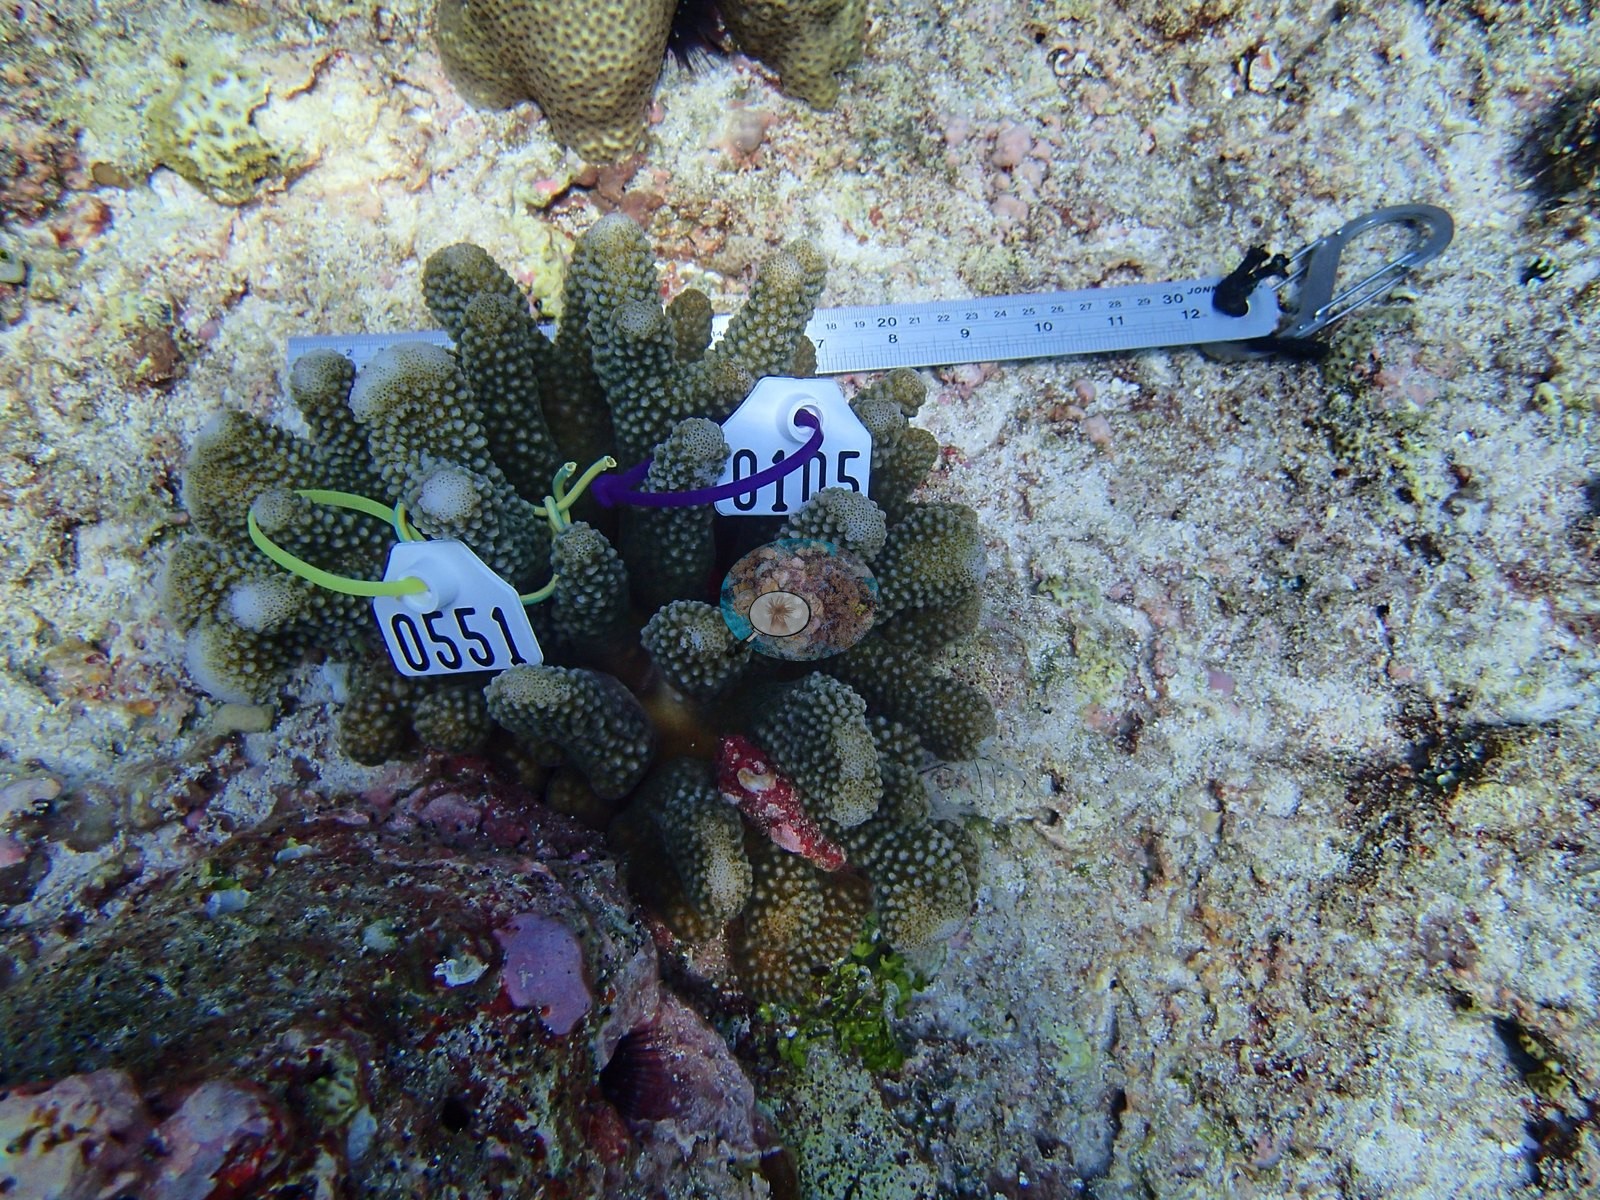
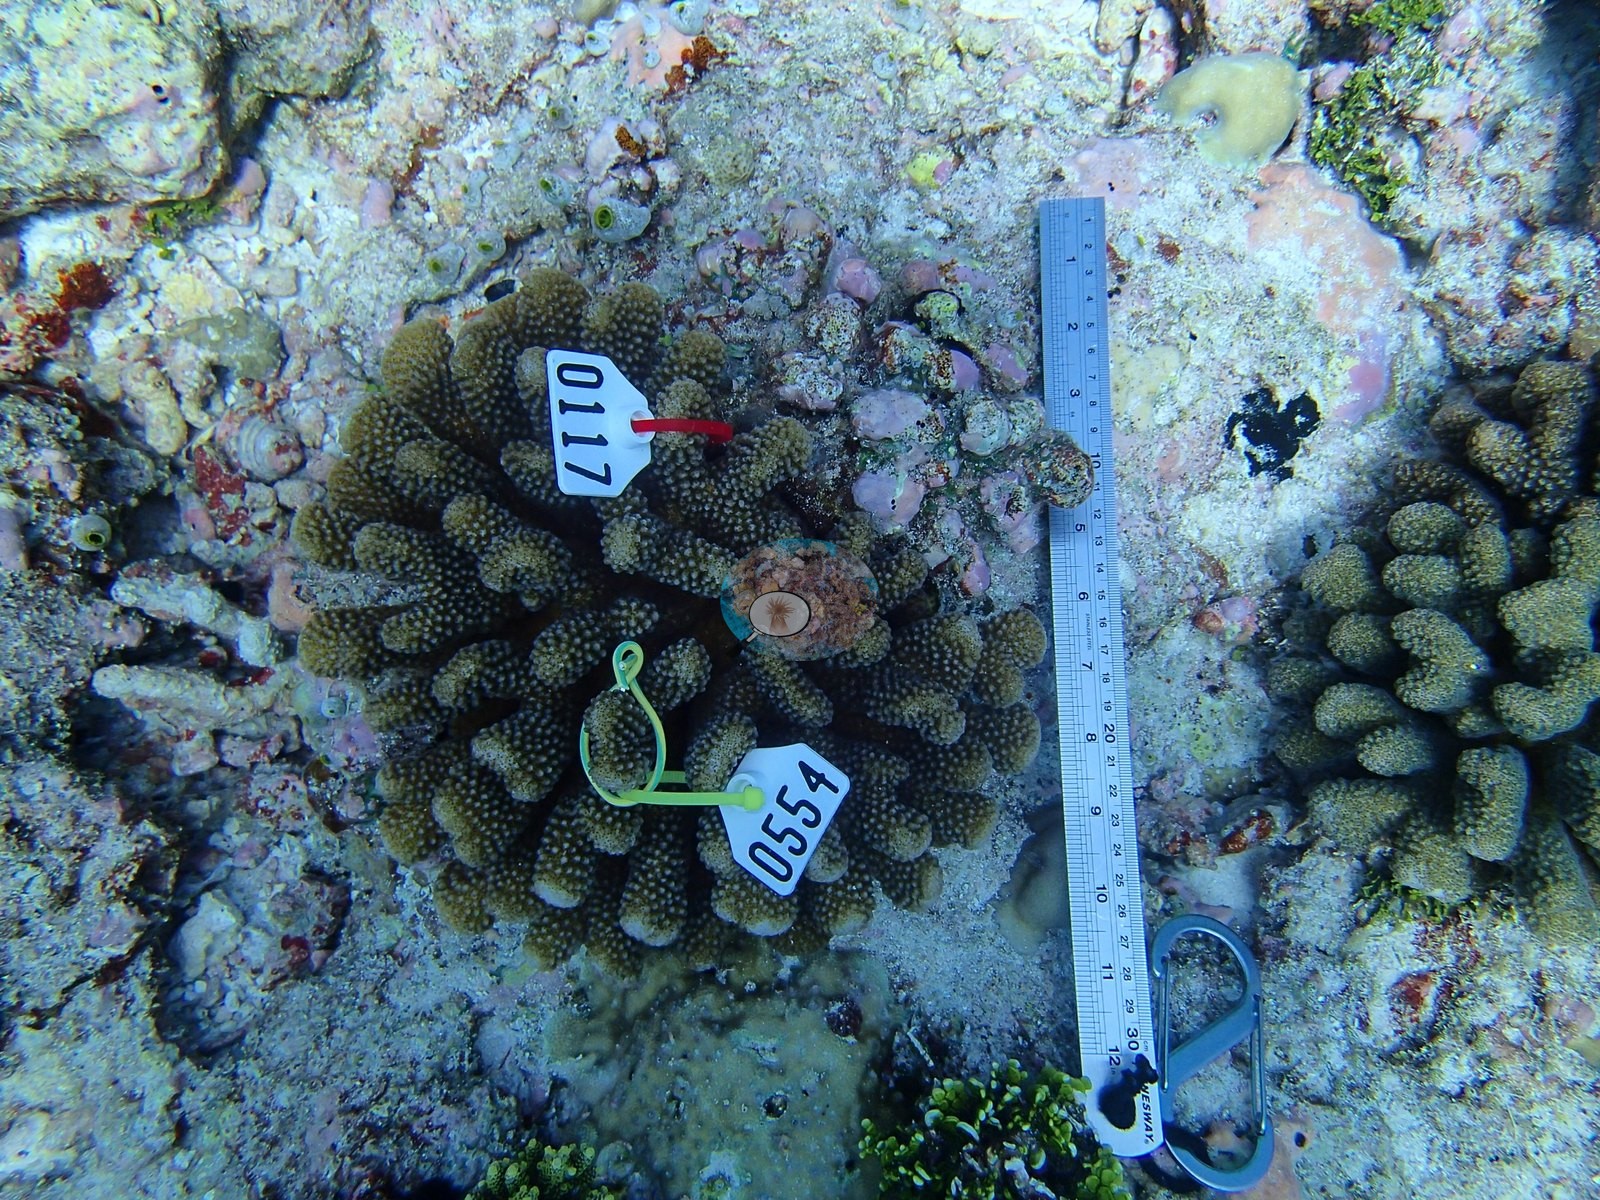
Stage is a shallow coral flat rather than a dramatic wall: a pale pavement of rock, rubble, and sand stretching into the blue, studded every meter or so with sturdy, self-contained coral colonies (e.g., Image 19, Image 25).
General benthic features
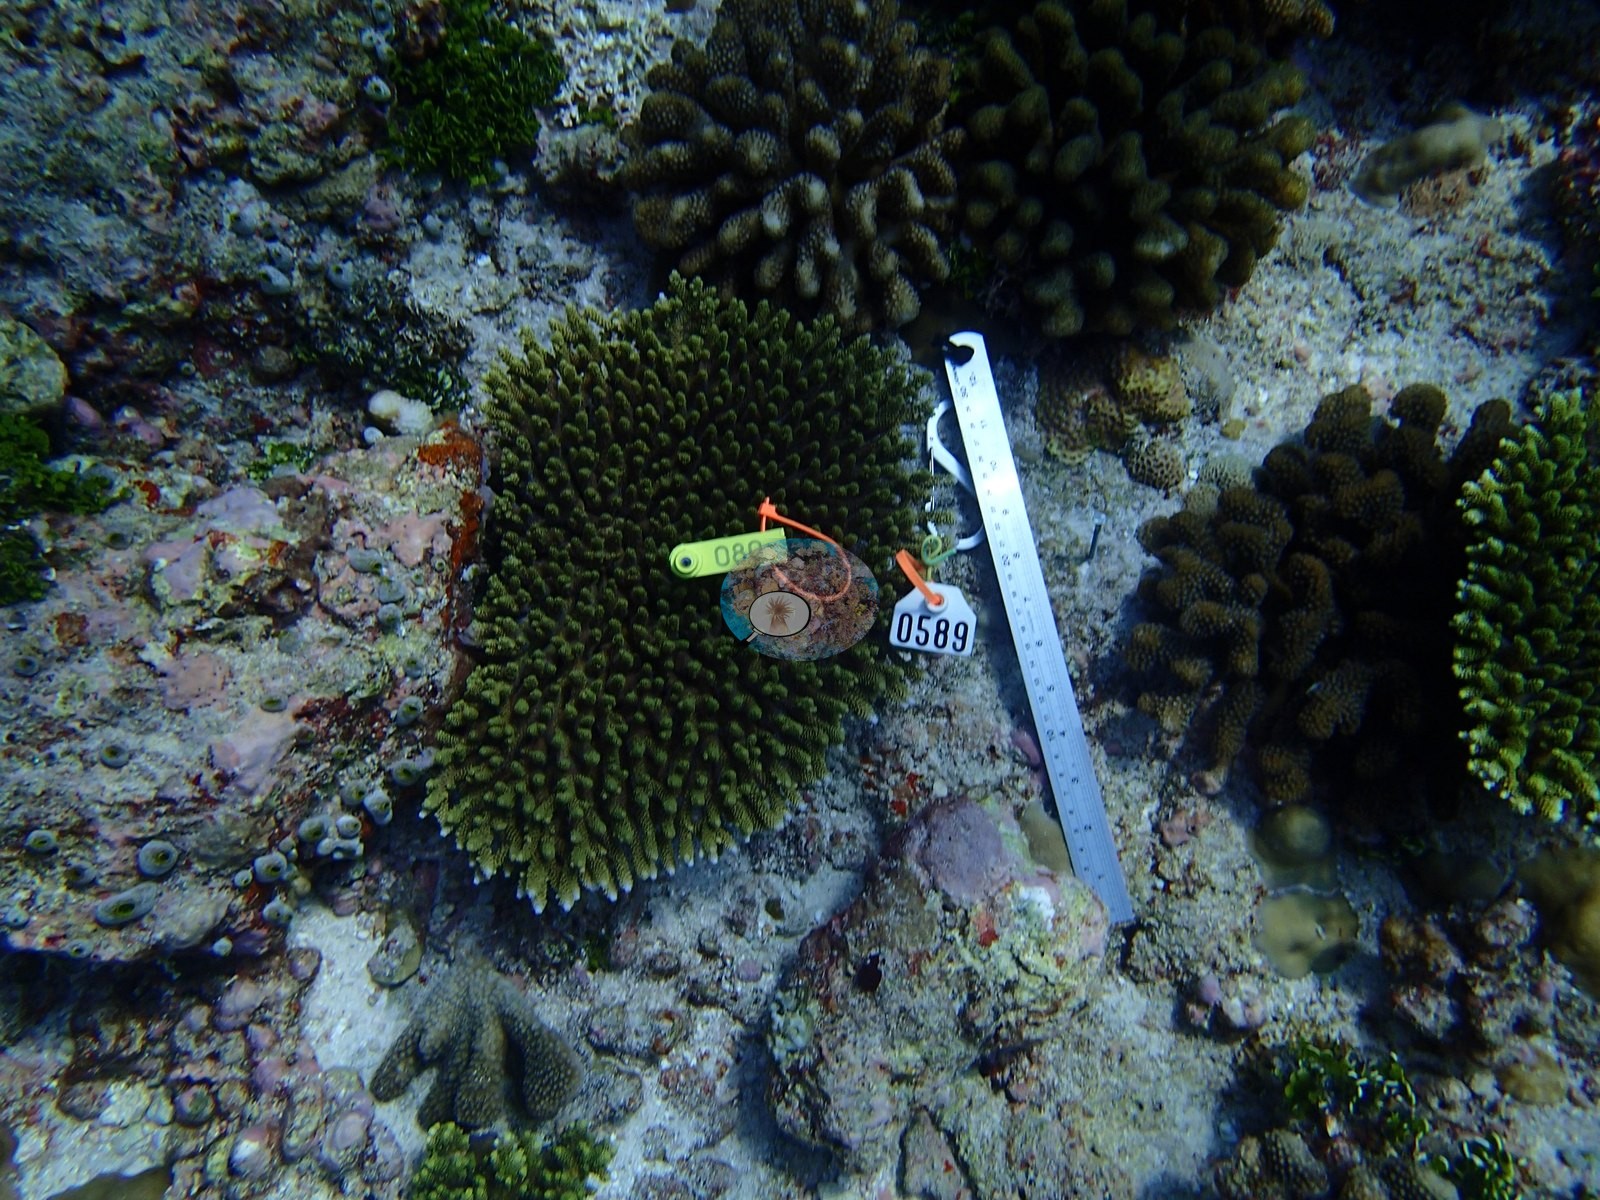
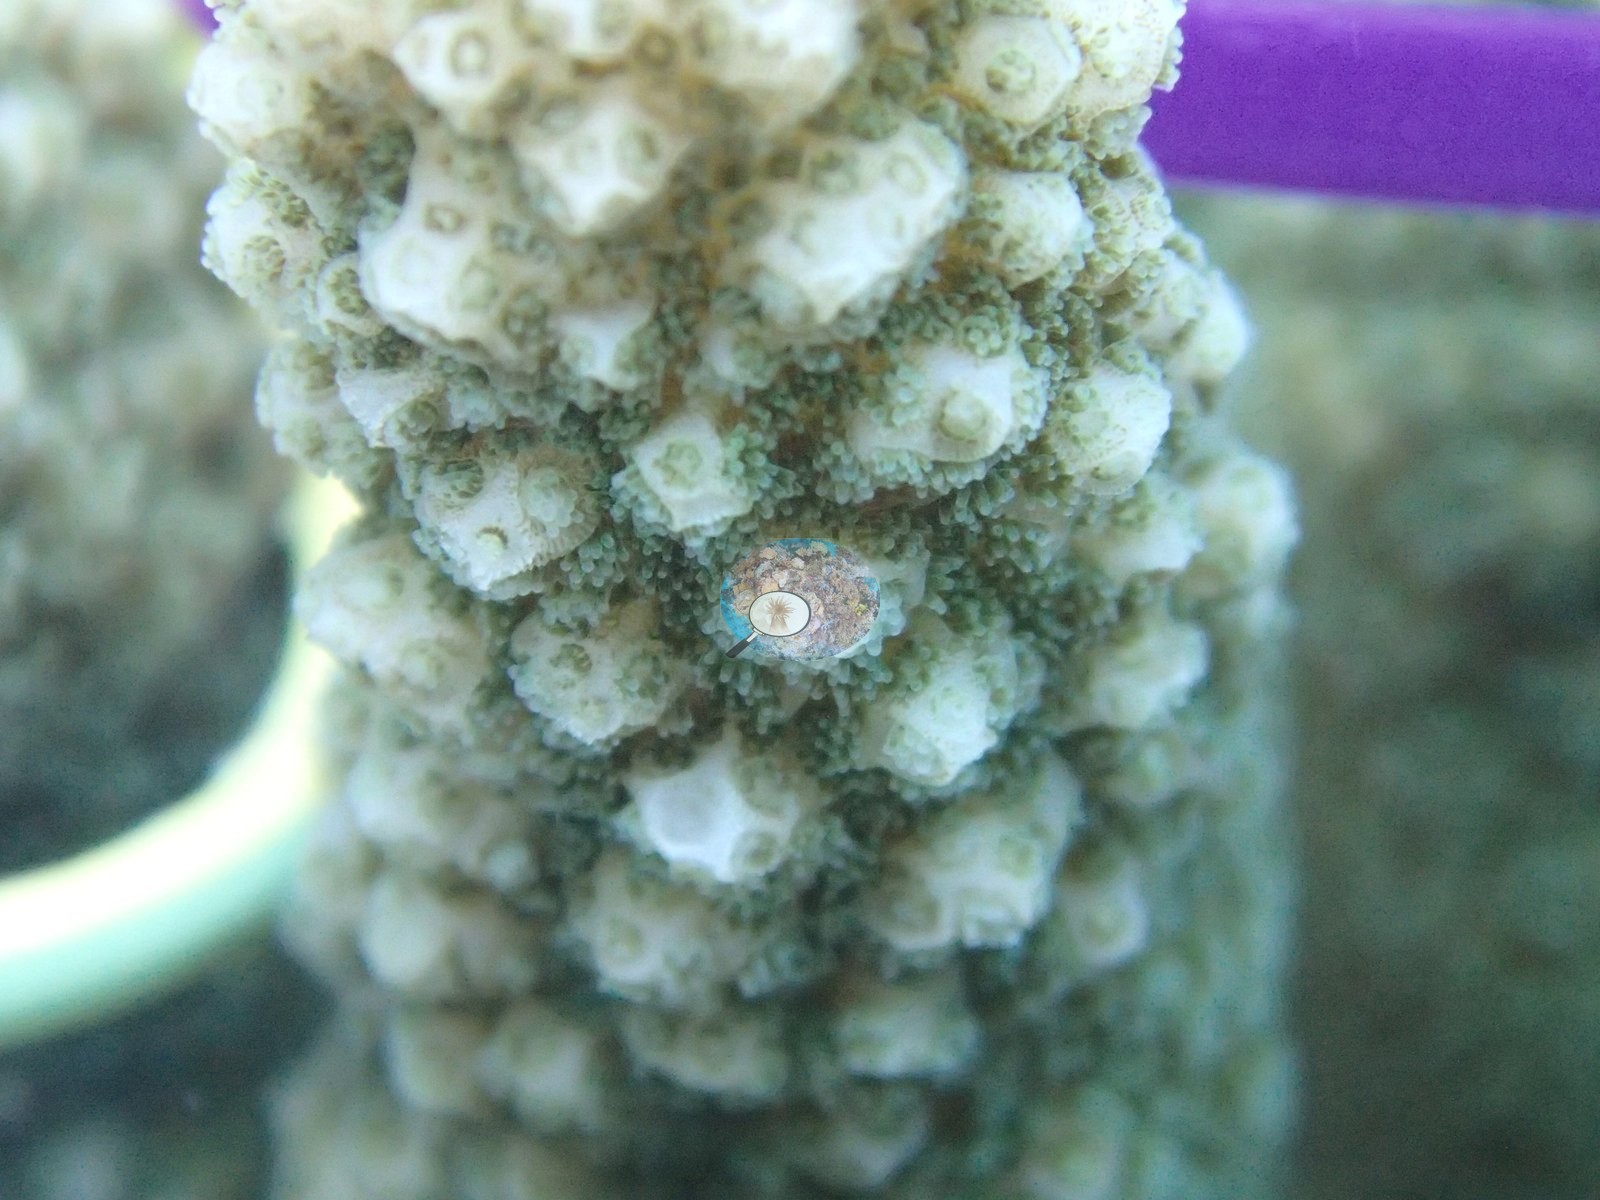
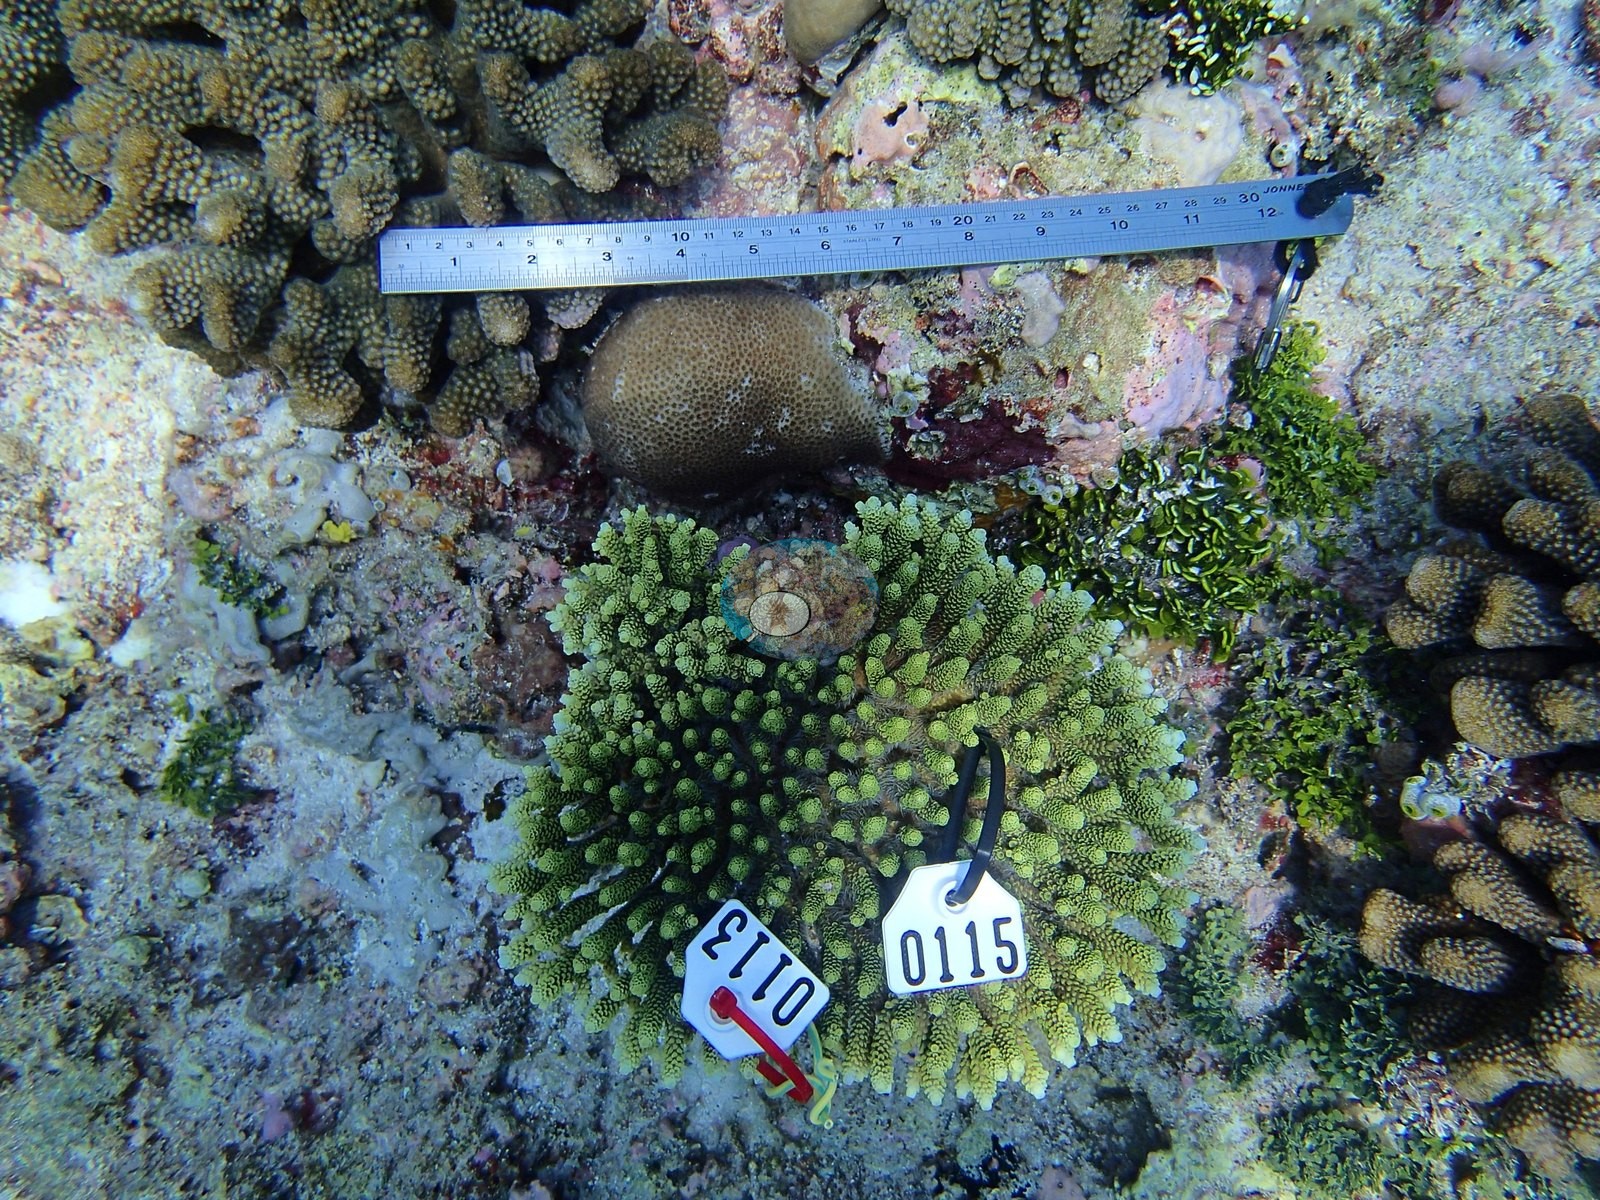
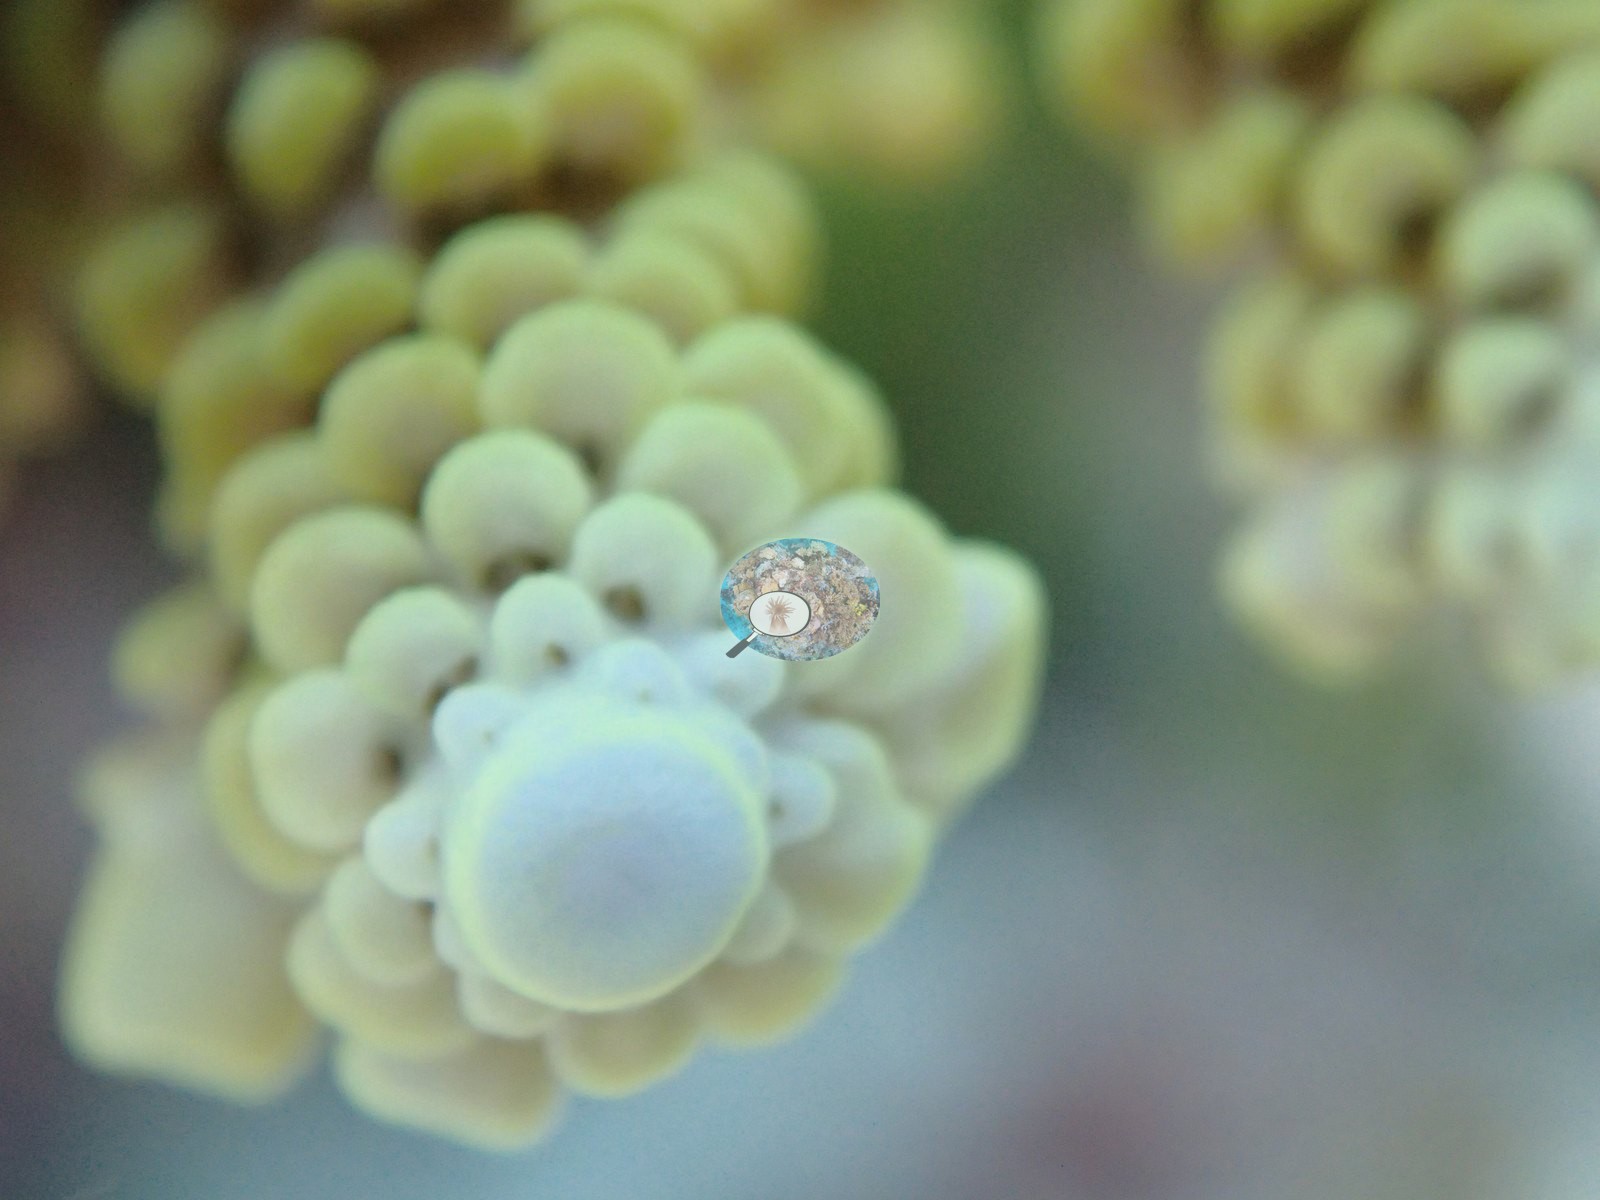
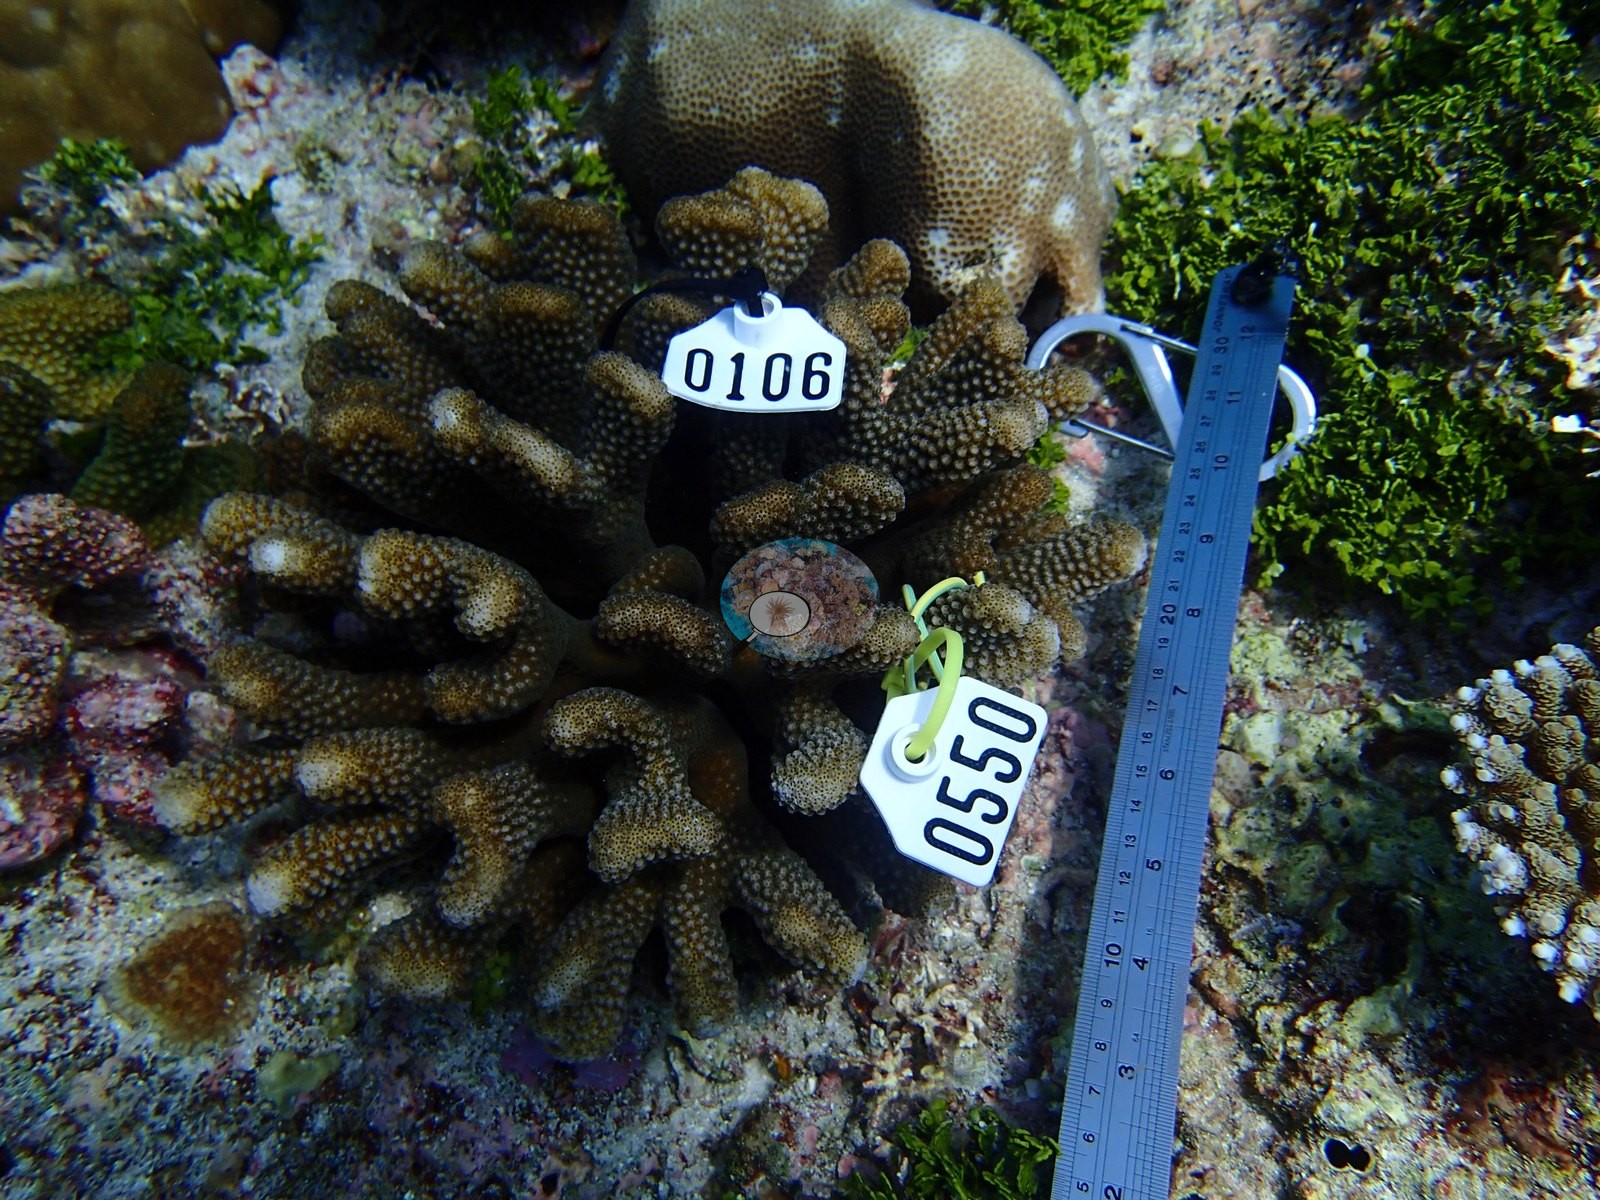
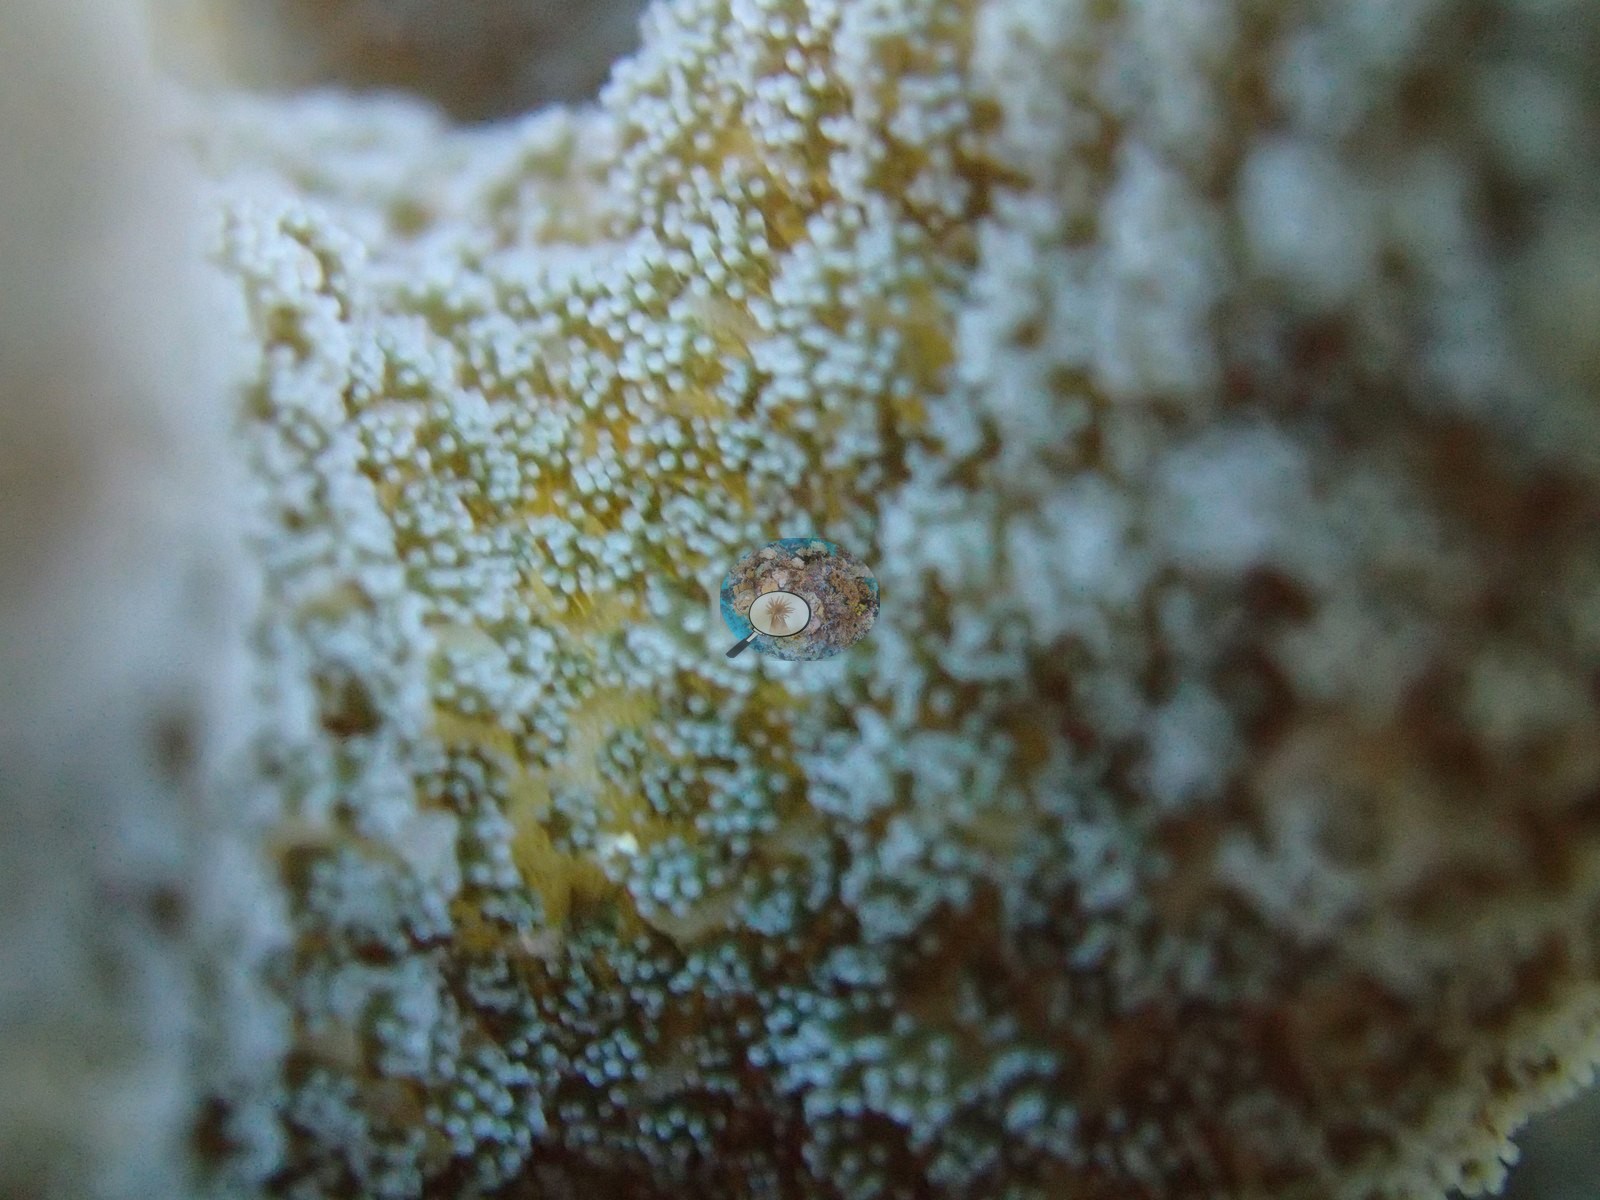
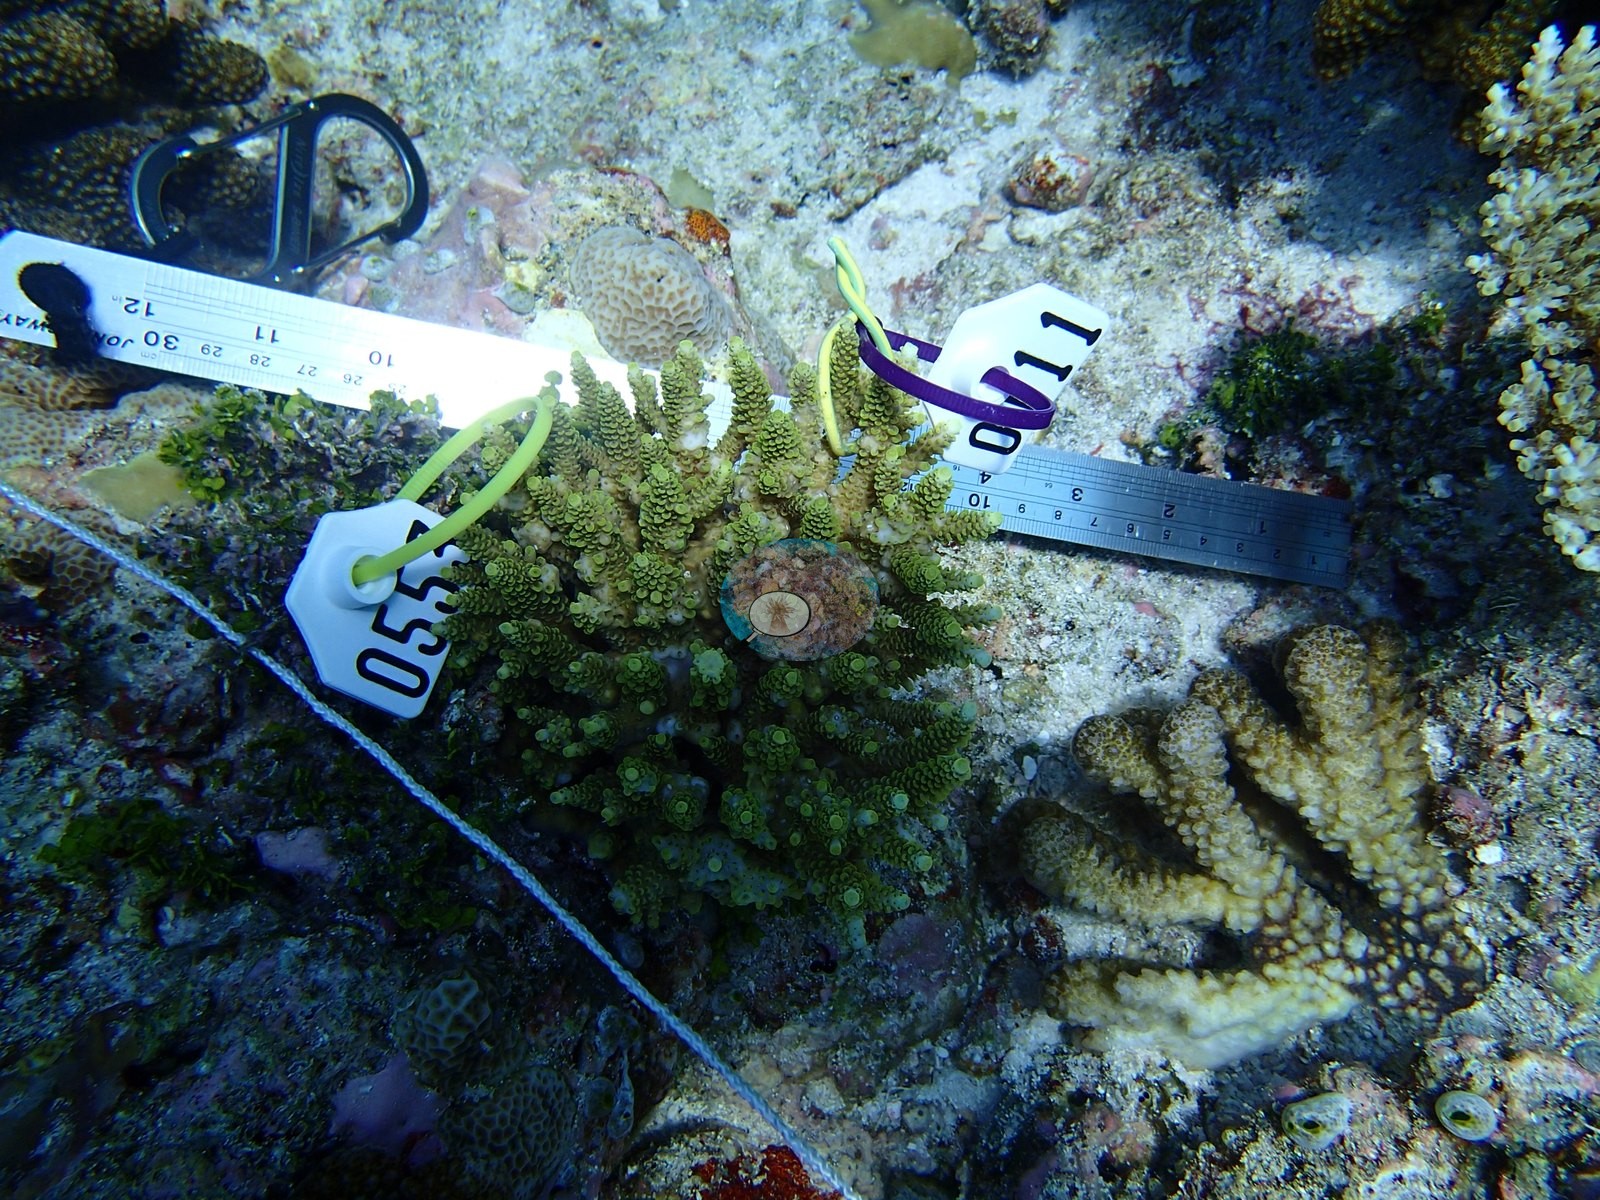
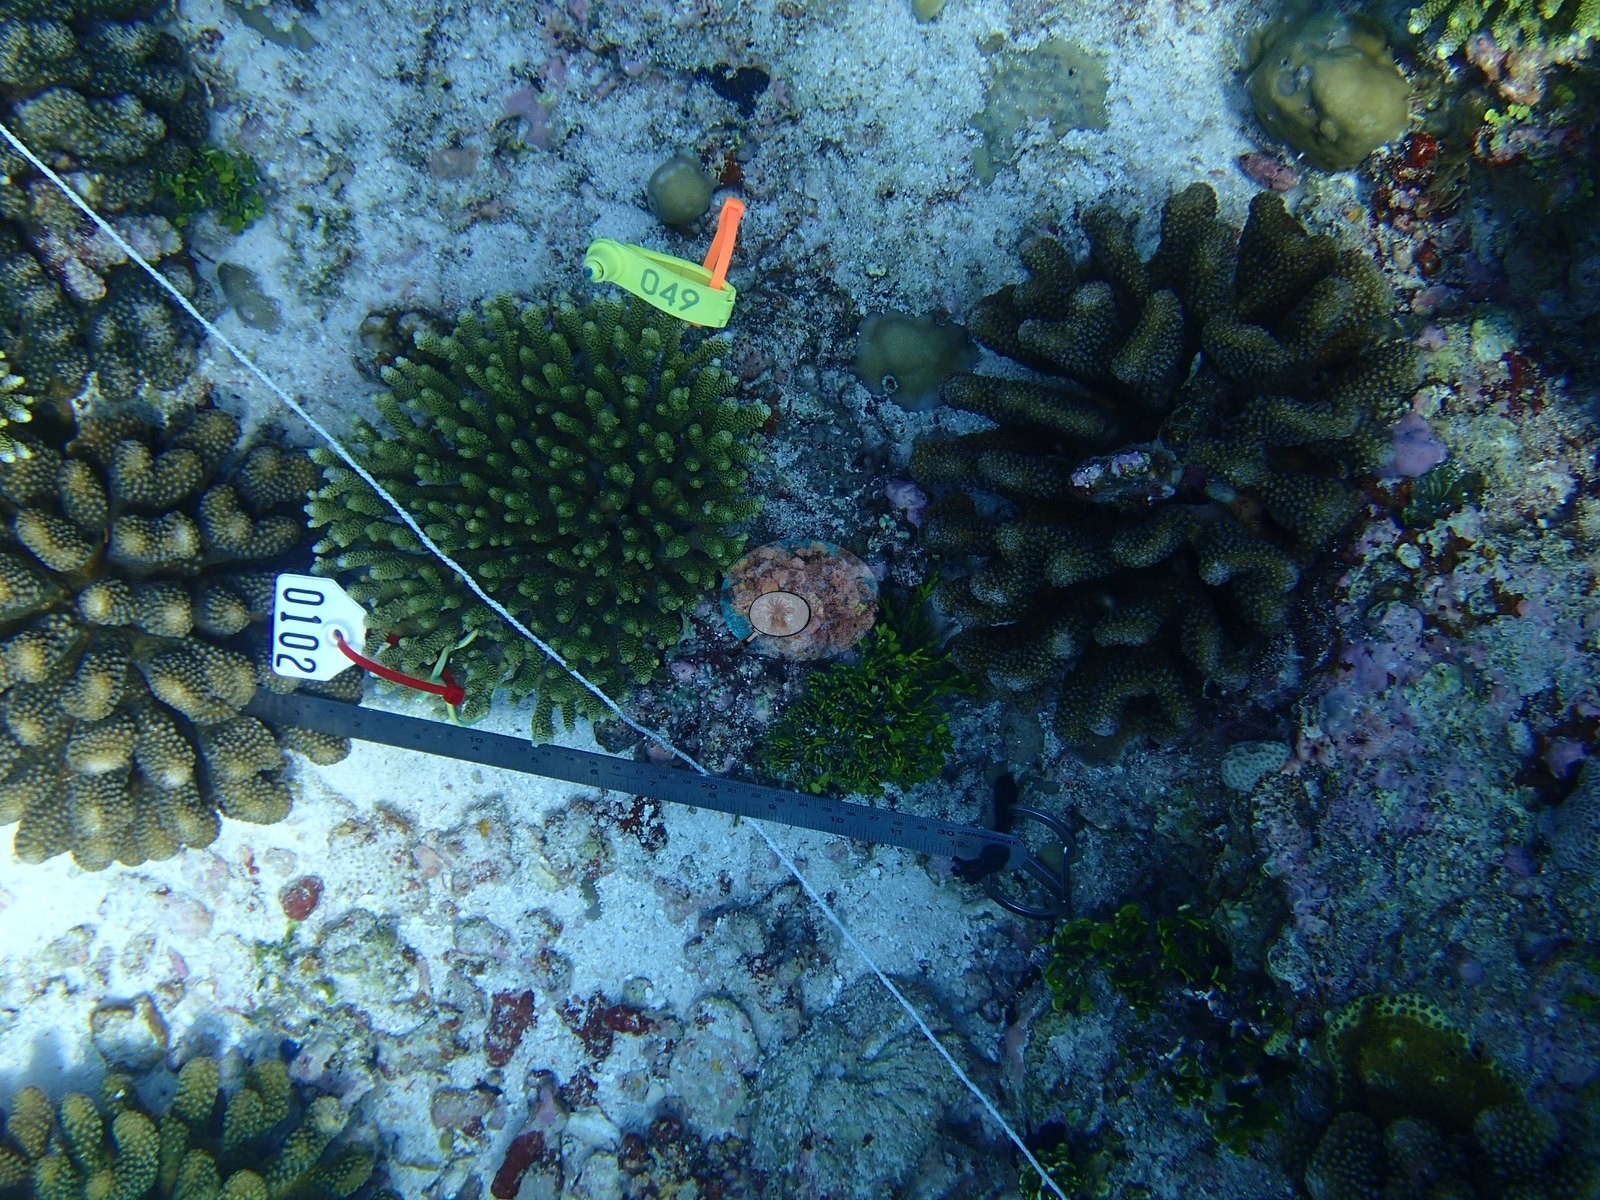
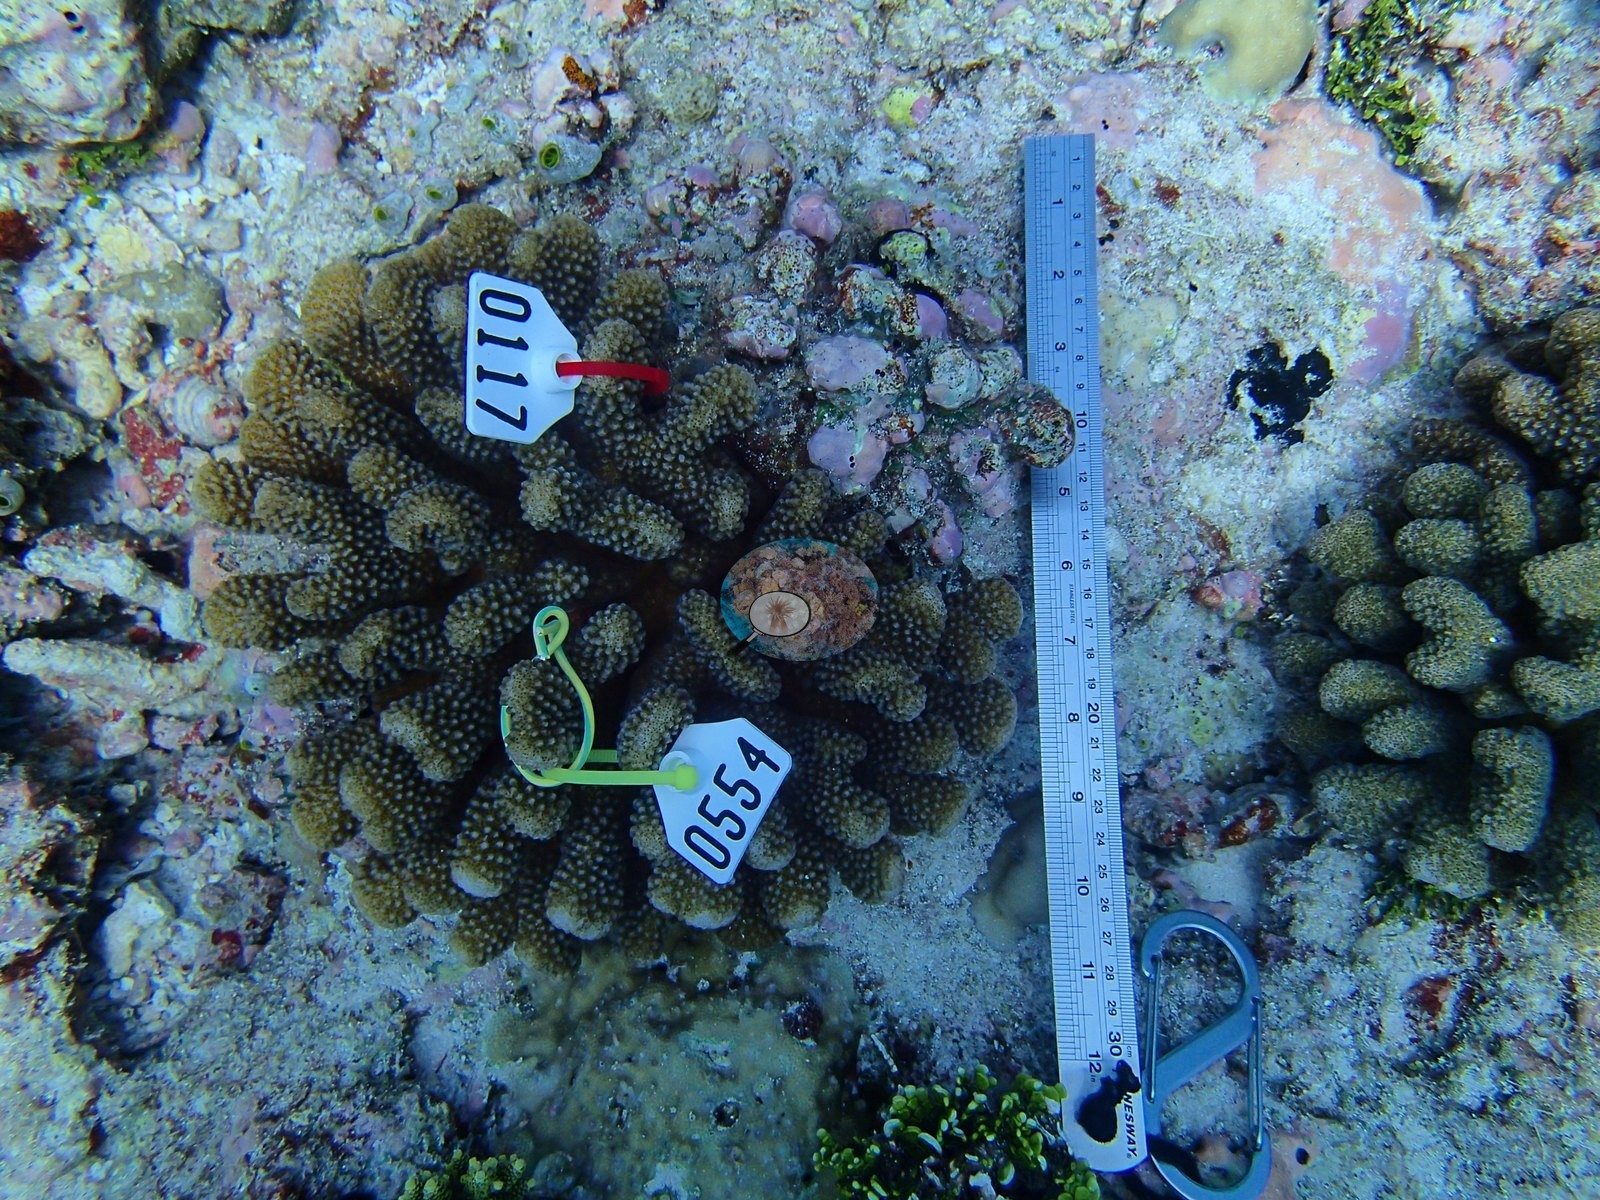
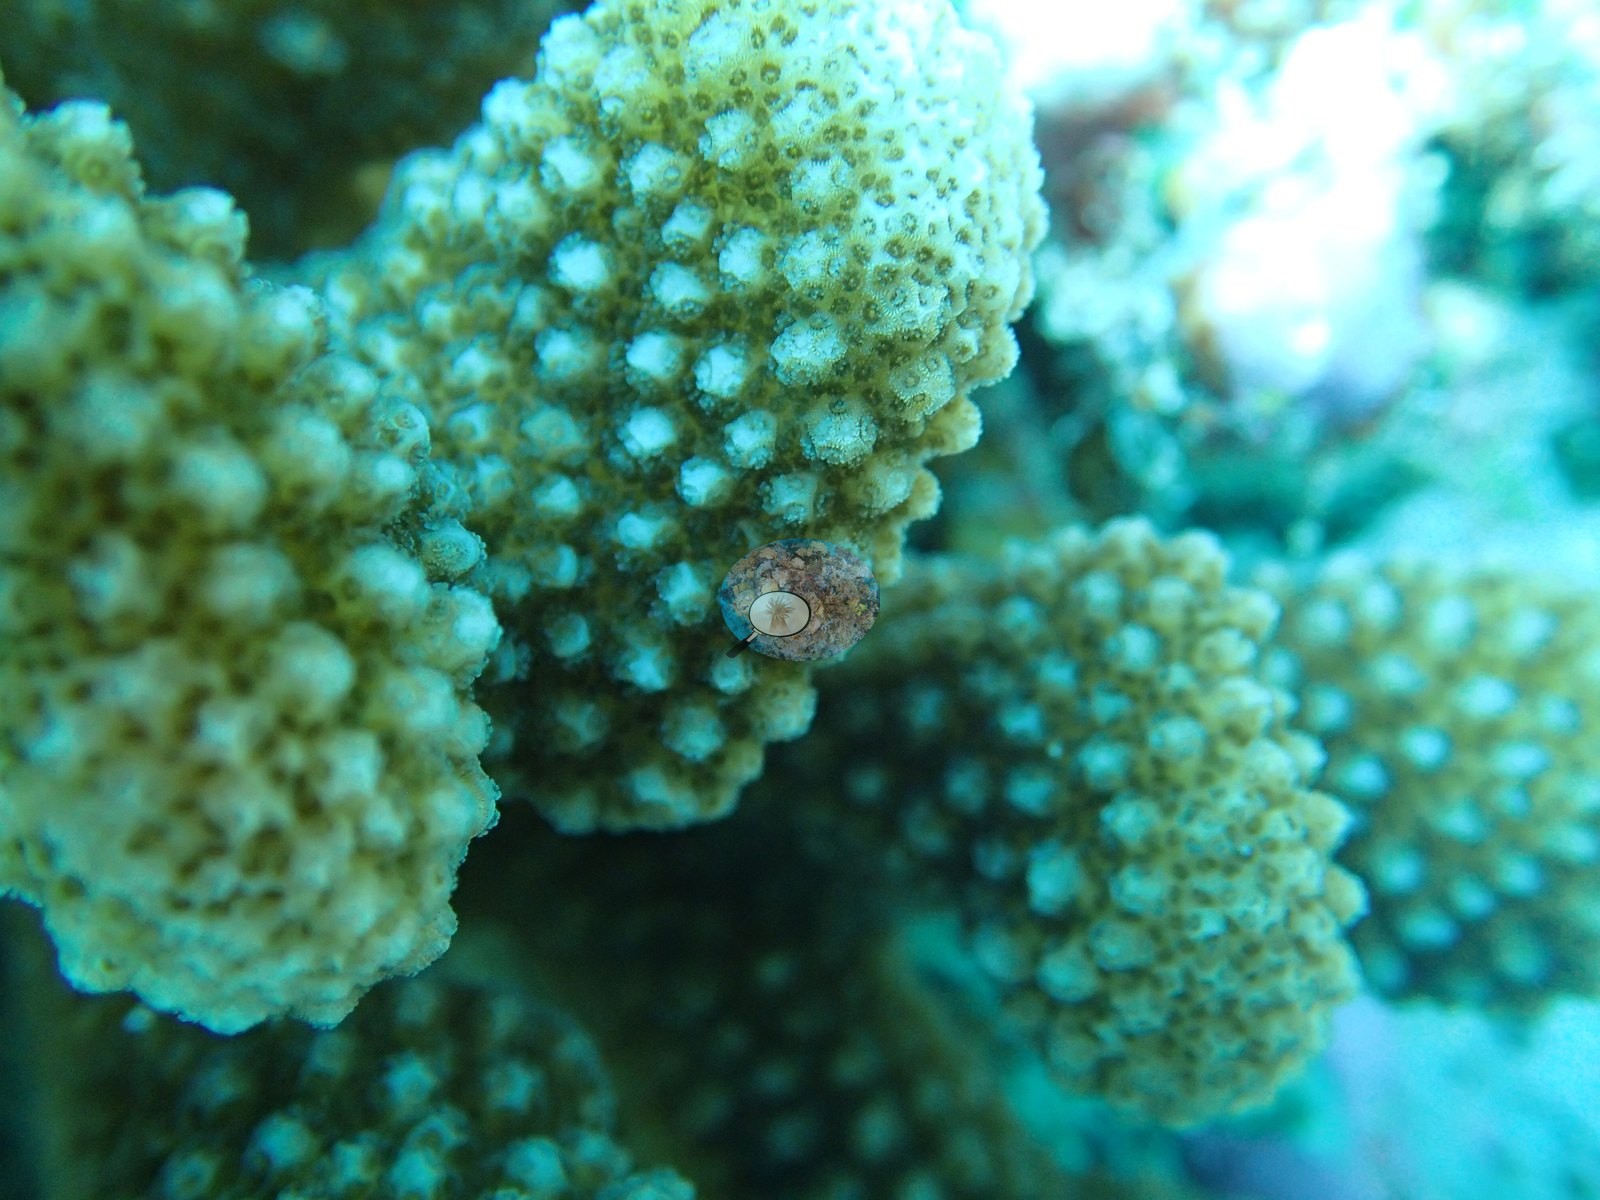
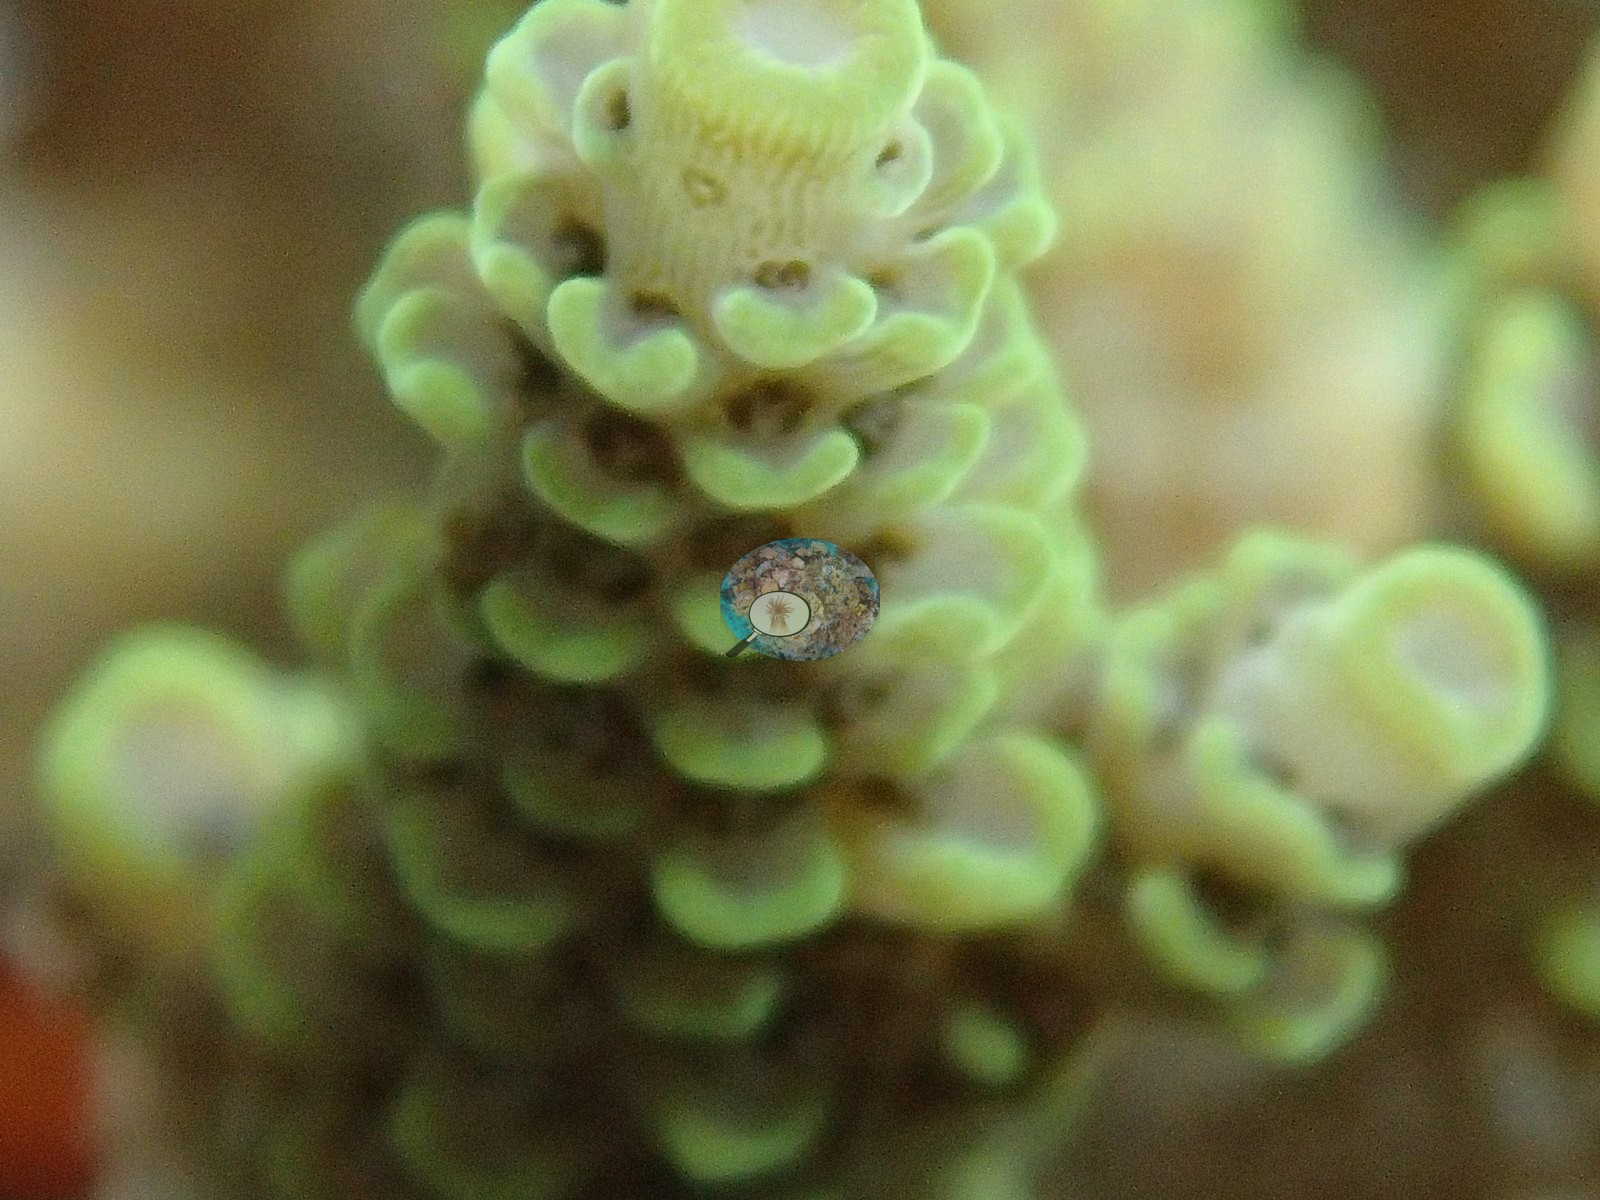
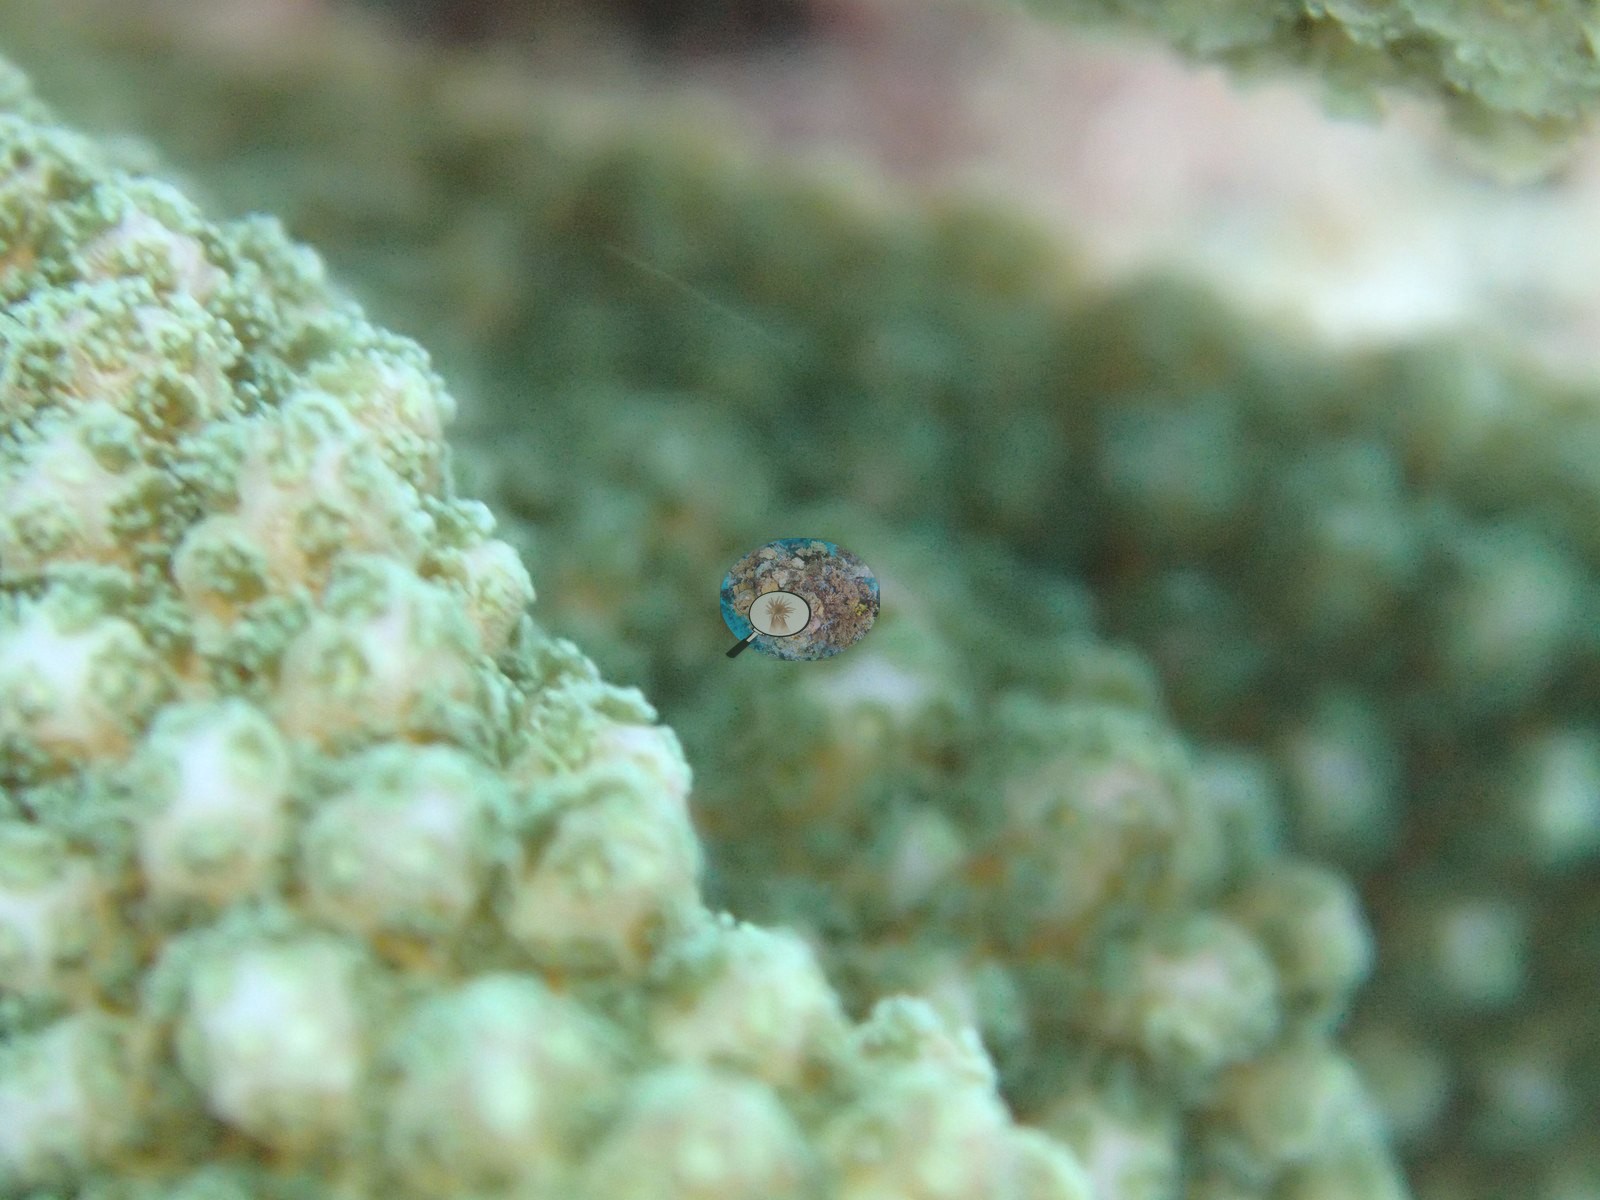
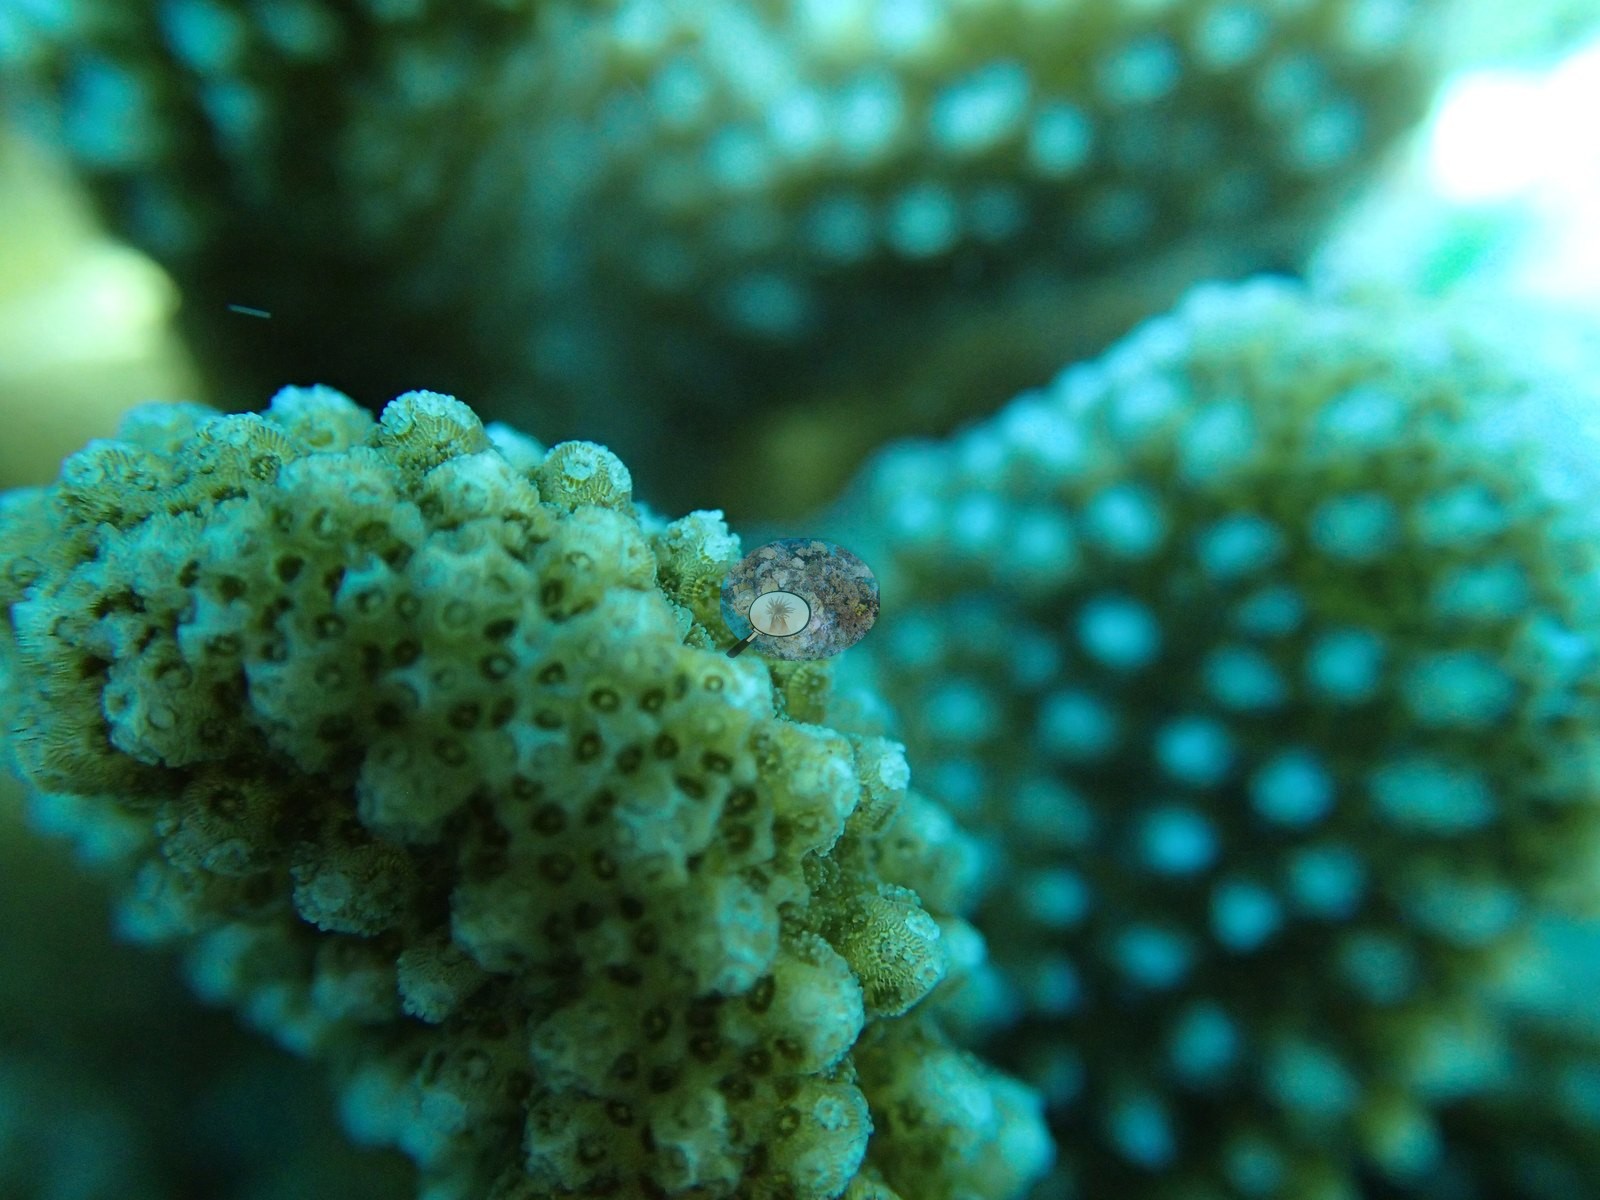
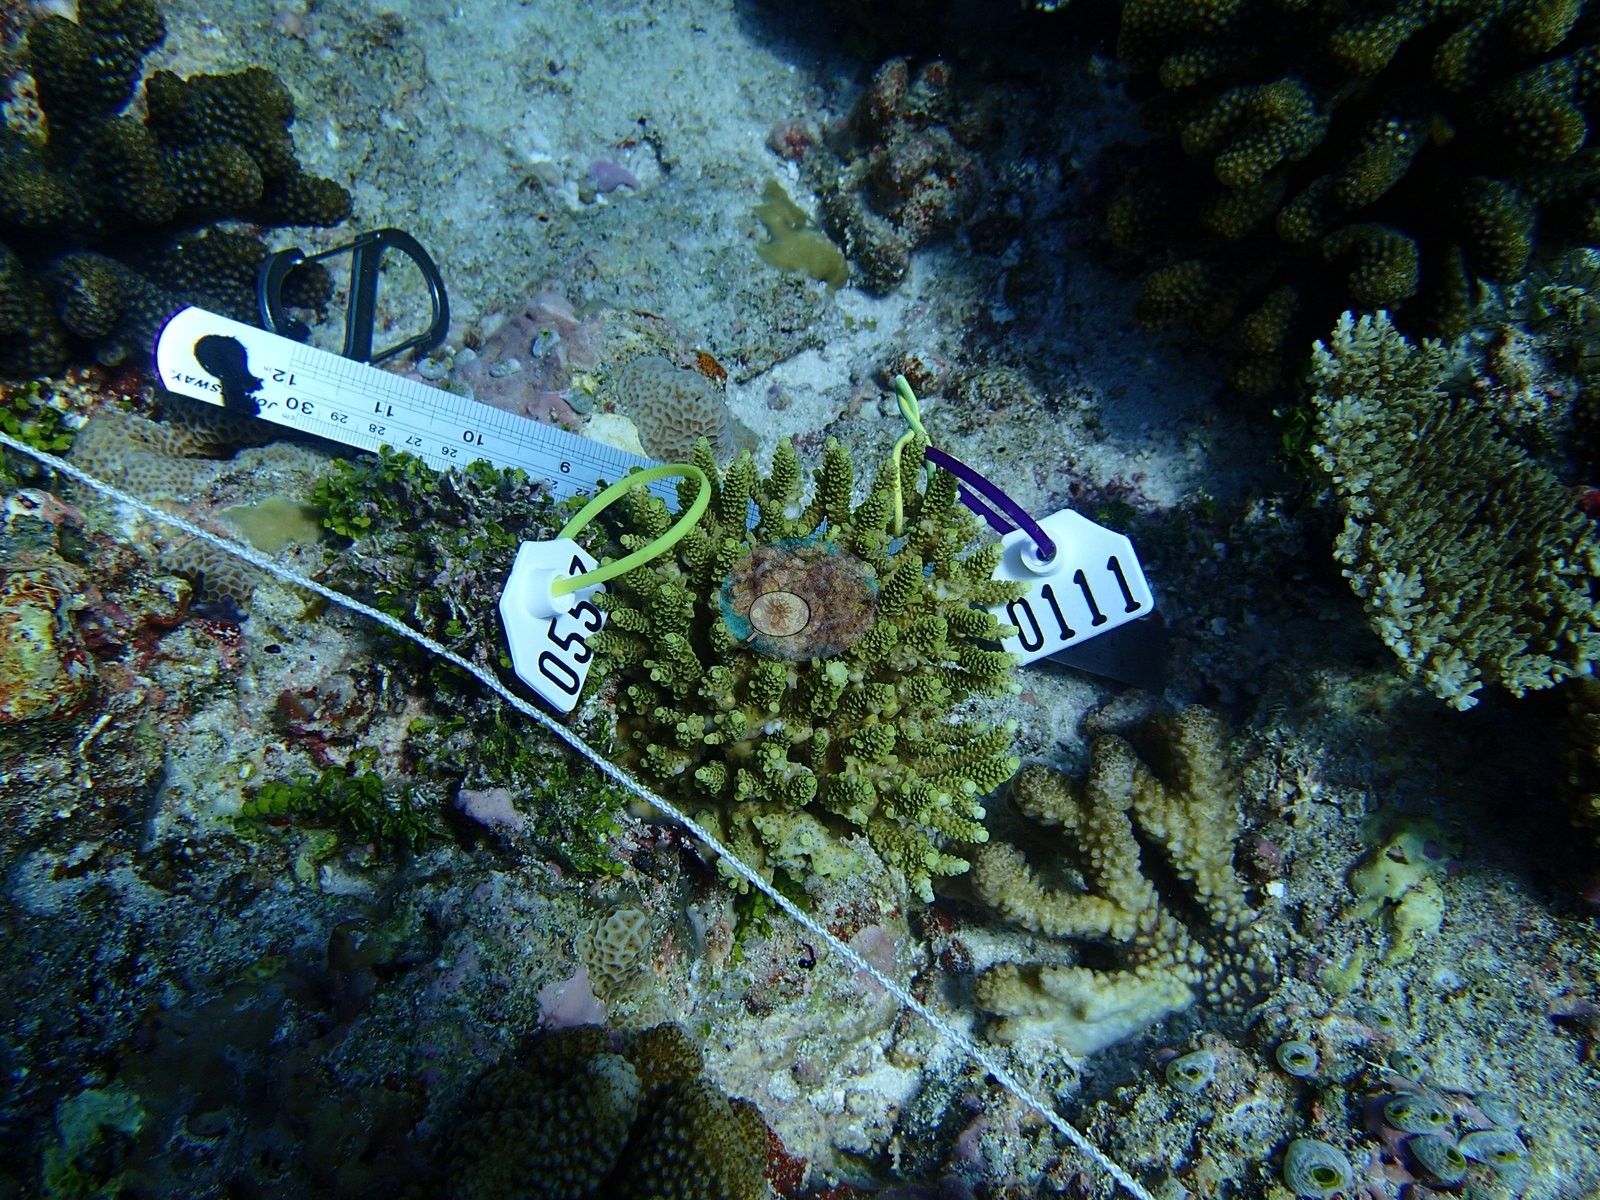
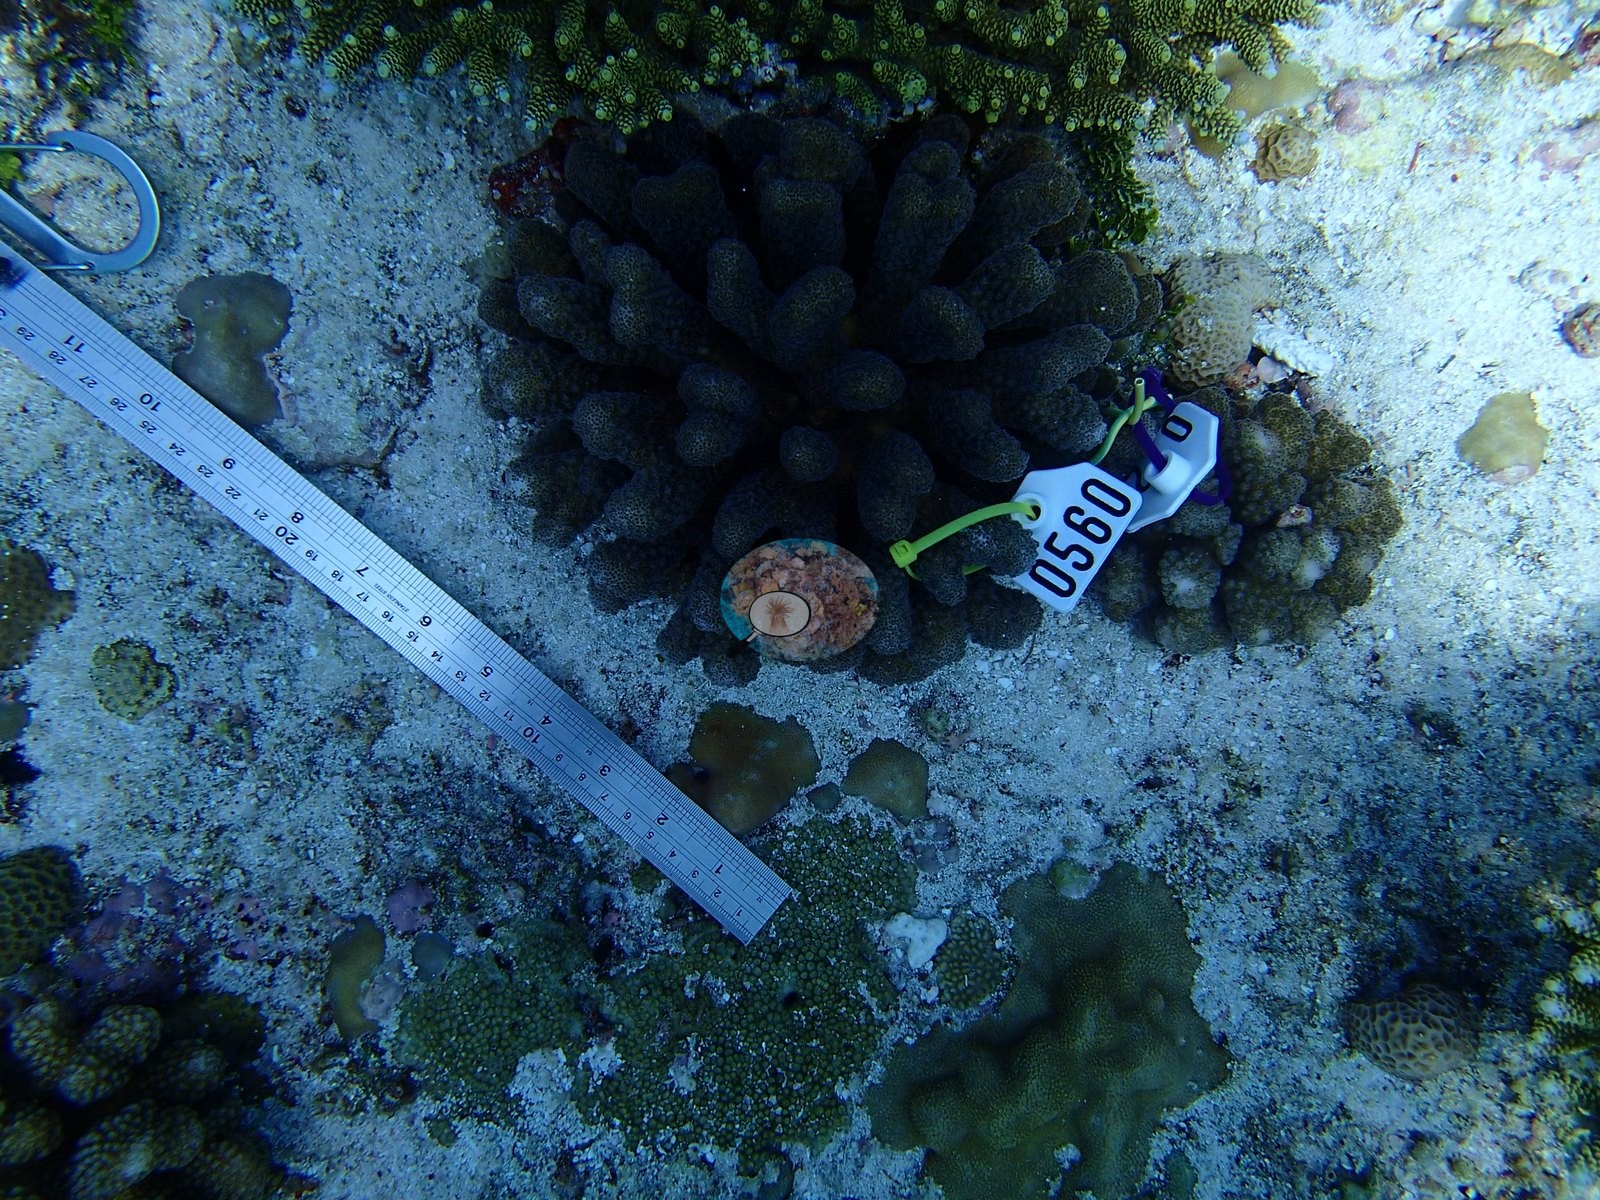
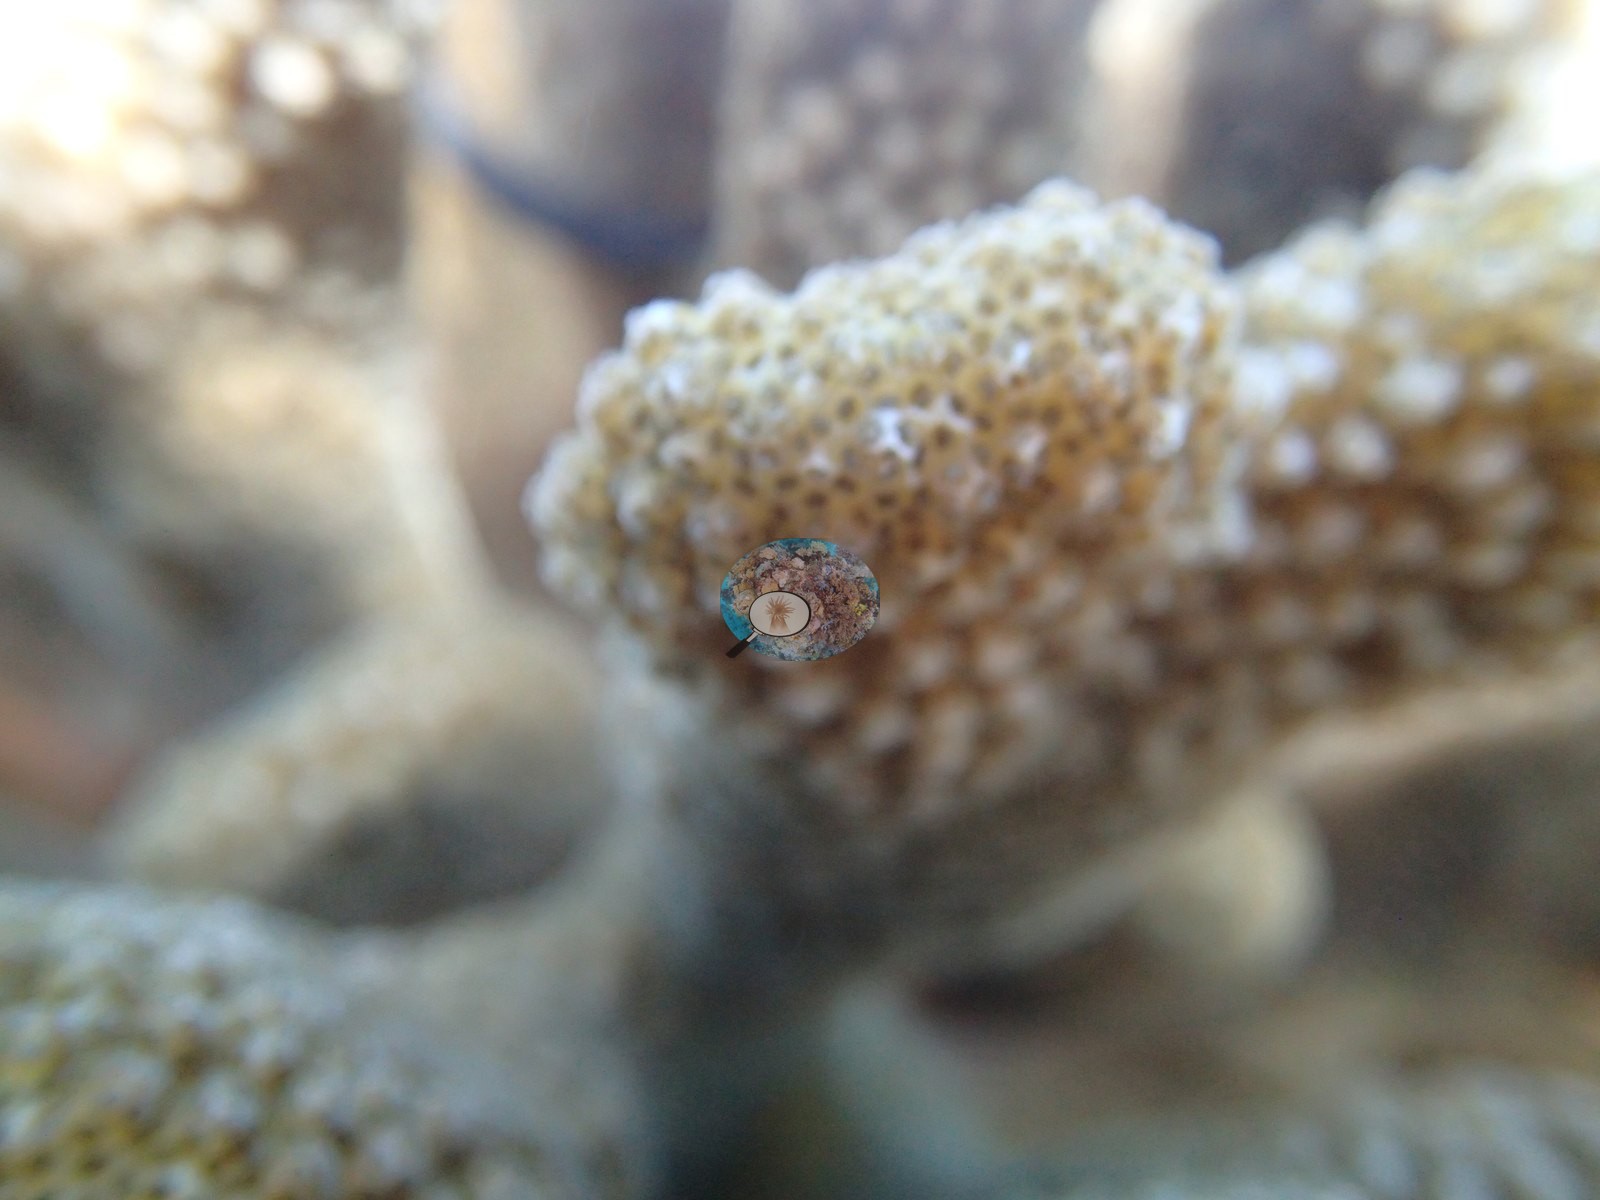
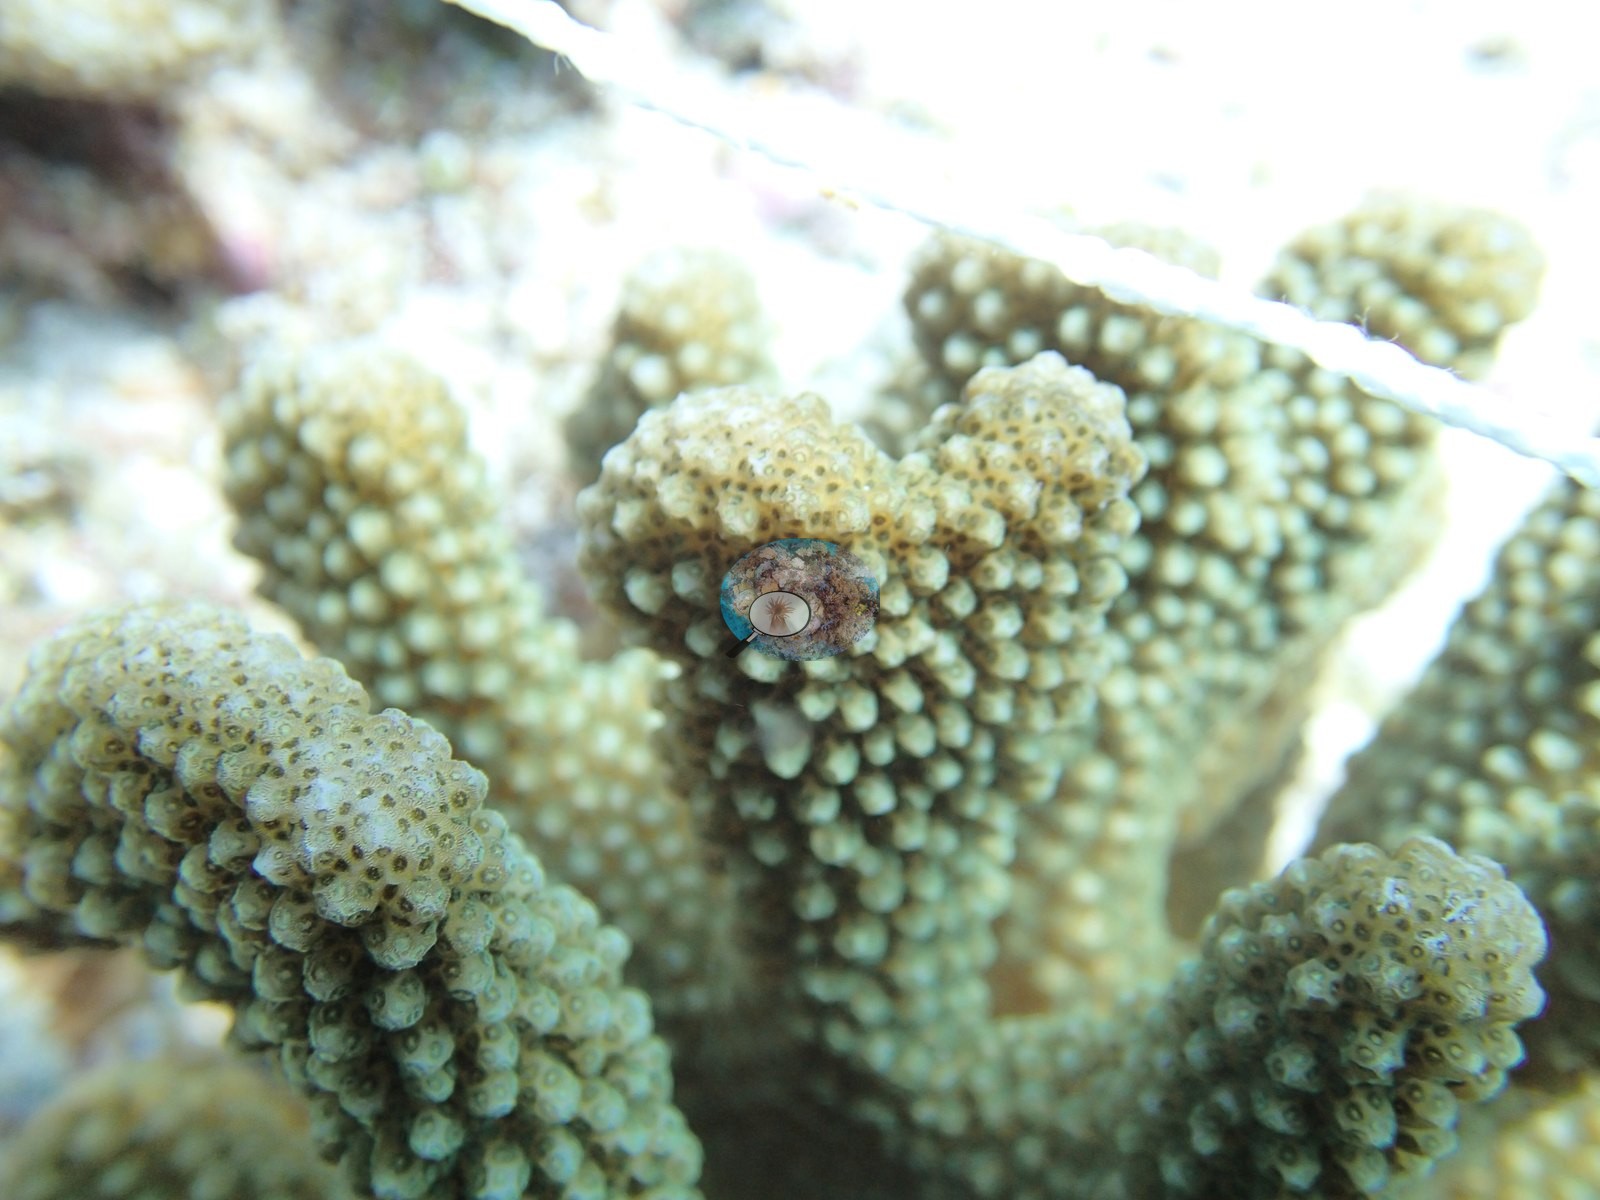
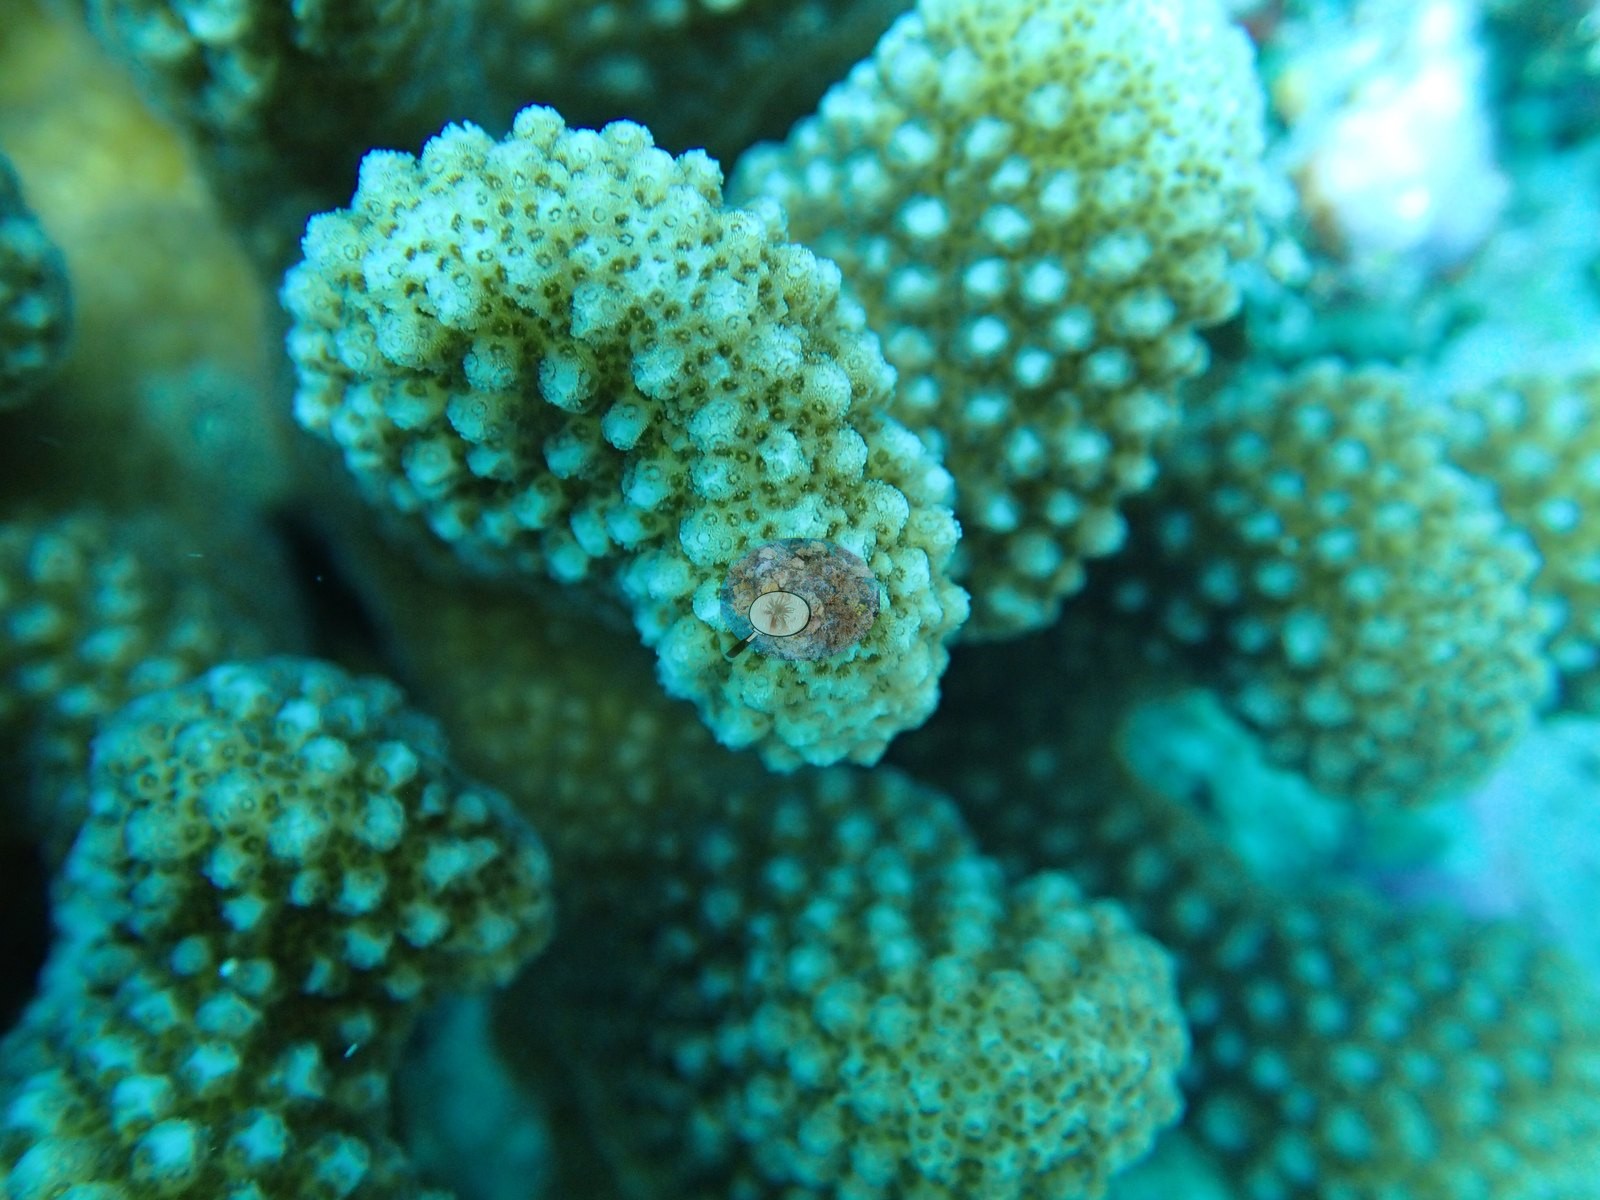
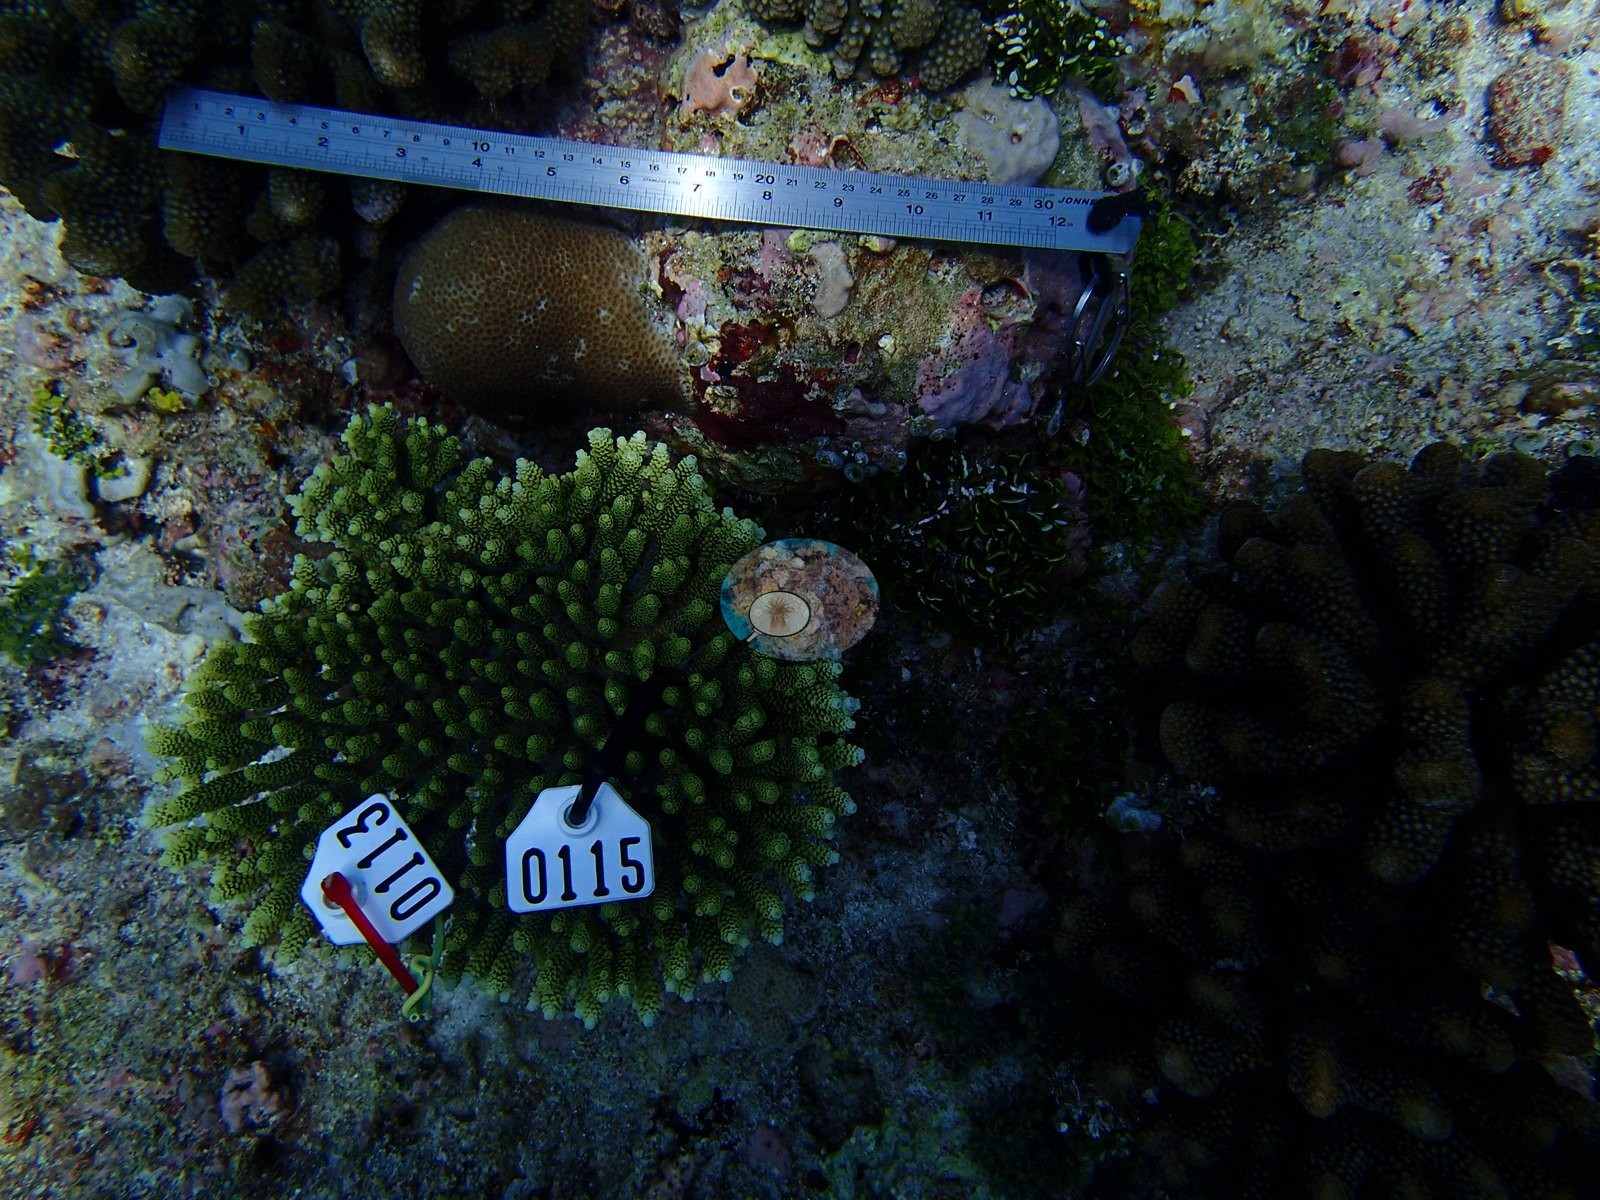
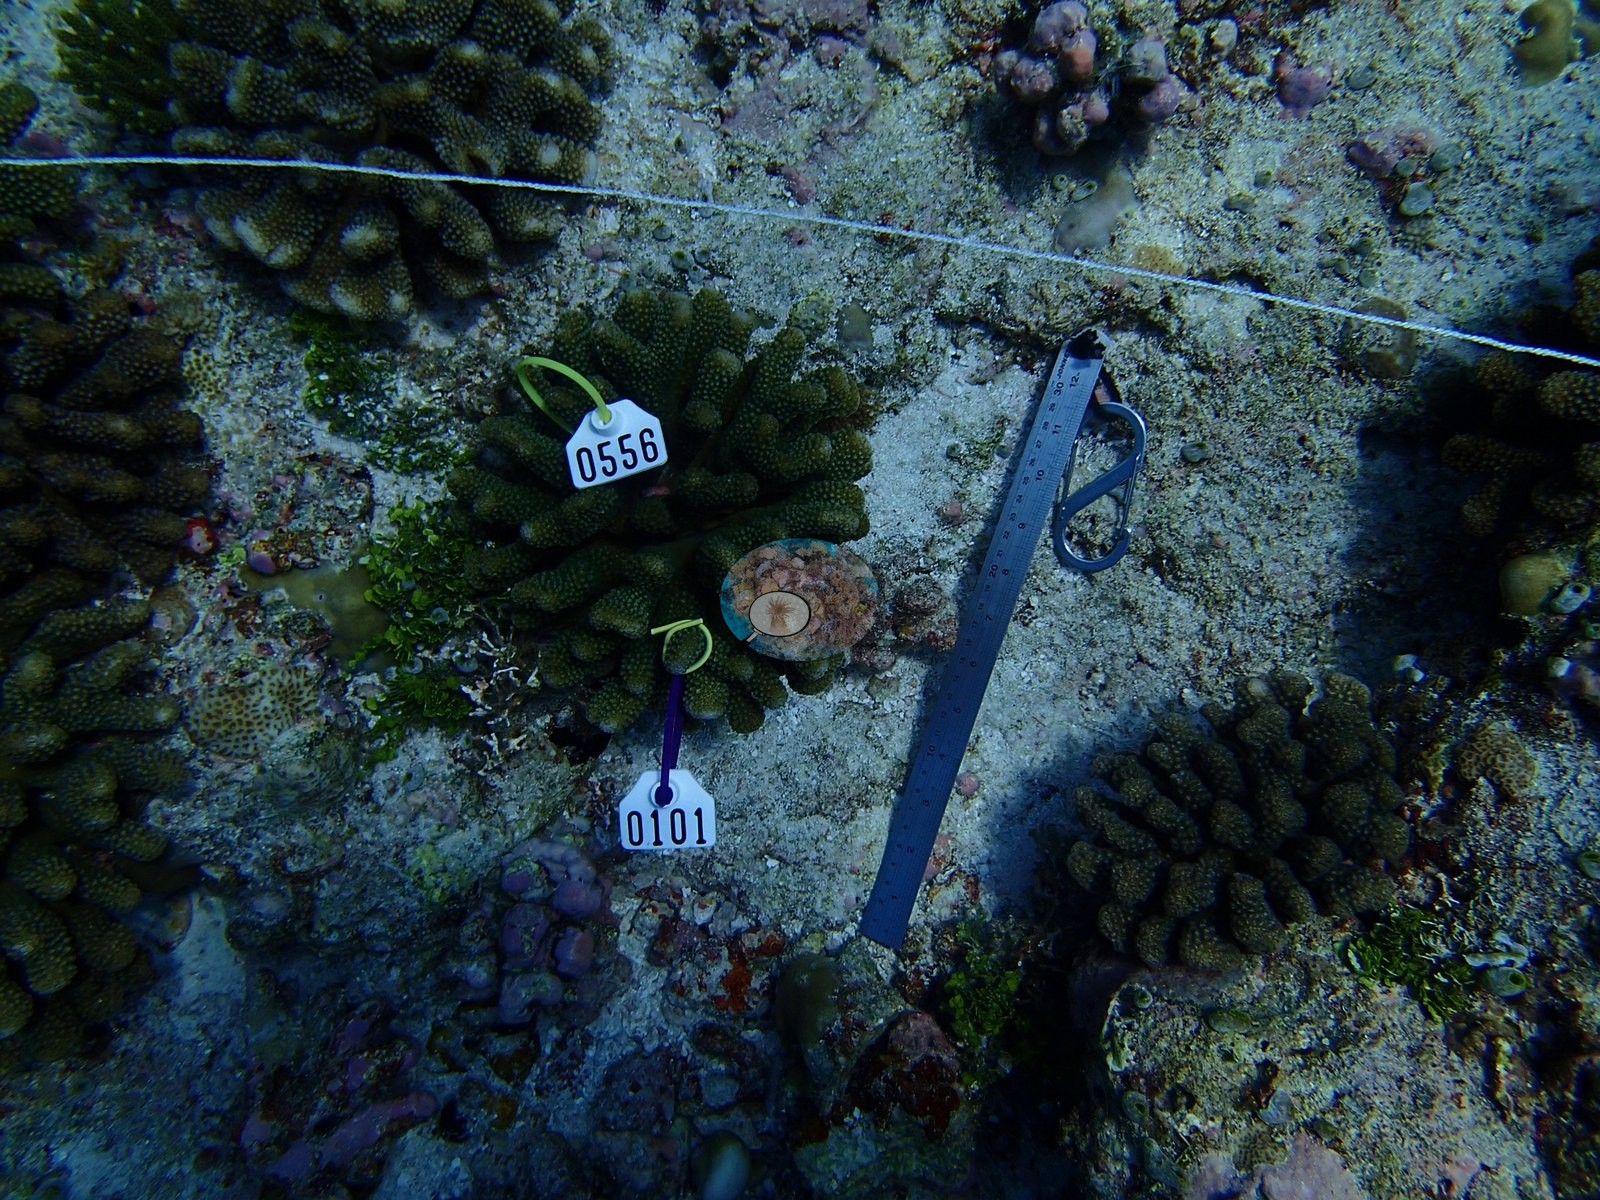
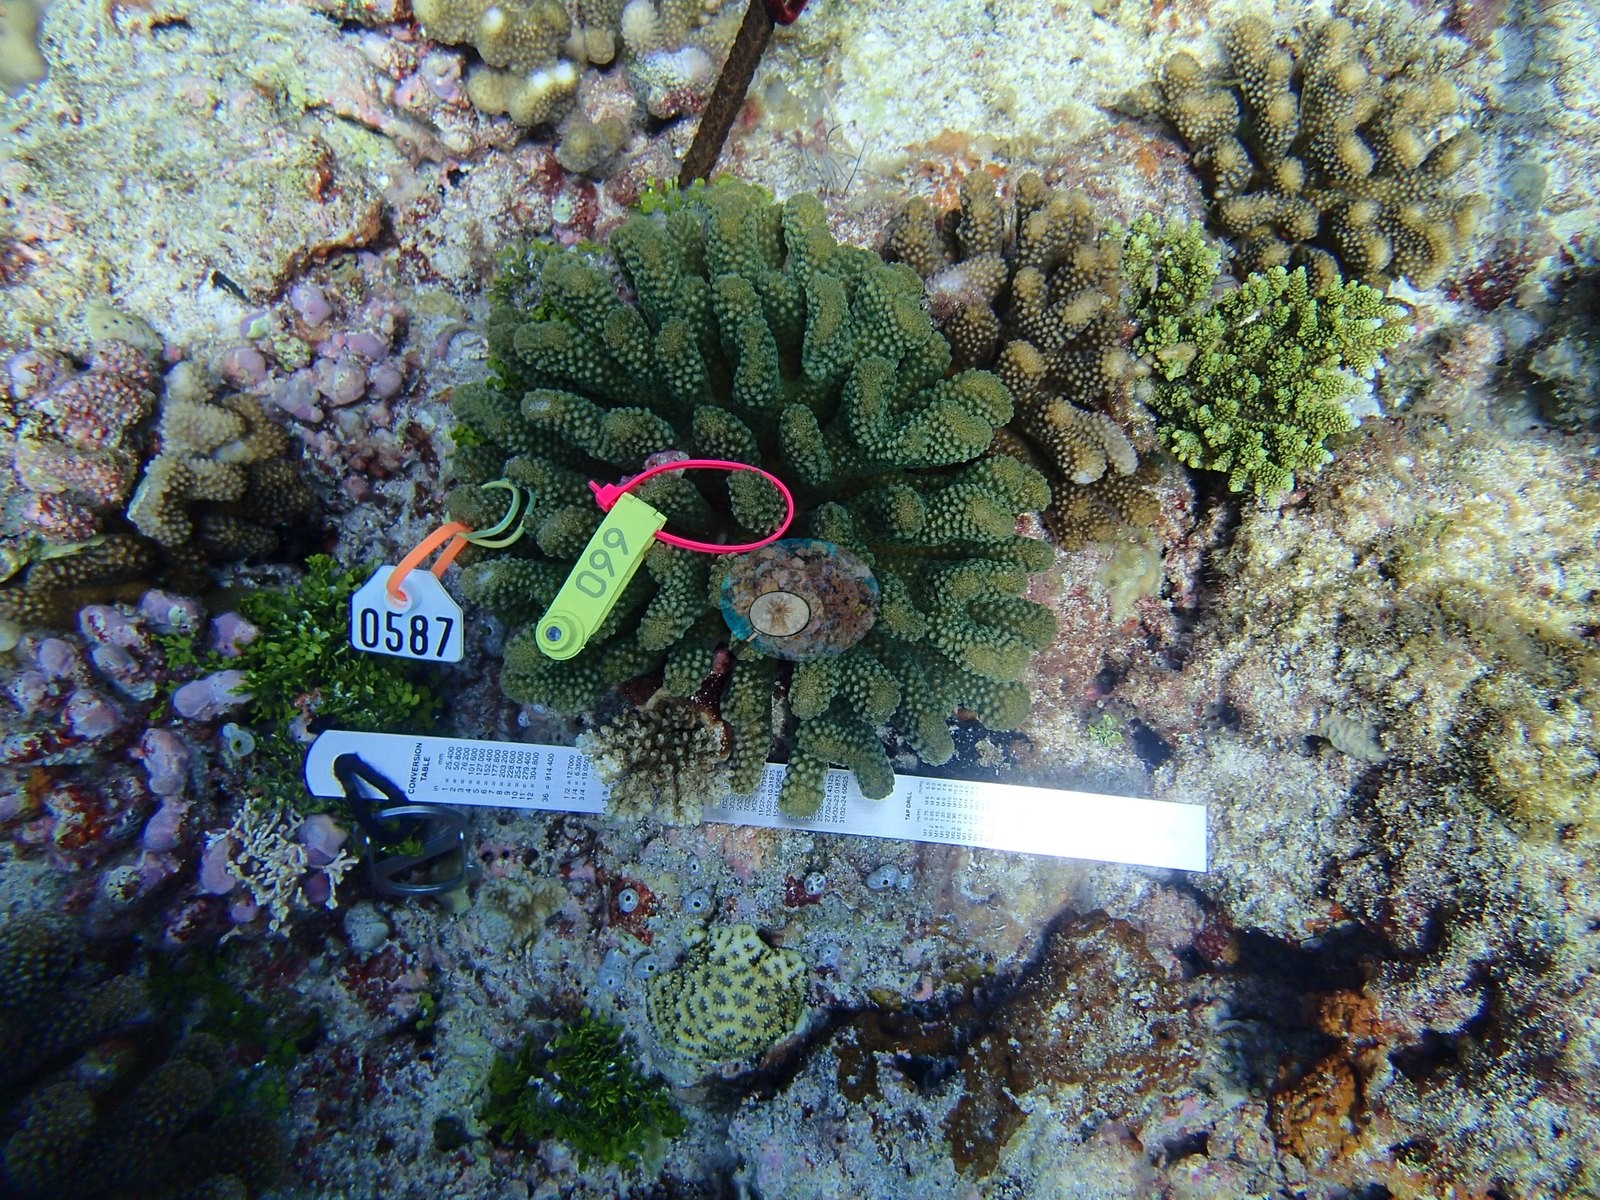
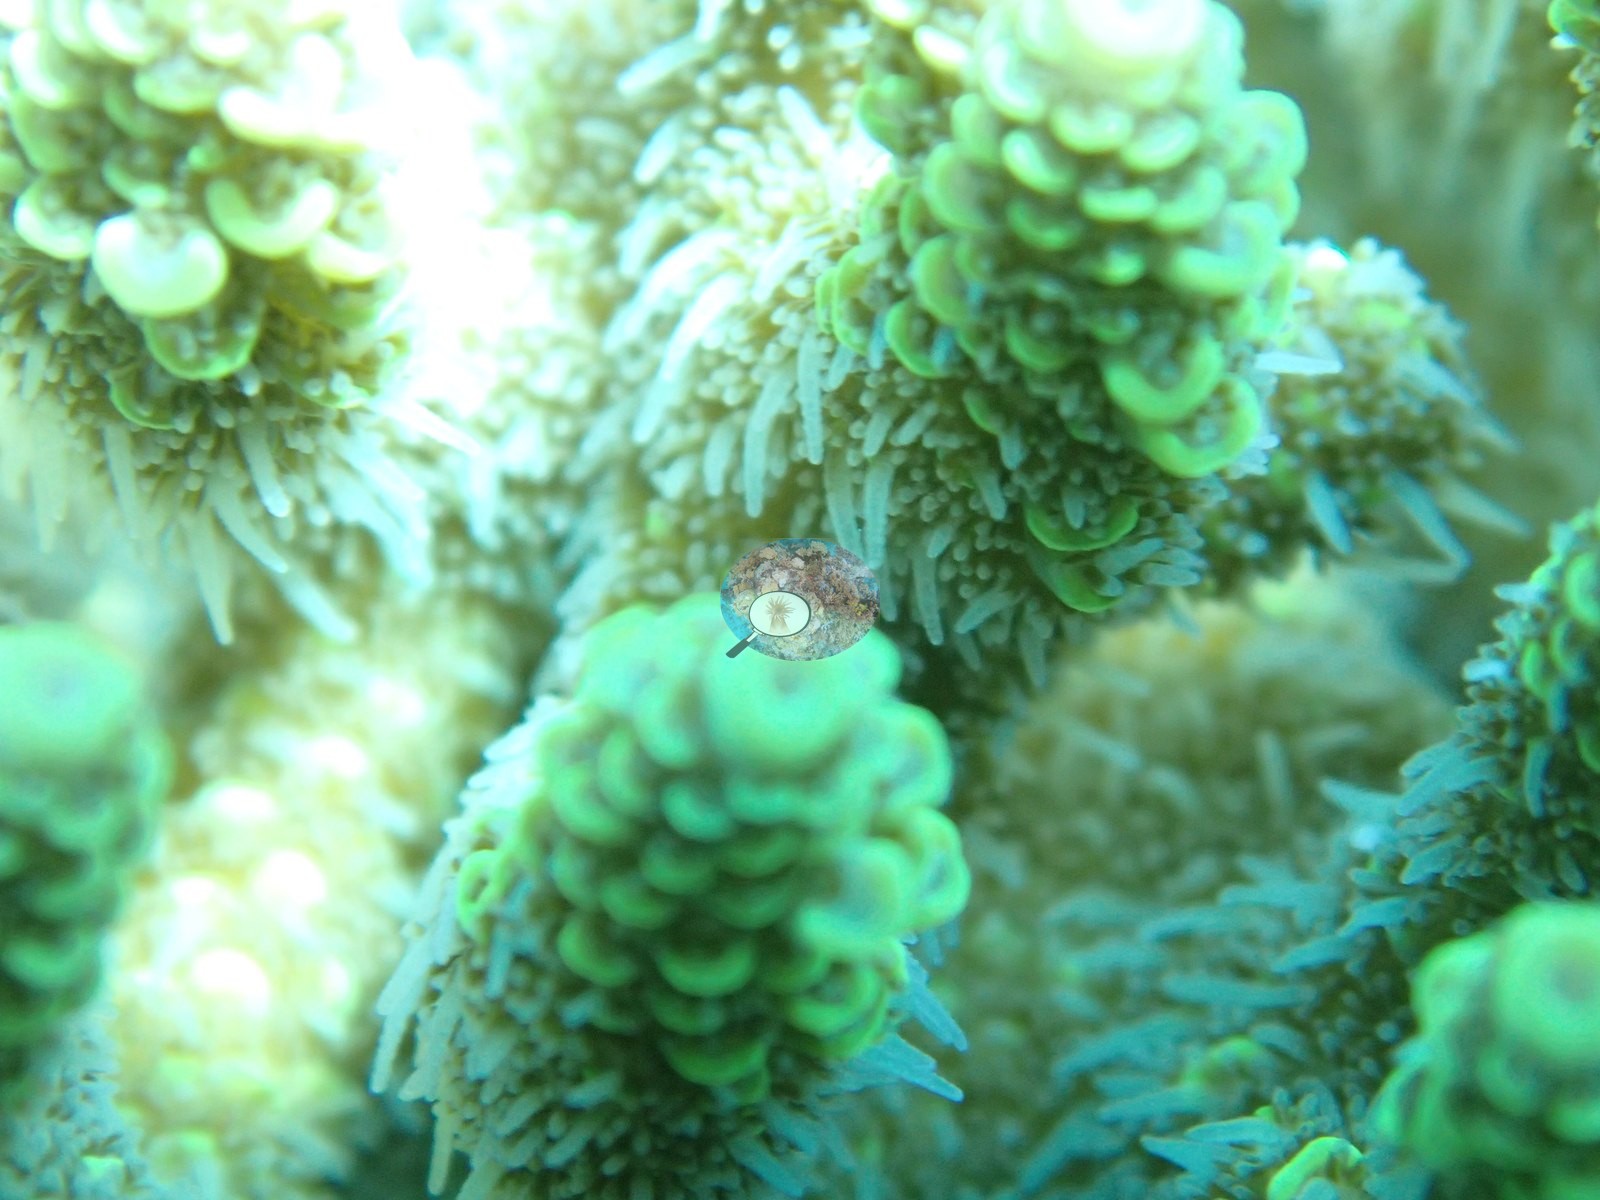
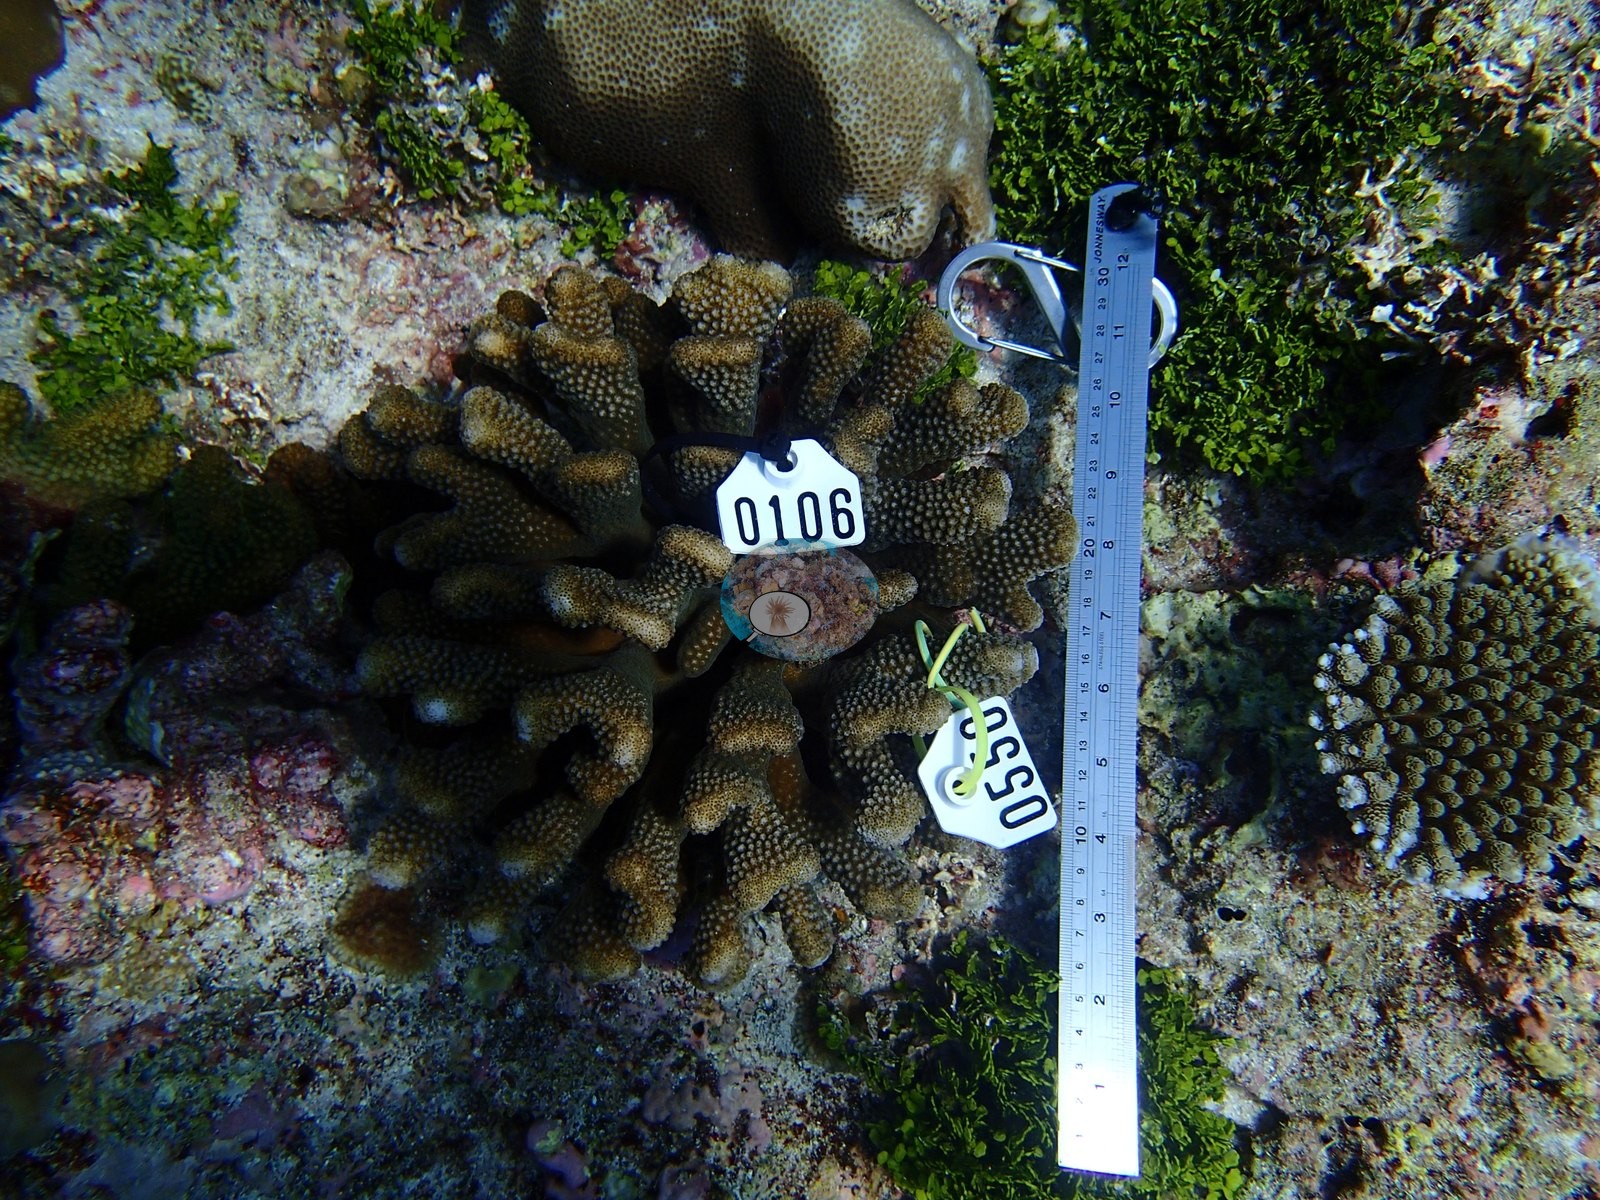
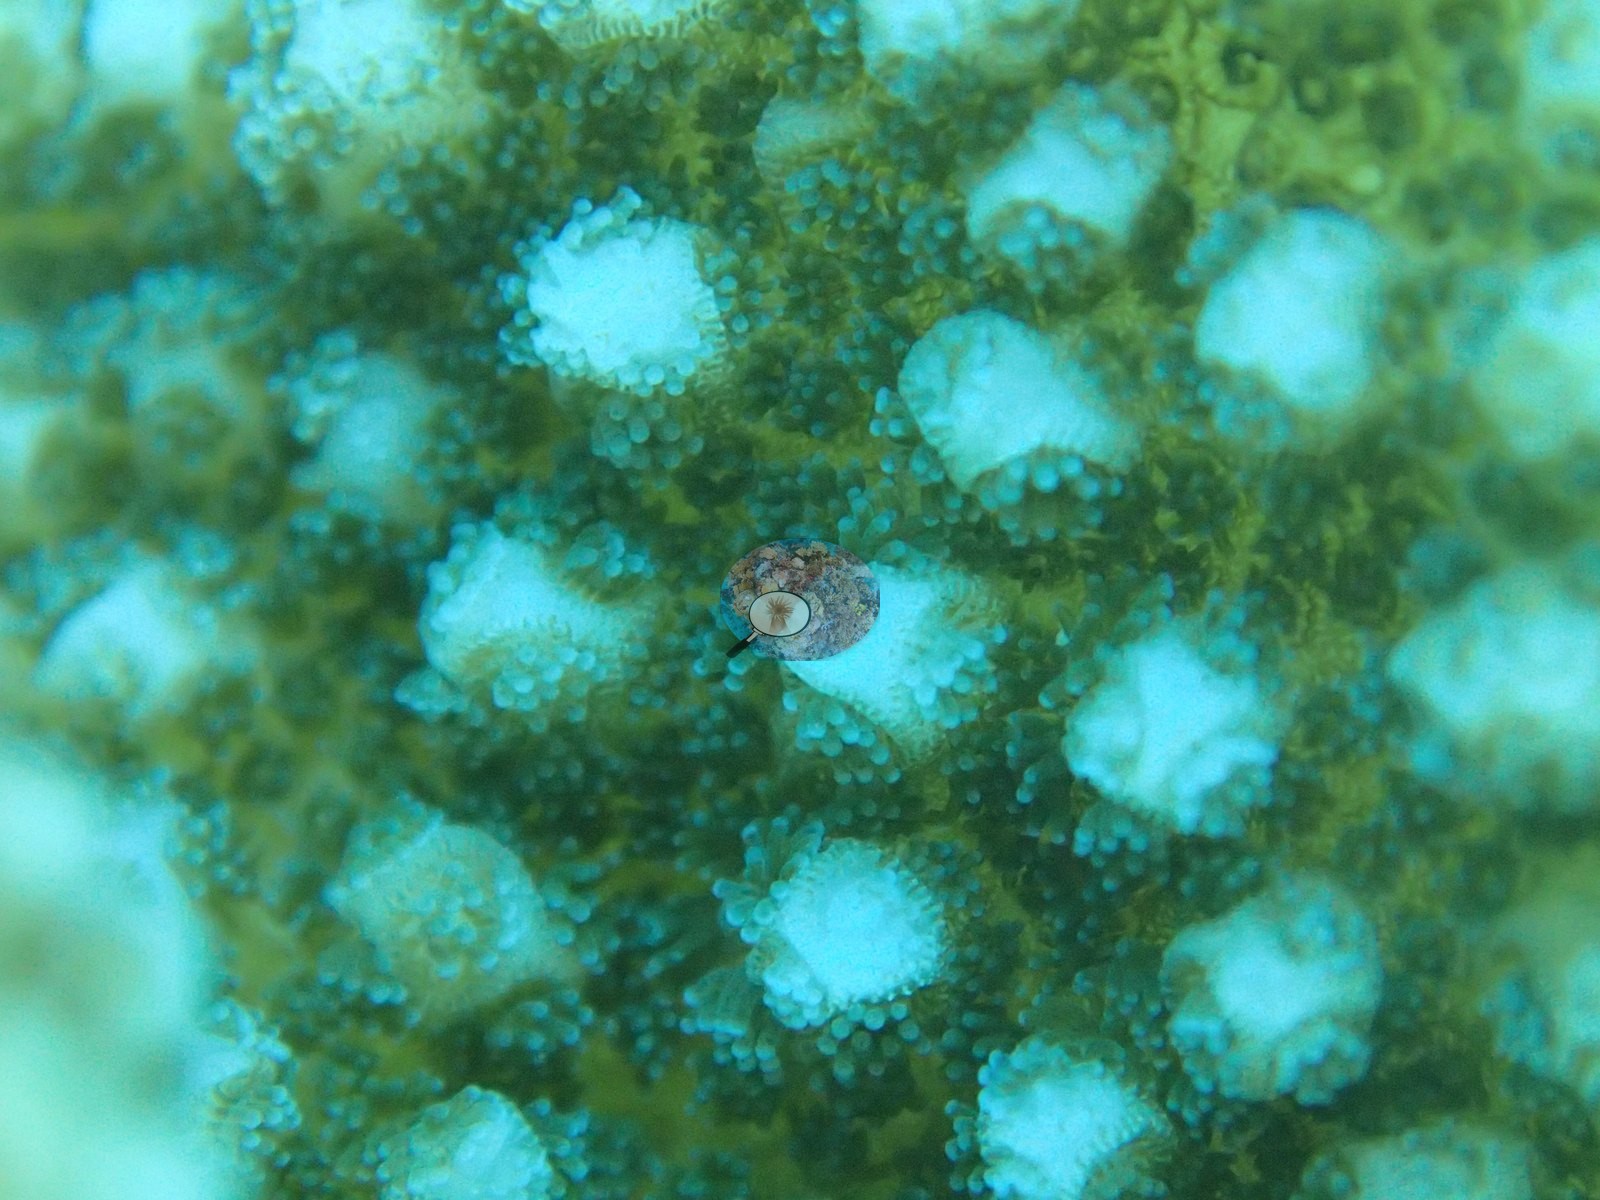
Cauliflower-like clumps compatible with Pocillopora share the ground with thick-fingered digitate and bushy staghorn forms compatible with Acropora — including one startling, almost fluorescent-green colony photographed with its polyps extended in broad daylight — plus honeycomb-surfaced mounds compatible with Goniastrea and its faviid kin (e.g., Image 1, Image 3, Image 11, Image 24).
Coral cover
Coral cover: 30% — photo-derived, and the two methods disagree by 14.8 pp; treat cover as a range (23–38%). This site's figure is the mean of two independent computer vision passes over Anderson's own frames: a DINOv3 calibrated point classifier reads 23% and a CoralSCOP computer vision reads 37.8%, a spread of 14.8 percentage points. The map publishes the mean so sites can be sorted against one another, but the honest statement of what is known here is the 23–38% range: the two products have different denominators and should not be treated as one measurement.
Stressors
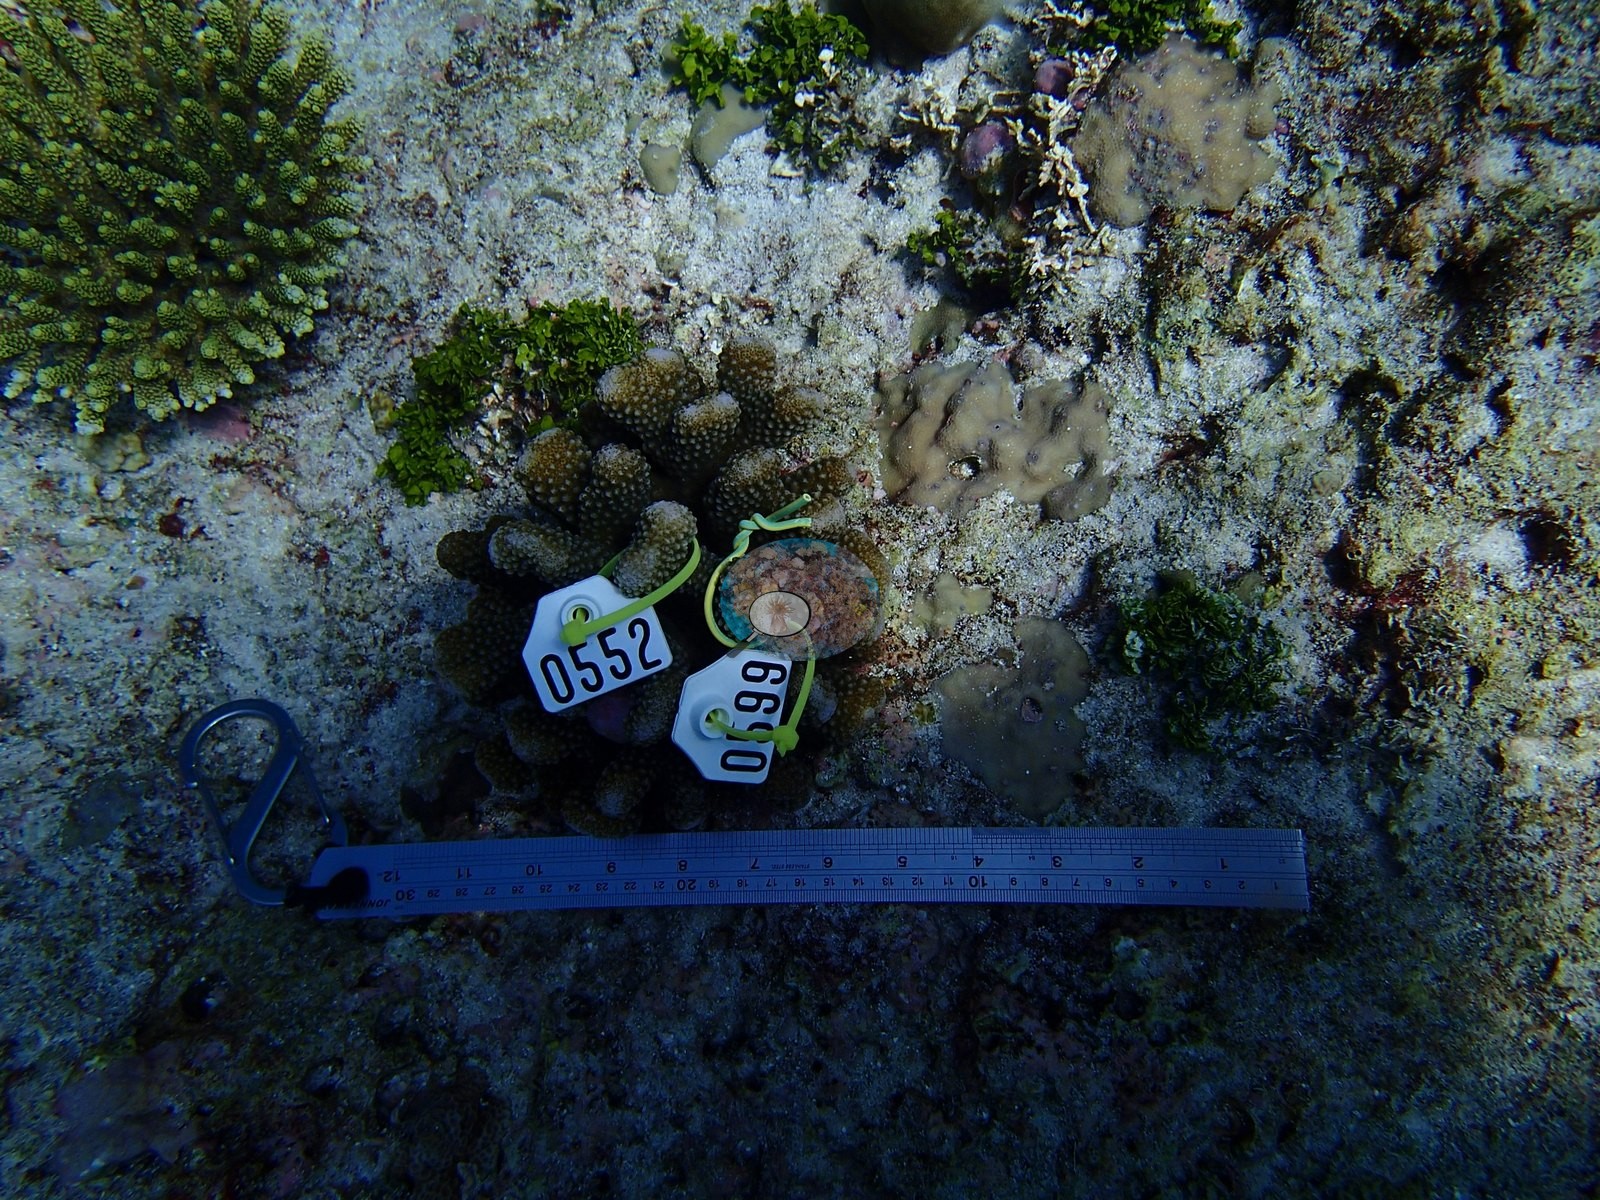
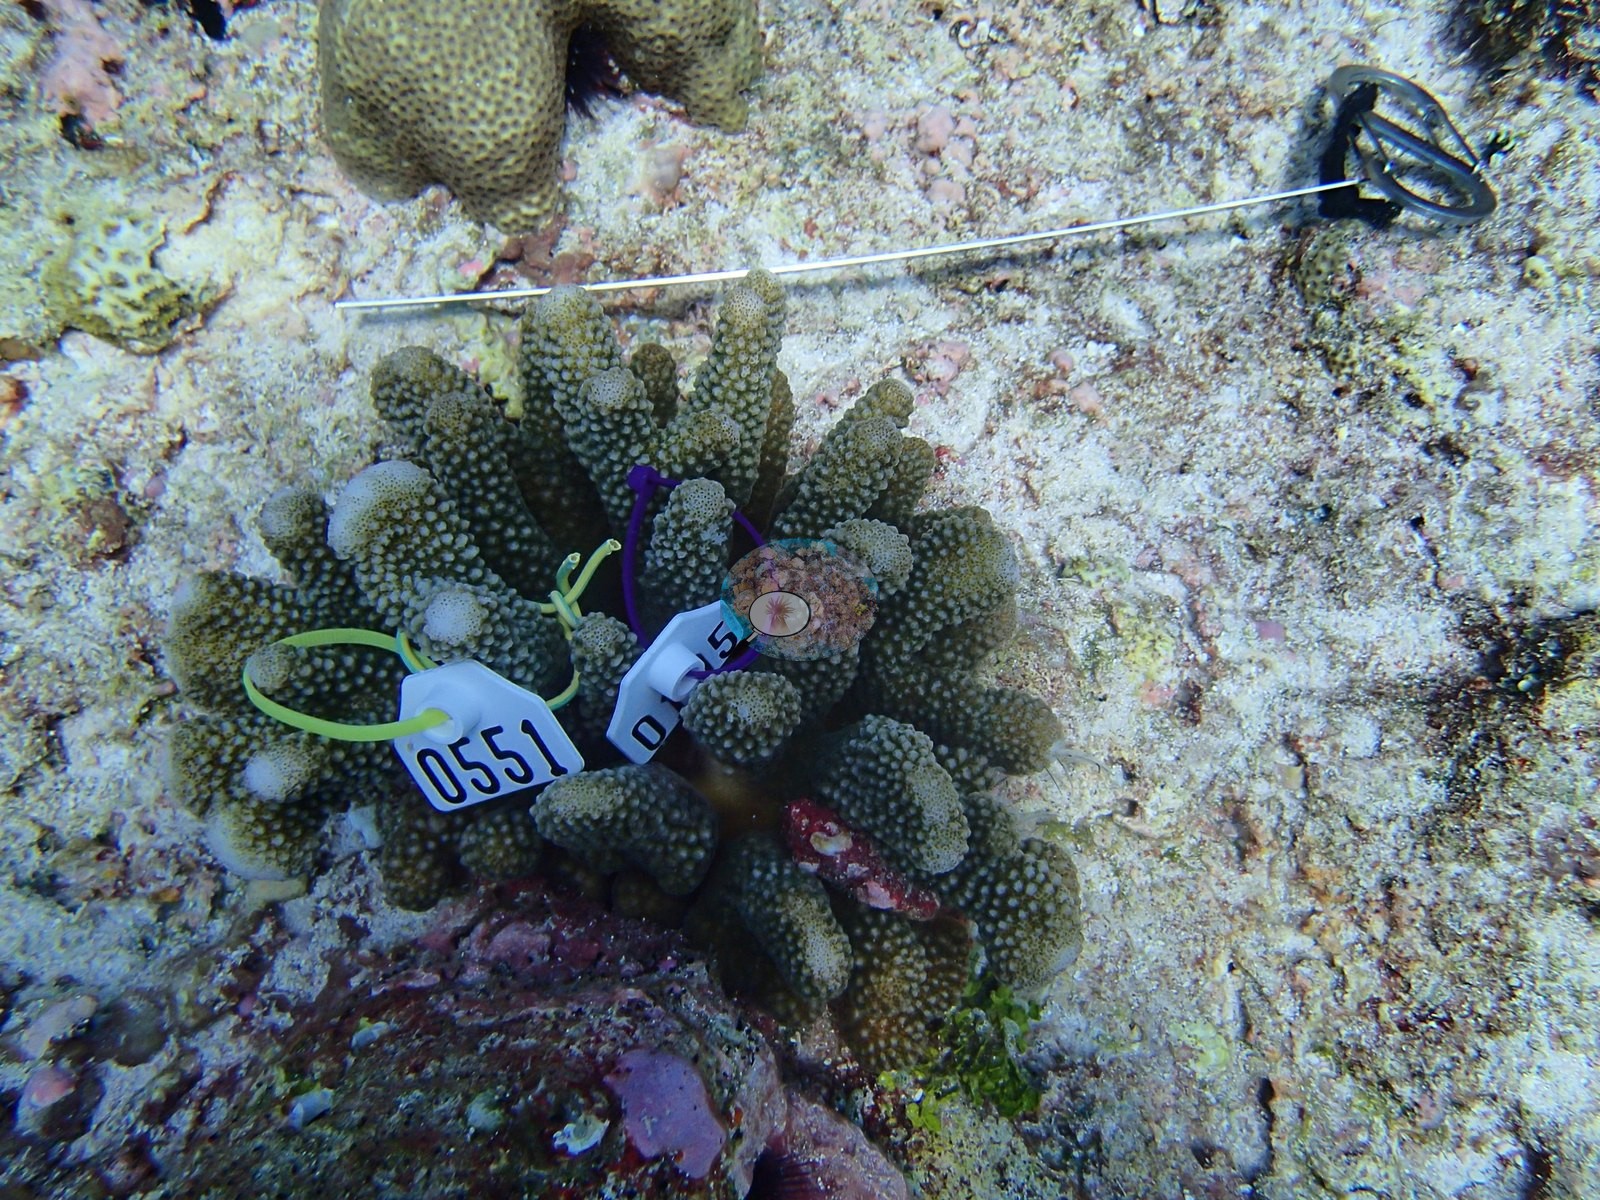
In January 2016 these photos, taken along research transect lines with numbered tags and rulers, caught the reef healthy and well-pigmented (e.g., Image 17).
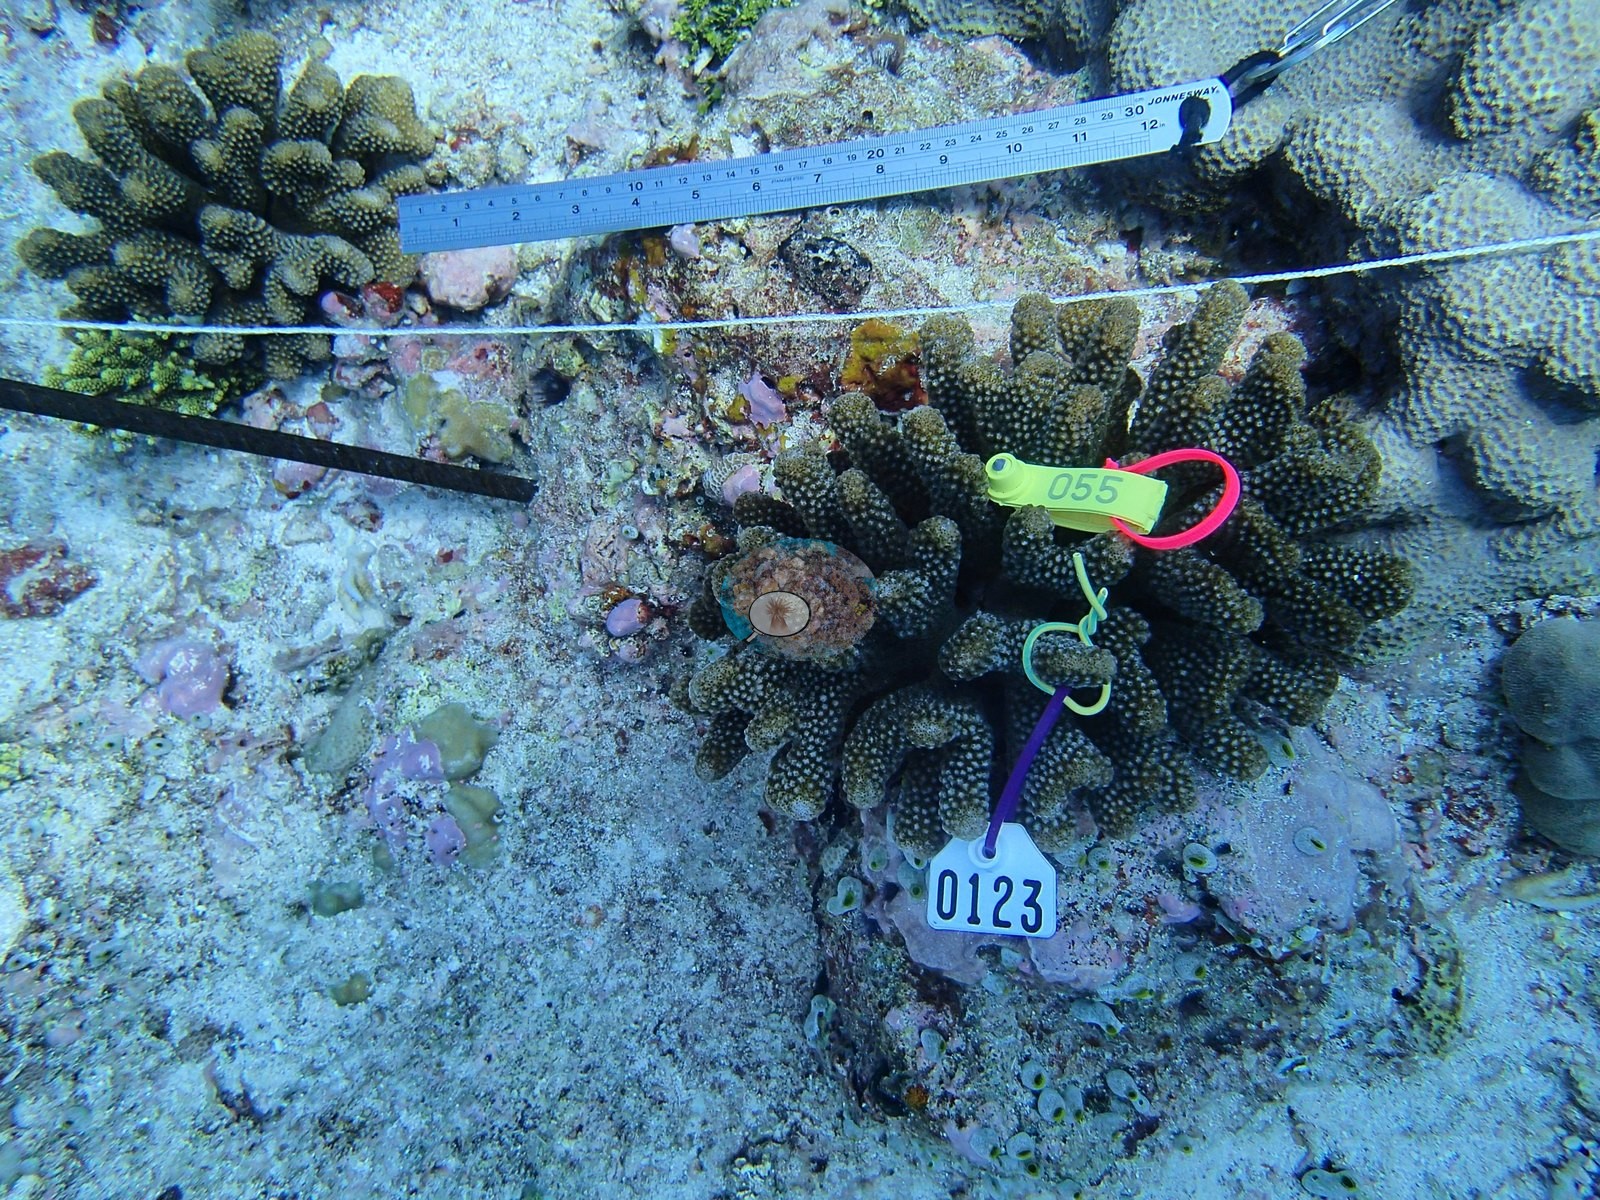
Months later the picture changed utterly: when the same reef was resurveyed in April 2016 at the peak of the El Niño marine heatwave, more than nine of every ten coral colonies here were bleached. No crown-of-thorns starfish (COTS) or other corallivores evident.
Comparisons with other data
No independent survey was made at this exact site; the nearest ones are listed in the table below.
CV model comparison
More info
As of September 2026 no computer-vision method estimates coral cover accurately on new images, so treat this as indicative rather than a measurement; it is revised as the methods improve.More info
The published figure is the mean of the two methods.| Method | Hard-coral cover (%) |
|---|---|
| In-house DINOv3 | 23.0 |
| CoralSCOP | 37.8 |
| Mean (± SD) | 30.4 ± 10 |
| Range | 23.0–37.8 |
Mean ± SD and range are across the computer-vision methods shown.
Independent surveys nearby
| Agency / program | Year(s) | Stations / distance | Link |
|---|---|---|---|
| Montefalcone et al. (2020) | 2015 | 1 station, 2.72 km | Records ↓ |
| Reef Check | 2022 | 1 station, 0.87 km | Records ↓ |
 Dr. Coral (CRD)
Within 5 km, 2 independent survey stations recorded hard coral cover in 2 surveys between 2015 and 2022. One survey since 2021 recorded 19%. This site's own estimate (30%) sits 11.0 points above the recent value (19%); the methods differ, so the comparison is context, not a like-for-like test.
Collected by other programs using different methods (Reef Check uses point-intercept transects), so these are context for the figures above, not a like-for-like comparison. Where a station was surveyed more than once the range is shown. Station names are not dive-site names. Values marked best patch exceed 70%: surveyors usually chose the richest area, so they are not site means.
| Agency | Site / location | Date | Hard coral cover (%) | Distance | Link |
|---|---|---|---|---|---|
| Montefalcone et al. (2020) | Cocoa Corner | 2015 | 76% best patch | 2.72 km | HeatCRD database |
| Reef Check | Gulhi Island Backreef | 2022 | 19% | 0.87 km | — |
Data & links
All images from Coral Reef Diagnostics. Data are from Coral Reef Diagnostics and the organizations named in the data-sources table above.
© Coral Reef Diagnostics.