
Maldives - Fish Tank

Part of the regional summaries: Maldives - Central (Male Atolls / Ari / Vaavu) and Maldives
More info
Maldives (NOAA CRW virtual station) · Maldives ecoregion mean=2.9°C-heating weeksA murky, coral-free sand-and-rubble patch that functions as an open-water aquarium - huge stingrays, trevally packs, and a fallen beam packed with giraffe-patterned honeycomb morays. Coral cover is negligible, around 8%.
Five independent survey stations shown with the program’s logo — click one to see how far it is from this site.
Three other CRD dive sites within 5 km shown in orange — click a marker to open its page.
5 of these 19 photographs are shown beside the text that discusses them under "Site description" below.
Site description
Setting
The name says it all: this murky patch of sand and rubble works like a big open-water aquarium, and the haze only makes the encounters more cinematic.
General benthic features
Zero coral, unforgettable fish.
Coral cover
Coral cover: 8.1% — photo-derived, and the two methods broadly agree (11% vs 4.9%). This site's figure is the mean of two independent computer vision passes over Anderson's own frames: a DINOv3 calibrated point classifier reads 11.2% and a CoralSCOP computer vision reads 4.9%, a spread of 6.3 percentage points. The map publishes the mean so sites can be sorted against one another, but the honest statement of what is known here is the 4.9–11% range: the two products have different denominators and should not be treated as one measurement. Anderson is actively trying out other CV models and intends to redo this CoralSCOP and DINOv3-based figure once something more dependable comes along.
Stressors
No crown-of-thorns starfish (COTS) or other corallivores evident.
Fish and other fauna
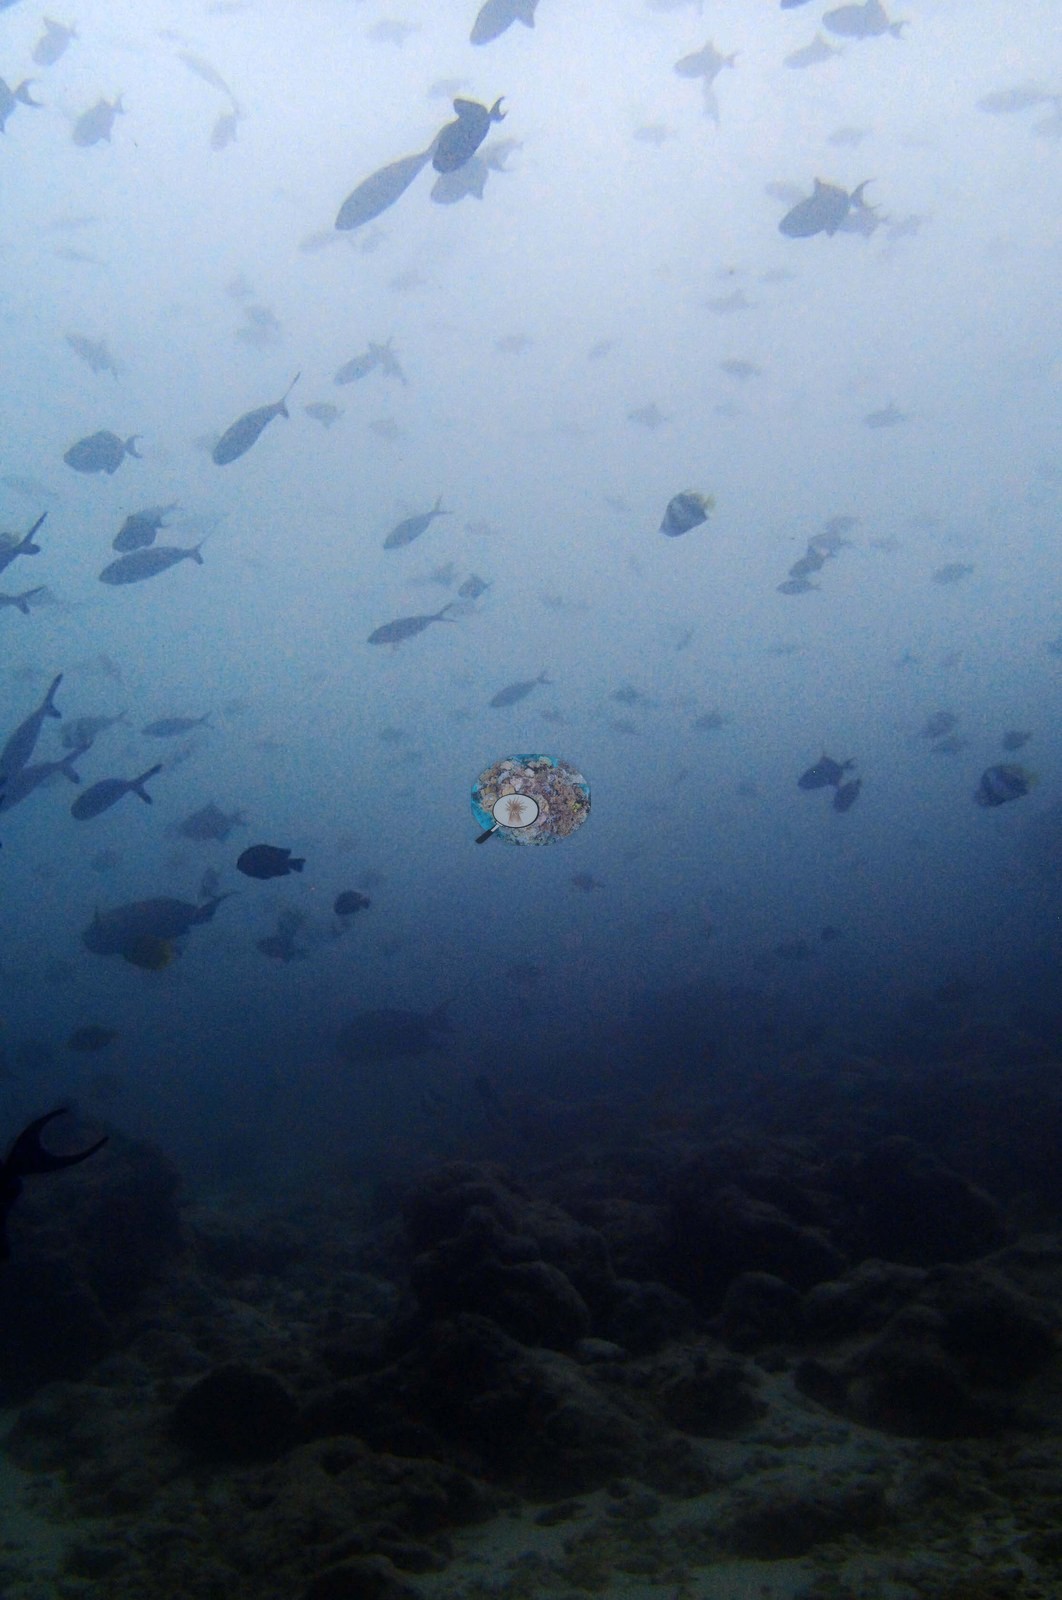
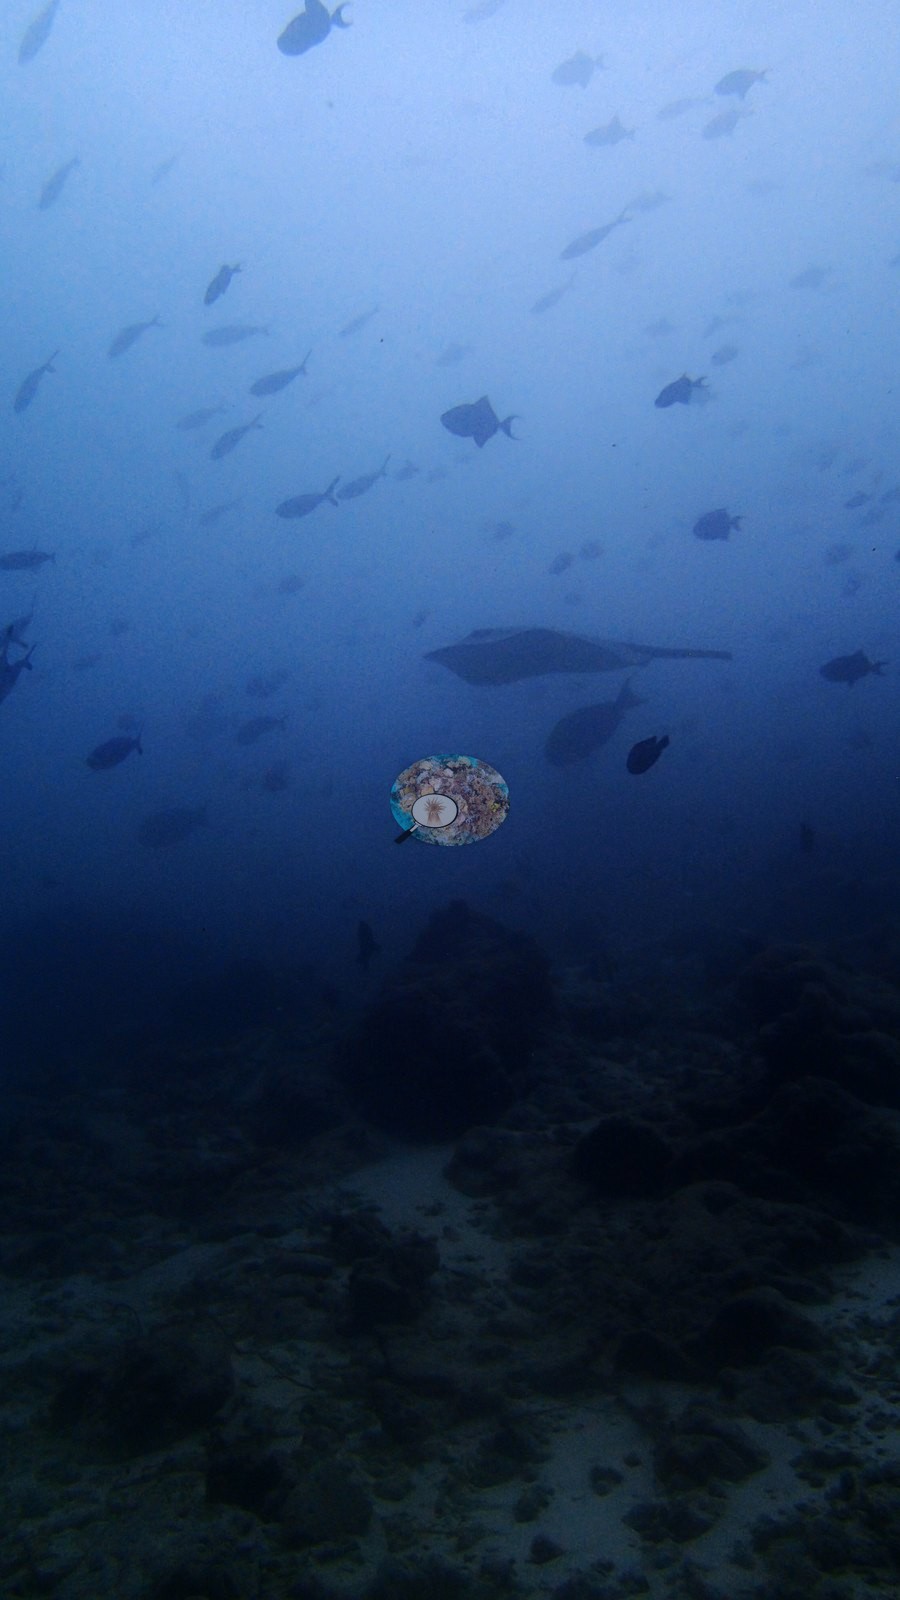
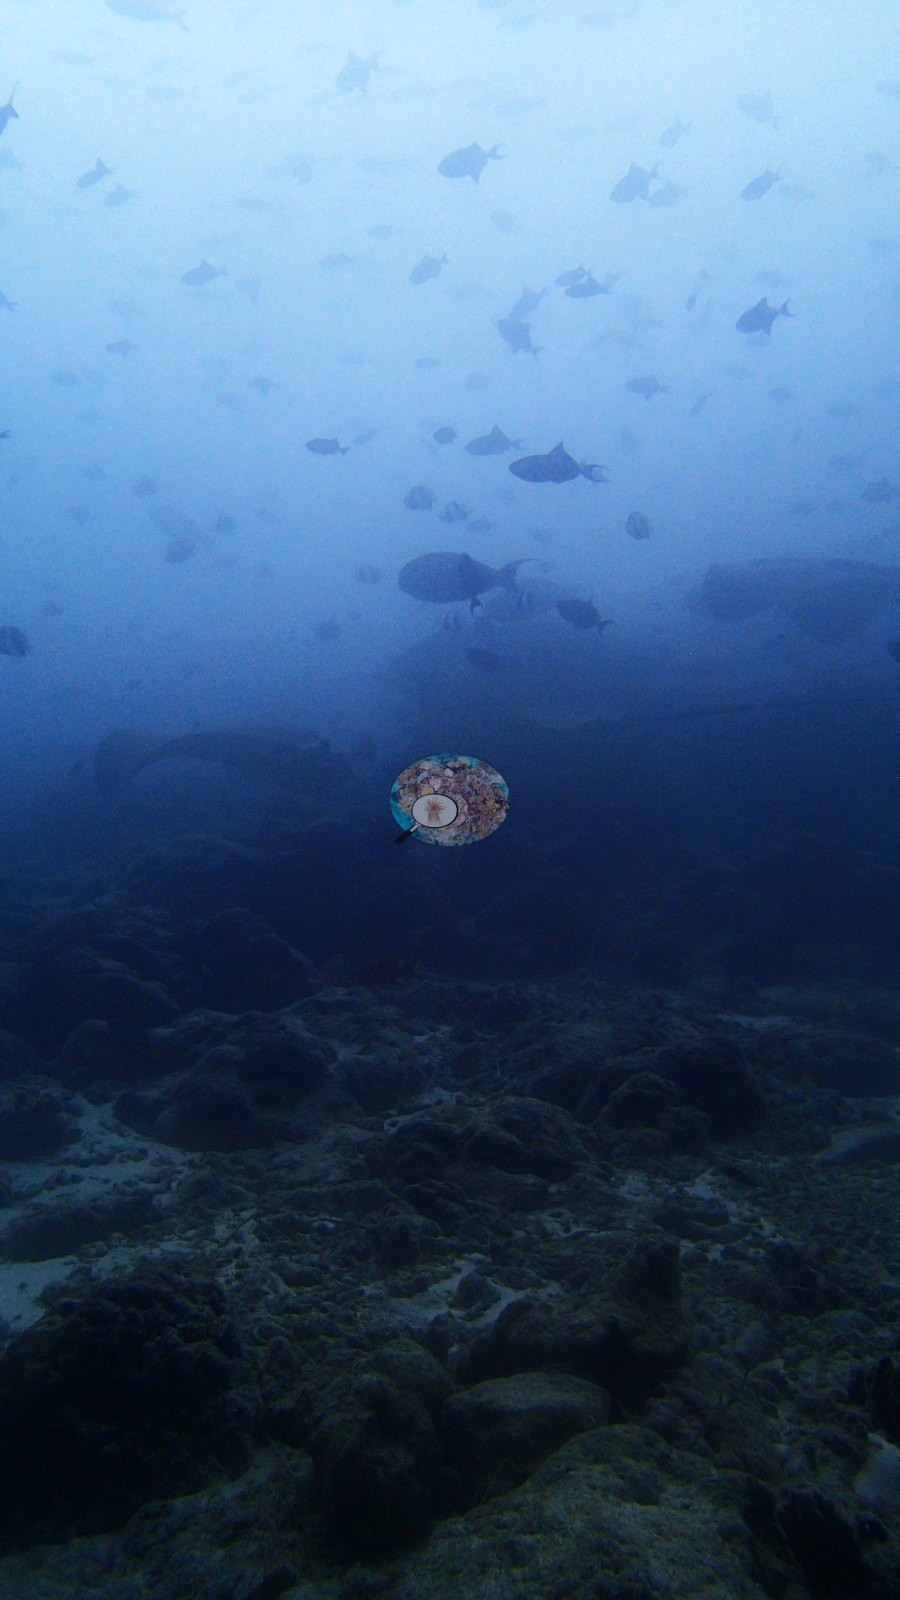
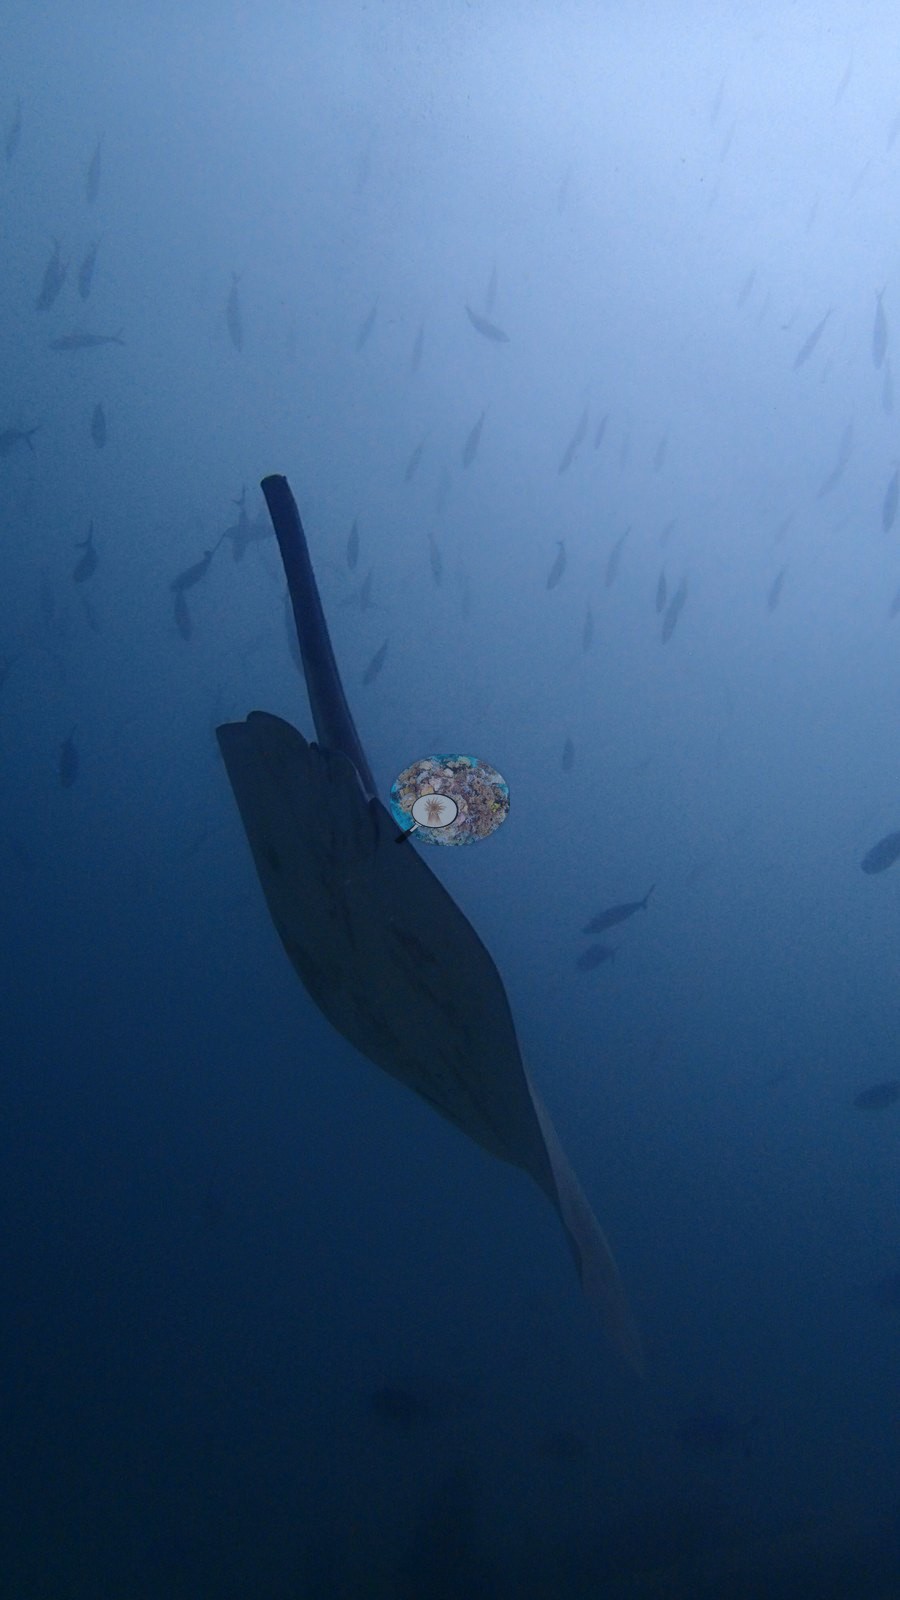
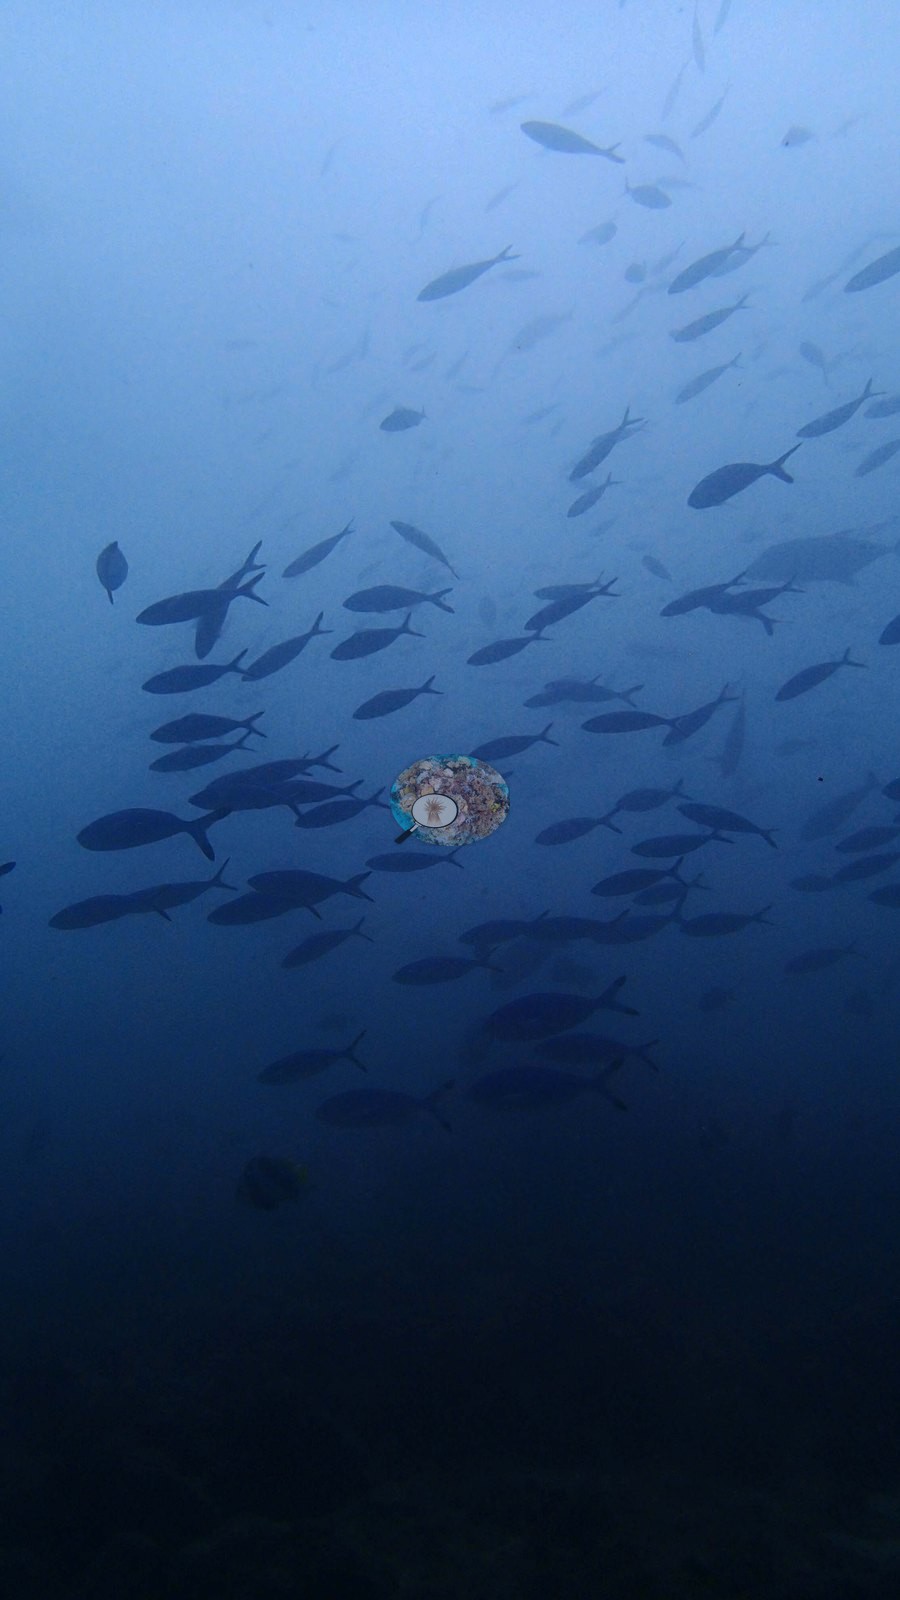
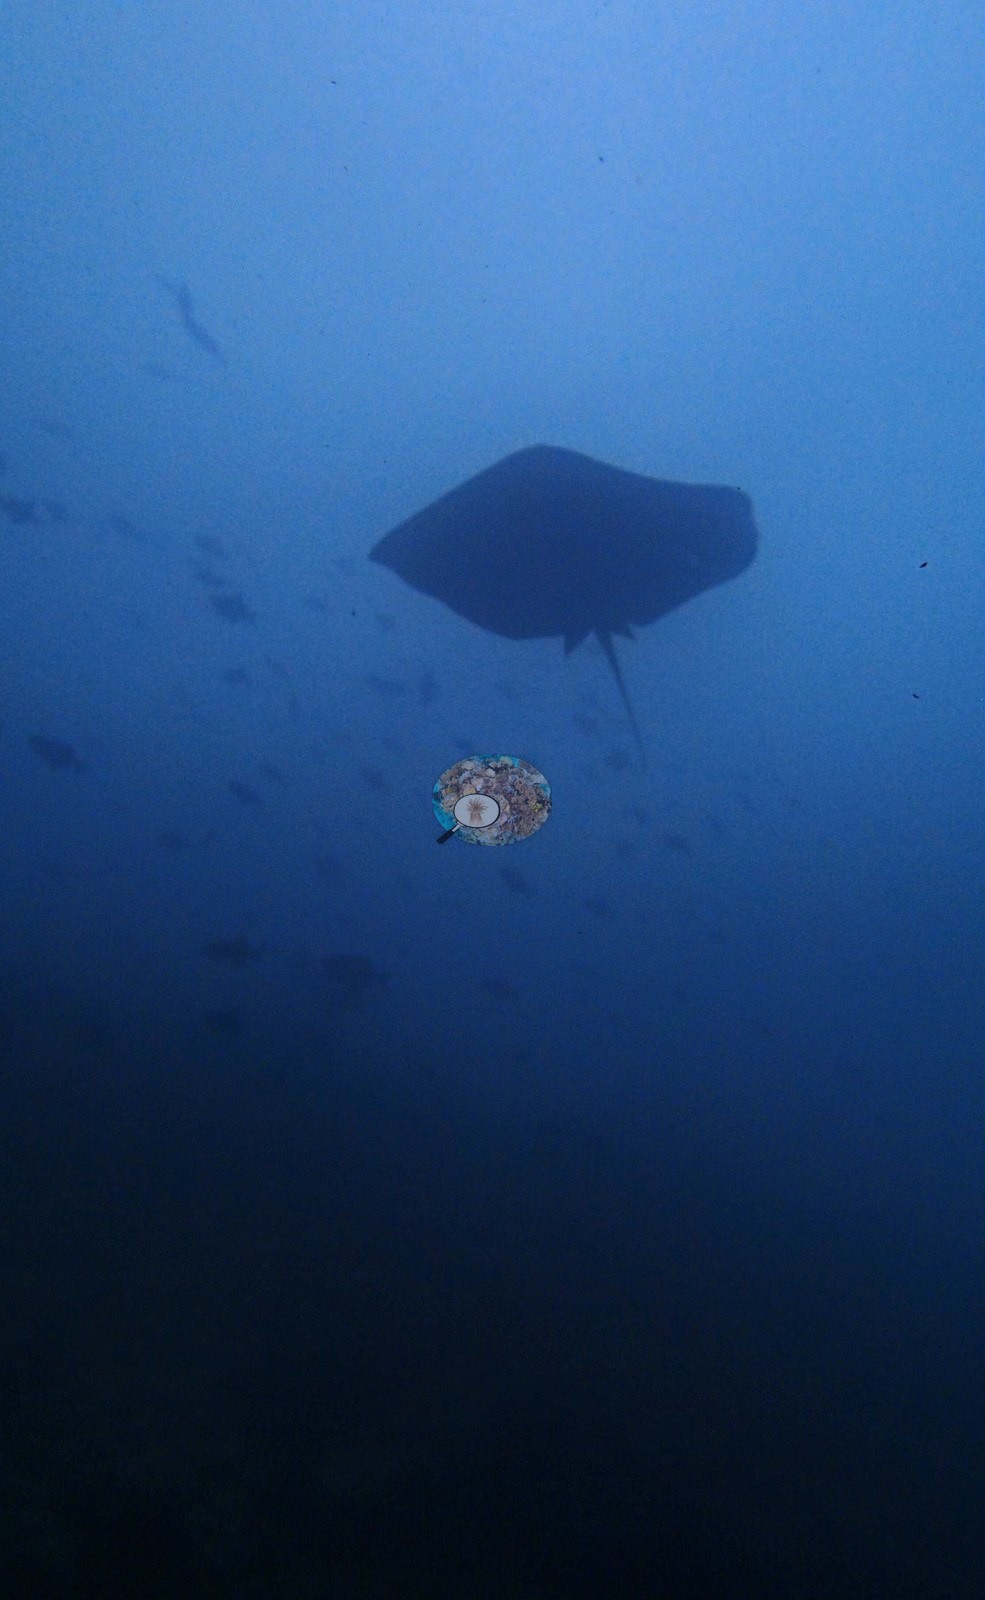
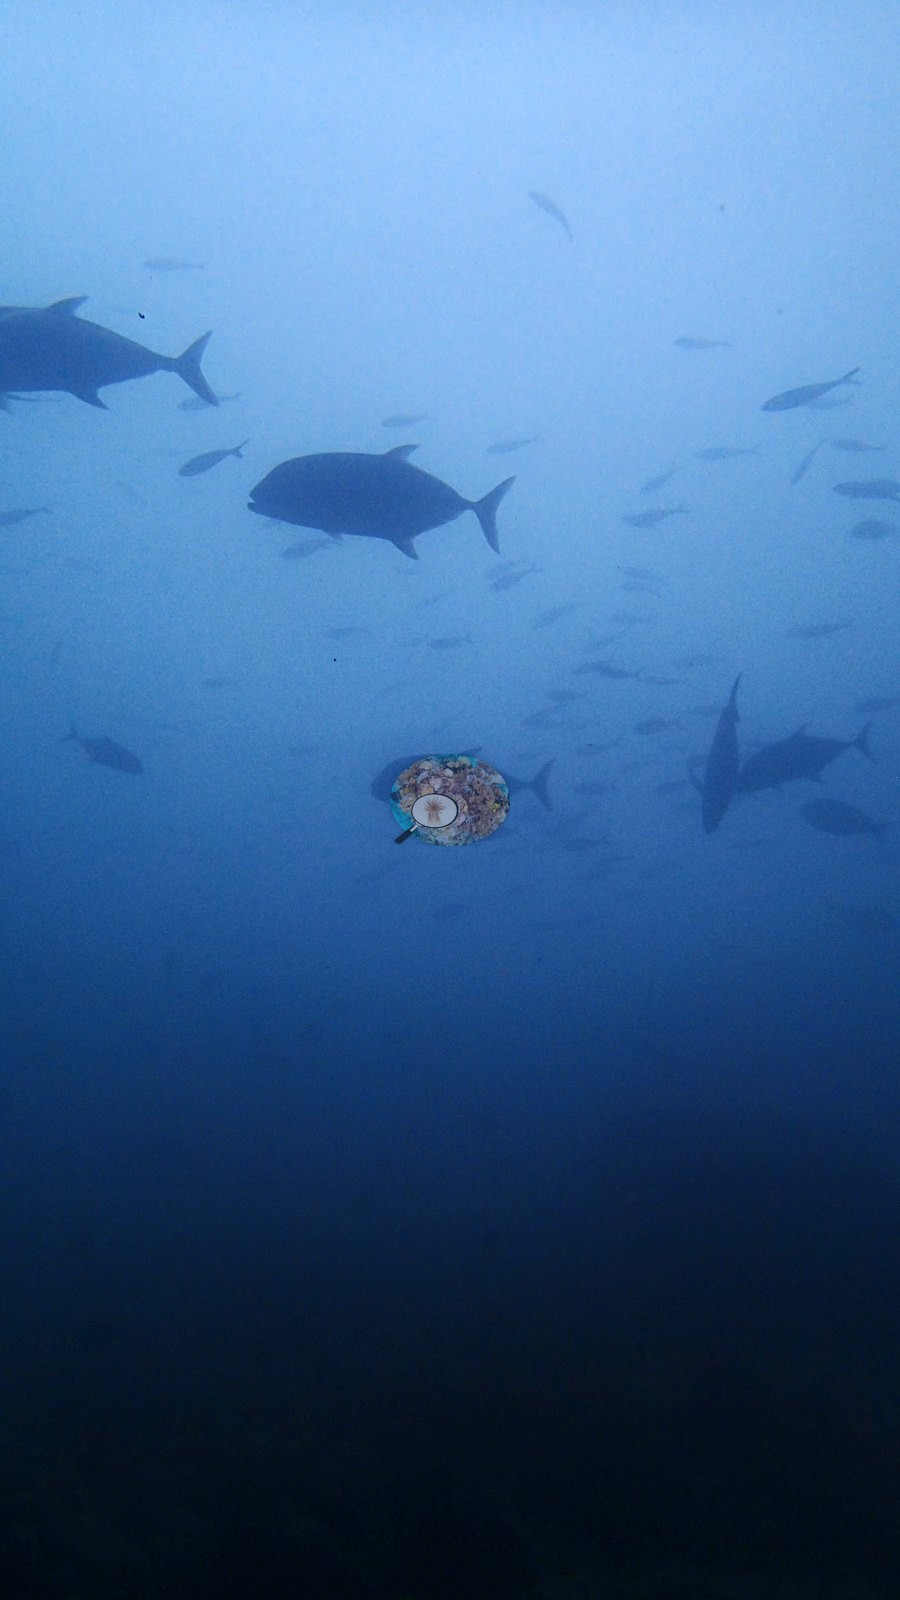
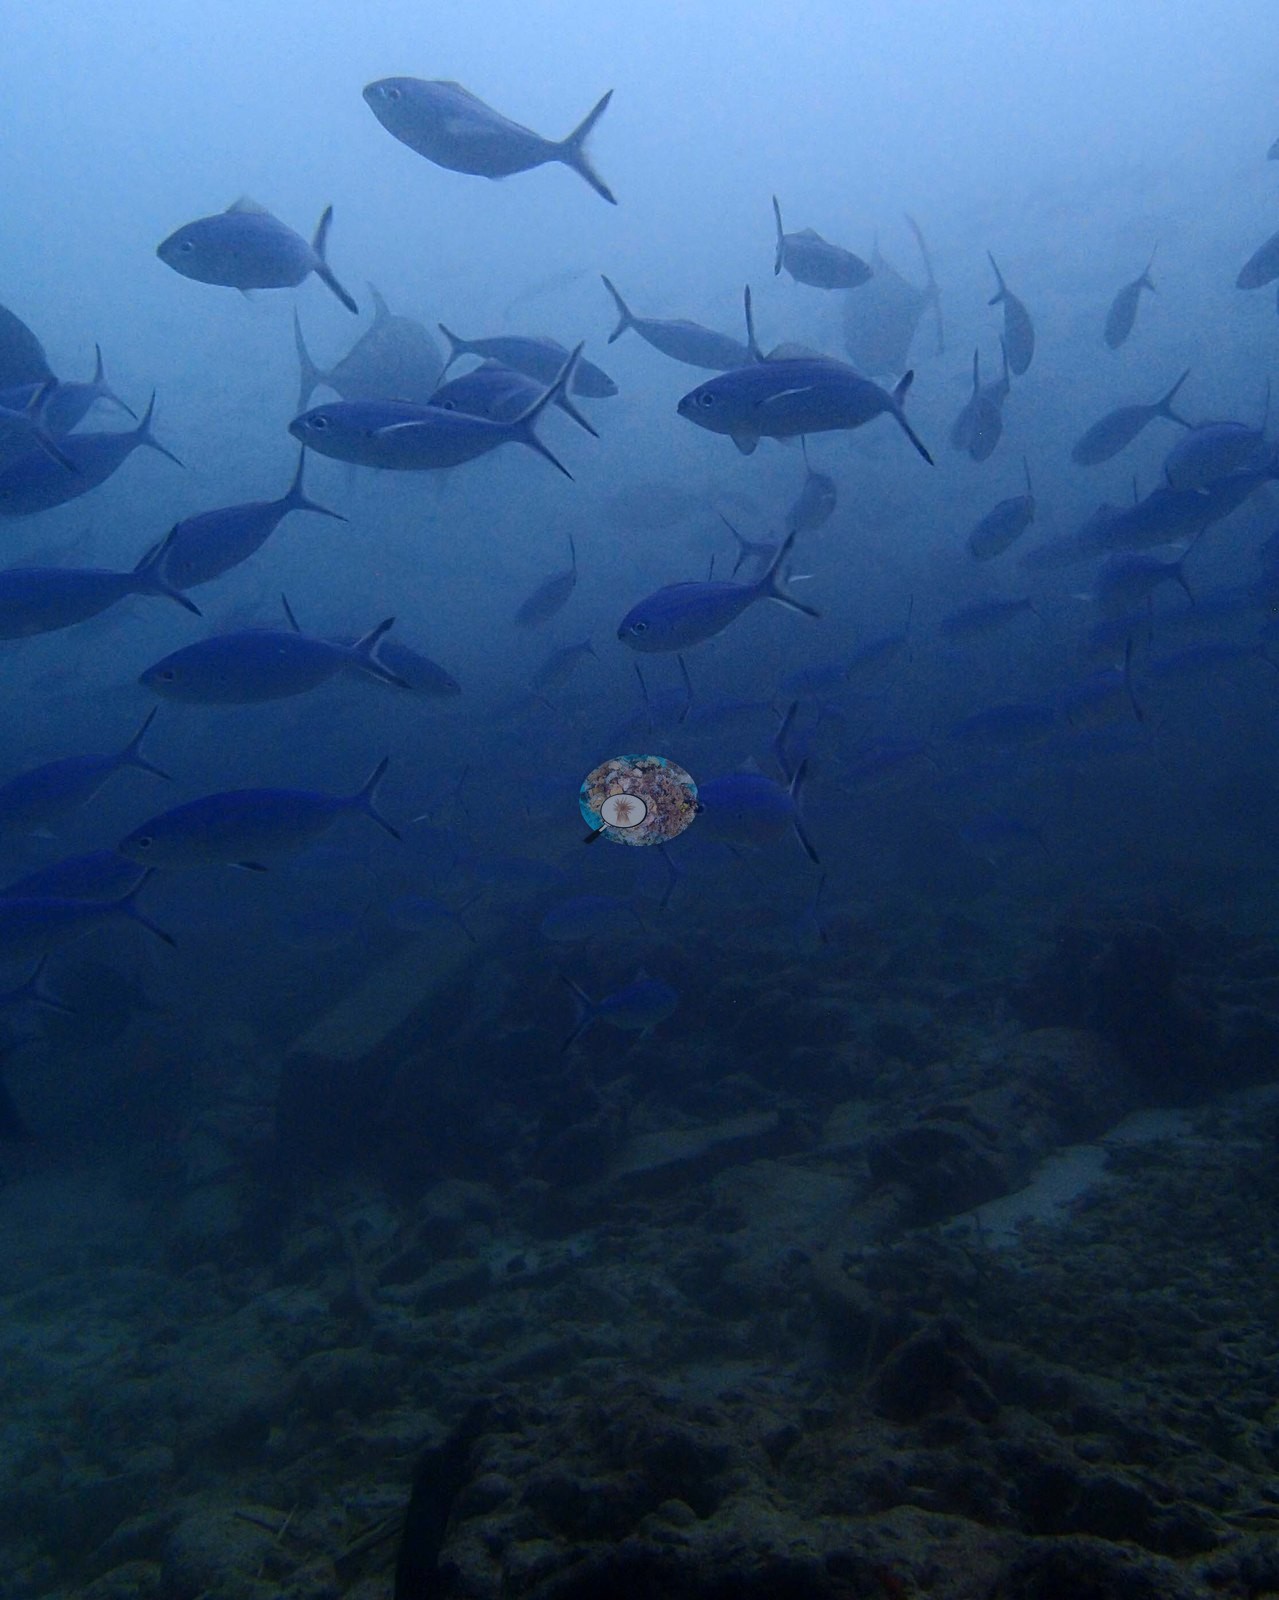
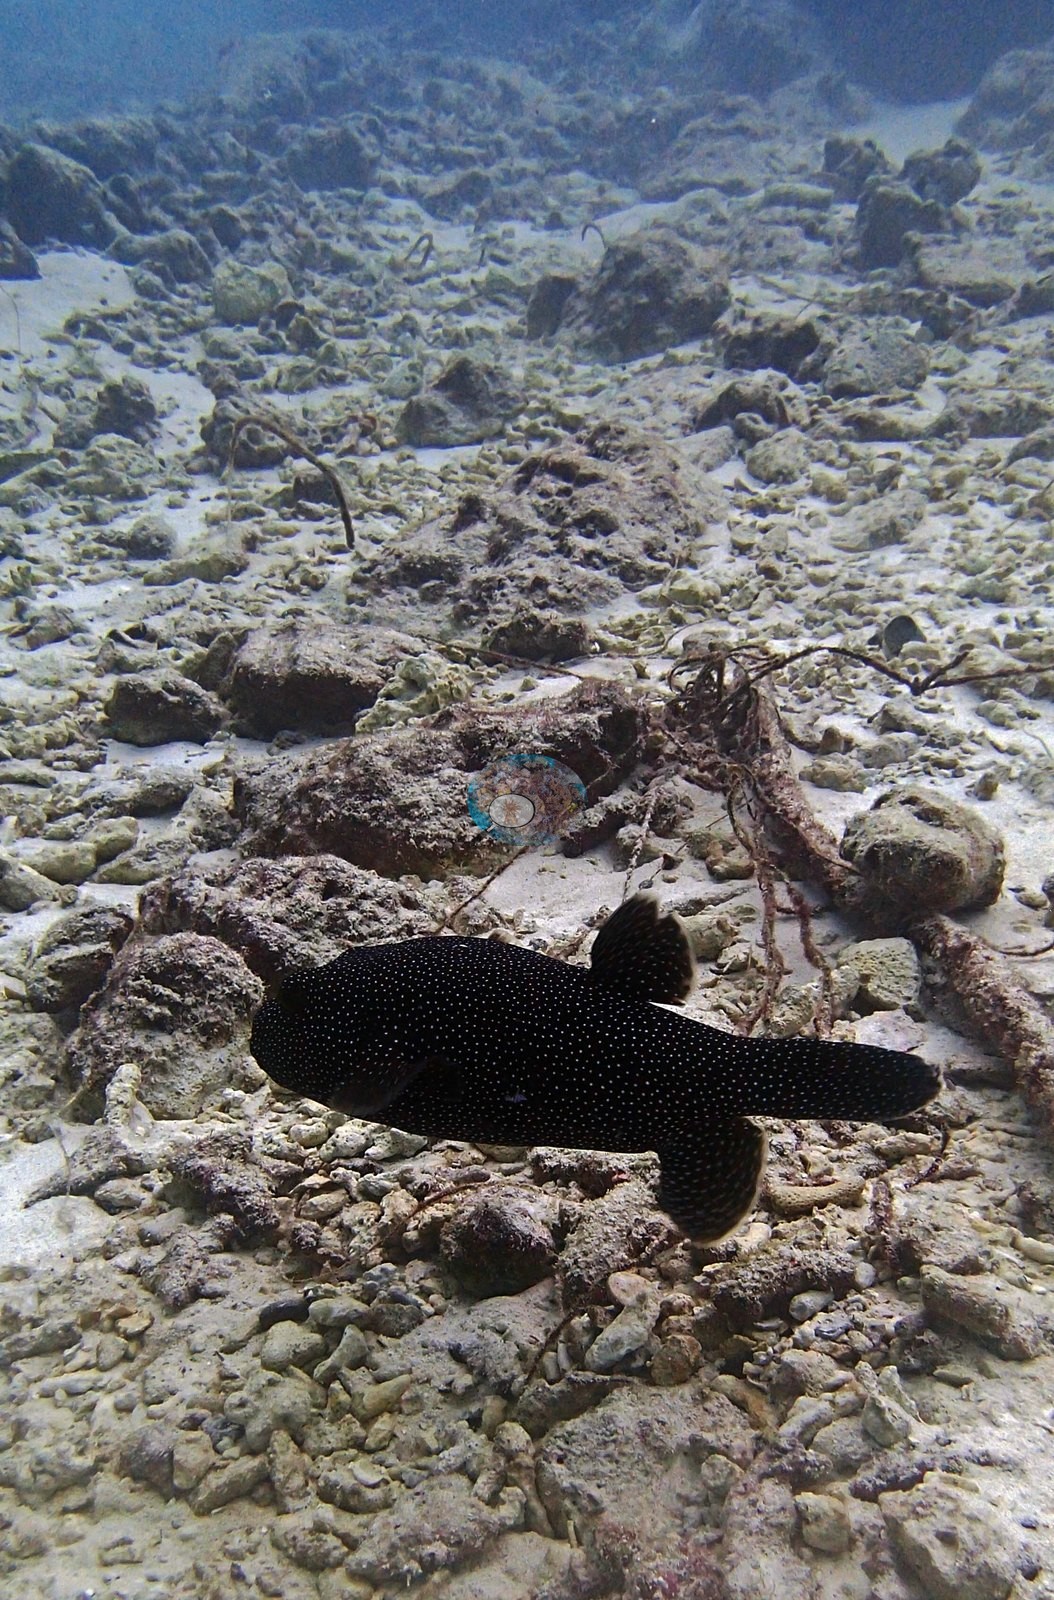
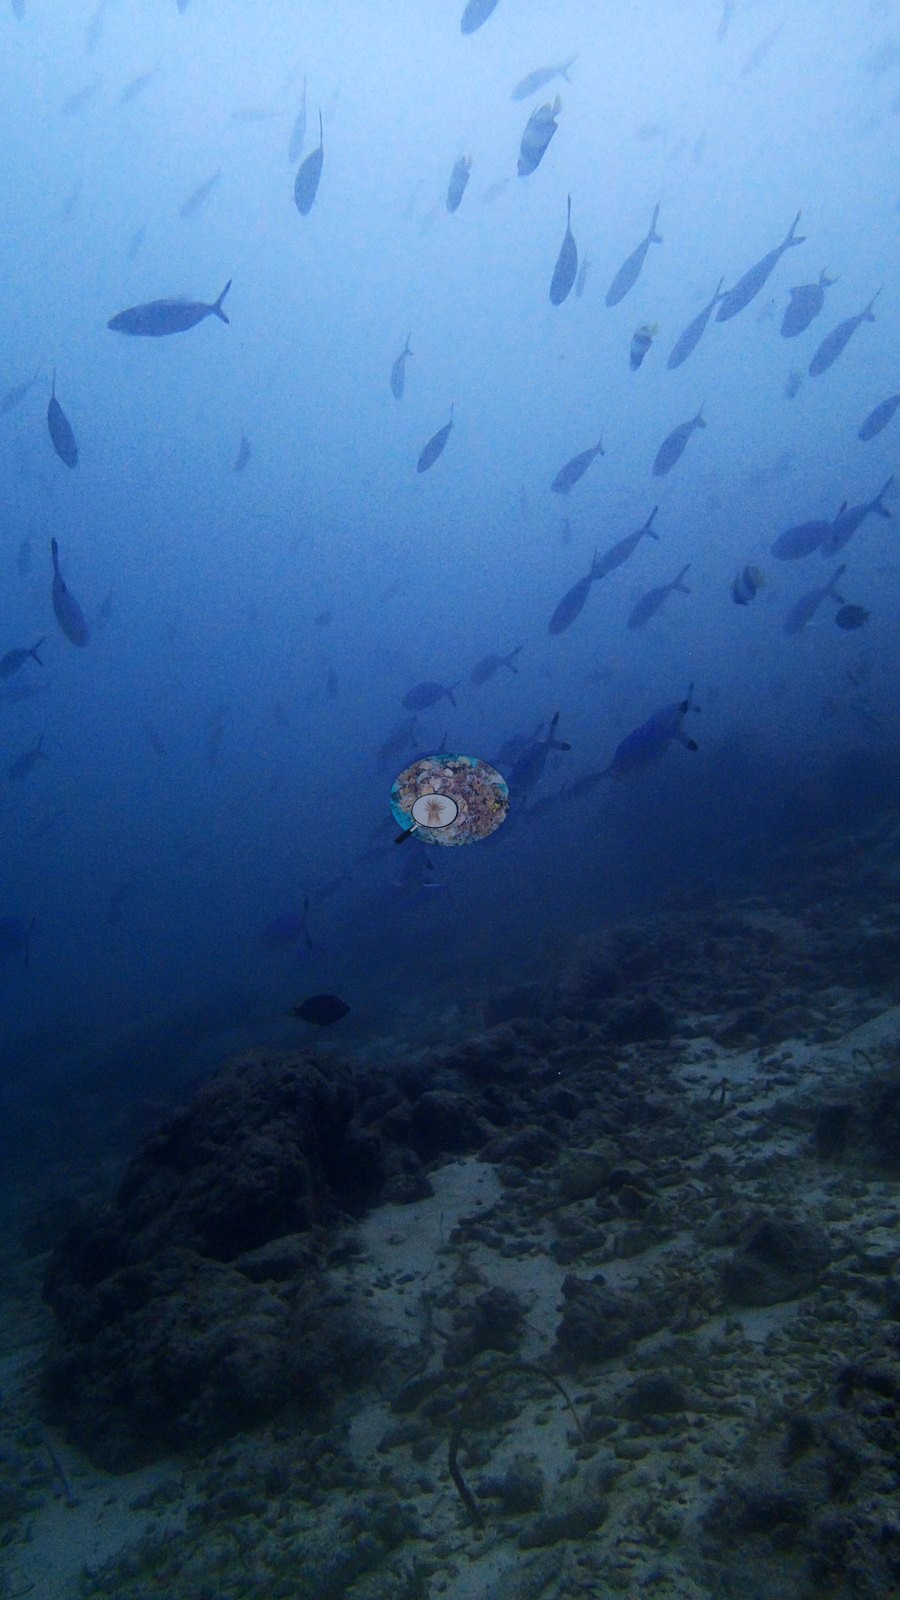
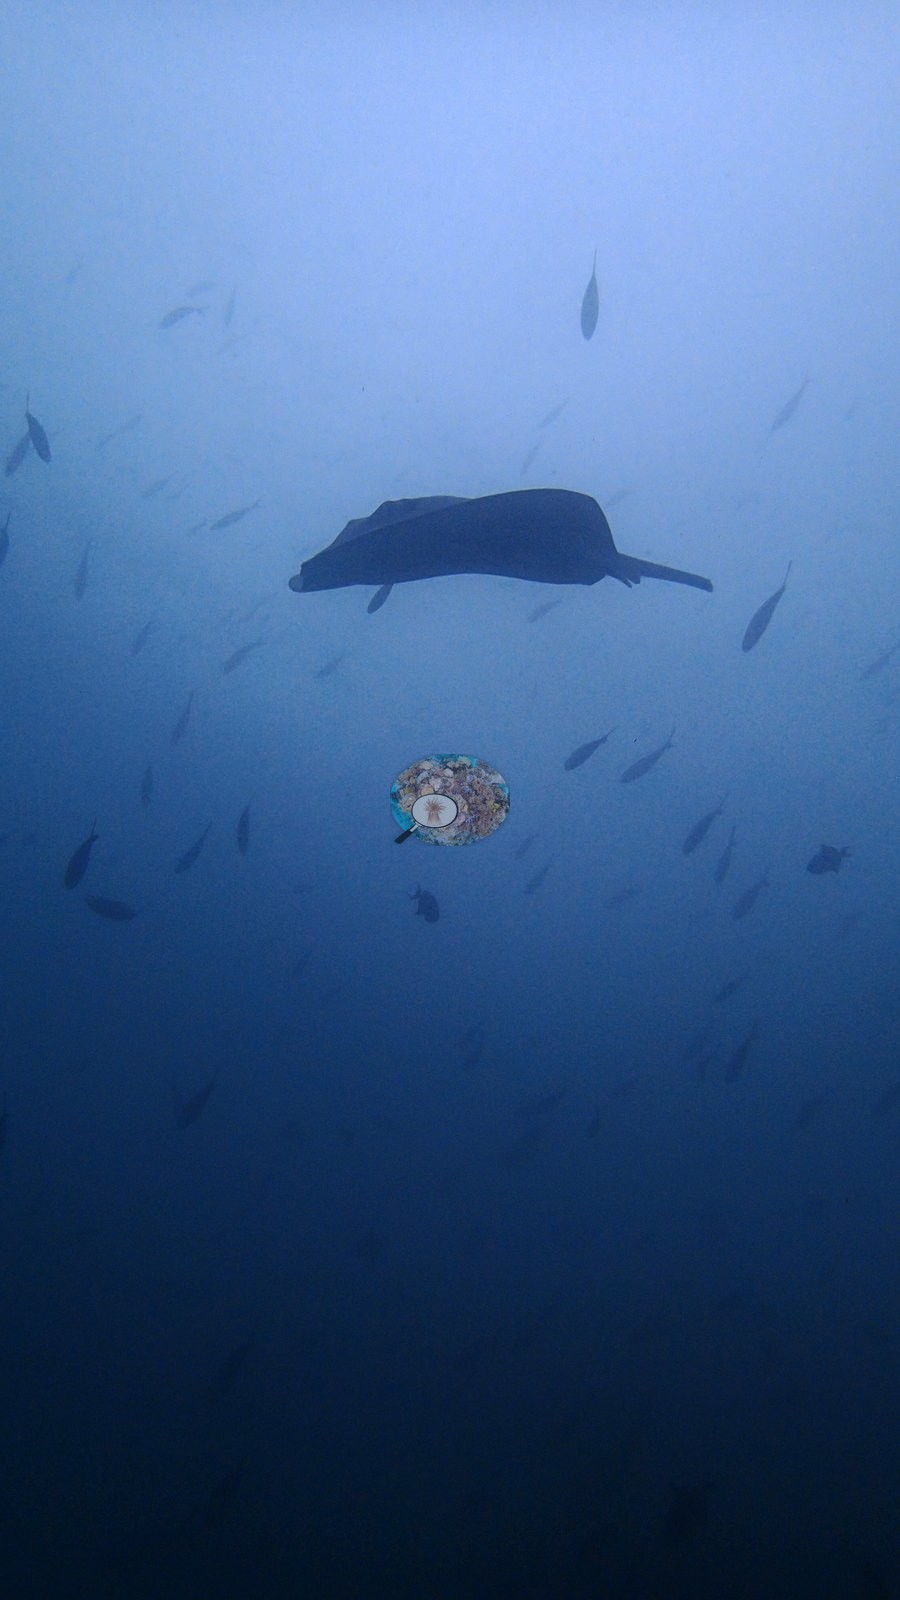
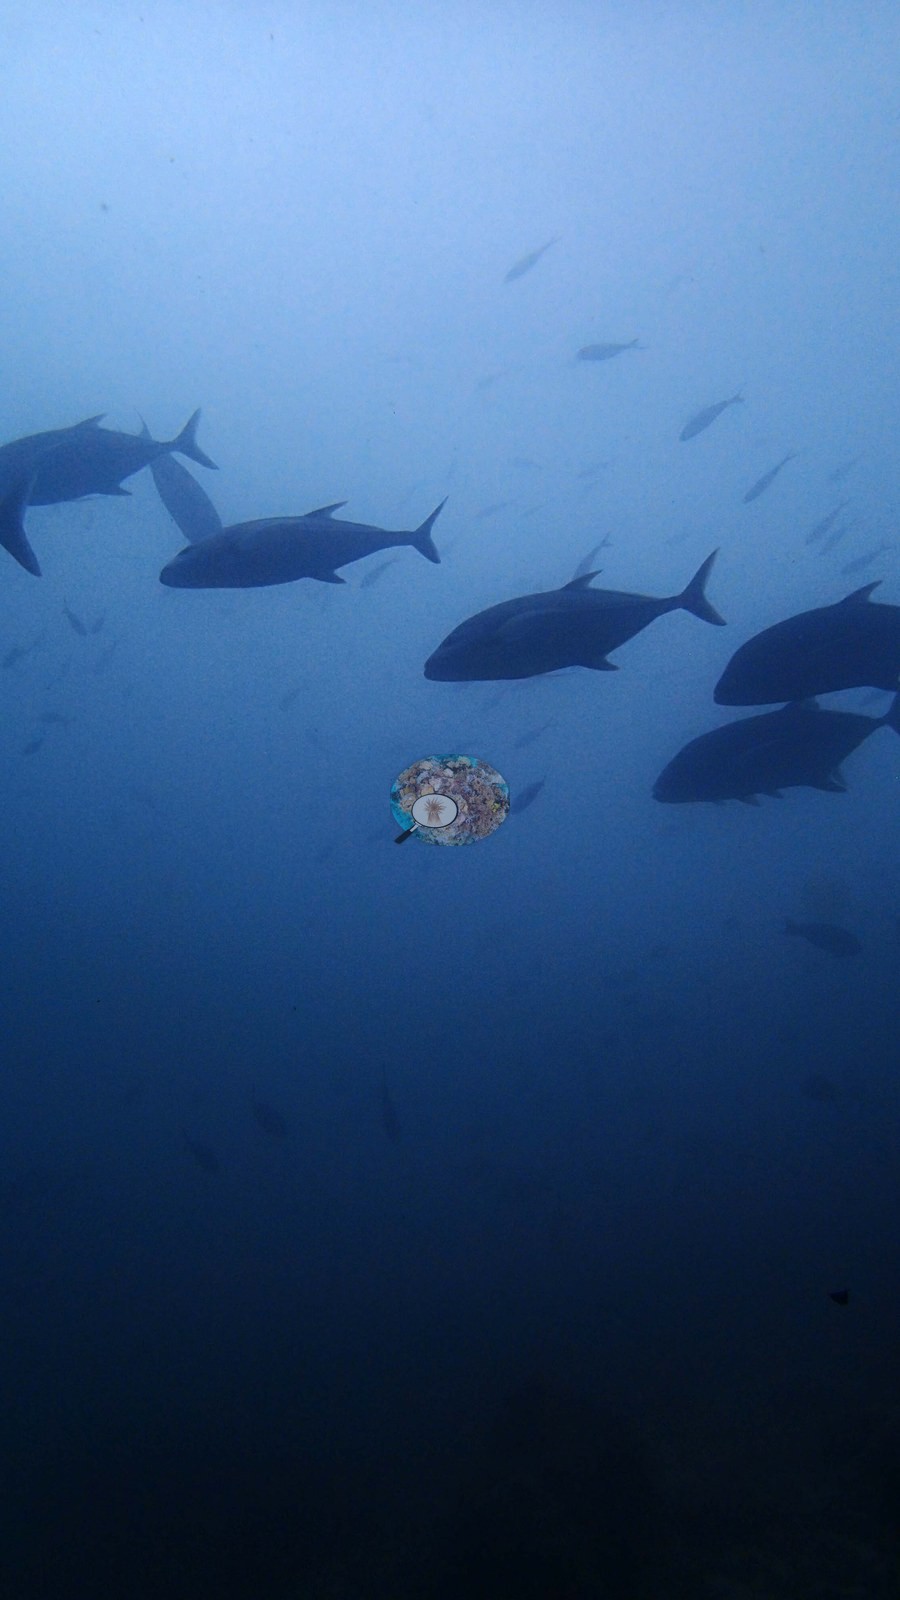
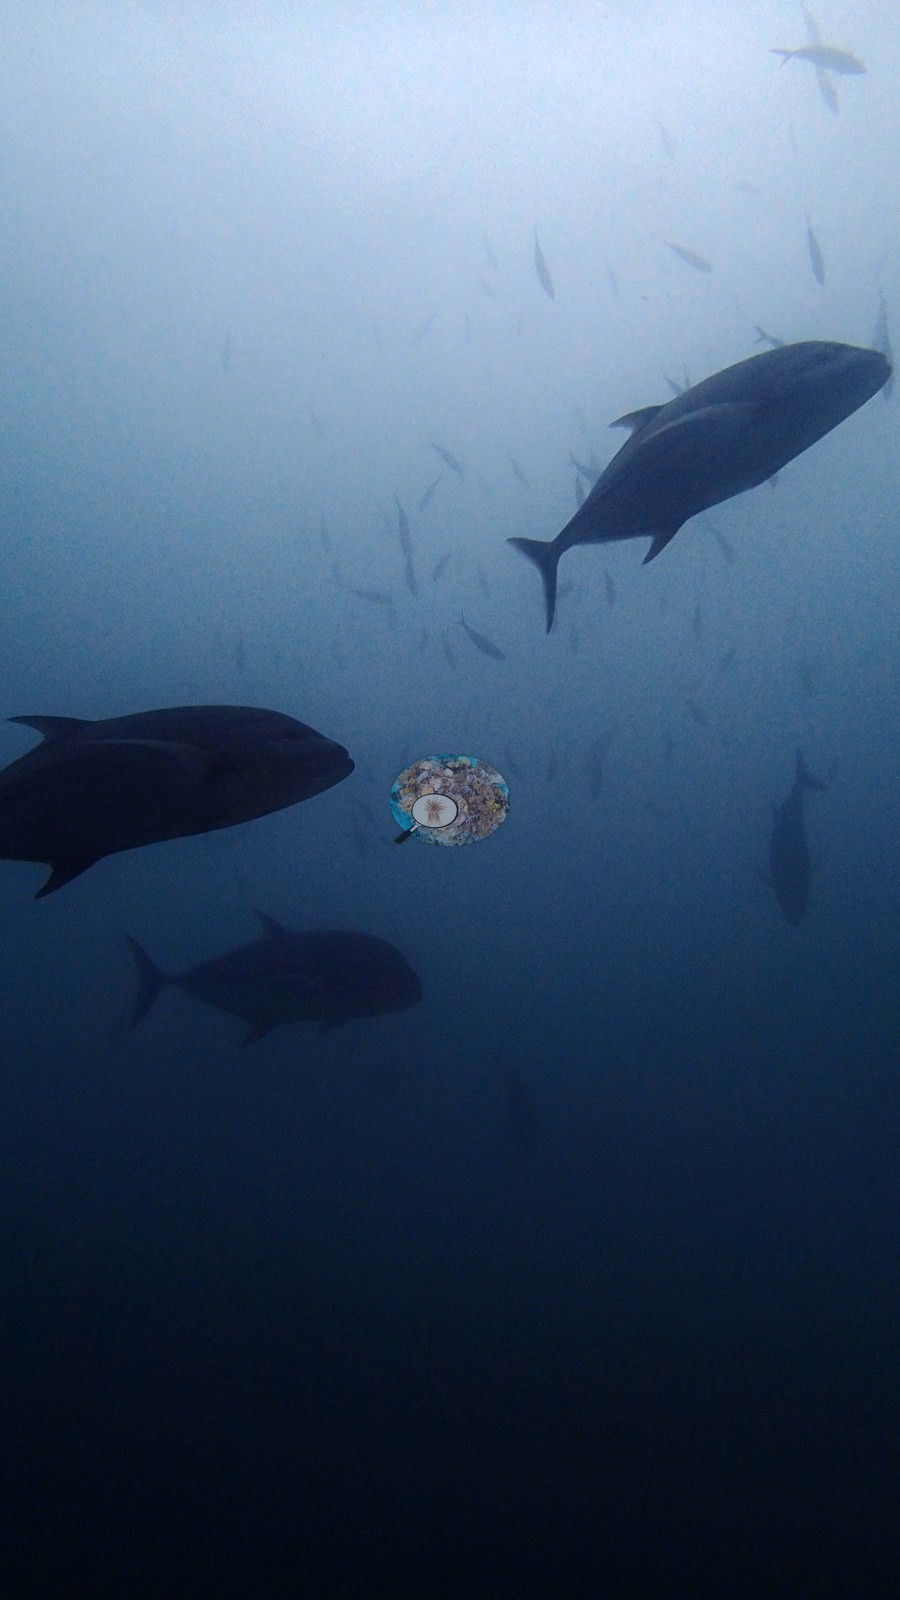
Huge stingrays materialize out of the green-blue gloom — one an absolute monster — gliding past at close range with long tails trailing, while packs of trevally prowl the edges of visibility and a wall of fusiliers shimmers overhead (e.g., Image 1, Image 2, Image 5).
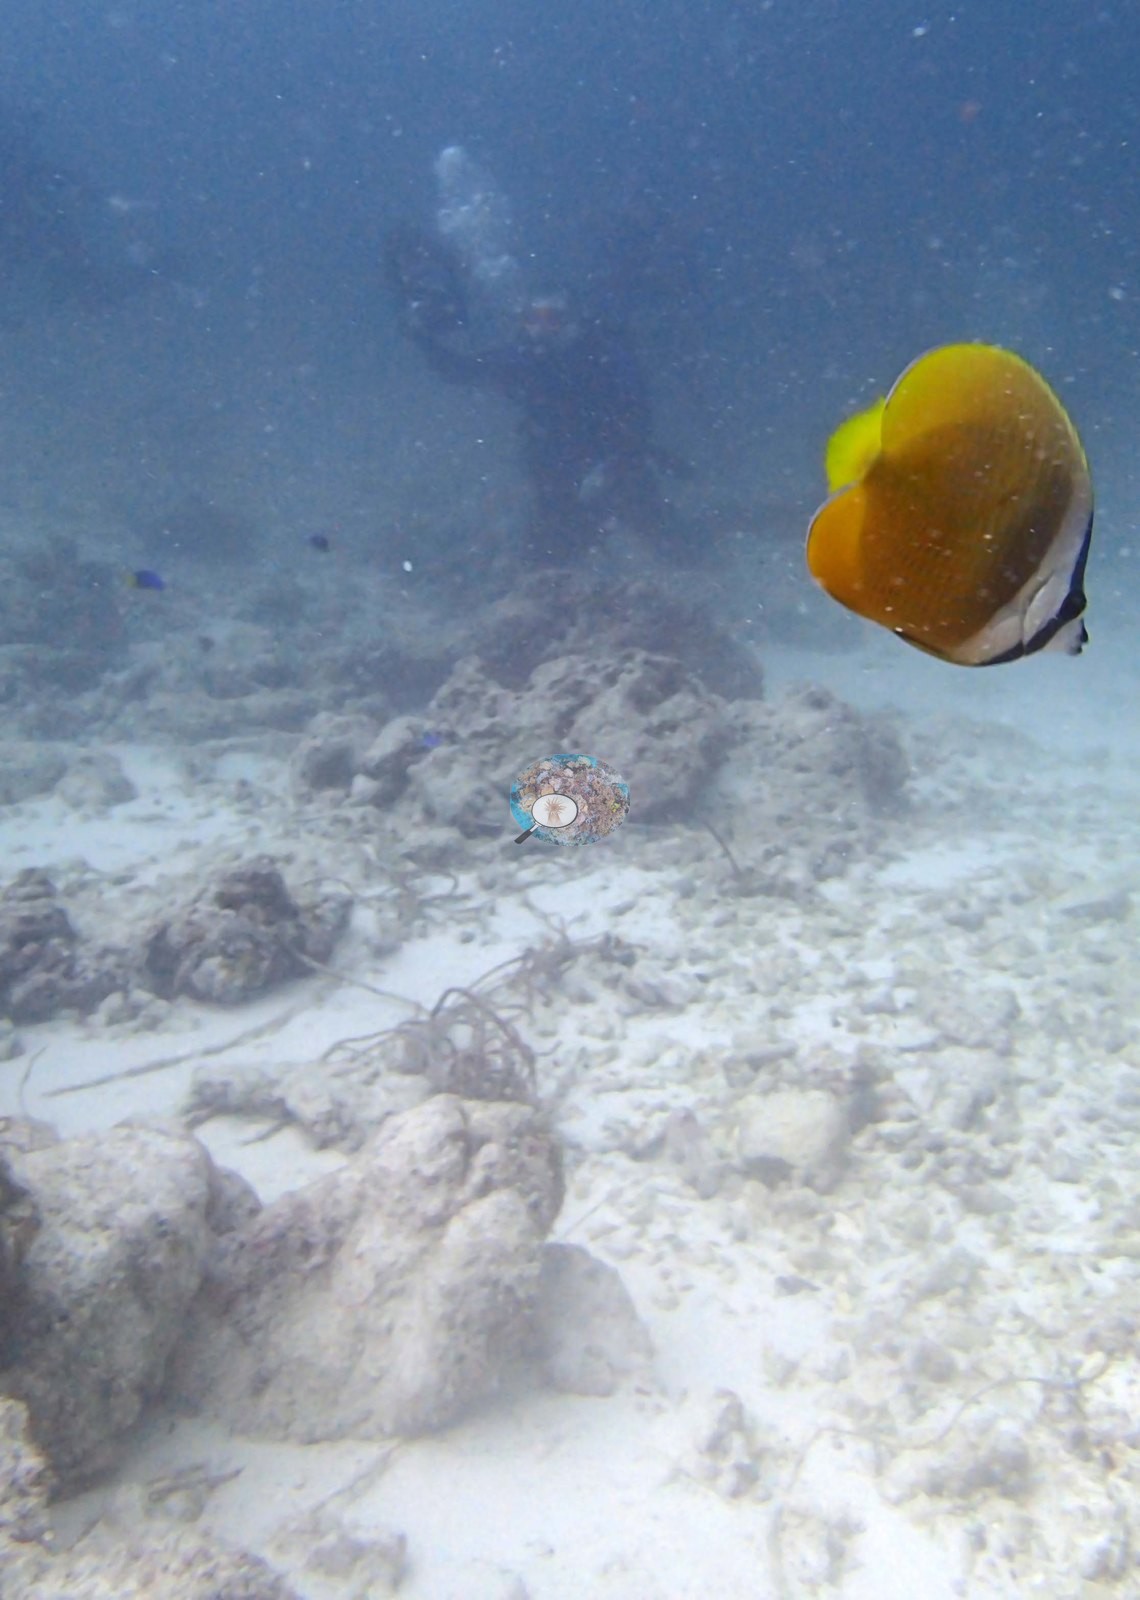
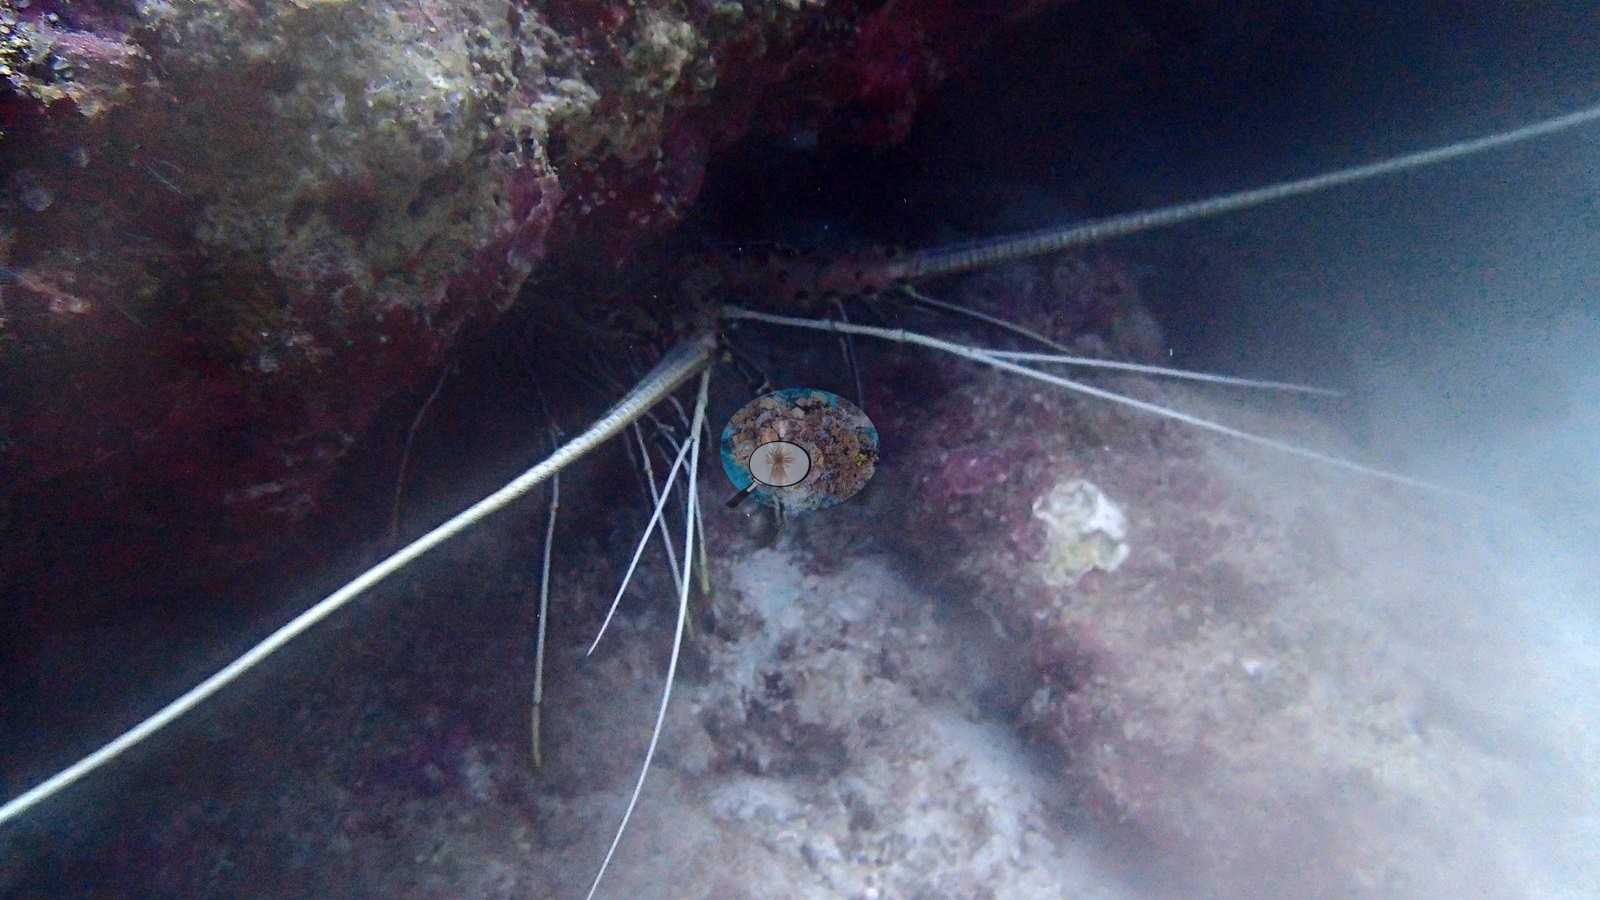
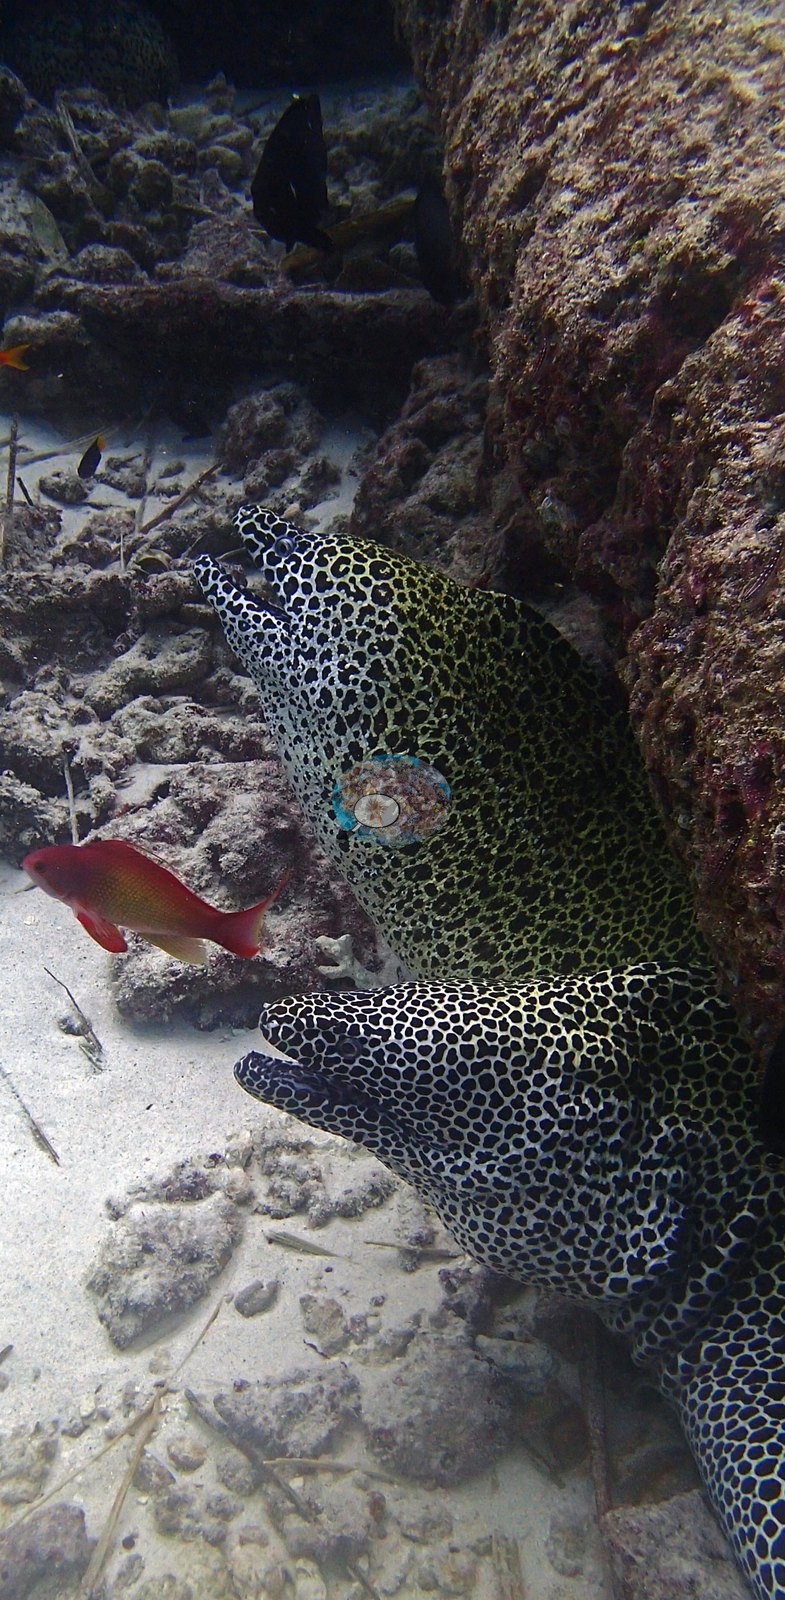
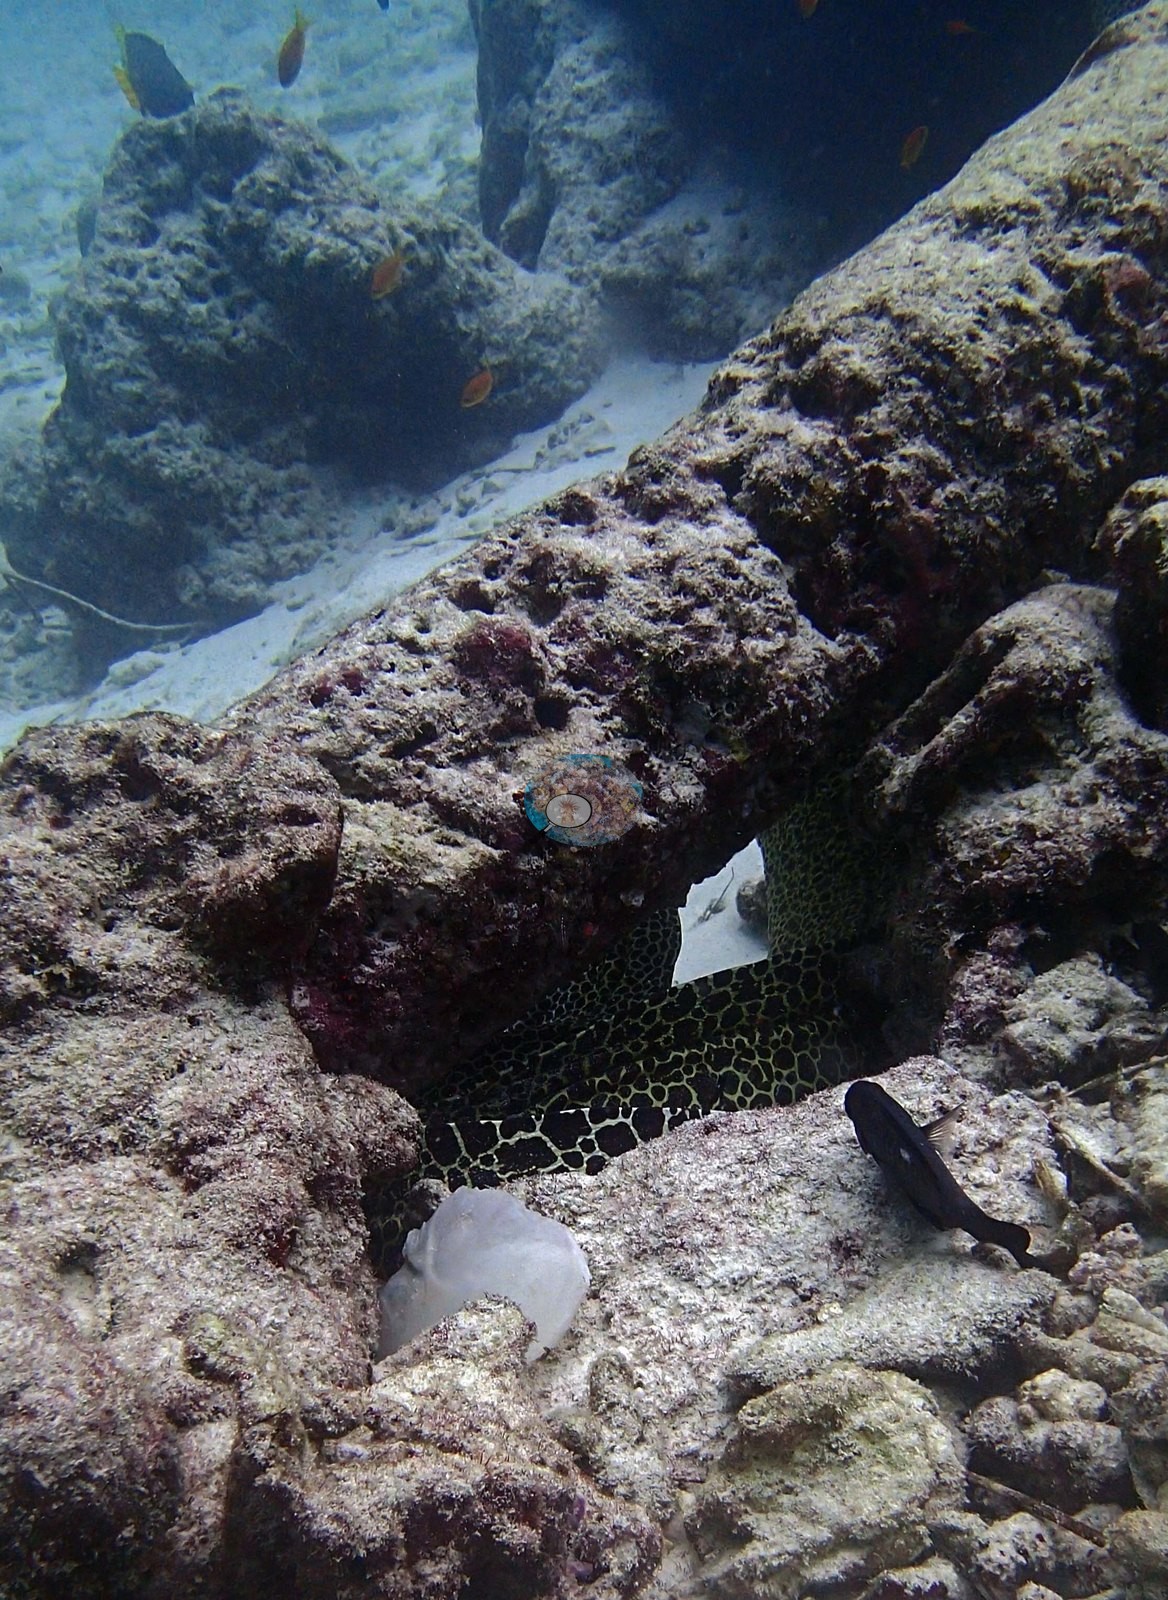
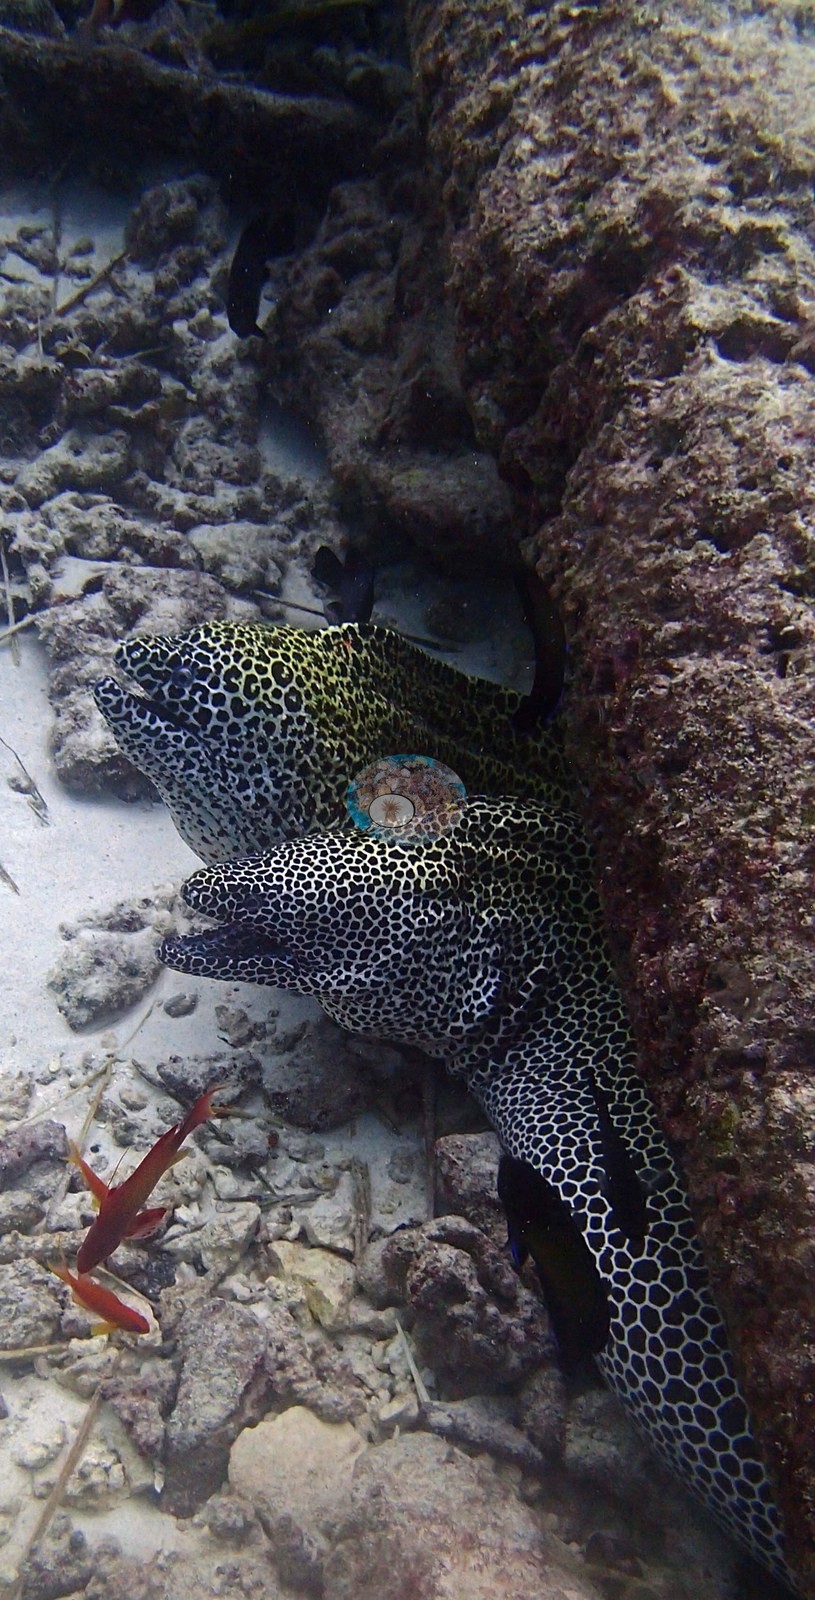
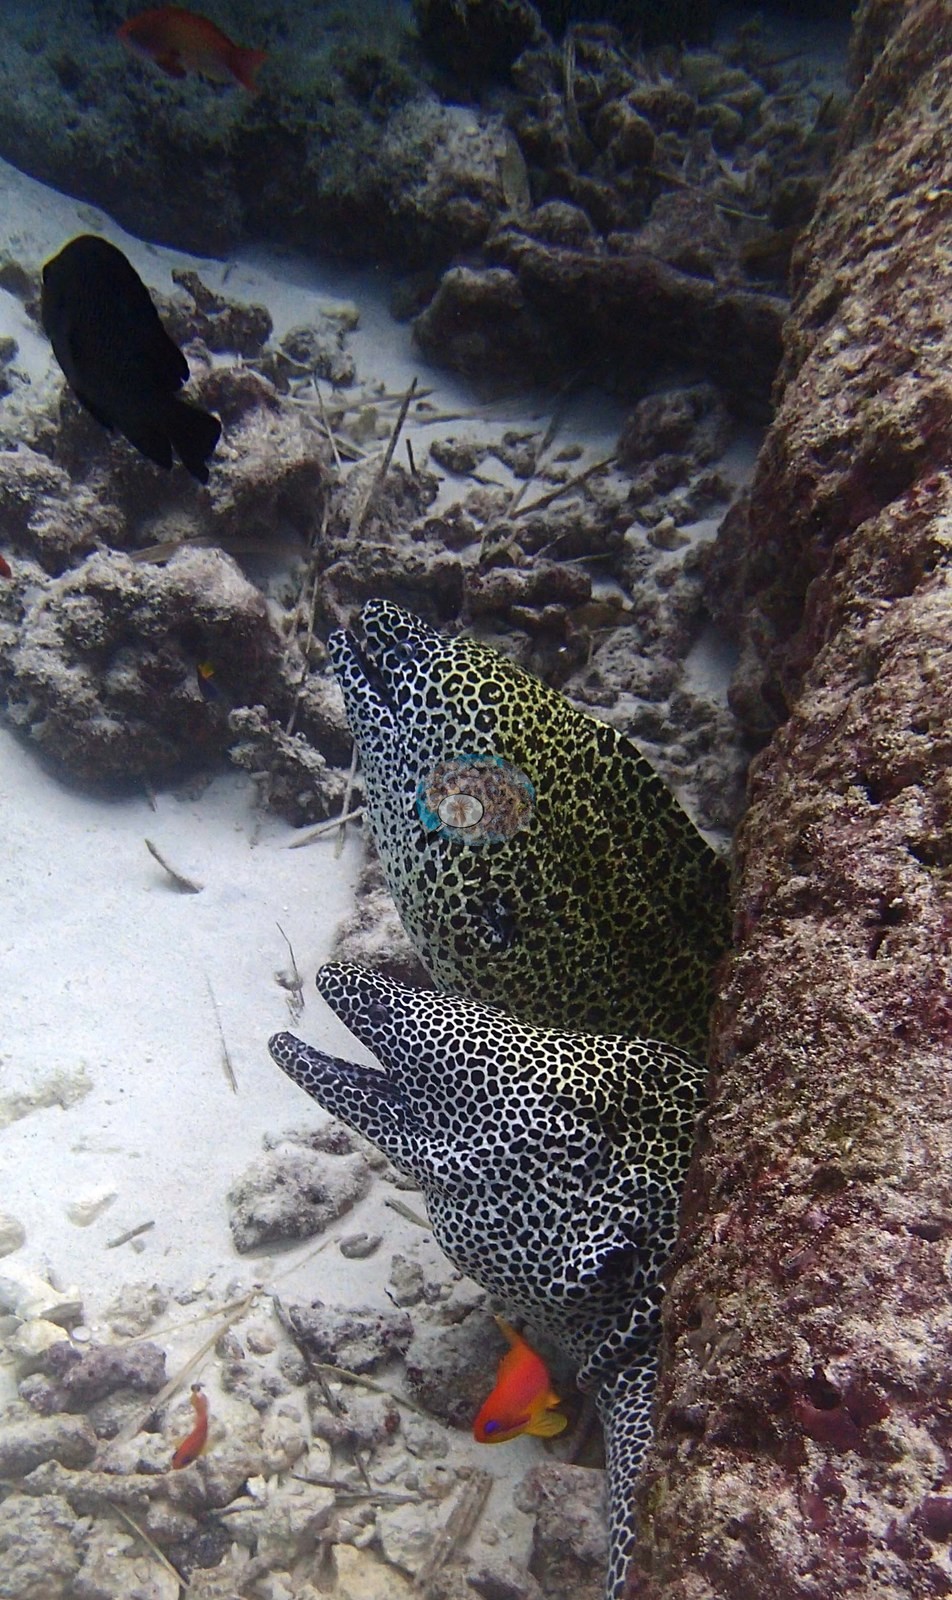
Down on the bottom, a fallen beam has become an eel tenement: honeycomb morays in bold giraffe-print peer from its crevices, two heads sometimes sharing one doorway, with a red squirrelfish standing guard and a spiny lobster betraying itself by nothing but a fan of white antennae under a ledge (e.g., Image 3, Image 4).
Comparisons with other data
No independent survey was made at this exact site; the nearest ones are listed in the table below.
CV model comparison
More info
As of September 2026 no computer-vision method estimates coral cover accurately on new images, so treat this as indicative rather than a measurement; it is revised as the methods improve.More info
The published figure is the mean of the two methods.| Method | Hard-coral cover (%) |
|---|---|
| In-house DINOv3 | 11.2 |
| CoralSCOP | 4.9 |
| Mean (± SD) | 8.1 ± 4.5 |
| Range | 4.9–11.2 |
Mean ± SD and range are across the computer-vision methods shown.
Independent surveys nearby
| Agency / program | Year(s) | Stations / distance | Link |
|---|---|---|---|
| Montefalcone et al. (2020) | 2015–2019 | 2 stations, 3.77–4.08 km | Records ↓ |
| Reef Check | 2010–2024 | 3 stations, 2.93–4.78 km | Records ↓ |
 Dr. Coral (CRD)
Within 5 km, 5 independent survey stations recorded hard coral cover in 12 surveys between 2010 and 2024. Of the 3 stations surveyed in more than one year, 3 declined between their first and latest surveys. The longest record, Banana Reef (Montefalcone et al. 2020, 4.08 km away), went from 40% in 2015 to 19% in 2019. One survey since 2021 recorded 35%. This site's own estimate (8.1%) sits 26.9 points below the recent value (35%); the methods differ, so the comparison is context, not a like-for-like test.
Collected by other programs using different methods (Reef Check uses point-intercept transects), so these are context for the figures above, not a like-for-like comparison. Where a station was surveyed more than once the range is shown. Station names are not dive-site names.
| Agency | Site / location | Date | Hard coral cover (%) | Distance | Link |
|---|---|---|---|---|---|
| Reef Check | Banana Reef | 2010–2014 | 16–33% (2 surveys) | 2.93 km | — |
| Montefalcone et al. (2020) | Hulumale Beyru | 2015–2016 | 15–41% (2 surveys) | 3.77 km | HeatCRD database |
| Montefalcone et al. (2020) | Banana Reef | 2015–2019 | 12–40% (4 surveys) | 4.08 km | HeatCRD database |
| Reef Check | Kuda Banana Reef | 2019 | 7.2% (2 surveys) | 3.61 km | — |
| Reef Check | Bandos Island Housereef | 2024 | 35% (2 surveys) | 4.78 km | — |
Data & links
All images from Coral Reef Diagnostics. Data are from Coral Reef Diagnostics and the organizations named in the data-sources table above.
© Coral Reef Diagnostics.