
Maldives - Bodu Hithi Thila

Part of the regional summaries: Maldives - Central (Male Atolls / Ari / Vaavu) and Maldives
2017-05-15
More info
Maldives (NOAA CRW virtual station) · Maldives ecoregion mean=2.9°C-heating weeksA submerged pinnacle split between bleaching-era rubble plains and thriving coral knolls, home to a car-sized dome coral, a hawksbill turtle, a nurse shark, and giant purple anemones. Computer vision cover estimate is 15-17%, averaging 16%.
One independent survey station shown with the program’s logo — click one to see how far it is from this site.
One other CRD dive site within 5 km shown in orange — click a marker to open its page.
8 of these 36 photographs are shown beside the text that discusses them under "Site description" below.
Site description
Setting
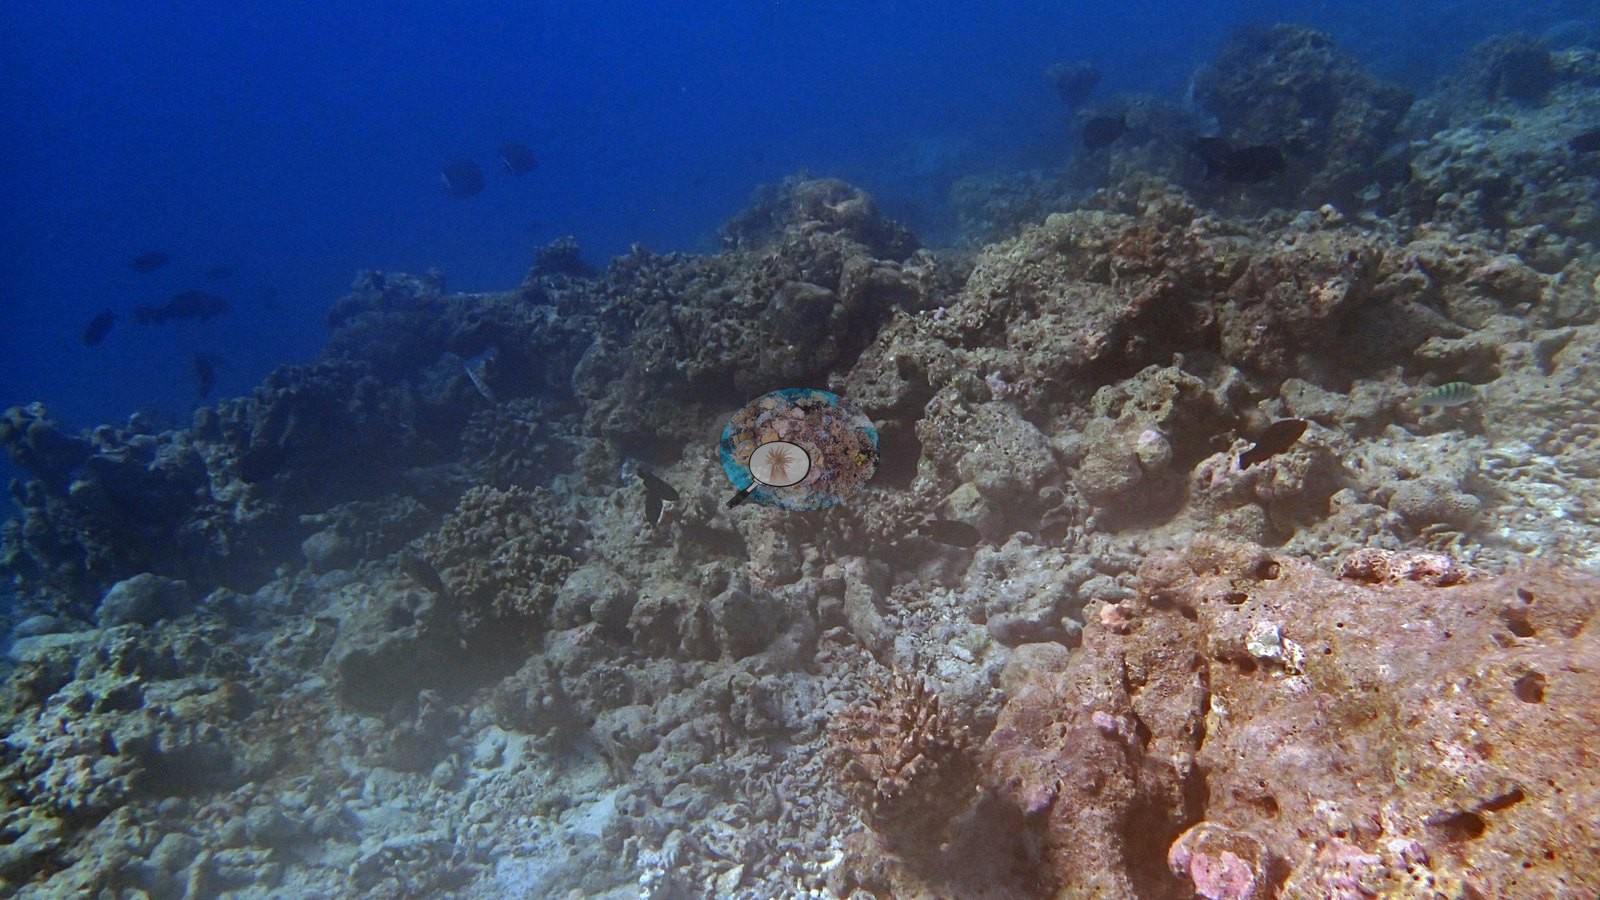
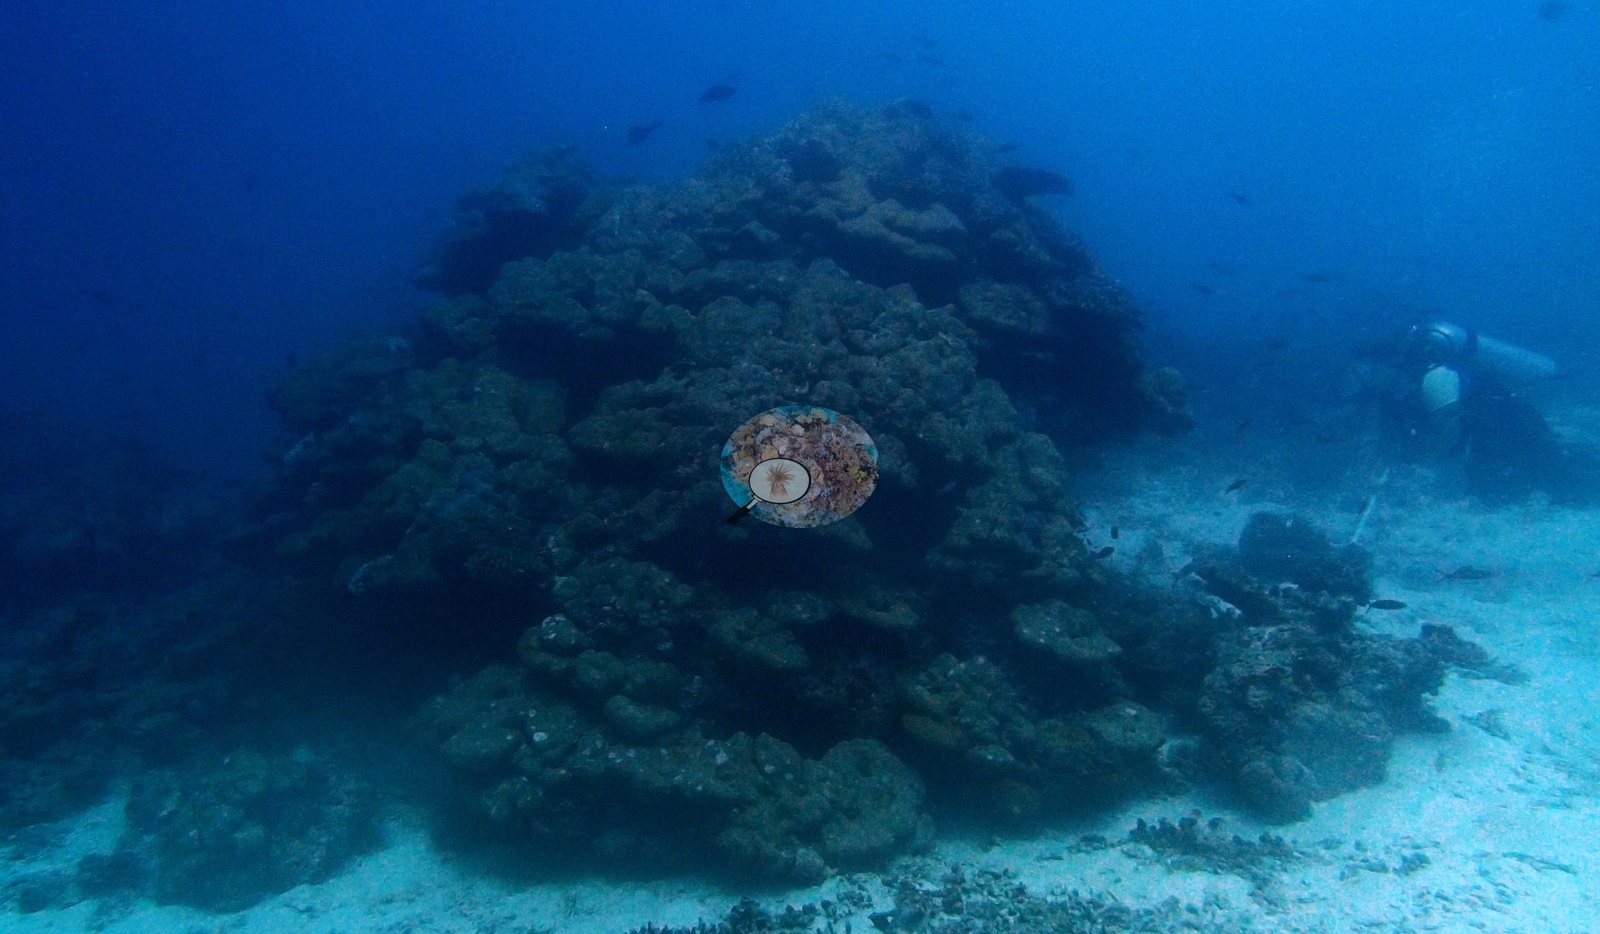
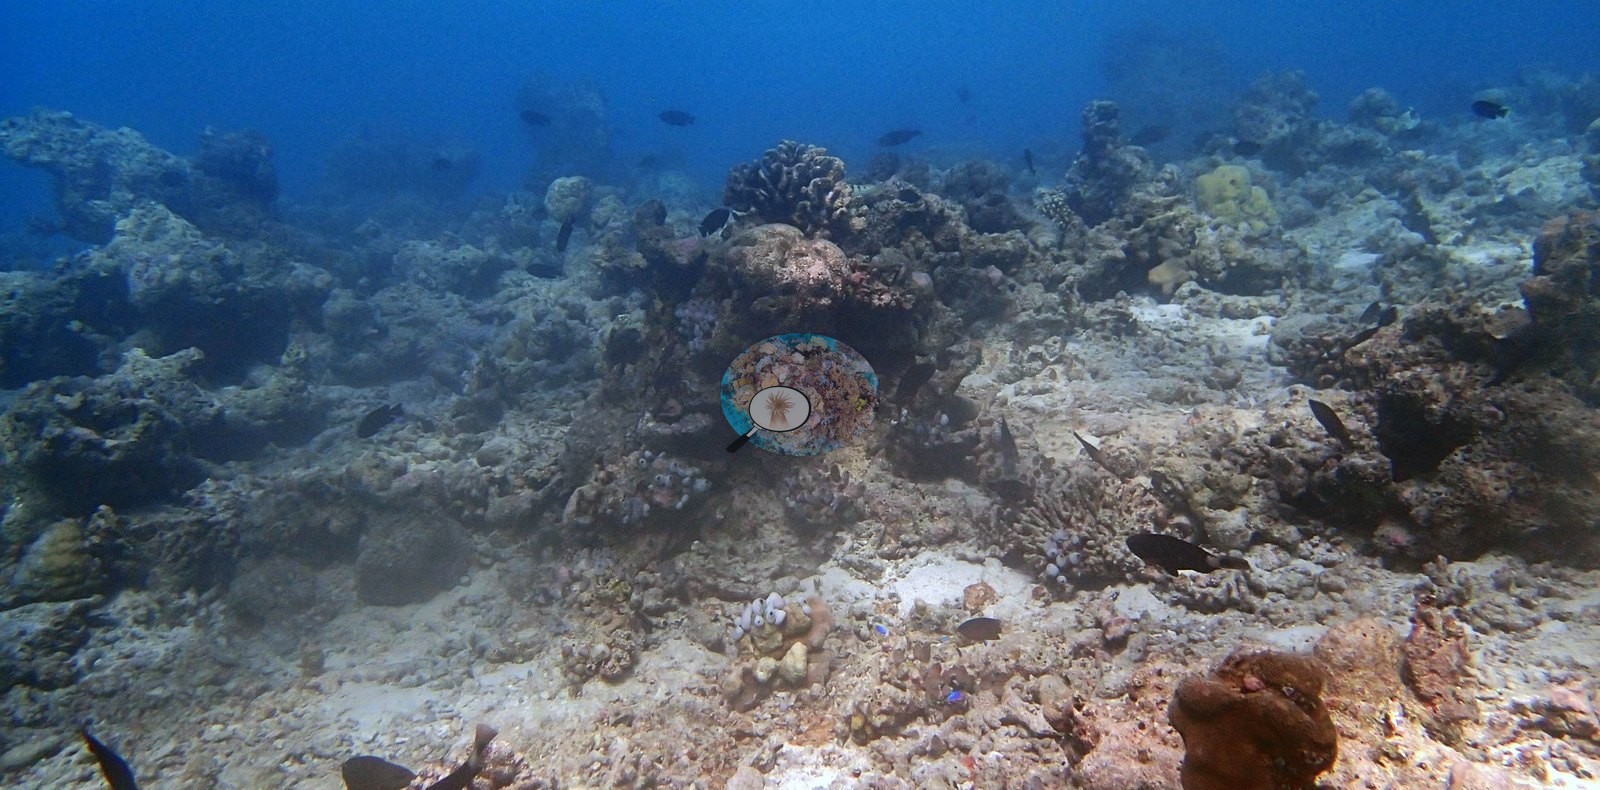
A submerged pinnacle worth two visits — an afternoon pass and a dawn return — Bodu Hithi Thila serves its drama in layers.
General benthic features
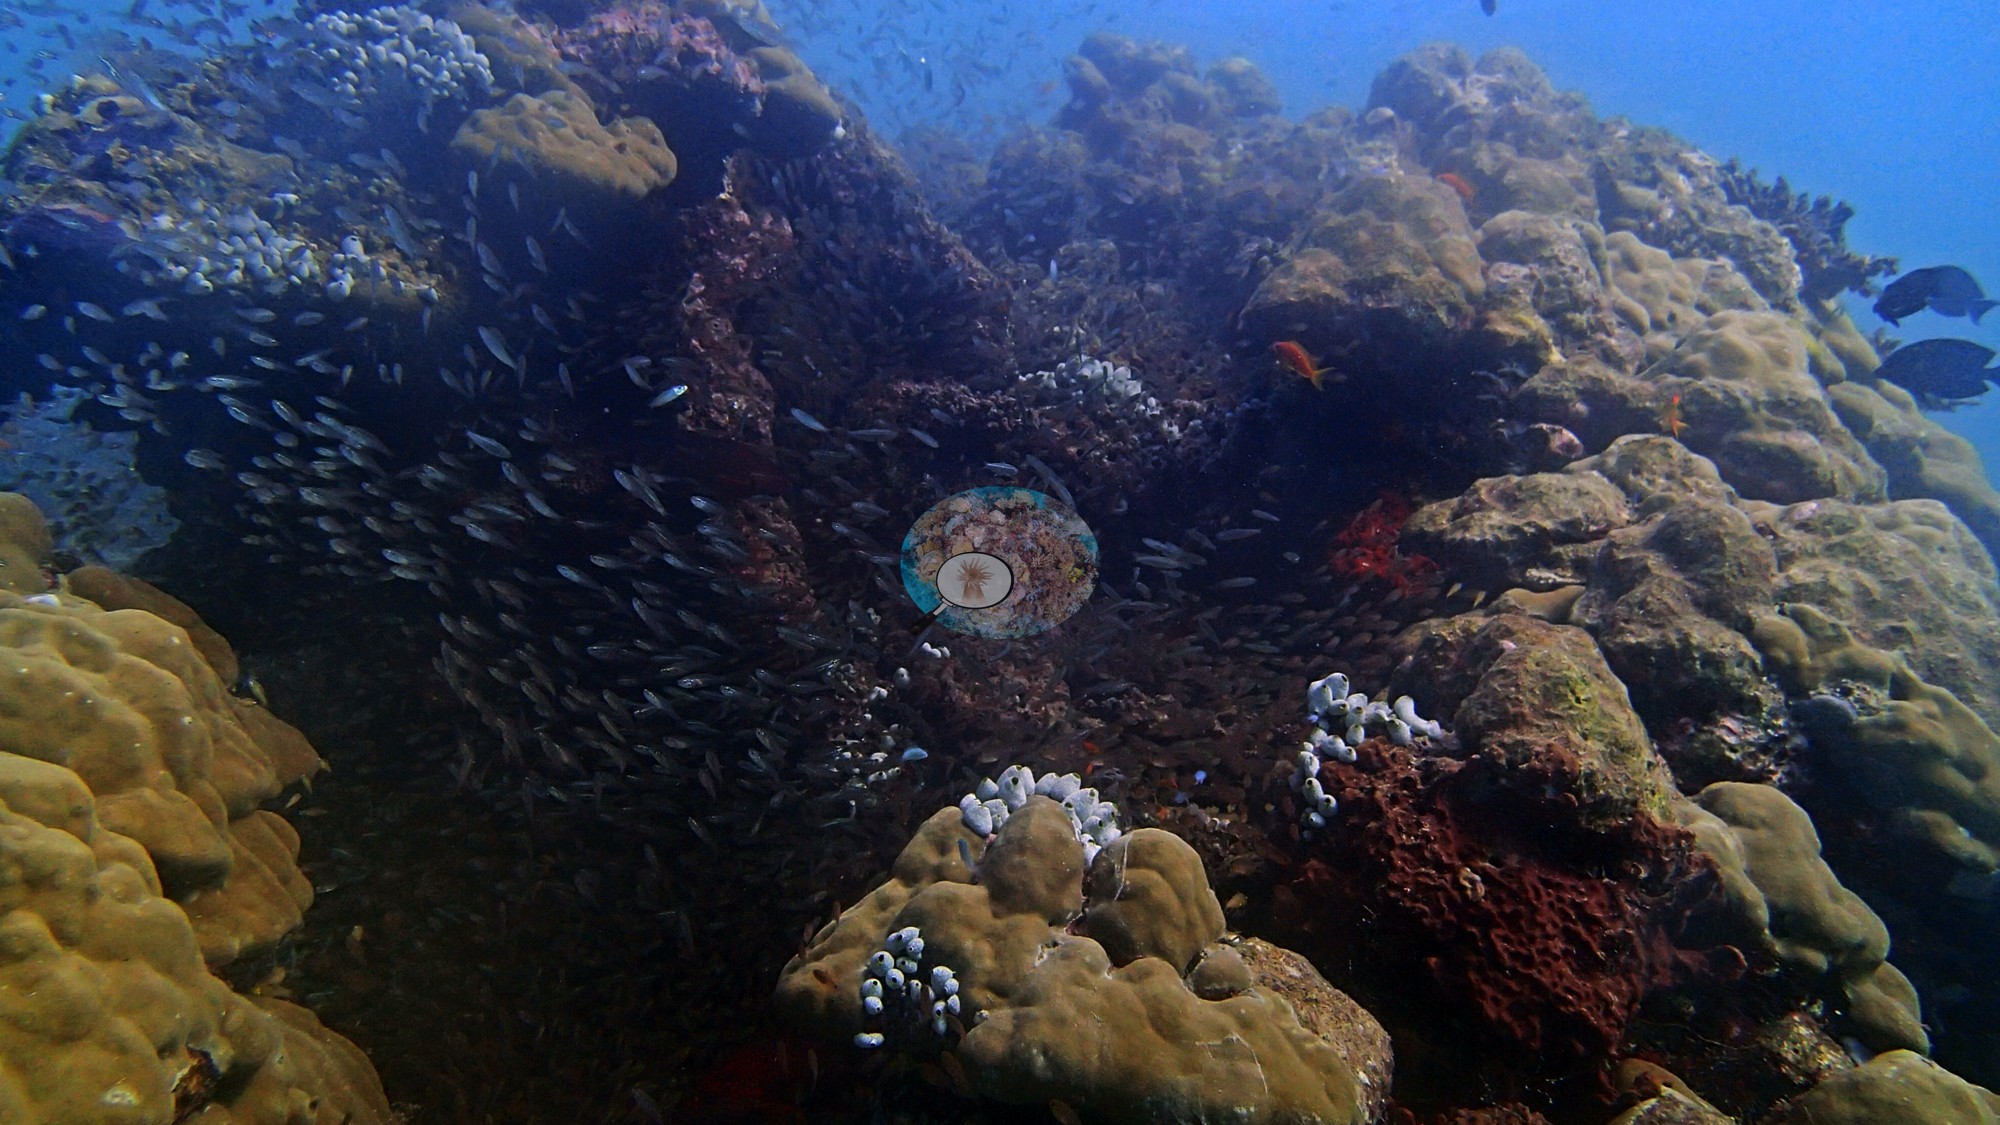
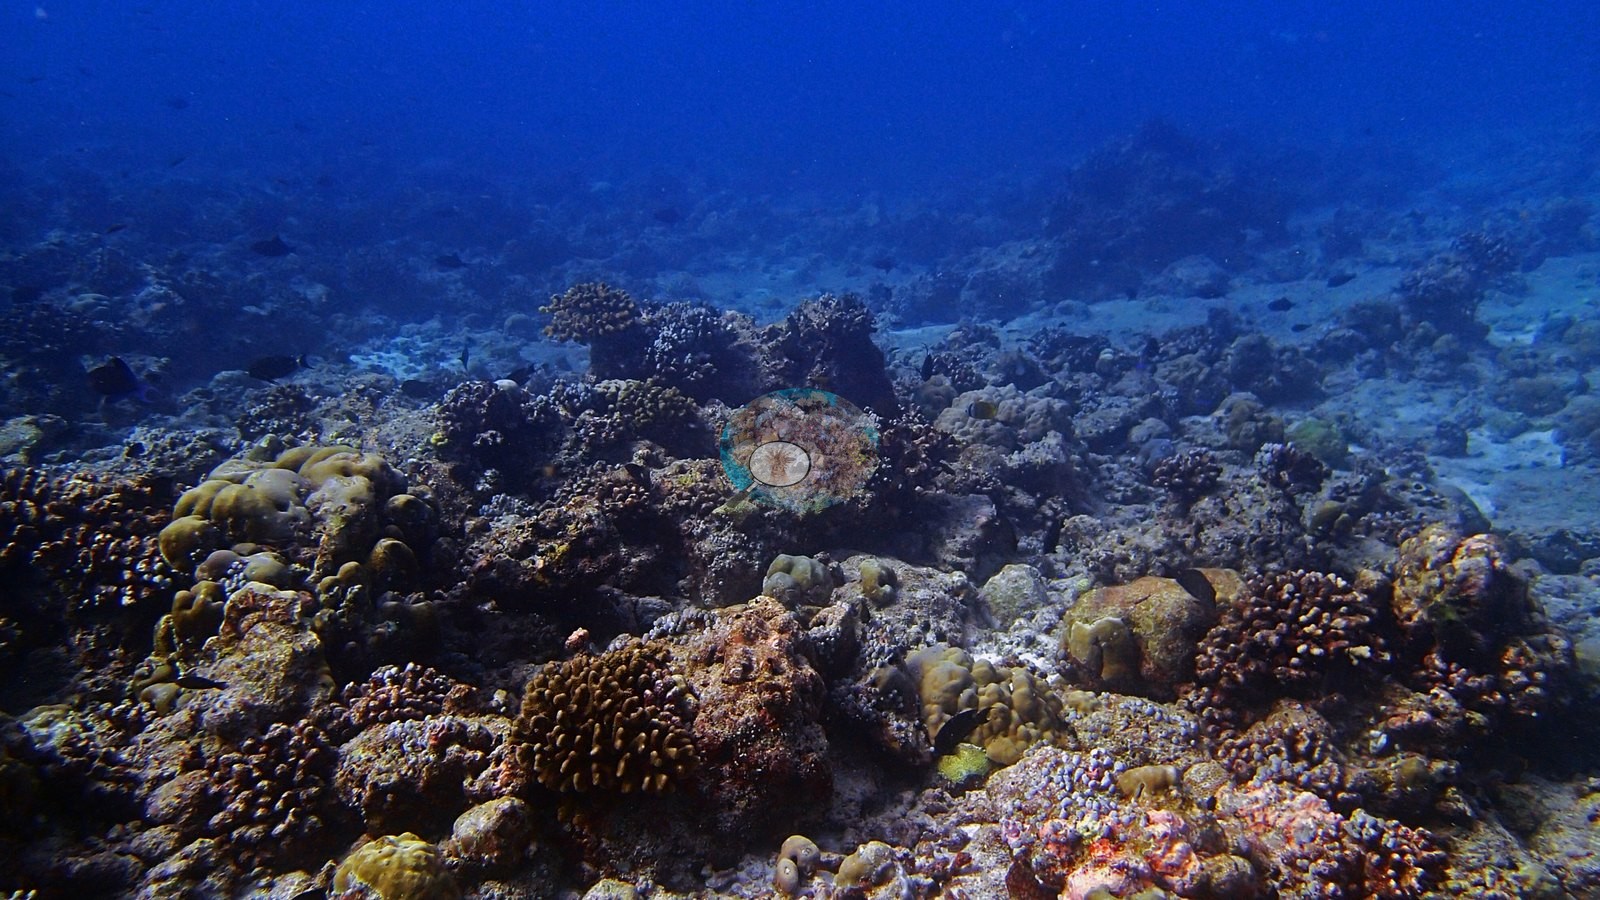
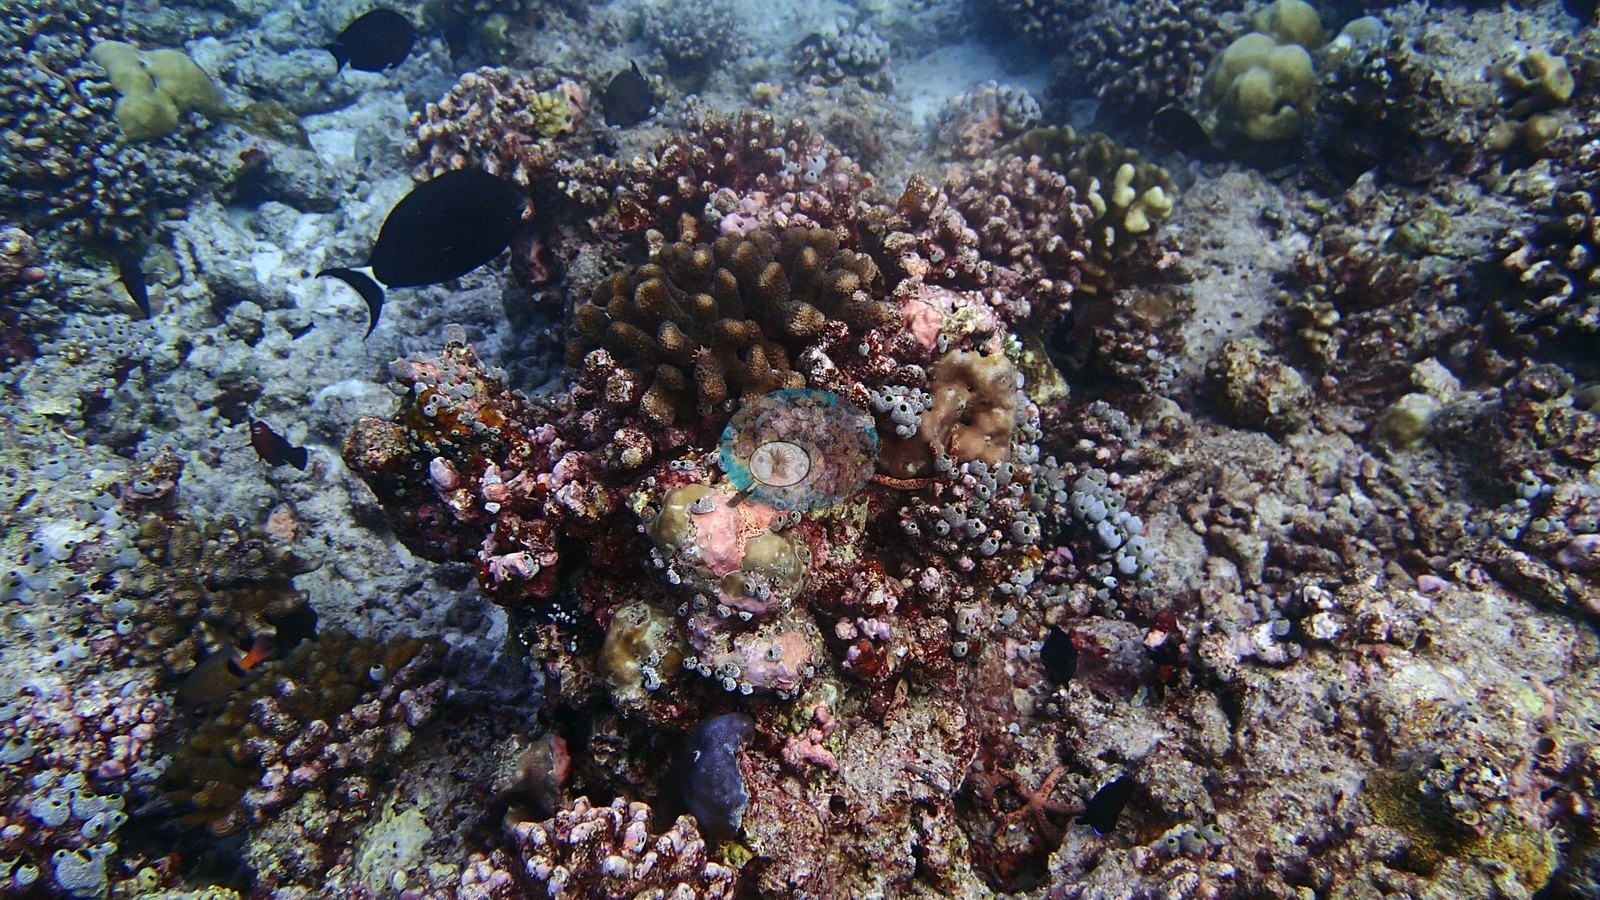
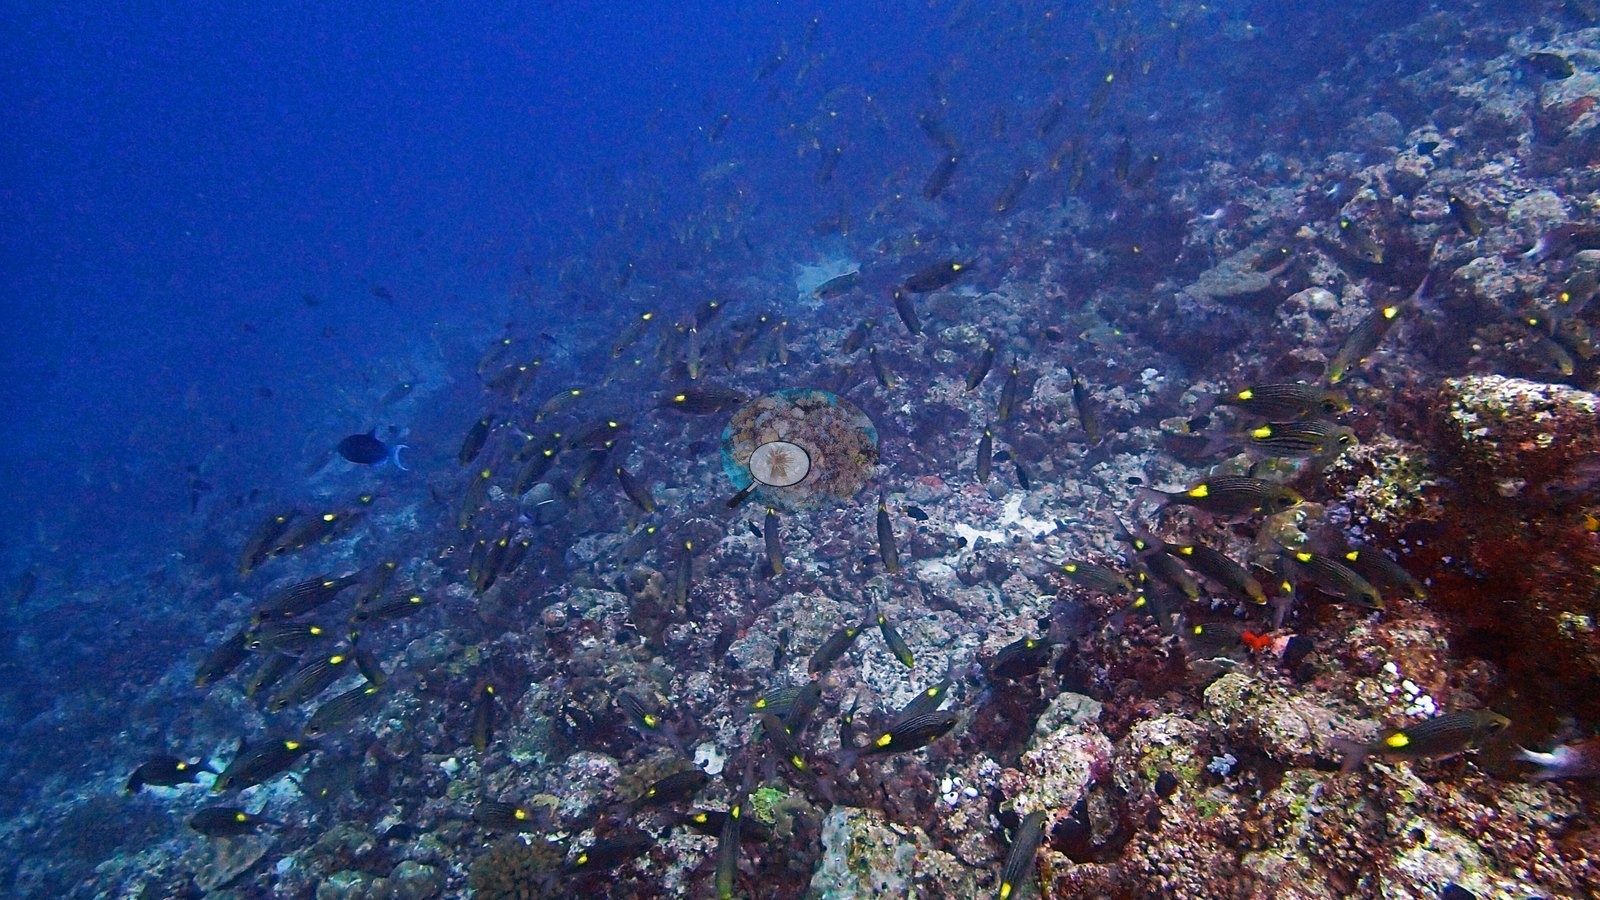
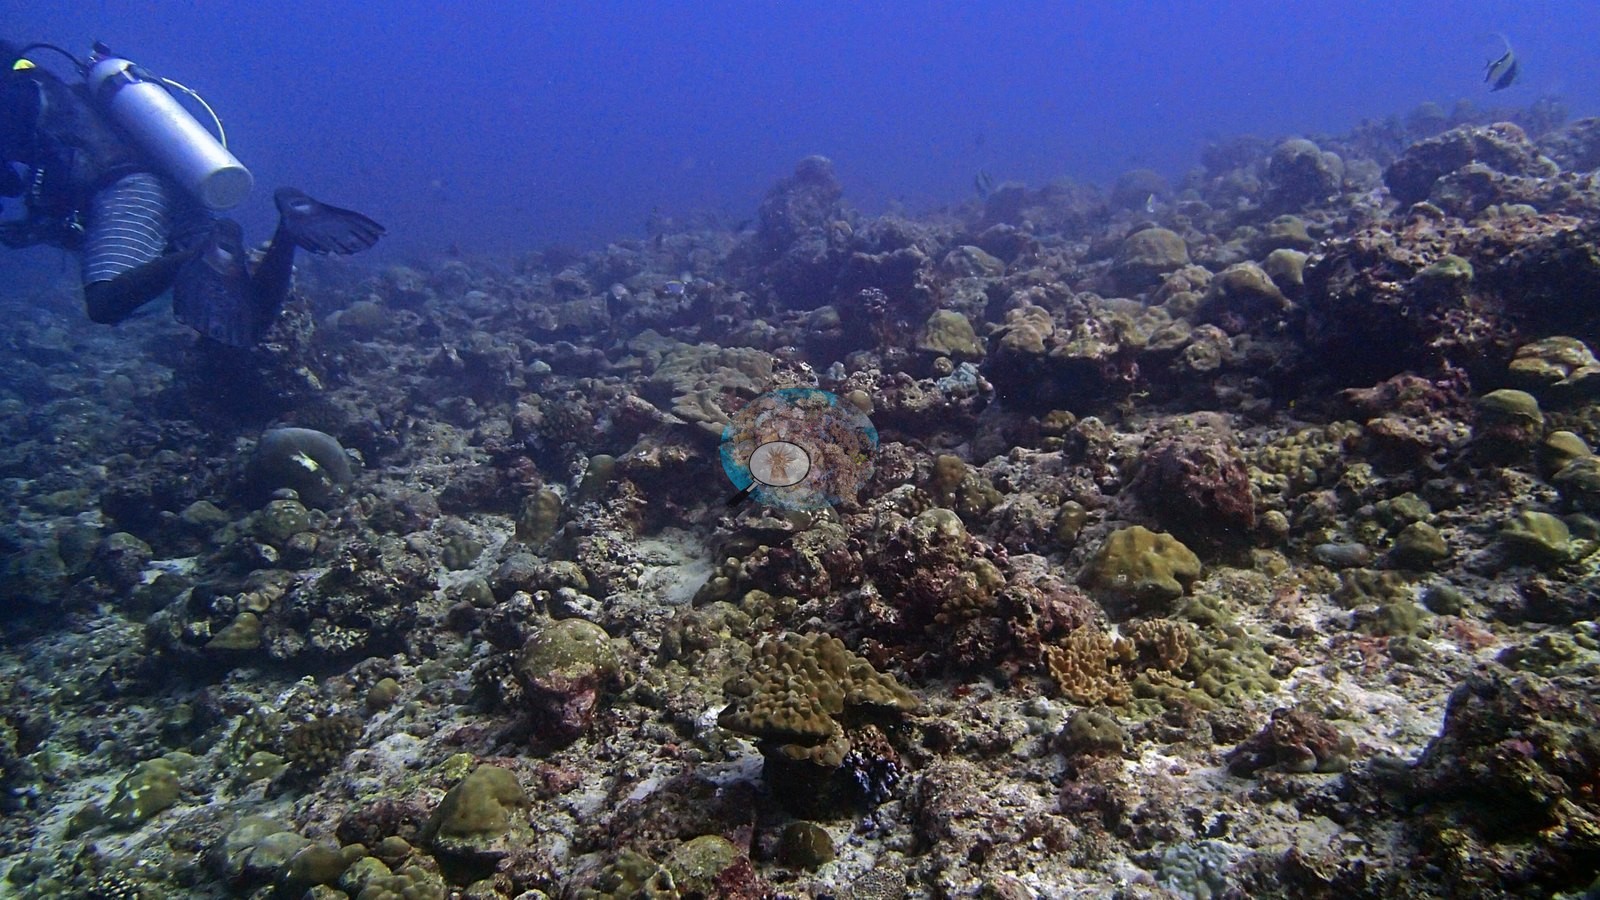
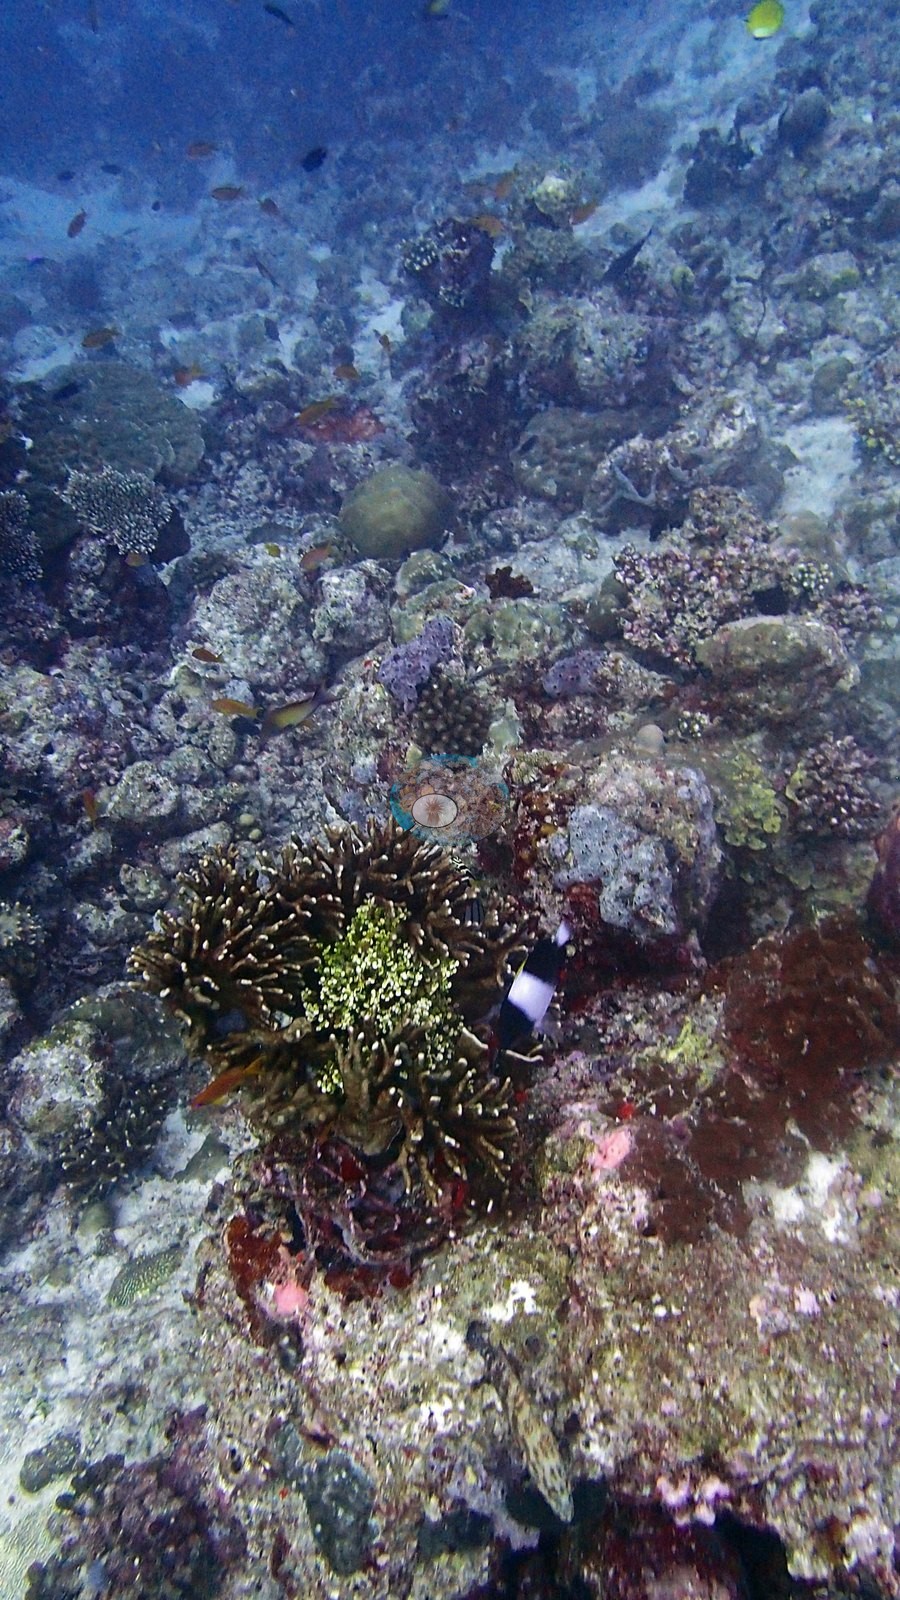
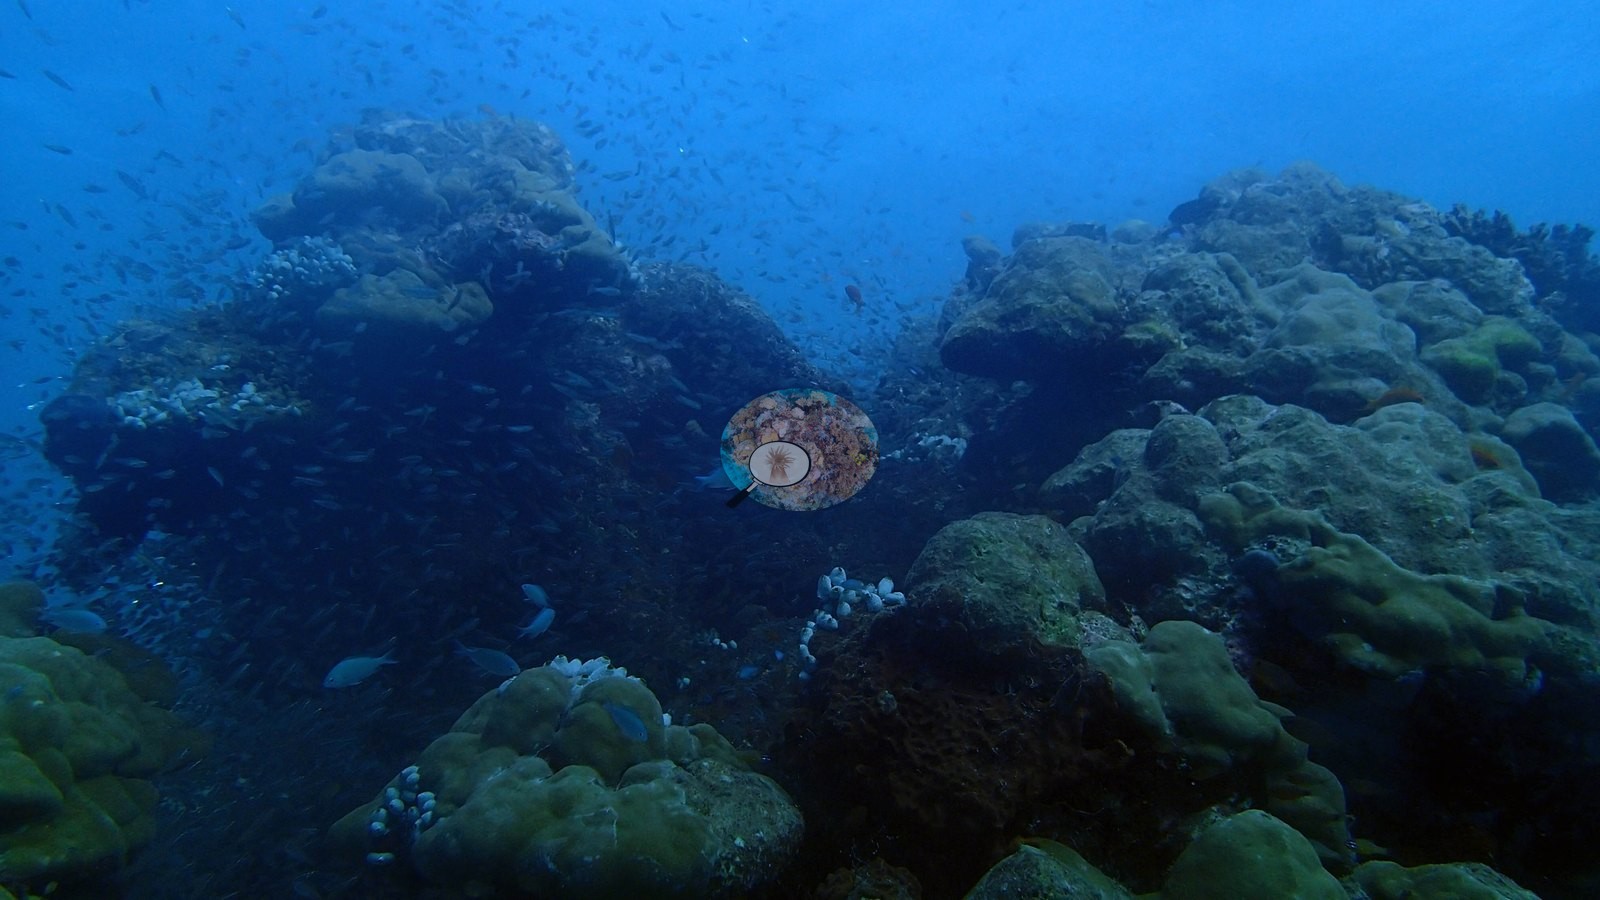
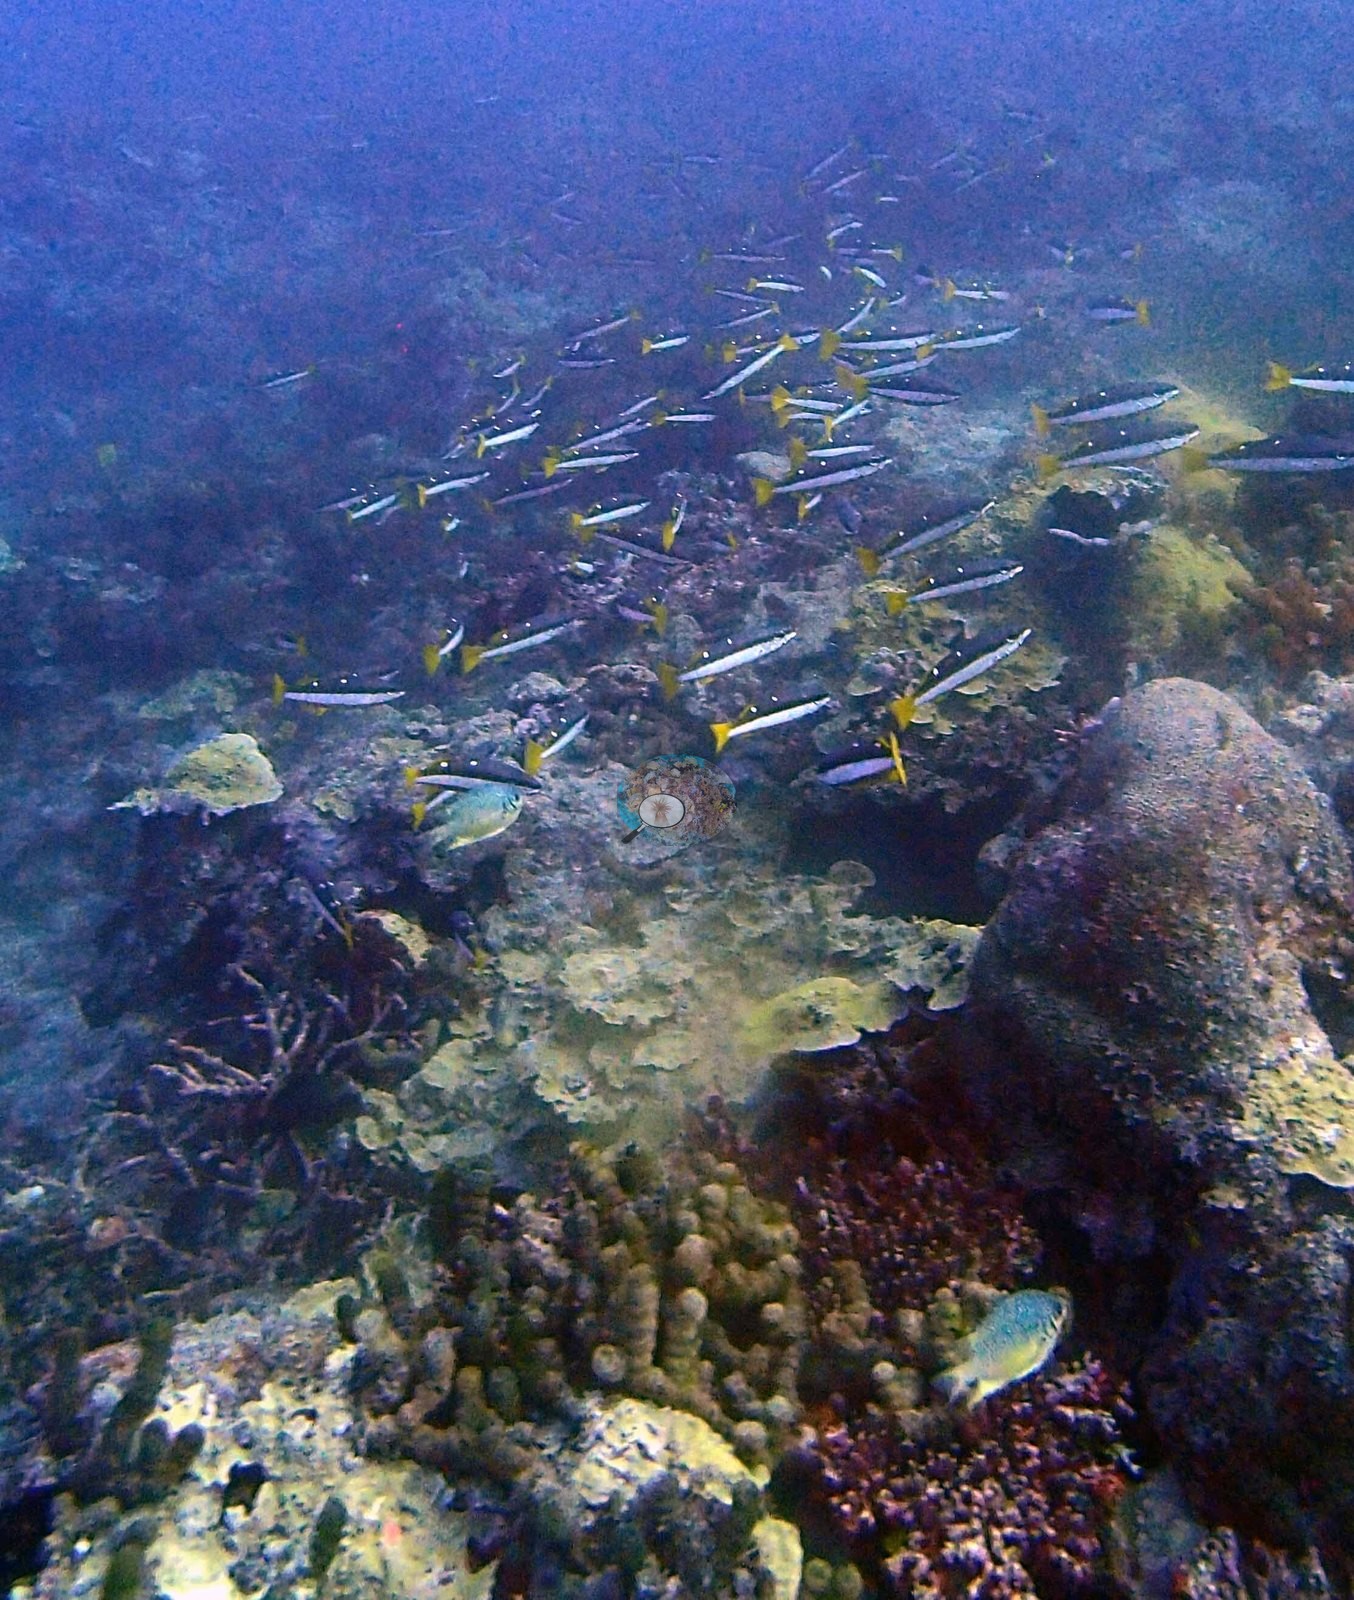
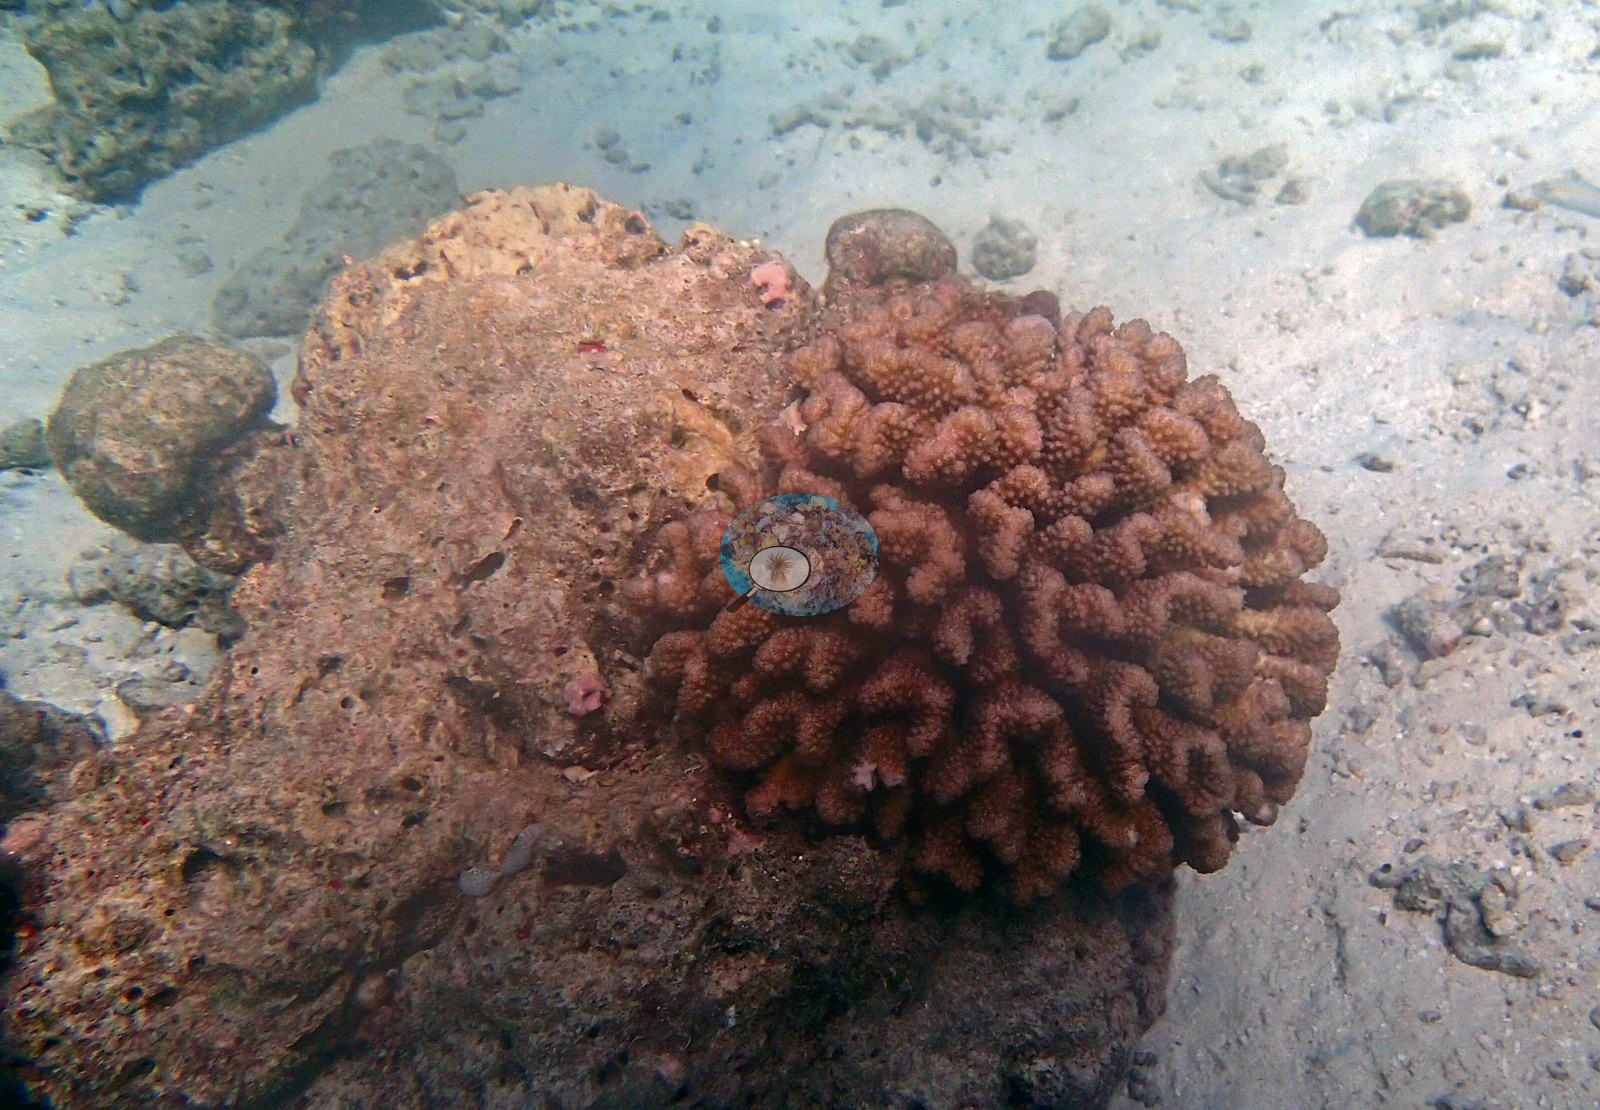
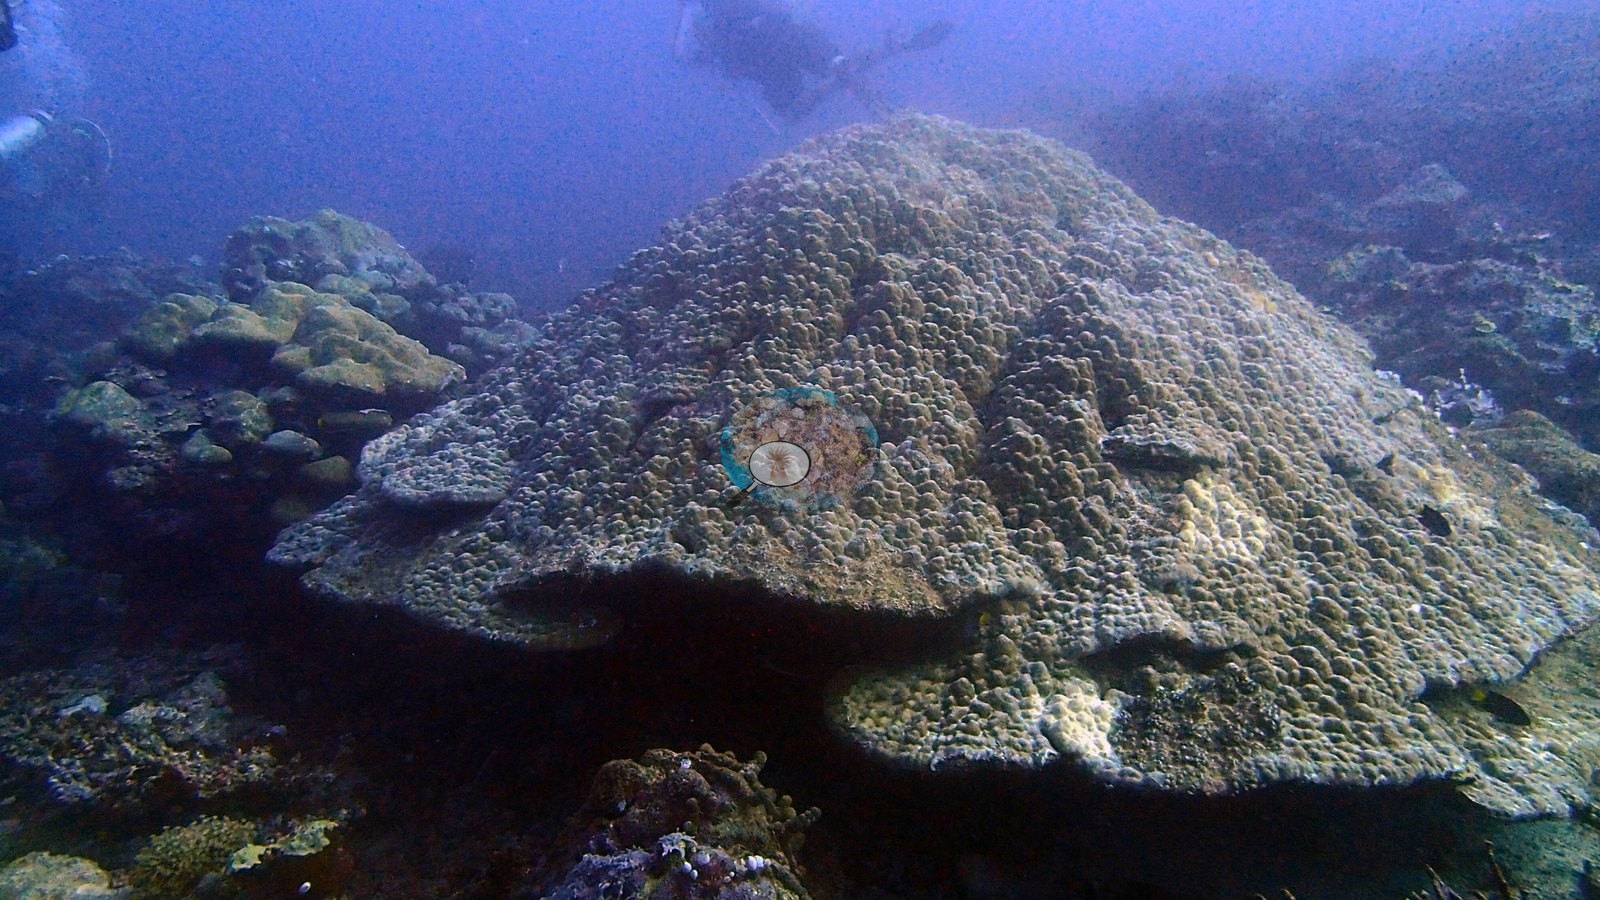
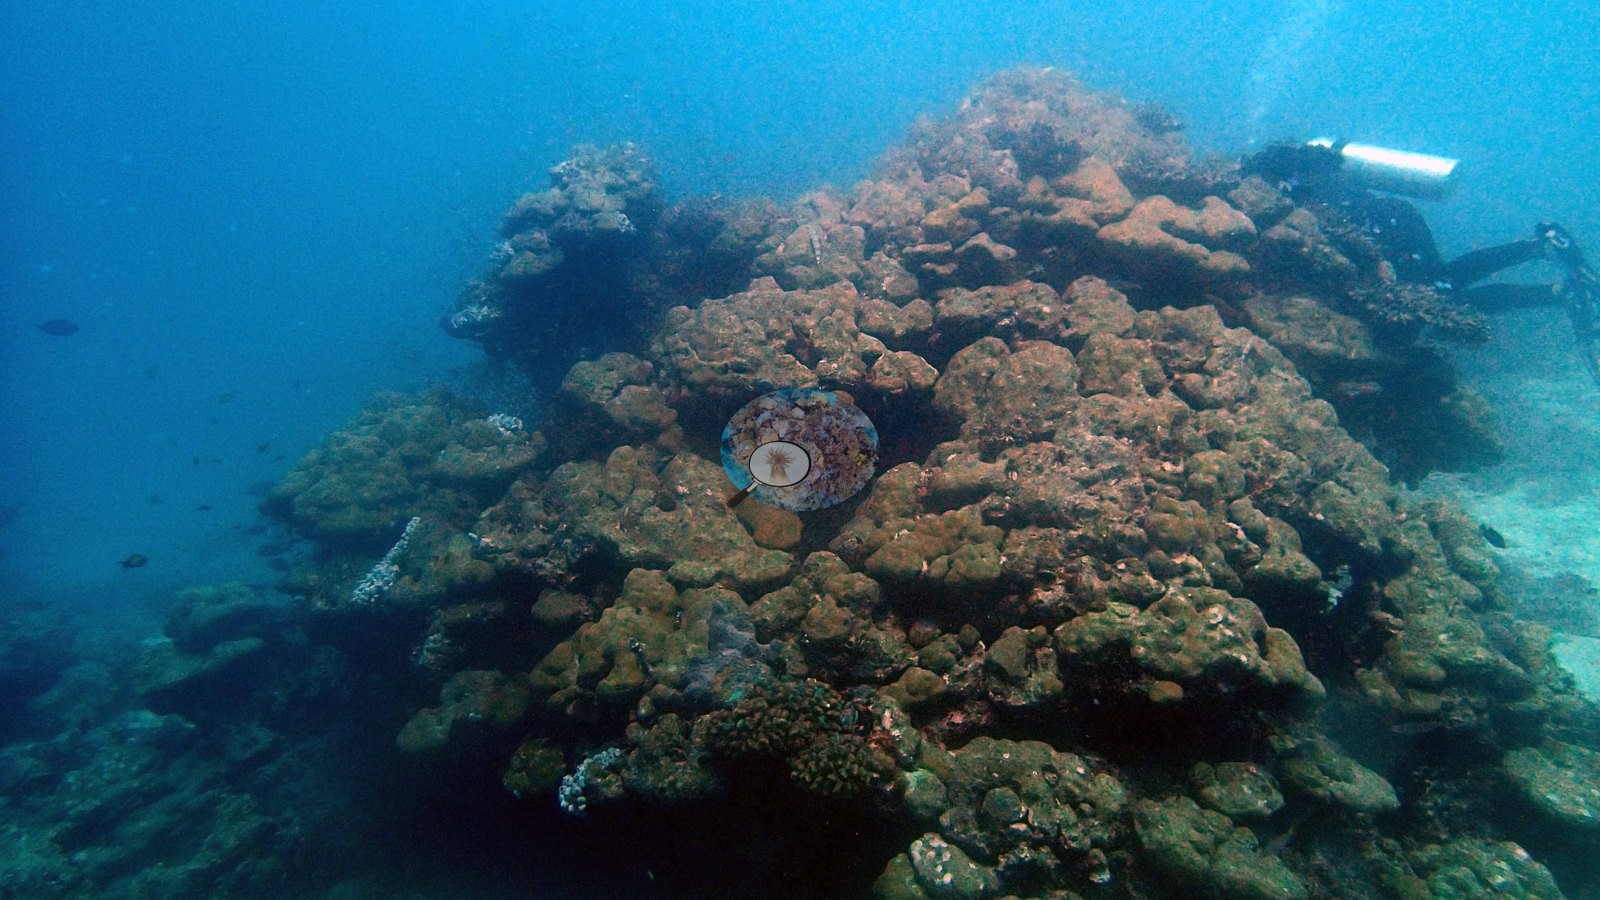
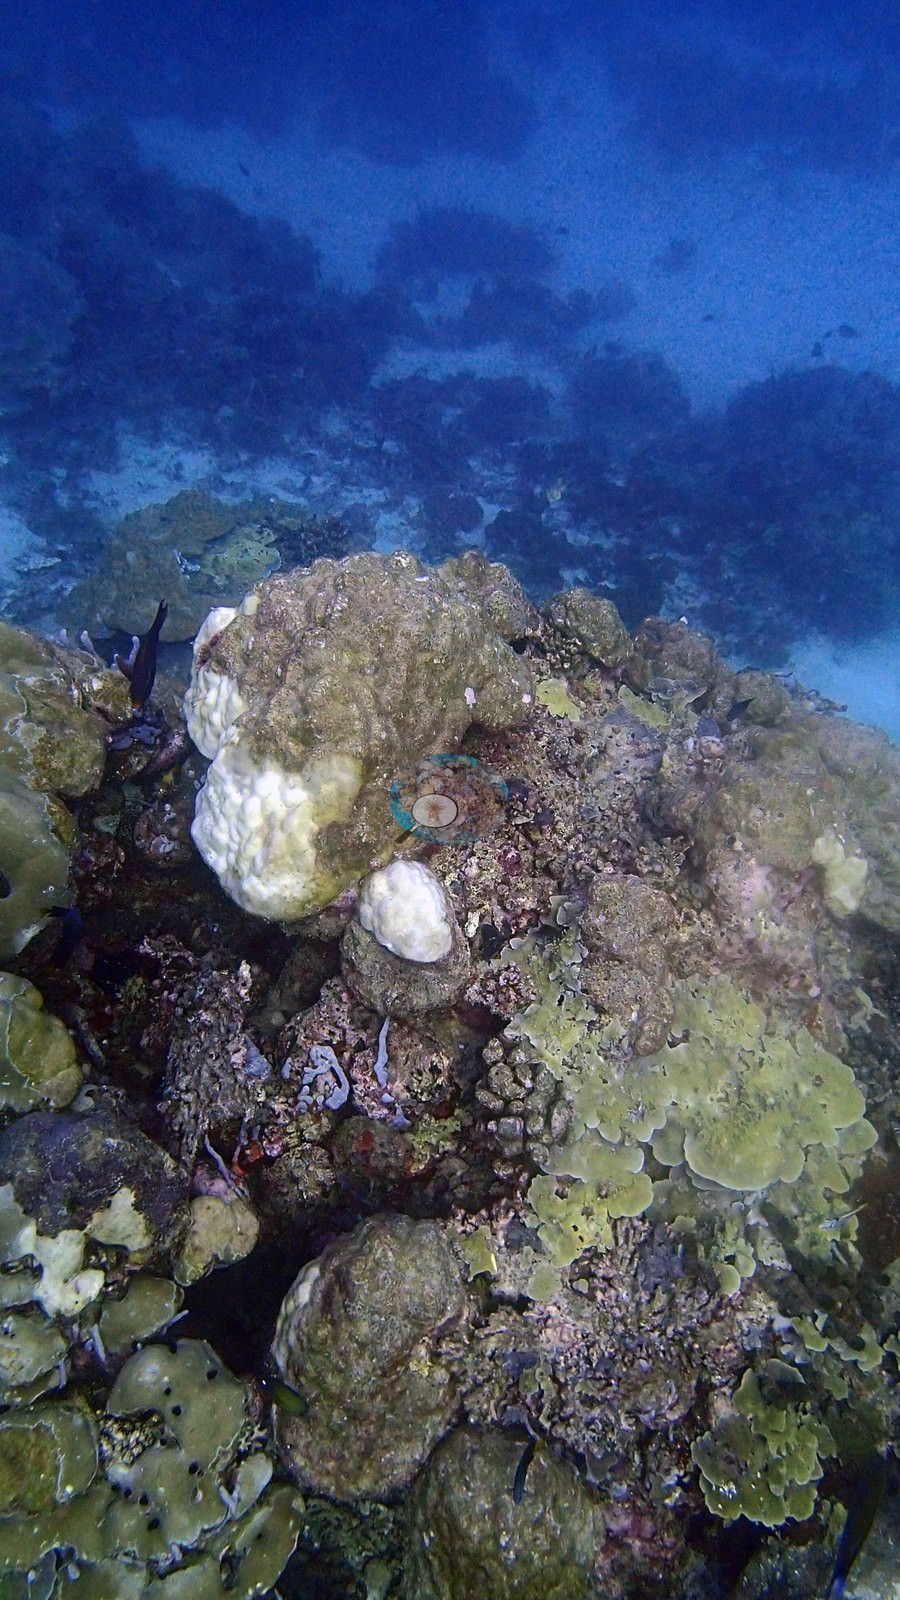
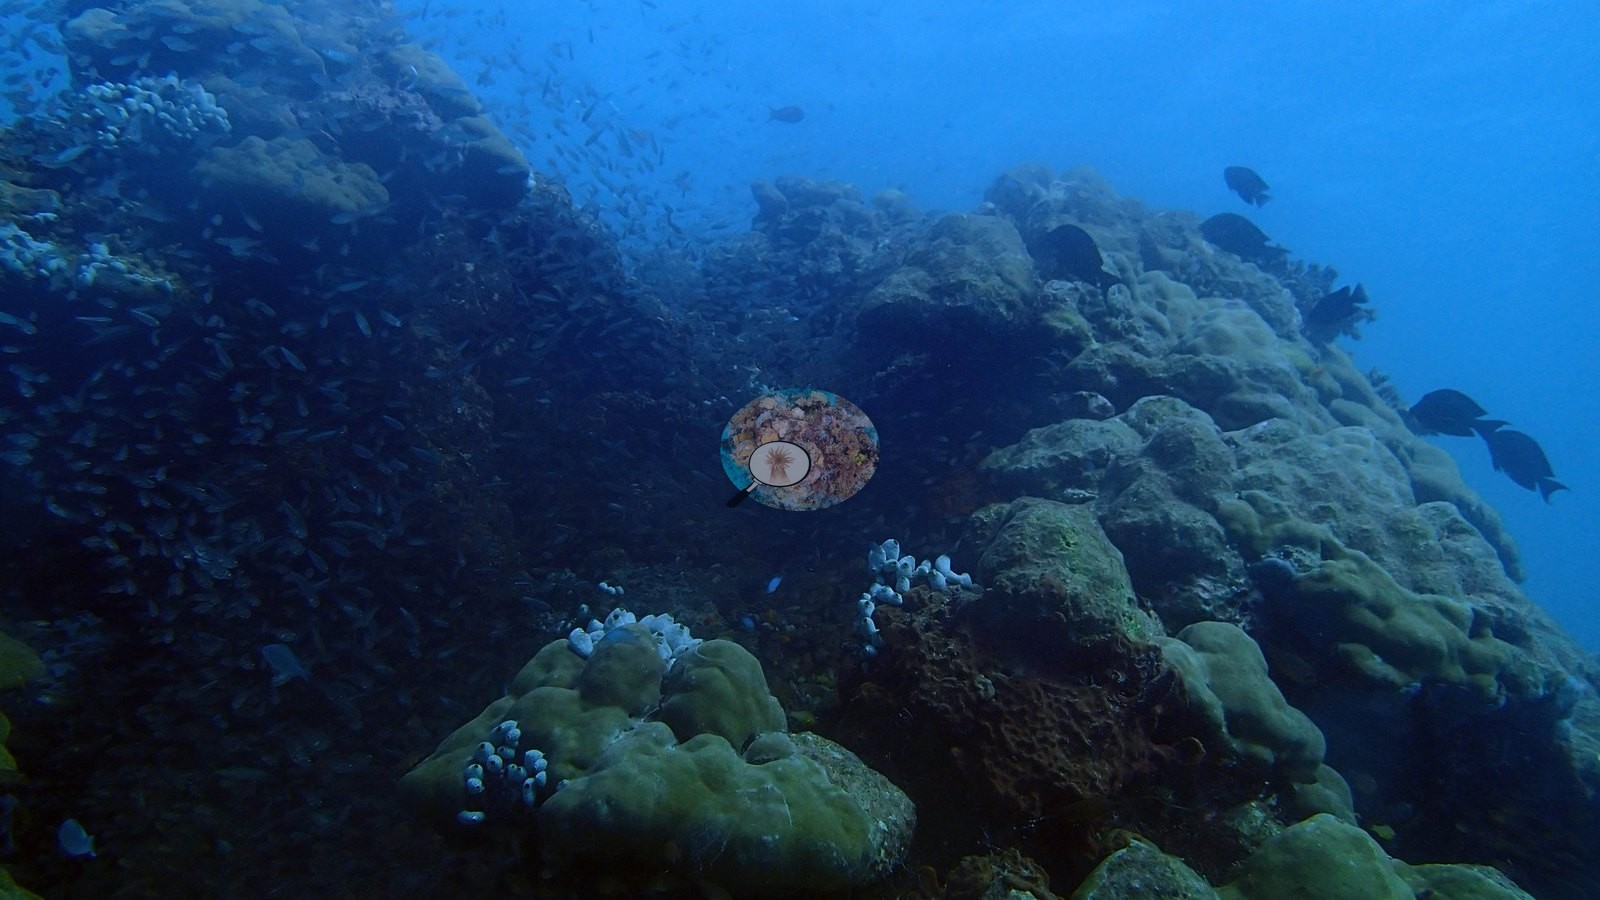
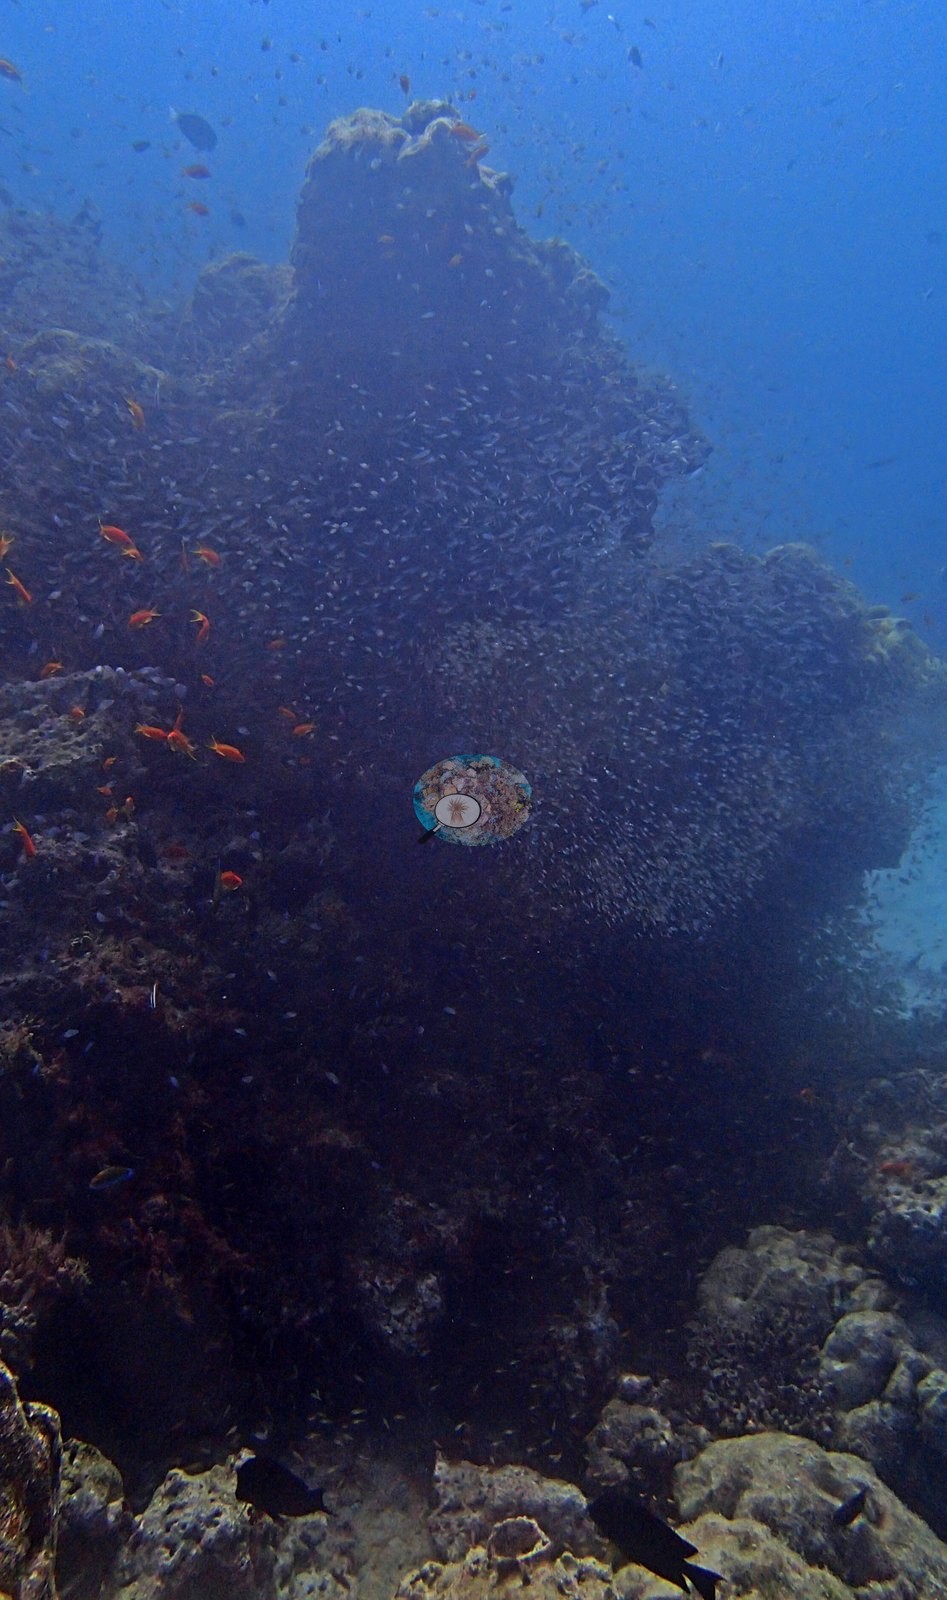
But climb the thila's flanks and the reef roars back — coral knolls stacked with living colonies, a "monster" dome coral compatible with Porites the size of a small car, and a face swarming with orange anthias-like fish (e.g., Image 15, Image 20).
Coral cover
Coral cover: 16% — photo-derived, and the two methods broadly agree (15% vs 17%). This site's figure is the mean of two independent computer vision passes over Anderson's own frames: a DINOv3 calibrated point classifier reads 14.8% and a CoralSCOP computer vision reads 16.5%, a spread of 1.7 percentage points. The map publishes the mean so sites can be sorted against one another, but the honest statement of what is known here is the 15–17% range: the two products have different denominators and should not be treated as one measurement.
Stressors
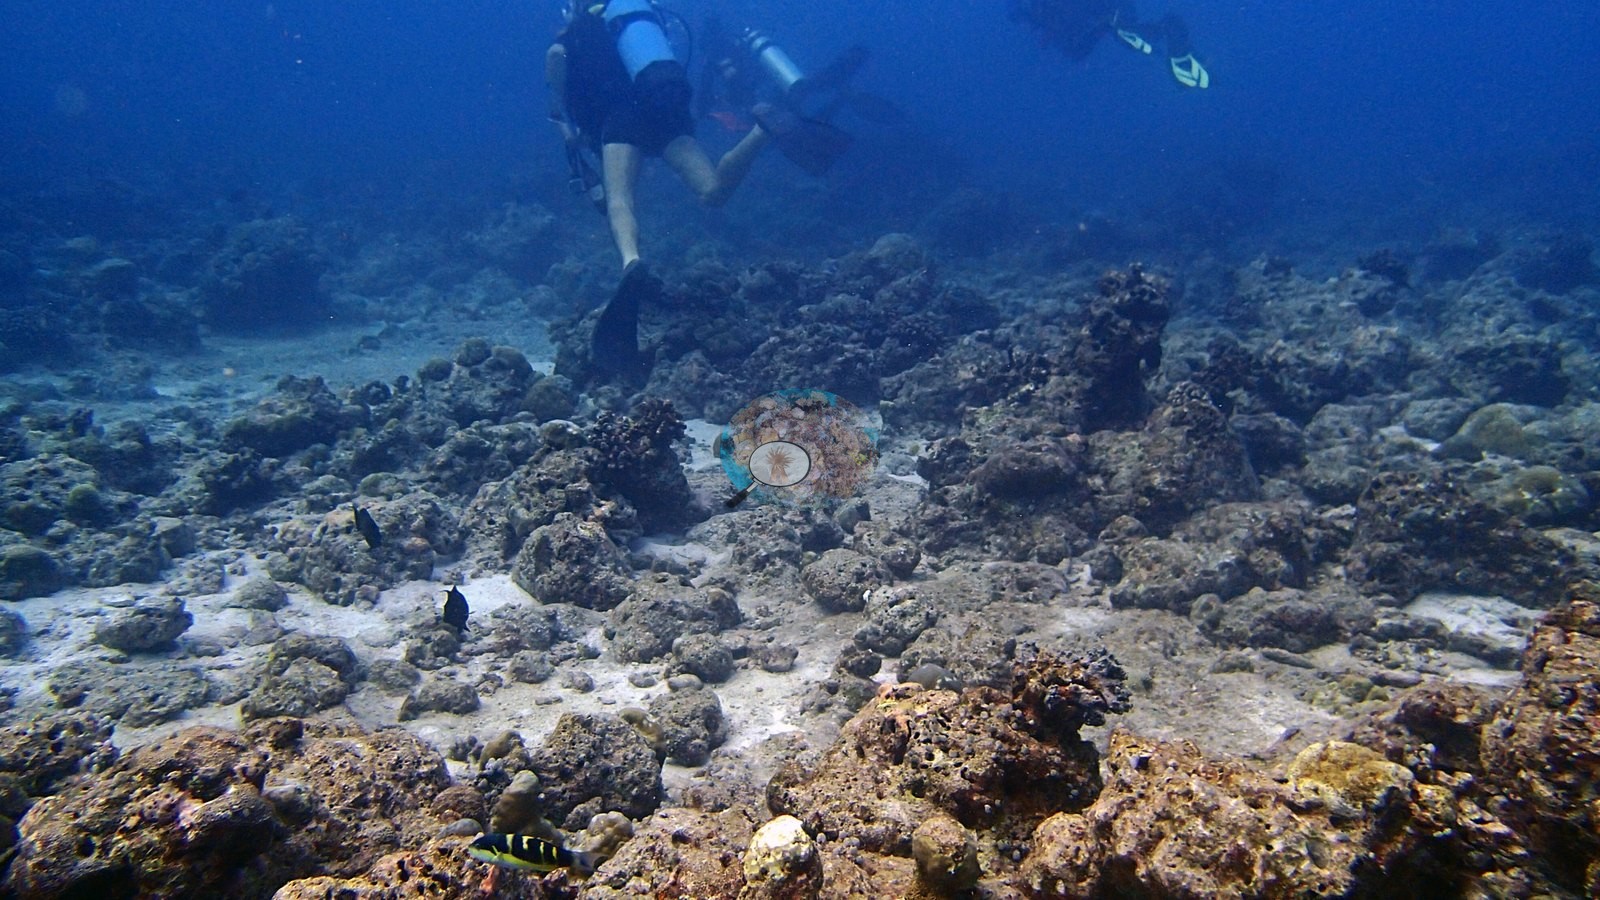
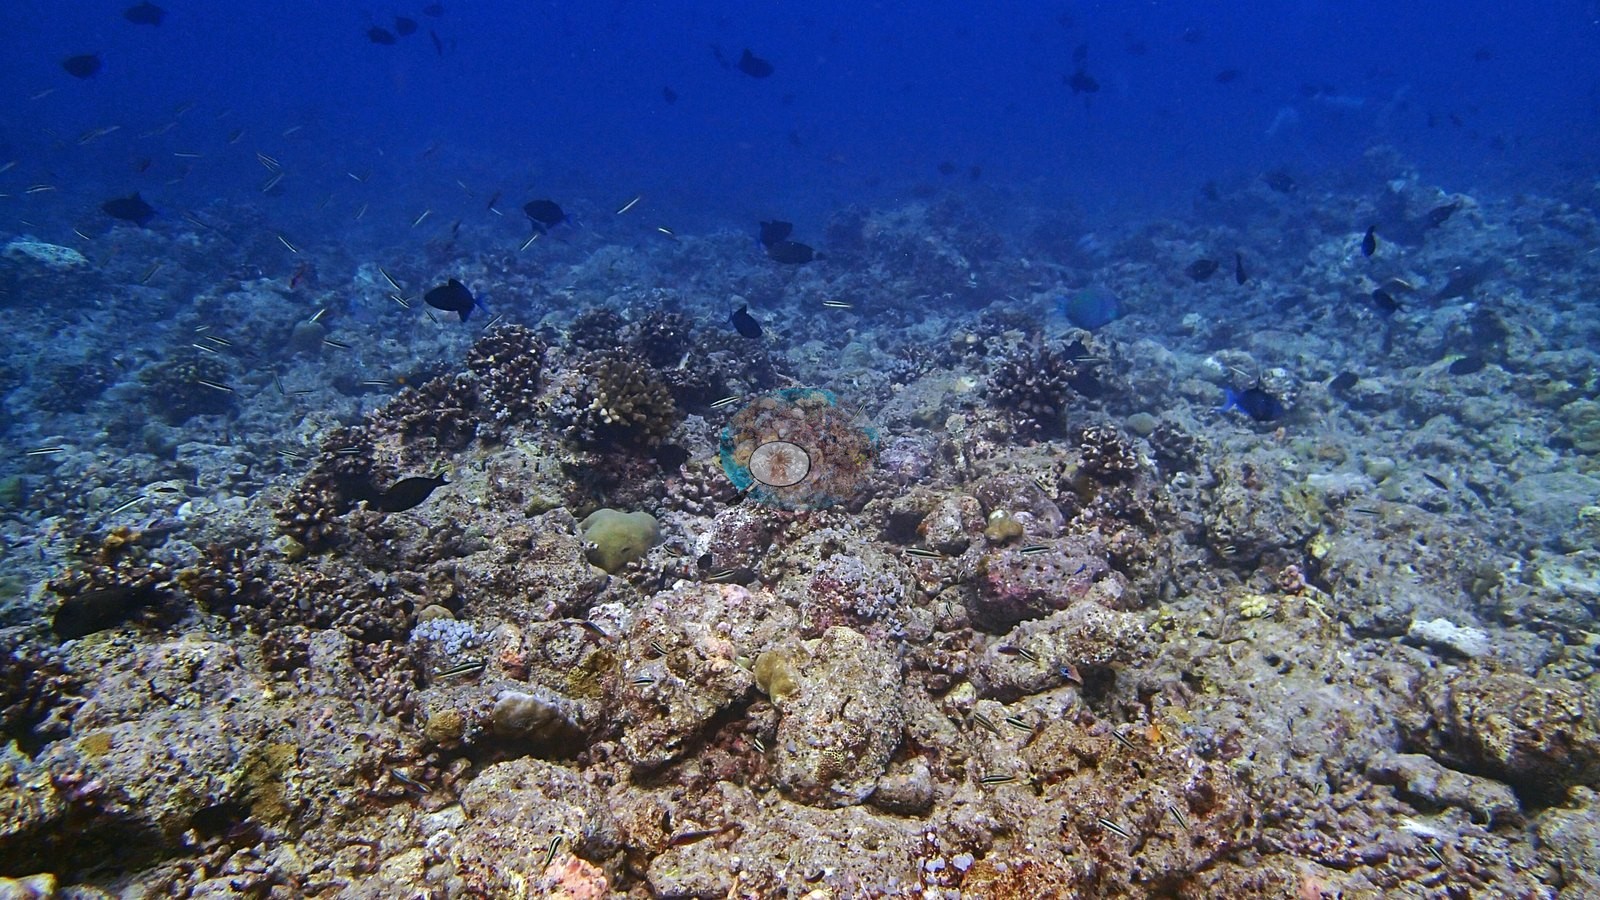
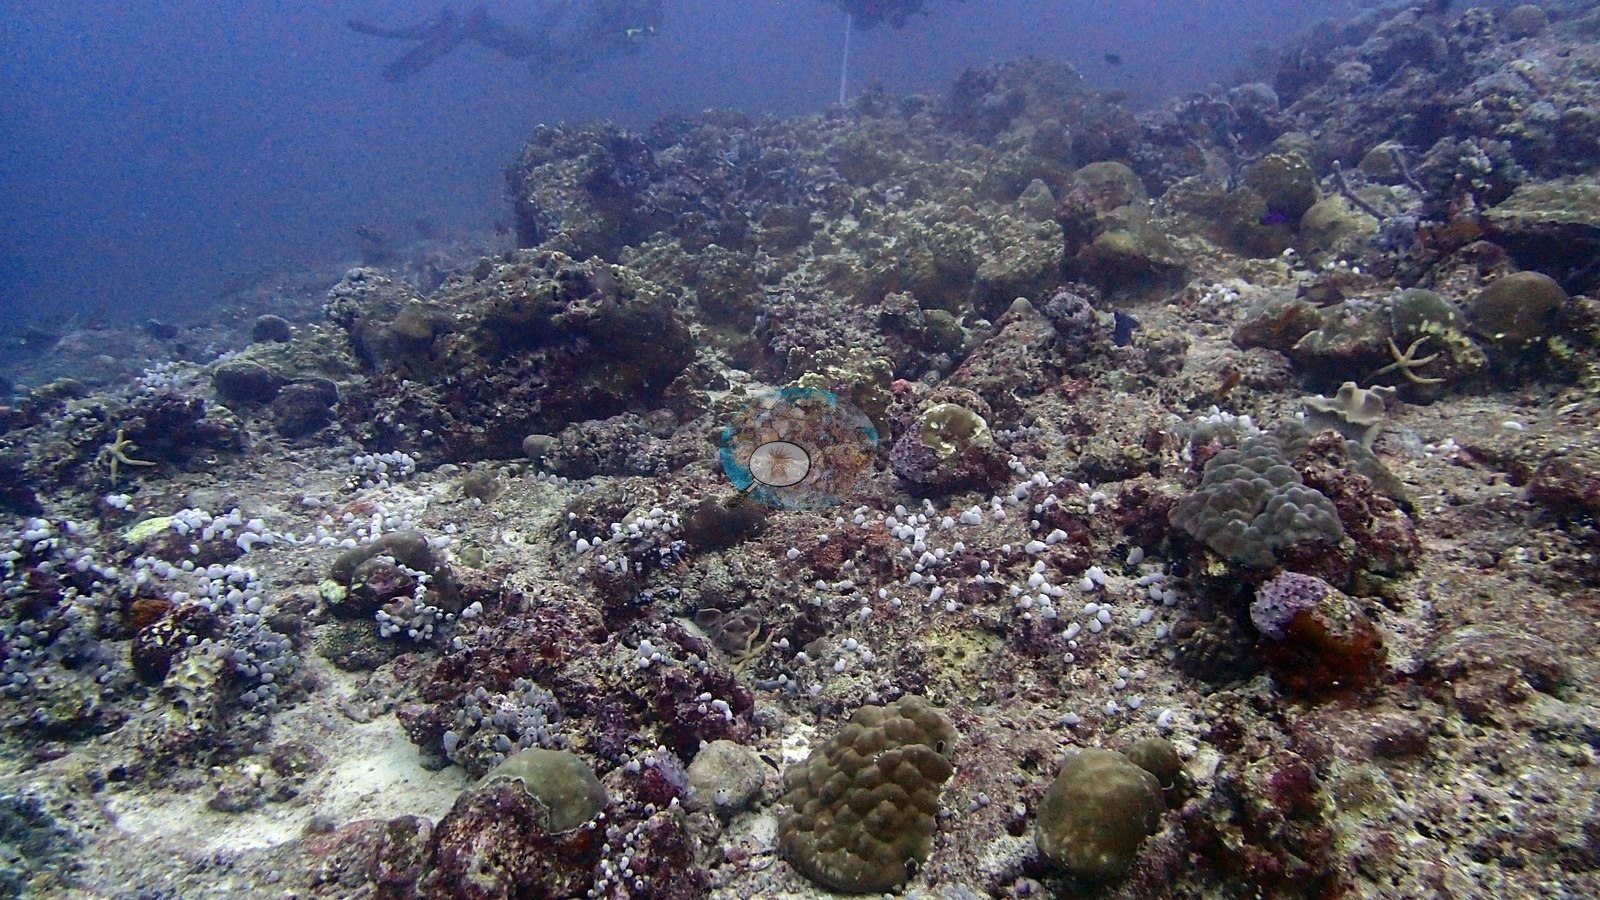
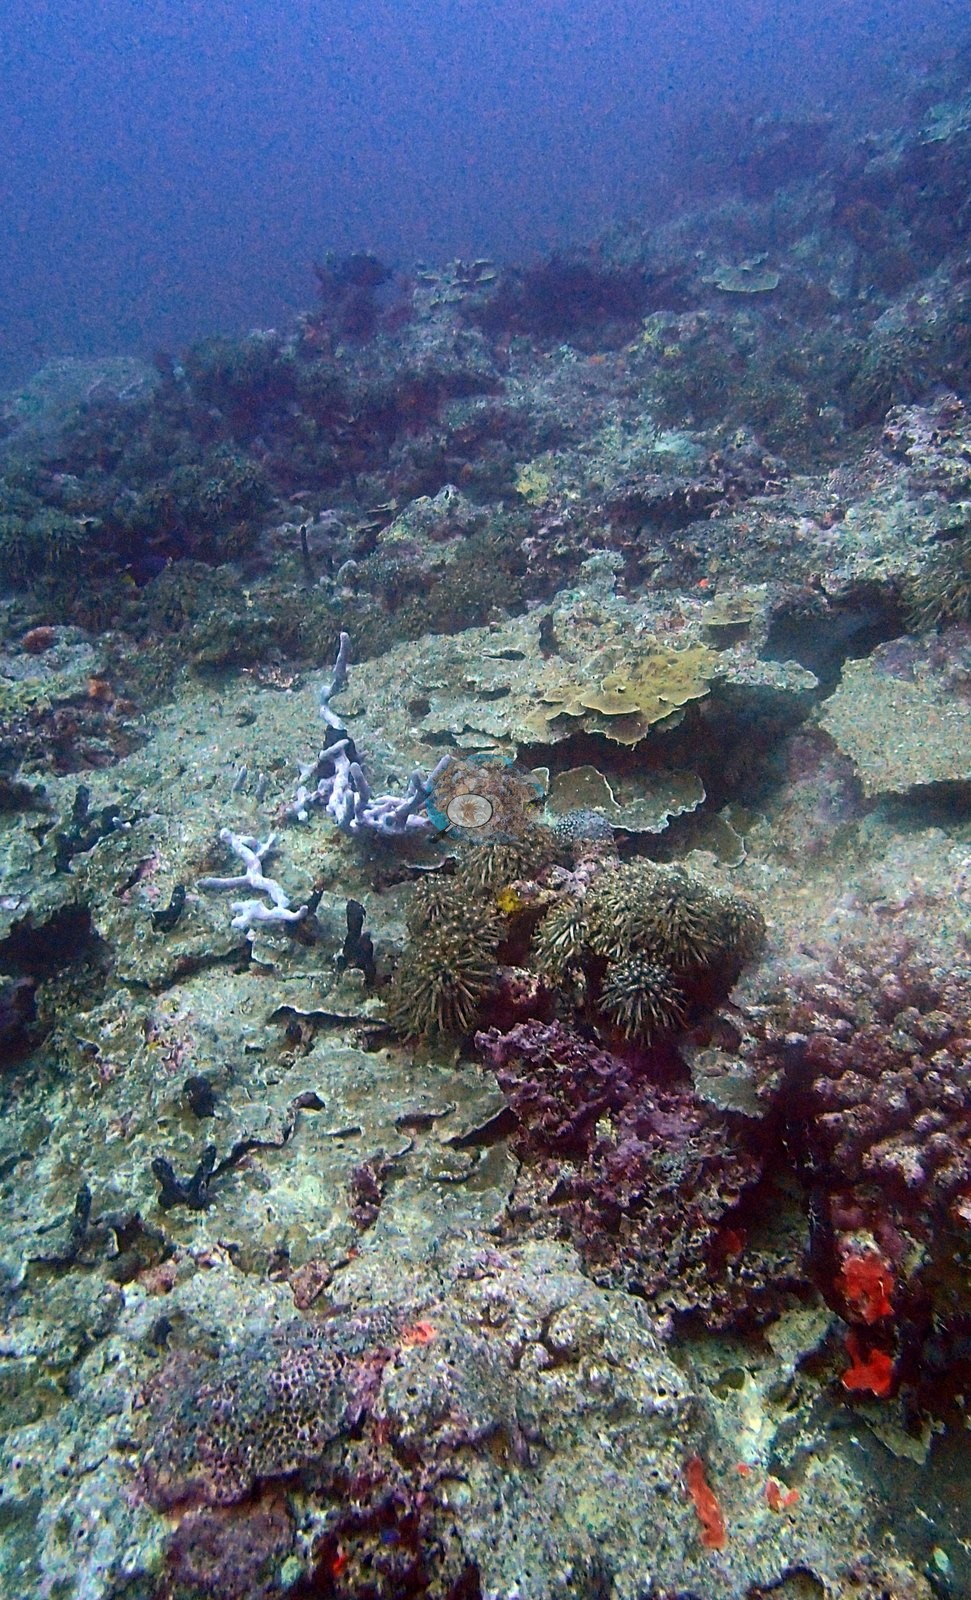
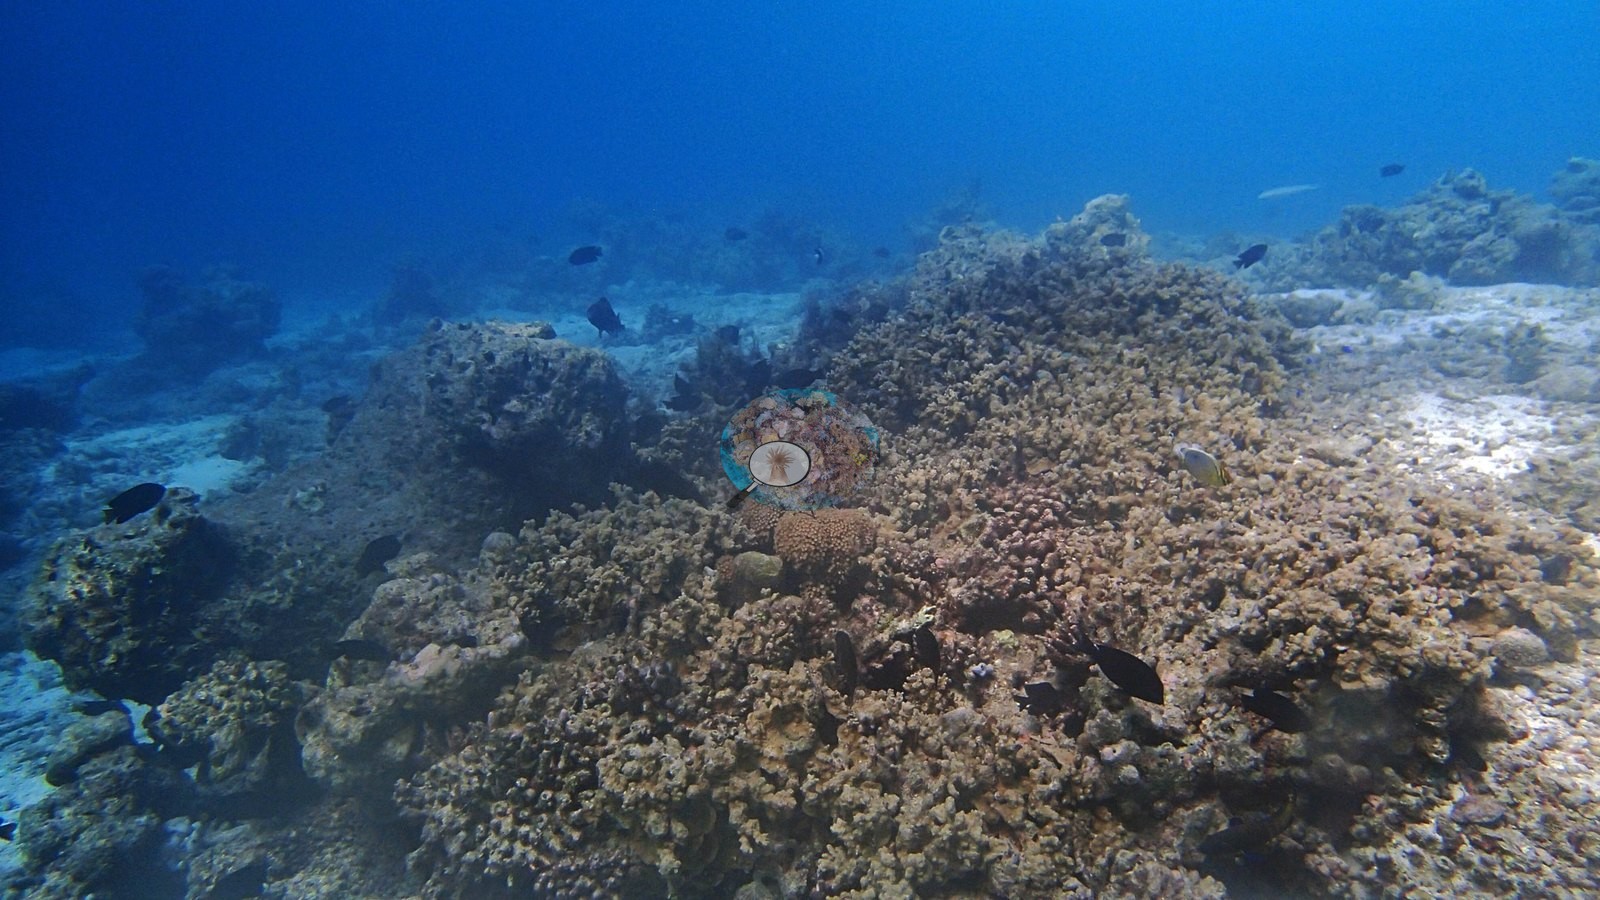
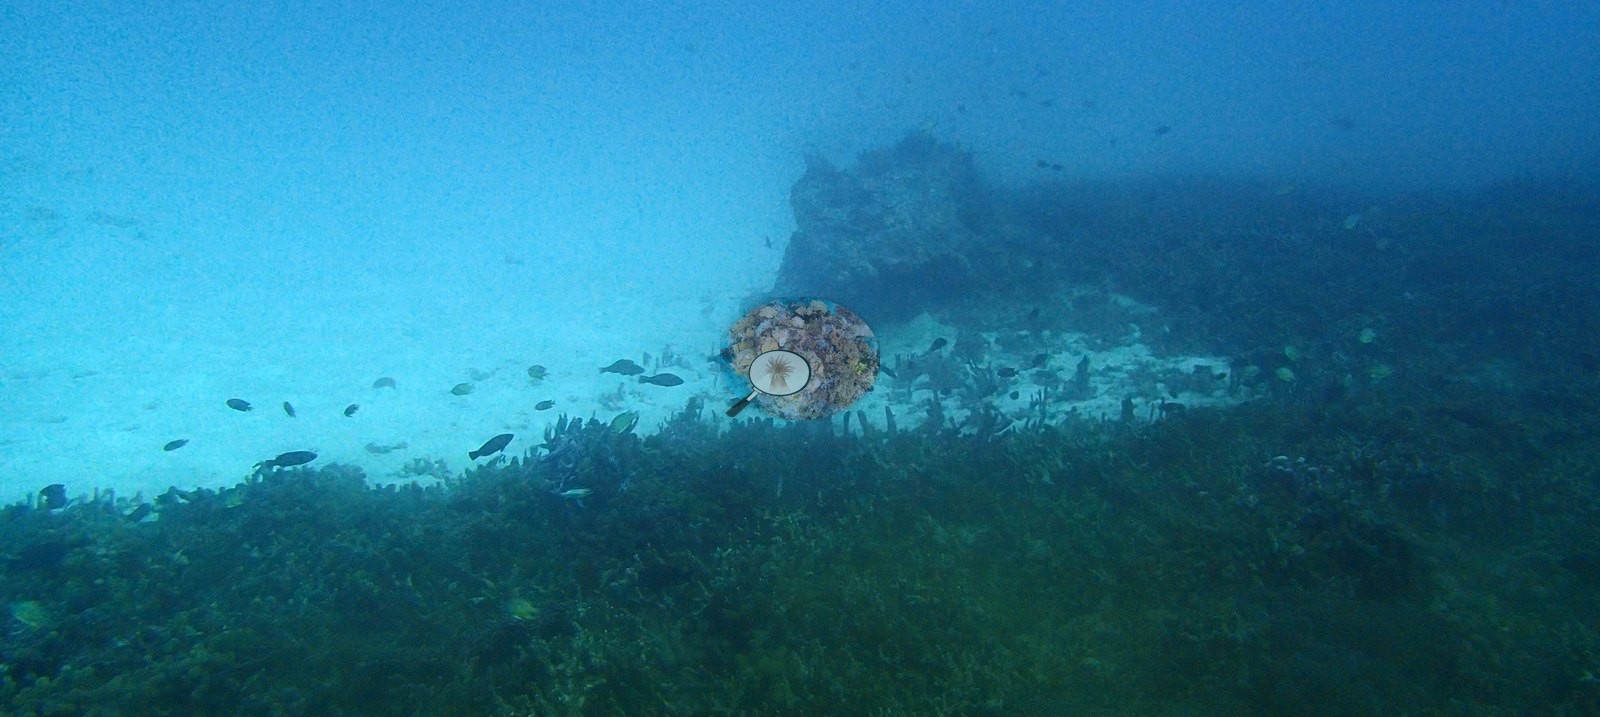
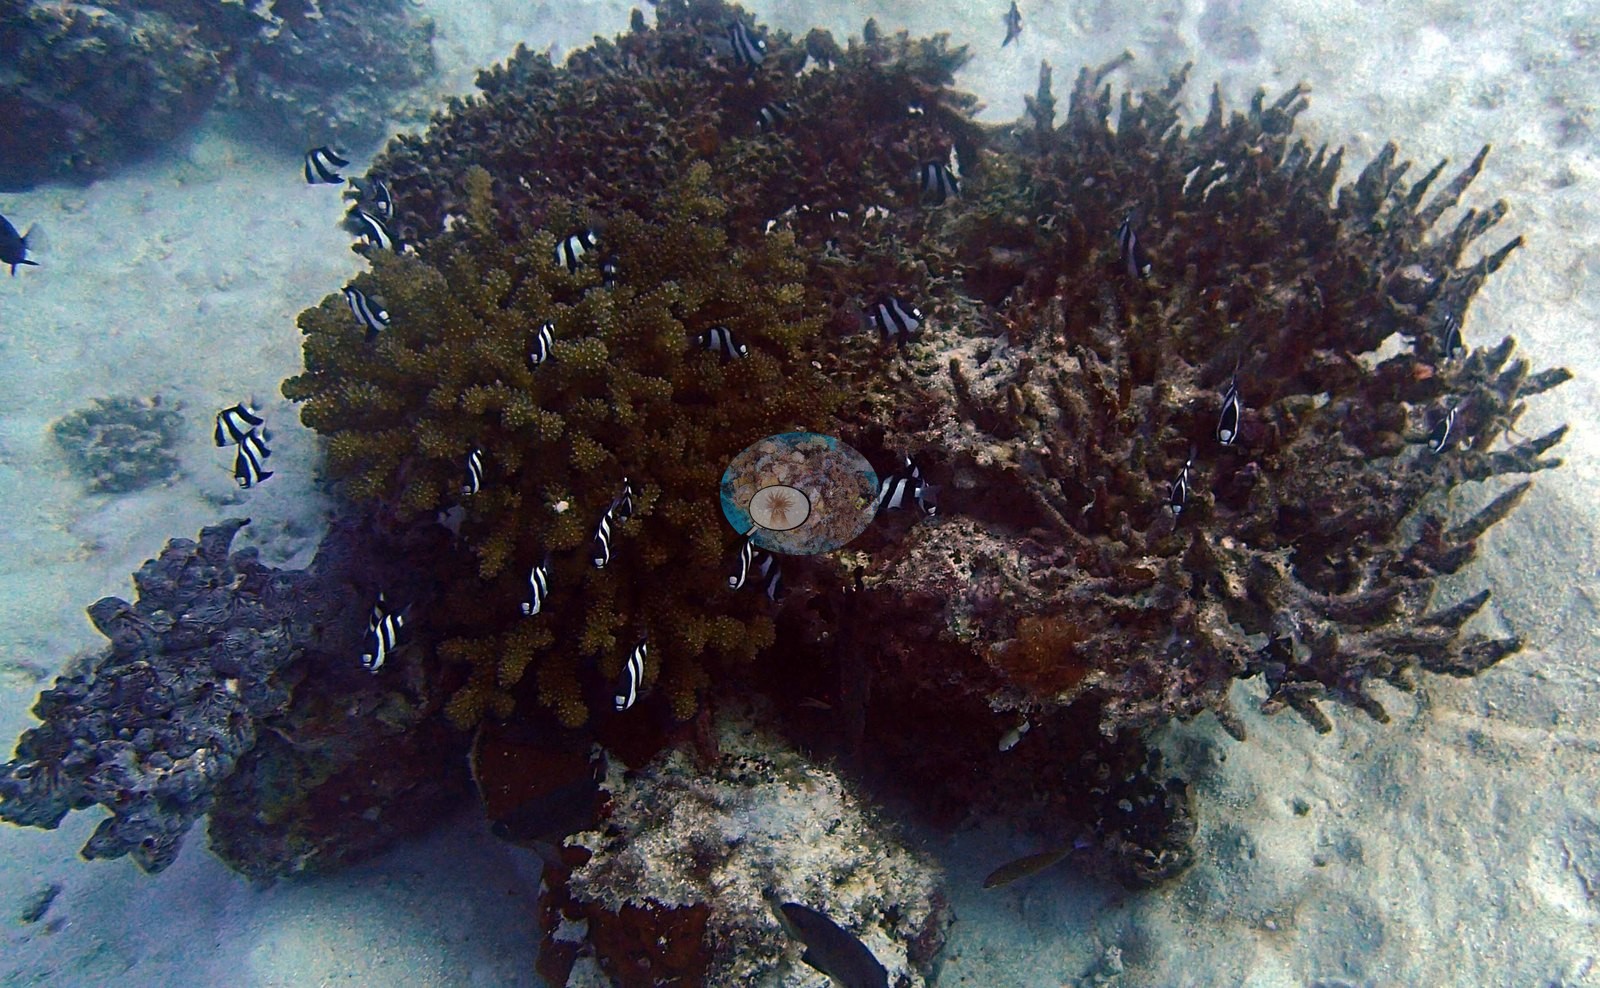
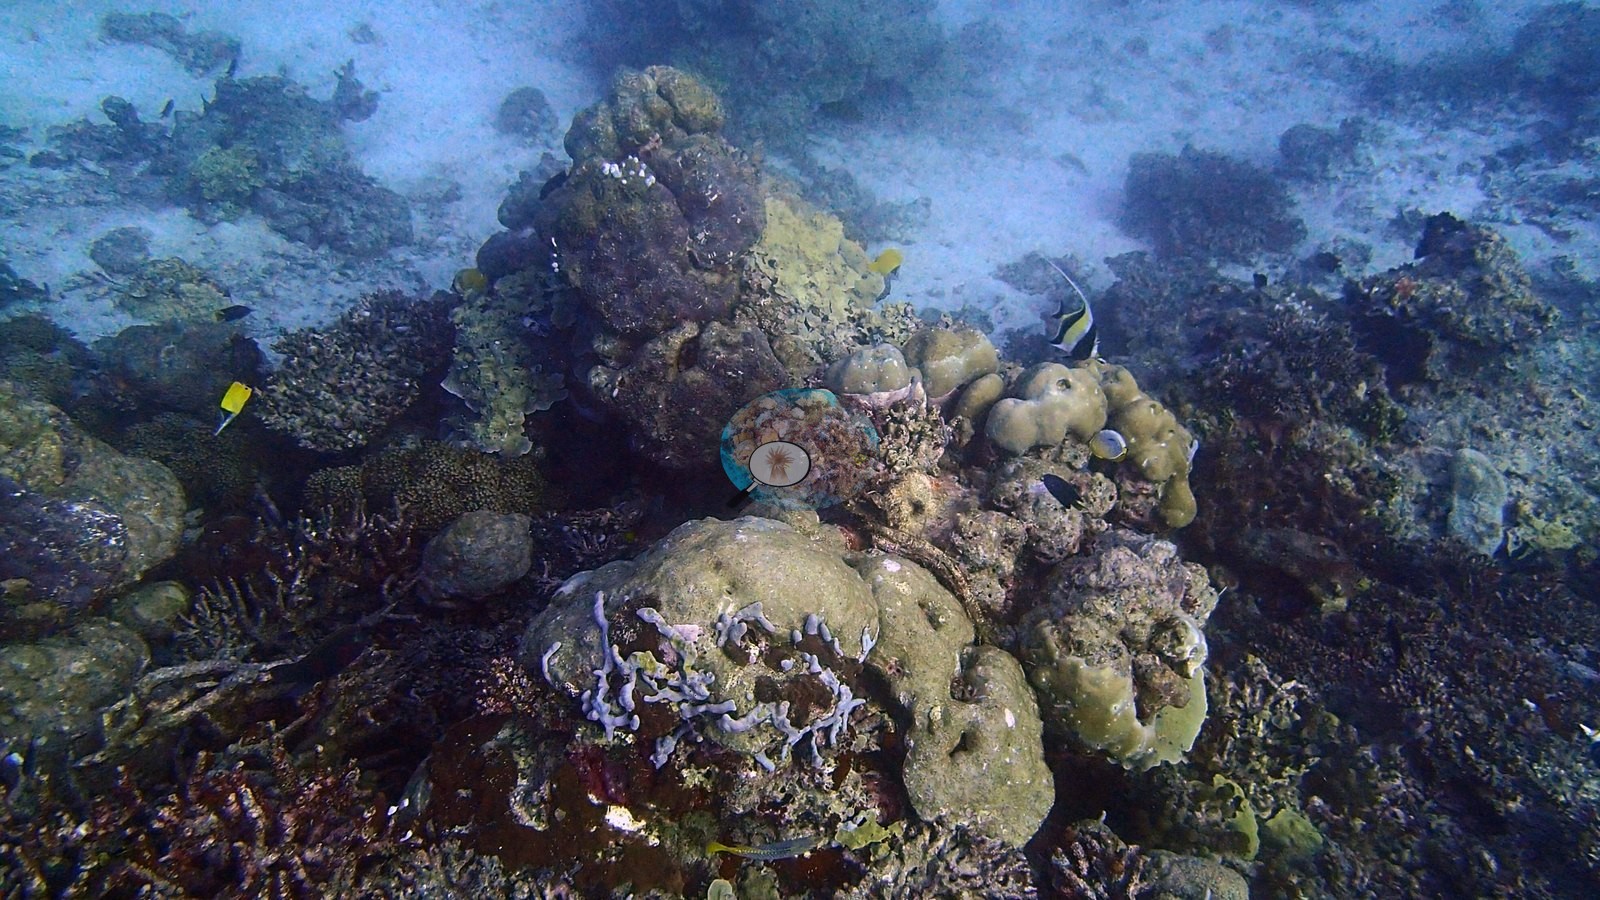
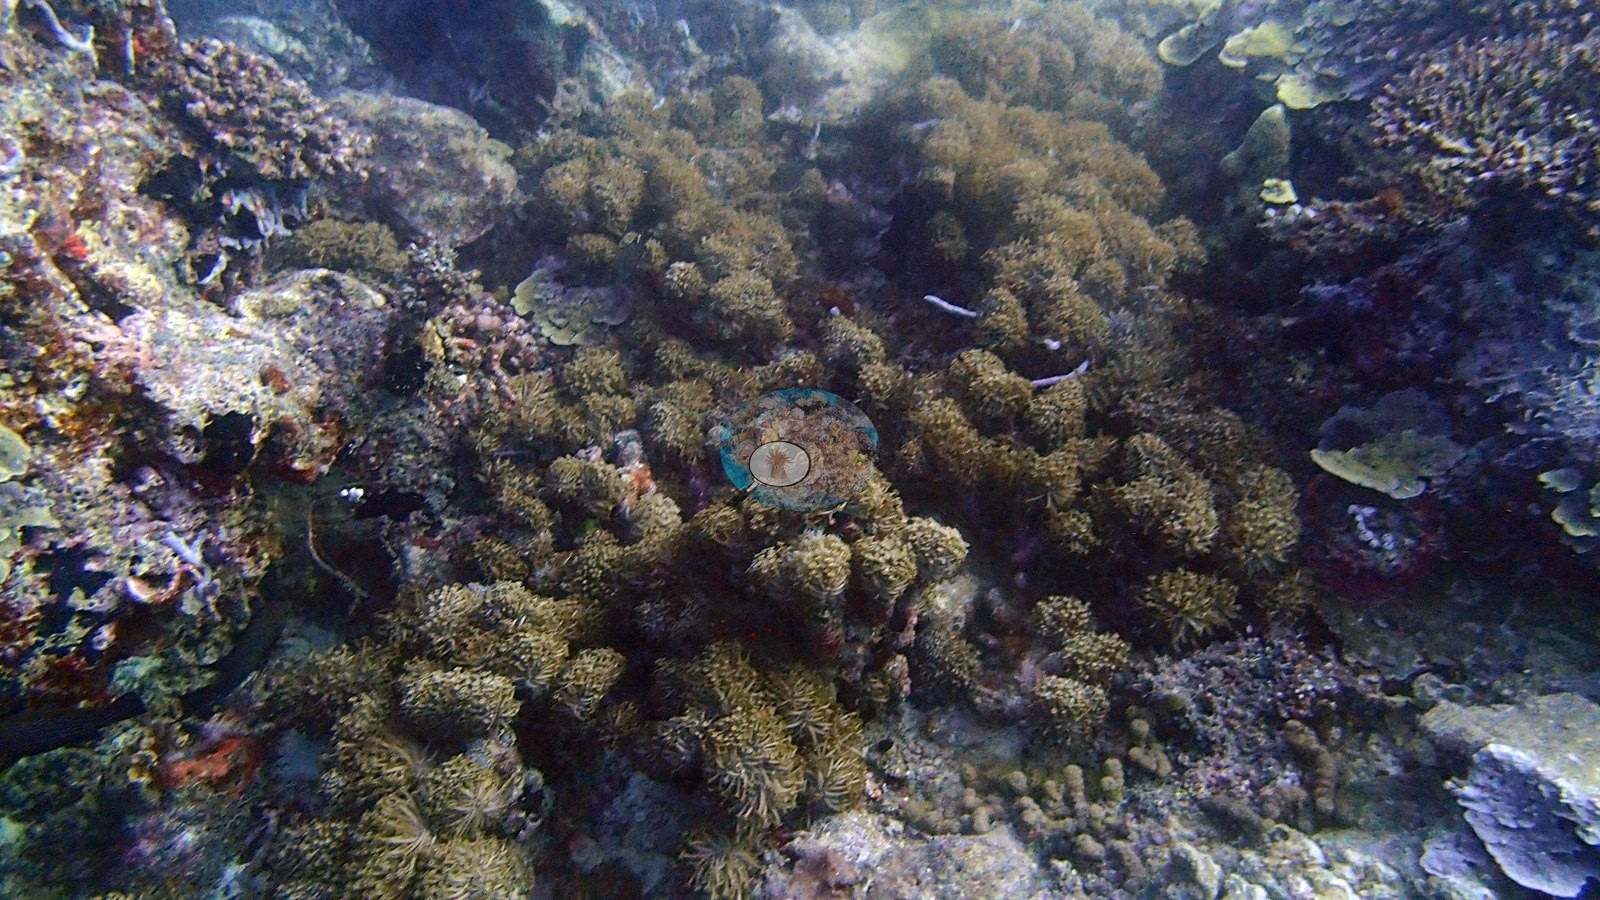
The shallow rubble plains tell the 2016 story plainly: fields of broken framework and dead staghorn thickets that still shelter flickering columns of humbug damselfish (e.g., Image 17, Image 18).
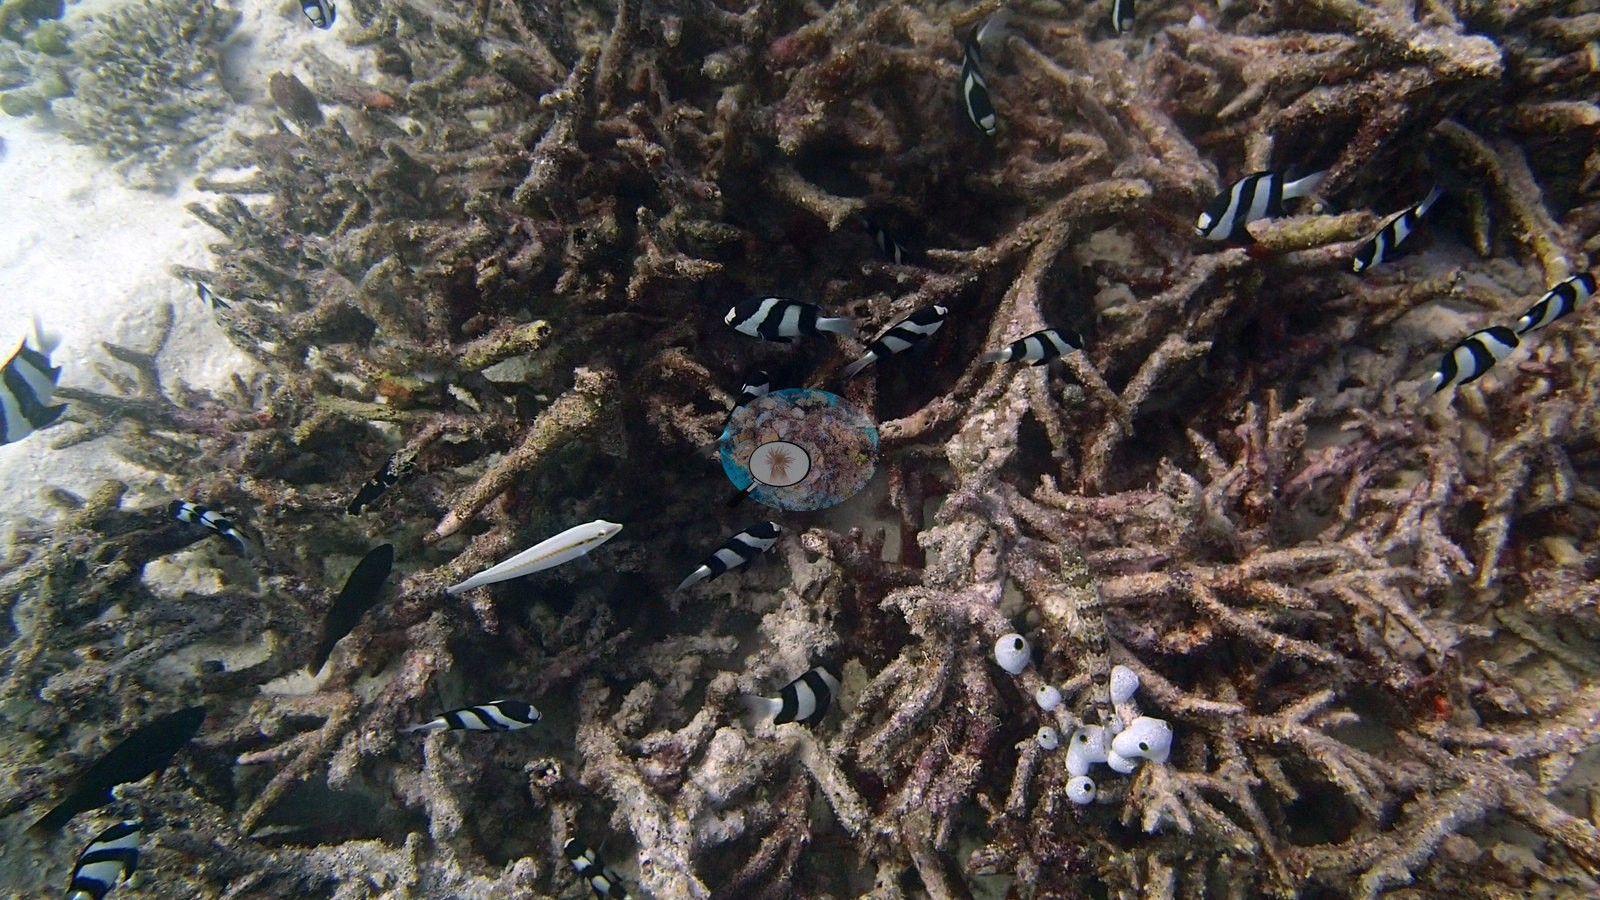
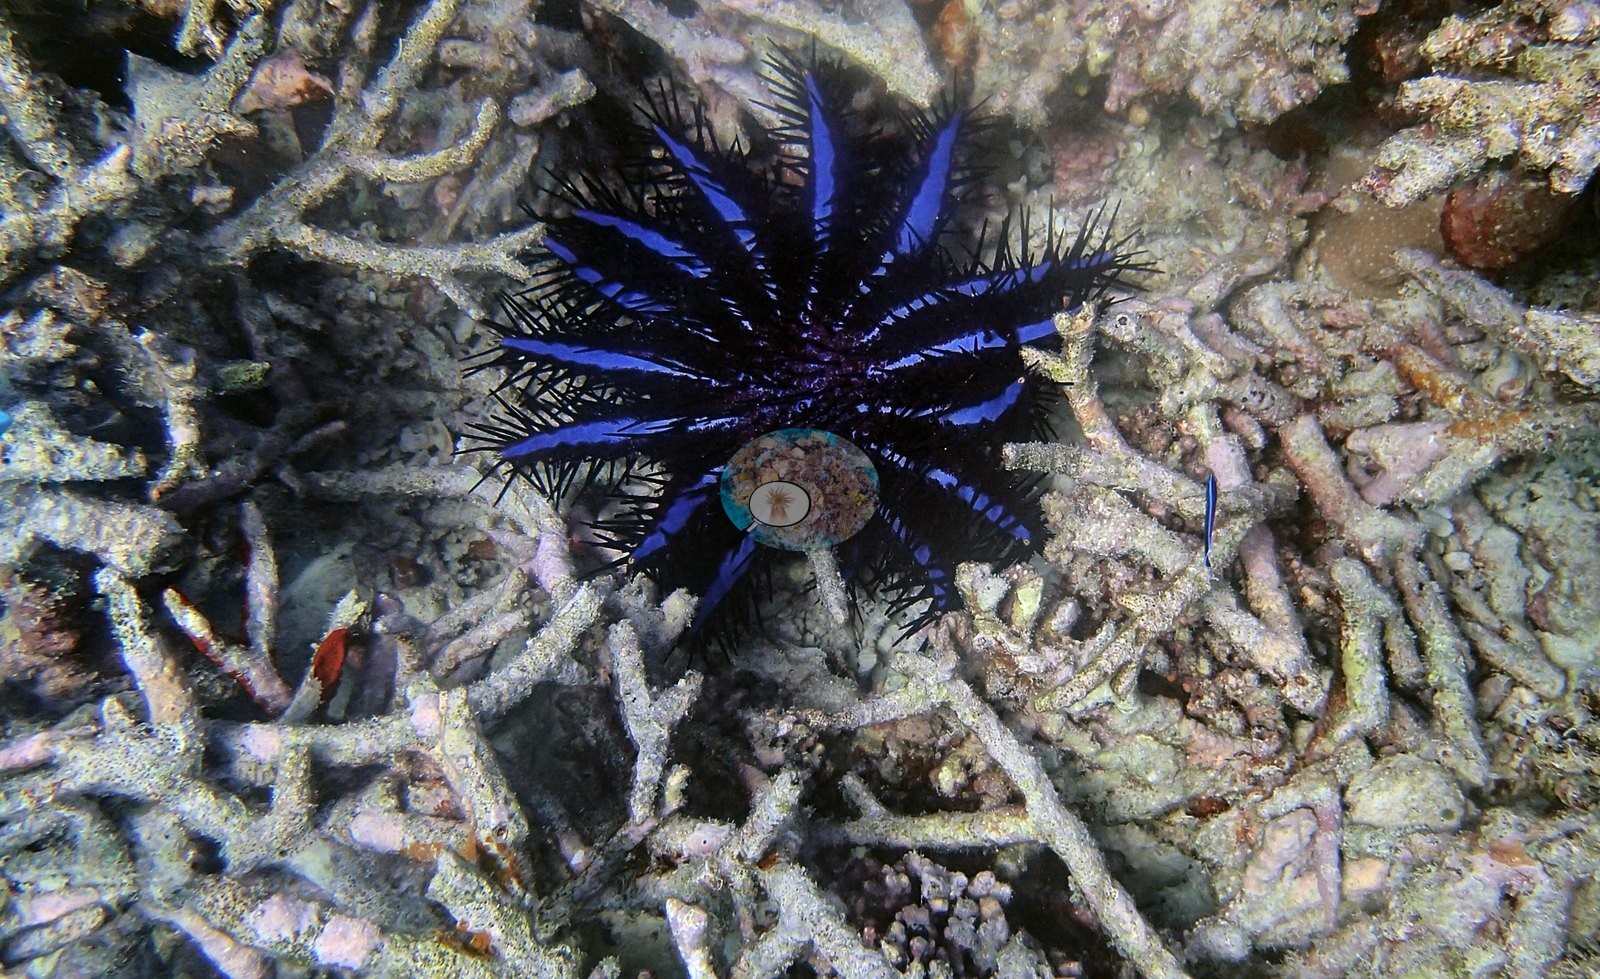
No crown-of-thorns starfish (COTS) or other corallivores evident.
Fish and other fauna
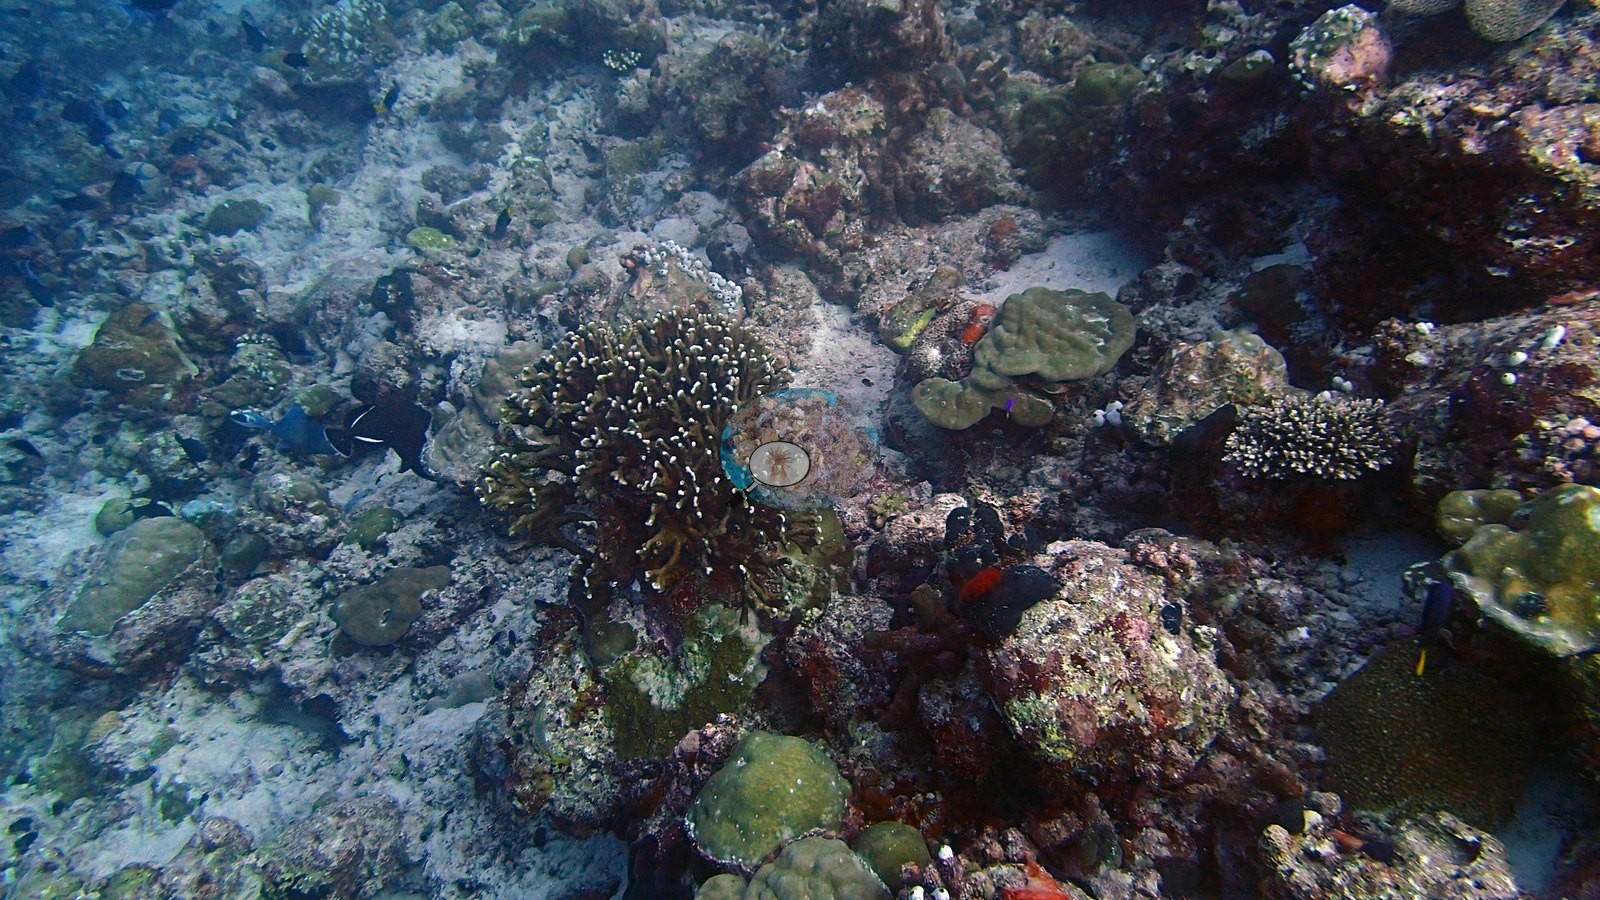
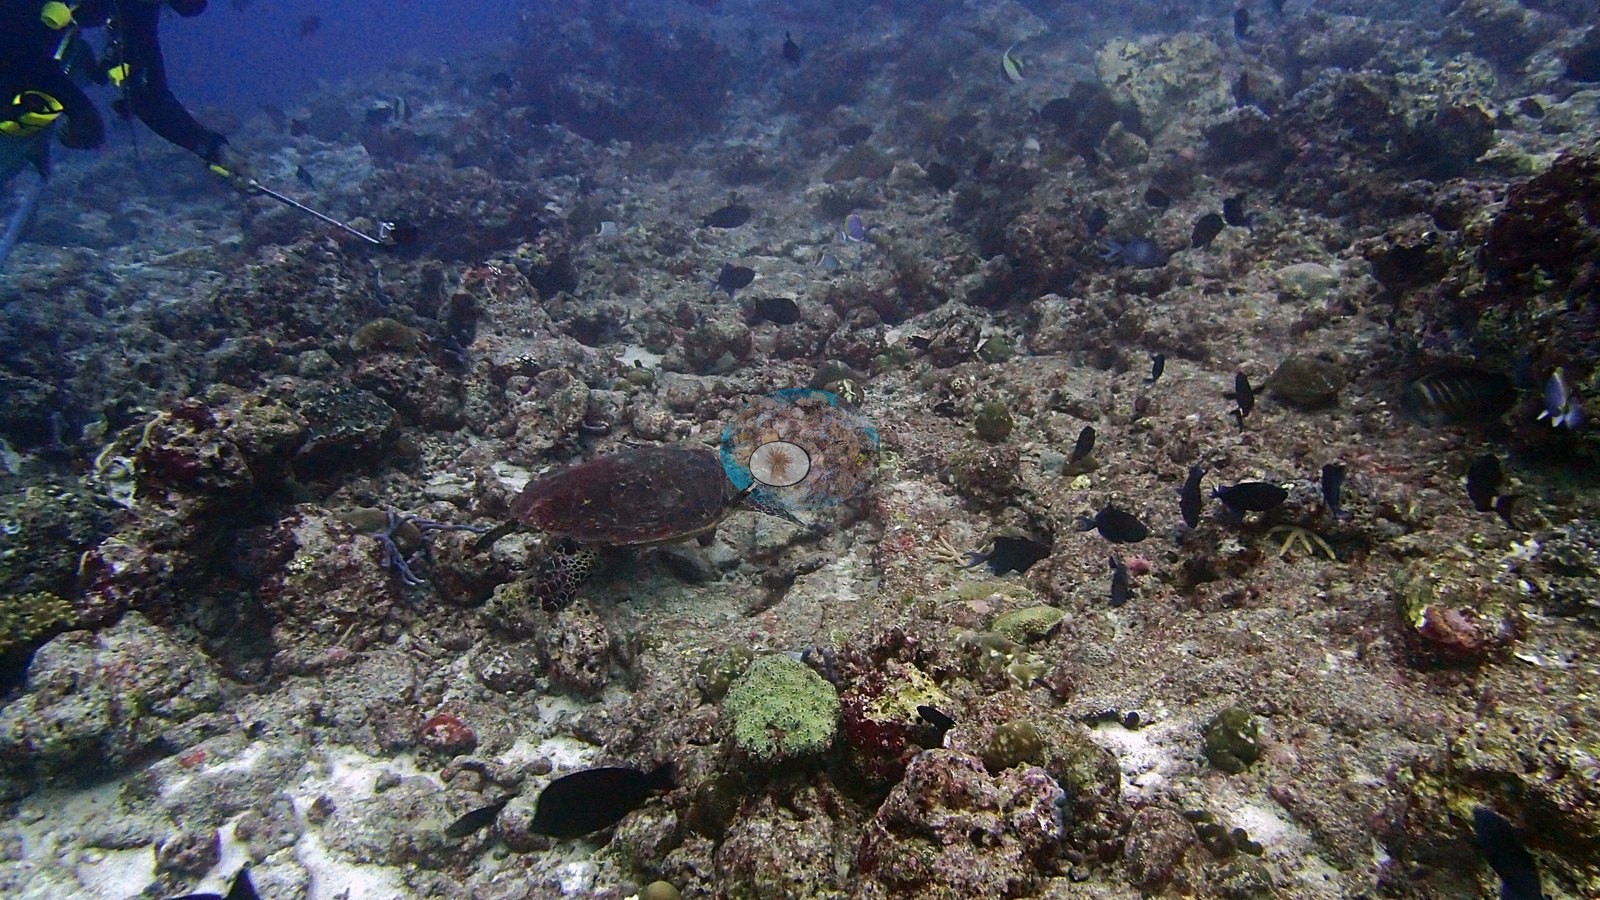
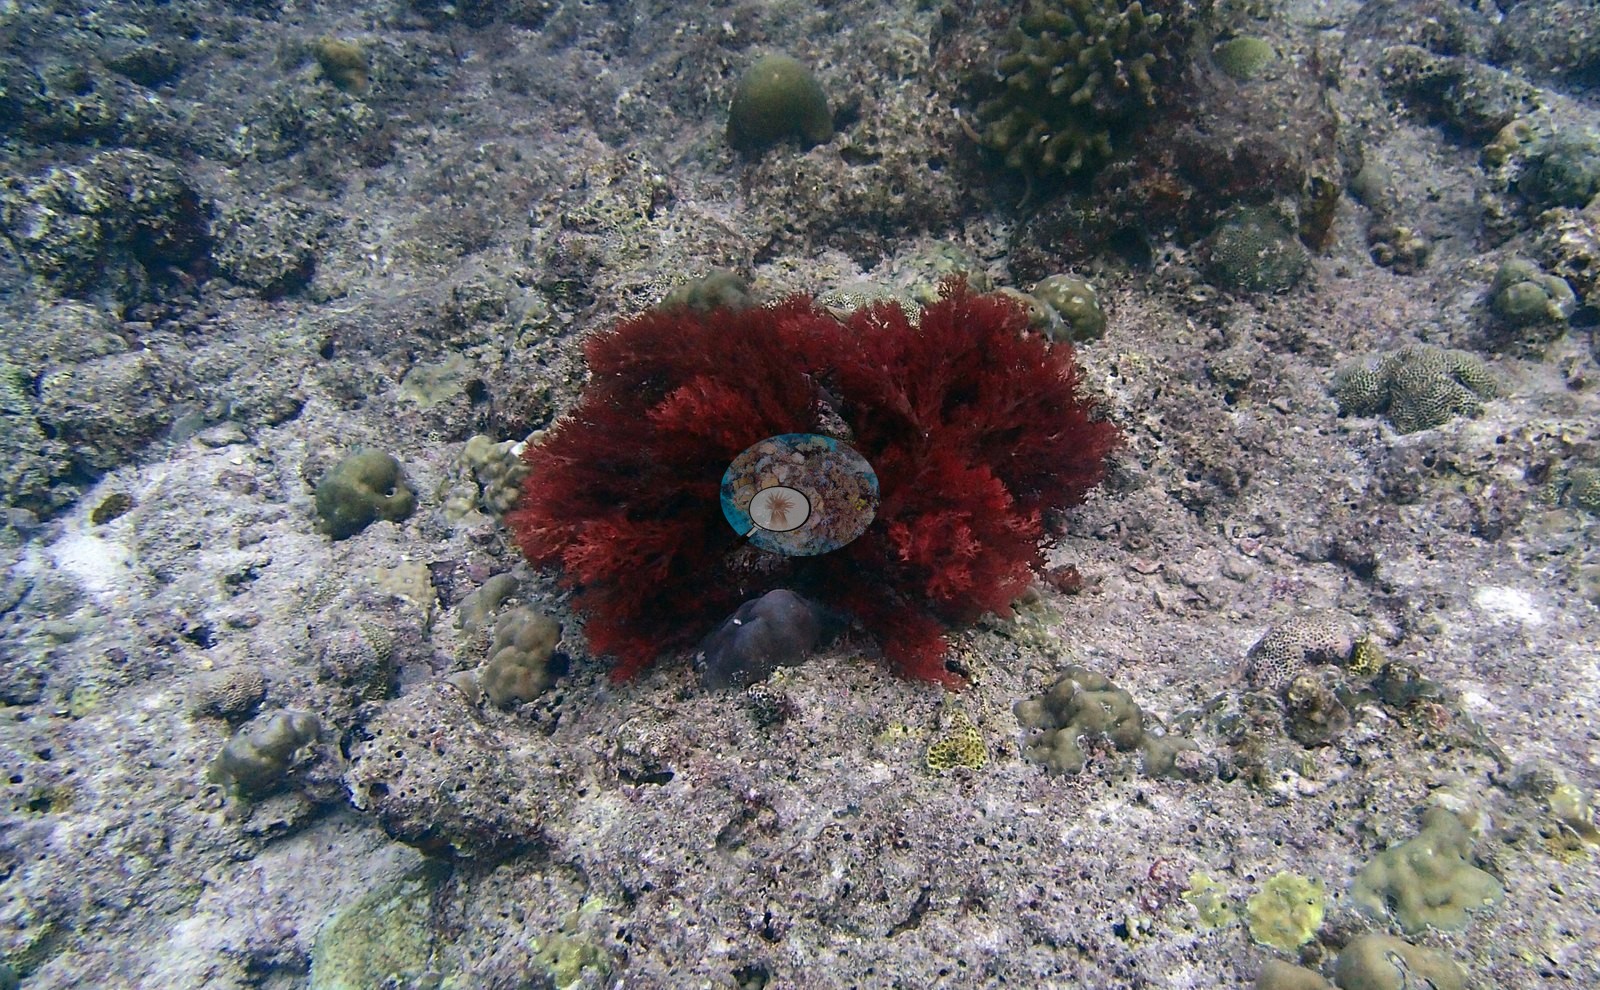
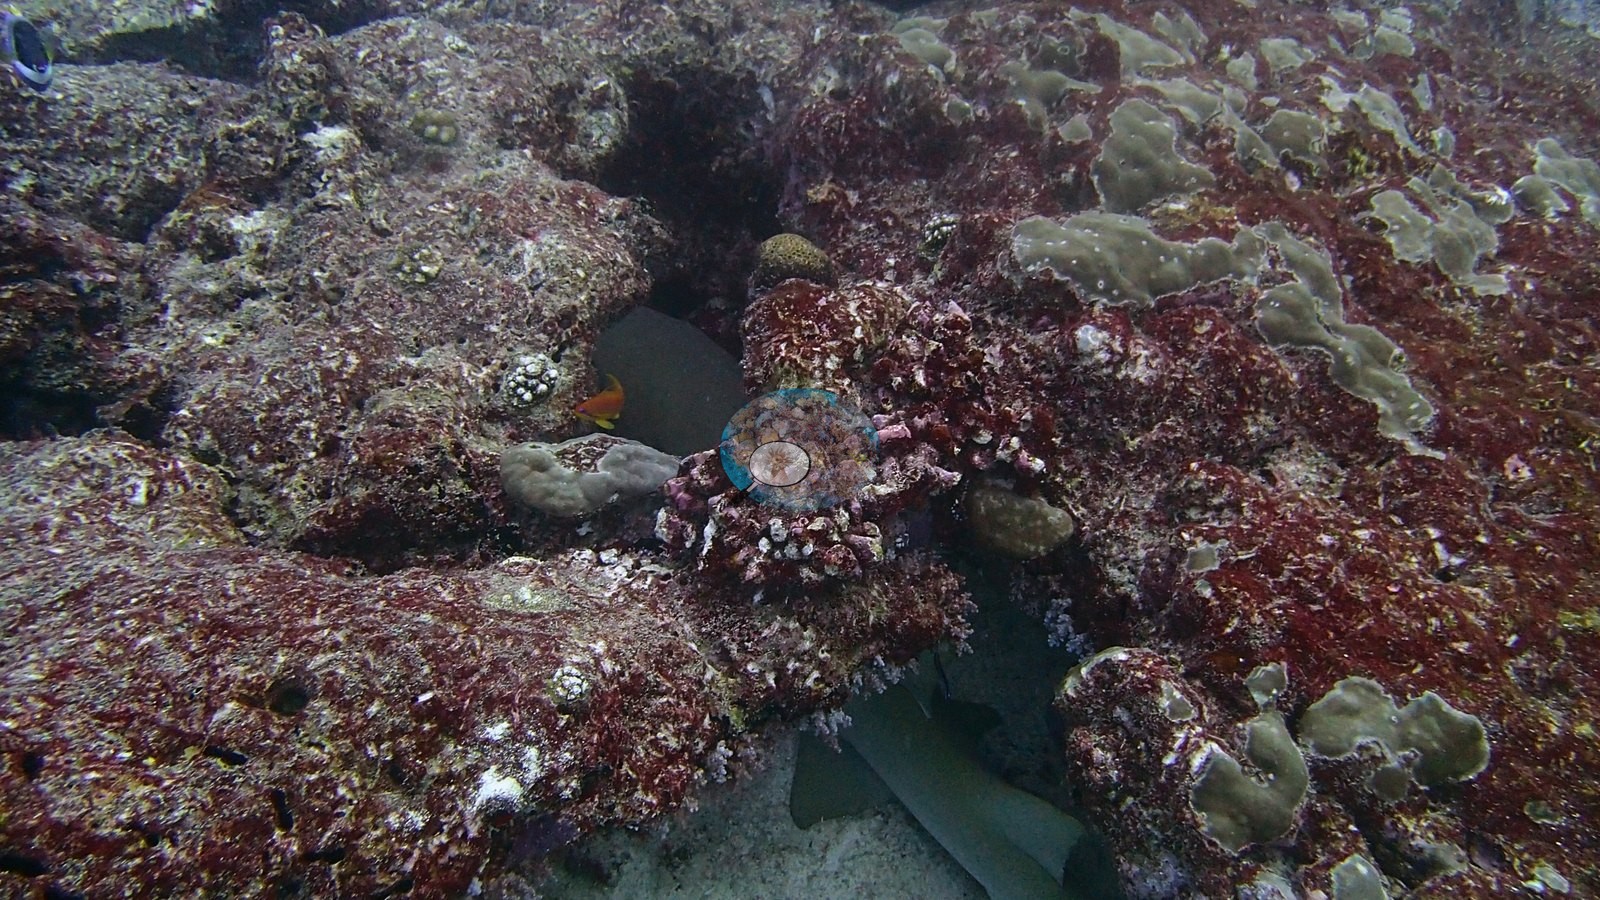
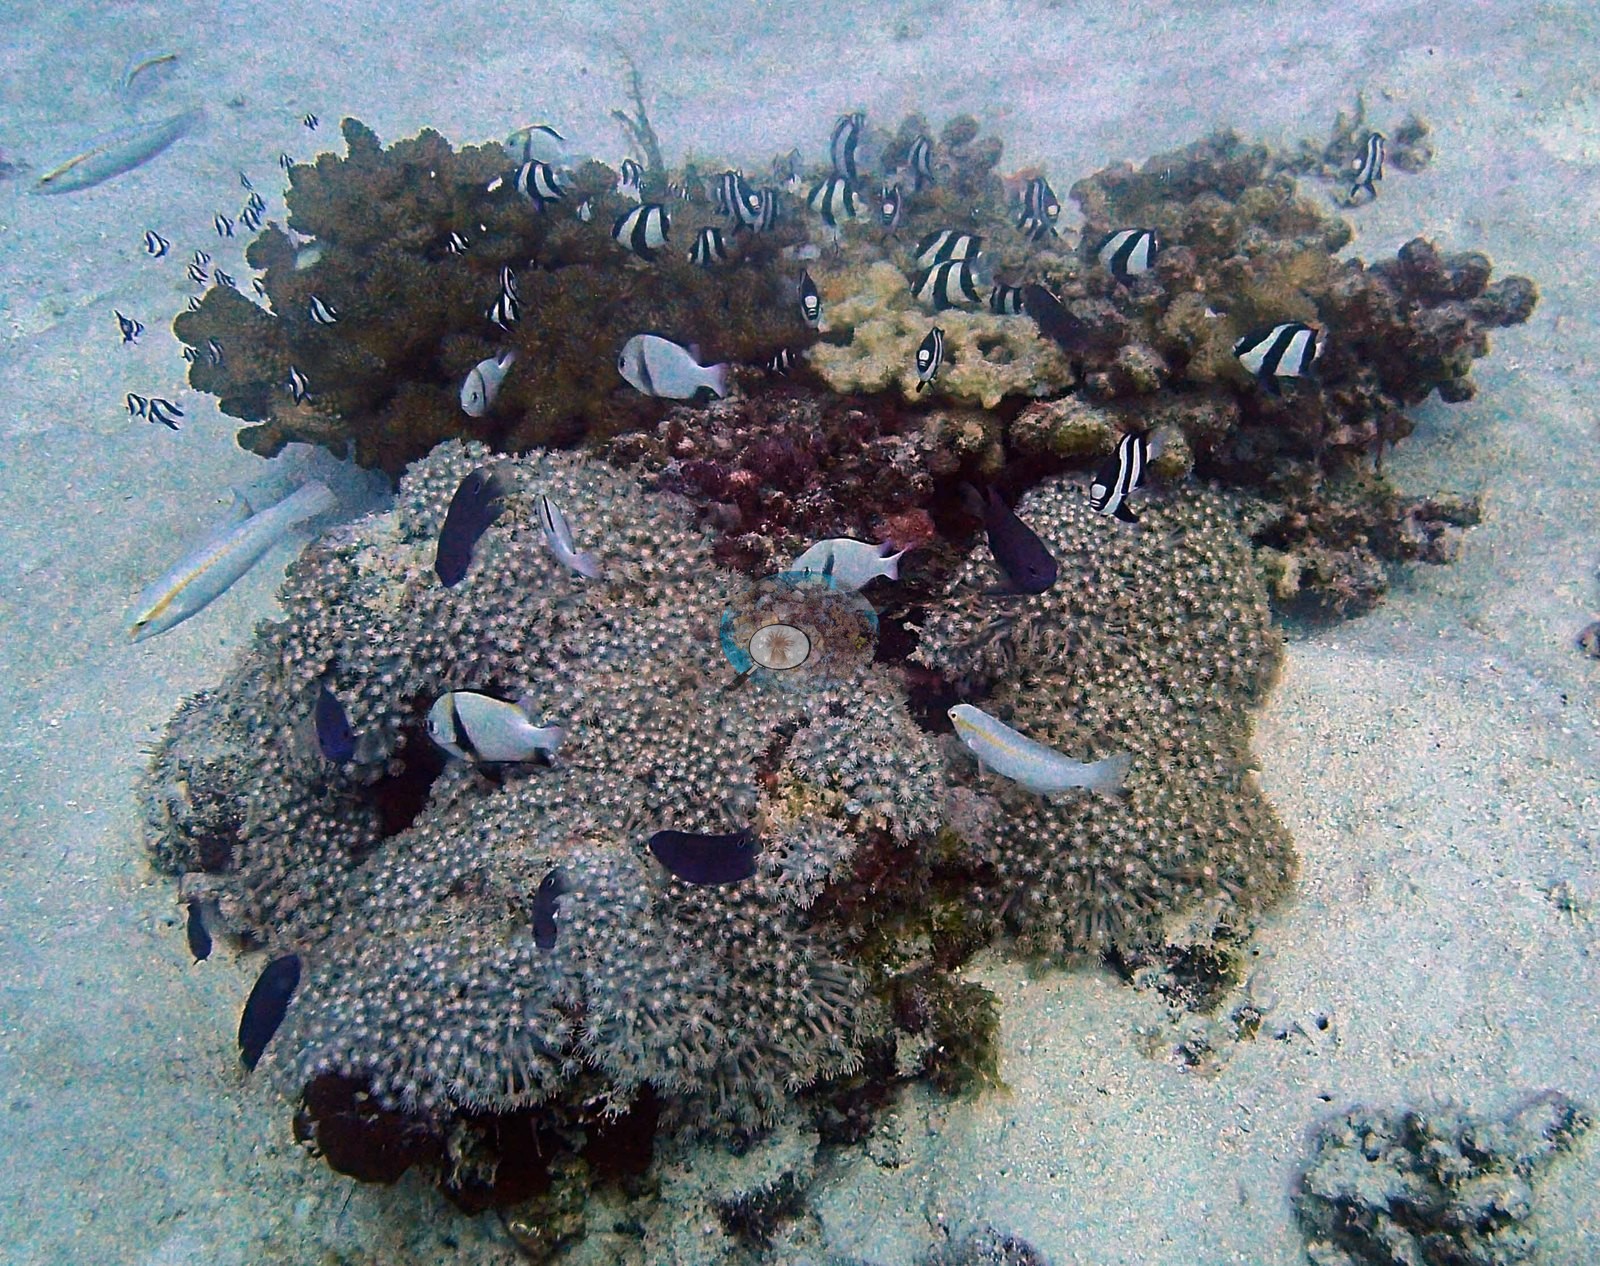
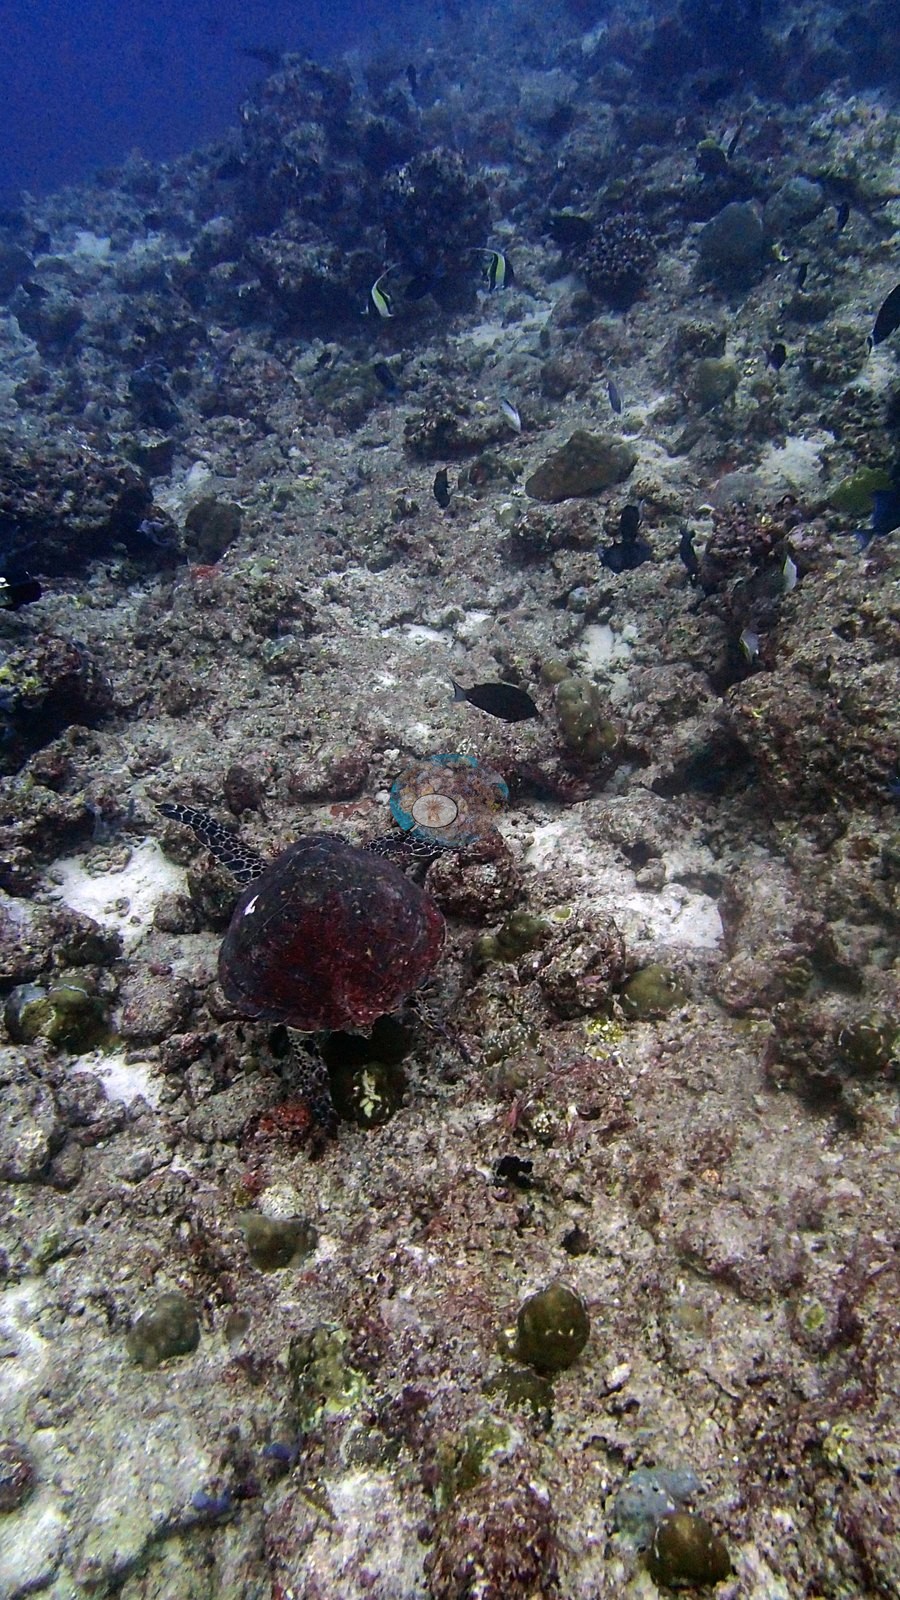
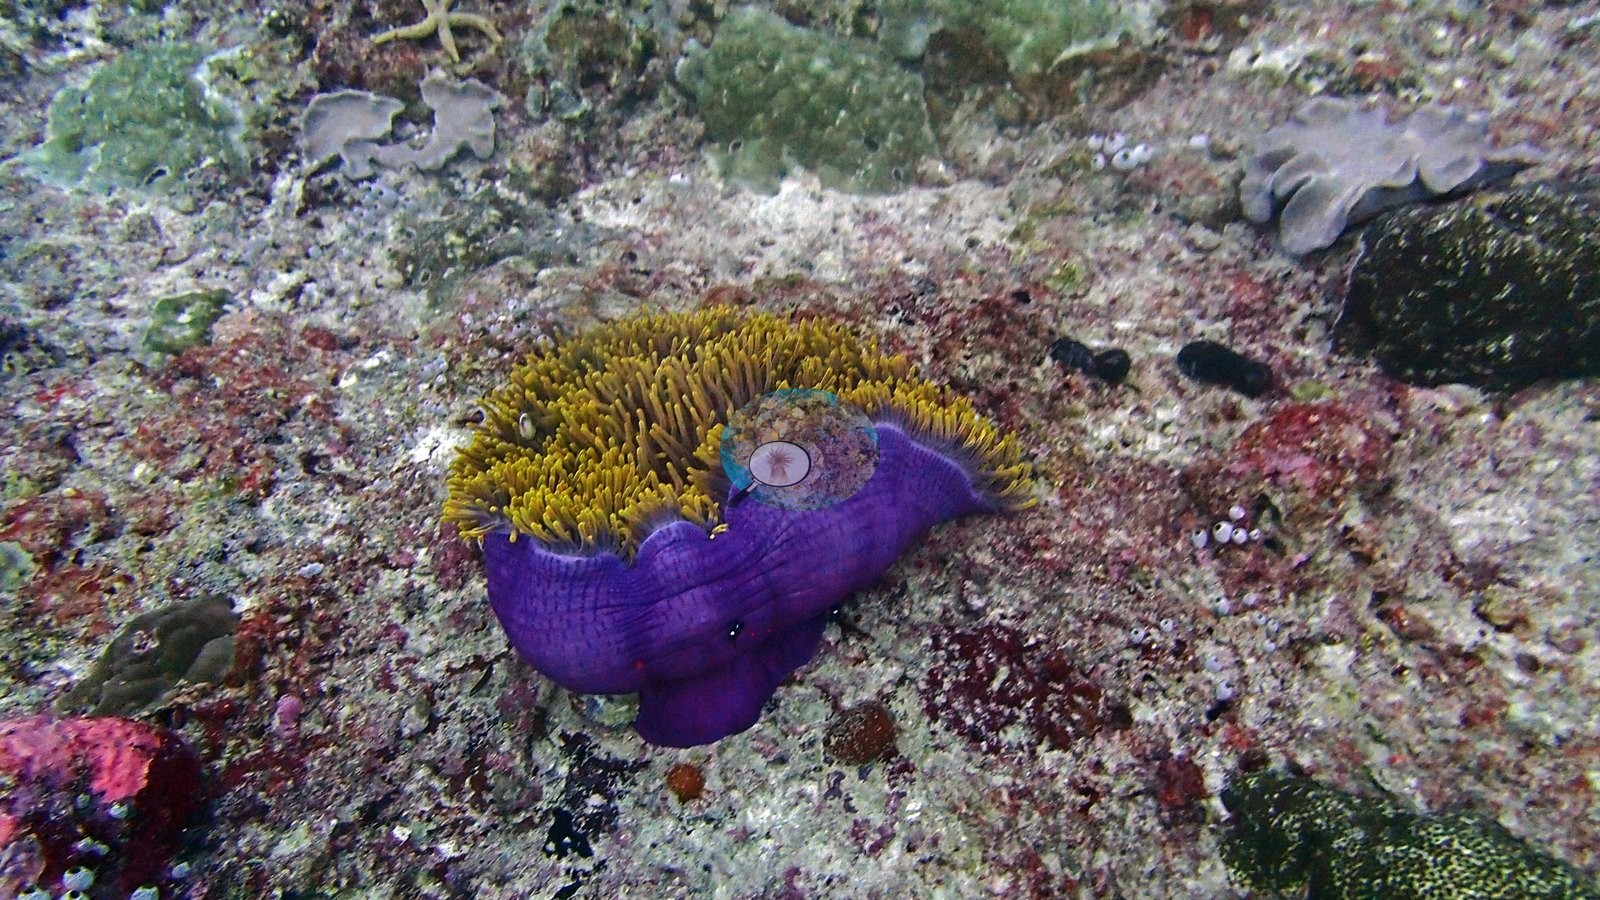
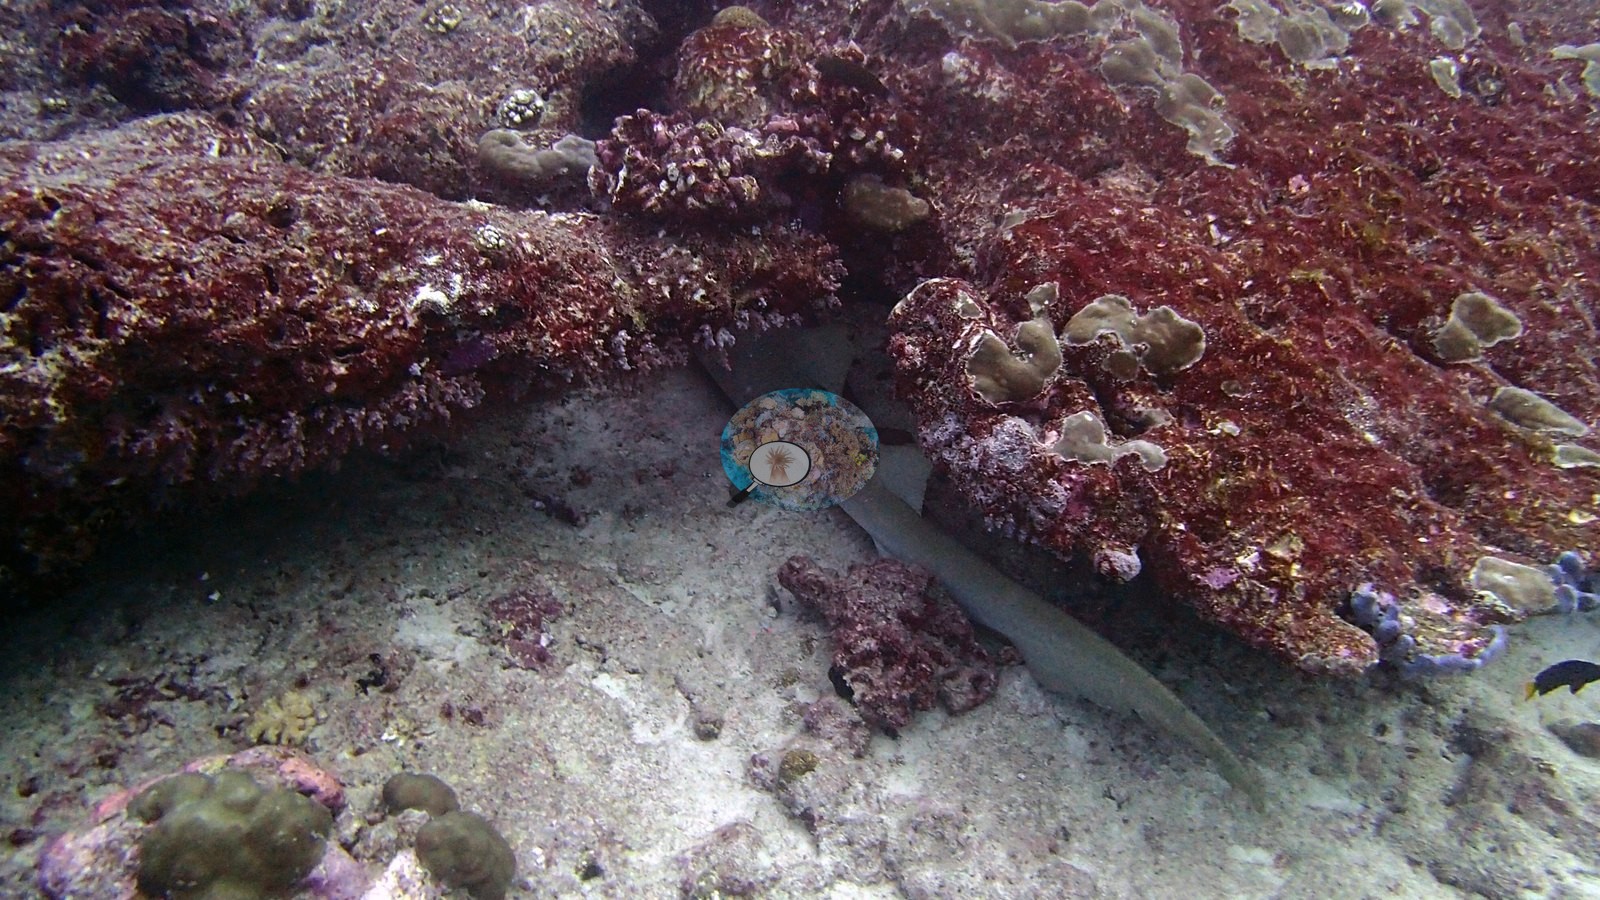
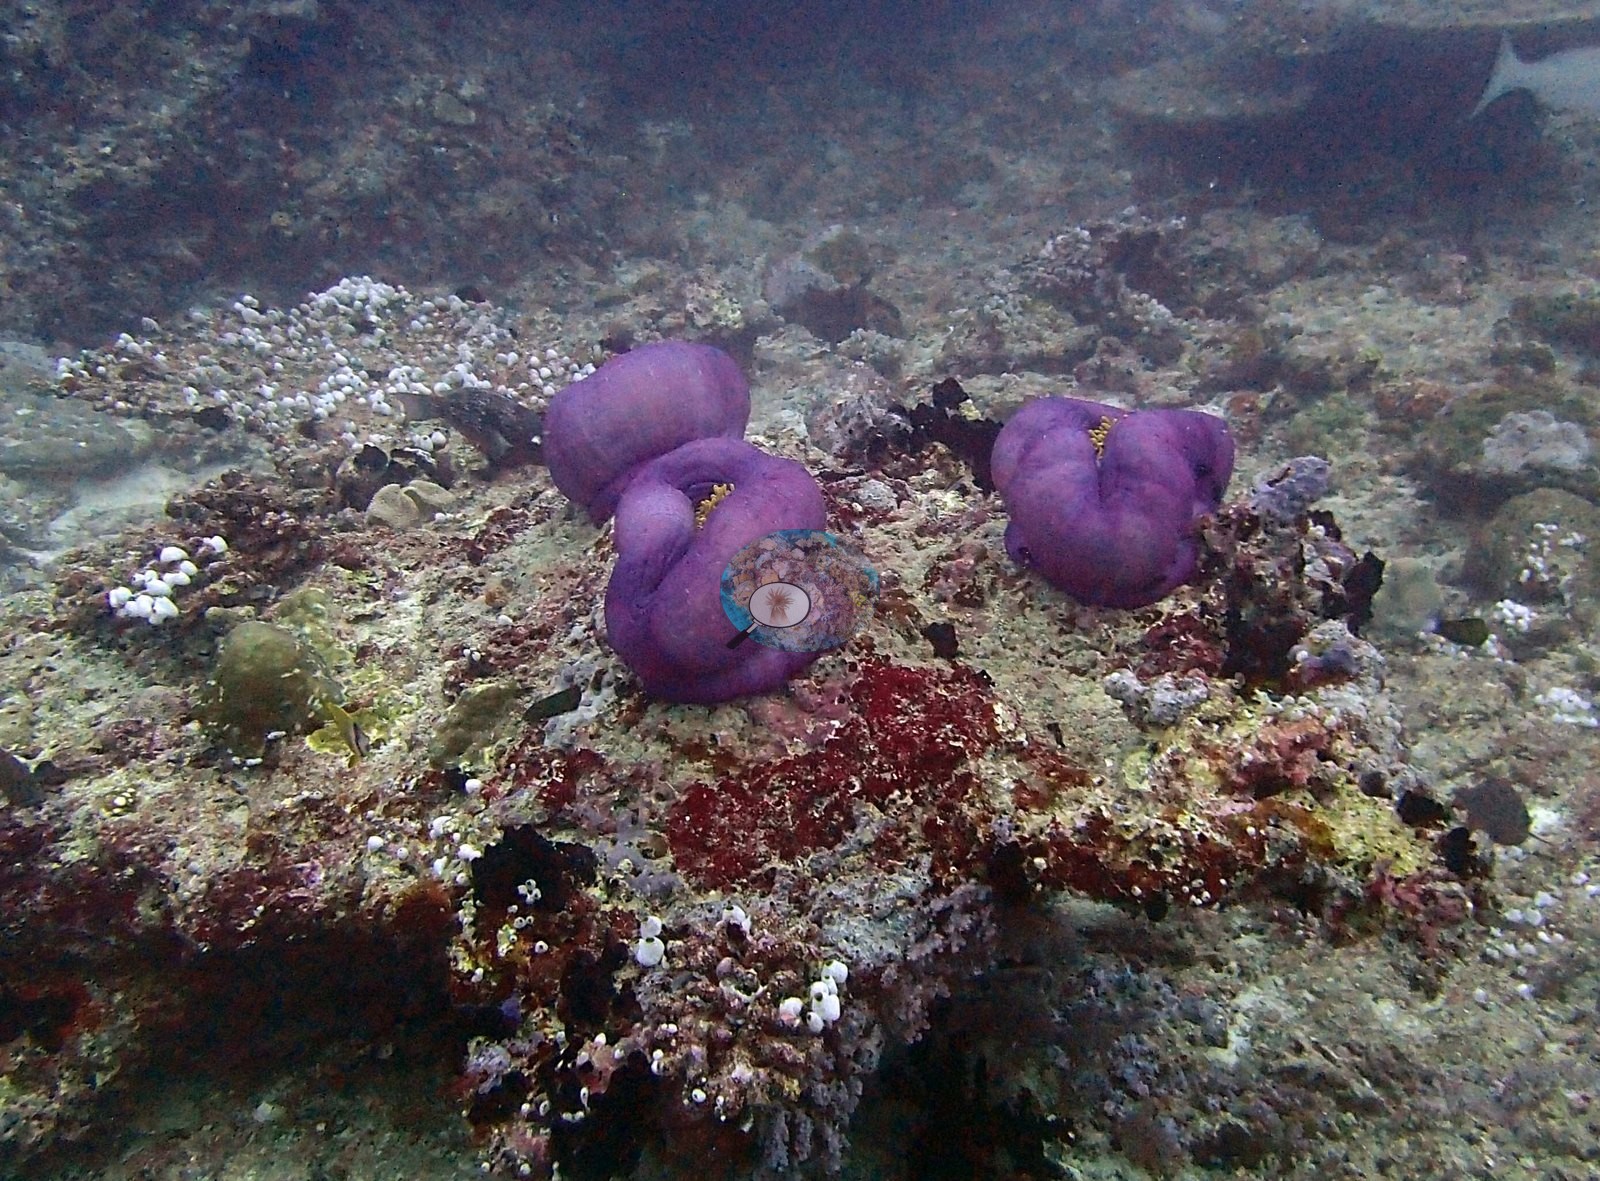
The celebrity sightings came fast: a turtle compatible with a hawksbill bulldozing across the rubble, a nurse shark jammed under a ledge, and — most photogenic of all — balled-up magnificent-type anemones scattered over the reef like giant purple satin pillows, one unfurling to flash its orange tentacles (e.g., Image 12, Image 13, Image 23, Image 24).
Comparisons with other data
No independent survey was made at this exact site; the nearest ones are listed in the table below.
CV model comparison
More info
As of September 2026 no computer-vision method estimates coral cover accurately on new images, so treat this as indicative rather than a measurement; it is revised as the methods improve.More info
The published figure is the mean of the two methods.| Method | Hard-coral cover (%) |
|---|---|
| In-house DINOv3 | 14.8 |
| CoralSCOP | 16.5 |
| Mean (± SD) | 15.7 ± 1.2 |
| Range | 14.8–16.5 |
Mean ± SD and range are across the computer-vision methods shown.
Independent surveys nearby
Within 5 km, 1 independent survey station recorded hard coral cover in 1997. The most recent nearby survey is from 1997, so these values predate recent heat stress. This site's own estimate (16%) is indistinguishable from the range of these surveys (17%): the 1.5-point gap is inside the ±7 percentage-point noise between methods; the methods differ, so the comparison is context, not a like-for-like test.
Collected by other programs using different methods (Reef Check uses point-intercept transects), so these are context for the figures above, not a like-for-like comparison. Where a station was surveyed more than once the range is shown. Station names are not dive-site names.
| Agency | Site / location | Date | Hard coral cover (%) | Distance | Link |
|---|---|---|---|---|---|
| Reef Check | Hembadhoo Hohola | 1997 | 17% (2 surveys) | 3.21 km | — |
Data & links
All images from Coral Reef Diagnostics. Data are from Coral Reef Diagnostics and the organizations named in the data-sources table above.
© Coral Reef Diagnostics.