
Maldives - Kurumba Faru (checkout dive)

Part of the regional summaries: Maldives - Central (Male Atolls / Ari / Vaavu) and Maldives
More info
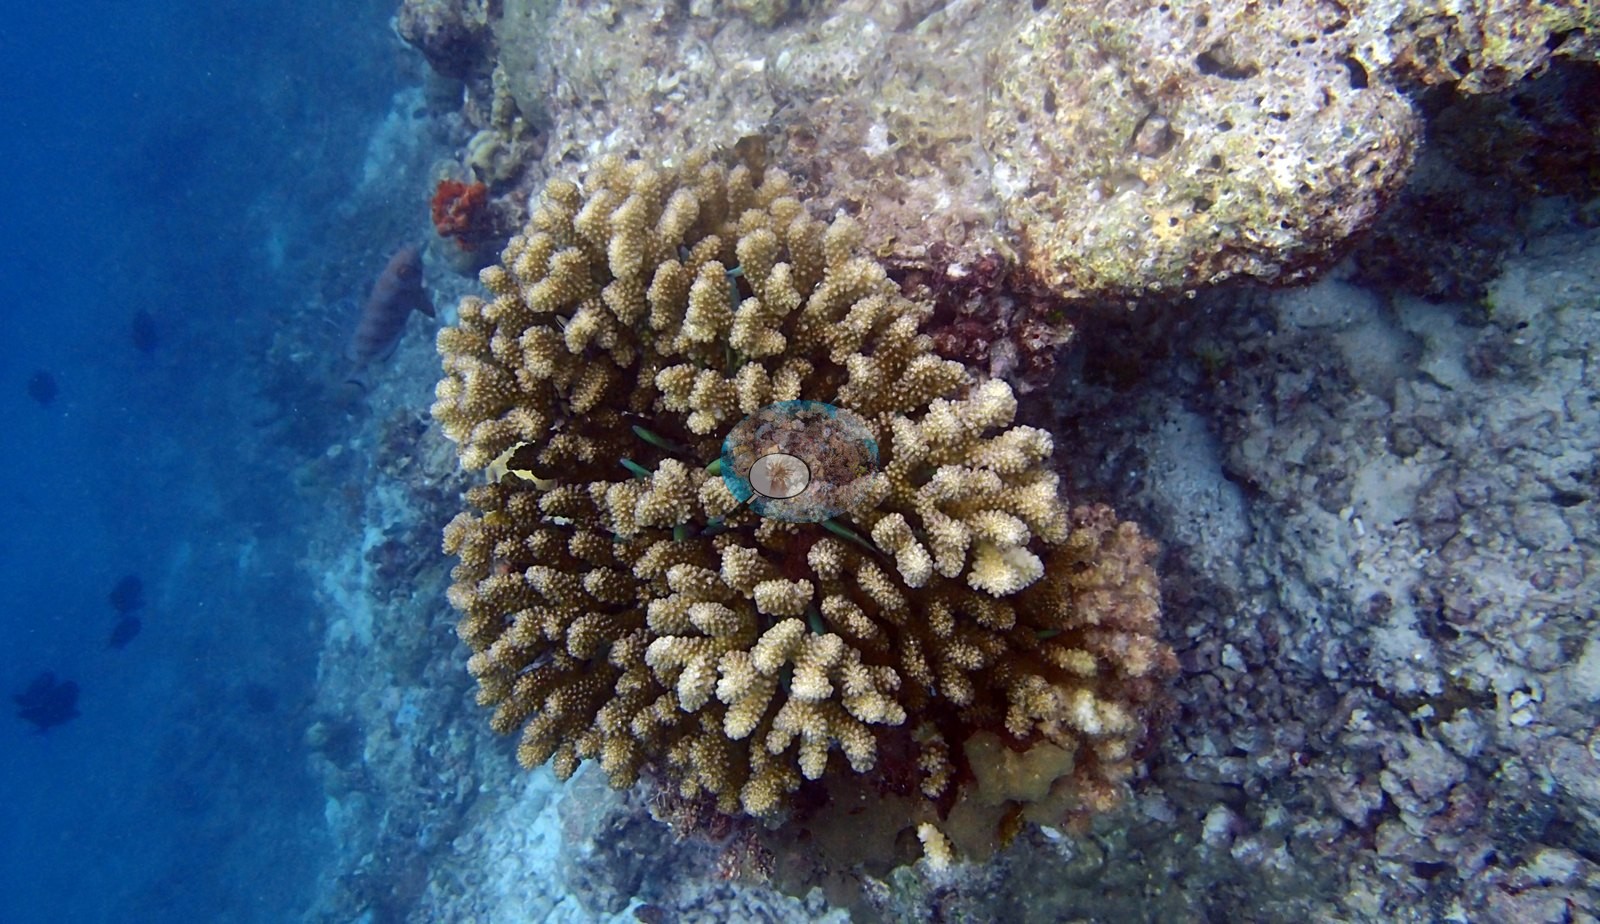
Maldives (NOAA CRW virtual station)A shallow warm-up dive that packed in the trip's first sea turtle and first crown-of-thorns starfish within half an hour, over a slope of dead coral framework, turf, and macroalgae alongside mustard cauliflower corals.
ފުން ނުވާ، ތައްޔާރުވުމުގެ ފީނުމެކެވެ (checkout dive). ދަތުރުގެ ފުރަތަމަ ވެލާއާއި ފުރަތަމަ crown-of-thorns ސްޓާފިޝް މި ފީނުމުގެ ފުރަތަމަ ބައިގަޑިއިރުގެ ތެރޭގައި ފެނުނެވެ. މި ފީނުނީ މަރުވެފައިވާ ހިރިގާގެ ފްރޭމްވޯކް، ޓާފް (turf)، އަދި macroalgae ހުރި، ފުންވަމުން ދާ ބިމެއްގެ މަތިންނެވެ. އެތަނުގައި ހުރުދާ ކުލައިގެ ކޮލީފްލާވަރ ހިރިގާ ވެސް ހުރެއެވެ.
AI translation of this summary; the English is authoritative. (low confidence)
Six independent survey stations shown with the program’s logo — click one to see how far it is from this site.
One other CRD dive site with its own page within 5 km shown in orange — click a marker to open its page.
6 of the 9 photographs on this page are shown beside the text that discusses them under "Site description" below.
Site description
Setting
The first splash of the liveaboard, a late-afternoon warm-up on a shallow, rubble-strewn slope — and the reef wasted no time introducing its cast.
General benthic features
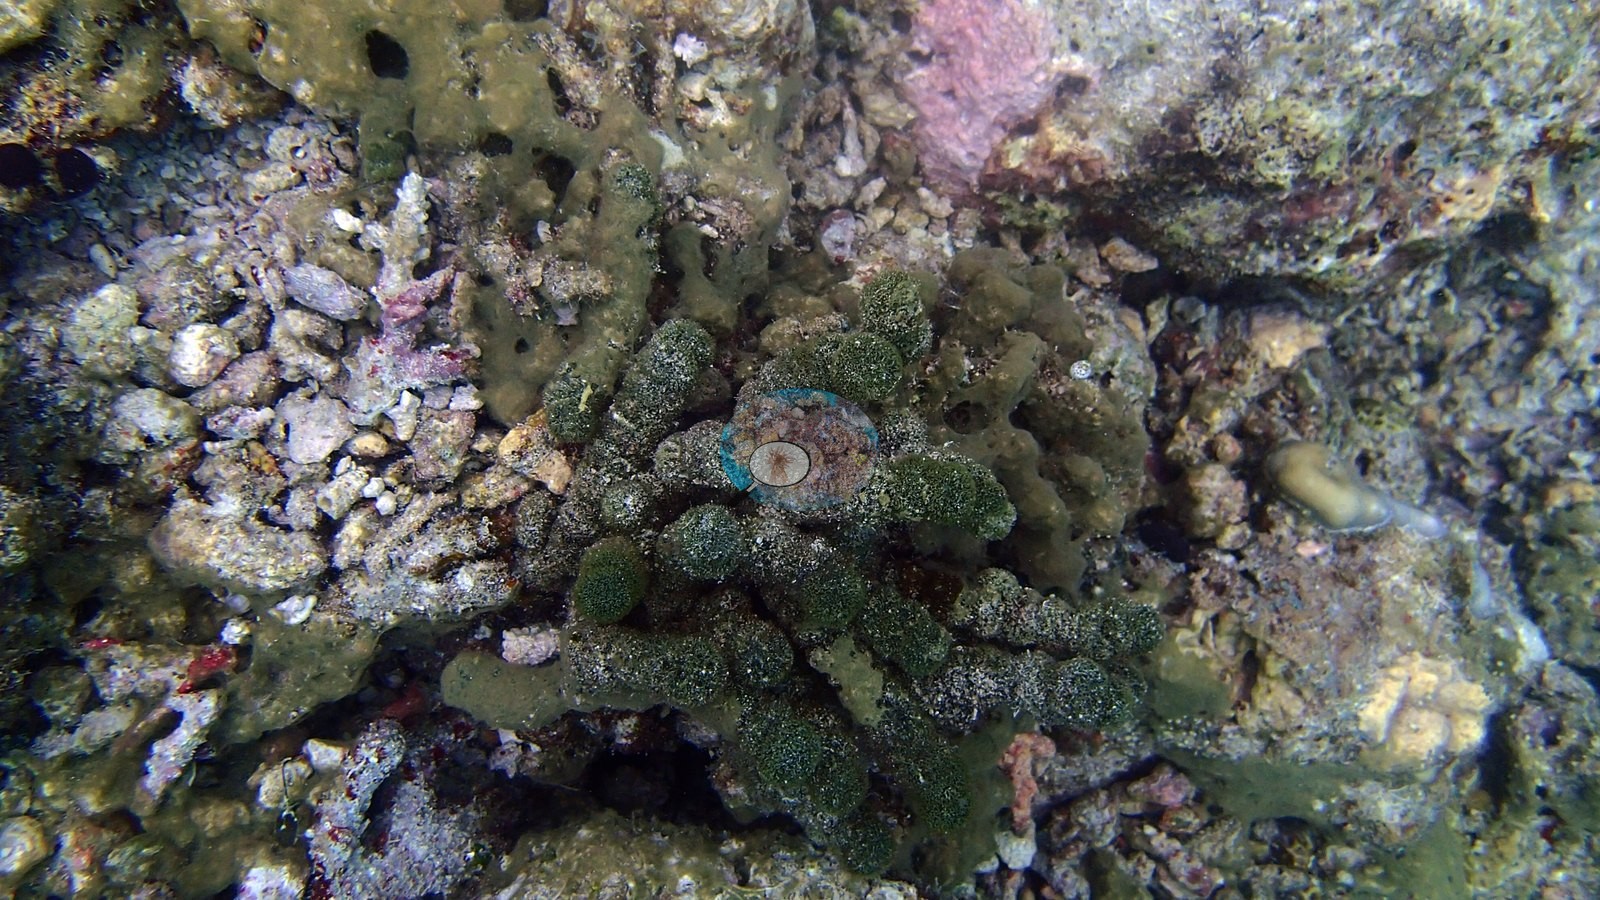
Mustard-brown cauliflower corals compatible with Pocillopora stood out vividly against a substrate of dead framework dusted with turf, pink coralline crusts, and clumps of dark green macroalgae (e.g., Image 1, Image 6).
Coral cover
- Coral cover: too few images to estimate it — only 9 usable reef photographs were scored, fewer than the 10 the photo rule needs; the photographs are still shown on this page.
Stressors
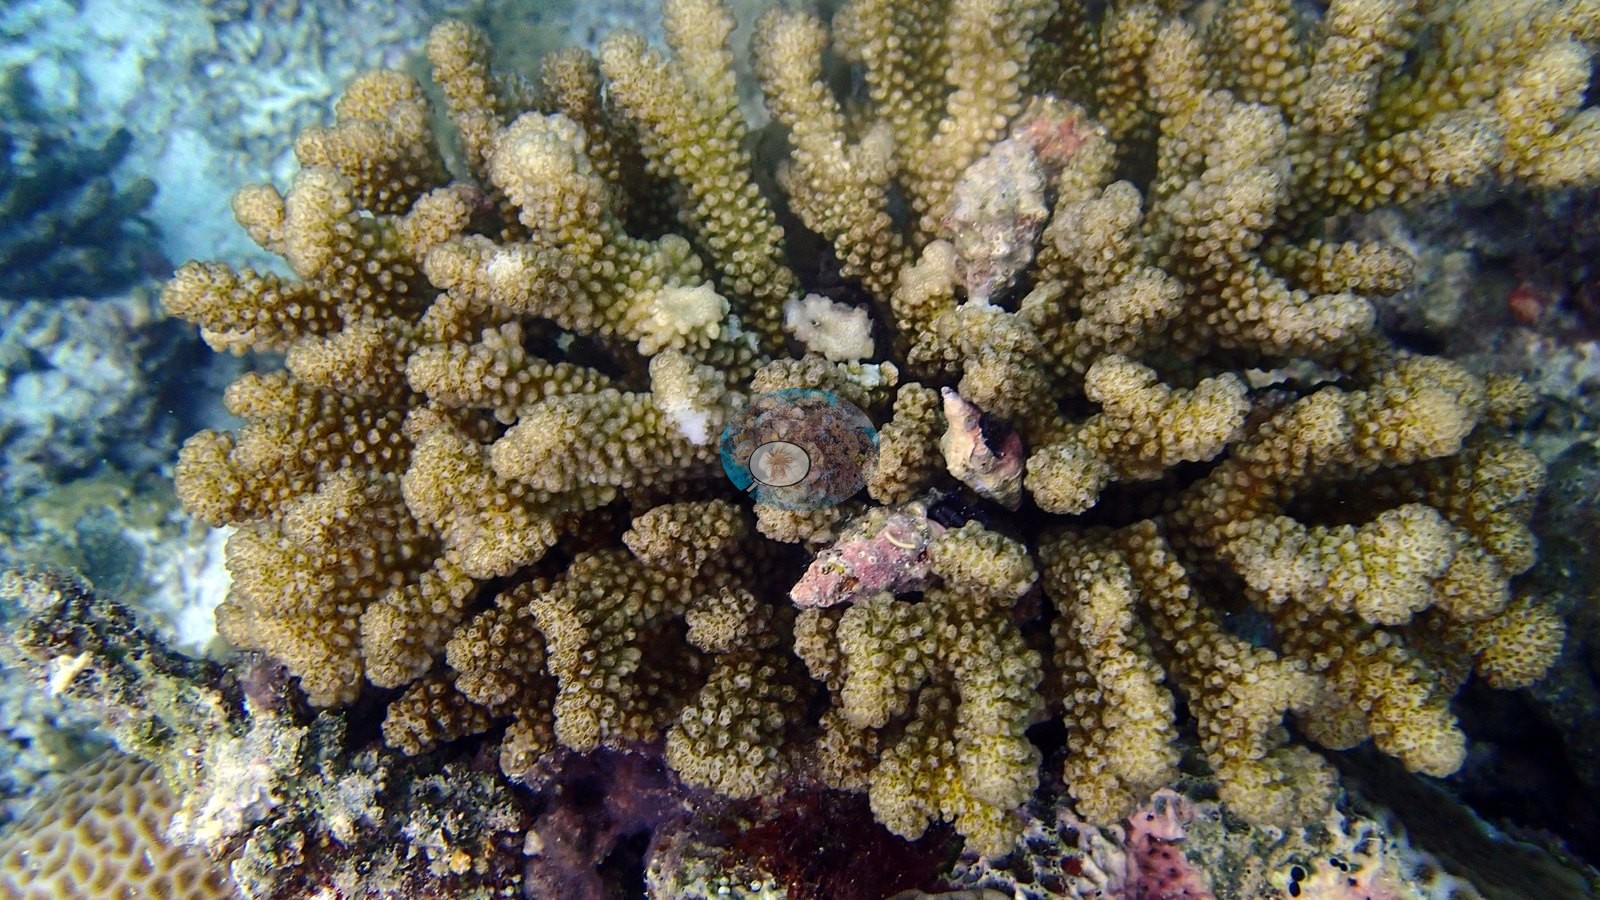
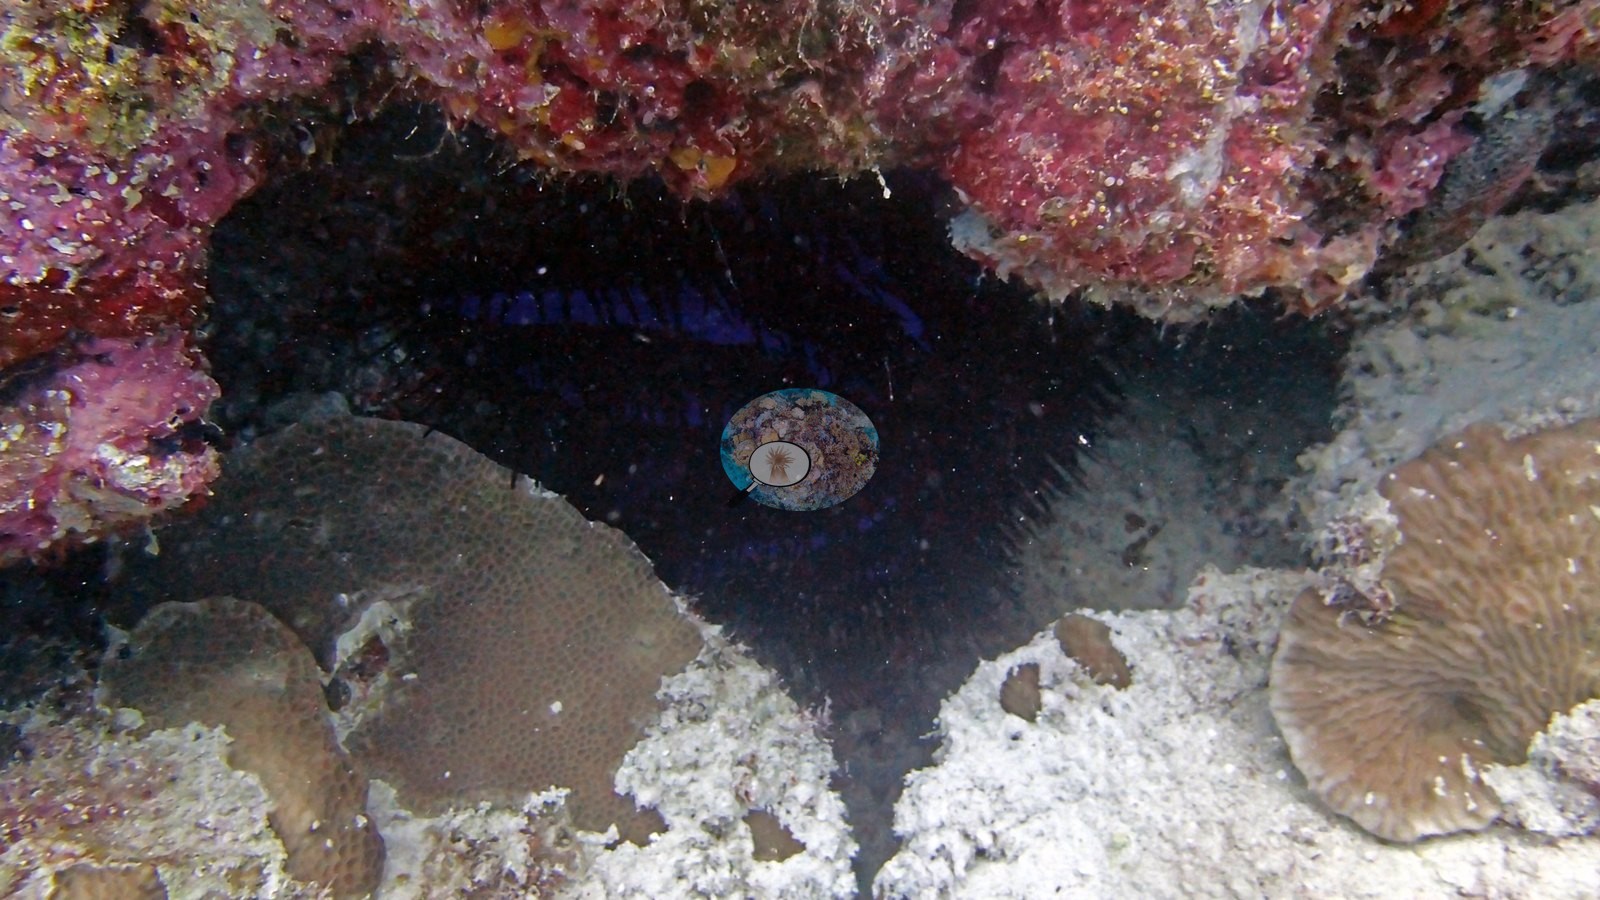
Directly below that first crown-of-thorns seastar, a plating colony shows a band of fresh white skeleton against its brown tissue, the pattern of a recent feeding scar (e.g., Image 4).
Fish and other fauna
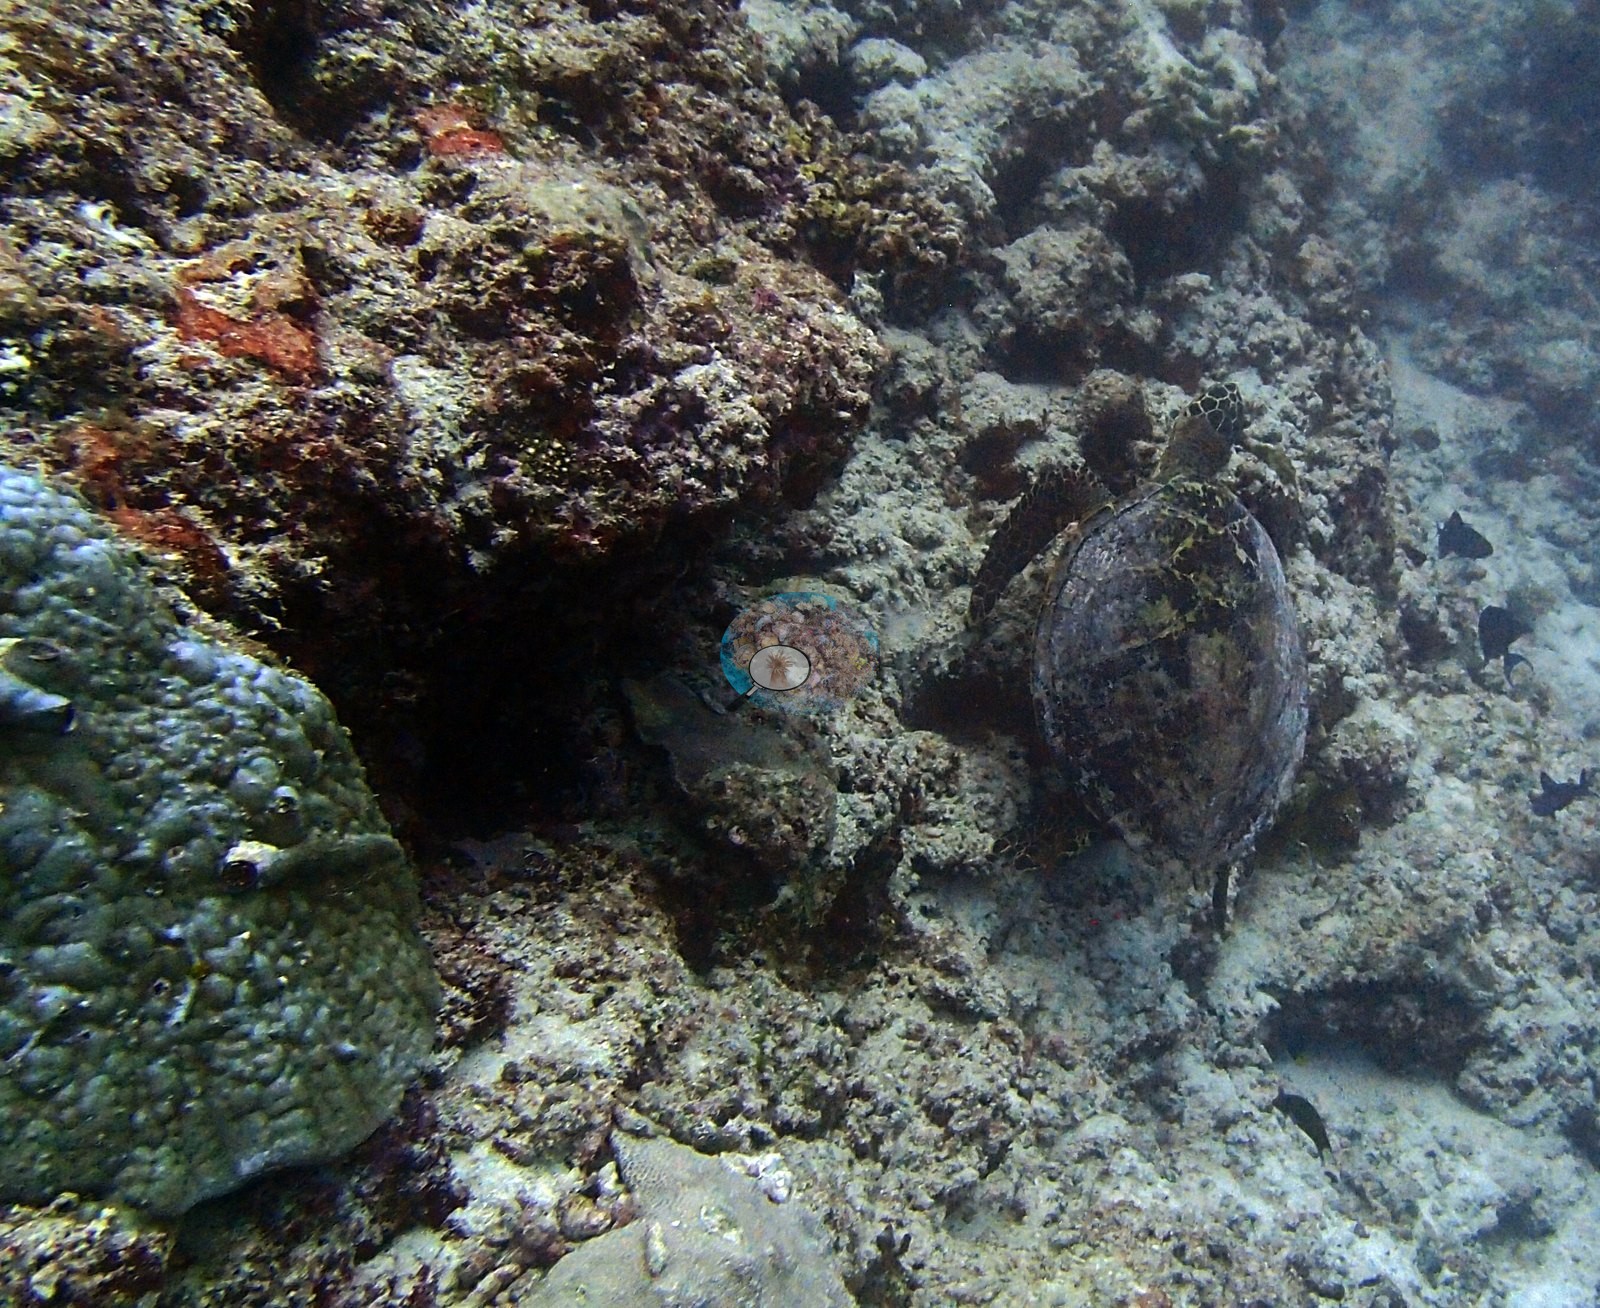
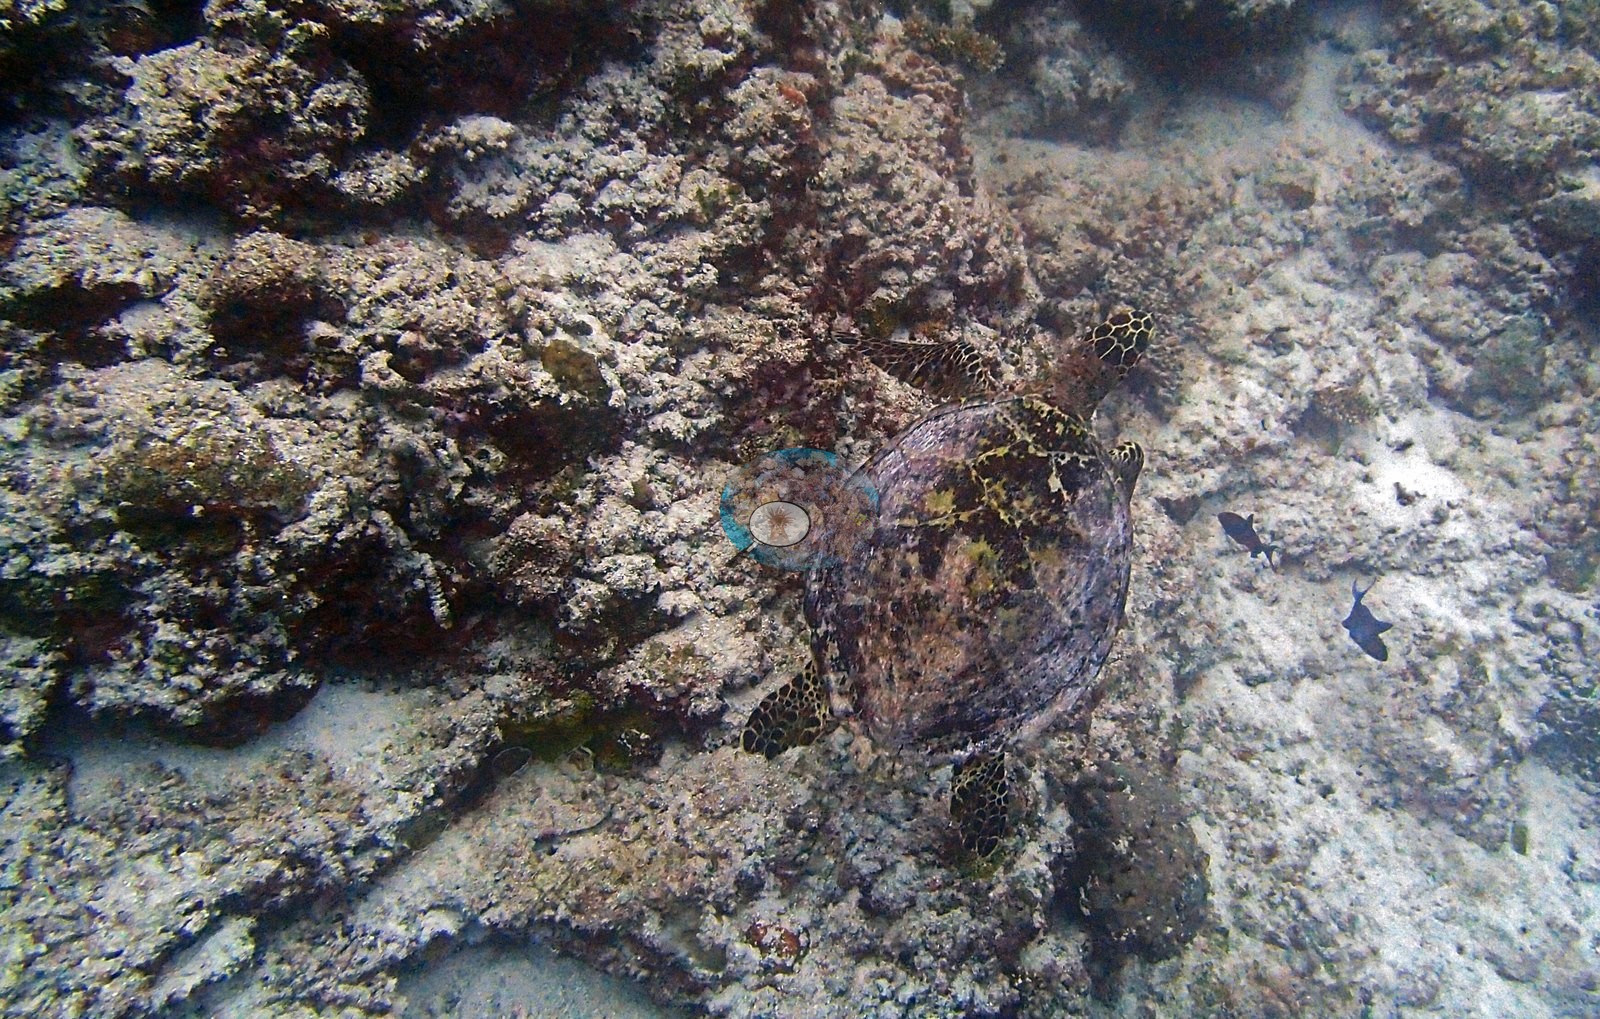
Frames from the first half hour show the trip's first sea turtle, hunkered flat on the bottom among the rubble, and its first crown-of-thorns seastar, jammed under a ledge with only a bristle of dark spines betraying it (e.g., Image 9, Image 4).
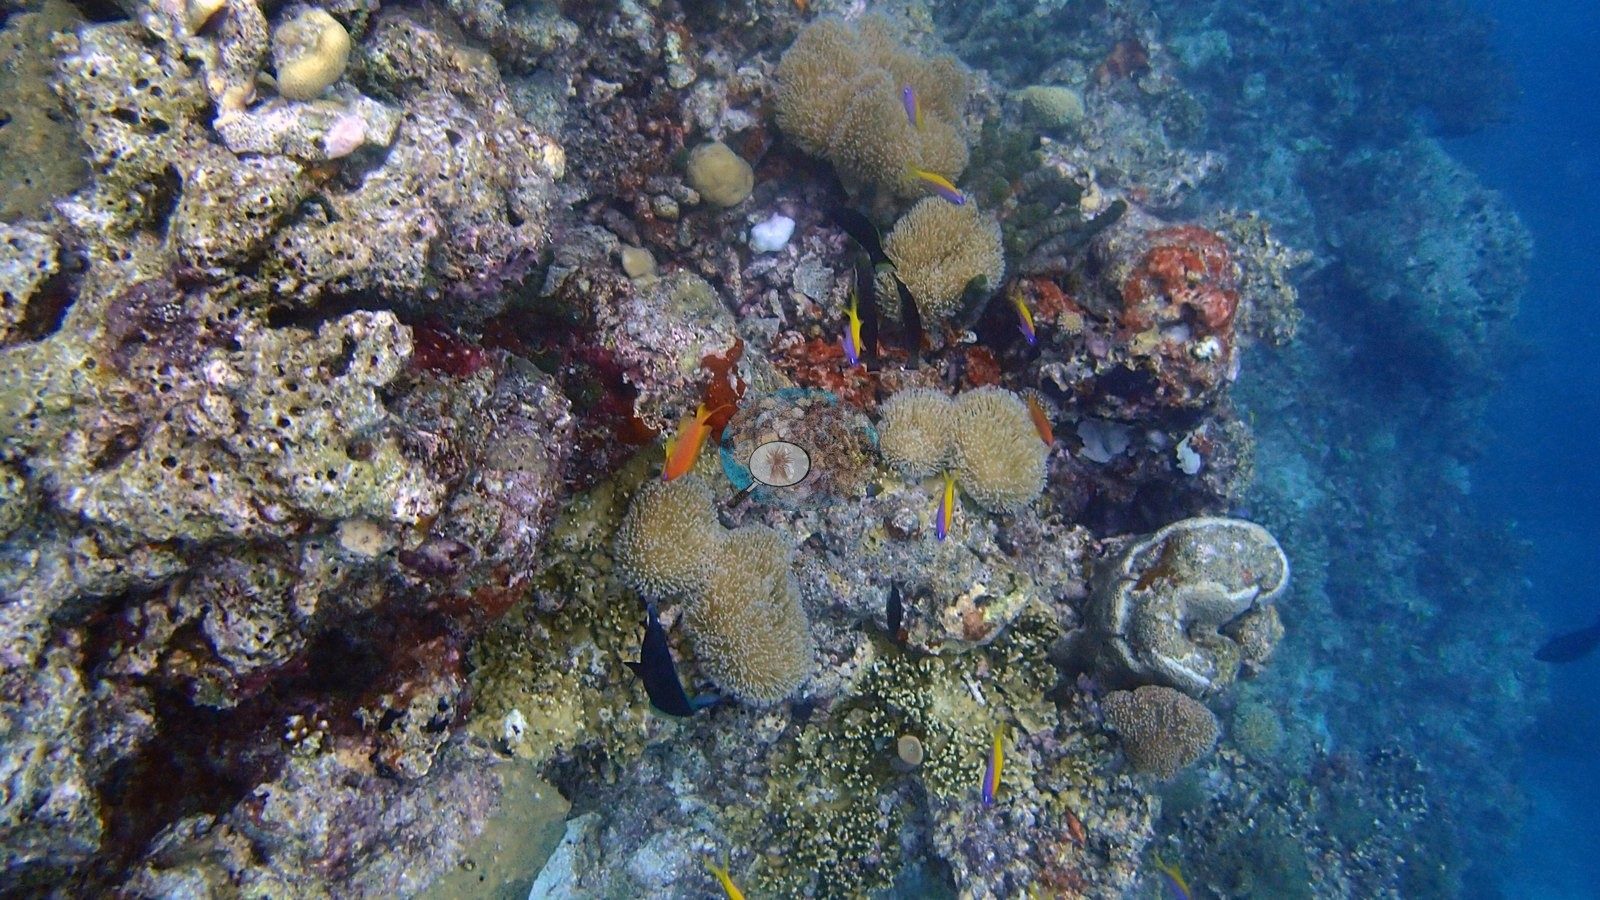
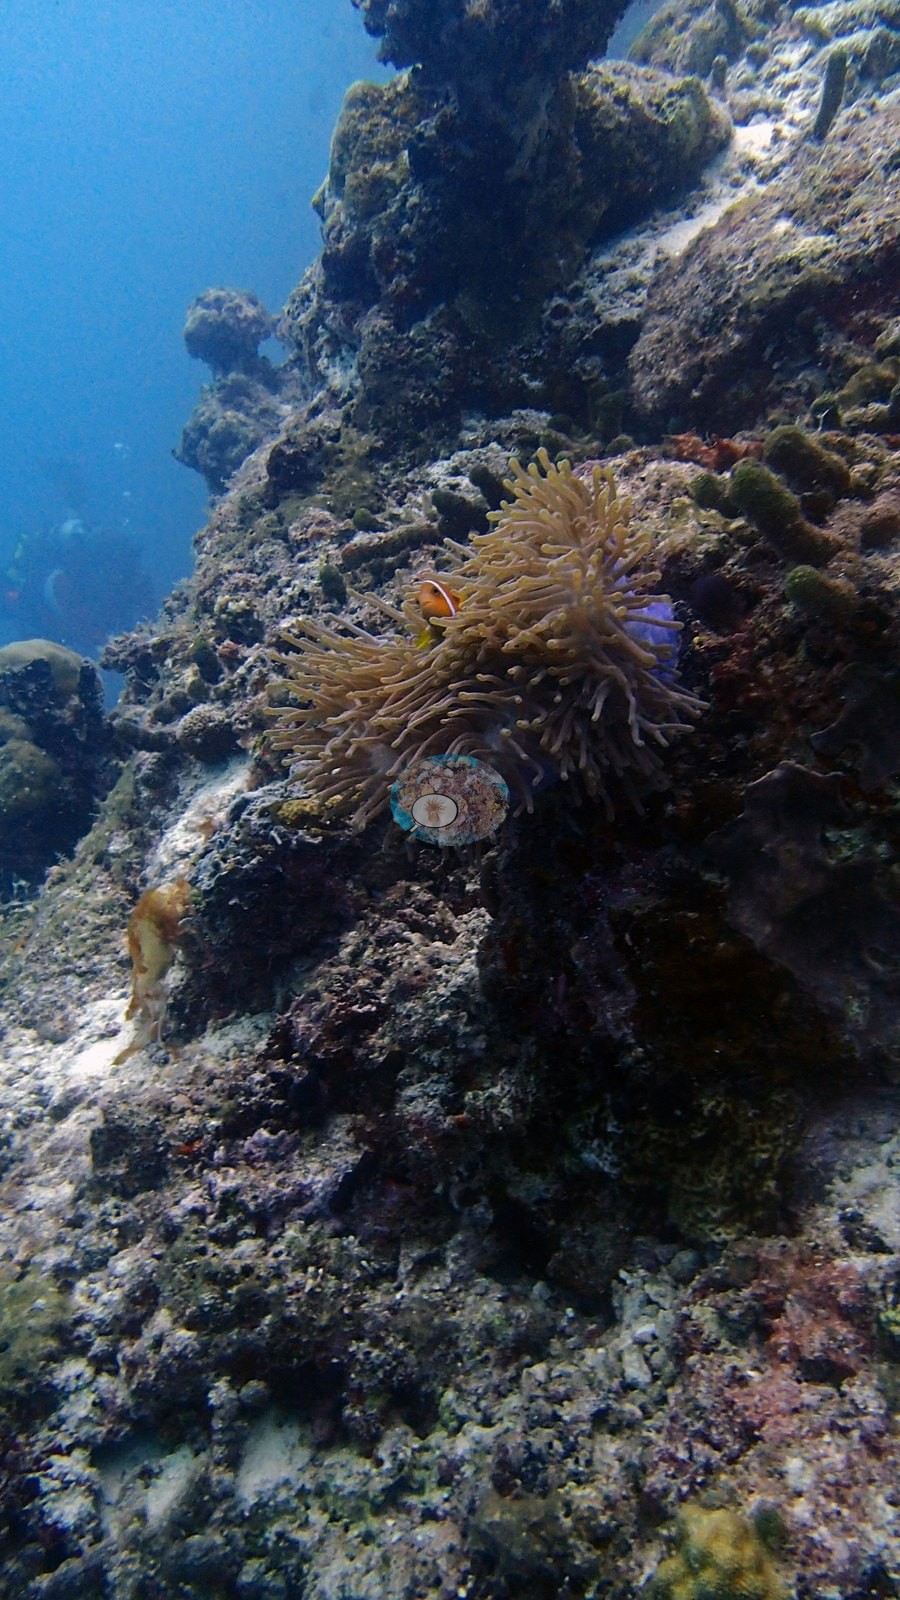
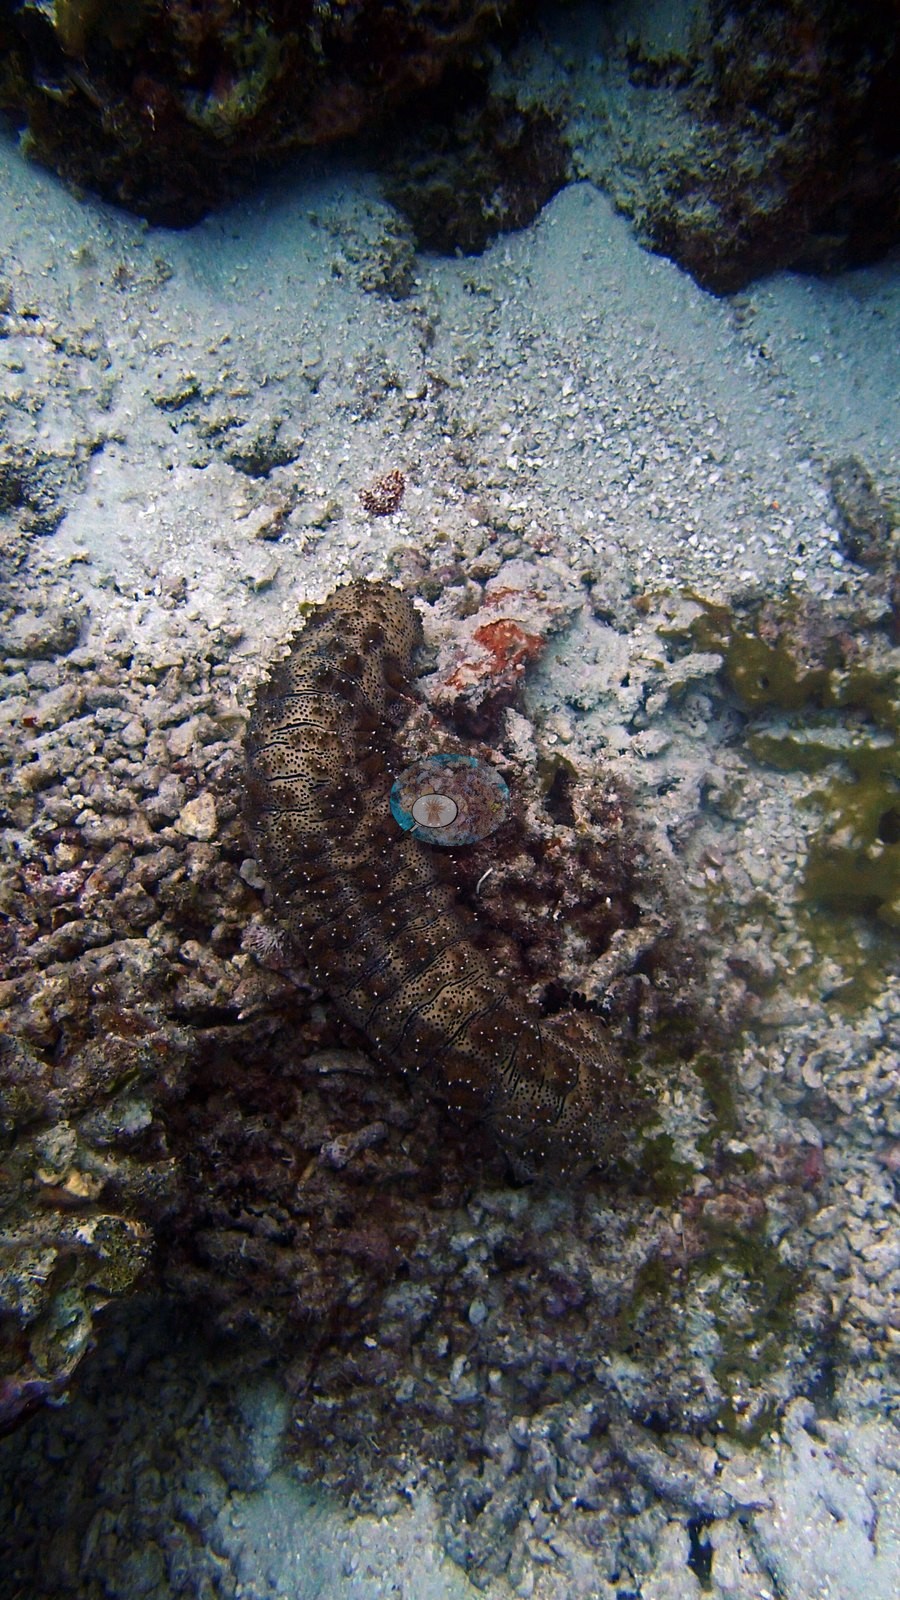
A big anemone flexing on the upper slope and a sea cucumber sprawled across a sand channel rounded out a checkout dive that doubled as a preview of everything to come (e.g., Image 2, Image 3).
Comparisons with other data
The XL Catlin Seaview Survey covered a nearby station (transect 37001) in 2015 and 2017, about 0.55 km from the pin; we could not confirm that it is the same reef. Within 5 km, six independent stations recorded station-year means of 1.8–41% hard coral cover between 2010 and 2019; the nearest, XL Catlin Seaview Survey at transect 37001, 0.54 km away, read 1.8% in 2017.
Coral cover score card
This site is listed in a stand-alone coral cover score card.
Independent surveys nearby
| Agency / program | Year(s) | Stations / distance | Link |
|---|---|---|---|
| Montefalcone et al. (2020) | 2015–2019 | 2 stations, 2.28–2.59 km | Records ↓ |
| Reef Check | 2010–2019 | 3 stations, 2.29–2.72 km | Records ↓ |
| XL Catlin Seaview Survey | 2015–2017 | 1 station, 0.54 km | Records ↓ |
Within 5 km, 6 independent survey stations recorded hard coral cover in 12 records between 2010 and 2019. Of the 3 stations surveyed in more than one year, 2 were scored by divers or by people annotating photographs: 2 declined (by 21–26 points) between their first and latest surveys. The other 1 was scored by automated image analysis: declined by 12 points, more than the 7-point method-noise floor. The longest record, Banana Reef (Montefalcone et al. 2020, 2.28 km away), went from 40% in 2015 to 19% in 2019. The most recent nearby survey is from 2019, so these values predate recent heat stress.
Collected by other programs using different methods (Reef Check uses point-intercept transects; the XL Catlin Seaview Survey uses photo-transects with automated image annotation), so these are context for the figures above, not a like-for-like comparison. Where a station was surveyed more than once, the cell shows either the range of its values or, as a single value, the mean of surveys made in one year. Station names are not dive-site names.
| Agency | Site / location | Date | Hard coral cover (%) | Distance | Link |
|---|---|---|---|---|---|
| Reef Check | Banana Reef | 2010 | 33% | 2.29 km | — |
| Reef Check | Banana Reef | 2014 | 16% | 2.72 km | — |
| XL Catlin Seaview Survey | transect 37001 | 2015–2017 | 1.8–14% (2 surveys) | 0.54 km | doi:10.14264/uql.2019.930 |
| Montefalcone et al. (2020) | Banana Reef | 2015–2019 | 12–40% (range of yearly means; 4 records) | 2.28 km | doi:10.3389/fmars.2020.00587 |
| Montefalcone et al. (2020) | Hulumale Beyru | 2015–2016 | 15–41% (range of yearly means; 2 records) | 2.59 km | doi:10.3389/fmars.2020.00587 |
| Reef Check | Kuda Banana Reef | 2019 | 7.2%, mean of 2 surveys (5 m and 10 m) | 2.32 km | — |
Data & links
All images from Coral Reef Diagnostics. Data are from Coral Reef Diagnostics and the organizations named in the data sources above.
© Coral Reef Diagnostics.
References
- Montefalcone M, Morri C, Bianchi CN (2020). Influence of Local Pressures on Maldivian Coral Reef Resilience Following Repeated Bleaching Events, and Recovery Perspectives. Frontiers in Marine Science 7:587. PDF
- Gonzalez-Rivero M, et al. (2019). Seaview Survey photo-quadrat and image classification dataset. The University of Queensland (UQ eSpace) data collection. DOI