
Maldives - Moofushi Kandu

Part of the regional summaries: Maldives - Central (Male Atolls / Ari / Vaavu) and Maldives
More info
Maldives (NOAA CRW virtual station) · Maldives ecoregion mean=2.9°C-heating weeksA dawn channel dive dominated by a staggering school of bluestripe snapper and patrolling reef sharks over an austere, current-scoured seabed of rubble and algae-dusted coral skeletons. Coral cover is modest, computer vision estimating 10.9-20.8%, averaging 16%.
Seven independent survey stations shown with the program’s logo — click one to see how far it is from this site.
18 of these 34 photographs are shown beside the text that discusses them under "Site description" below.
Site description
Setting
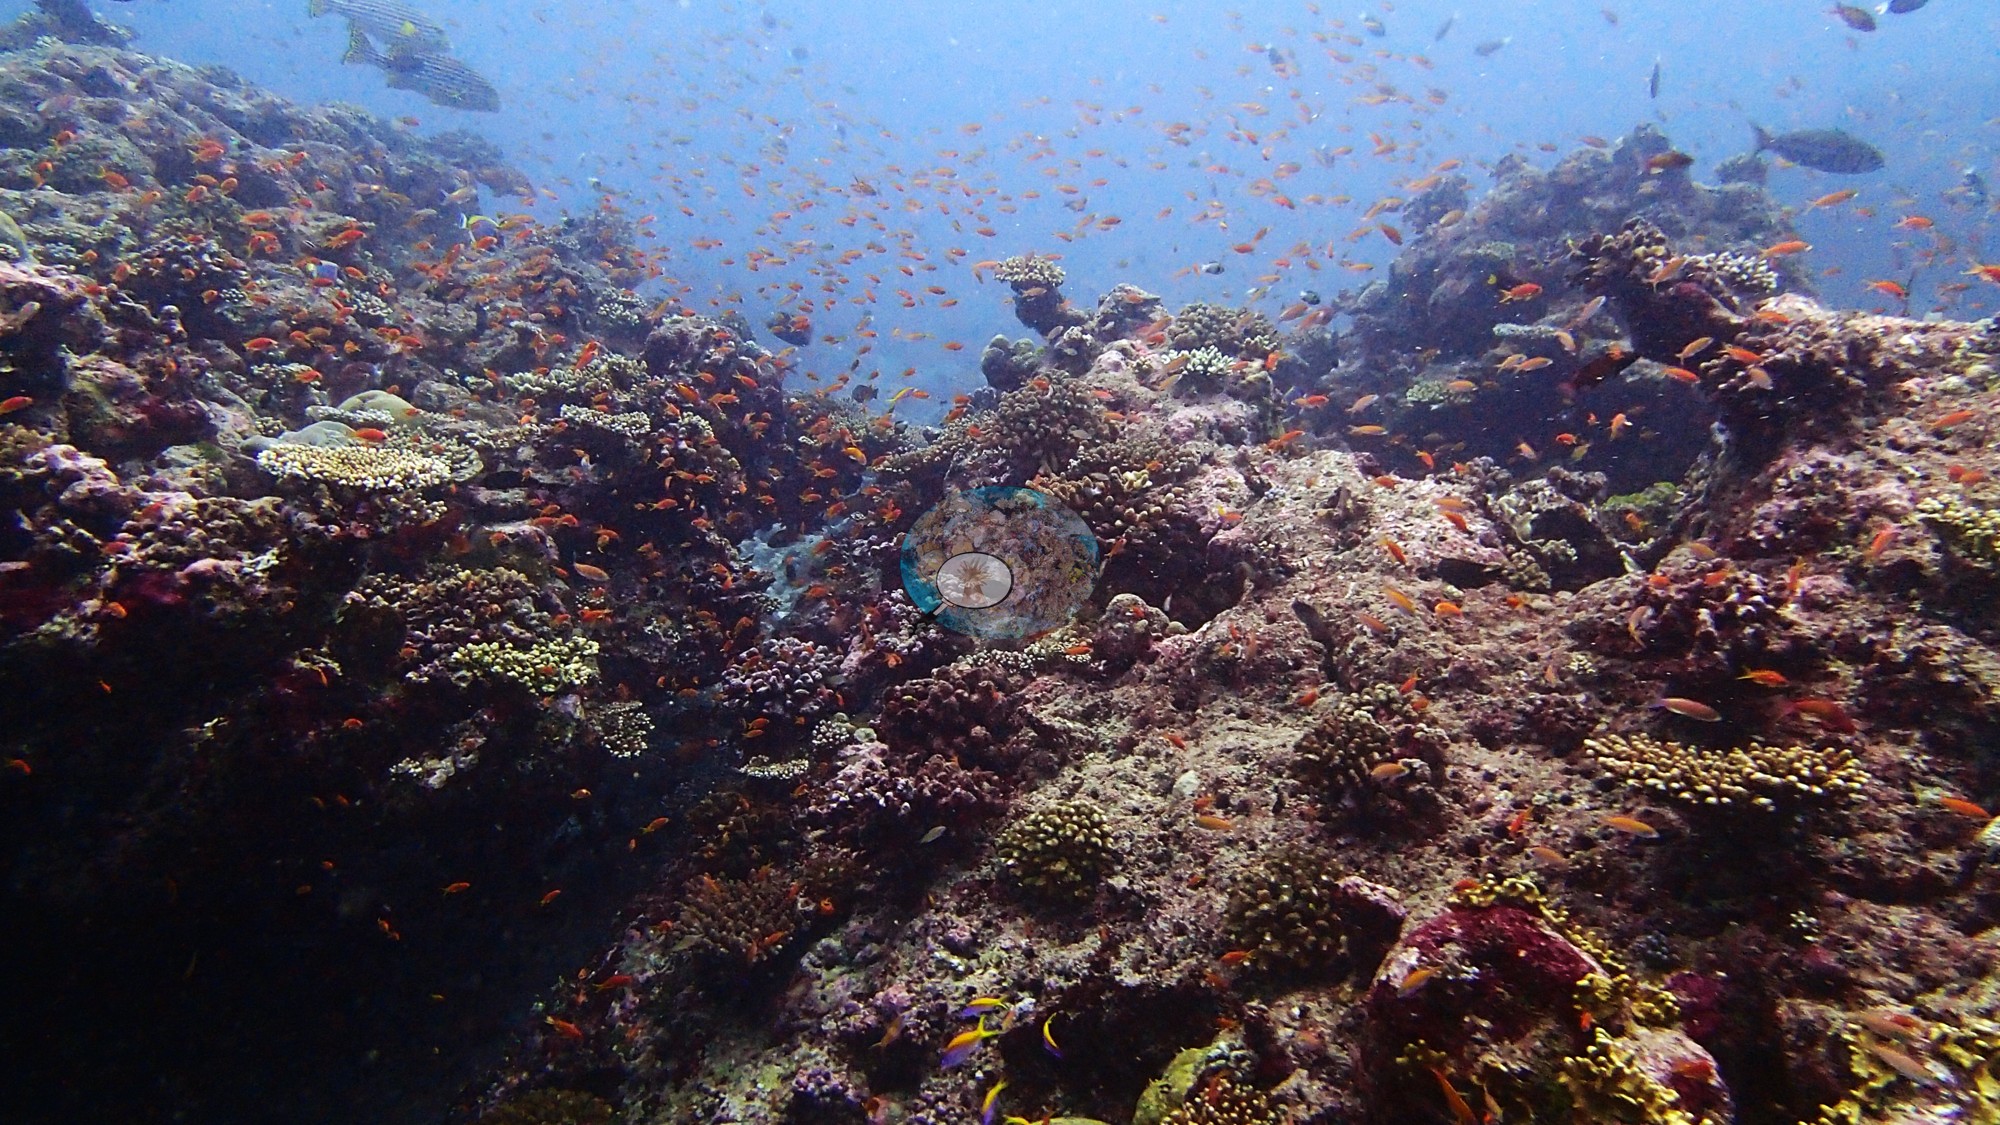
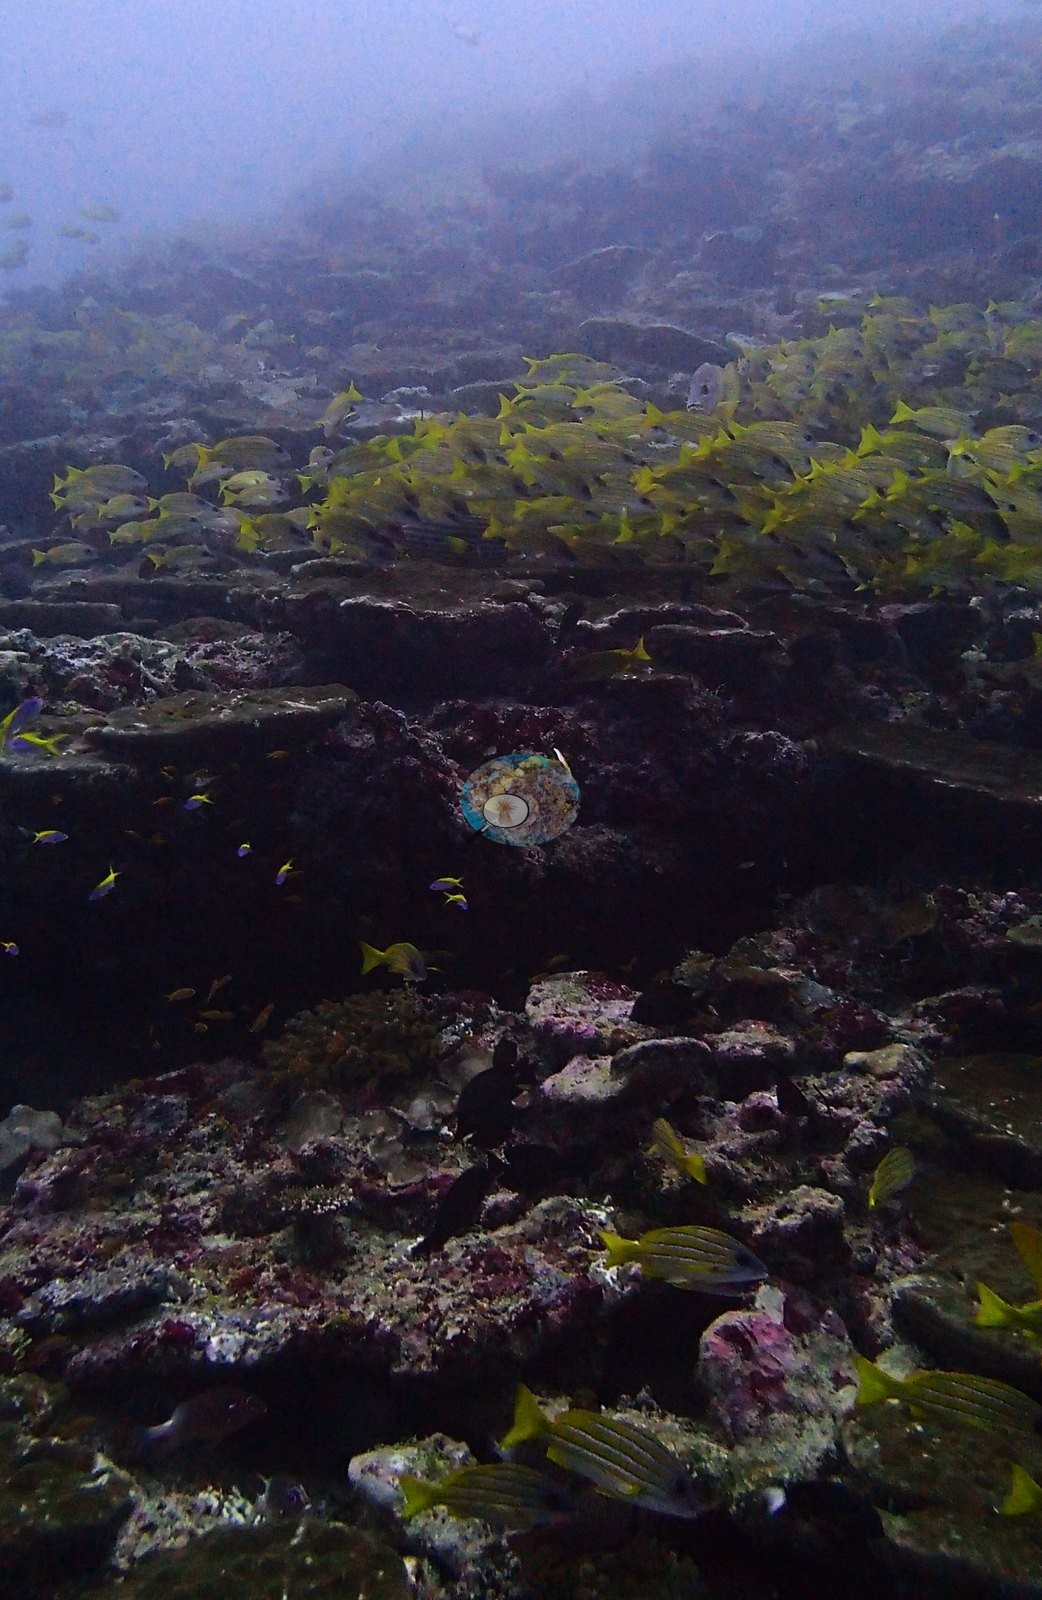
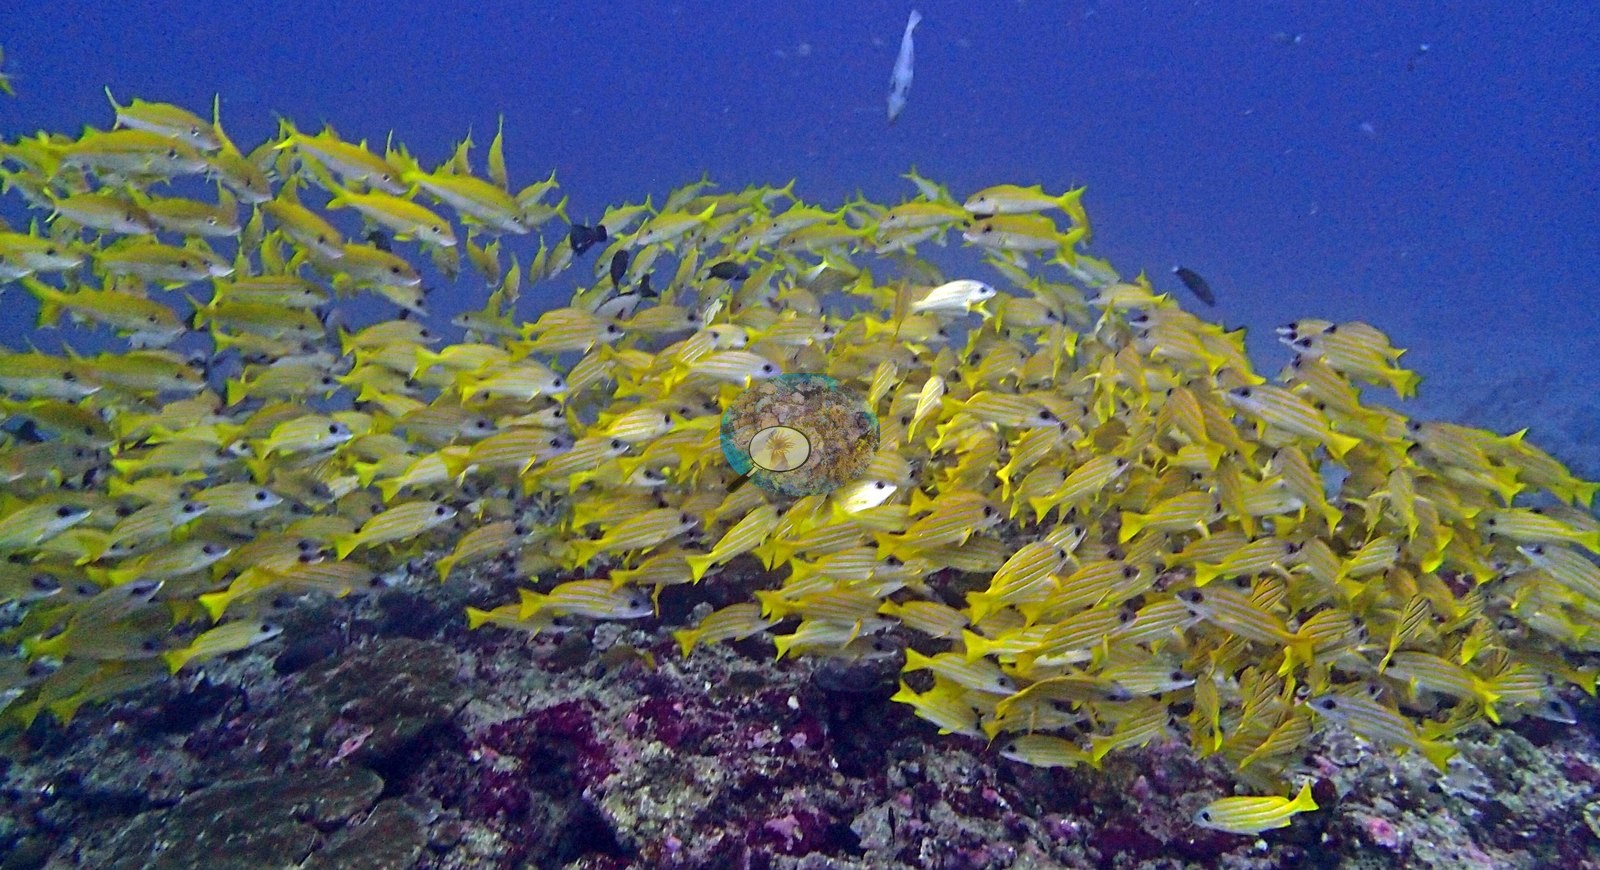
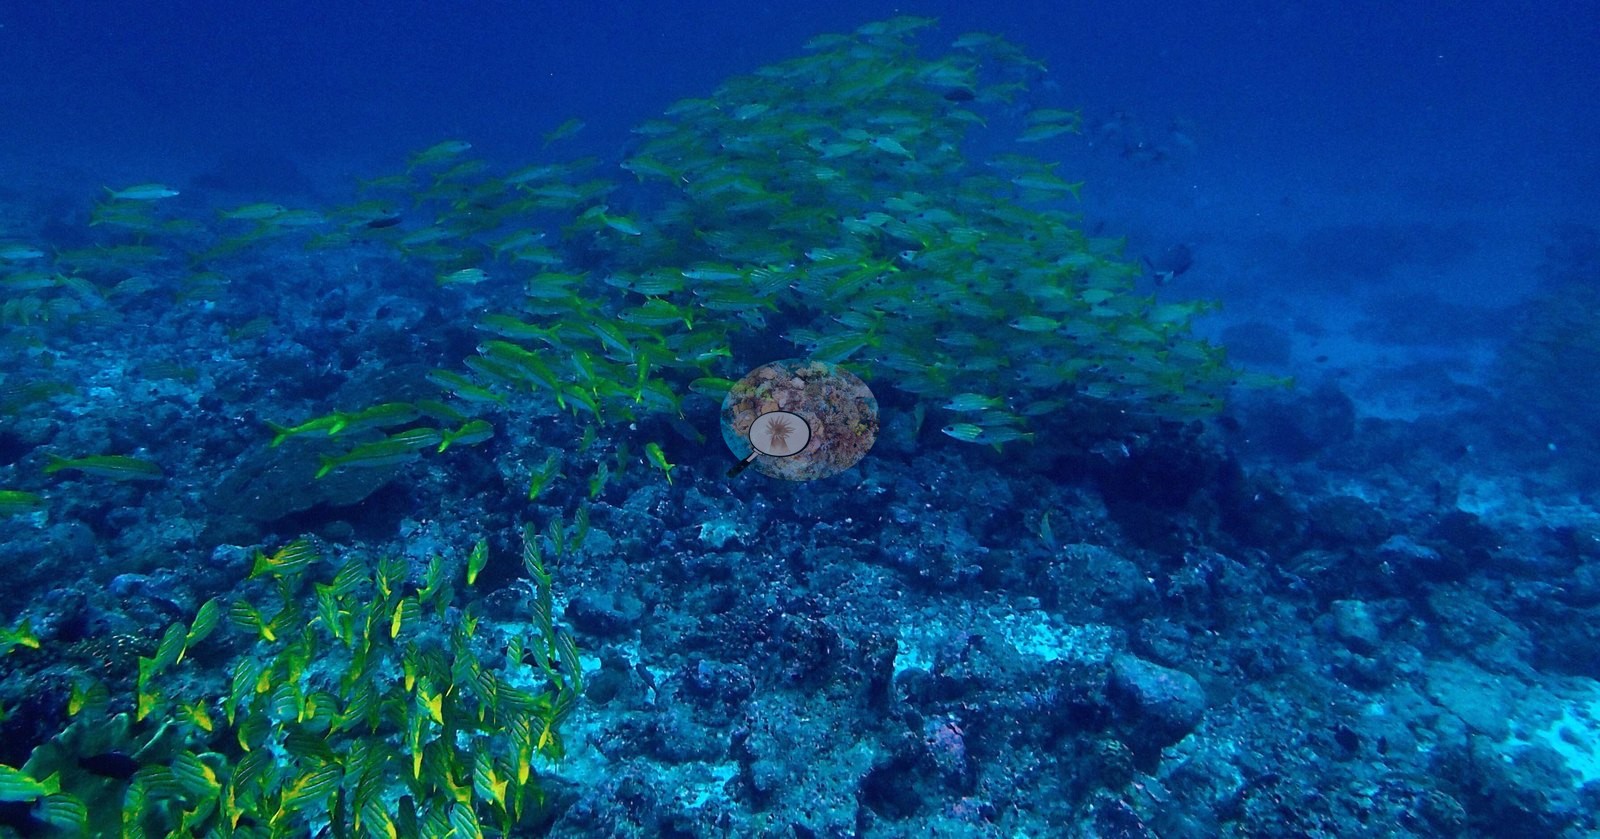
A dawn channel dive where the fish outnumber the corals a thousand to one (e.g., Image 1, Image 8).
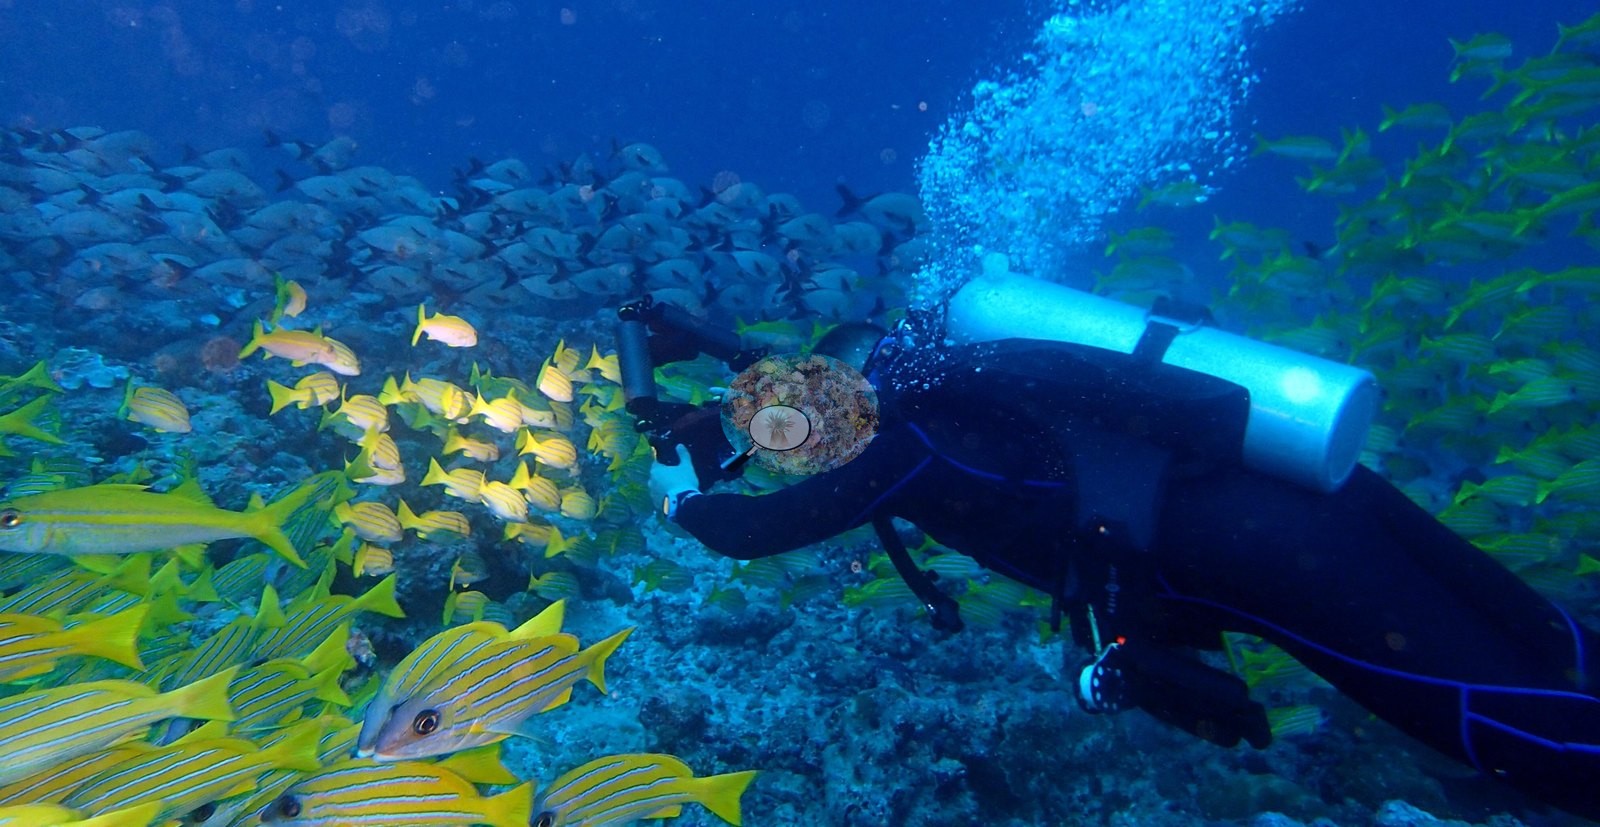
Pure Maldivian channel diving.
General benthic features
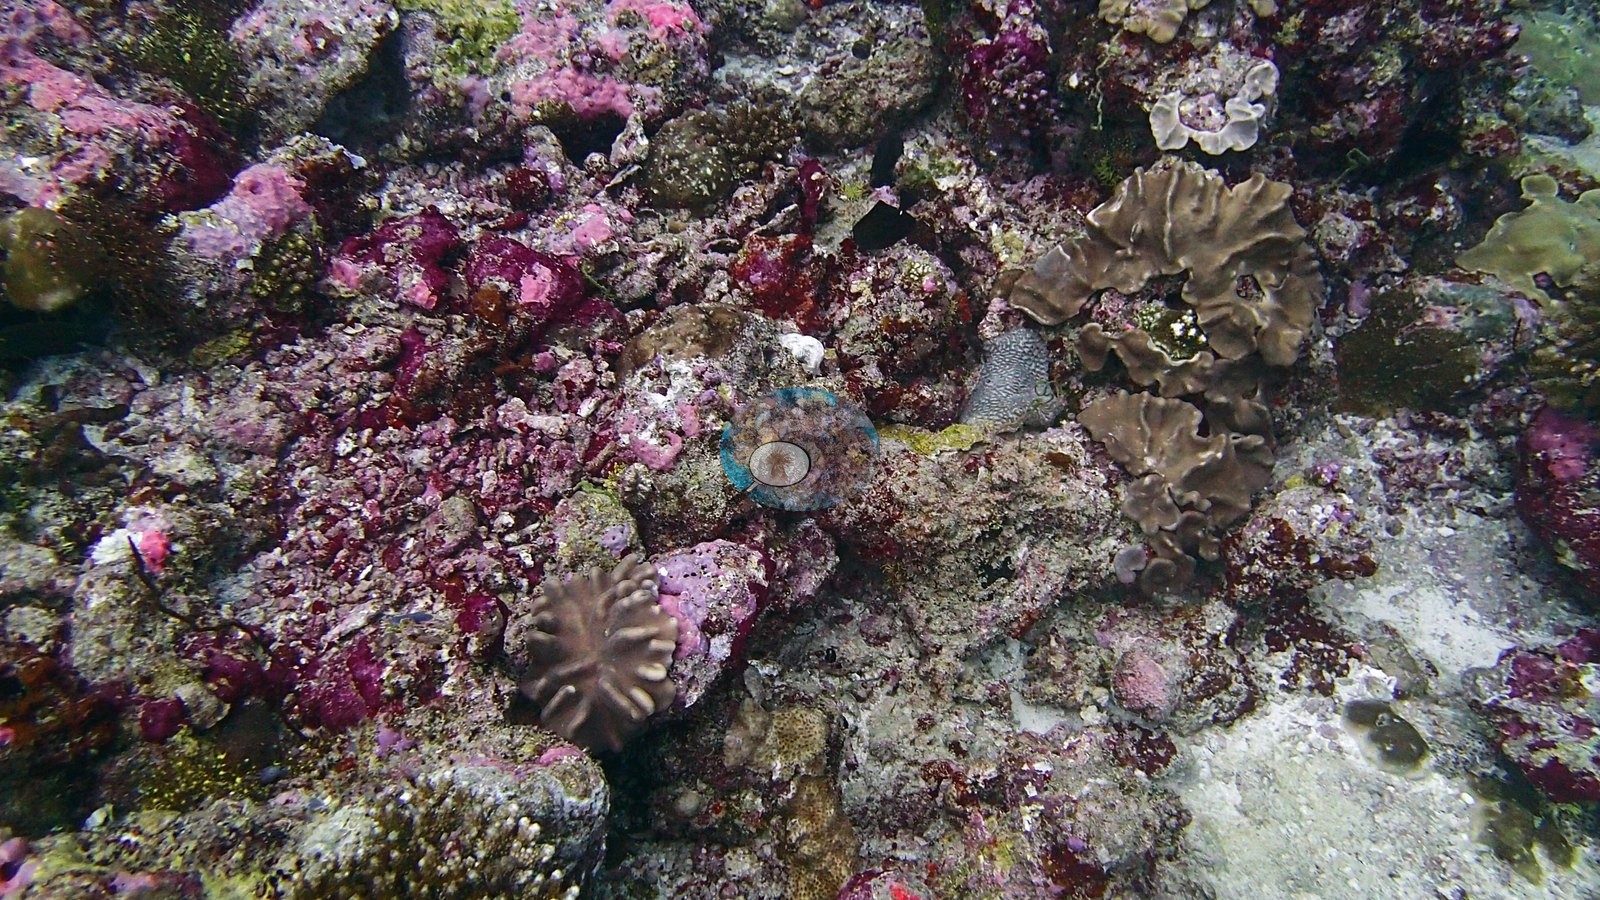
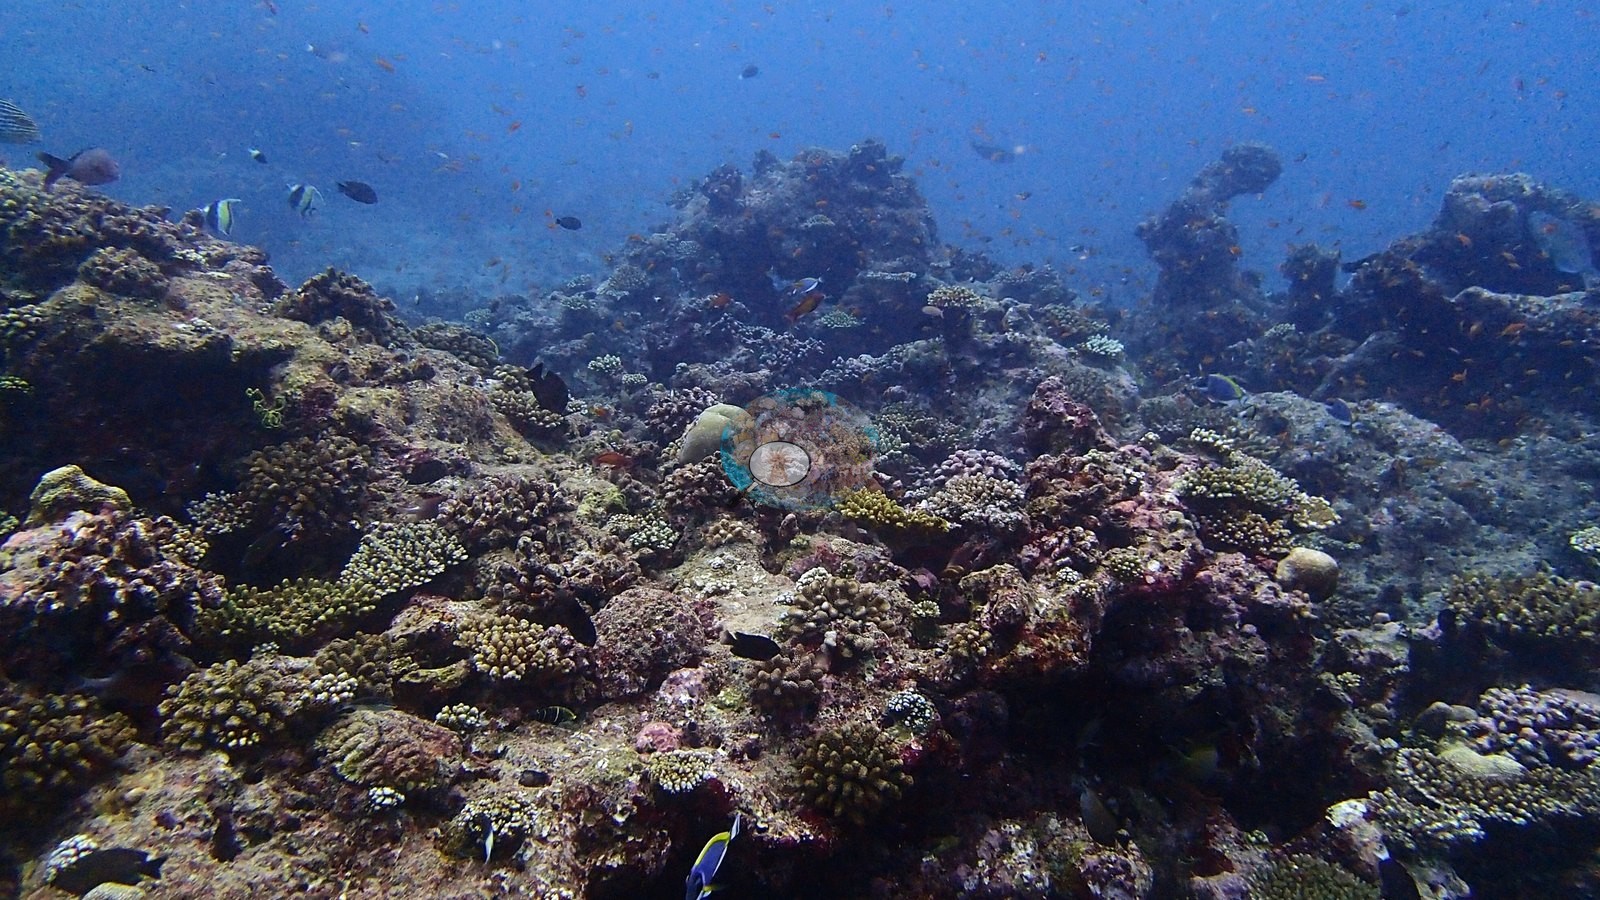
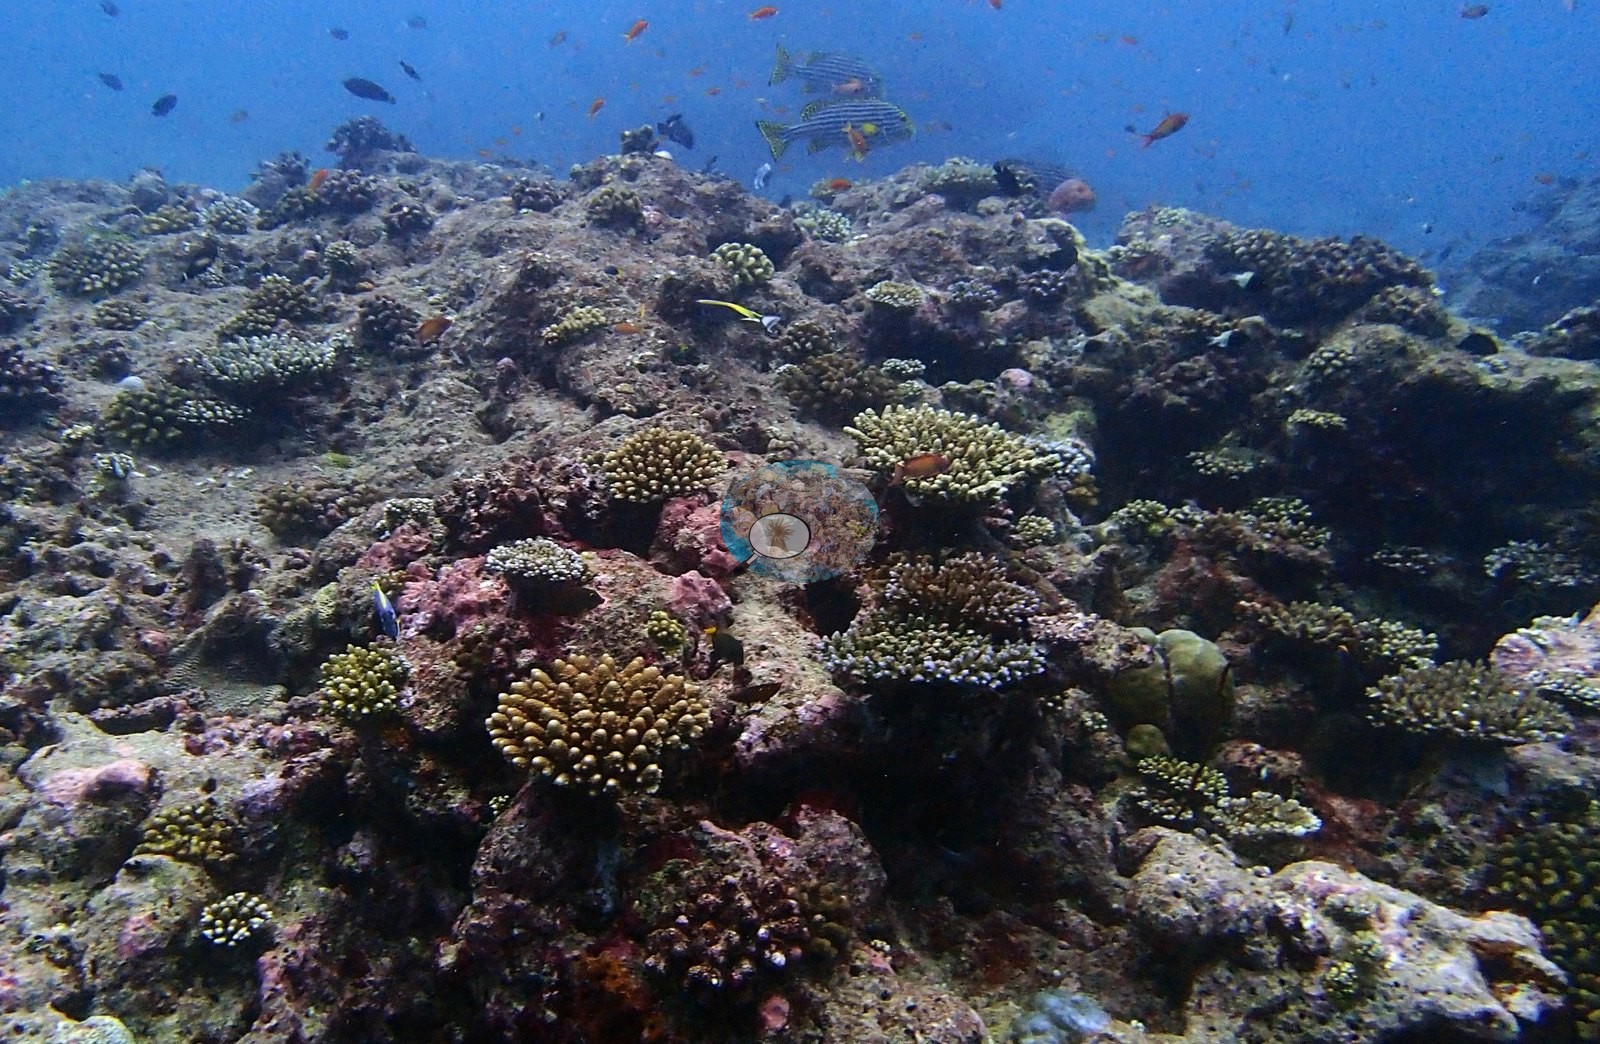
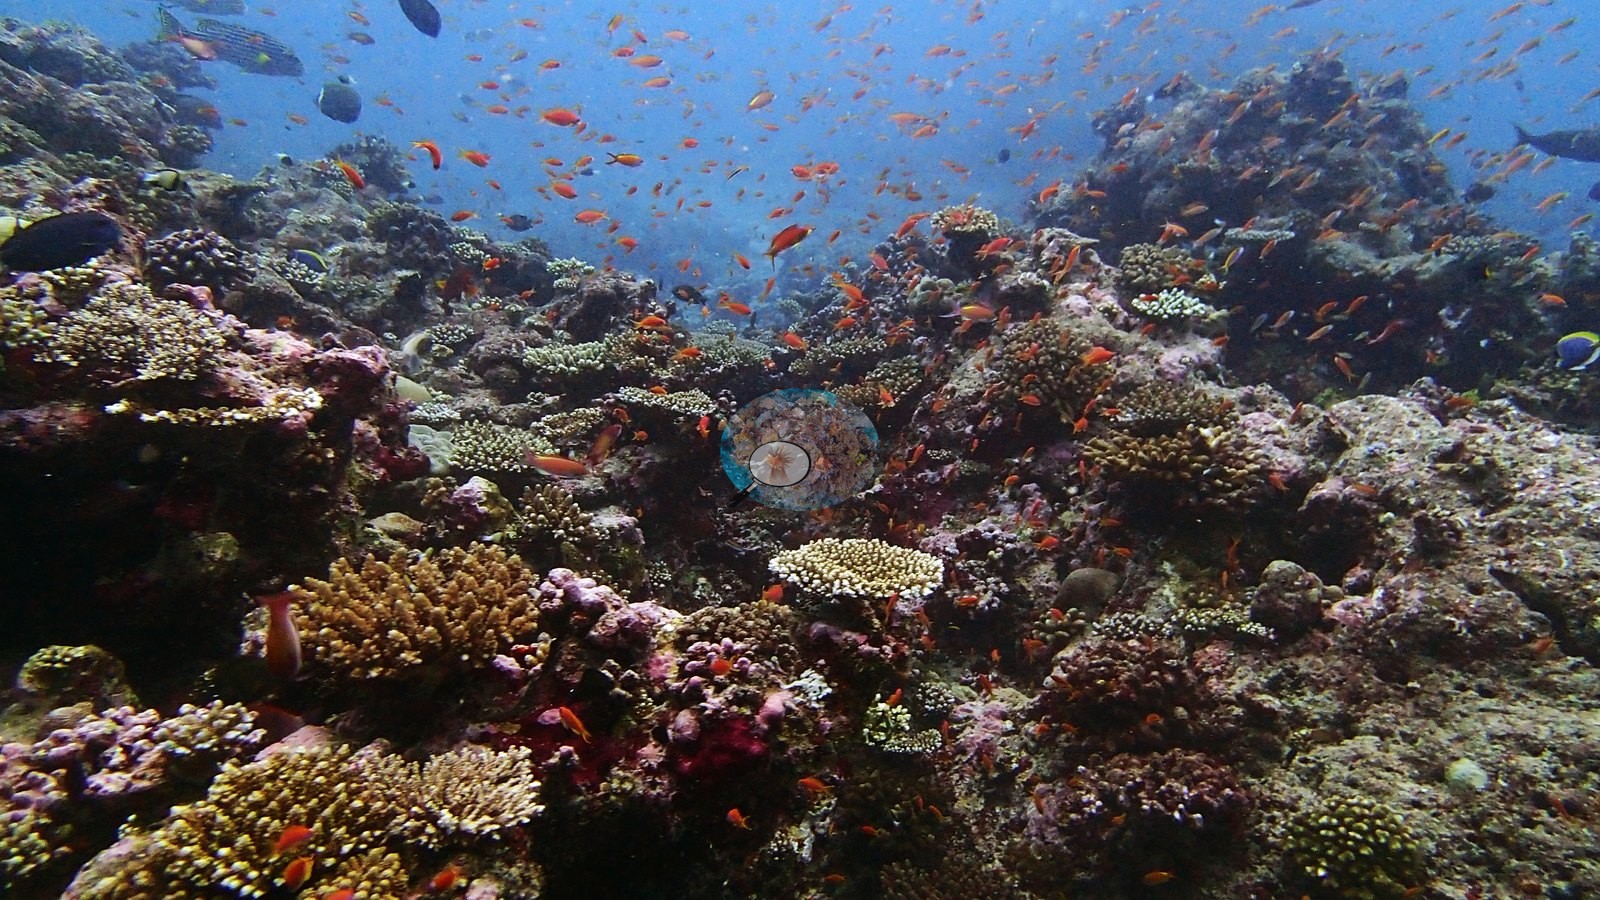
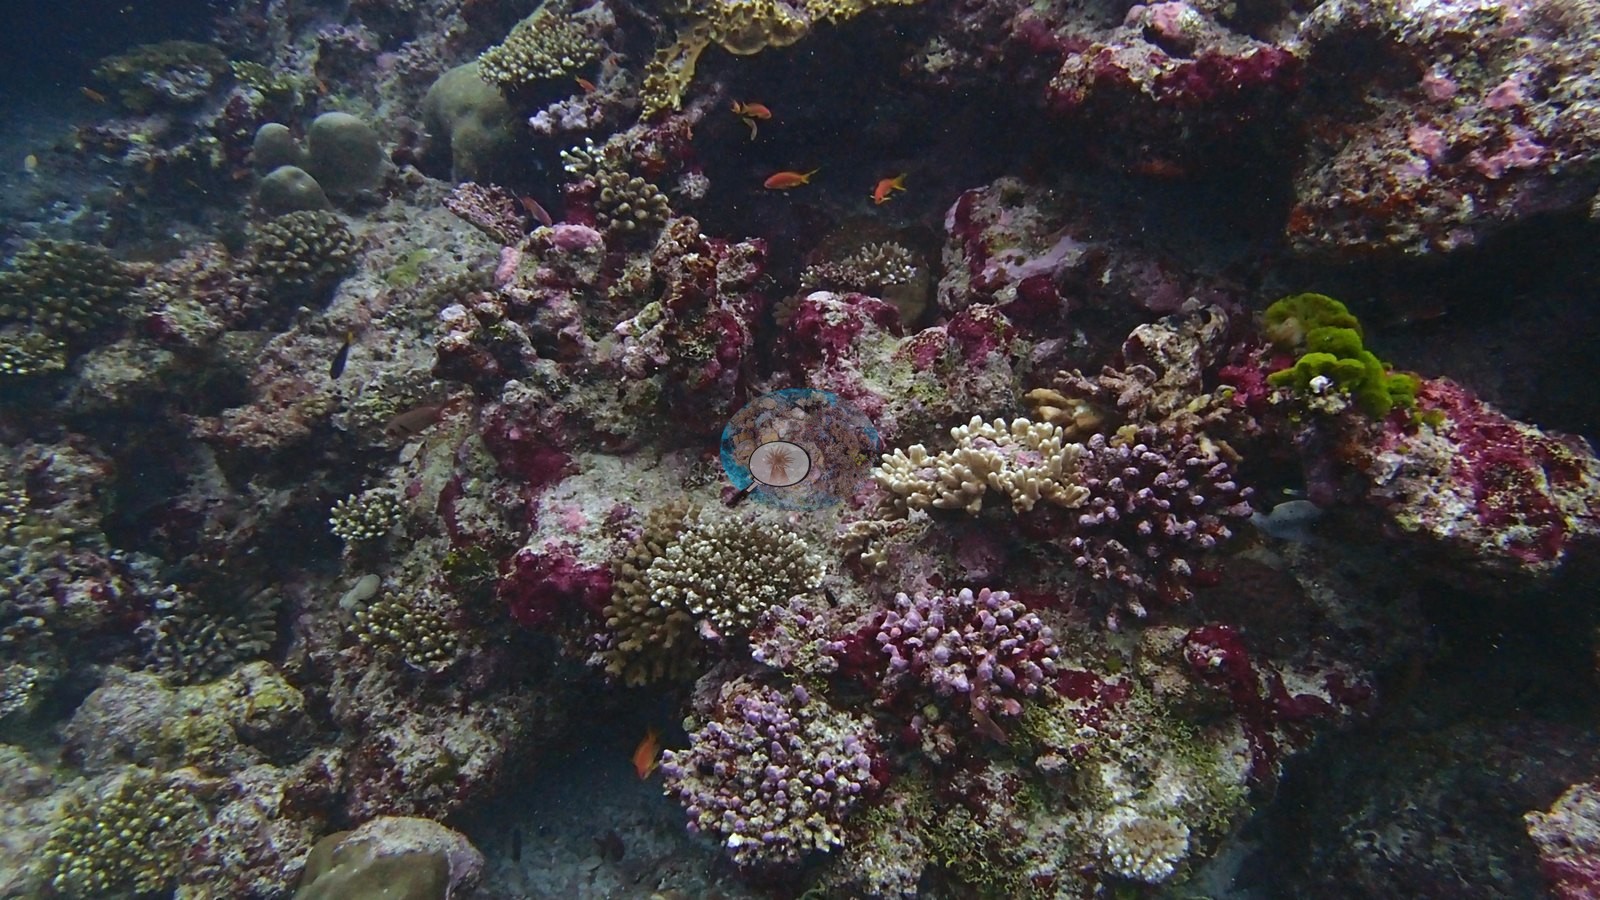
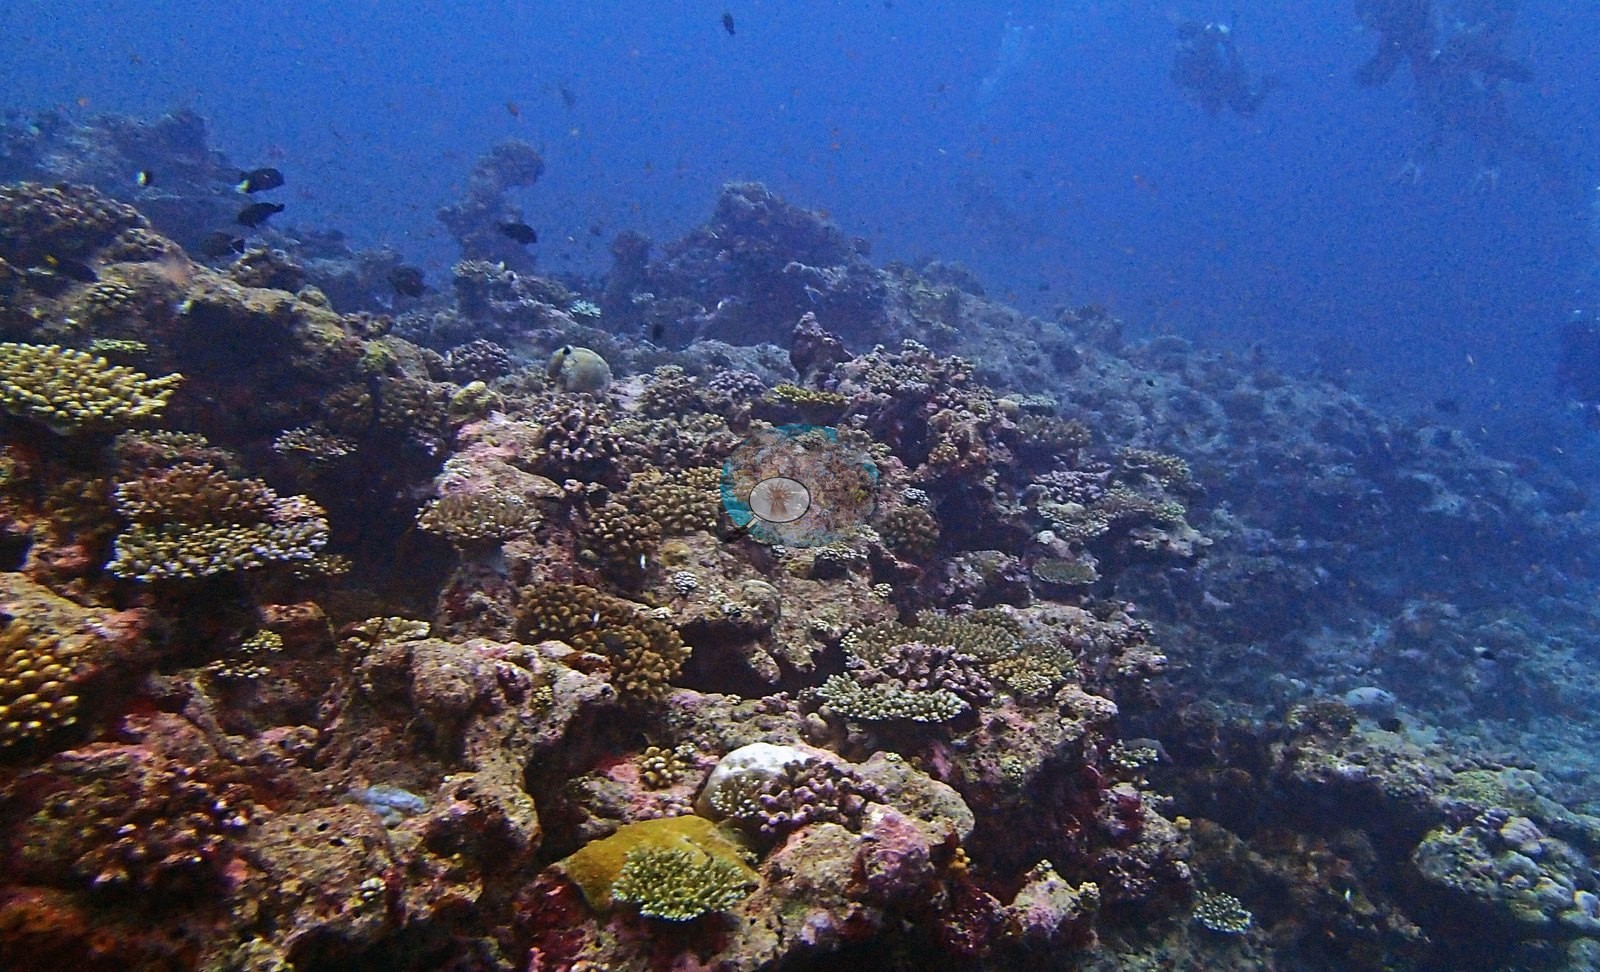
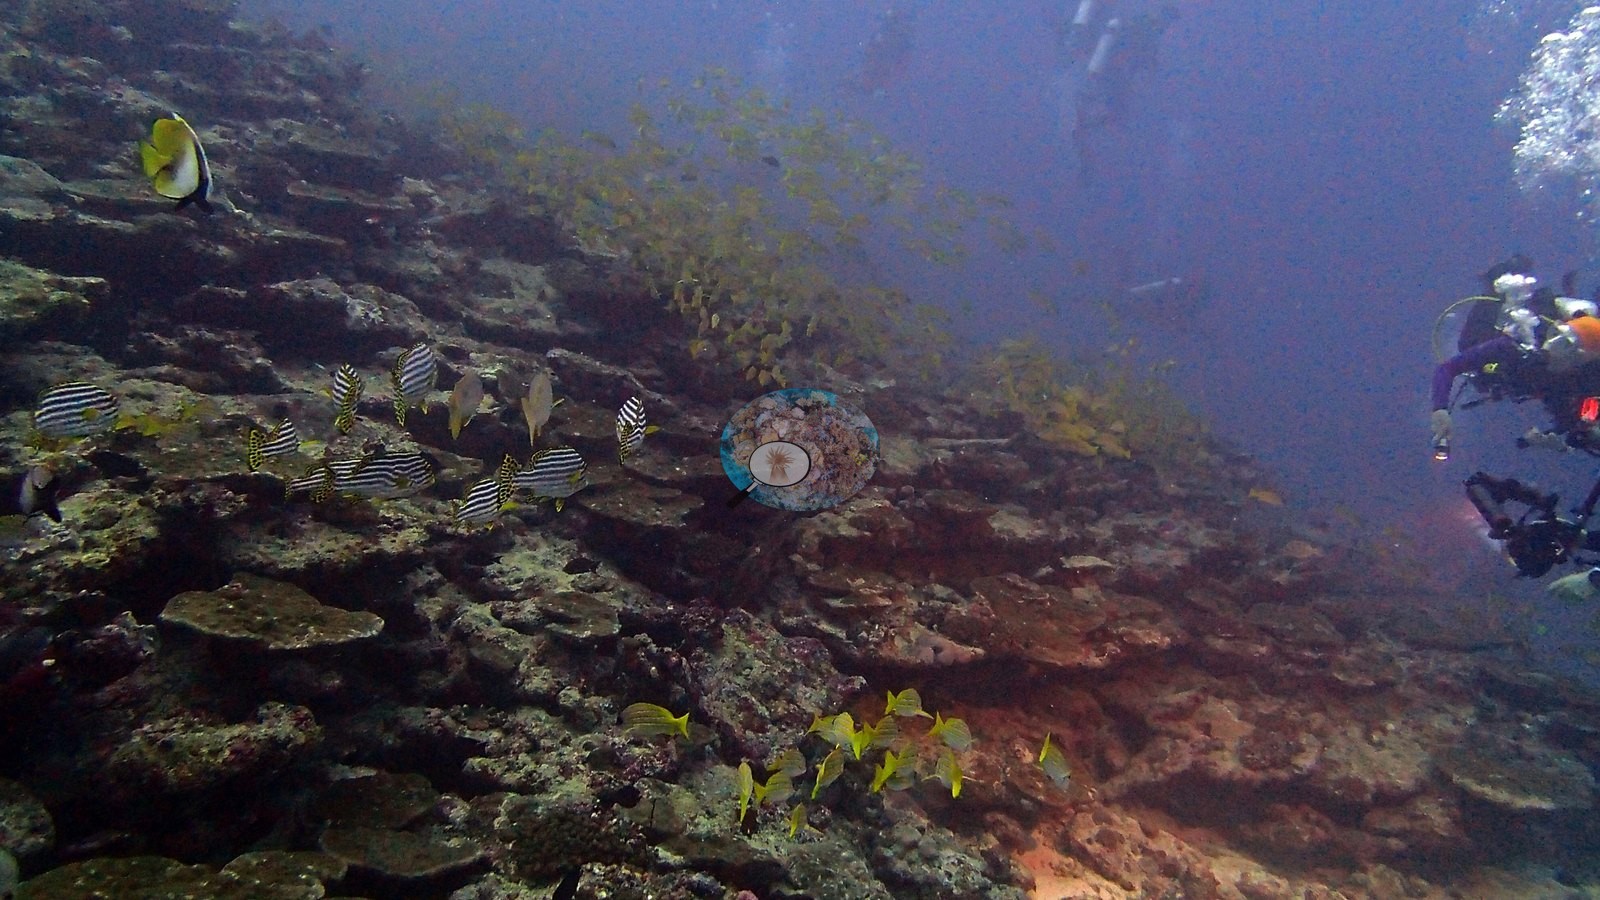
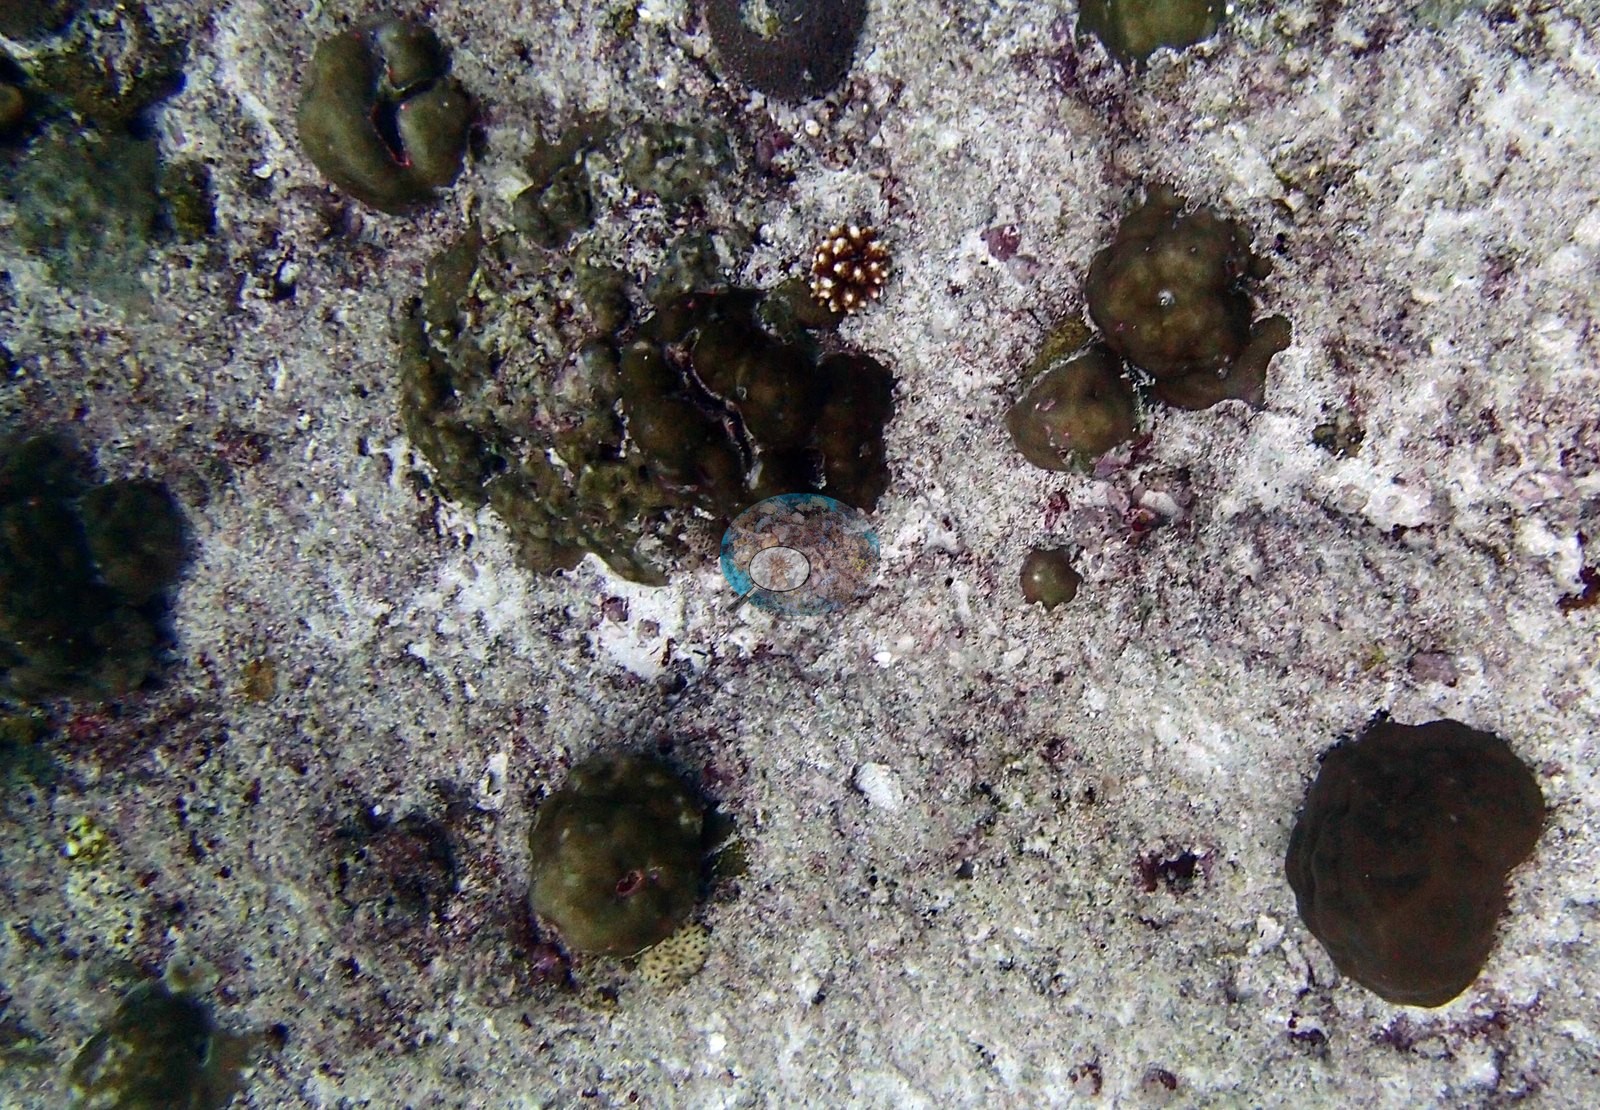
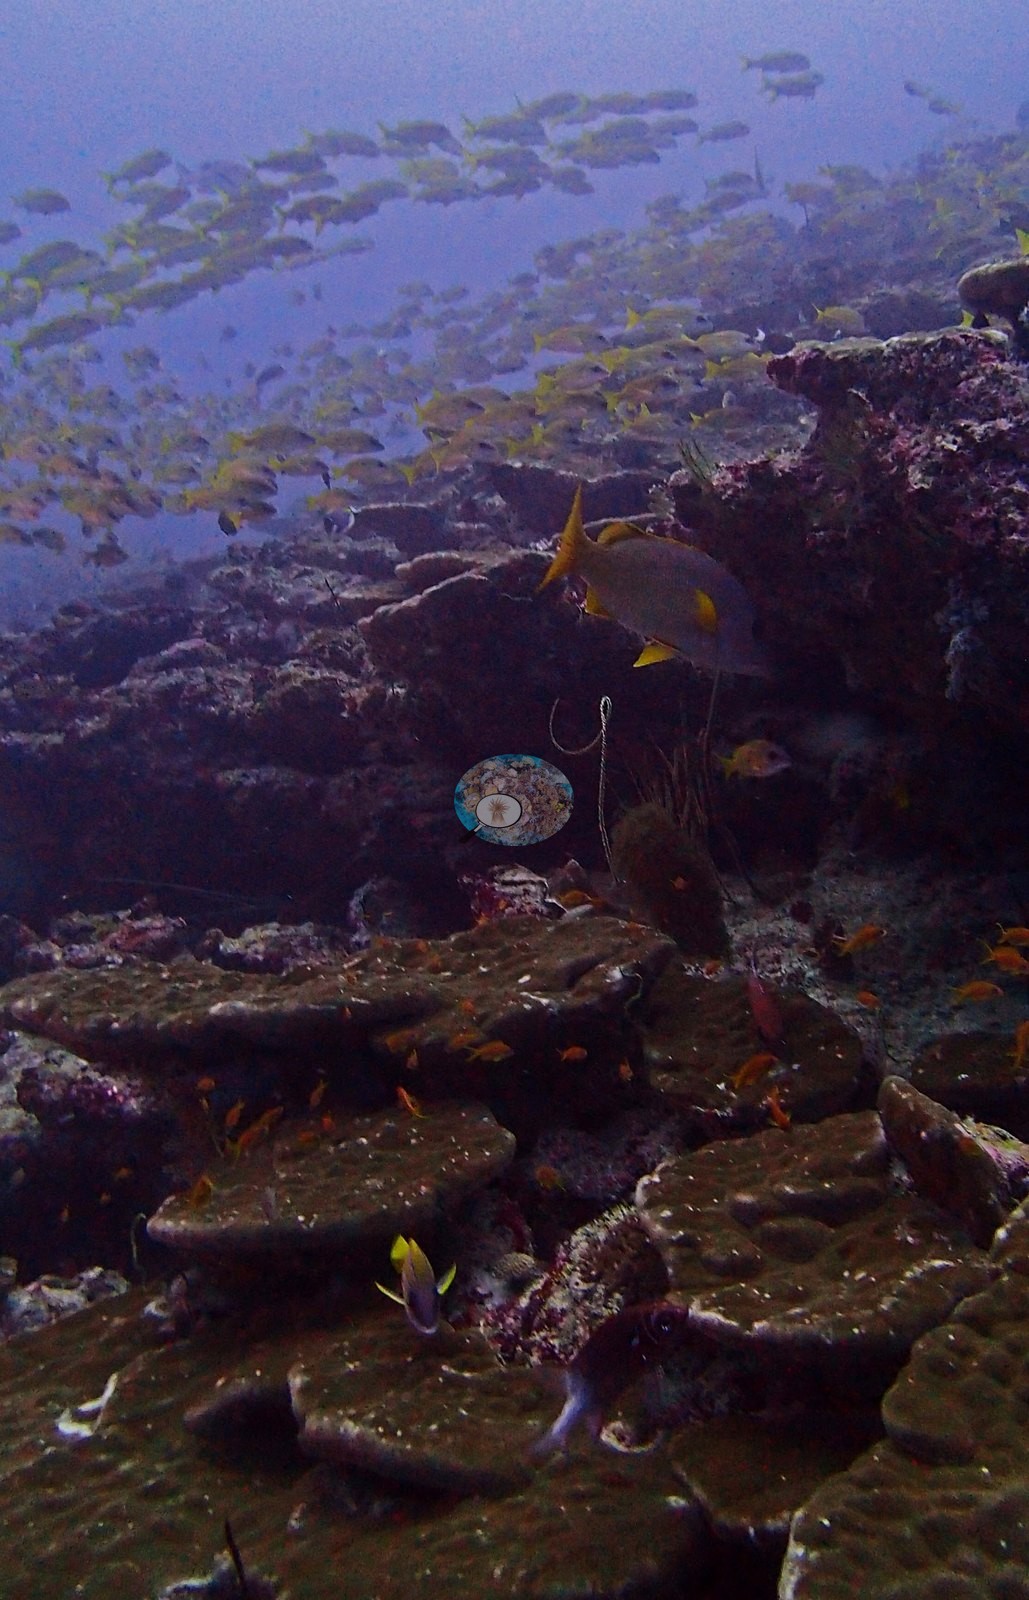
The seabed itself is austere — current-scoured rock, rubble, and the algae-dusted skeletons of table corals — which only makes the sheer biomass funneling through this cut more remarkable (e.g., Image 7, Image 16).
Coral cover
Coral cover: 16% — photo-derived, and the two methods differ by 9.9 pp (21% vs 11%). This site's figure is the mean of two independent computer vision passes over Anderson's own frames: a DINOv3 calibrated point classifier reads 20.8% and a CoralSCOP computer vision reads 10.9%, a spread of 9.9 percentage points. The map publishes the mean so sites can be sorted against one another, but the honest statement of what is known here is the 11–21% range: the two products have different denominators and should not be treated as one measurement. Anderson is actively trying out other CV models and intends to redo this CoralSCOP and DINOv3-based figure once something more dependable comes along.
Stressors
No crown-of-thorns starfish (COTS) or other corallivores evident.
Fish and other fauna
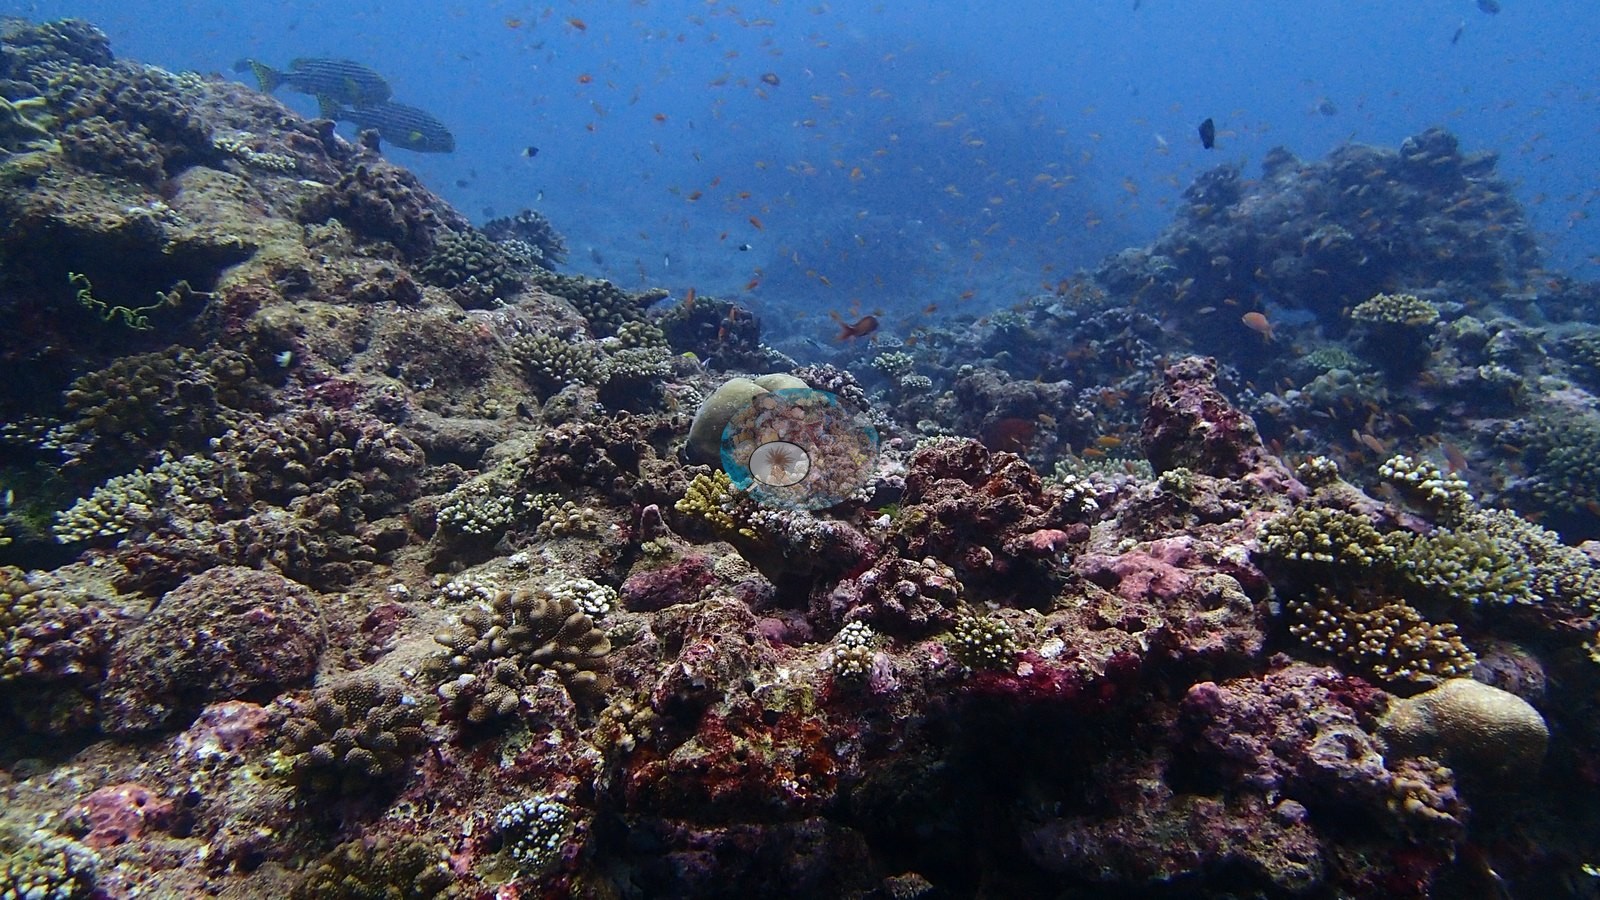
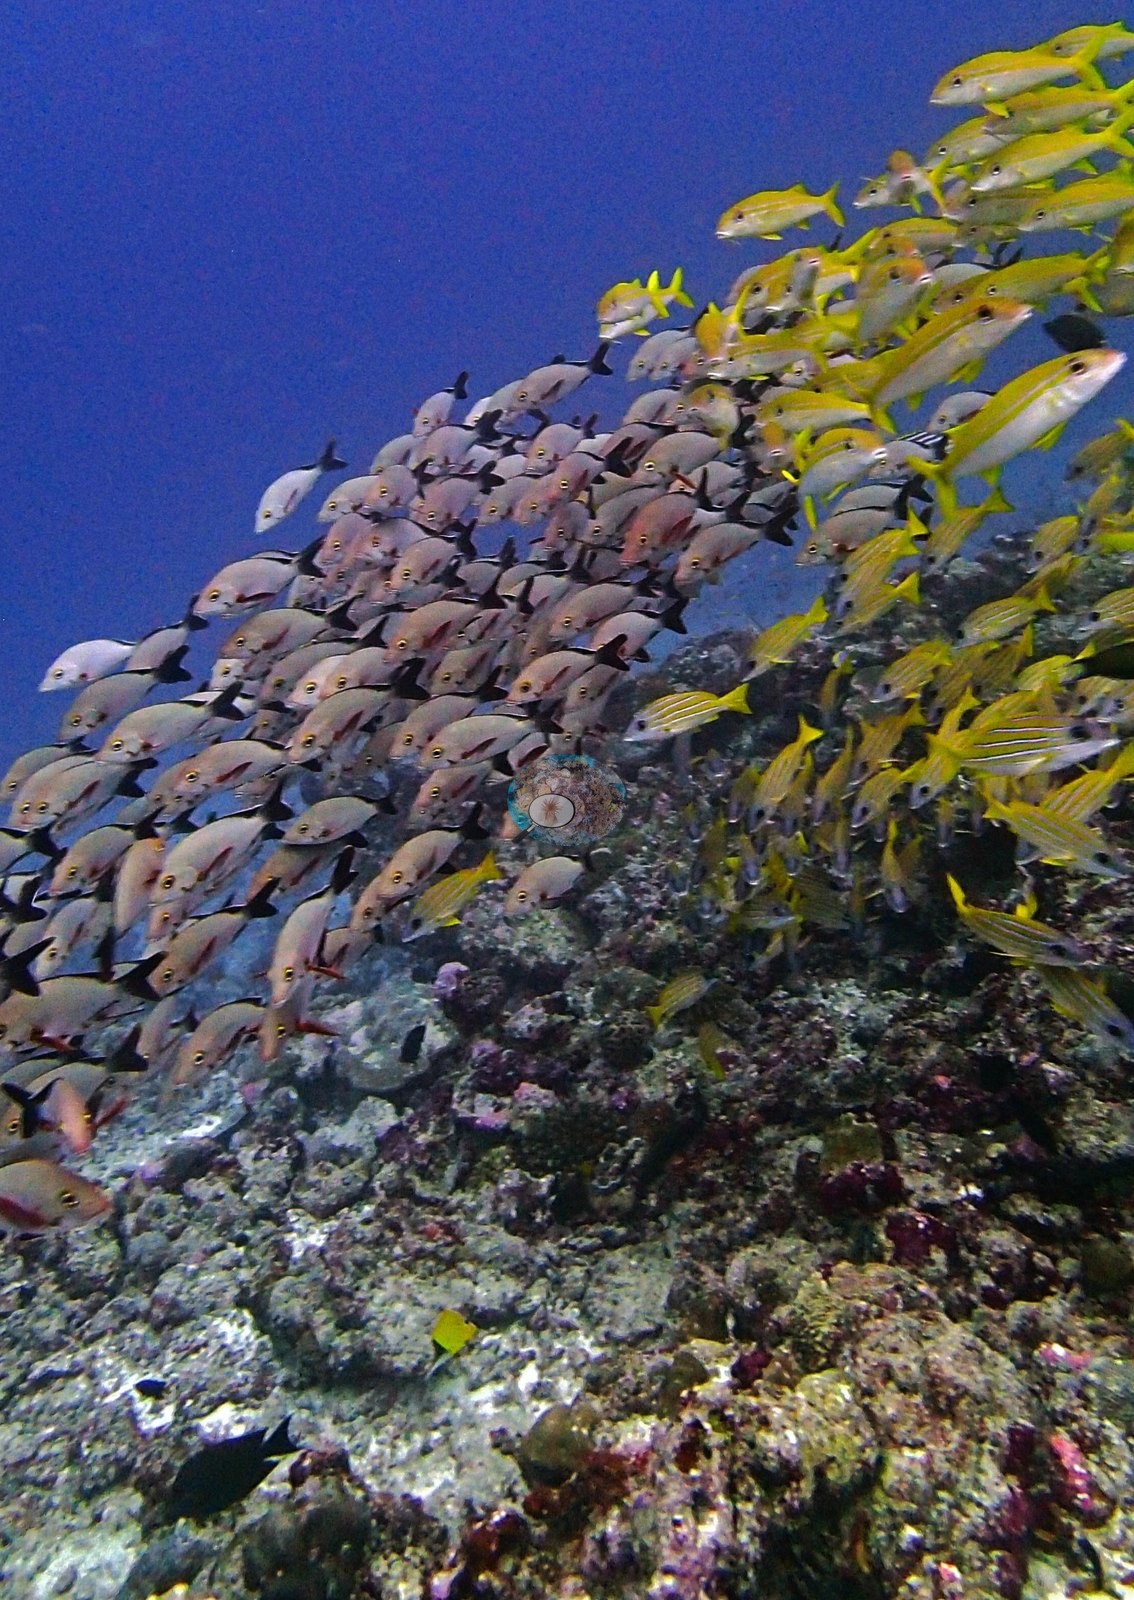
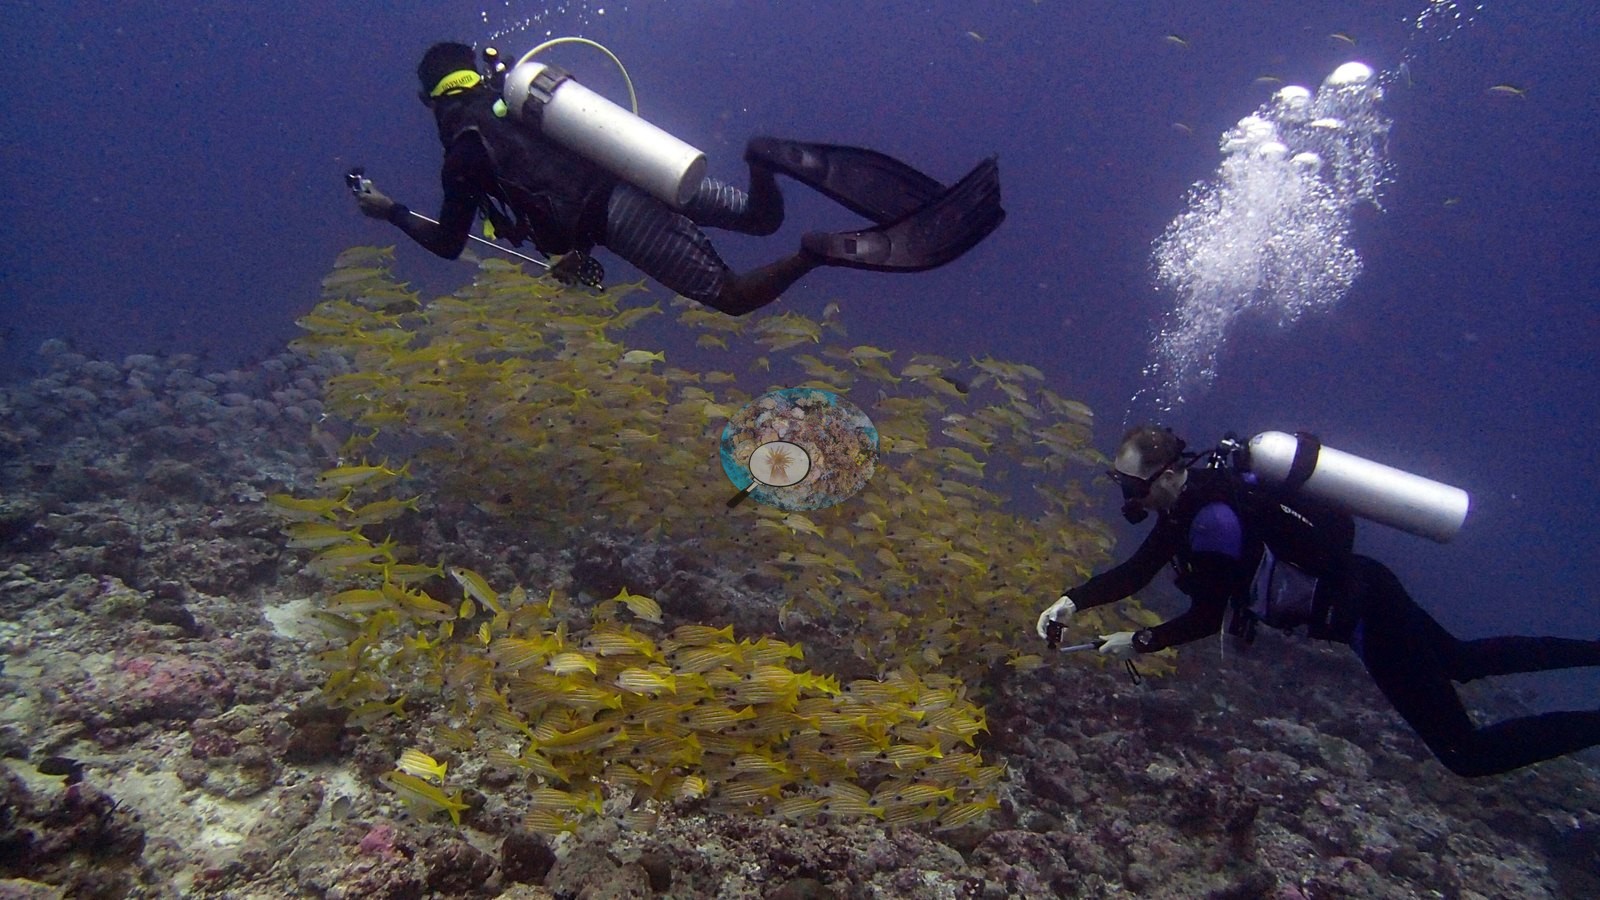
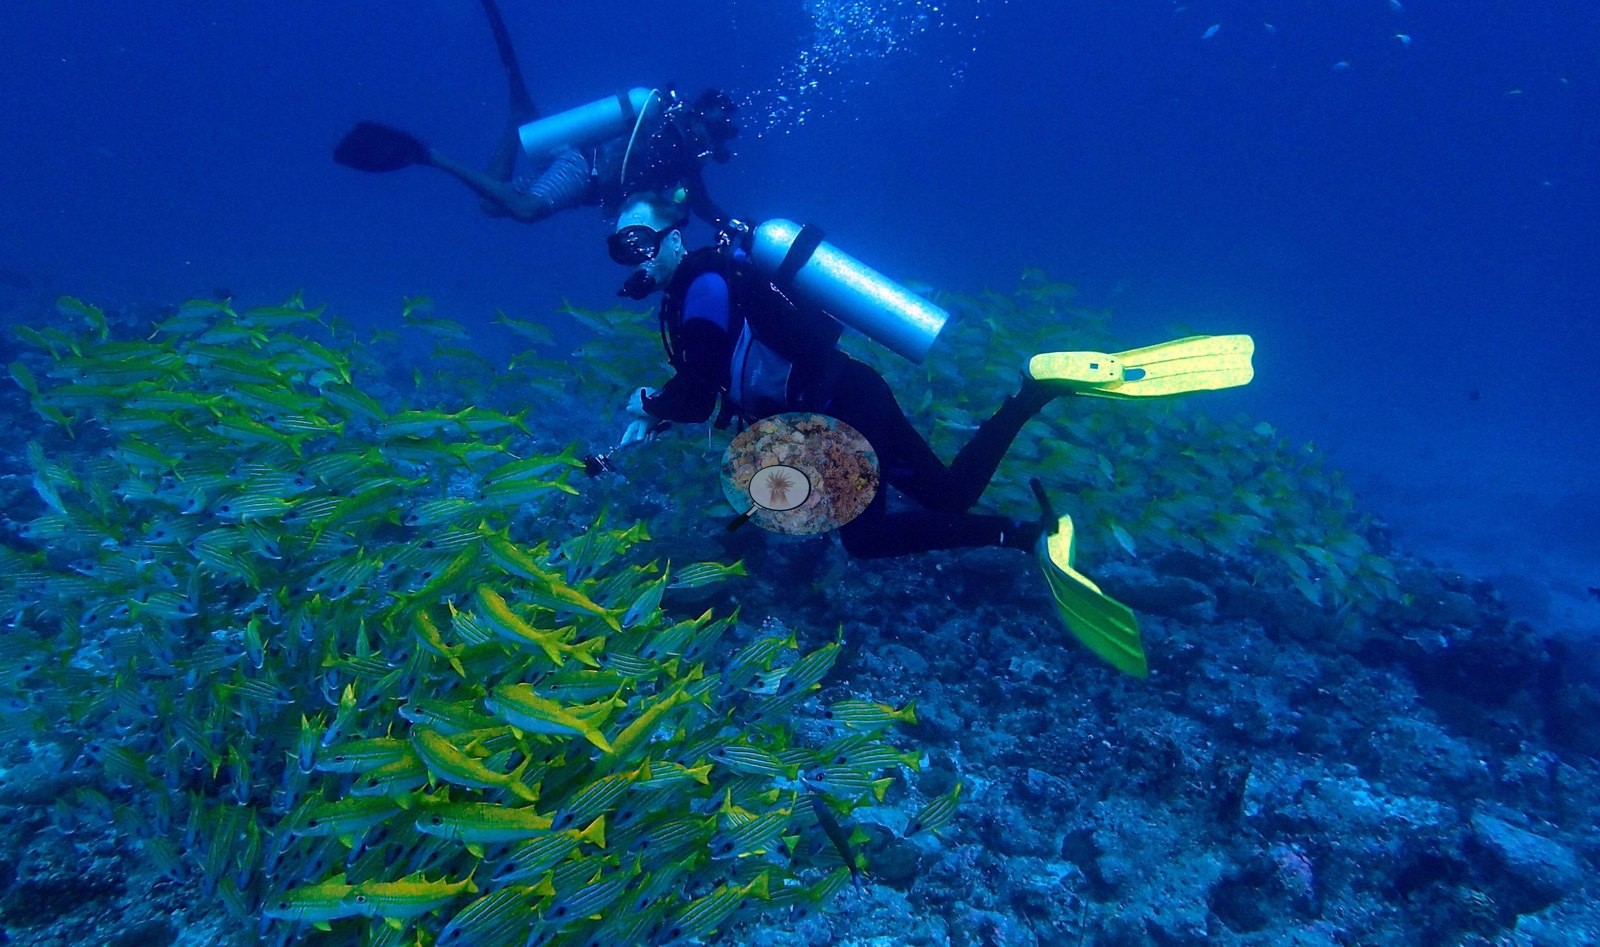
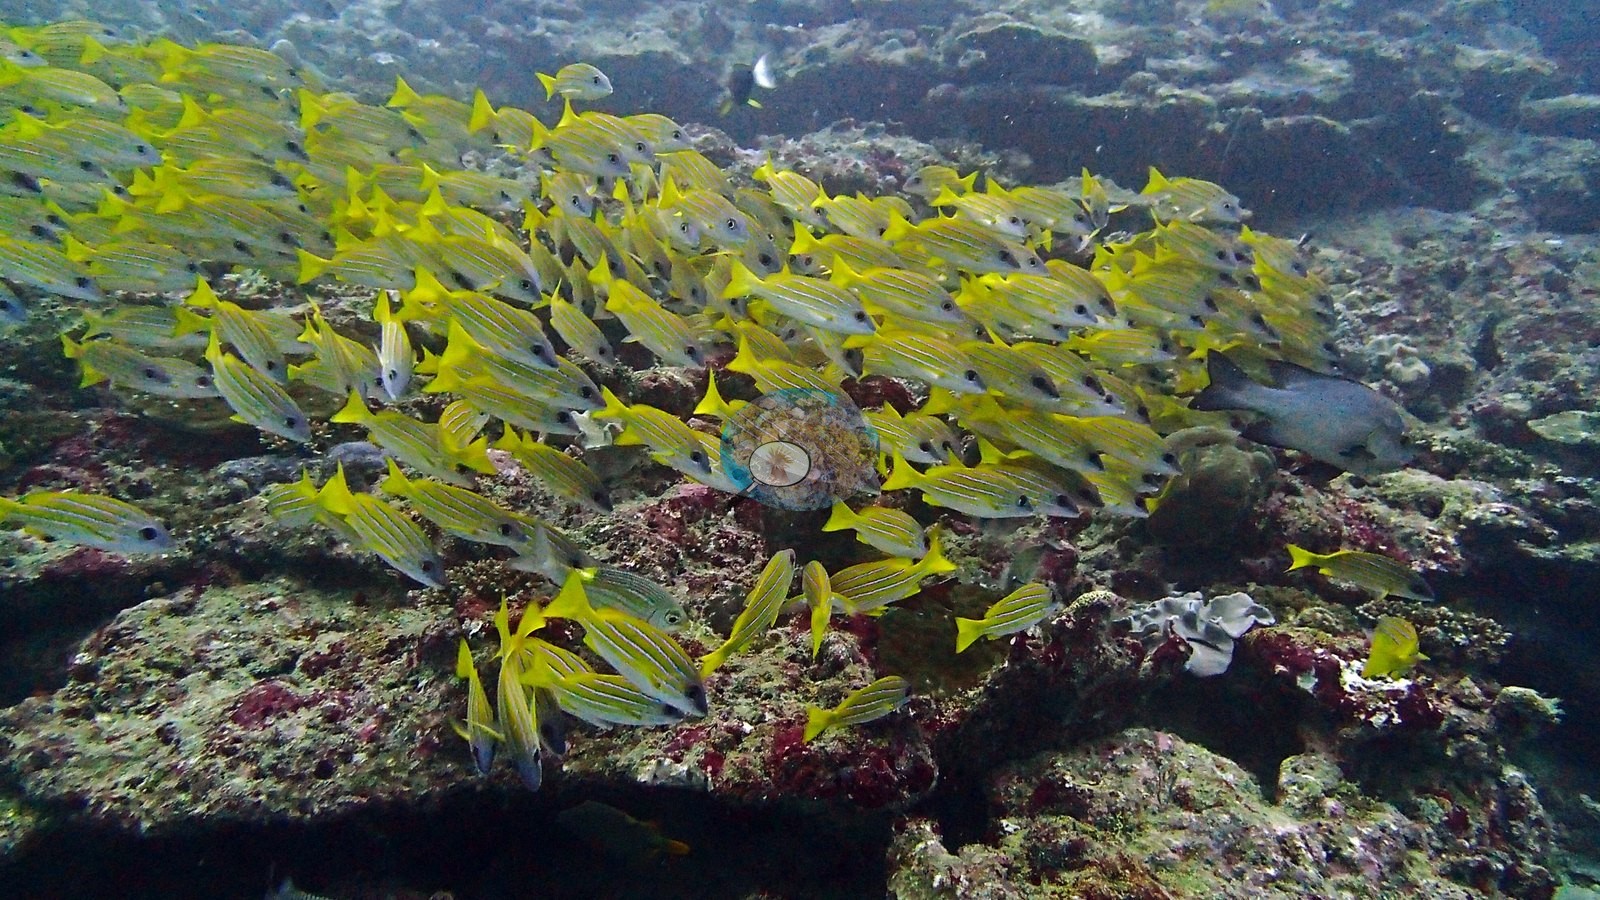
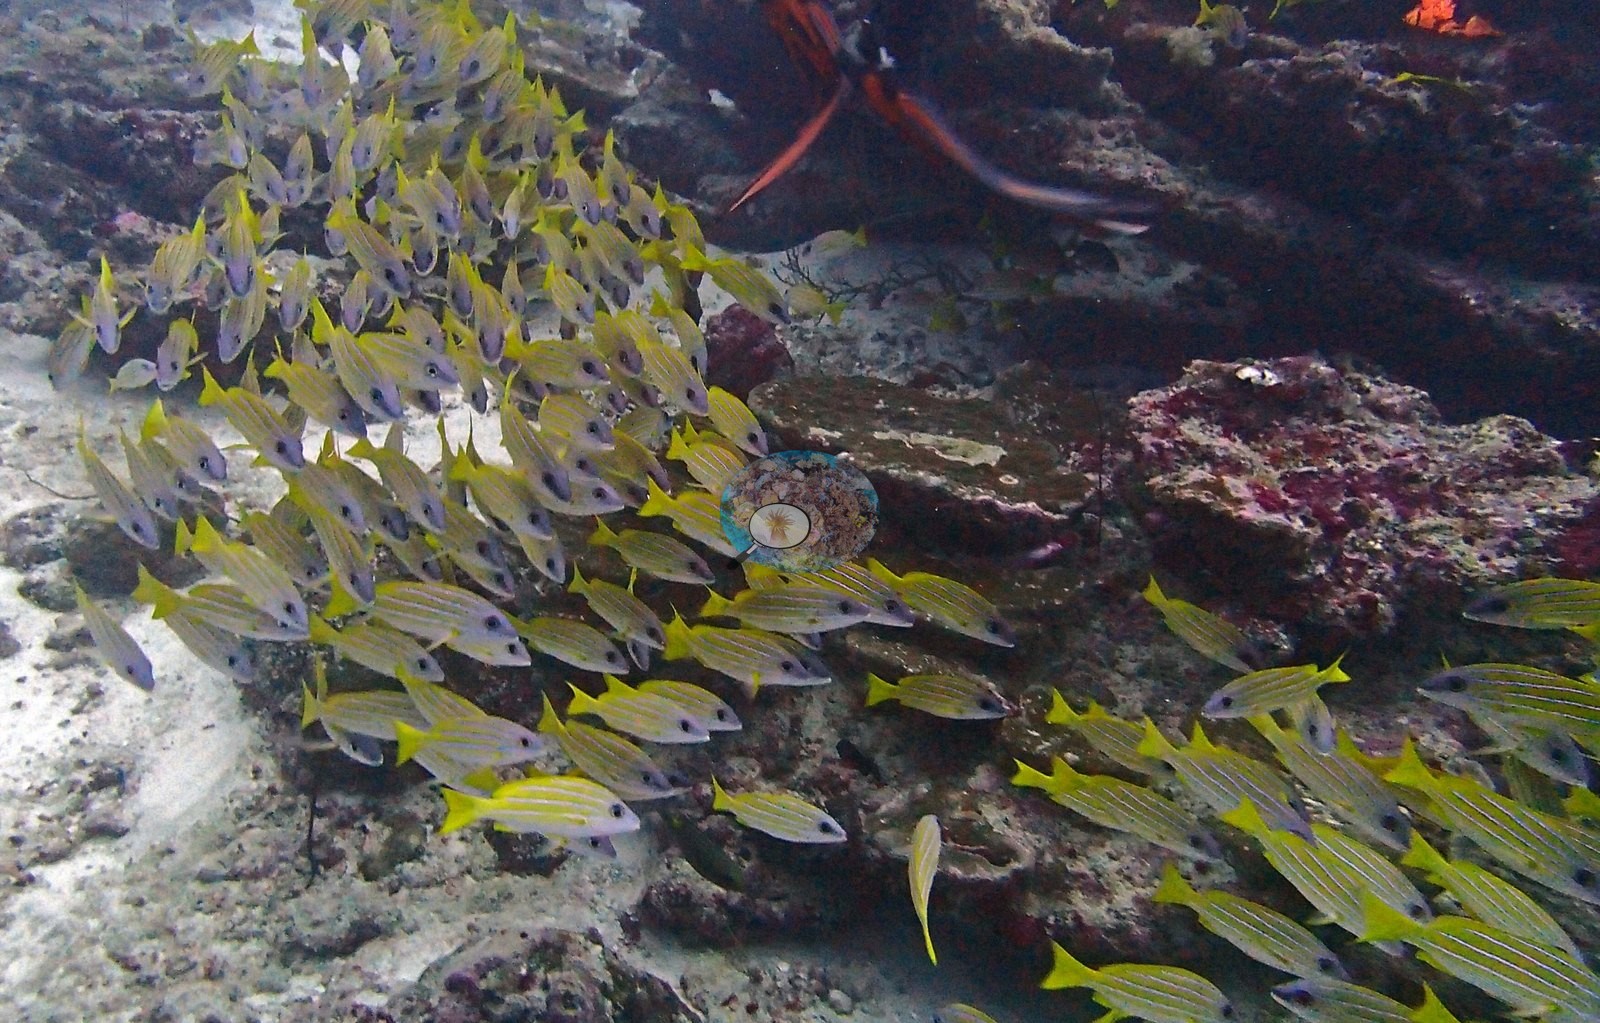
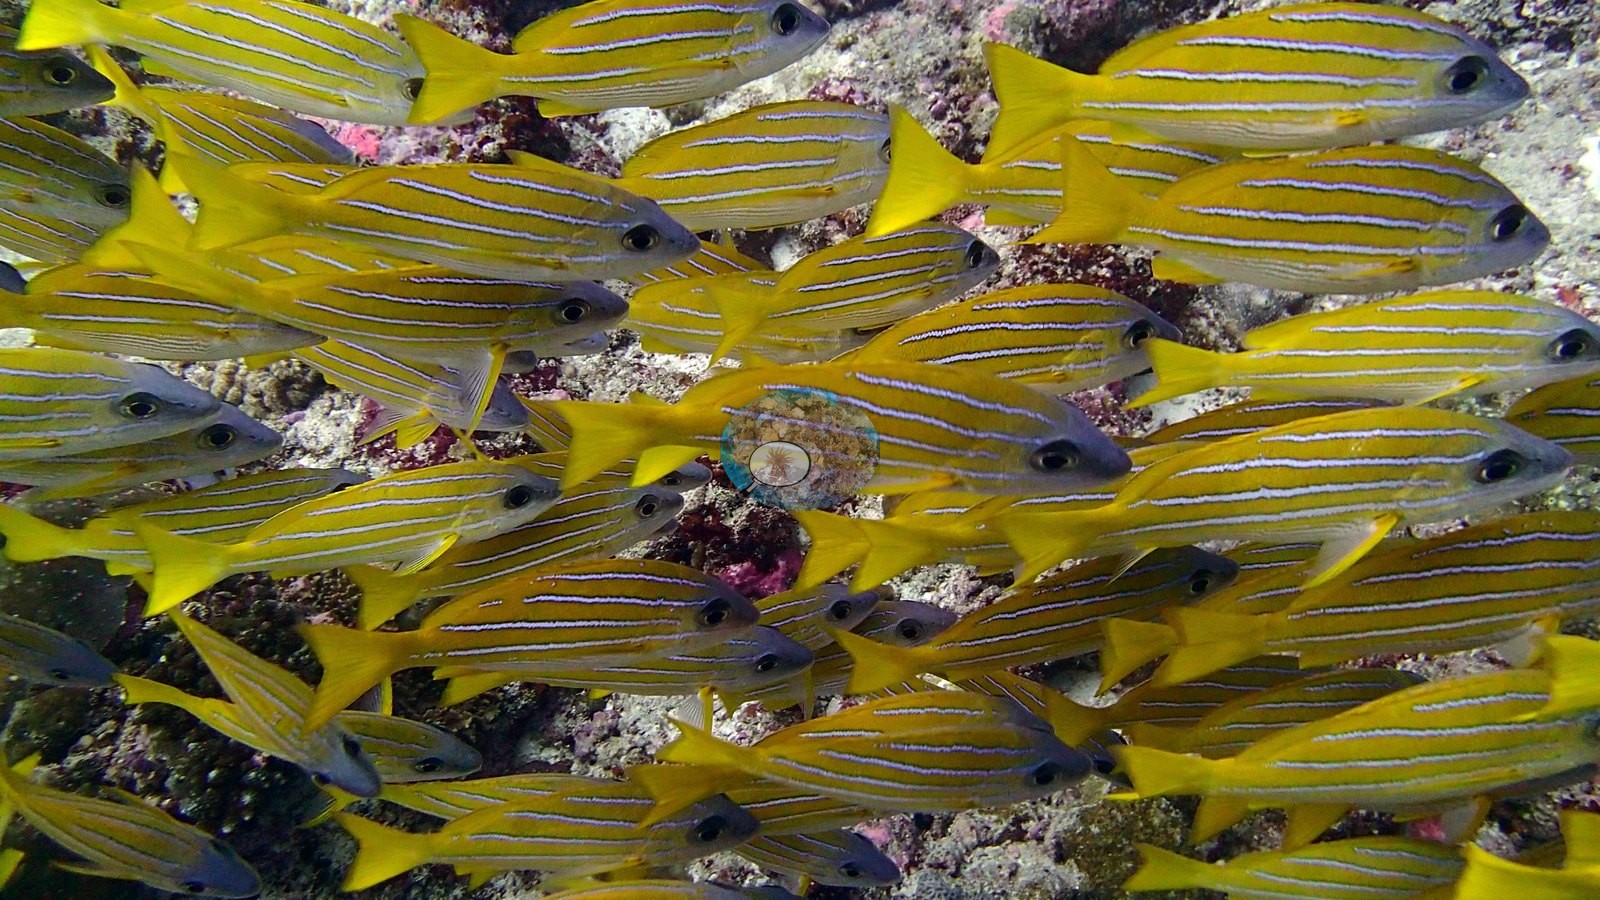
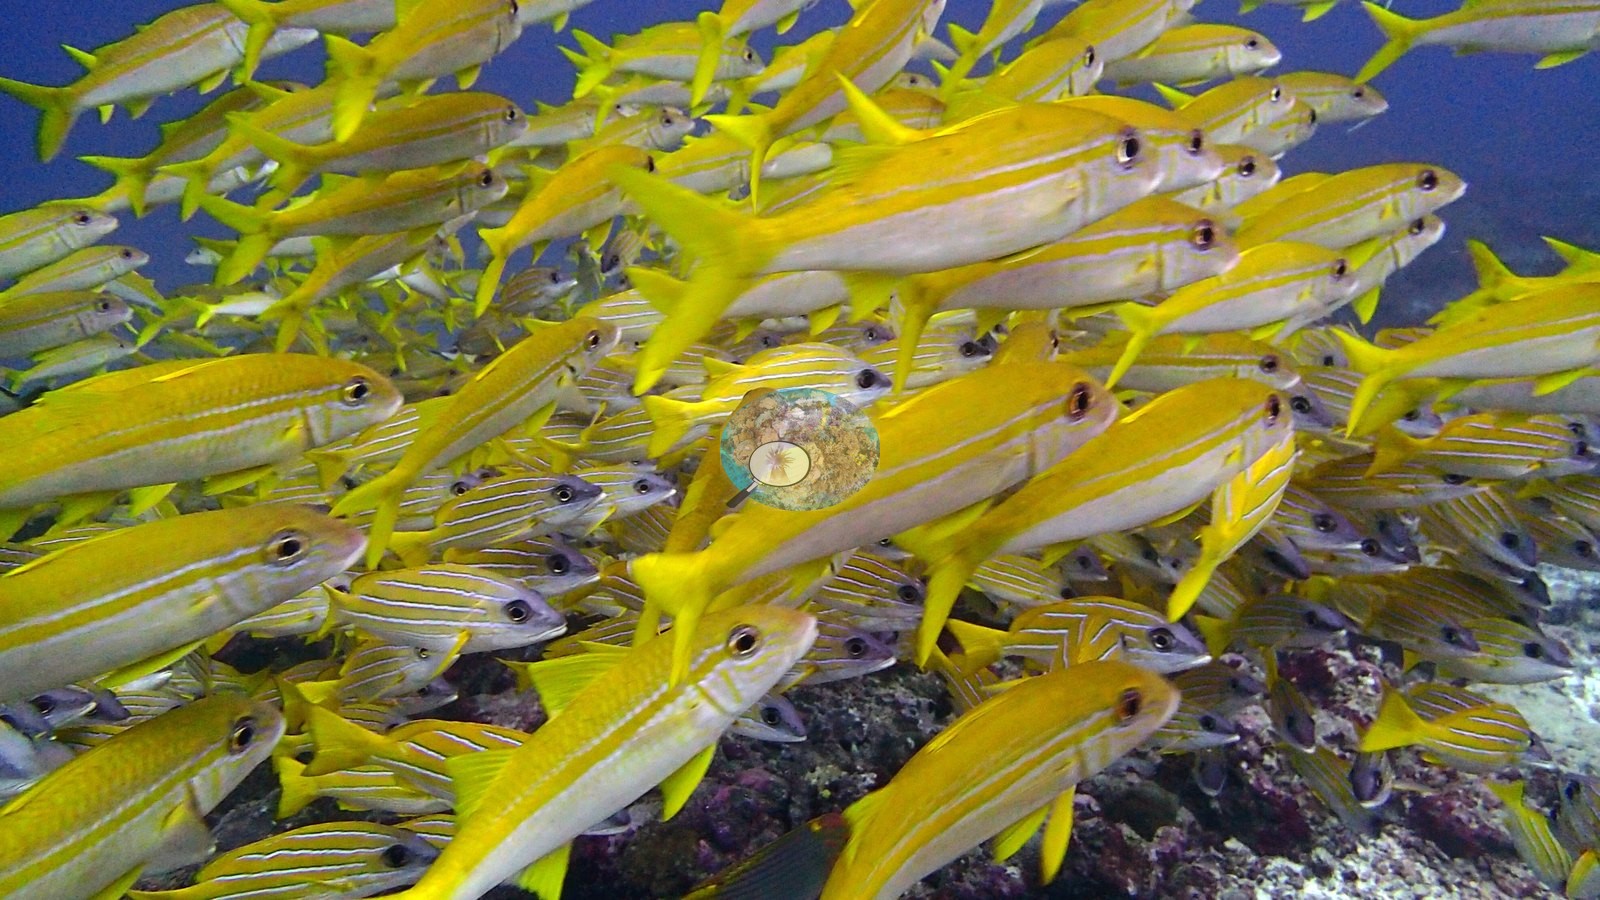
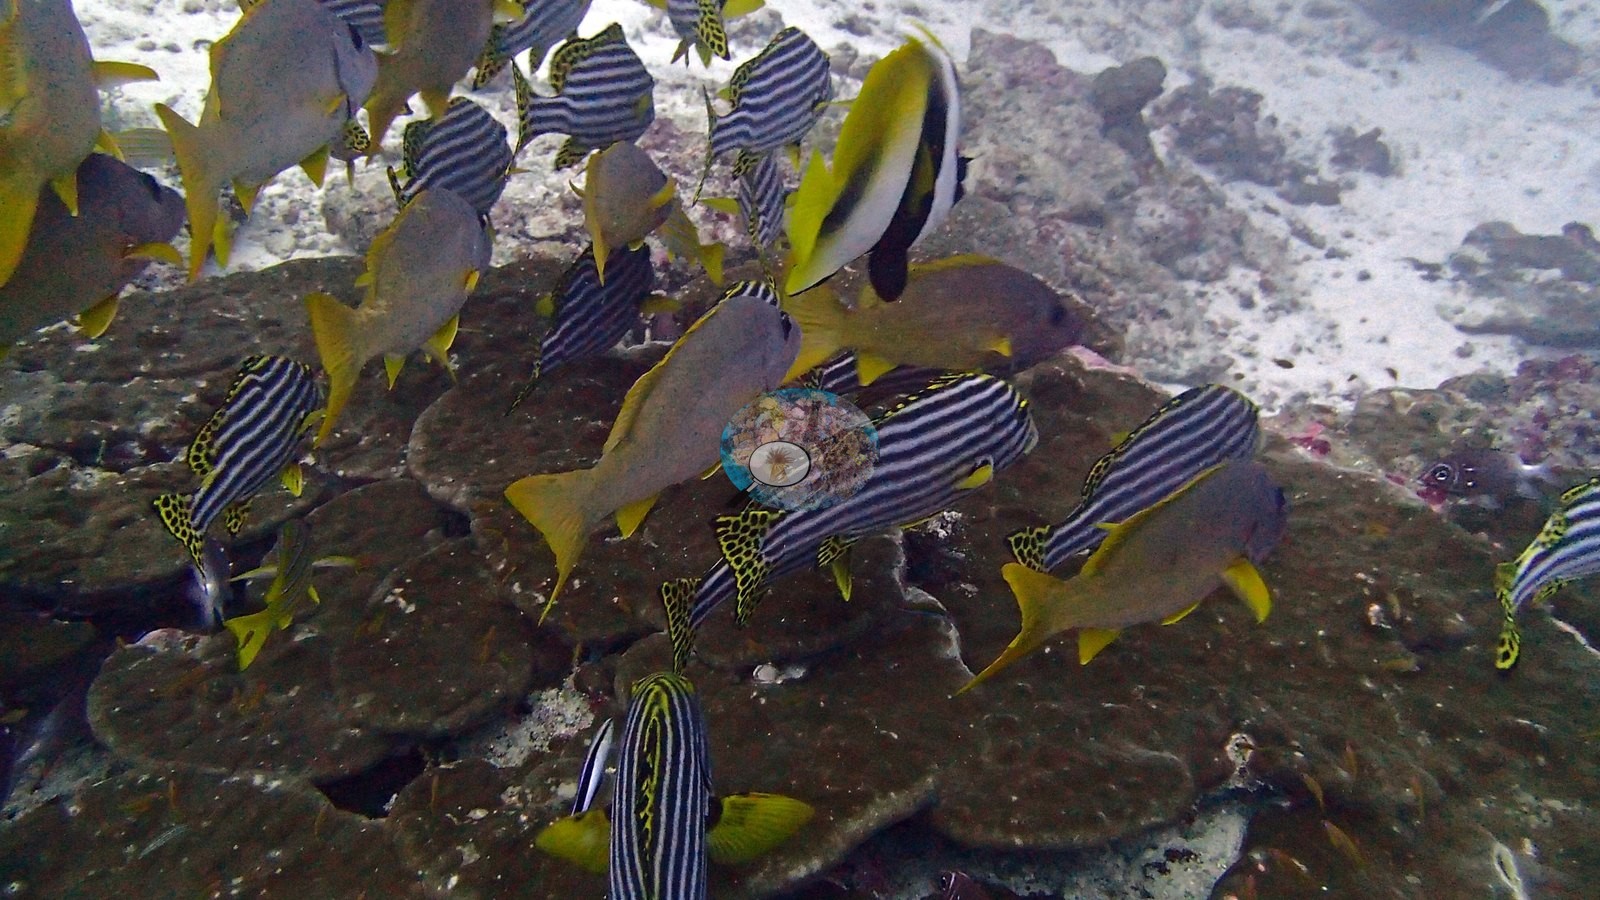
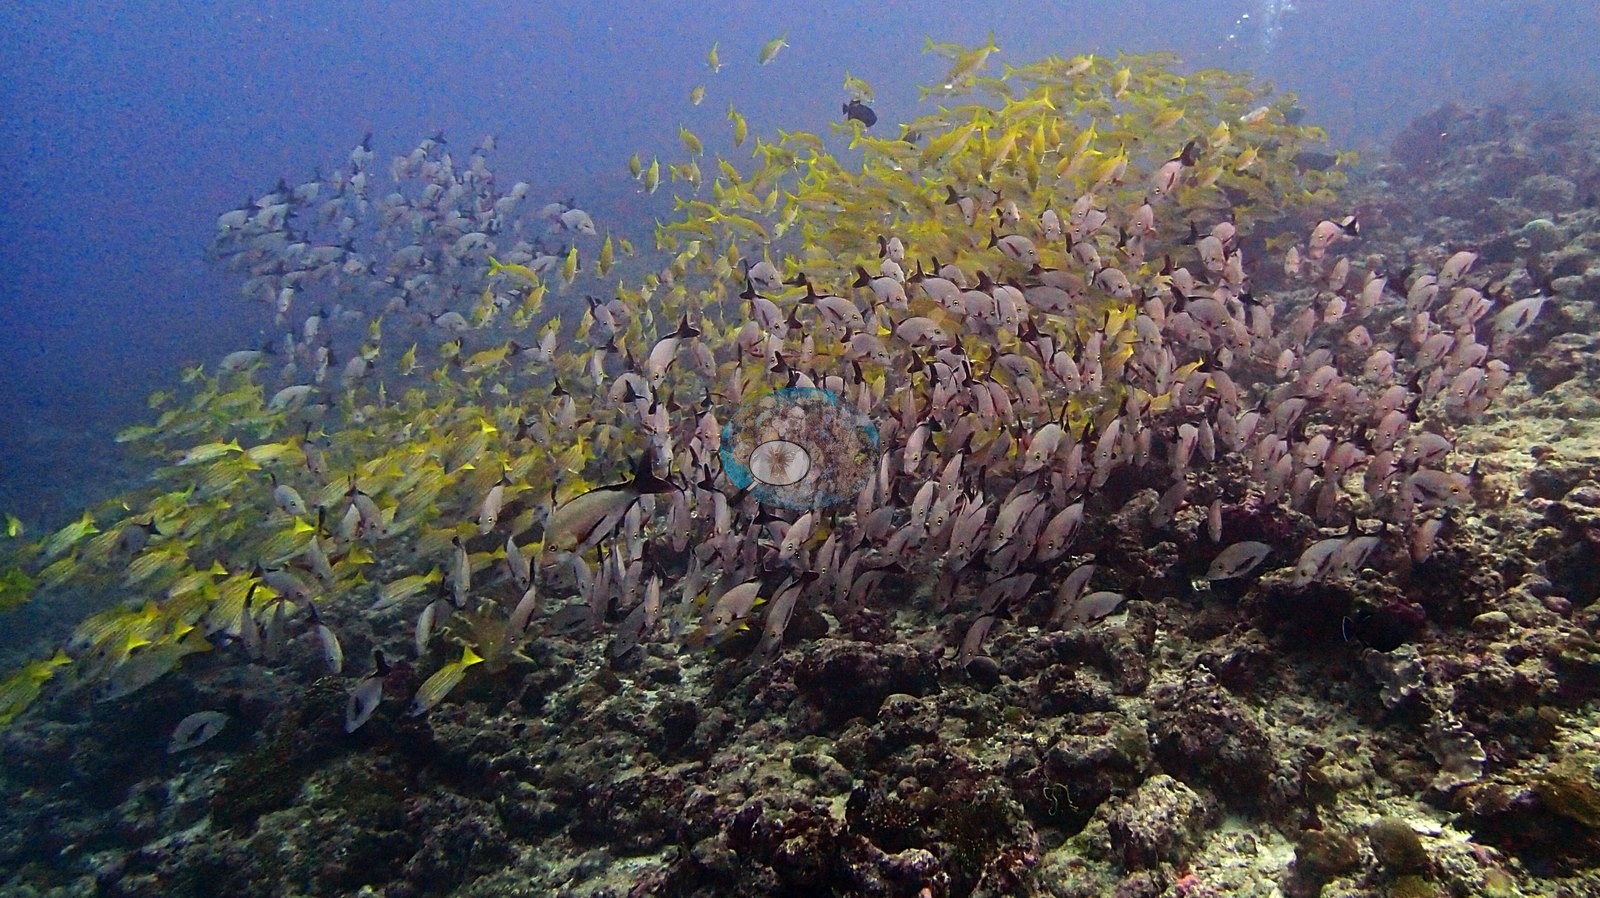
The main event is a single, staggering school of bluestripe snapper — a solid yellow river that parts around divers and reforms behind them, stacking into glowing walls over the channel floor (e.g., Image 3, Image 6, Image 10, Image 11, Image 12, Image 13).
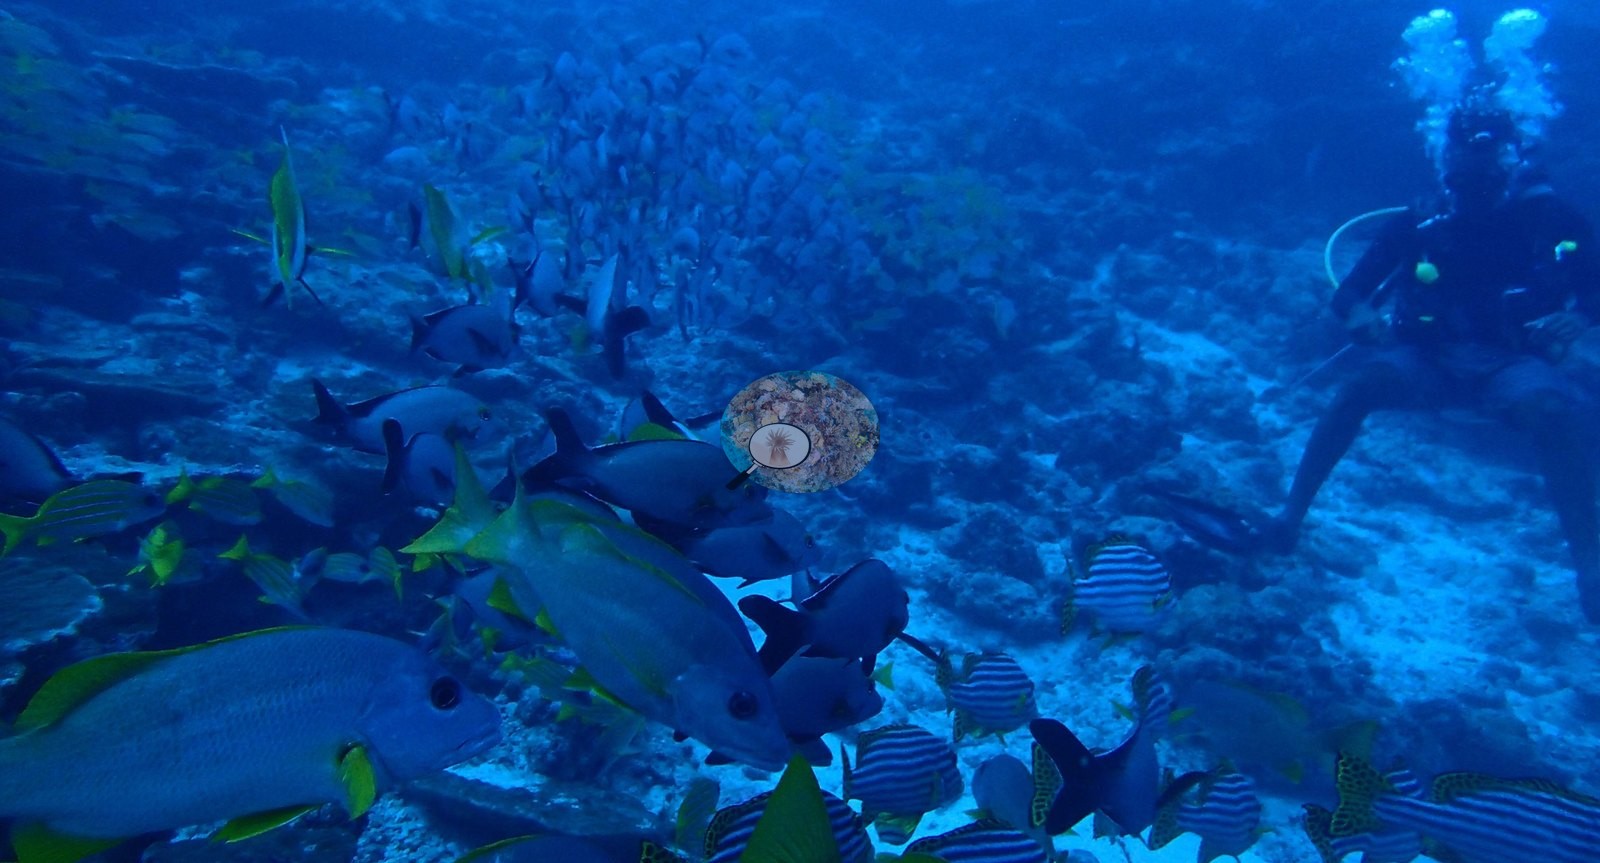
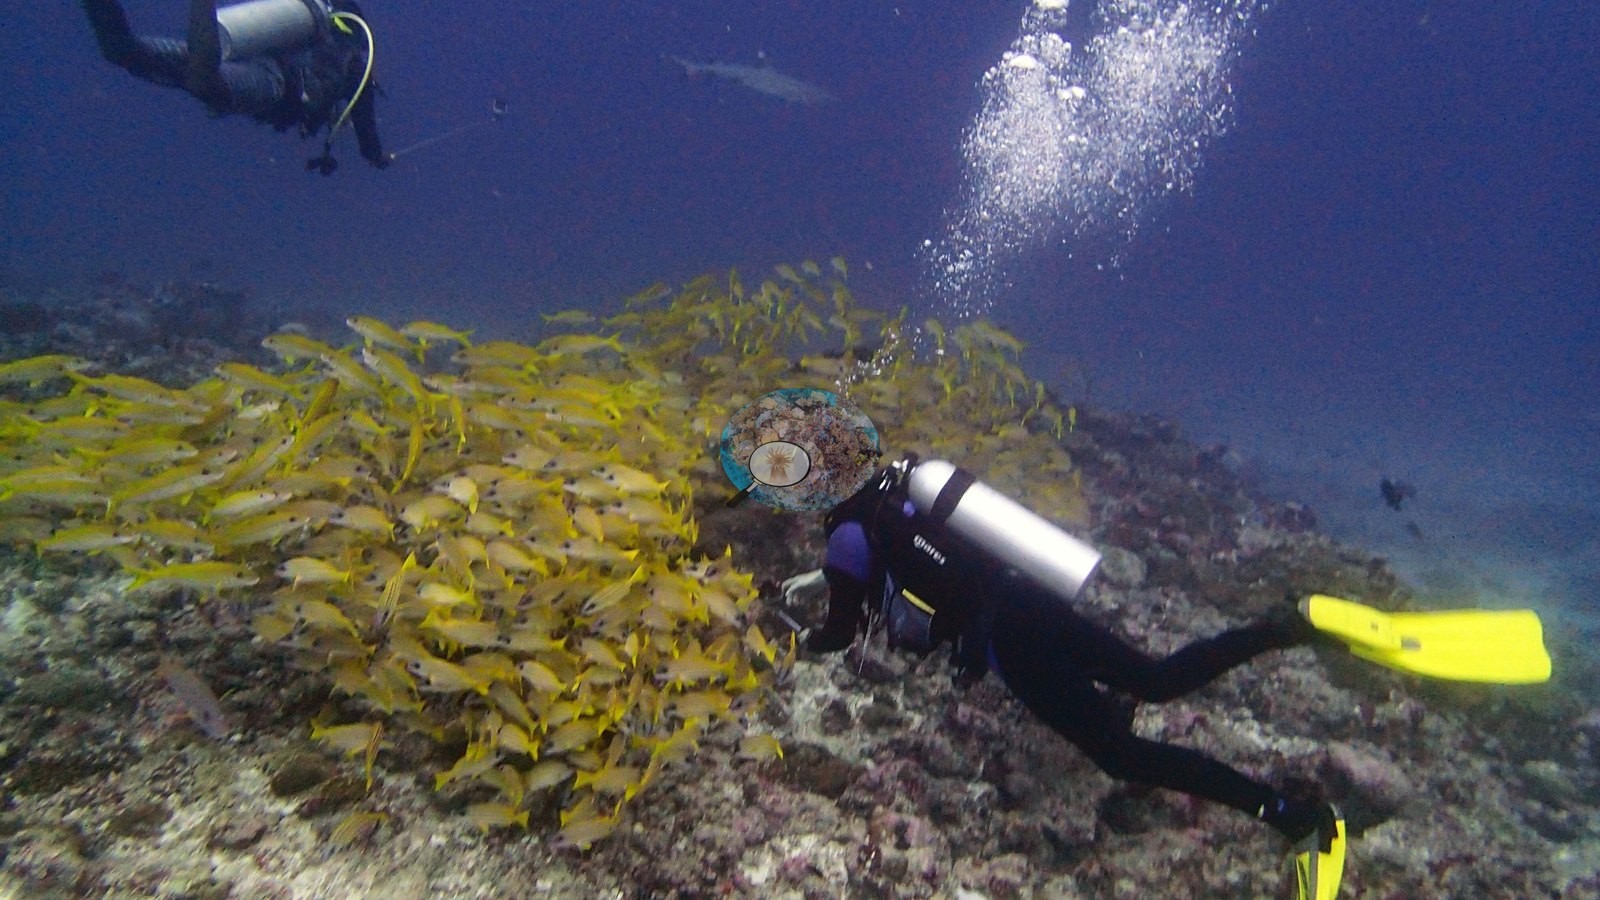
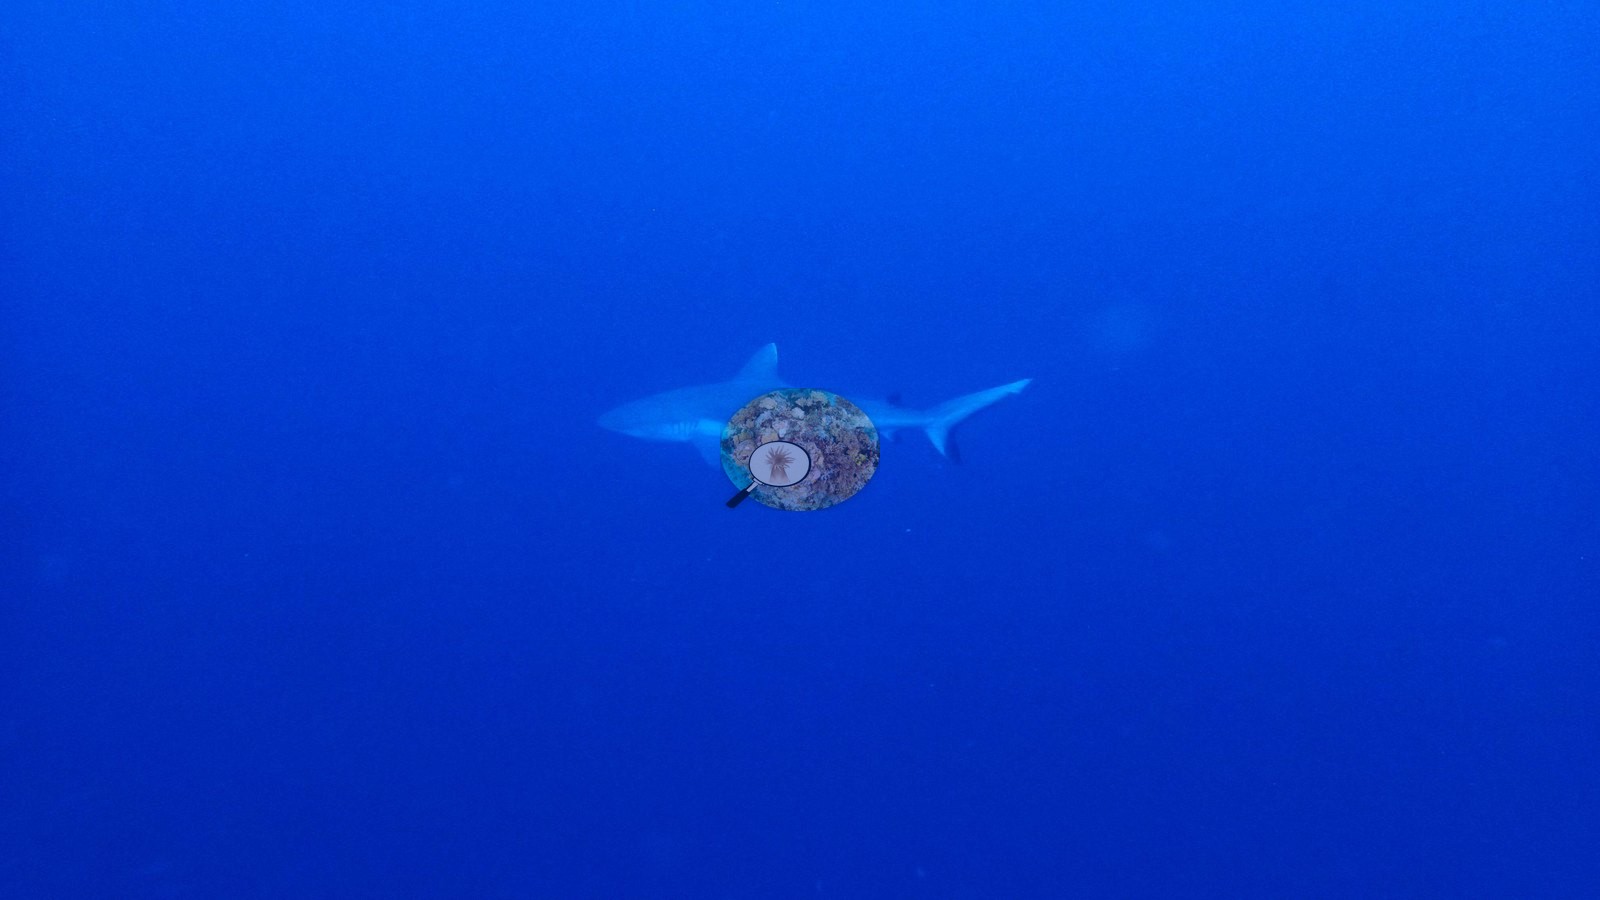
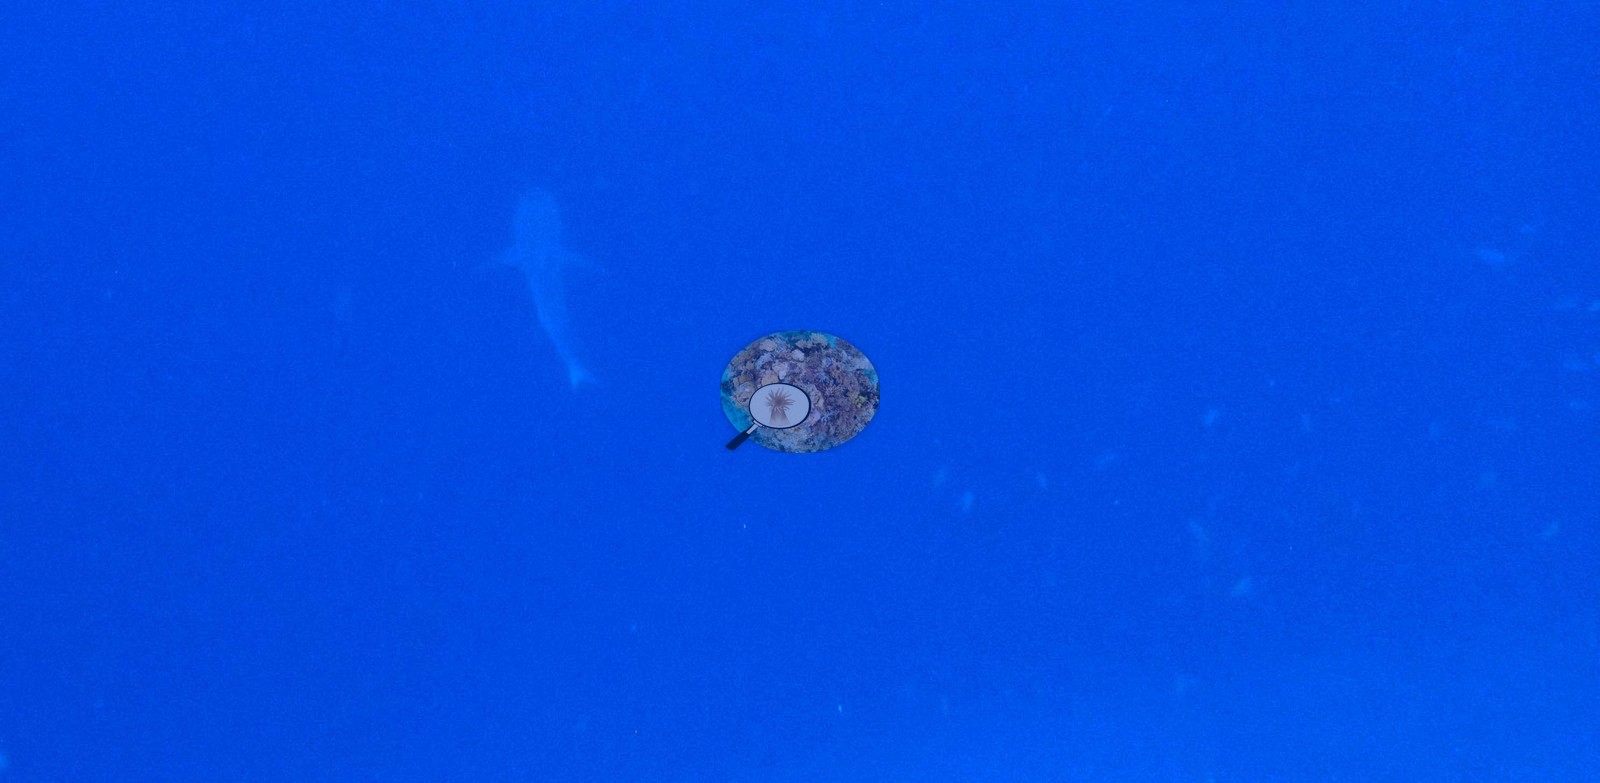
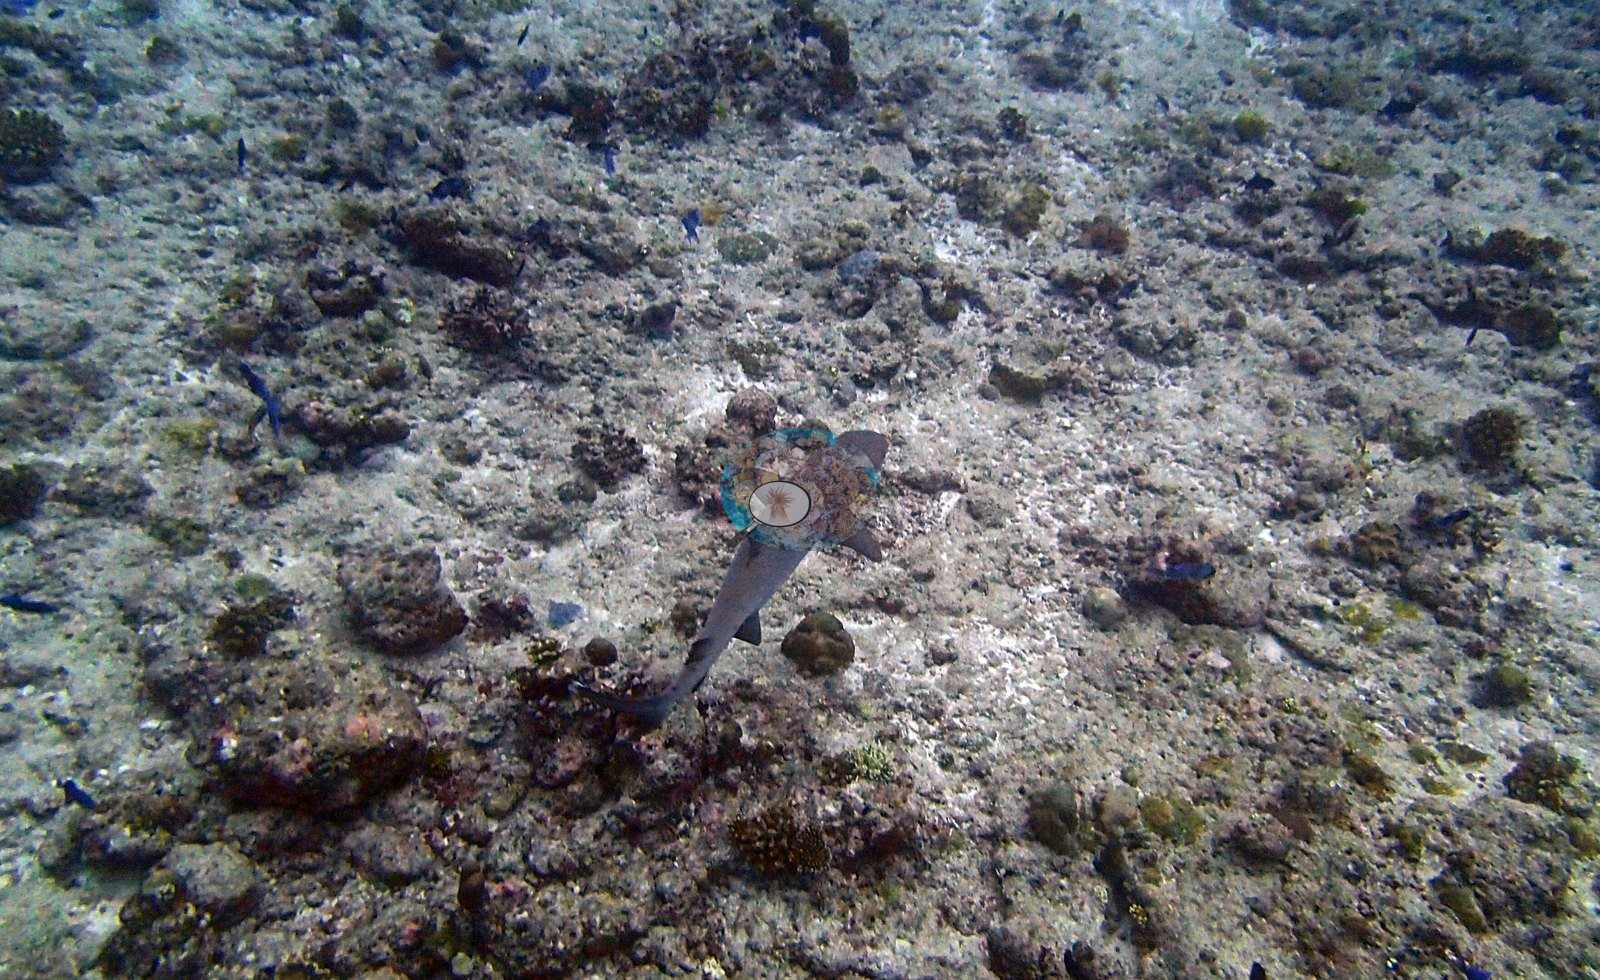
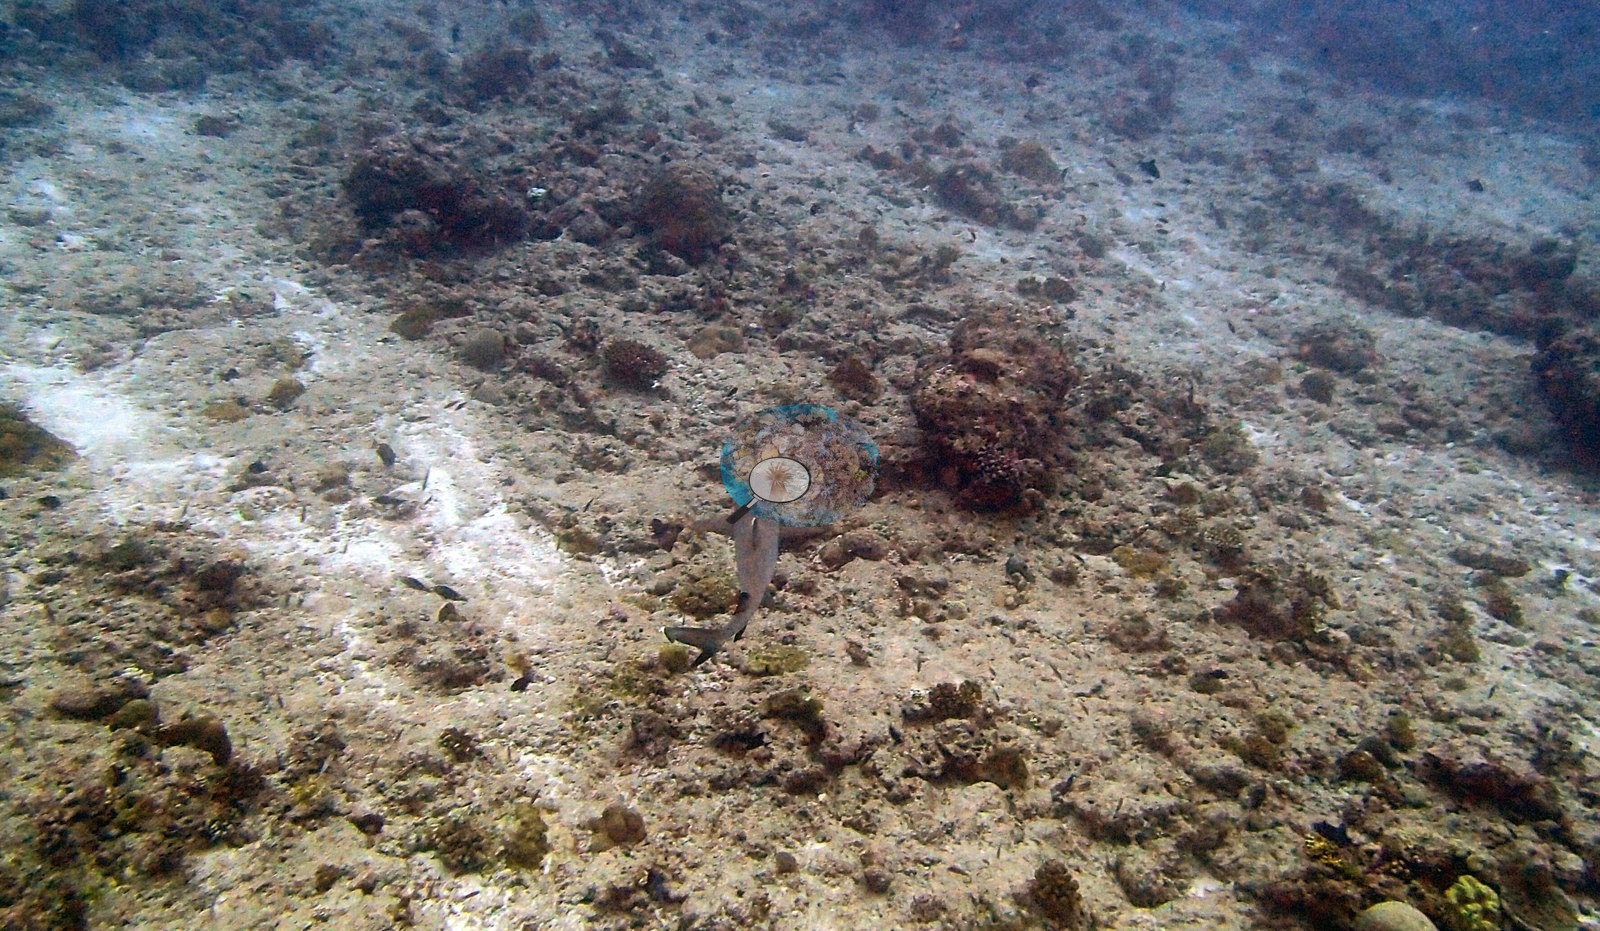
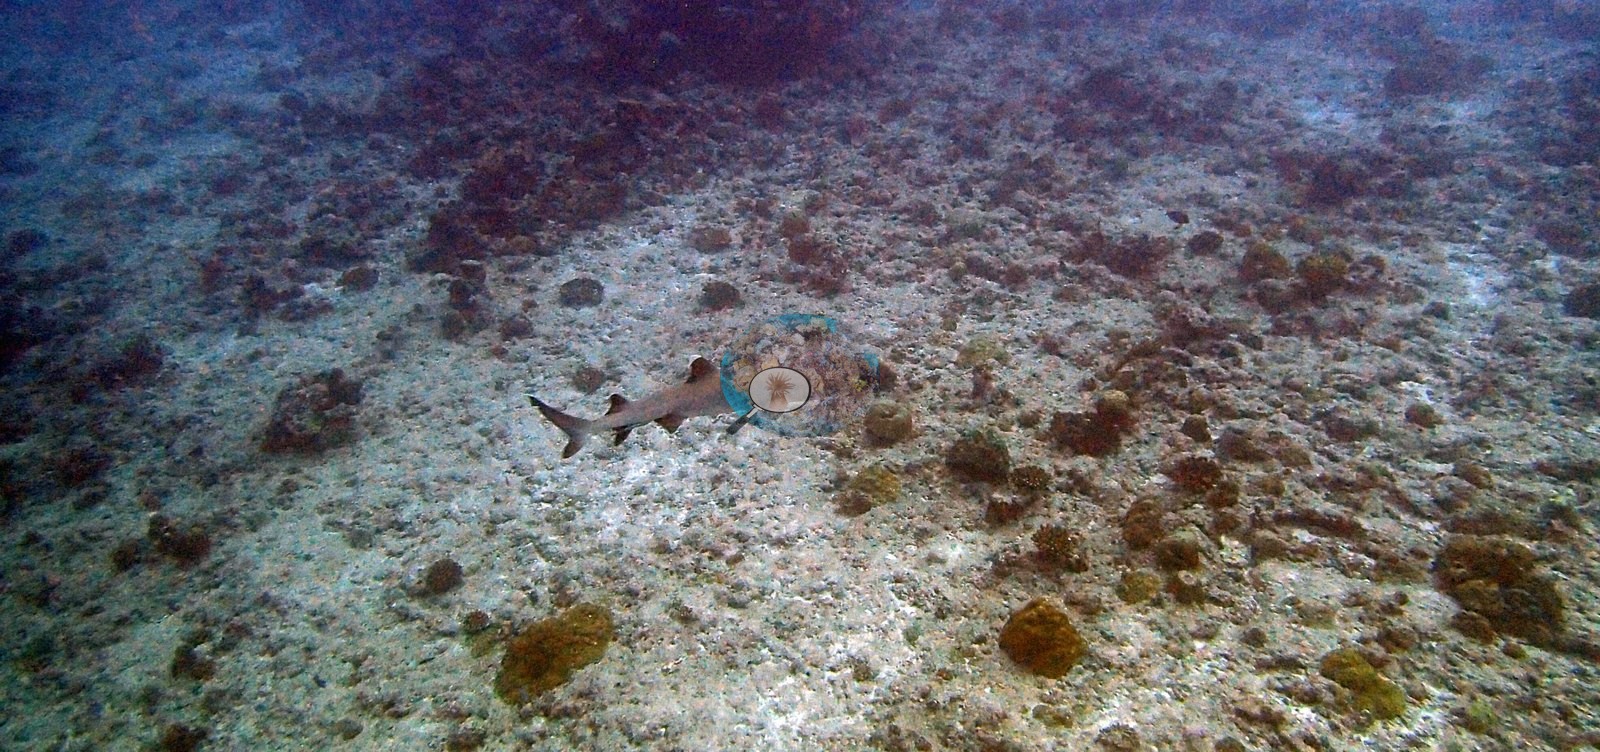
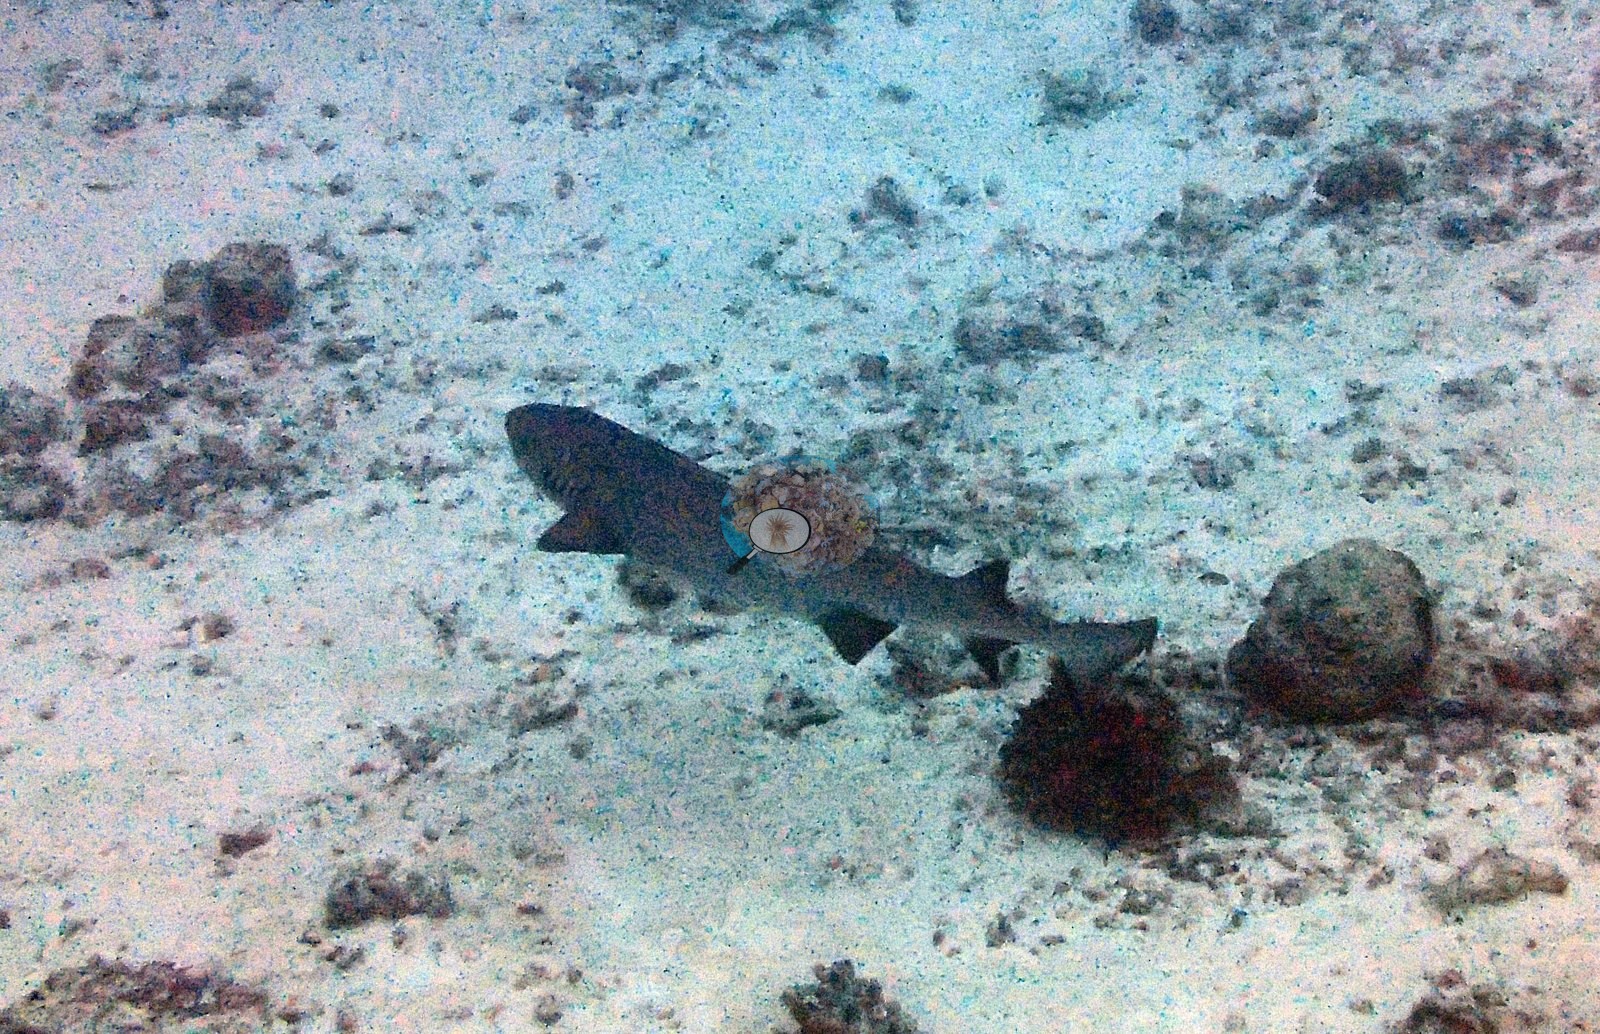
Oriental sweetlips in piano-key stripes hold court on old coral tables, silver snapper clouds drift overhead, and the channel's enforcers make their rounds: a gray reef shark knifing through the blue, pale whitetip-type sharks hugging the pavement, and a nurse shark slumped on the sand like it worked the night shift (e.g., Image 4, Image 5, Image 14, Image 2, Image 20, Image 21, Image 22, Image 9).
Comparisons with other data
No independent survey was made at this exact site; the nearest ones are listed in the table below.
CV model comparison
More info
As of September 2026 no computer-vision method estimates coral cover accurately on new images, so treat this as indicative rather than a measurement; it is revised as the methods improve.More info
The published figure is the mean of the two methods.| Method | Hard-coral cover (%) |
|---|---|
| In-house DINOv3 | 20.8 |
| CoralSCOP | 10.9 |
| Mean (± SD) | 15.9 ± 7.0 |
| Range | 10.9–20.8 |
Mean ± SD and range are across the computer-vision methods shown.
Independent surveys nearby
| Agency / program | Year(s) | Stations / distance | Link |
|---|---|---|---|
| Montefalcone et al. (2020) | 2017–2019 | 2 stations, 3.45–3.73 km | Records ↓ |
| Reef Check | 2008–2025 | 5 stations, 2.83–3.83 km | Records ↓ |
 Dr. Coral (CRD)
Within 5 km, 7 independent survey stations recorded hard coral cover in 20 surveys between 2008 and 2025. Of the 3 stations surveyed in more than one year, 1 declined and 2 increased between their first and latest surveys. The longest record, Dega Thila (Reef Check, 3.83 km away), went from 14% in 2016 to 4.7% in 2025. Surveys since 2021 average 4.2% (range 3.8–4.7%, n=2). This site's own estimate (16%) sits 11.2 points above the recent range (3.8–4.7%); the methods differ, so the comparison is context, not a like-for-like test.
Collected by other programs using different methods (Reef Check uses point-intercept transects), so these are context for the figures above, not a like-for-like comparison. Where a station was surveyed more than once the range is shown. Station names are not dive-site names. Values marked best patch exceed 70%: surveyors usually chose the richest area, so they are not site means.
| Agency | Site / location | Date | Hard coral cover (%) | Distance | Link |
|---|---|---|---|---|---|
| Reef Check | Dega Giri, Ari Atoll | 2008 | 67% | 3.74 km | — |
| Reef Check | Dega Giri | 2008 | 16% | 3.75 km | — |
| Reef Check | Dega Thila | 2016–2025 | 3.8–35% (10 surveys) | 3.83 km | — |
| Montefalcone et al. (2020) | Maavaru Faru Beyru | 2017–2019 | 53–71% (2 surveys) best patch | 3.45 km | HeatCRD database |
| Montefalcone et al. (2020) | Maavaru Faru Etheru | 2017–2019 | 7.3–13% (2 surveys) | 3.73 km | HeatCRD database |
| Reef Check | Maavaru Faru beyru | 2019 | 40% (2 surveys) | 2.83 km | — |
| Reef Check | Maavaru Faru etere | 2019 | 16% (2 surveys) | 3.30 km | — |
Data & links
All images from Coral Reef Diagnostics. Data are from Coral Reef Diagnostics and the organizations named in the data-sources table above.
© Coral Reef Diagnostics.