
Maldives - Big Sand Bank

Part of the regional summaries: Maldives - Central (Male Atolls / Ari / Vaavu) and Maldives
2017-05-18
More info
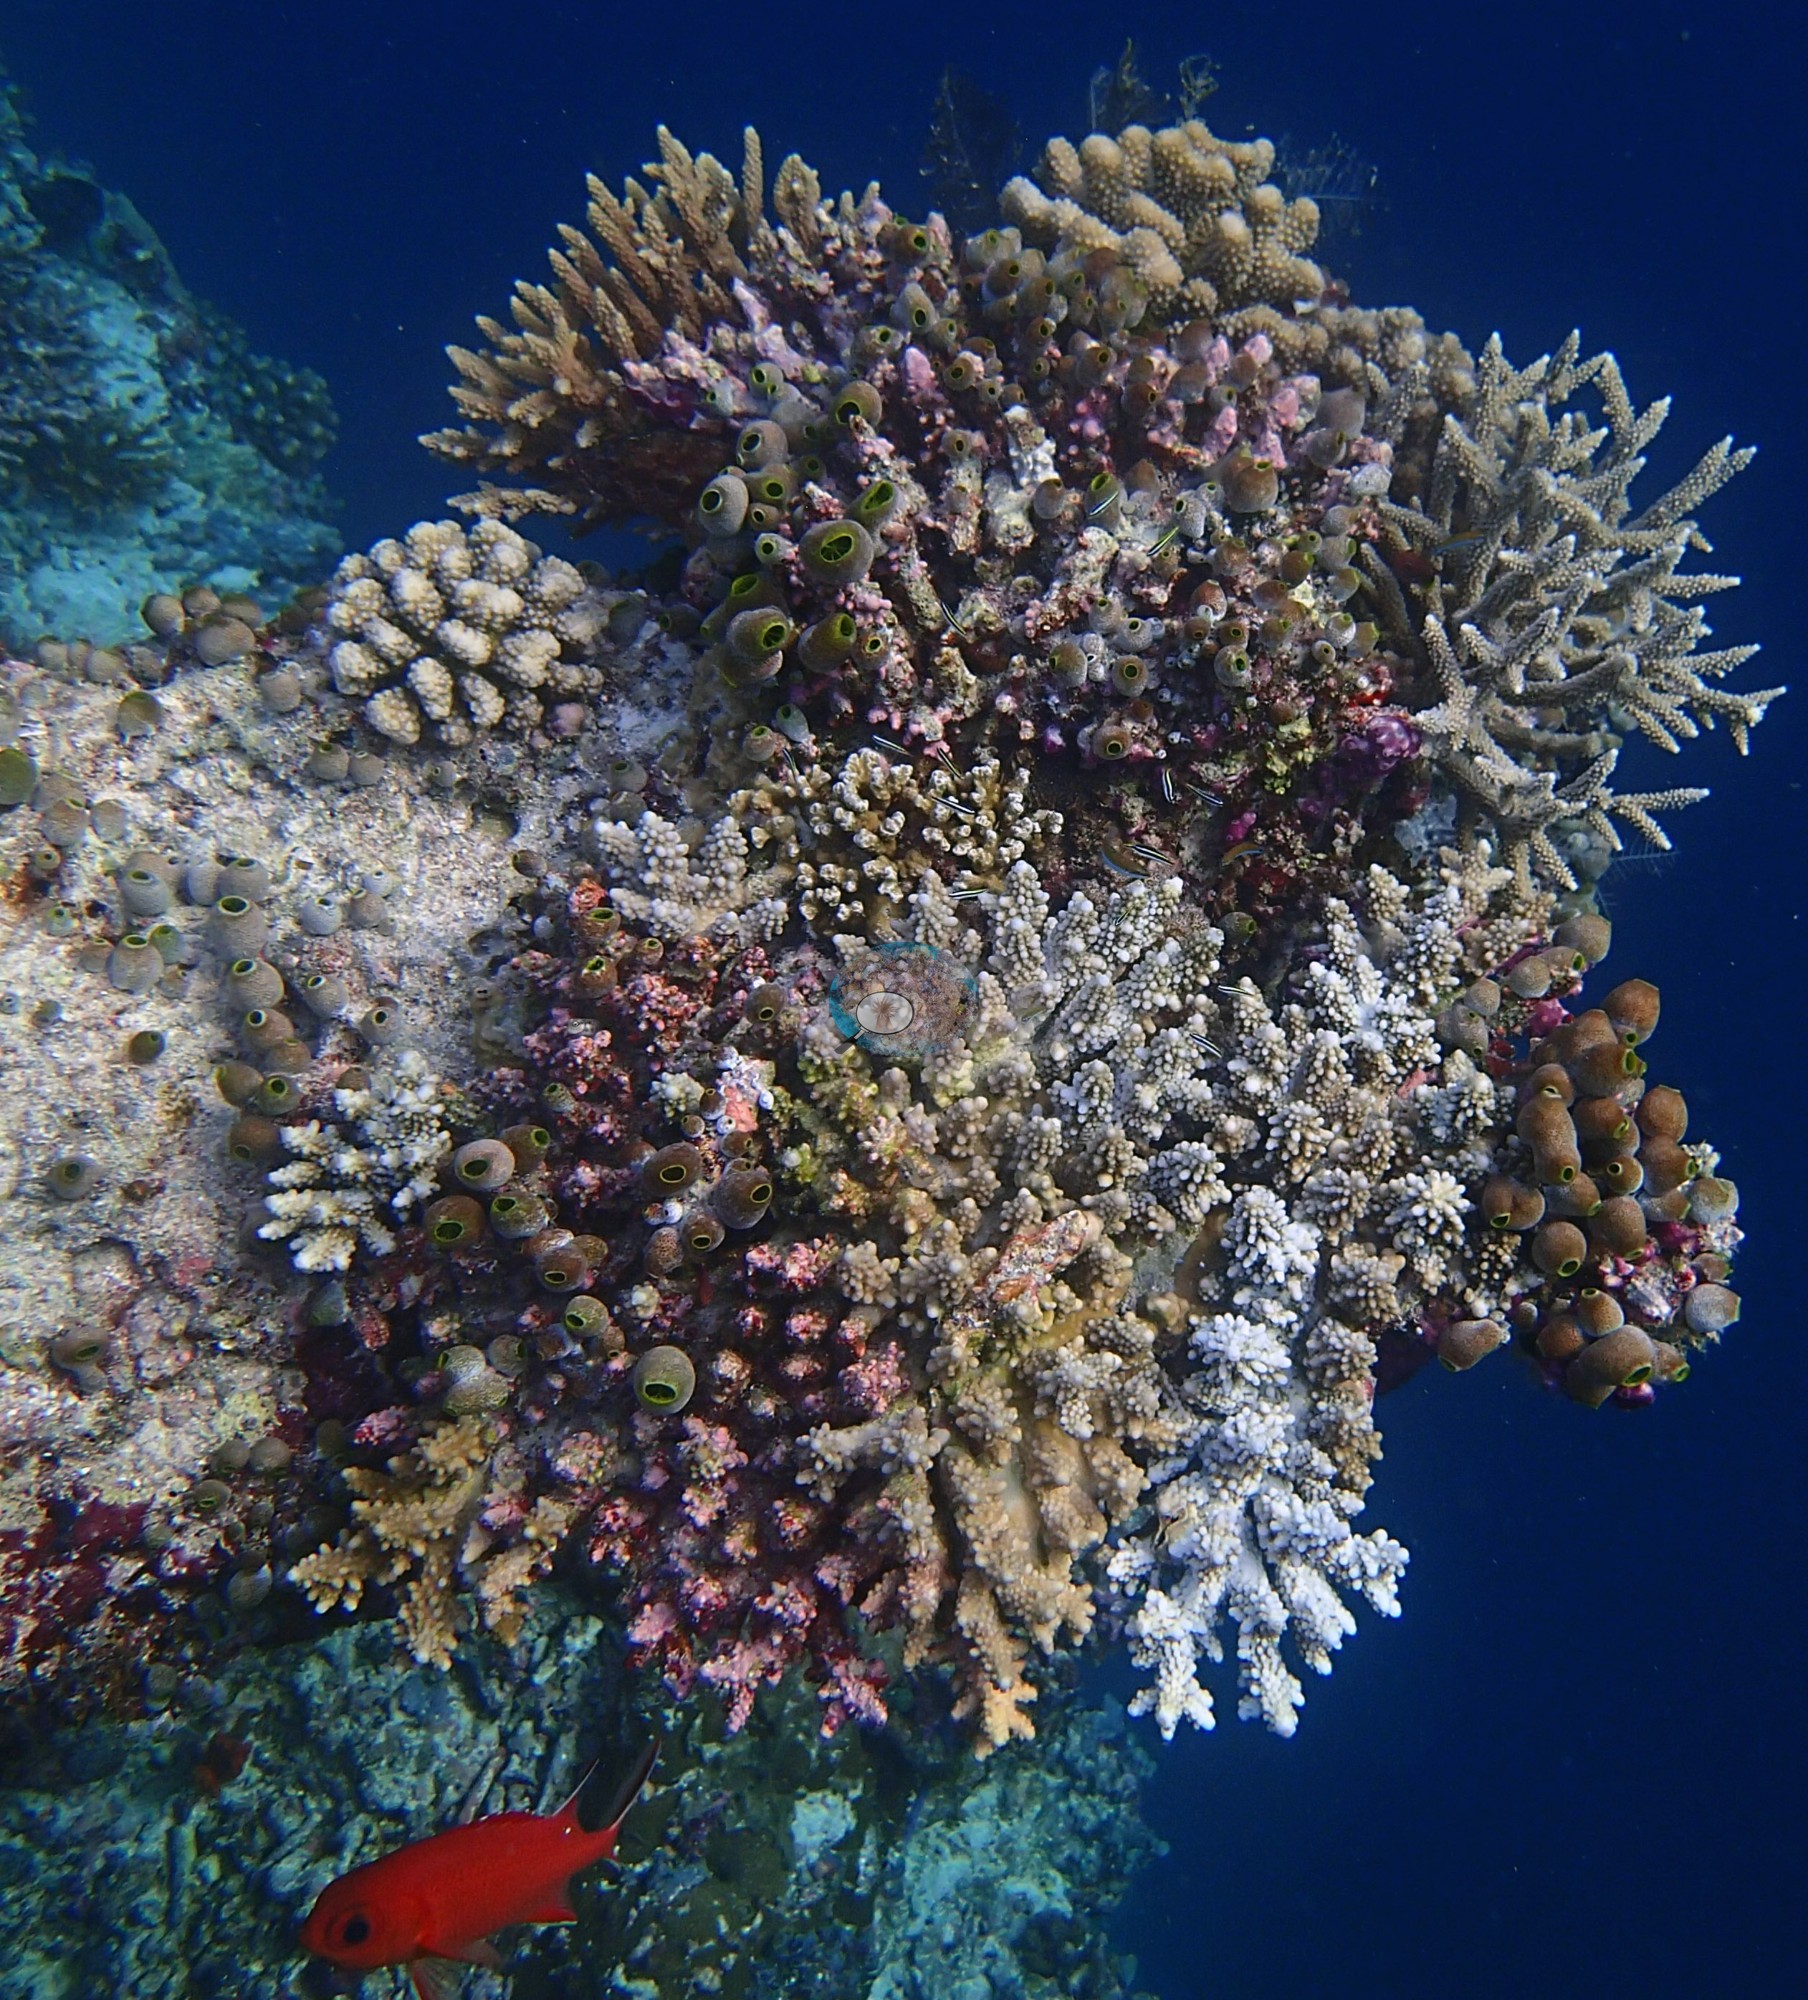
Maldives (NOAA CRW virtual station) · Maldives ecoregion mean=2.9°C-heating weeksBig Sand Bank hides a canyon maze of sponge- and soft-coral-draped swim-throughs beneath sunlit staghorn and tabletop terraces, photographed in January 2016 just months before the regional bleaching event. A May 2017 revisit found the site's tagged long-term monitoring colonies largely dead. Computer vision cover estimate is 15.8-19.6%, averaging 17.7%.
Three independent survey stations shown with the program’s logo — click one to see how far it is from this site.
Seven other CRD dive sites within 5 km shown in orange — click a marker to open its page.
7 of these 25 photographs are shown beside the text that discusses them under "Site description" below.
Site description
Setting
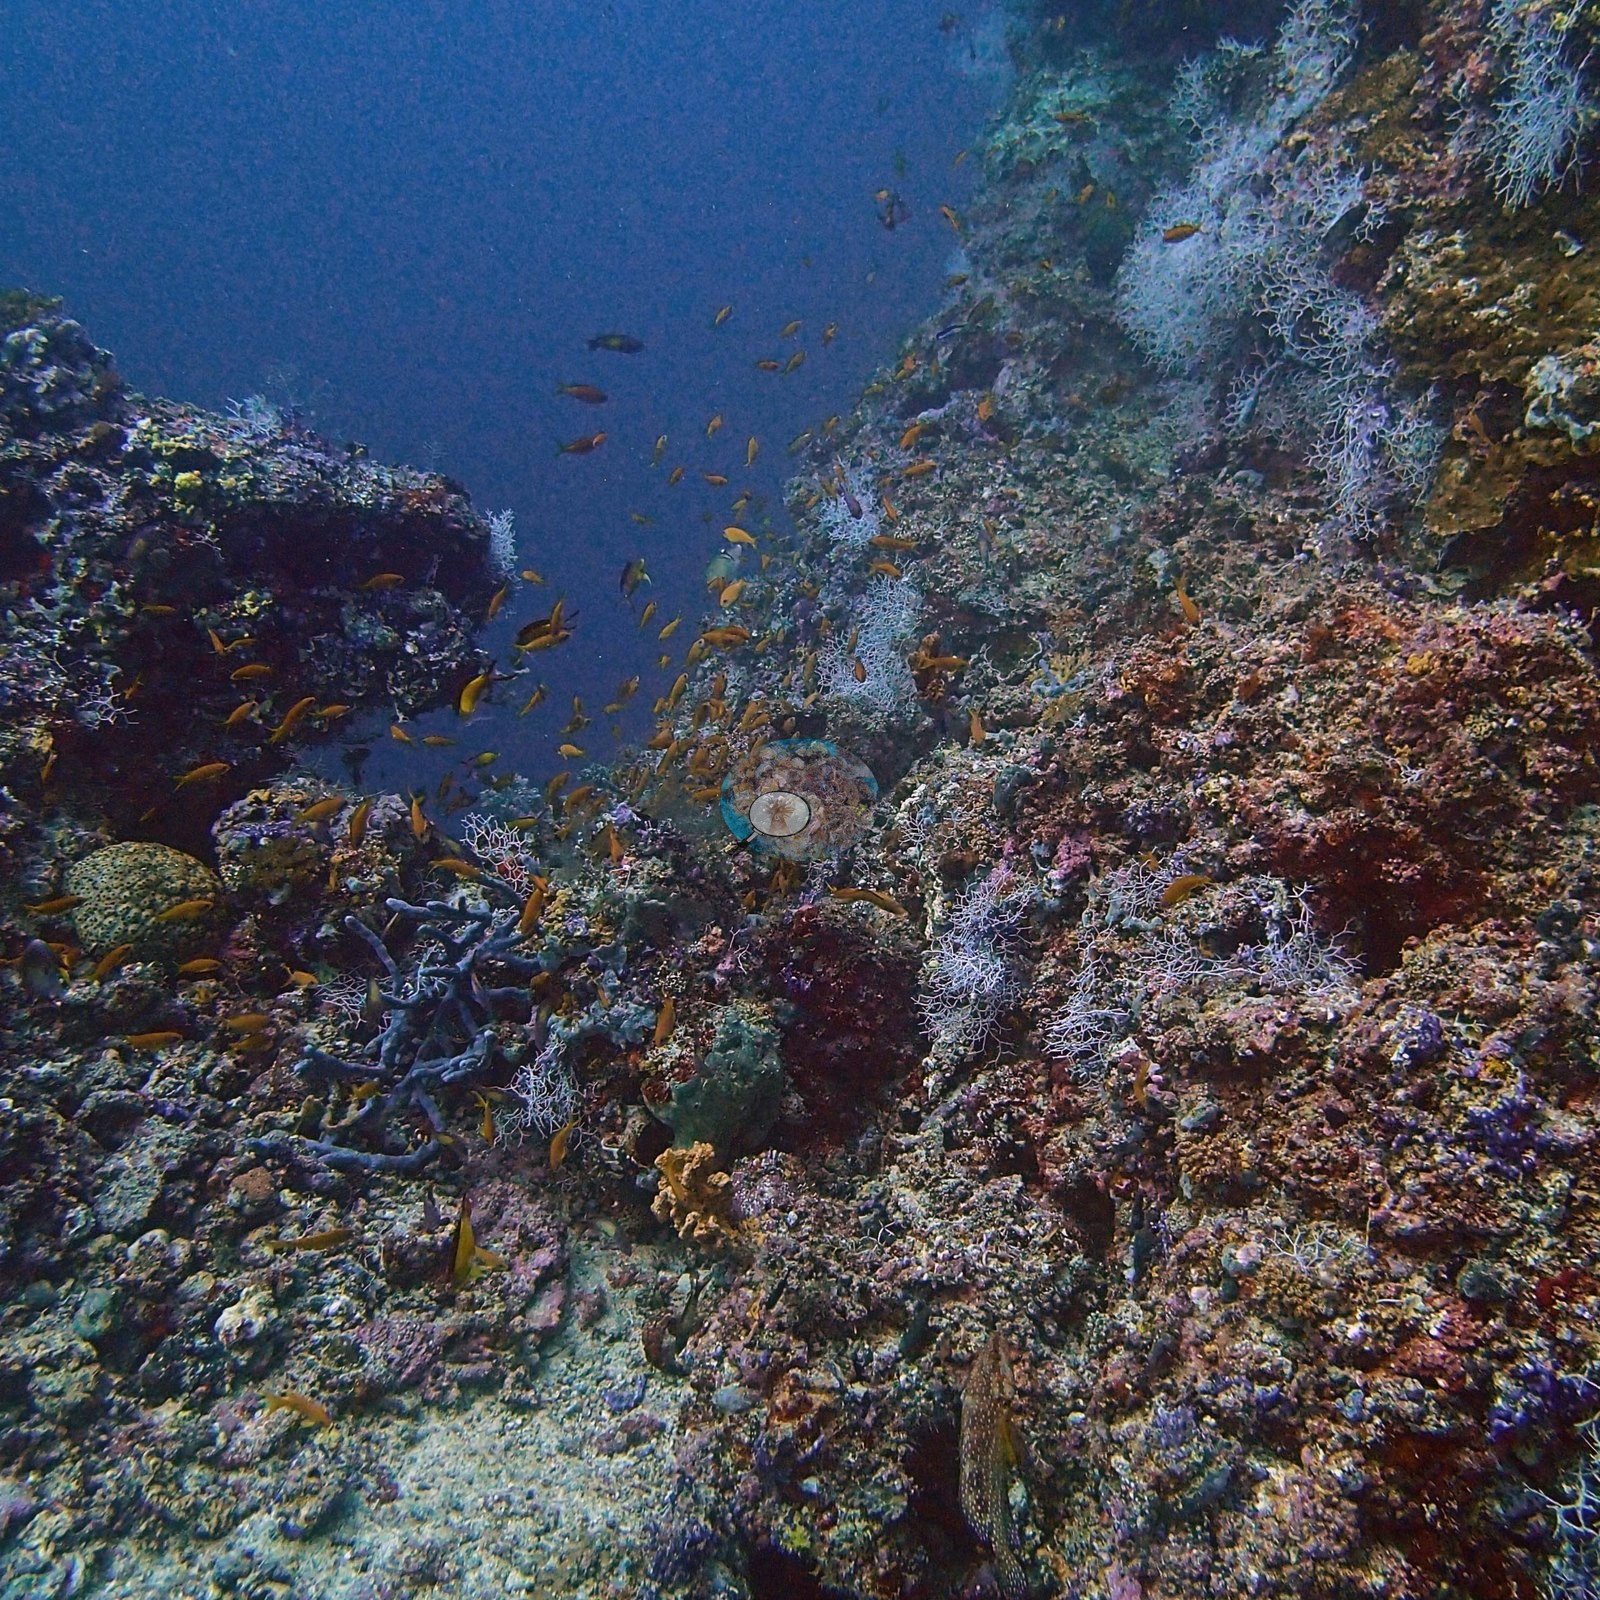
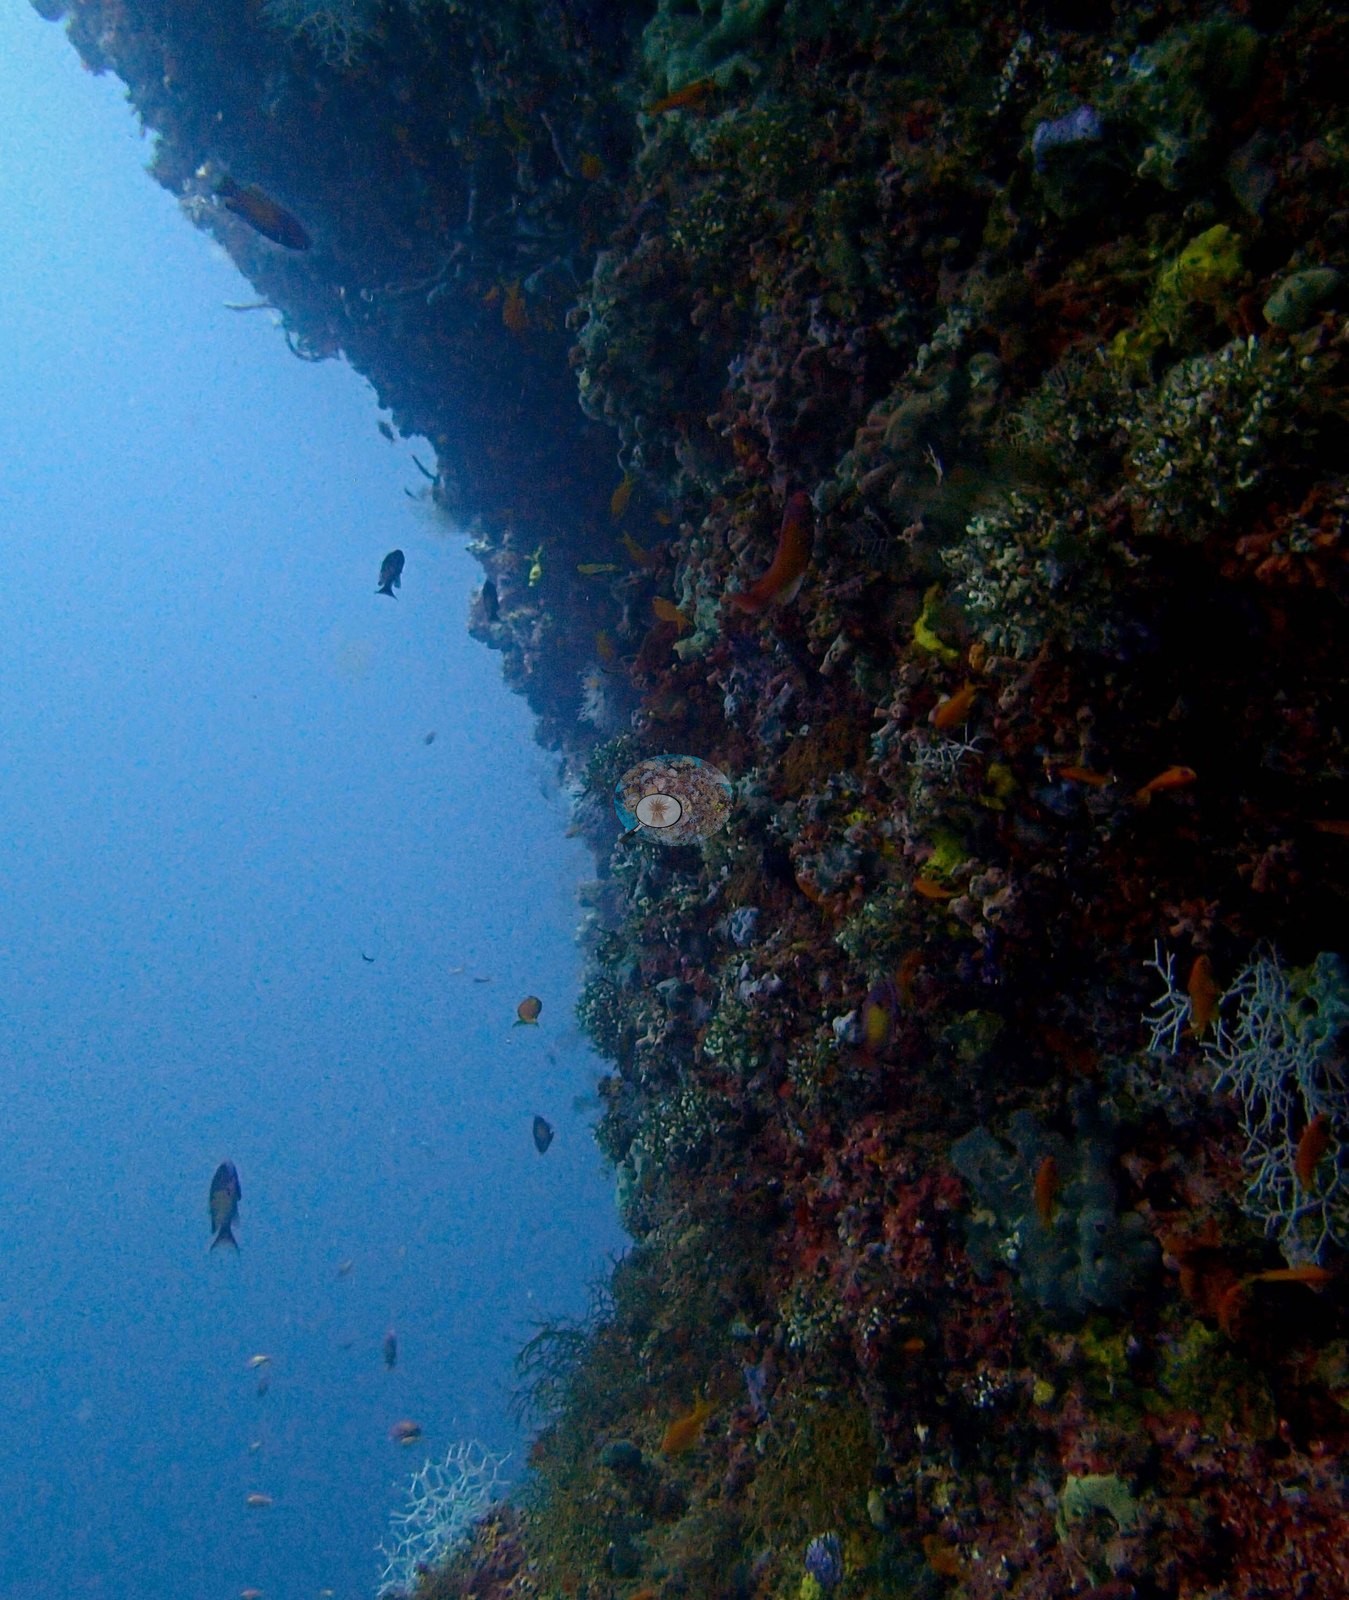
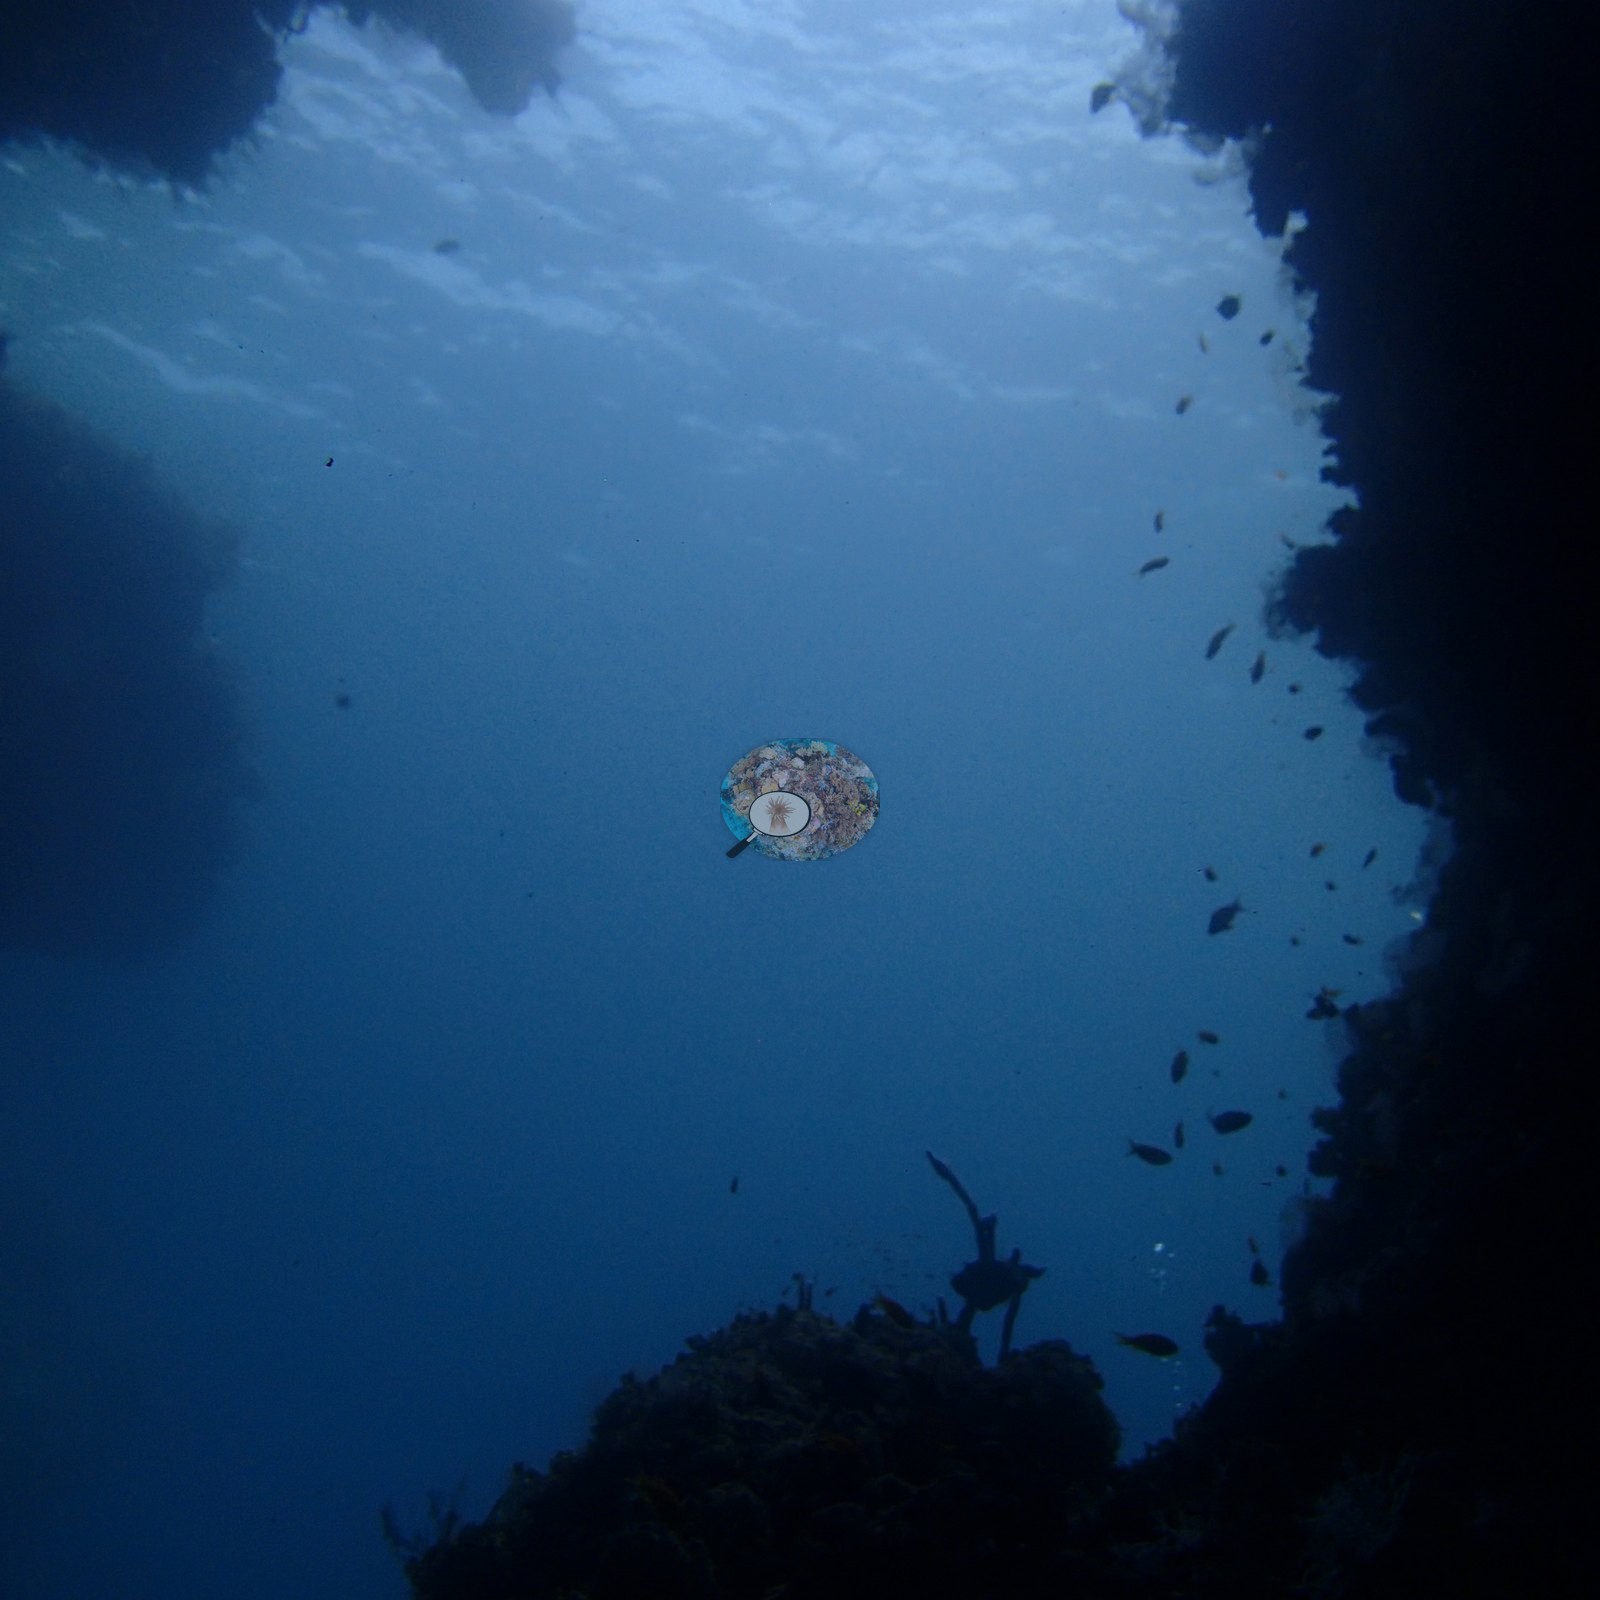
Big Sand Bank hides a secret beneath its sunny name: a maze of canyons and swim-throughs where sheer walls squeeze the light into pale blue keyholes overhead (e.g., Image 5).
General benthic features
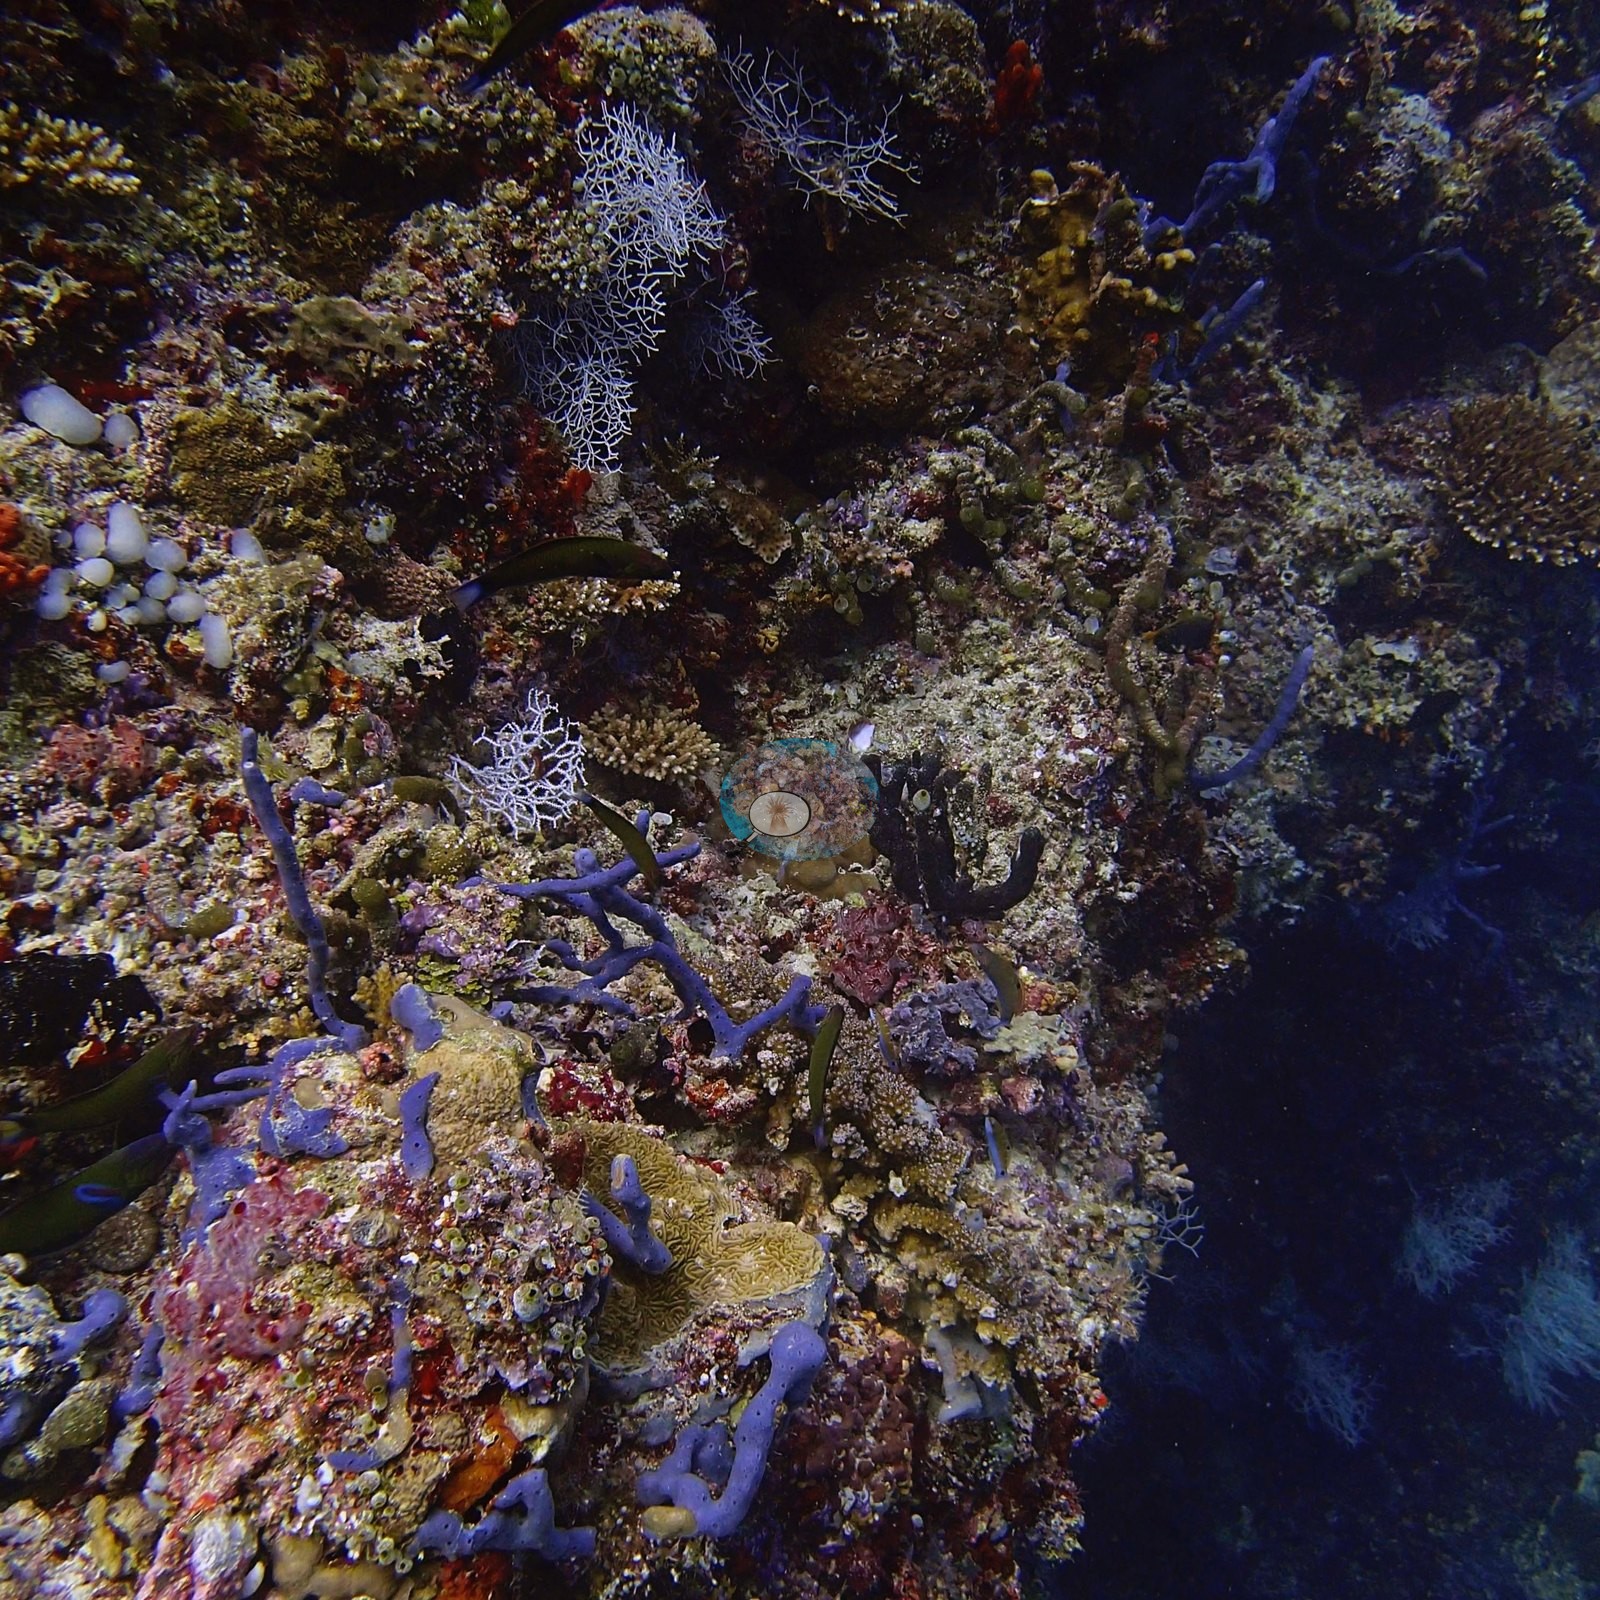
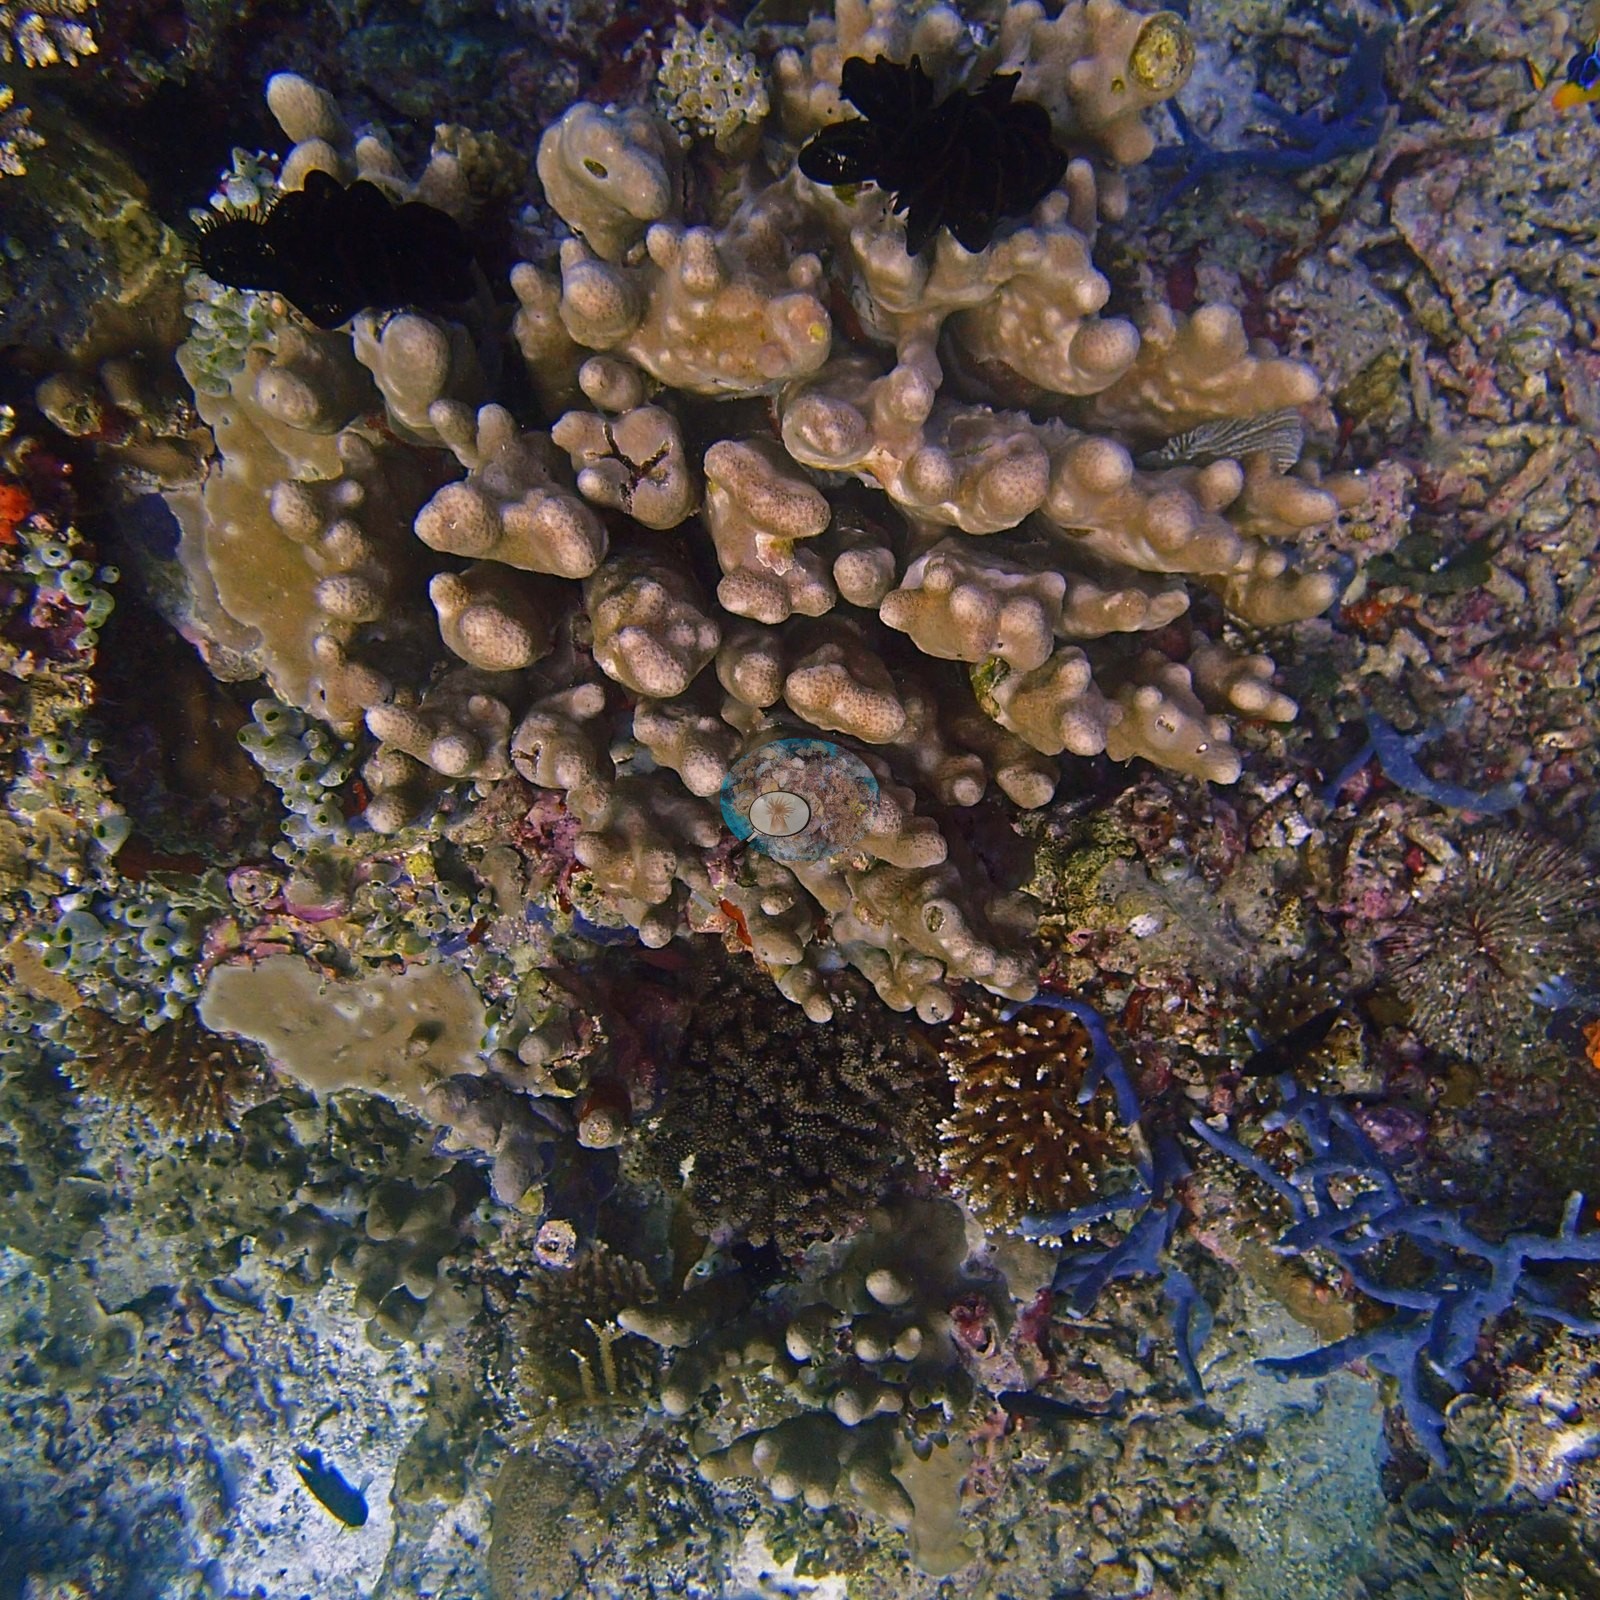
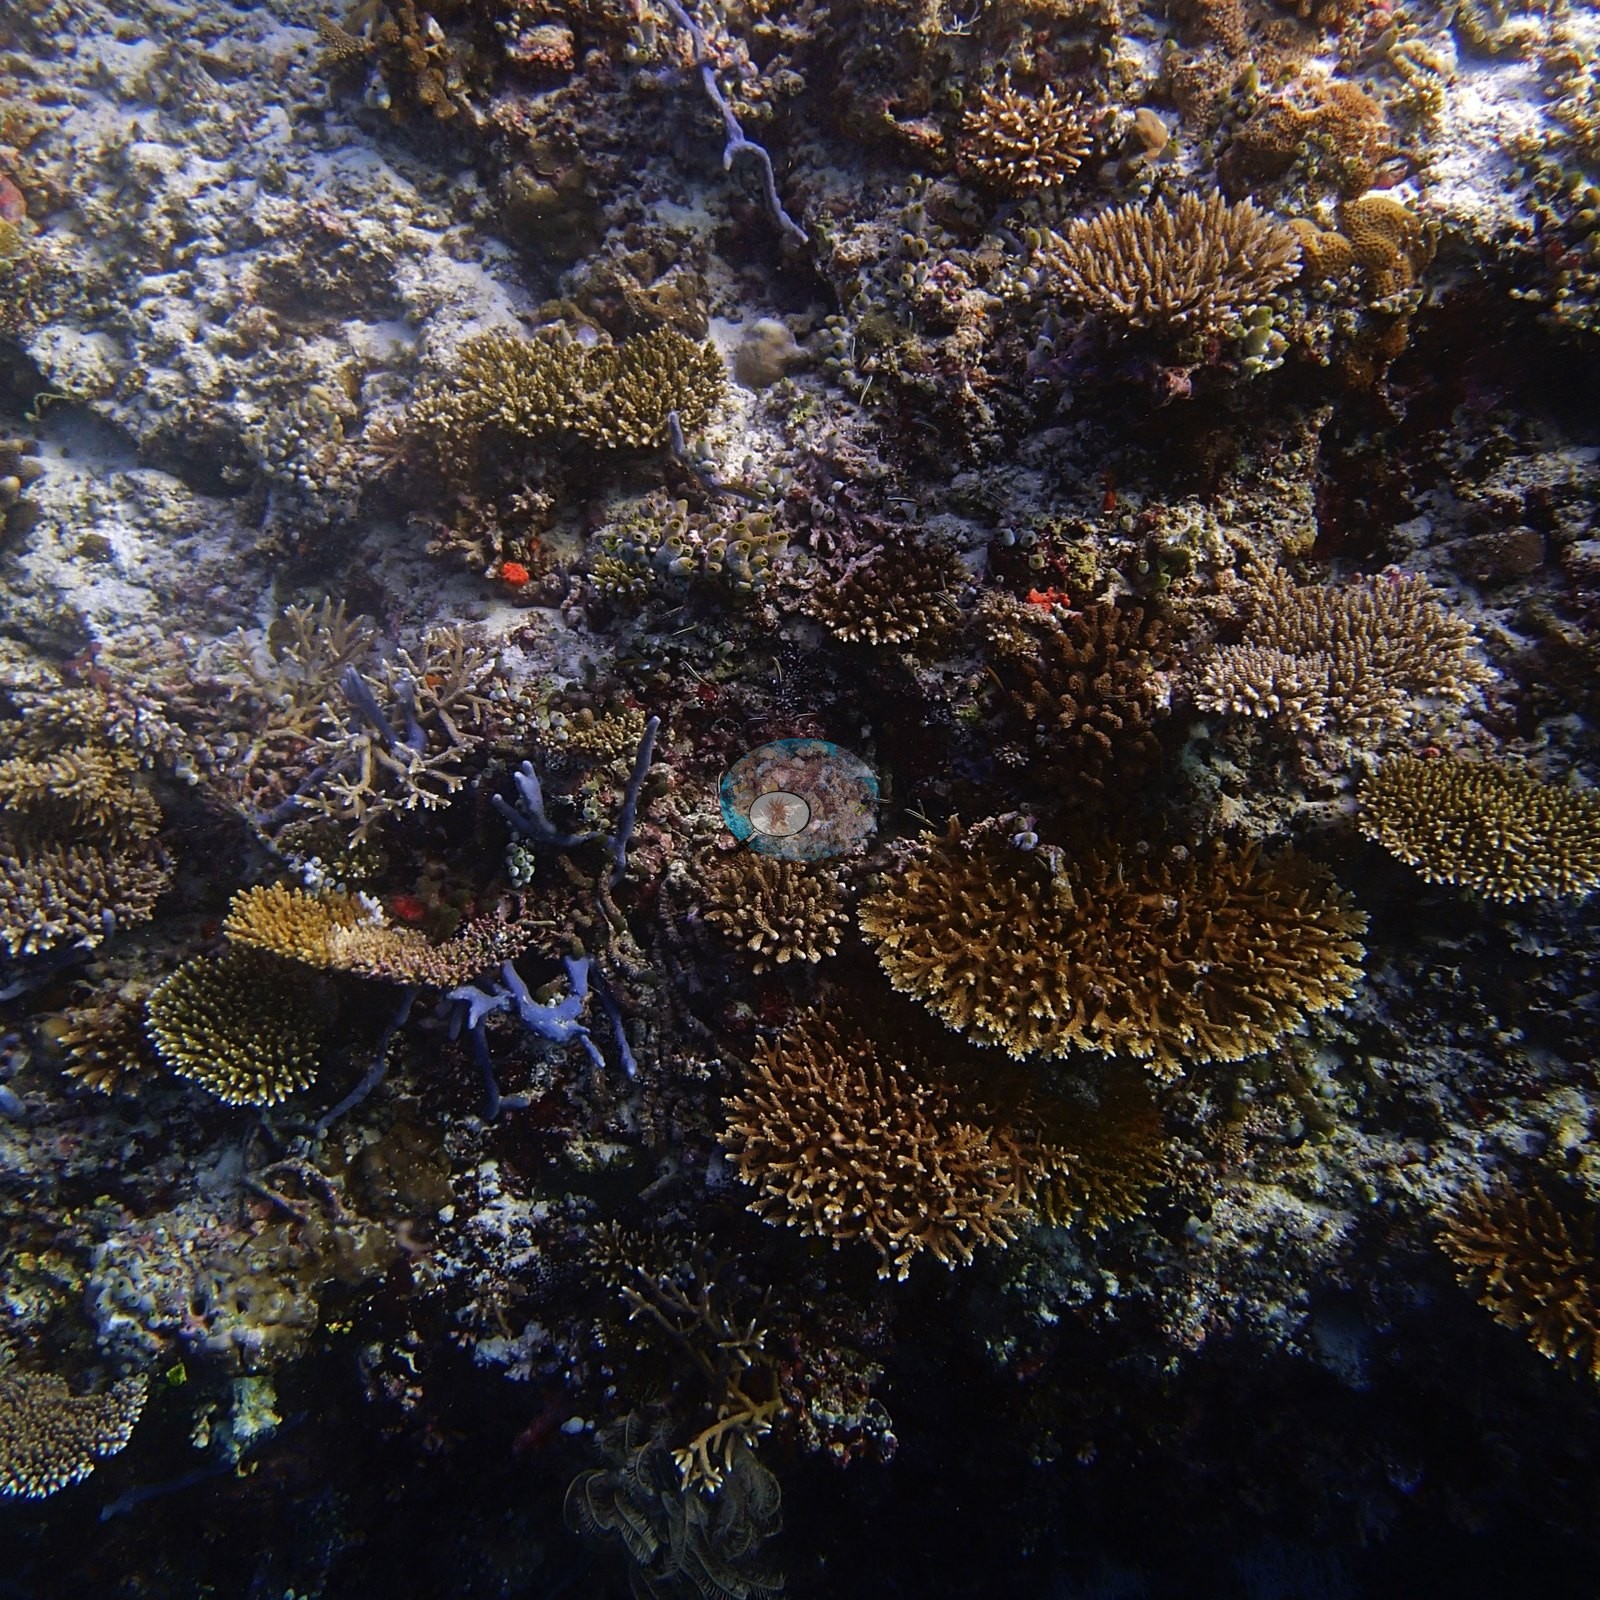
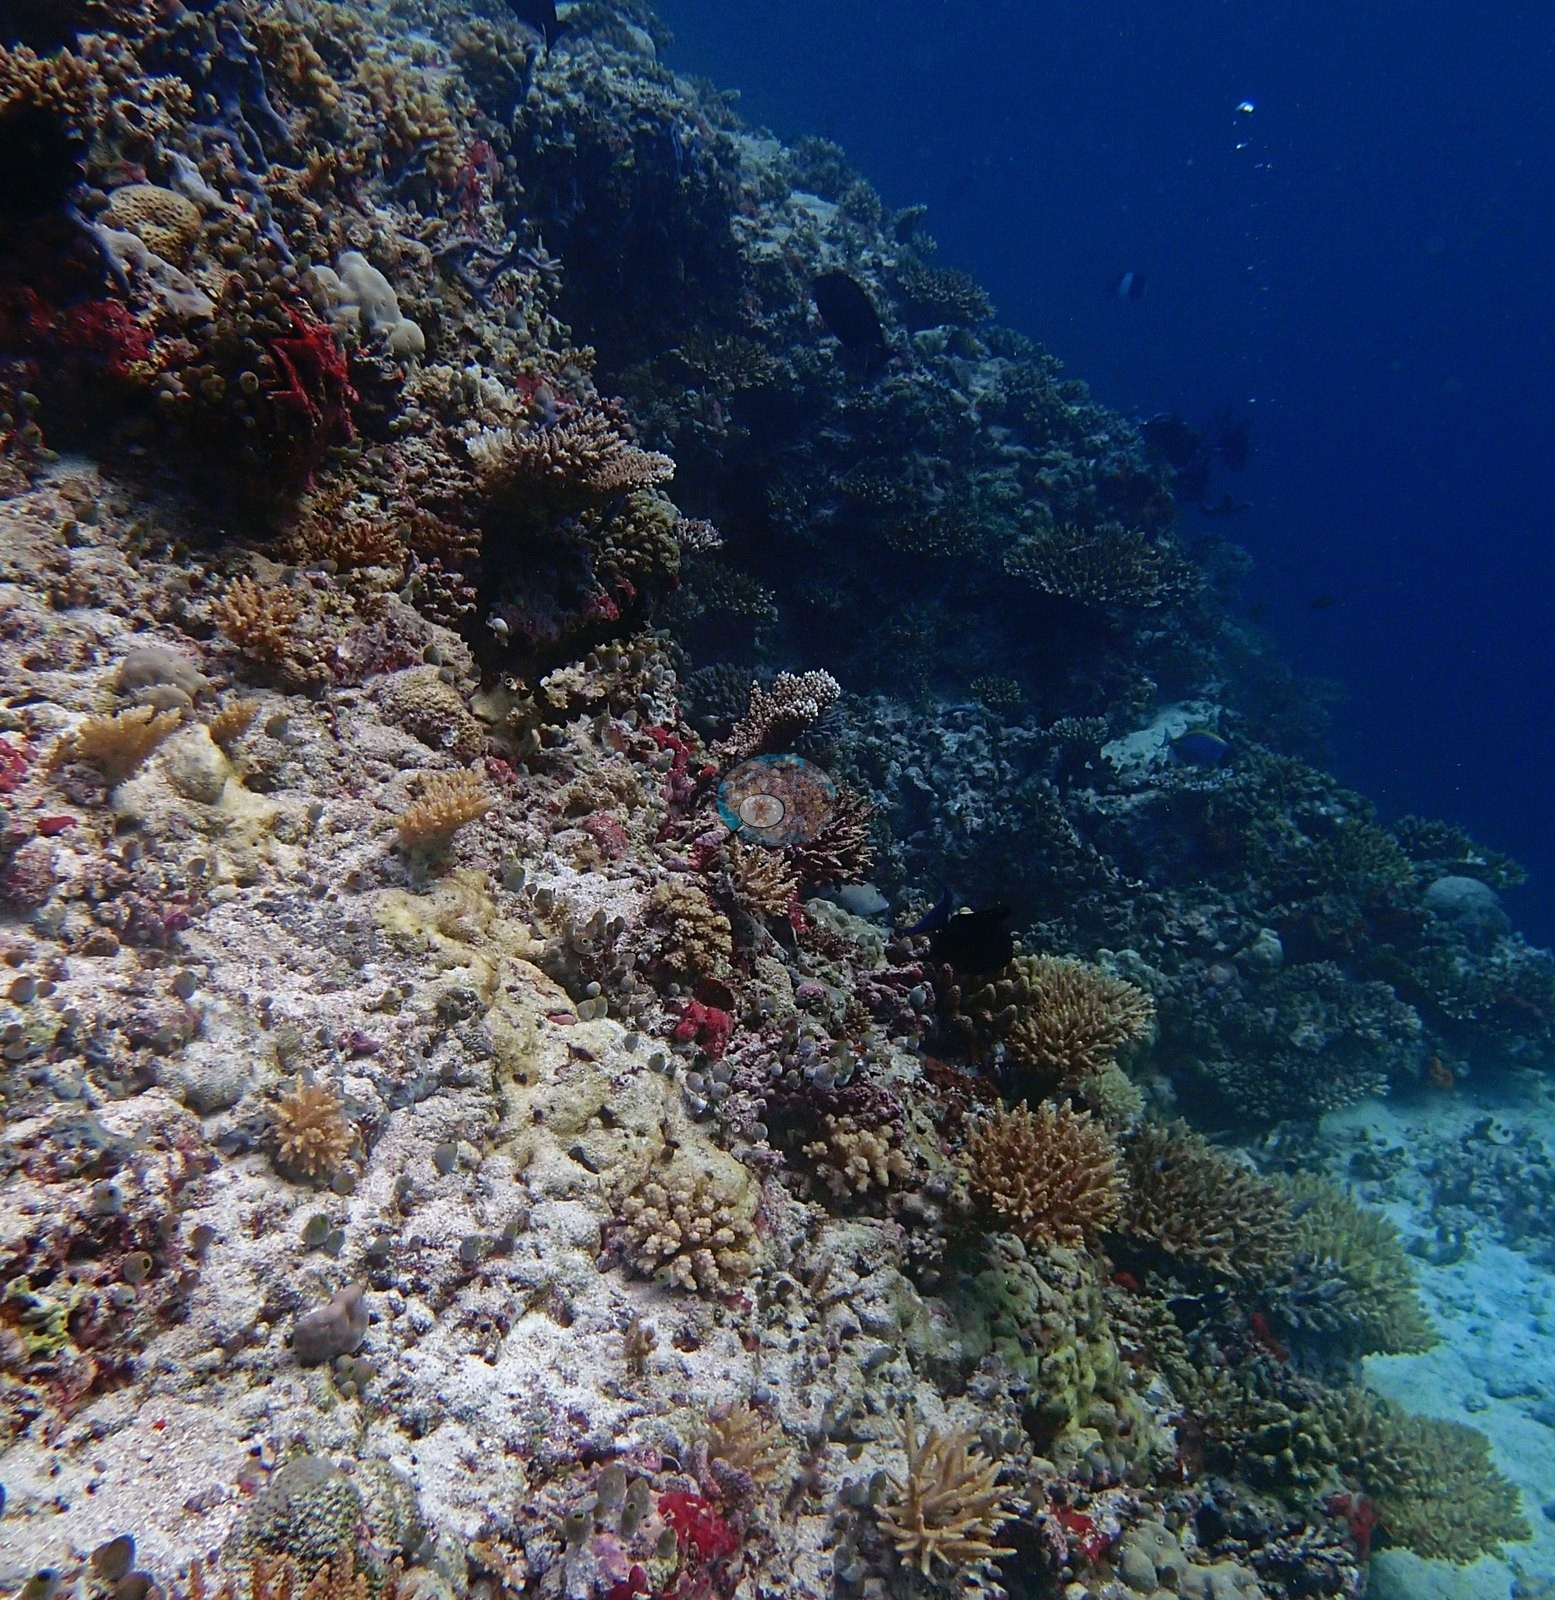
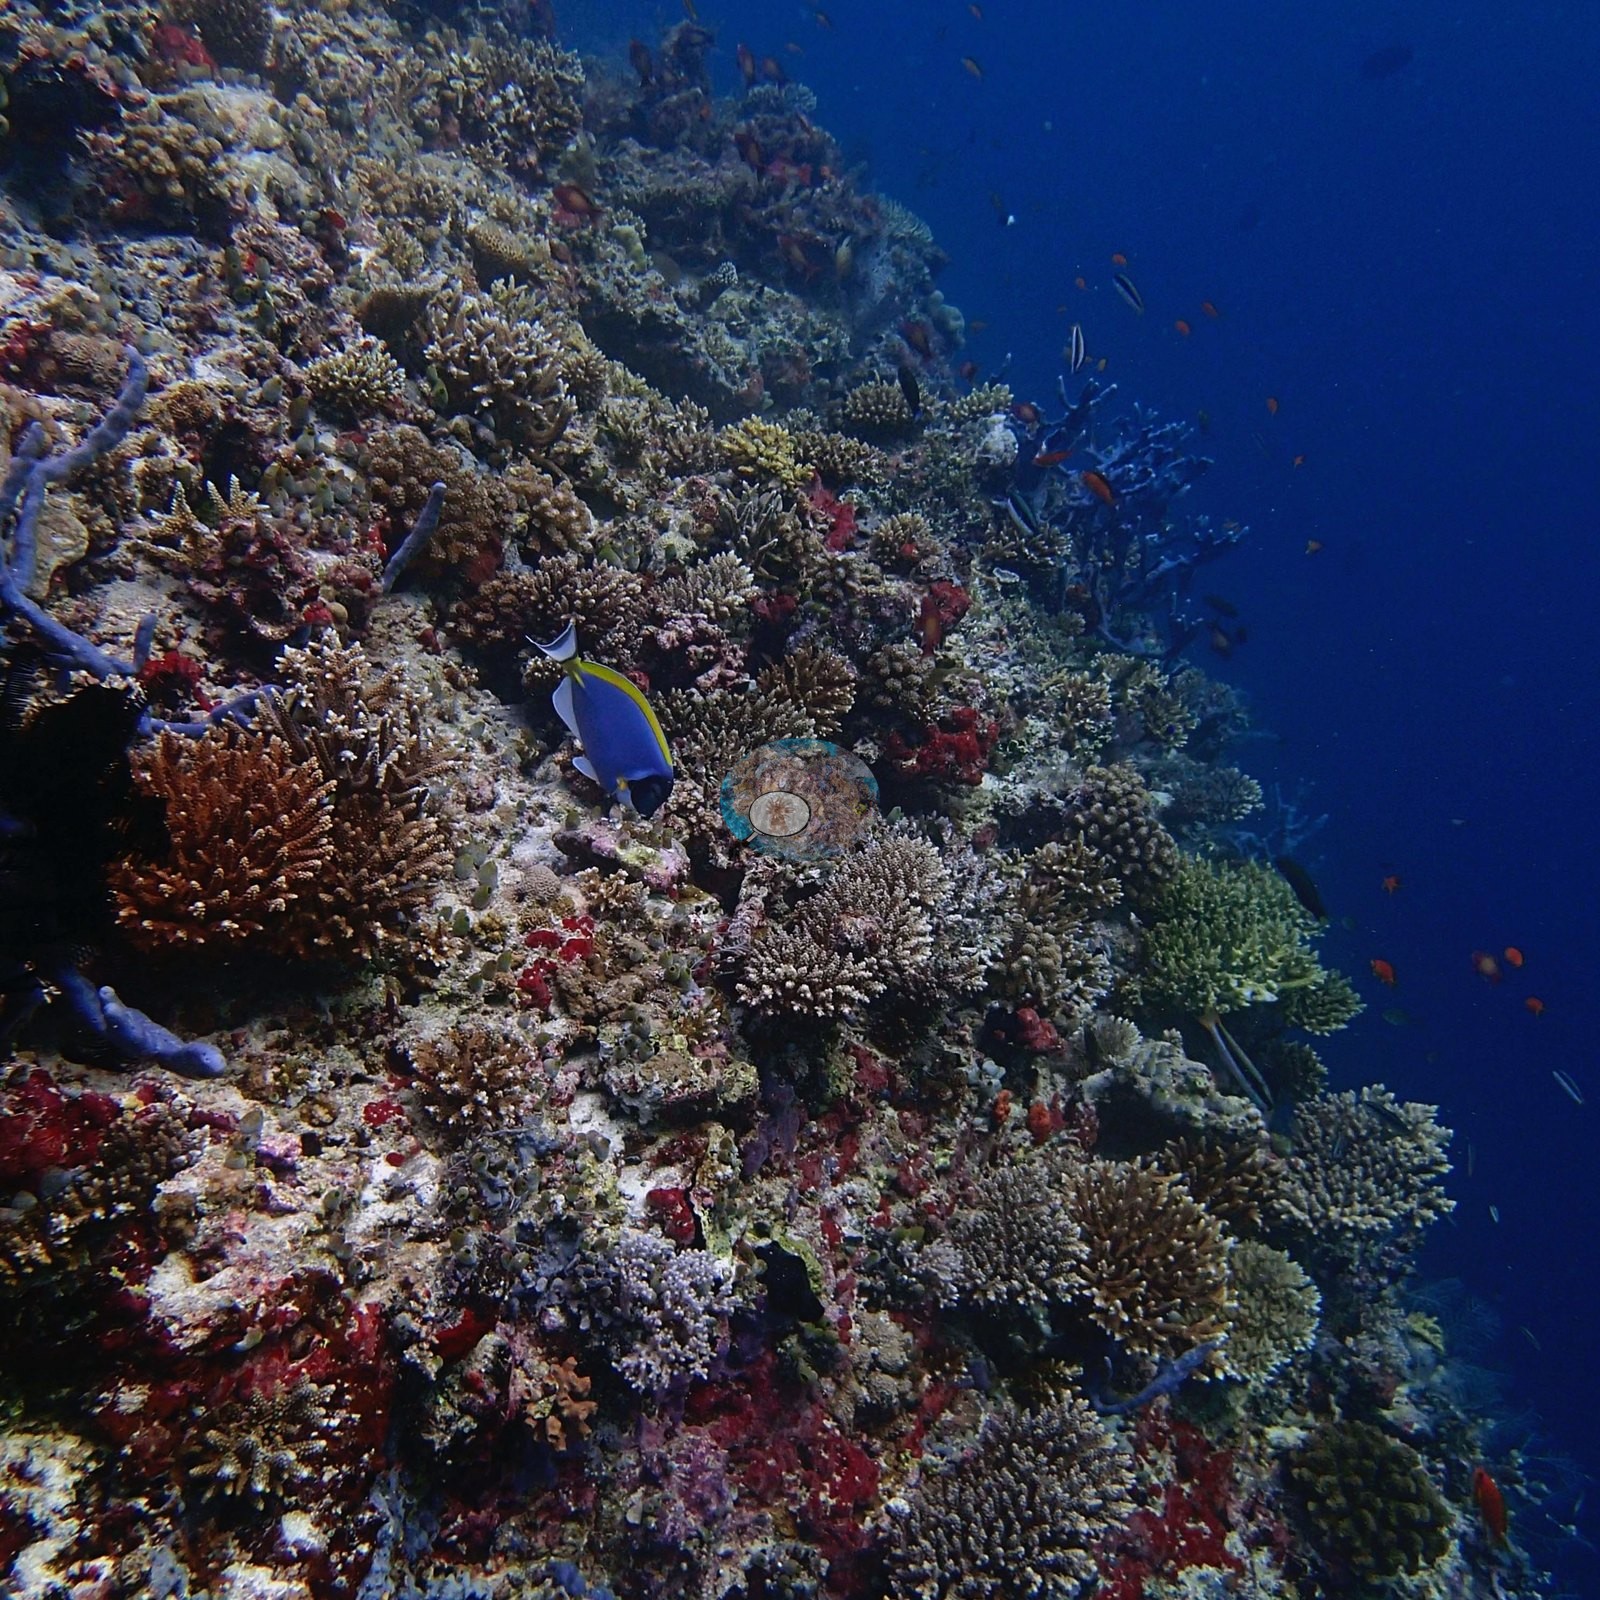
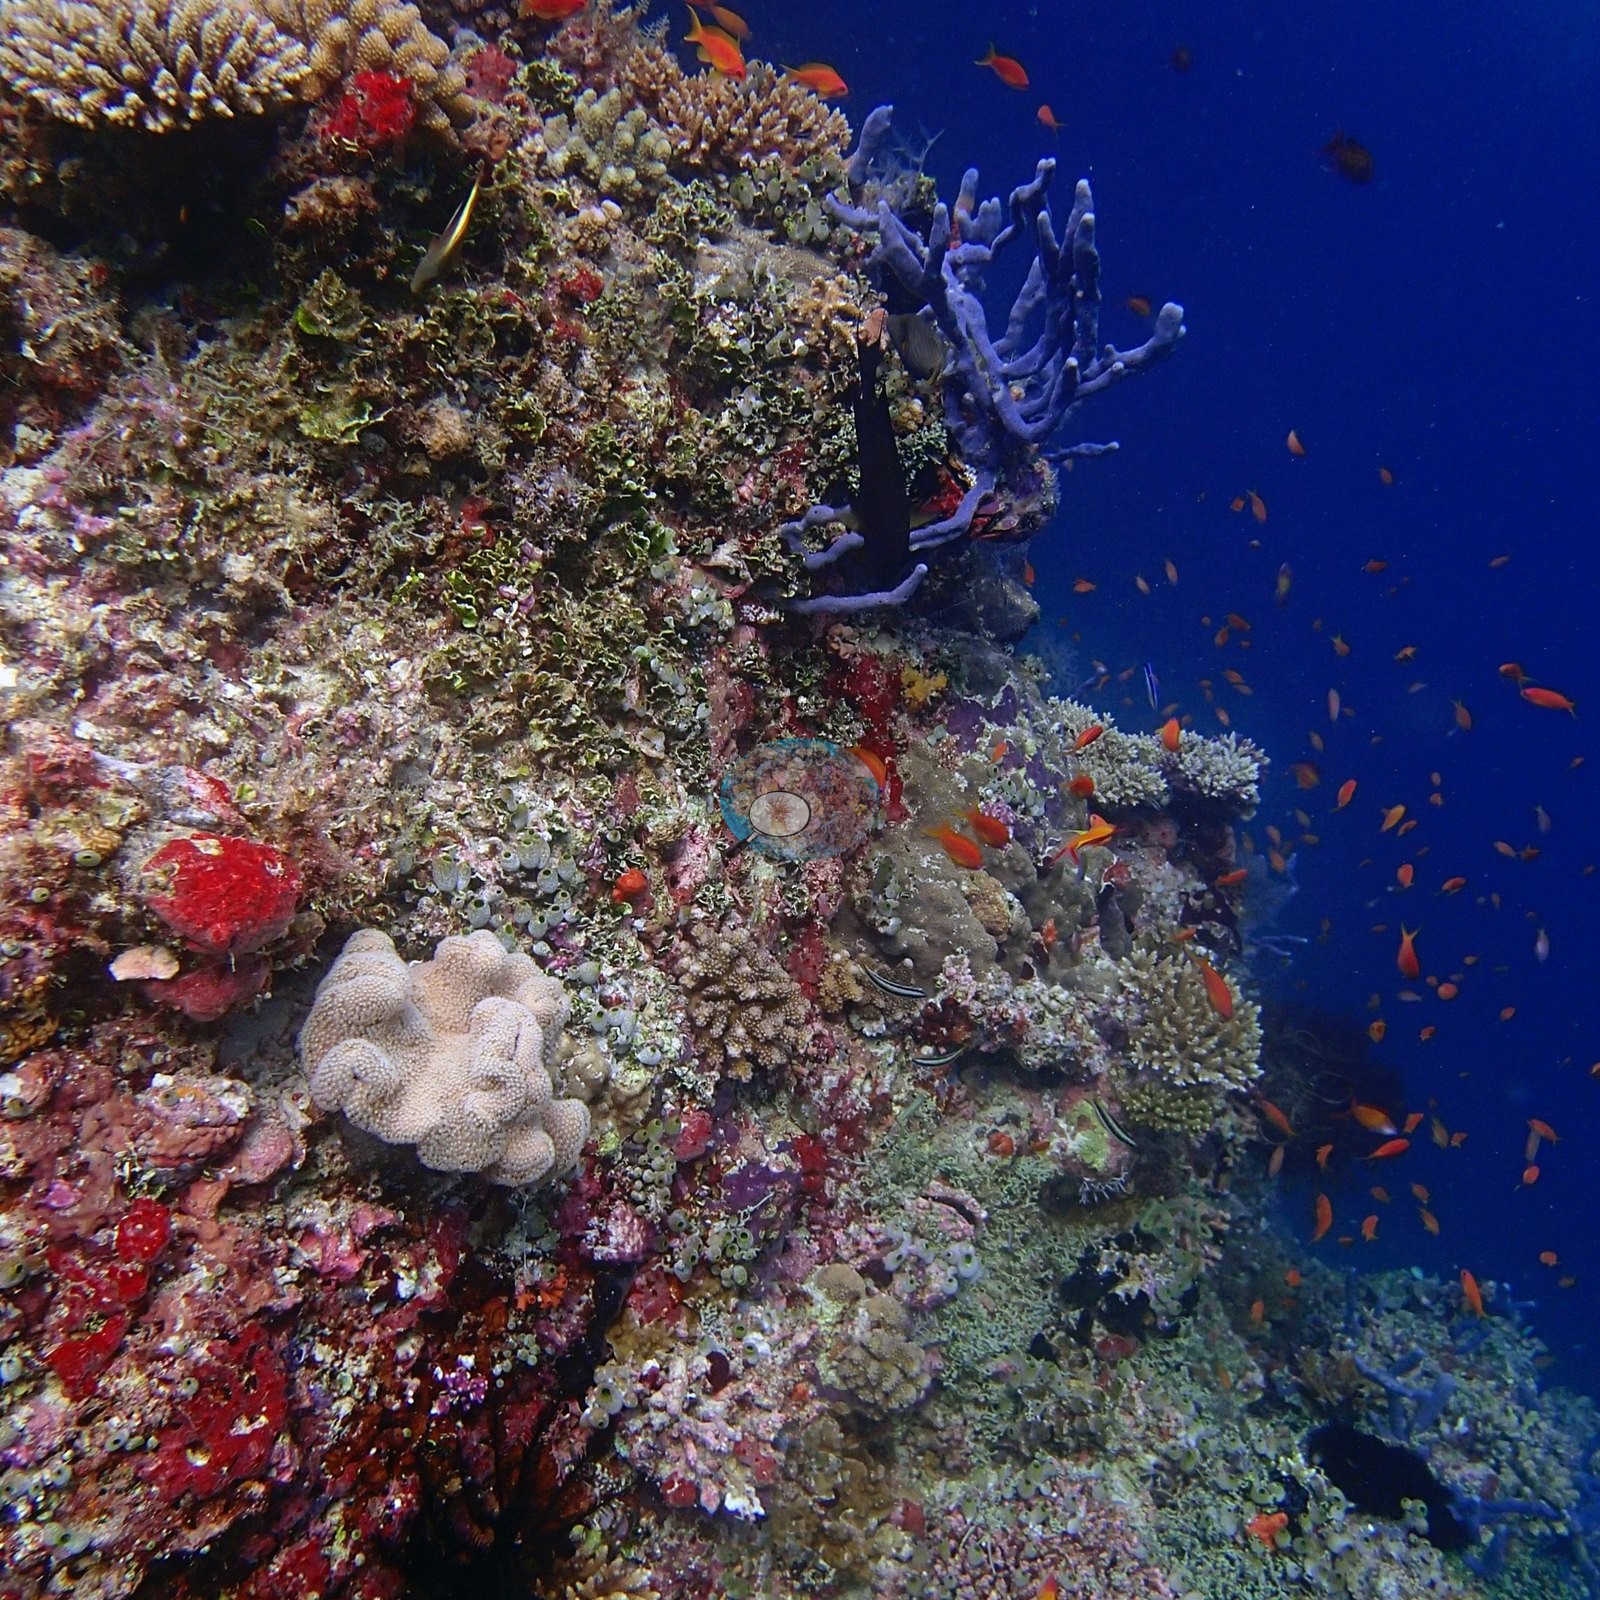
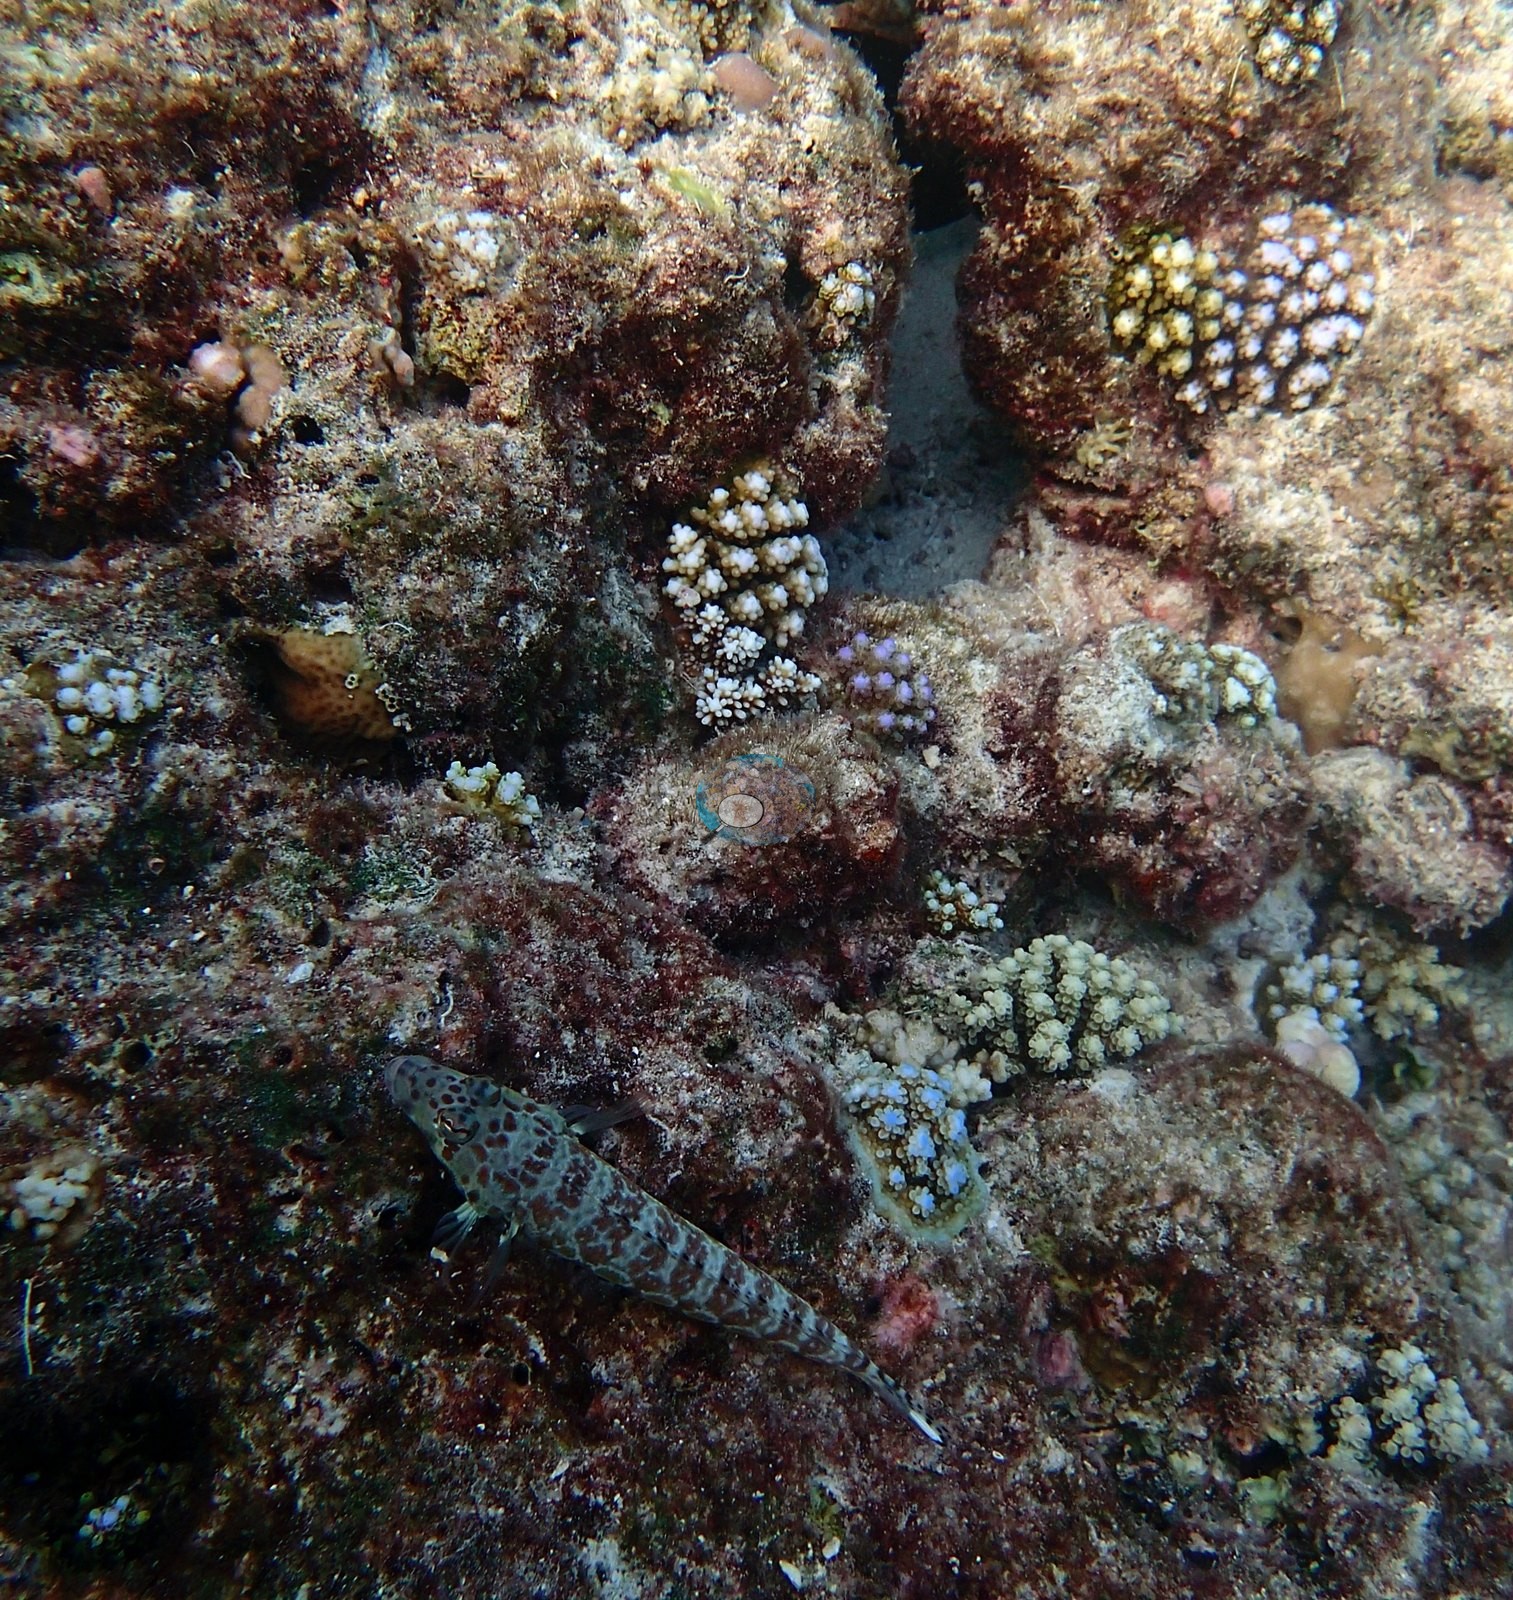
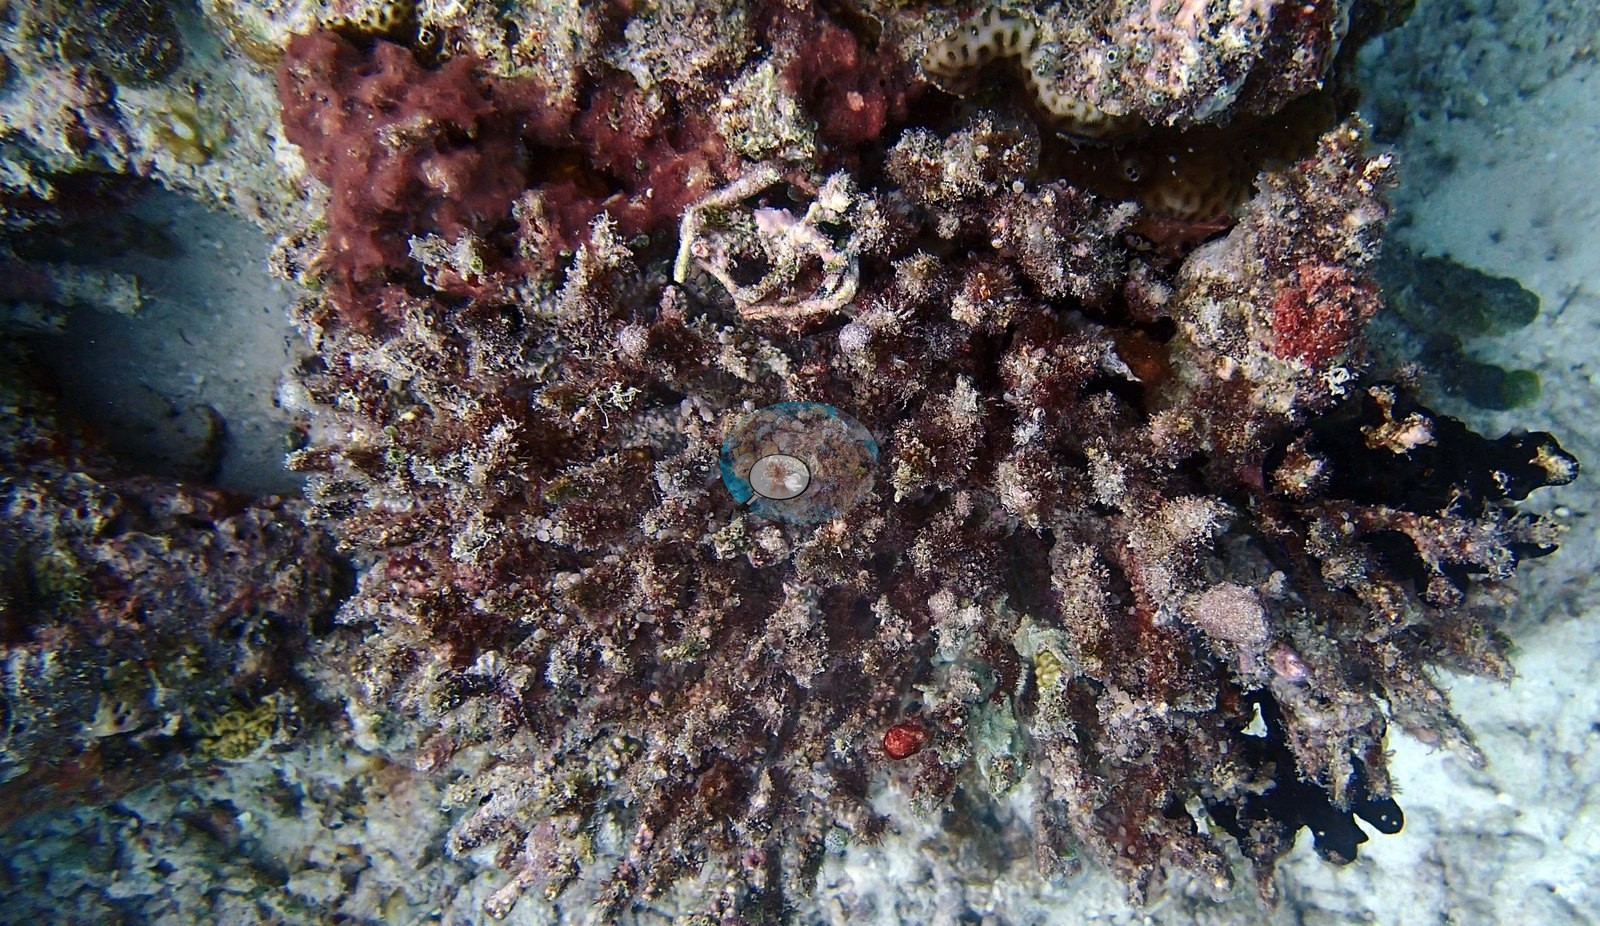
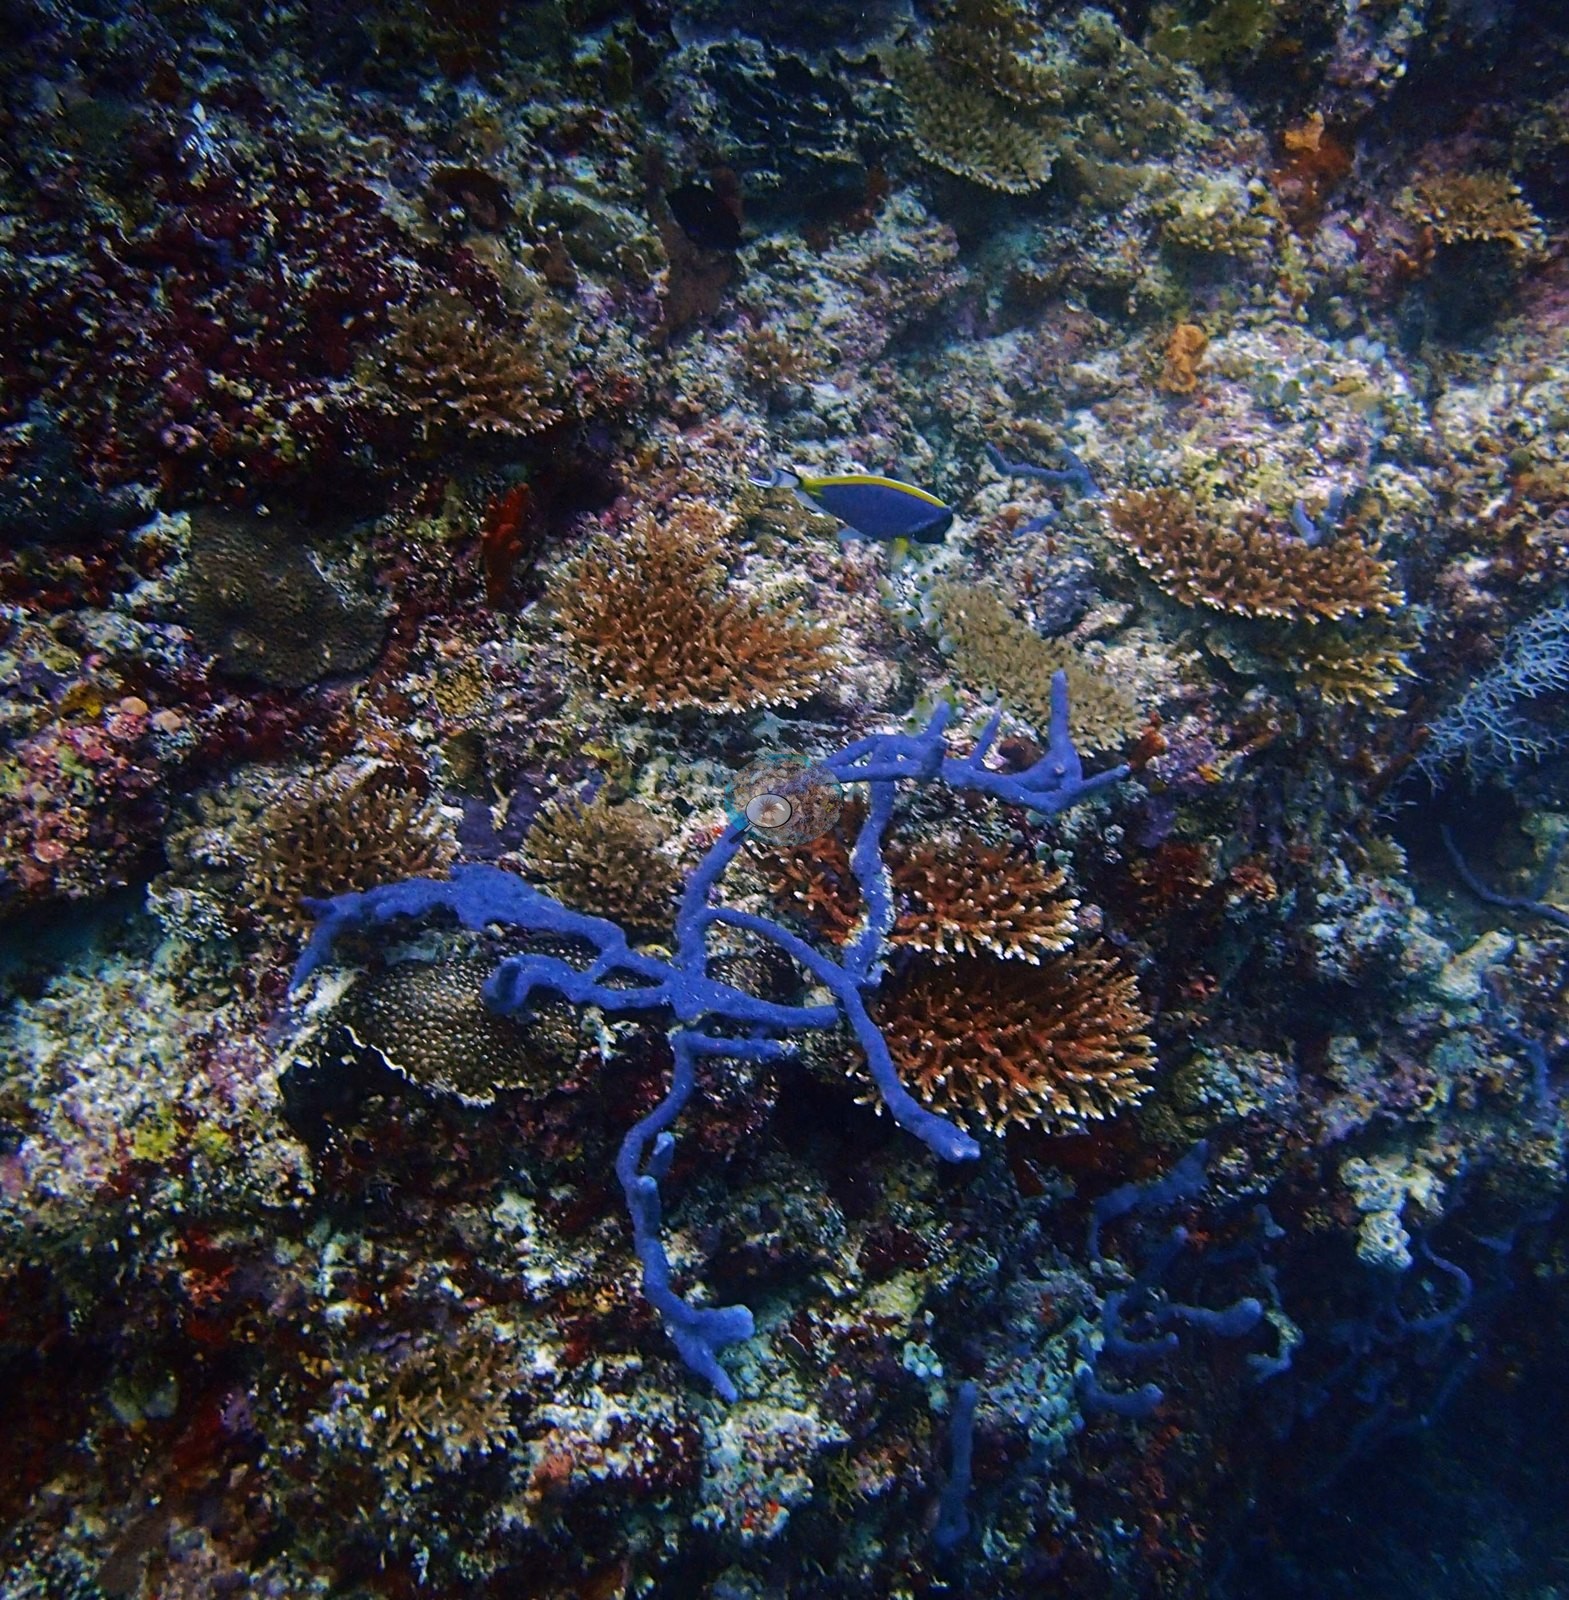
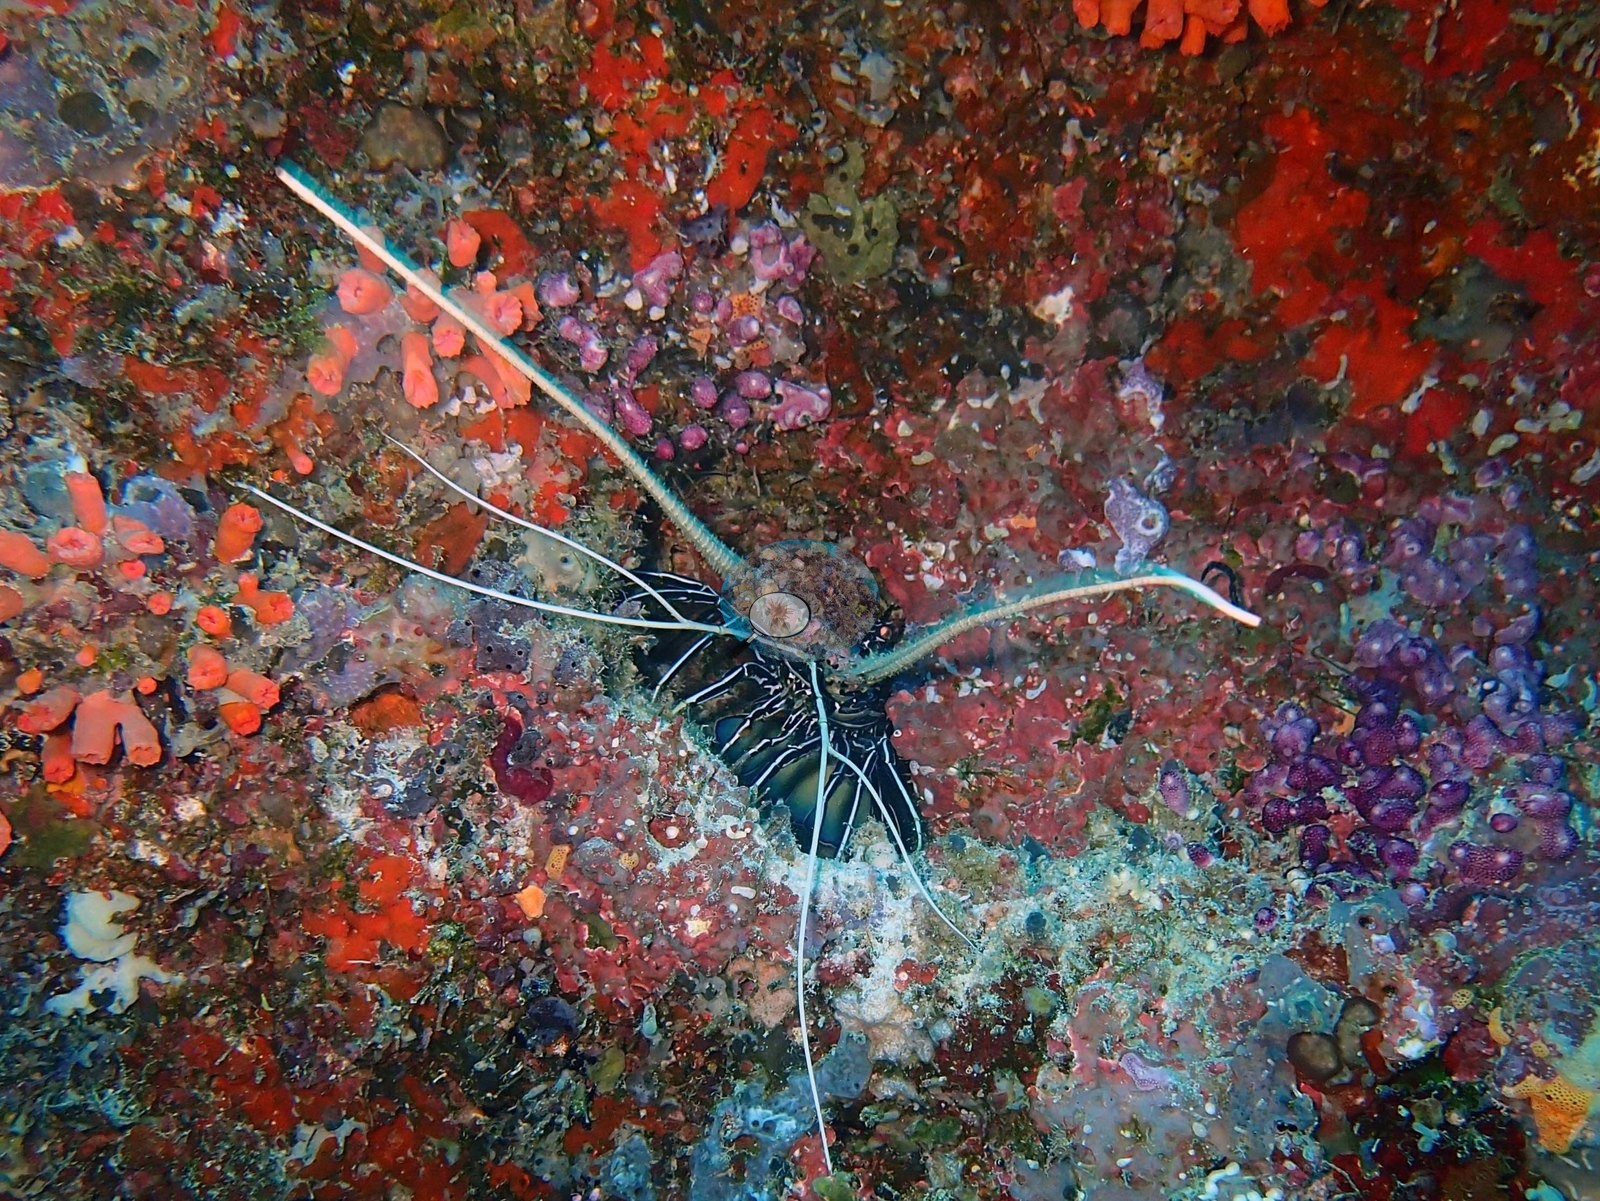
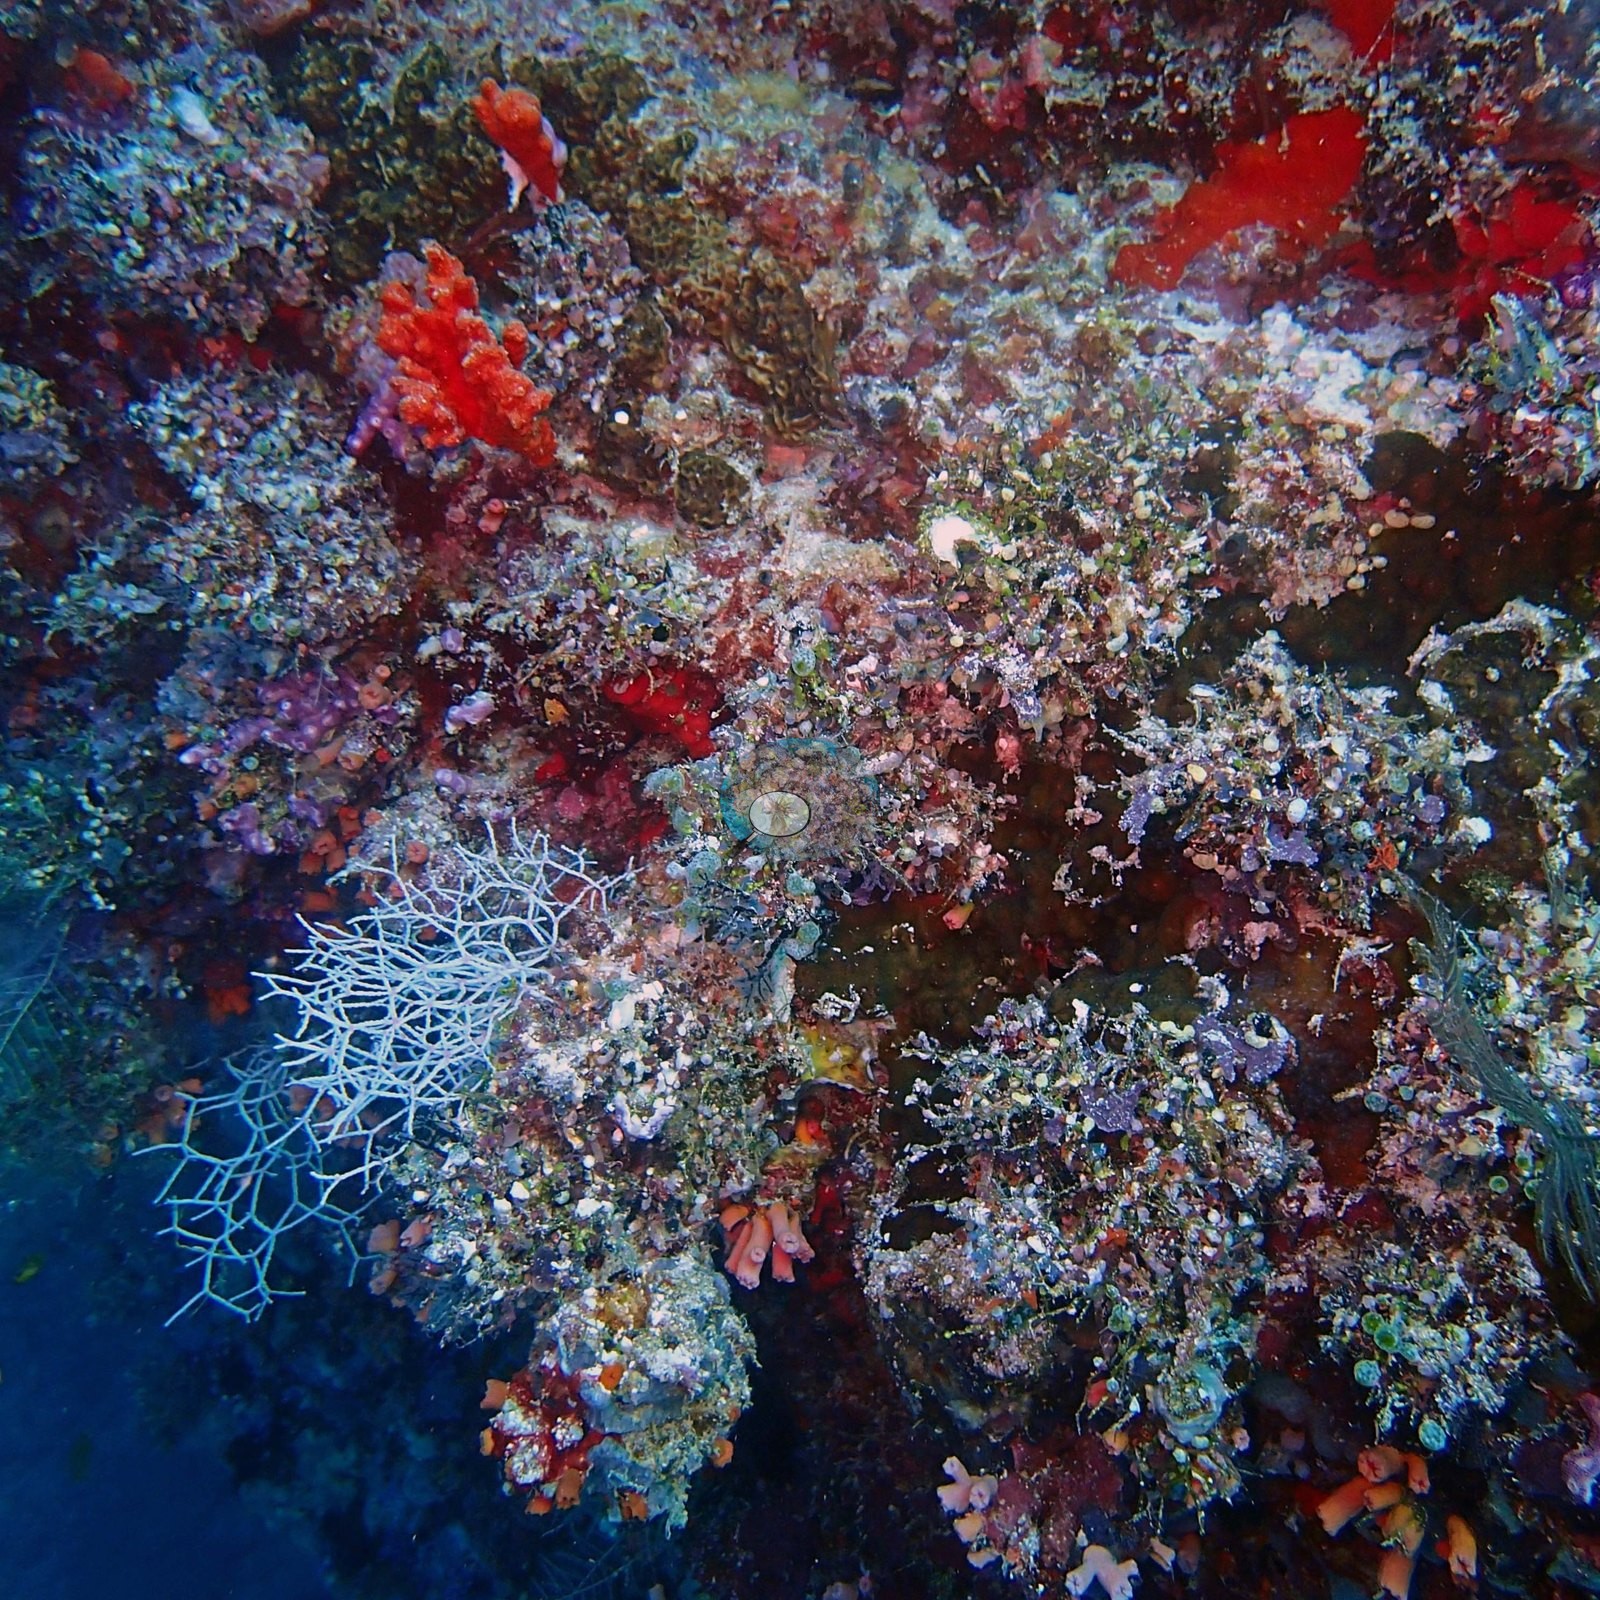
The passage walls drip with life that loves the shade — blue rope sponges slung like cables, red encrusting sponge, white lacework hydroids, feather stars, and soft corals in lavender and crimson (e.g., Image 2, Image 8, Image 9).
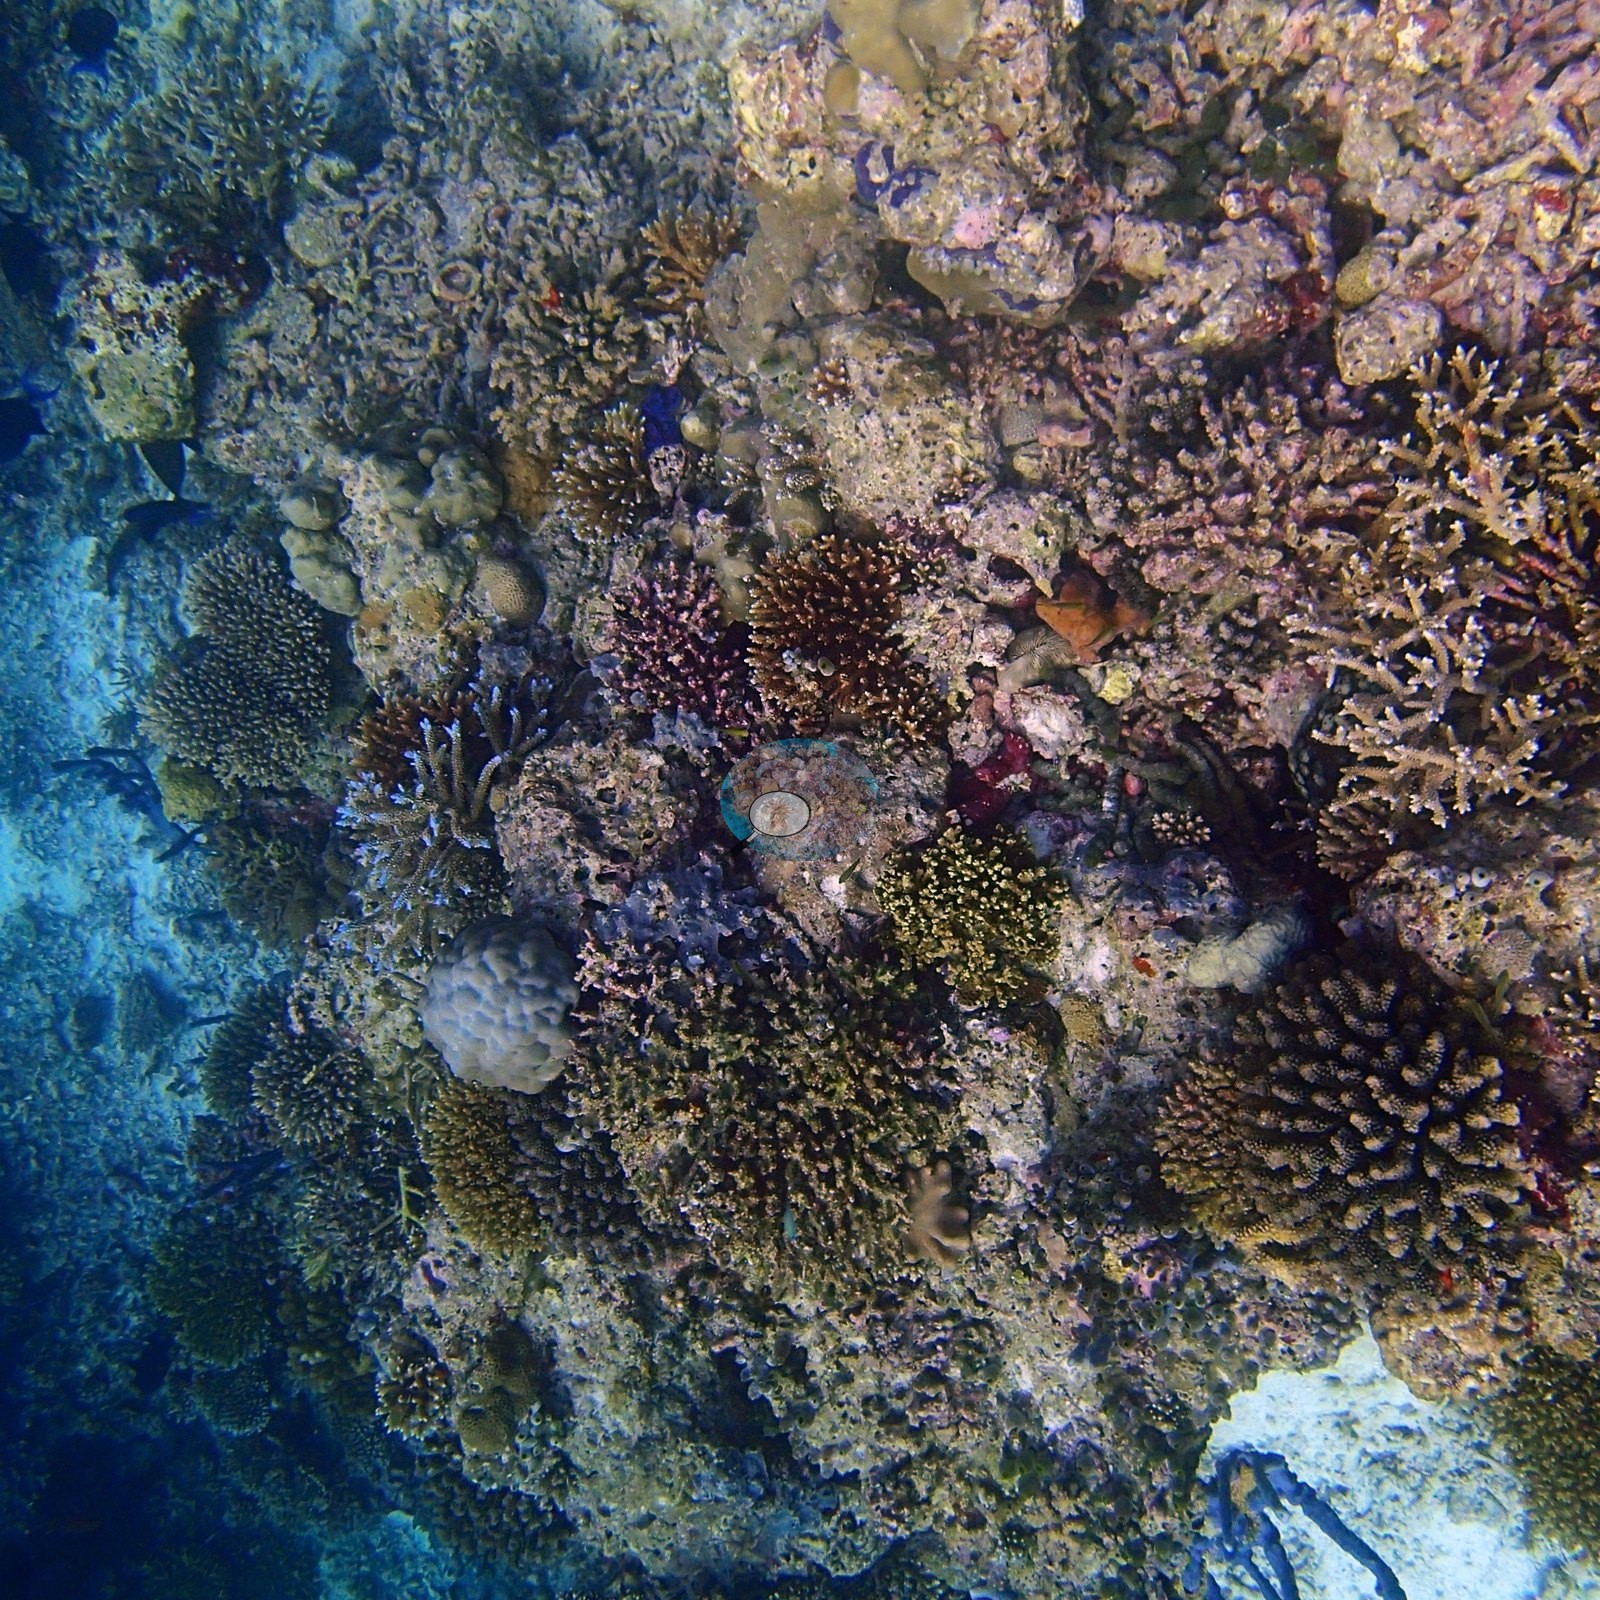
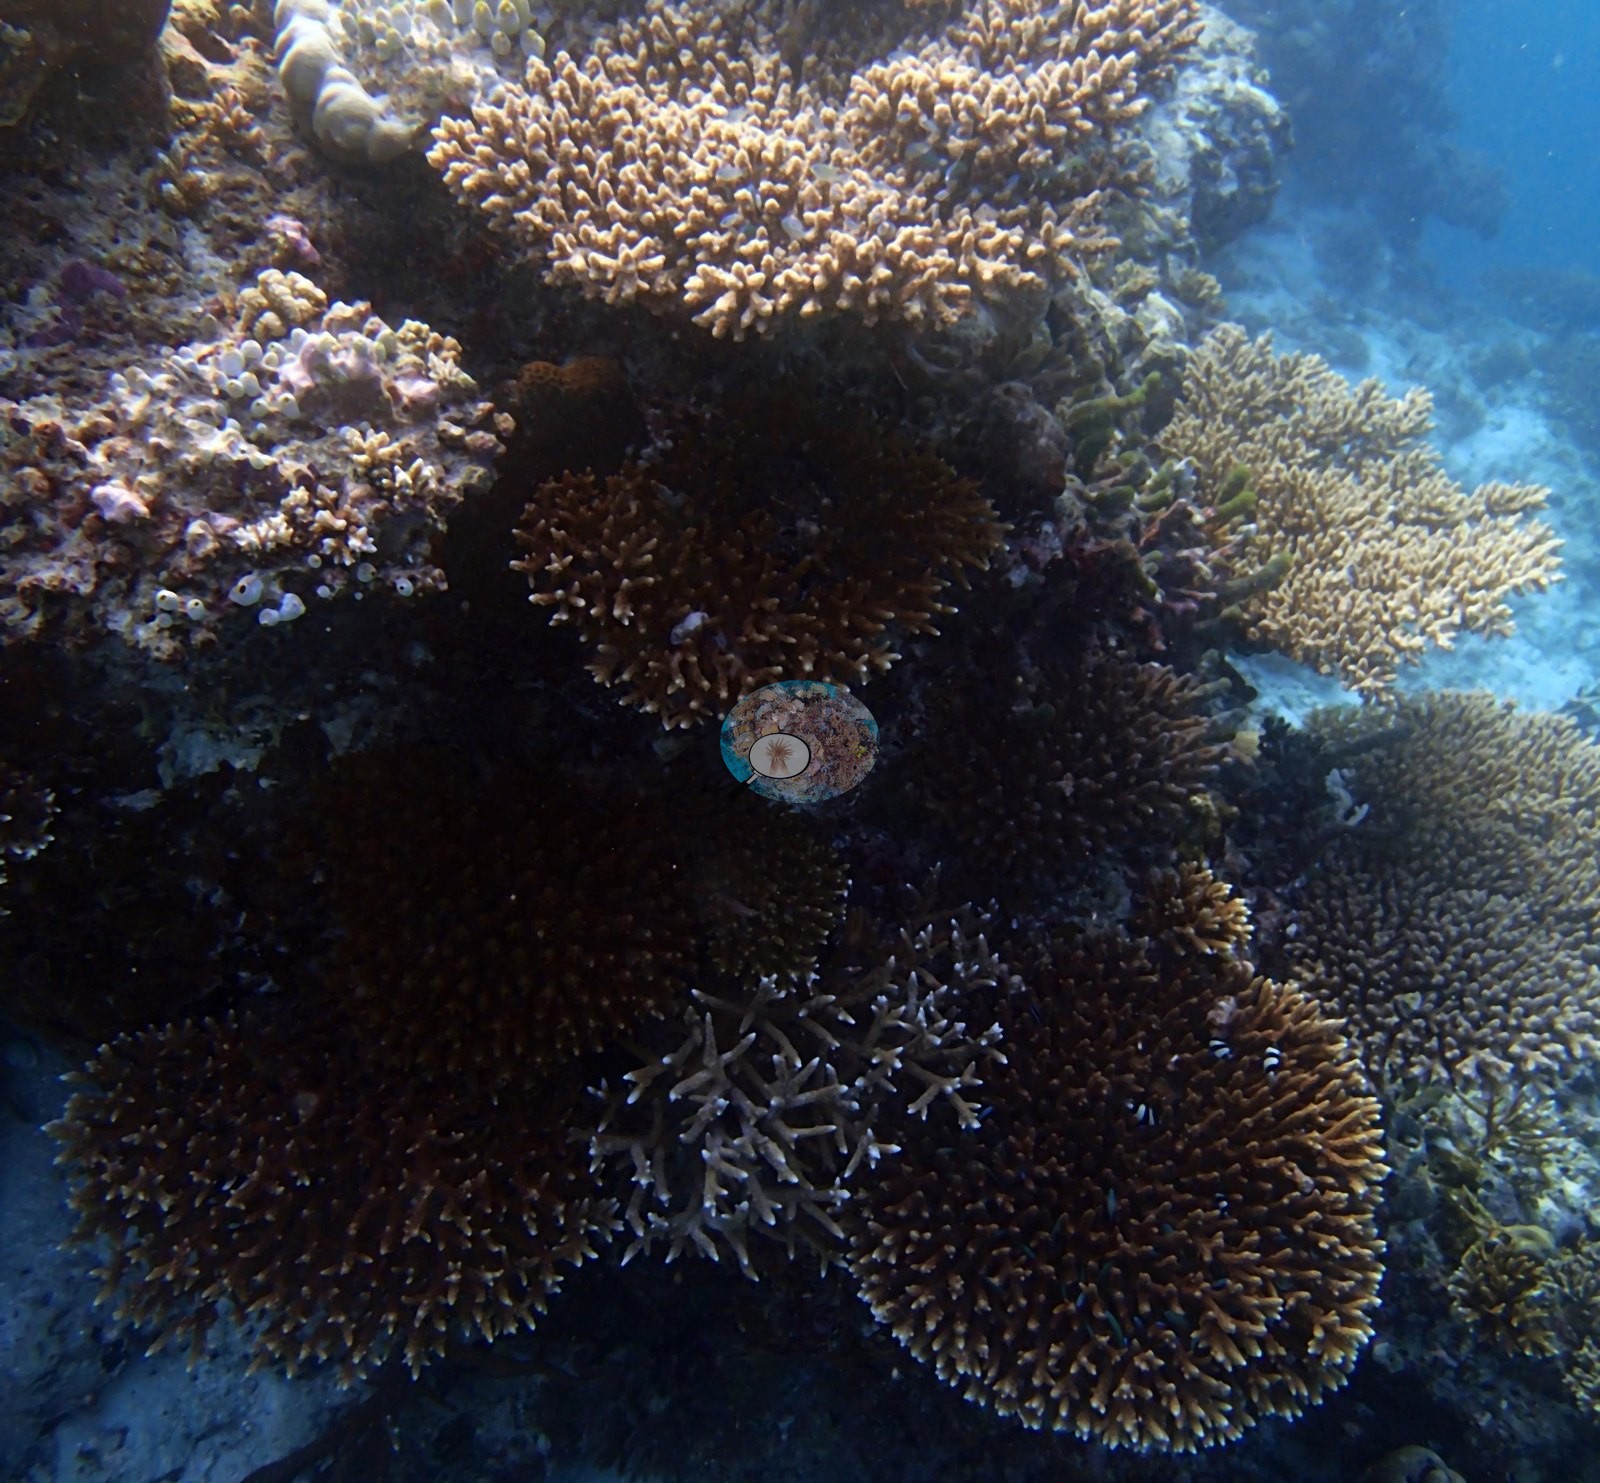
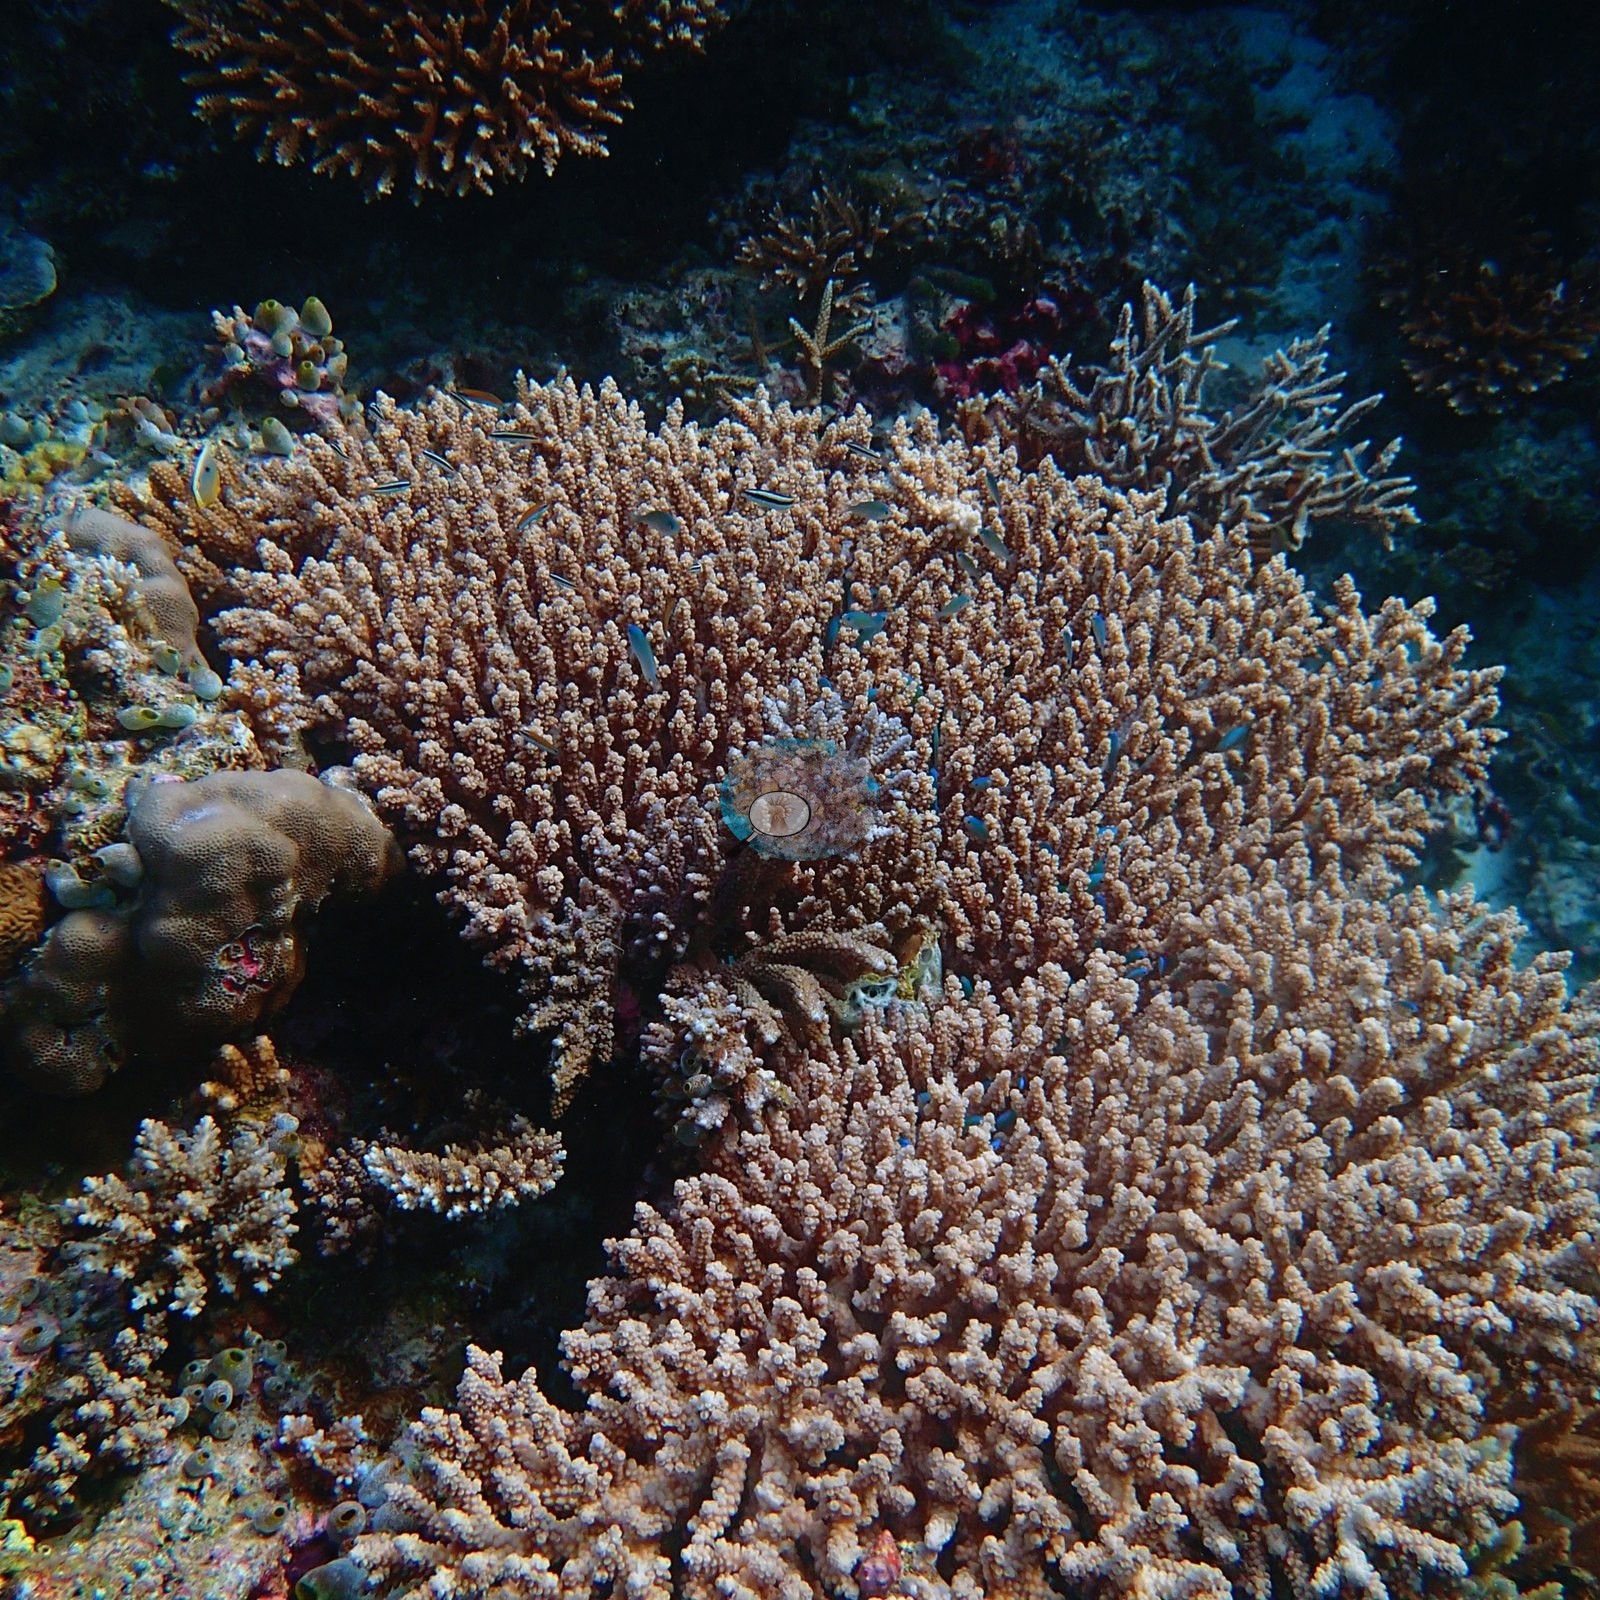
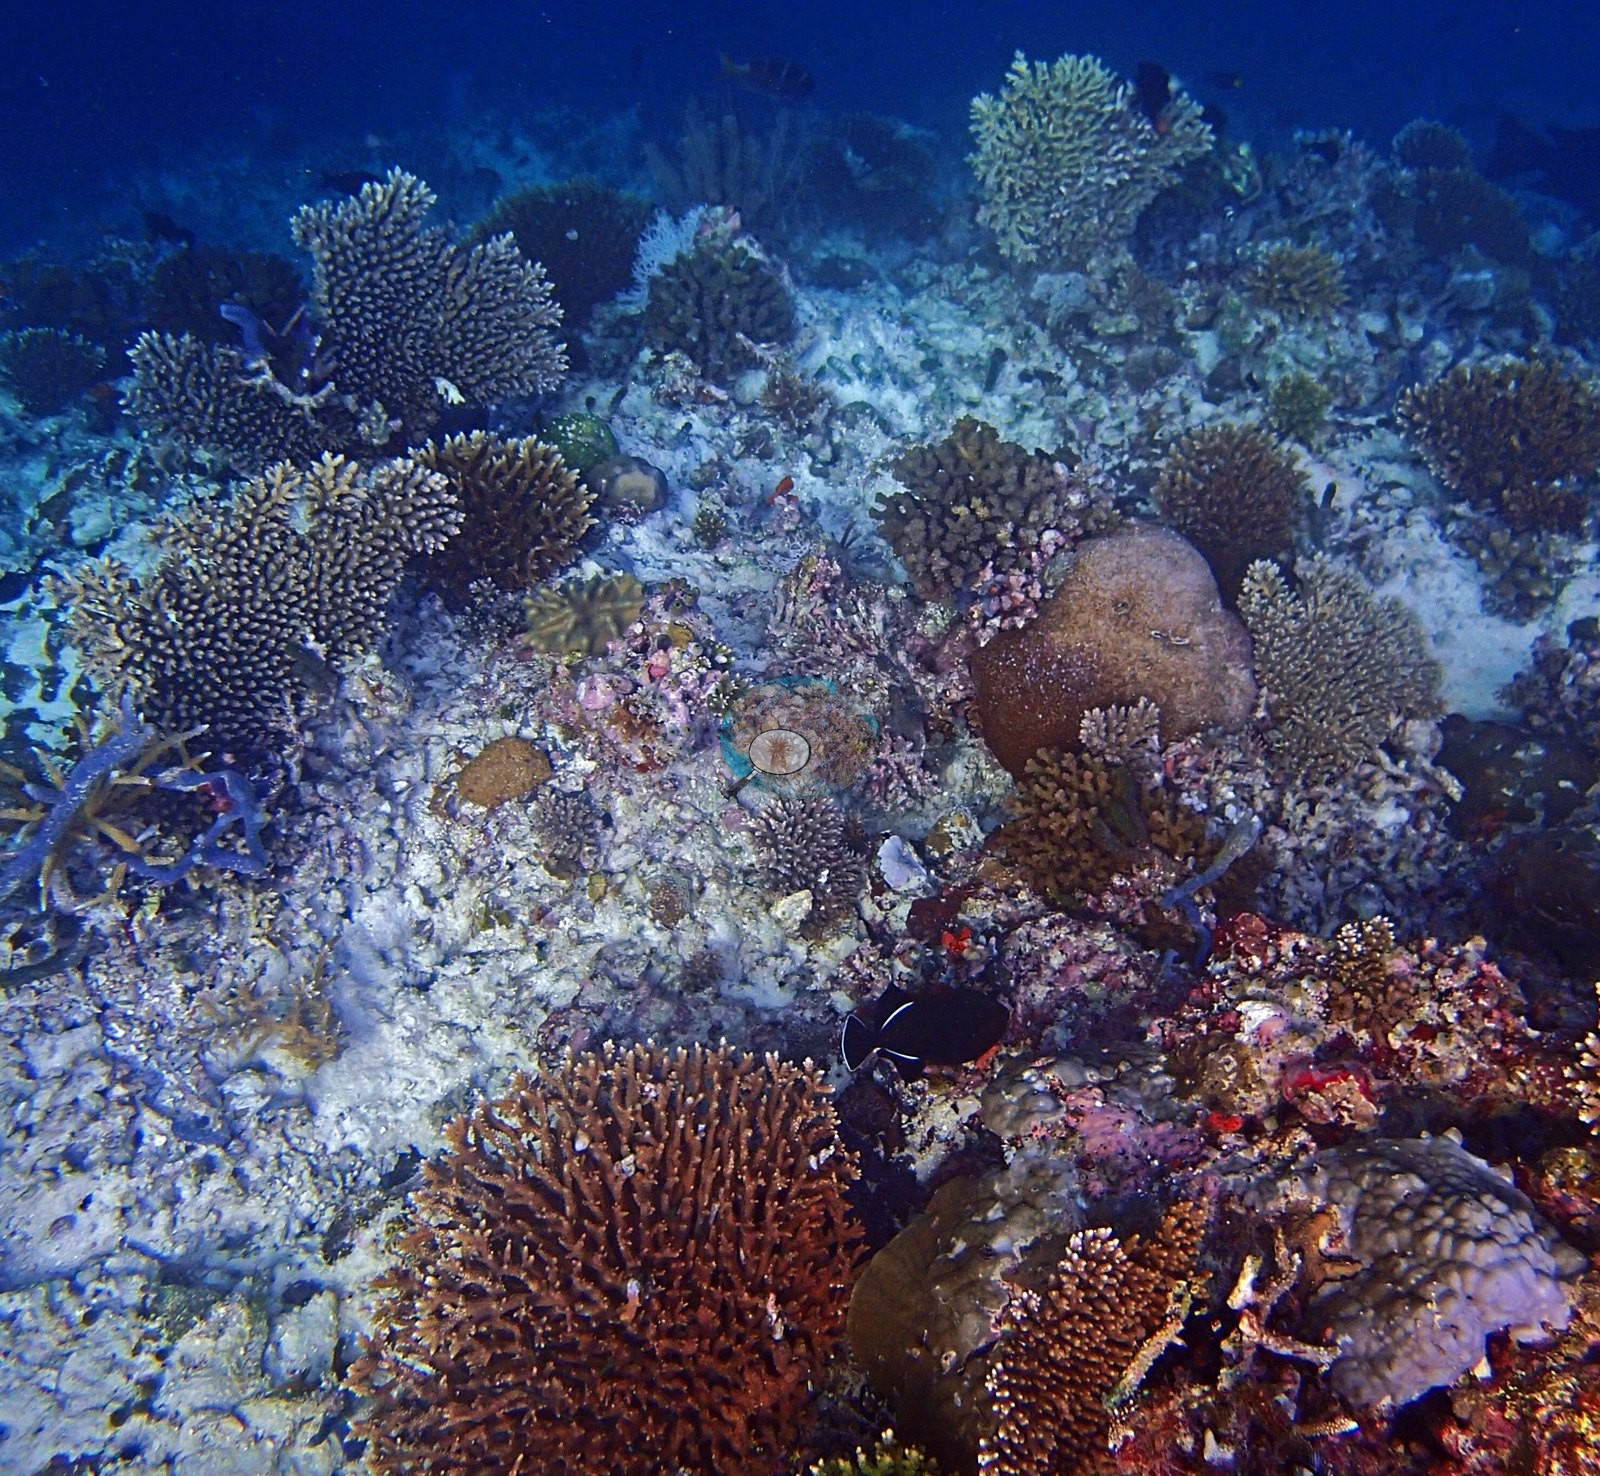
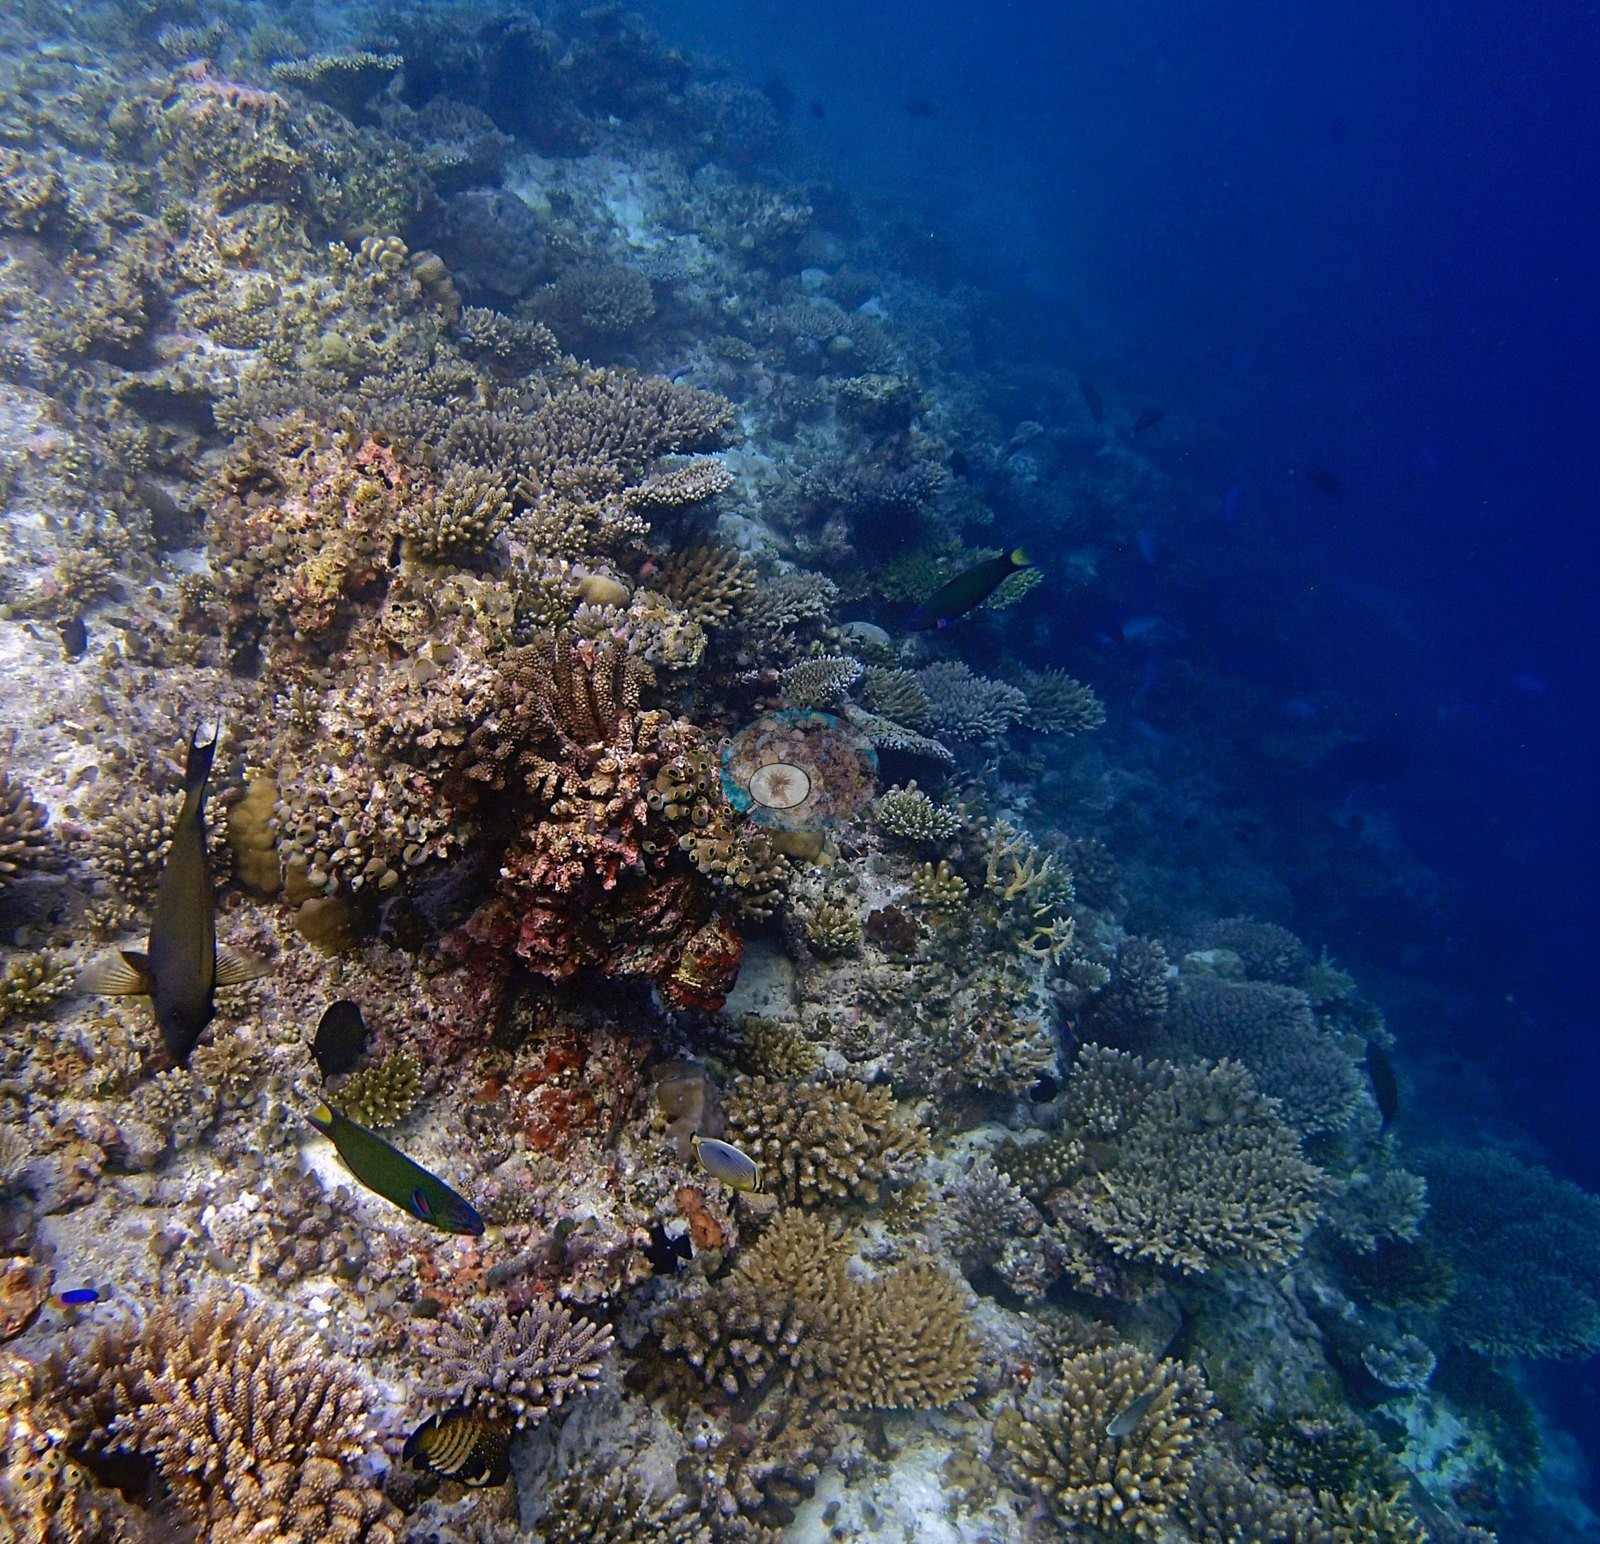
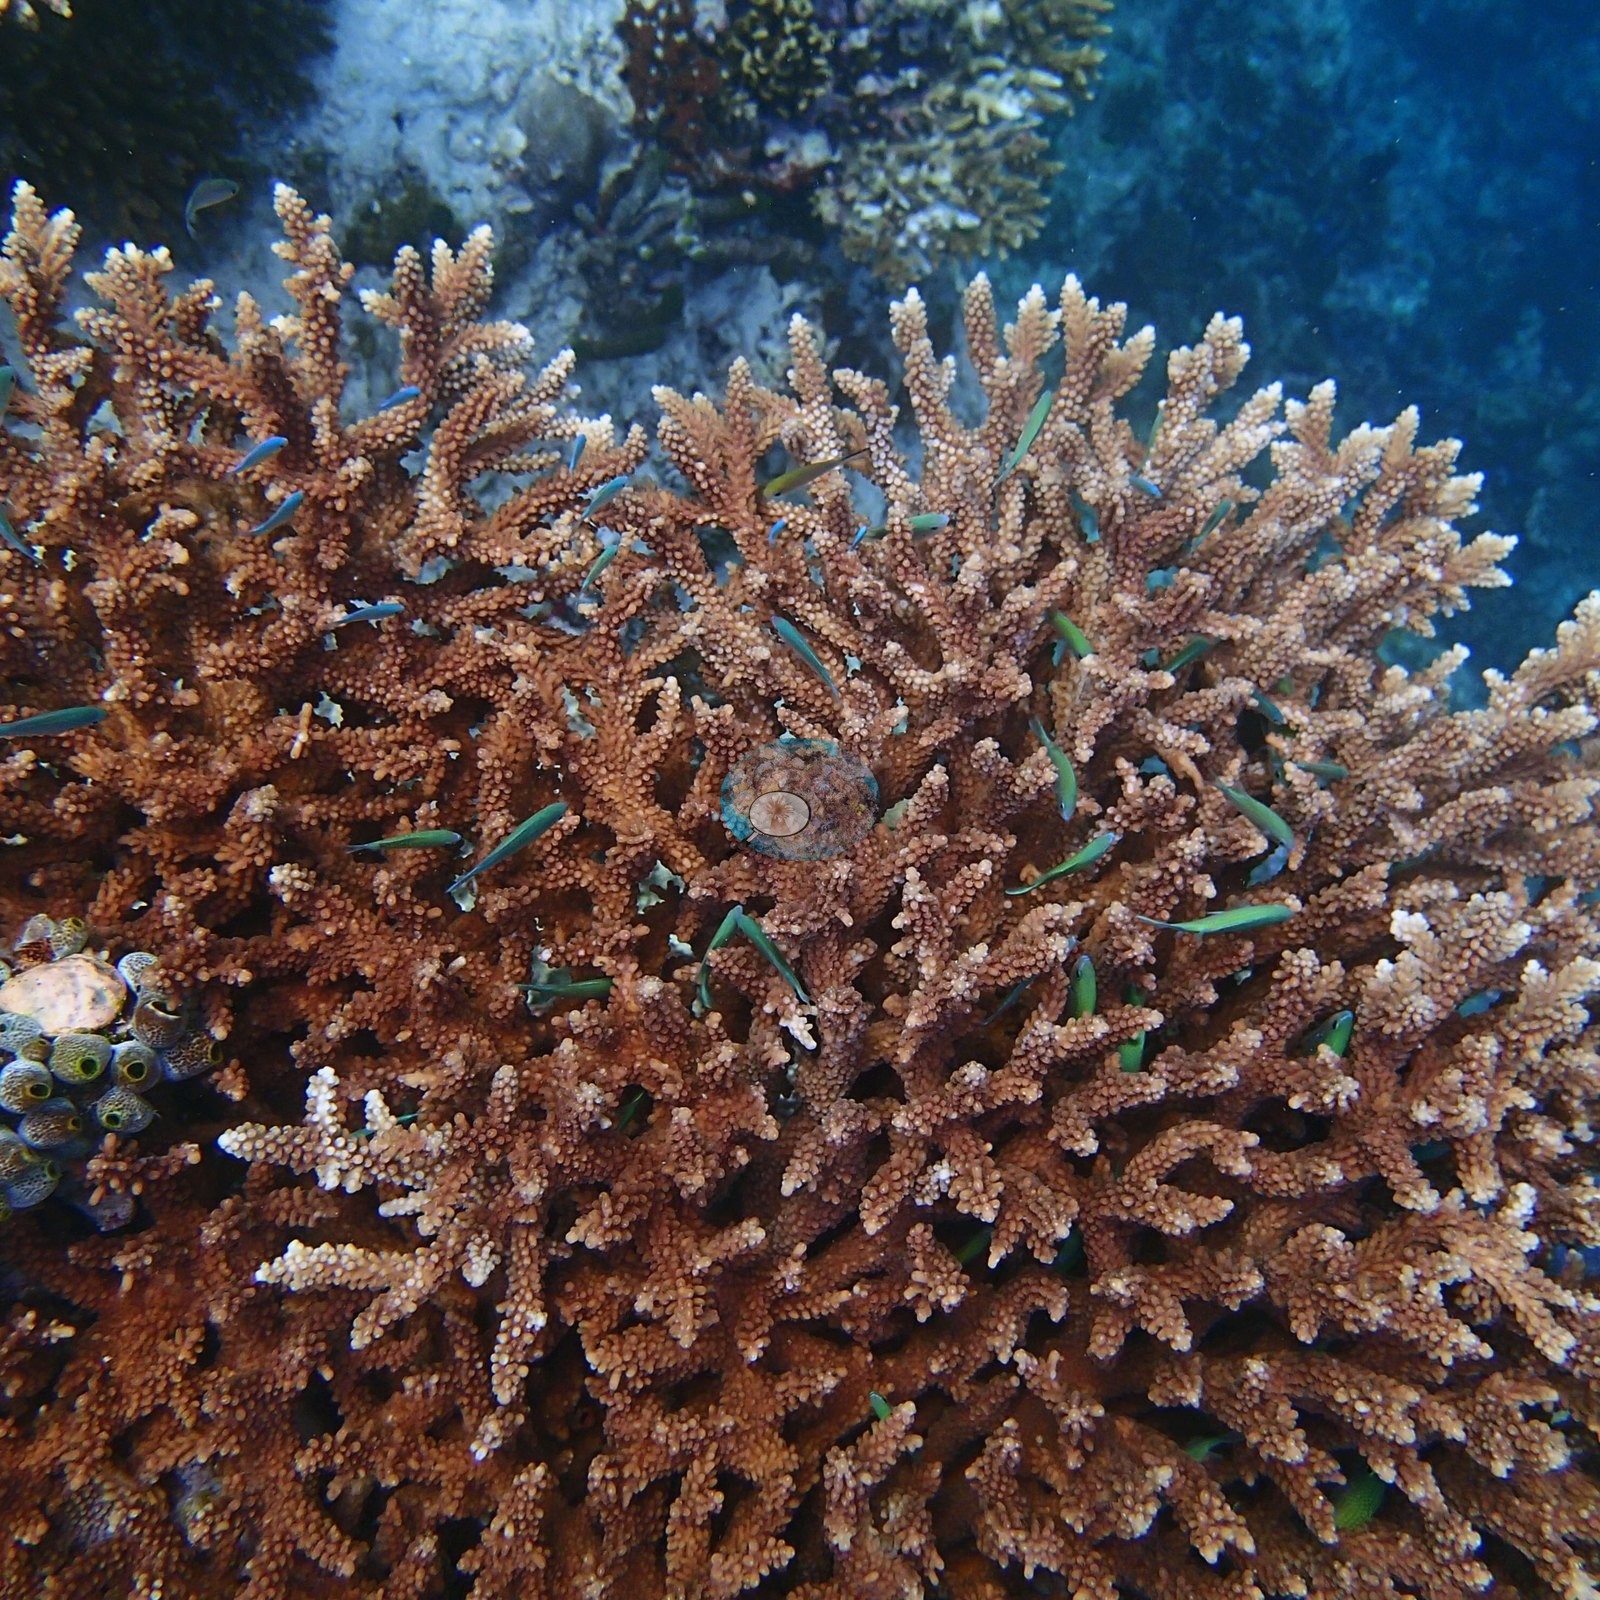
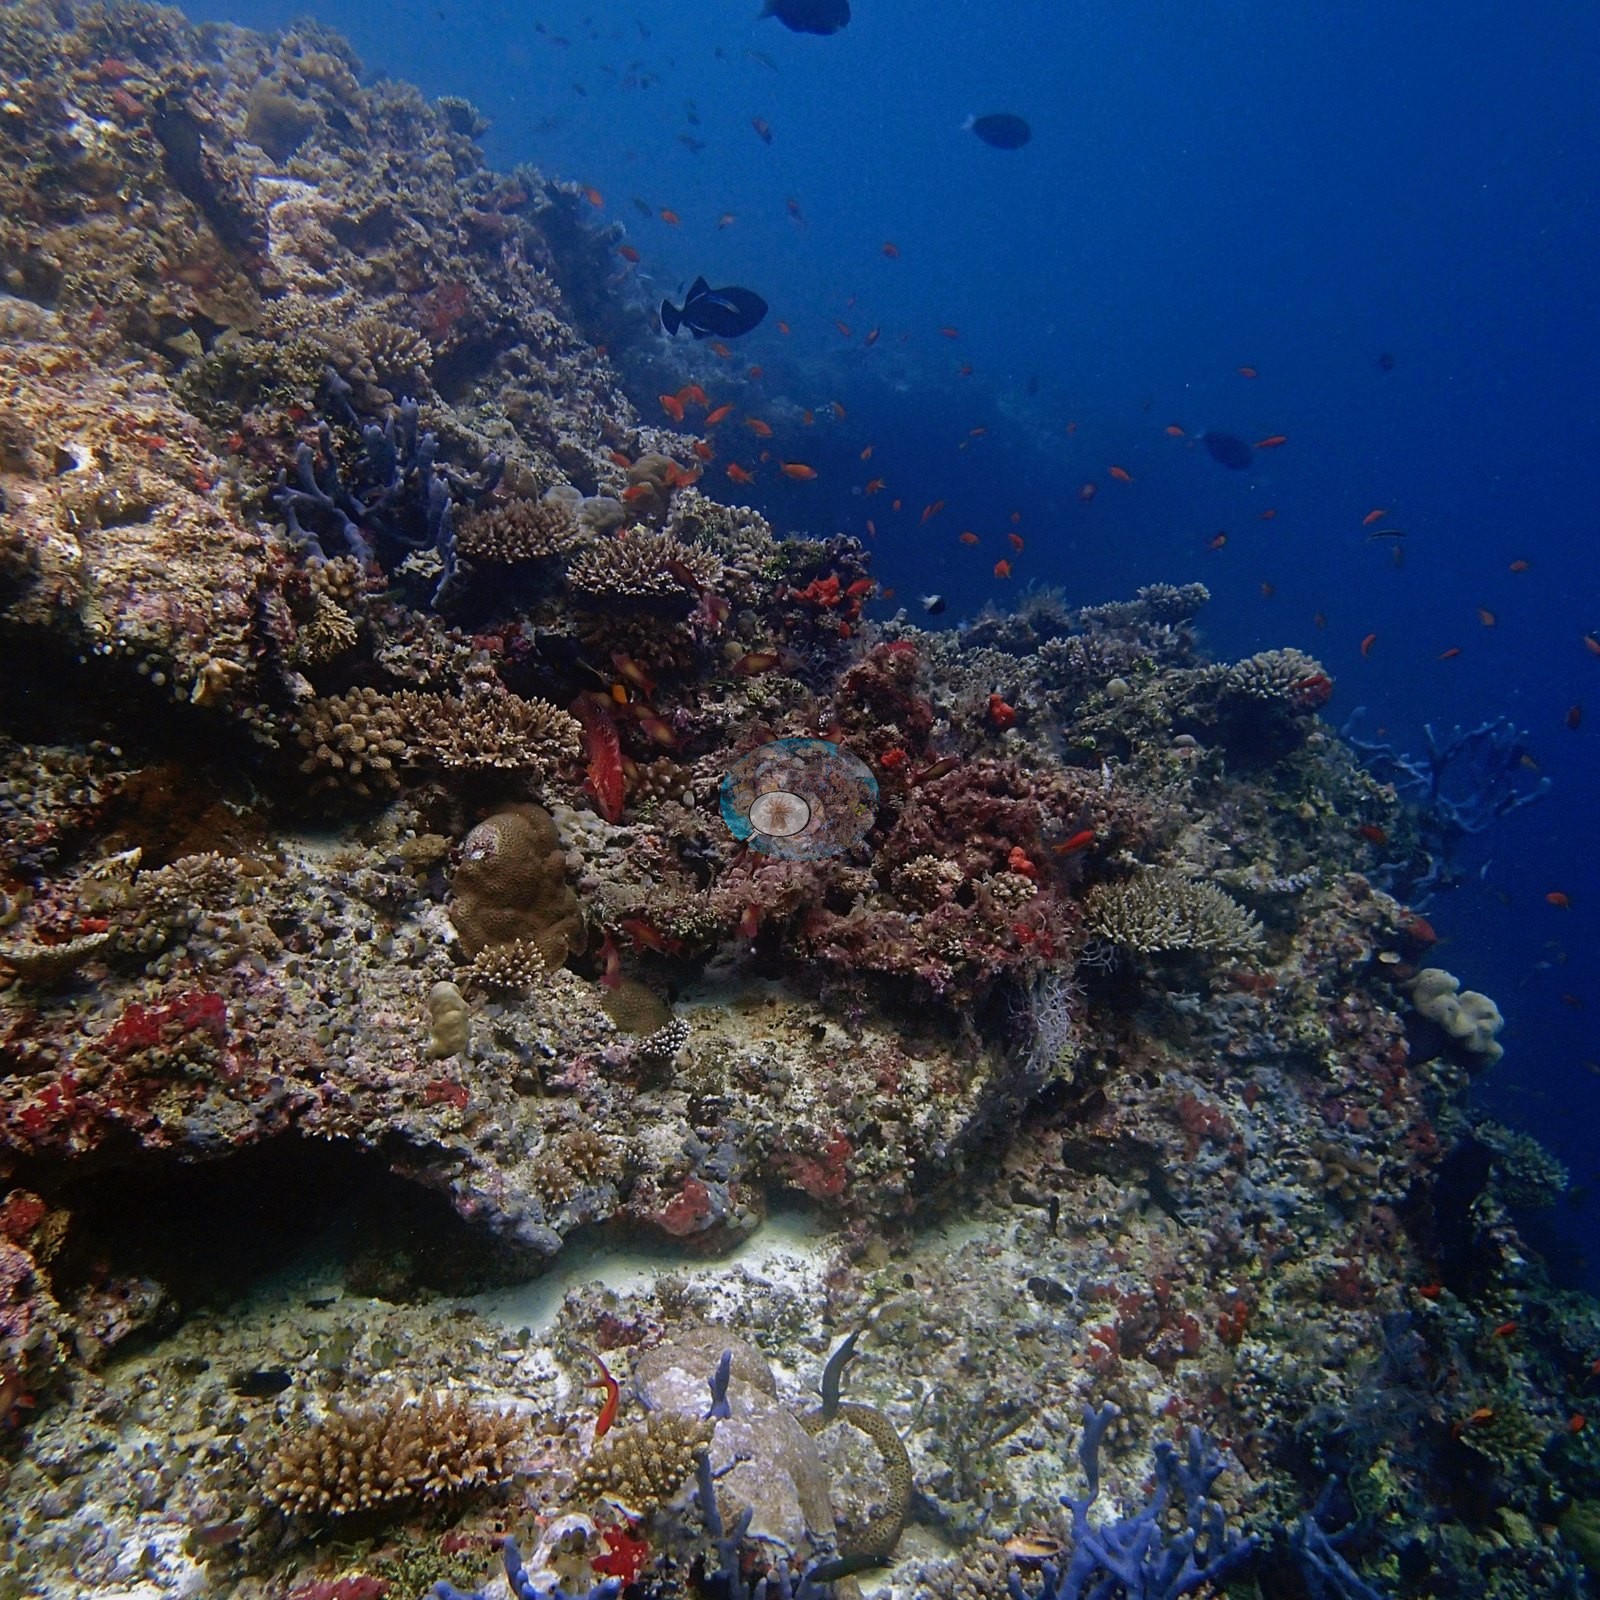
Then the reef climbs into the light and changes character completely: staghorn thickets boiling with blue-green chromis, tabletop corals stacked along the spurs, and pink cauliflower corals crowding the crests (e.g., Image 14).
Coral cover
Coral cover: 18% — photo-derived, and the two methods broadly agree (16% vs 20%). This site's figure is the mean of two independent computer vision passes over Anderson's own frames: a DINOv3 calibrated point classifier reads 15.8% and a CoralSCOP computer vision reads 19.6%, a spread of 3.8 percentage points. The map publishes the mean so sites can be sorted against one another, but the honest statement of what is known here is the 16–20% range: the two products have different denominators and should not be treated as one measurement.
Stressors
No crown-of-thorns starfish (COTS) or other corallivores evident.
Fish and other fauna
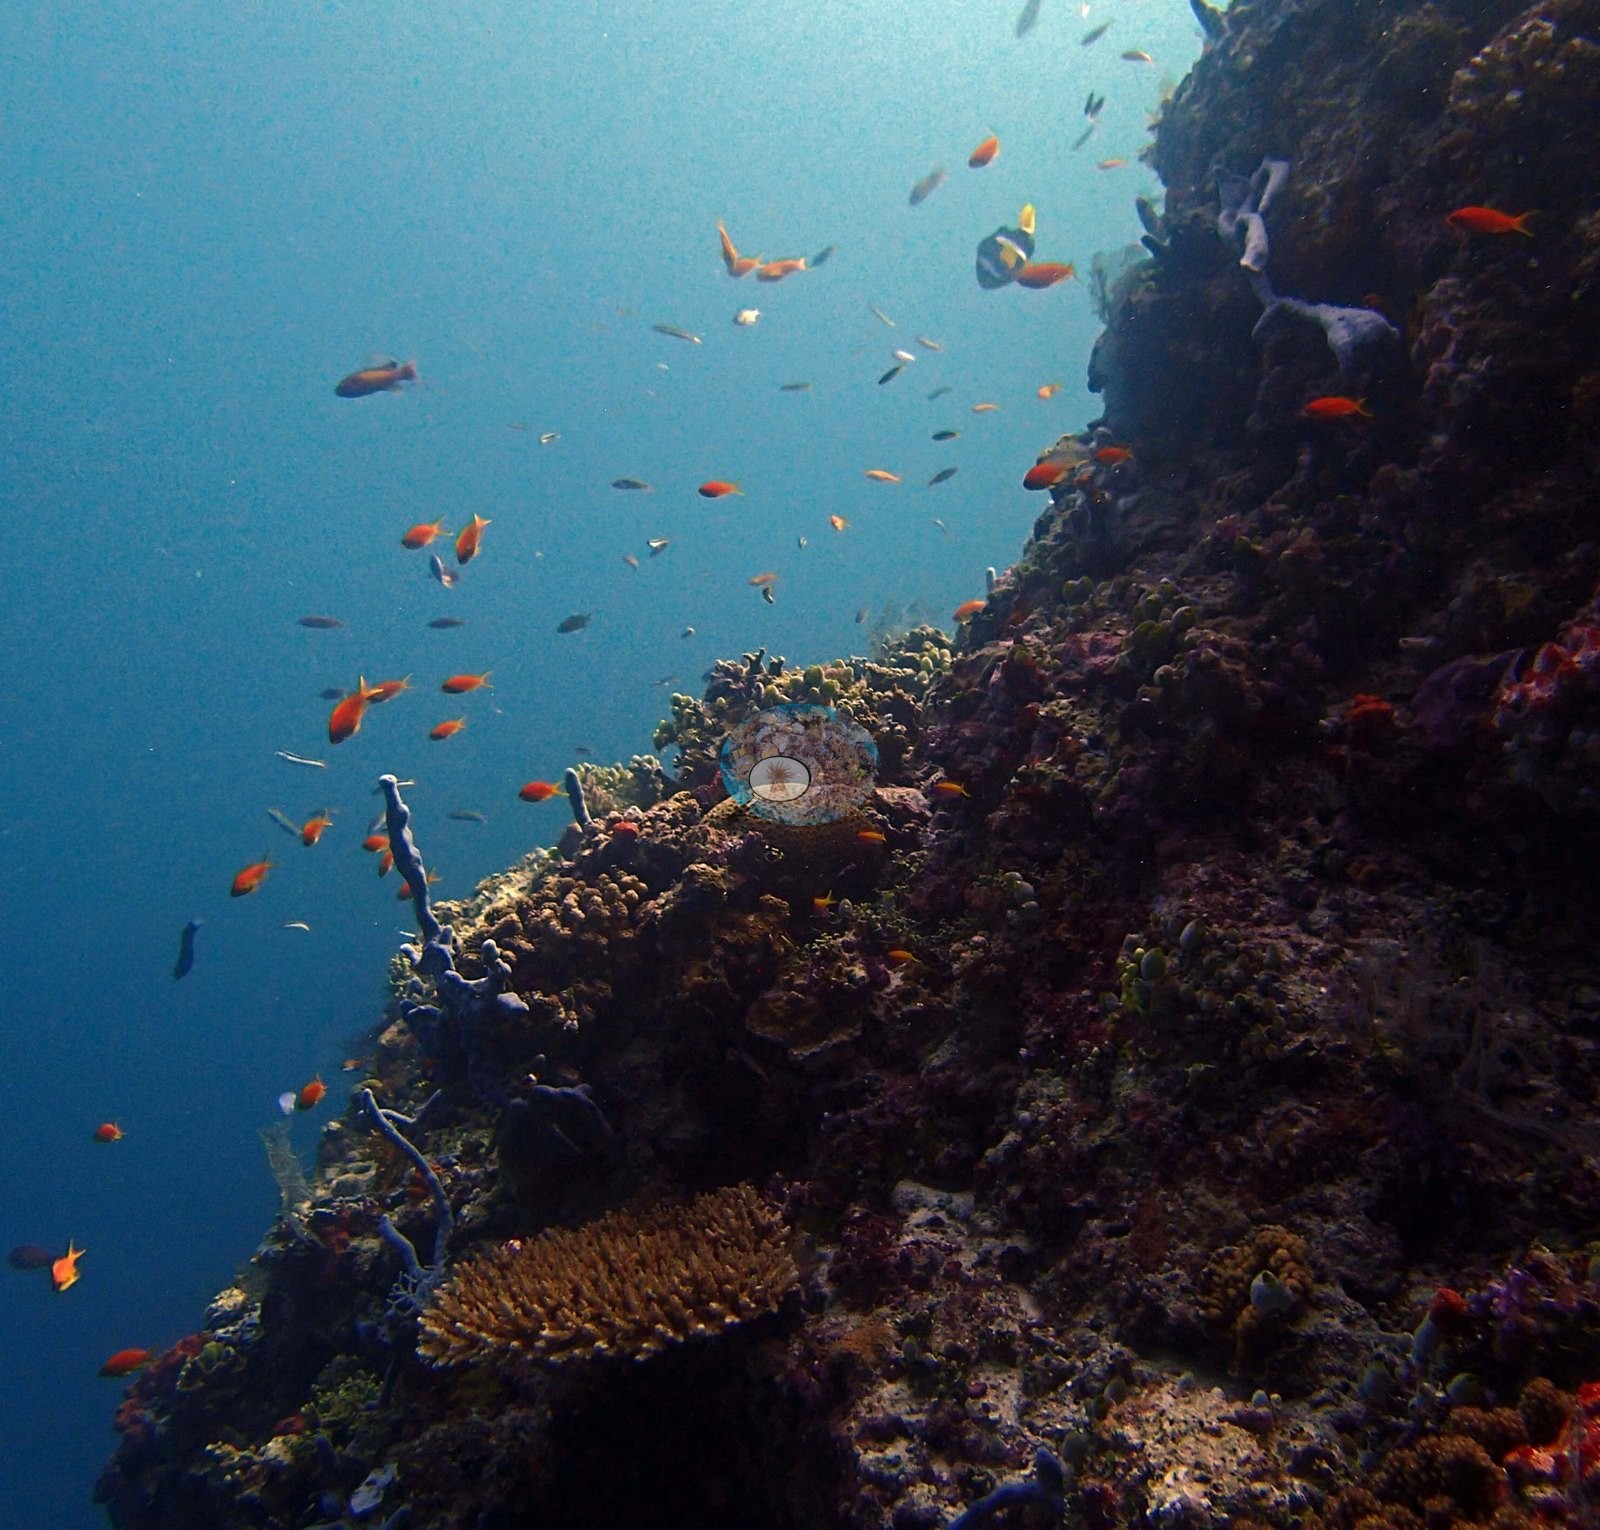
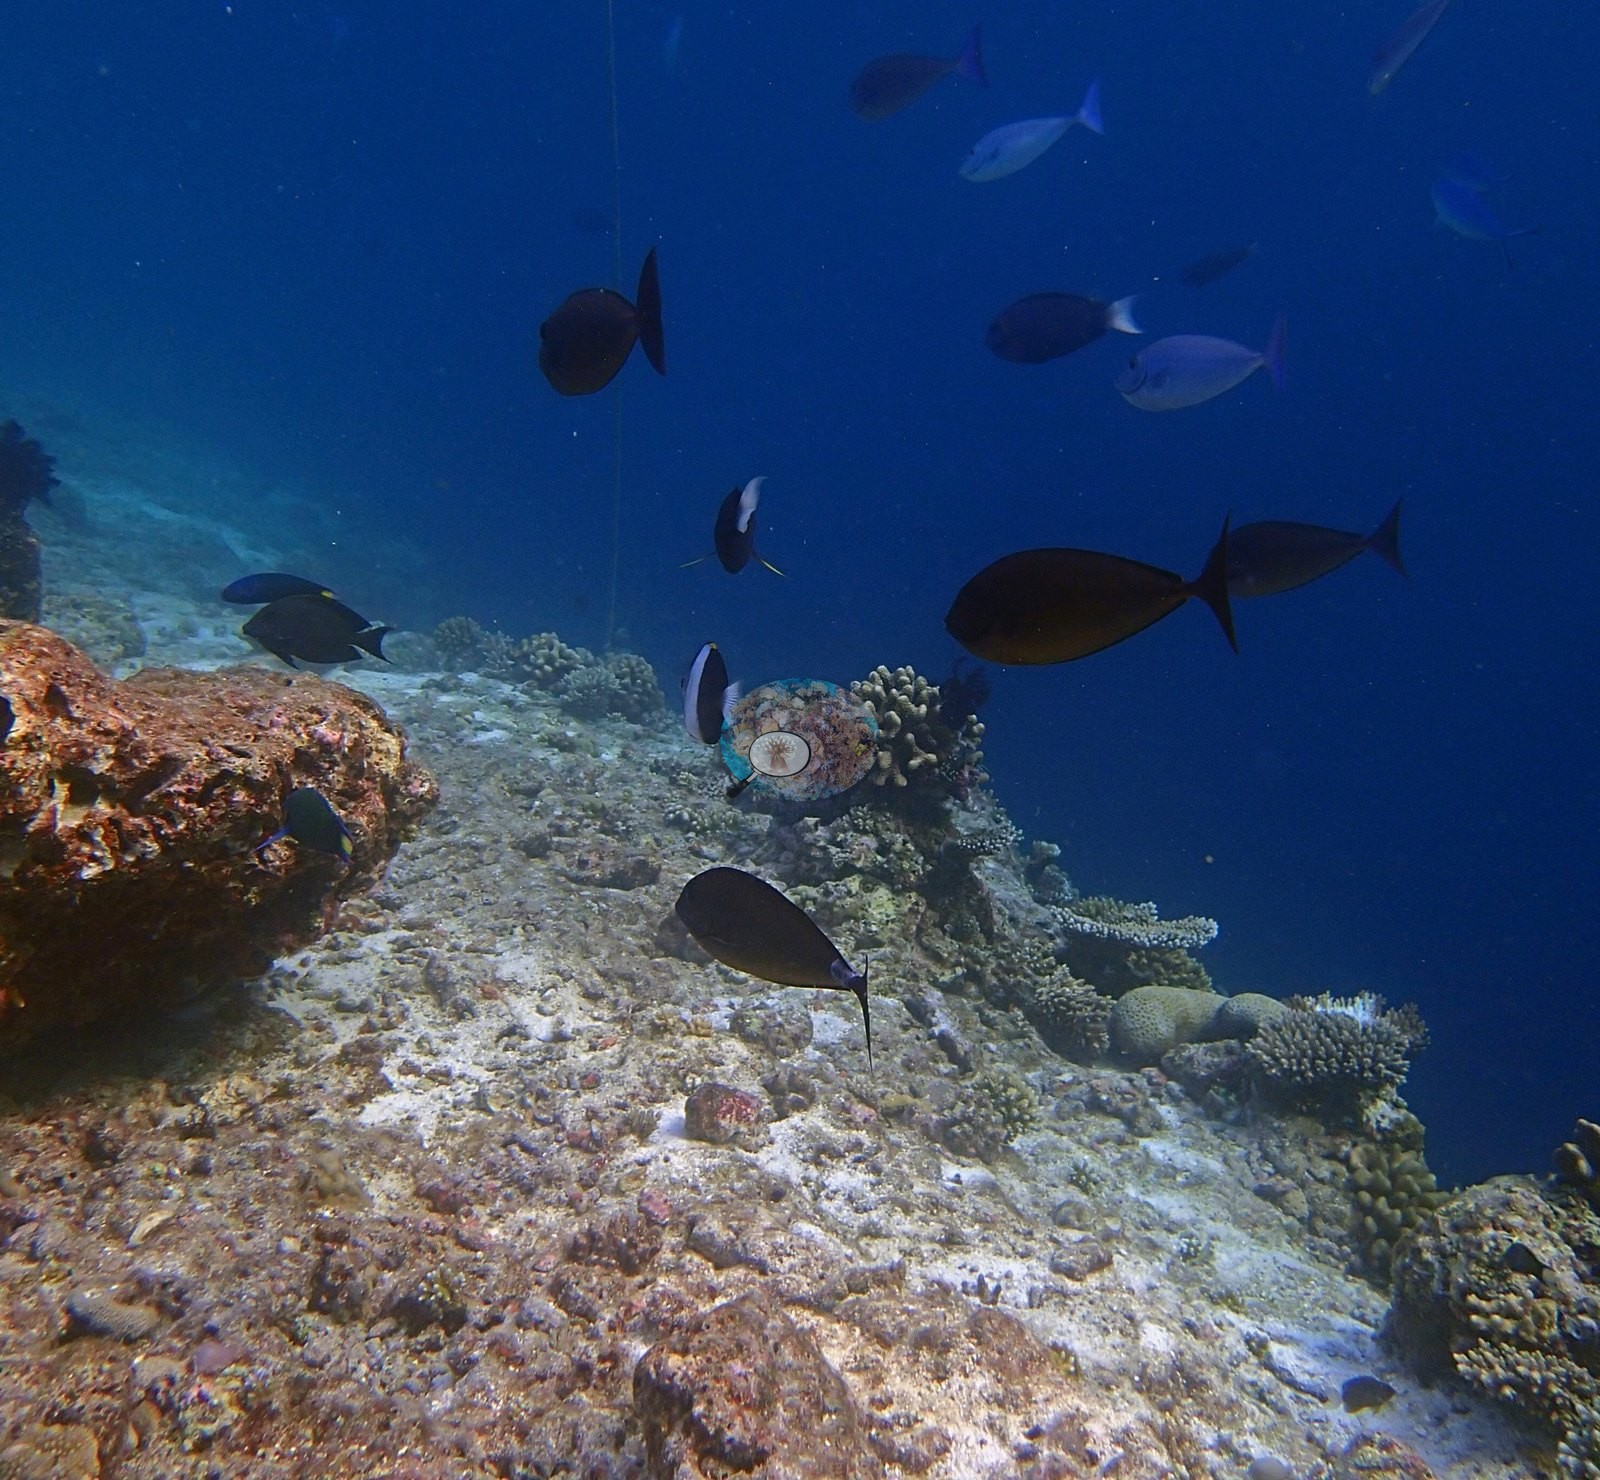
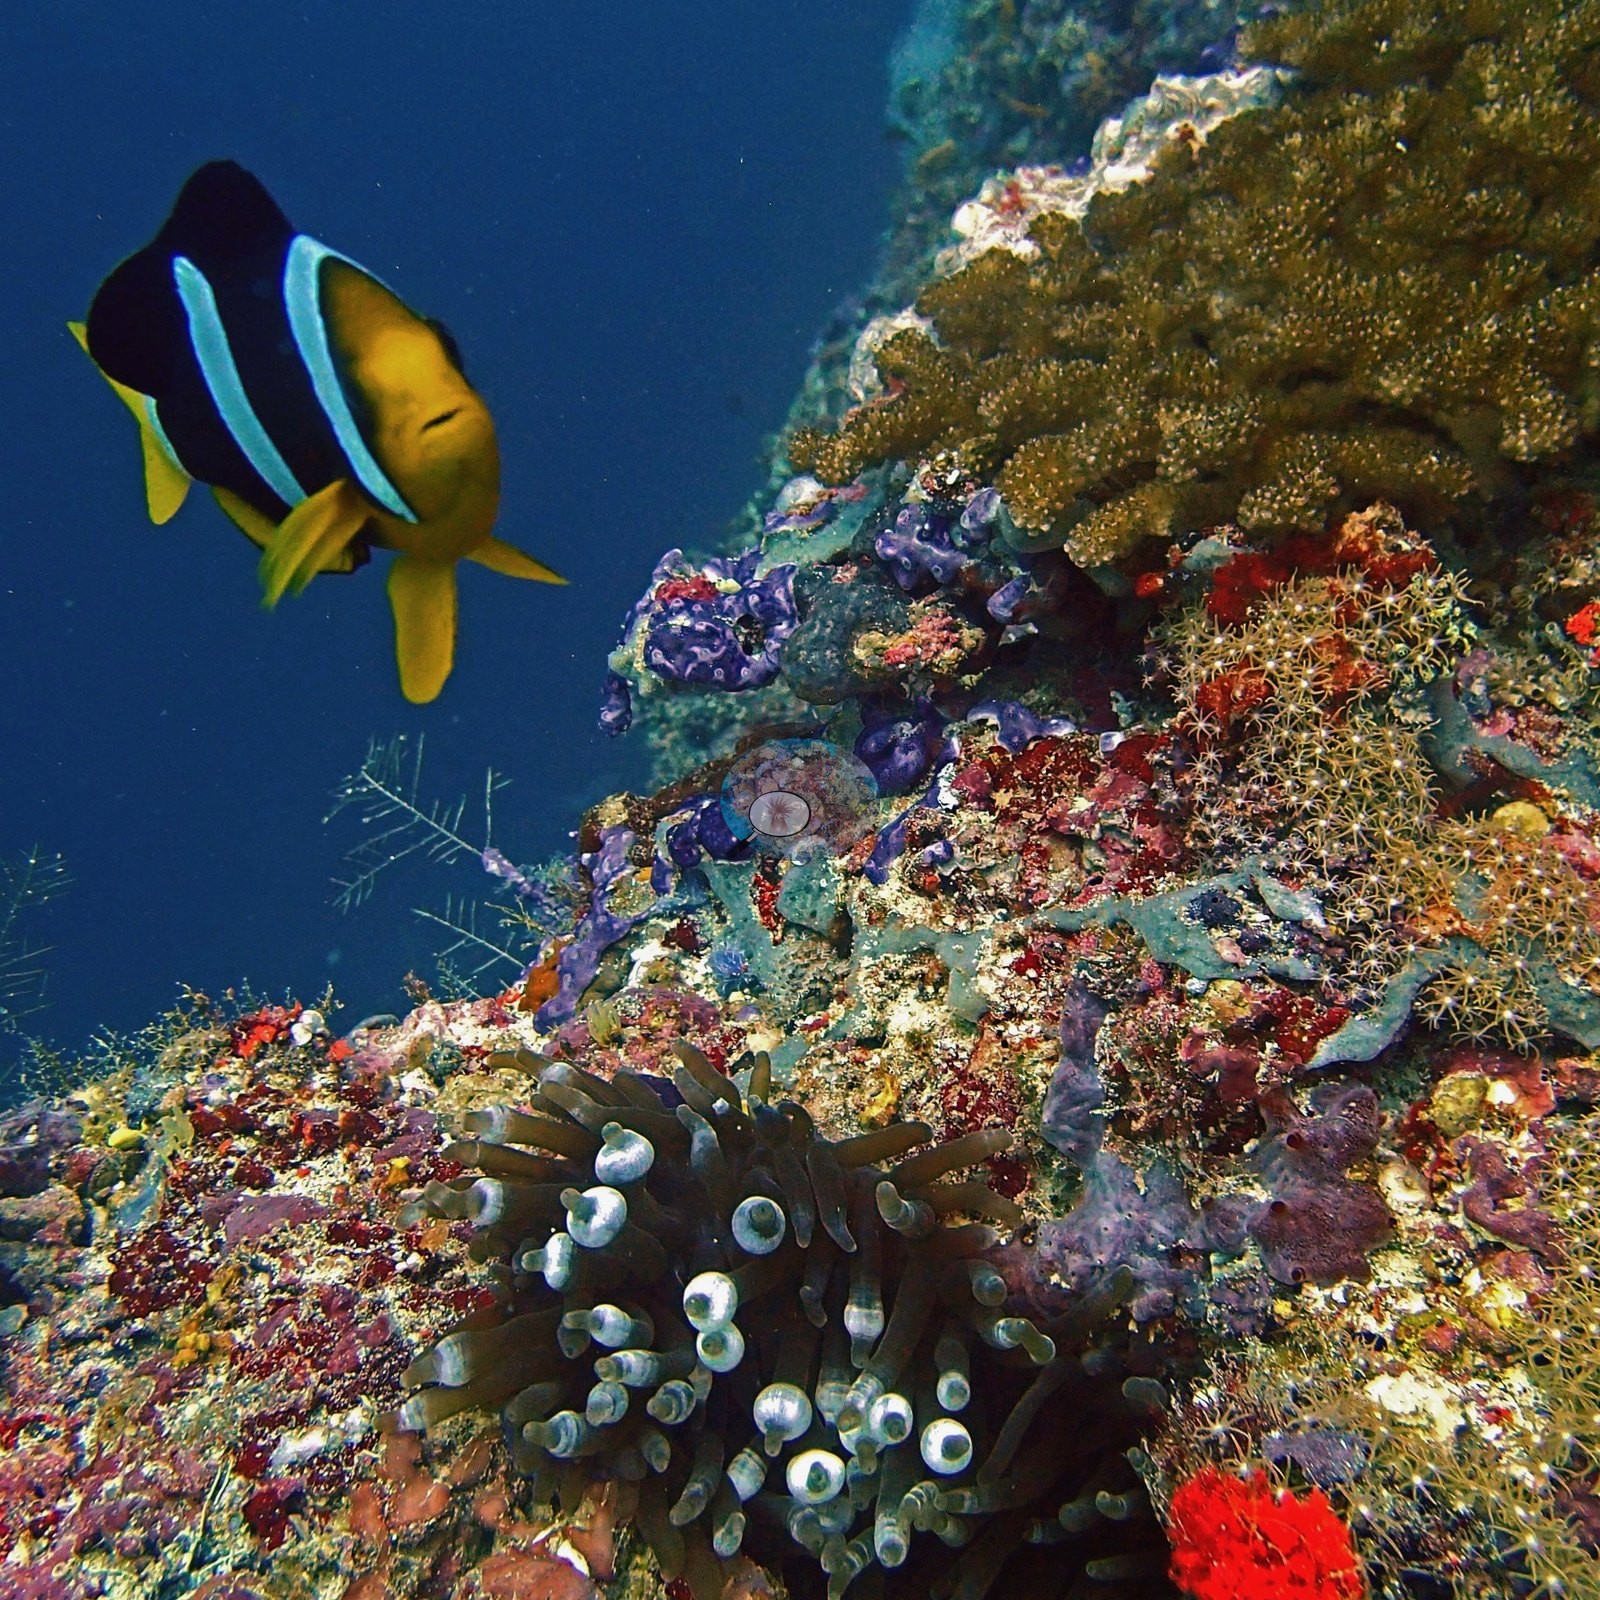
A Clark's anemonefish guards its anemone, a moorish idol works the spur tops, electric-blue fusiliers rip past in formation, and anthias spill over every rim like orange confetti (e.g., Image 4, Image 20).
Comparisons with other data
No independent survey was made at this exact site; the nearest ones are listed in the table below.
Dive record
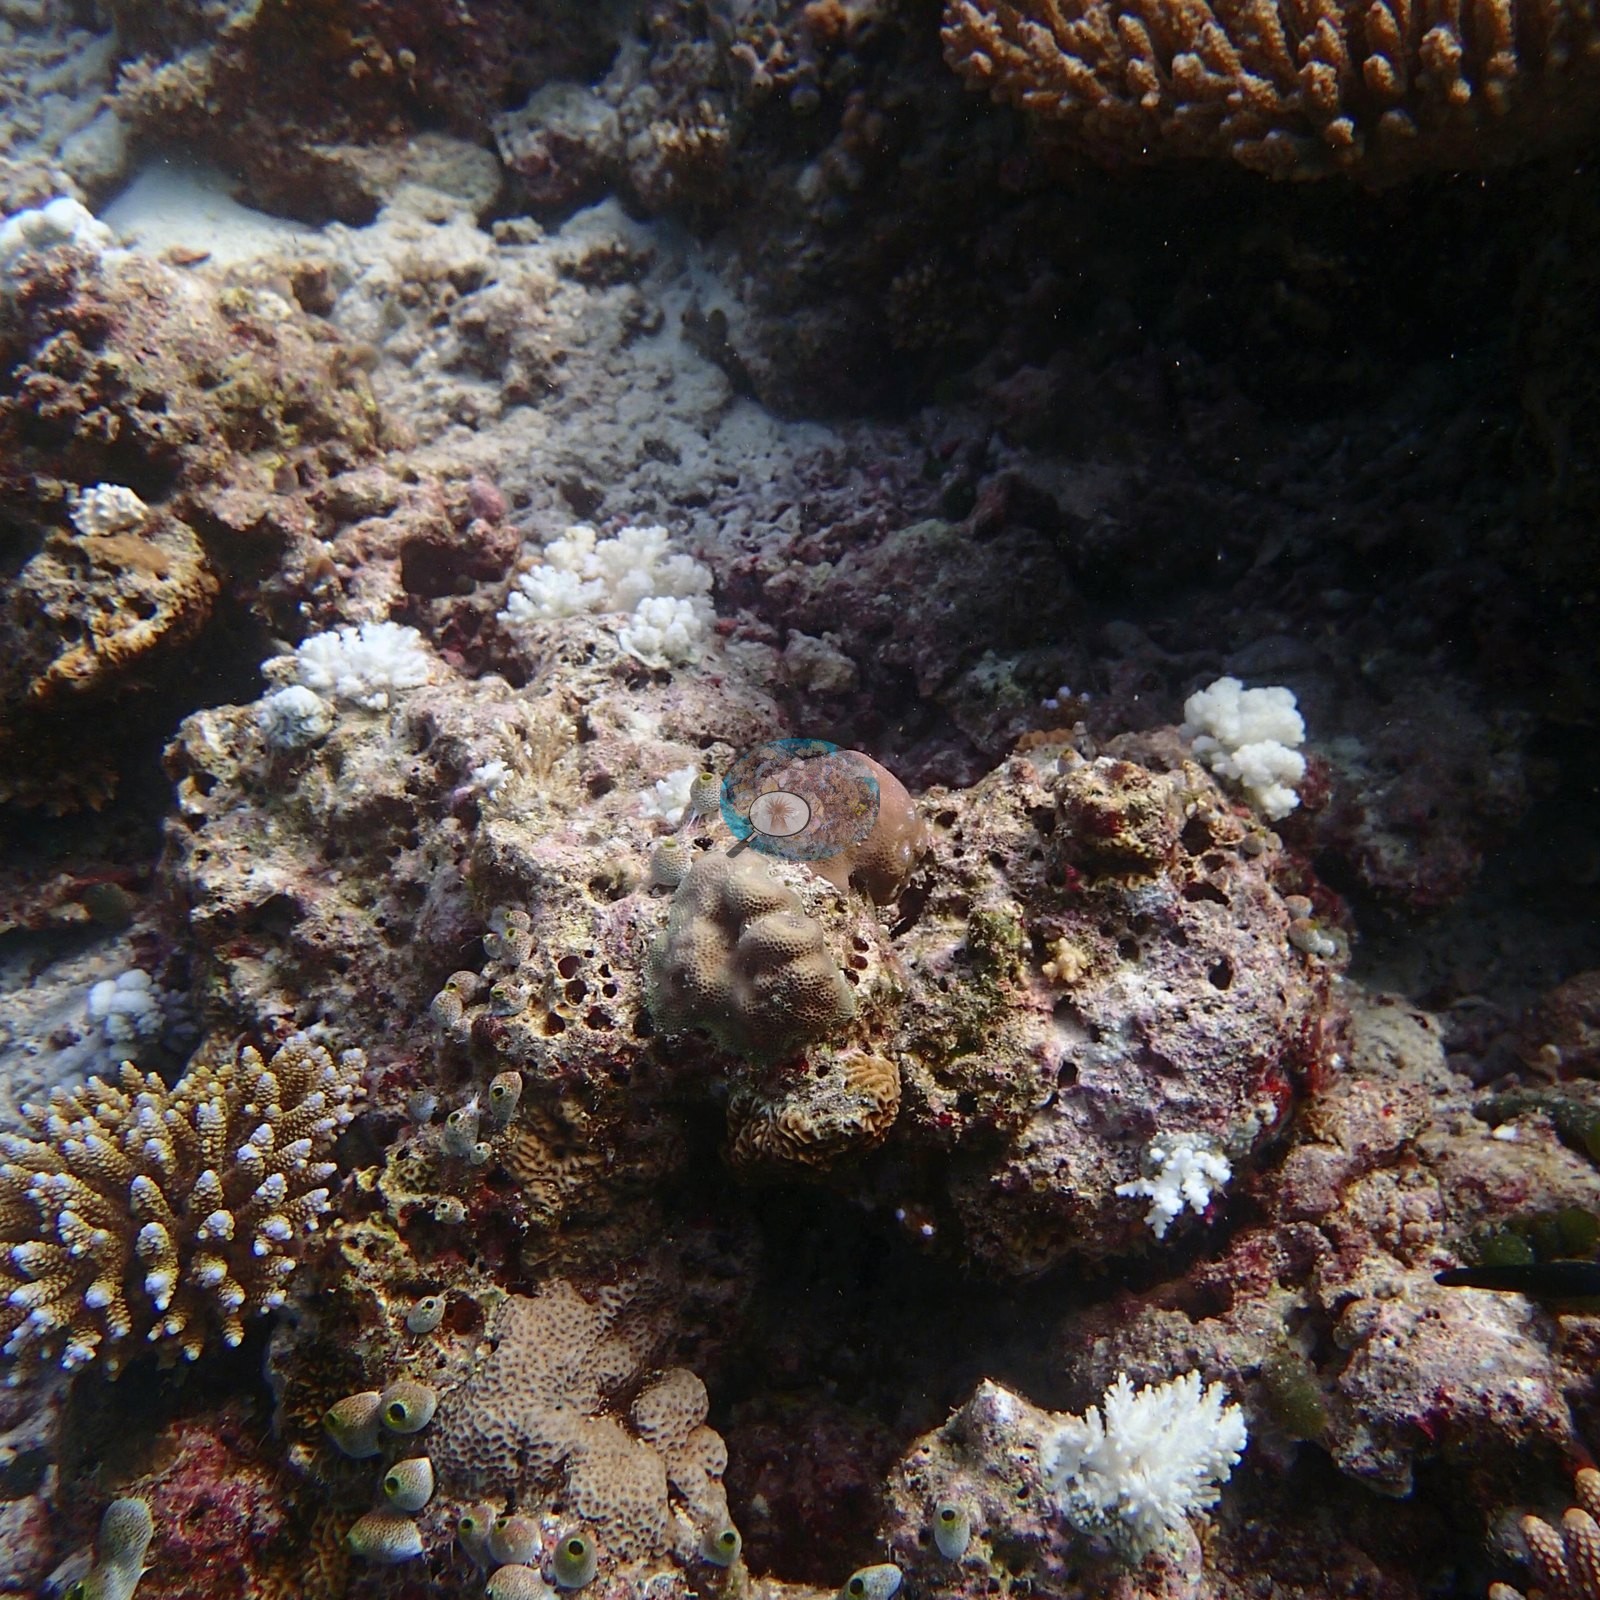
Photographed in January 2016, three months before the El Niño bleaching rewrote these reefs — this is the Maldives at full volume. Revisited in May 2017, when the tagged long-term monitoring colonies here were found largely dead — a stark before-and-after bracketing the 2016 El Niño bleaching.
CV model comparison
More info
As of September 2026 no computer-vision method estimates coral cover accurately on new images, so treat this as indicative rather than a measurement; it is revised as the methods improve.More info
The published figure is the mean of the two methods.| Method | Hard-coral cover (%) |
|---|---|
| In-house DINOv3 | 15.8 |
| CoralSCOP | 19.6 |
| Mean (± SD) | 17.7 ± 2.7 |
| Range | 15.8–19.6 |
Mean ± SD and range are across the computer-vision methods shown.
Independent surveys nearby
| Agency / program | Year(s) | Stations / distance | Link |
|---|---|---|---|
| Reef Check | 2012 | 1 station, 4.68 km | Records ↓ |
| XL Catlin Seaview Survey | 2015–2017 | 2 stations, 4.79–4.92 km | Records ↓ |
 Dr. Coral (CRD)
Within 5 km, 3 independent survey stations recorded hard coral cover in 6 records between 2012 and 2017. Of the 1 station surveyed in more than one year, 1 changed by less than 5 percentage points between their first and latest surveys. The longest record, transect 37035 (XL Catlin Seaview Survey, 4.79 km away), went from 7.1% in 2015 to 5.5% in 2017. The most recent nearby survey is from 2017, so these values predate recent heat stress. This site's own estimate (18%) sits within the range of these surveys (5.5–38%); the methods differ, so the comparison is context, not a like-for-like test.
Collected by other programs using different methods (Reef Check uses point-intercept transects; the XL Catlin Seaview Survey uses photo-transects with automated image annotation), so these are context for the figures above, not a like-for-like comparison. Where a station was surveyed more than once the range is shown. Station names are not dive-site names.
| Agency | Site / location | Date | Hard coral cover (%) | Distance | Link |
|---|---|---|---|---|---|
| Reef Check | Biyadhoo House Reef | 2012 | 18% (3 surveys) | 4.68 km | — |
| XL Catlin Seaview Survey | transect 37035 | 2015–2017 | 5.5–7.1% (2 images) | 4.79 km | — |
| XL Catlin Seaview Survey | transect 37036 | 2015 | 38% | 4.92 km | — |
Data & links
All images from Coral Reef Diagnostics. Data are from Coral Reef Diagnostics and the organizations named in the data-sources table above.
© Coral Reef Diagnostics.