
Maldives - Anantara Dhigu house reef

Part of the regional summaries: Maldives - Central (Male Atolls / Ari / Vaavu) and Maldives
More info
Maldives (NOAA CRW virtual station) · Maldives ecoregion mean=2.9°C-heating weeksAnantara Dhigu's house reef is carpeted in tabletop corals running to the edge of visibility, with dives here spanning a yellow-soft-coral wall drift and an underwater-restaurant coral nursery. A crown-of-thorns starfish was spotted amid feeding scars on table corals just months before the 2016 El Nino bleaching. Computer vision cover estimate is 24-38%, averaging 31%.
Four independent survey stations shown with the program’s logo — click one to see how far it is from this site.
Ten other CRD dive sites within 5 km shown in orange — click a marker to open its page.
8 of these 25 photographs are shown beside the text that discusses them under "Site description" below.
Site description
General benthic features
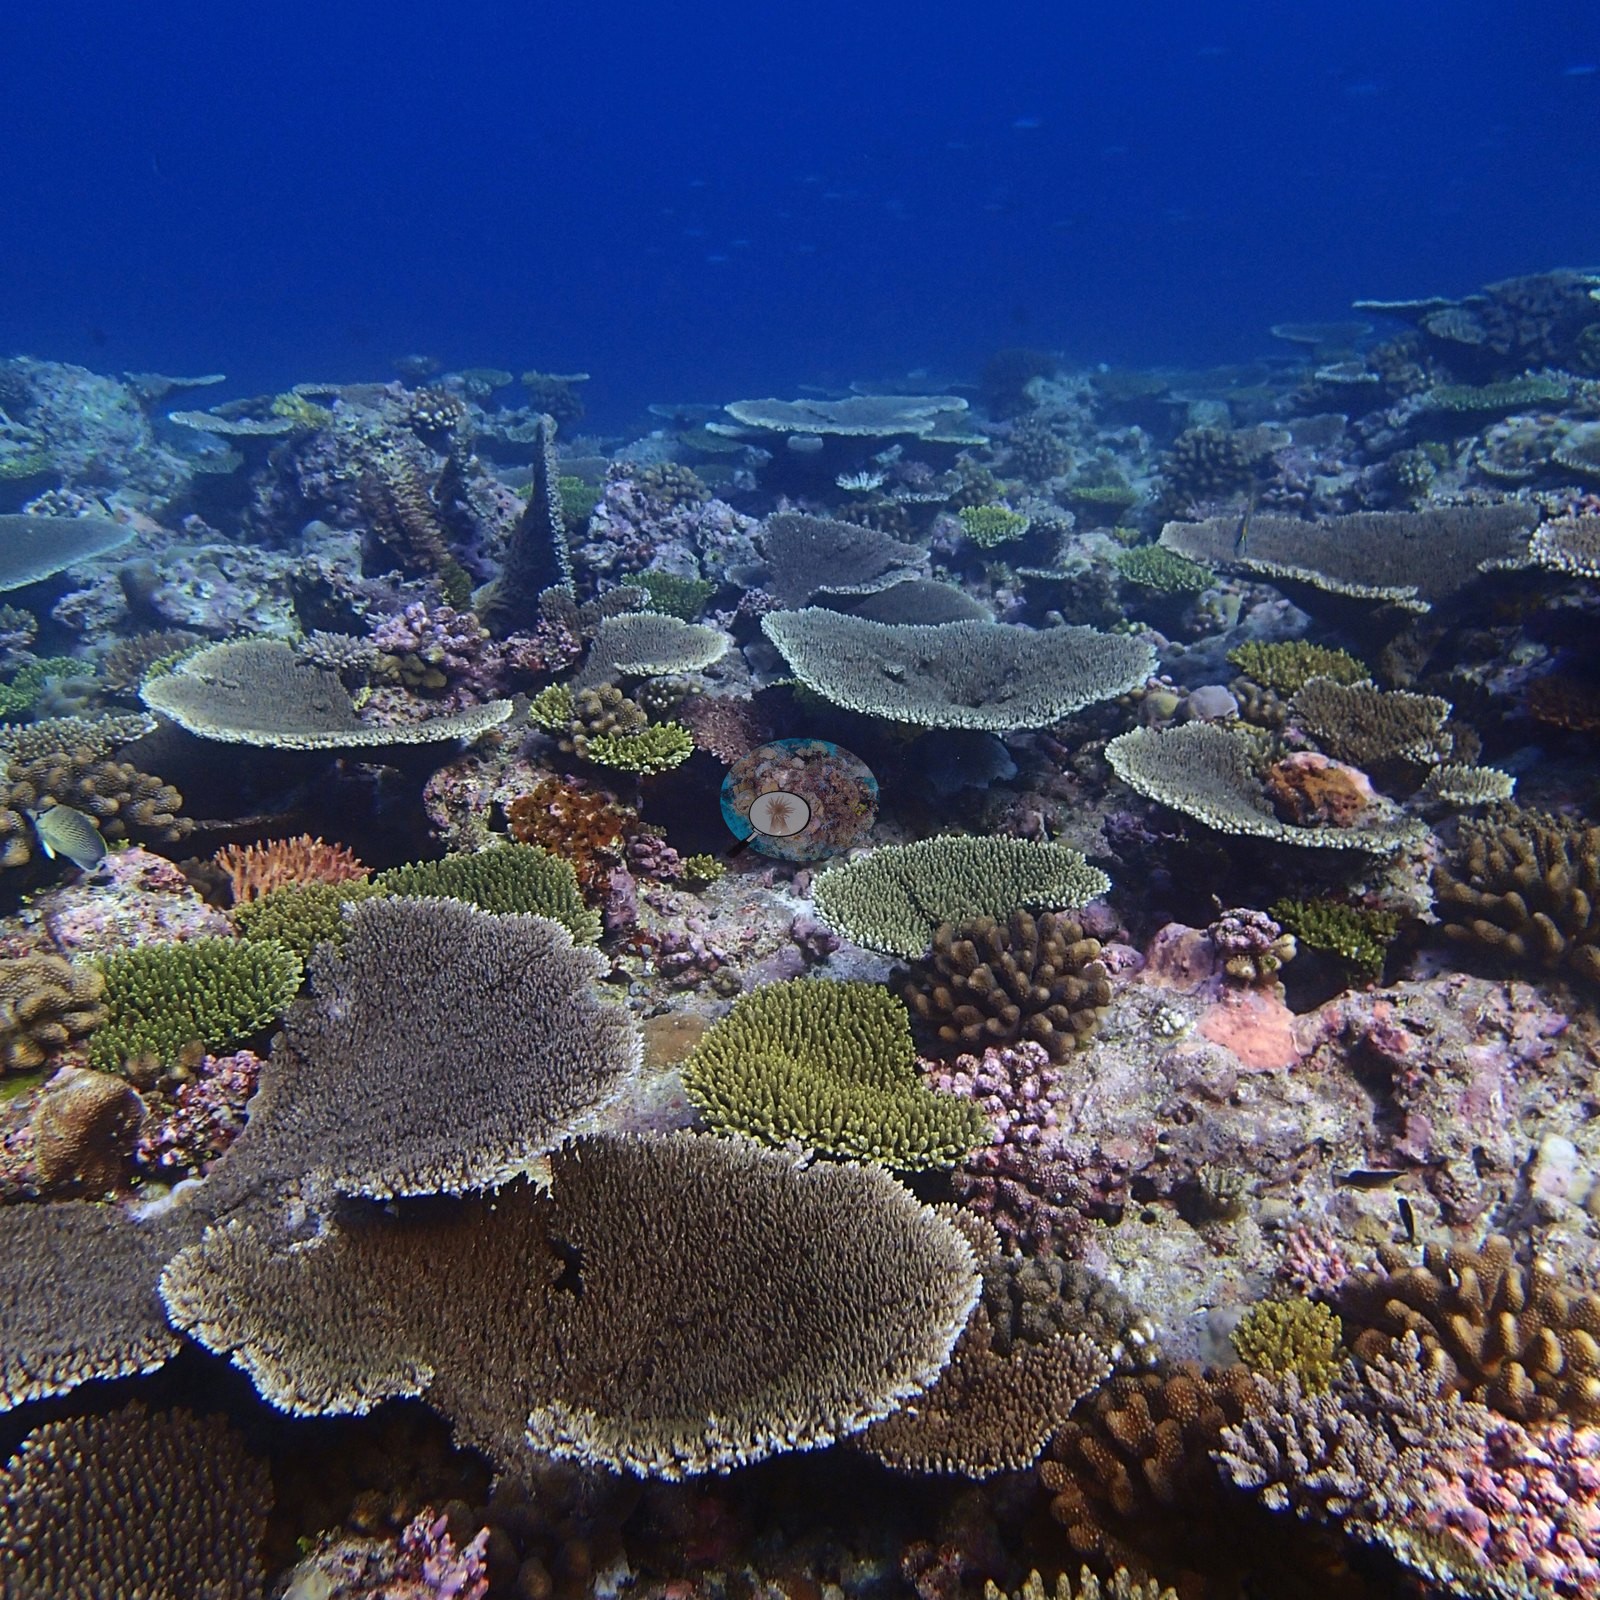
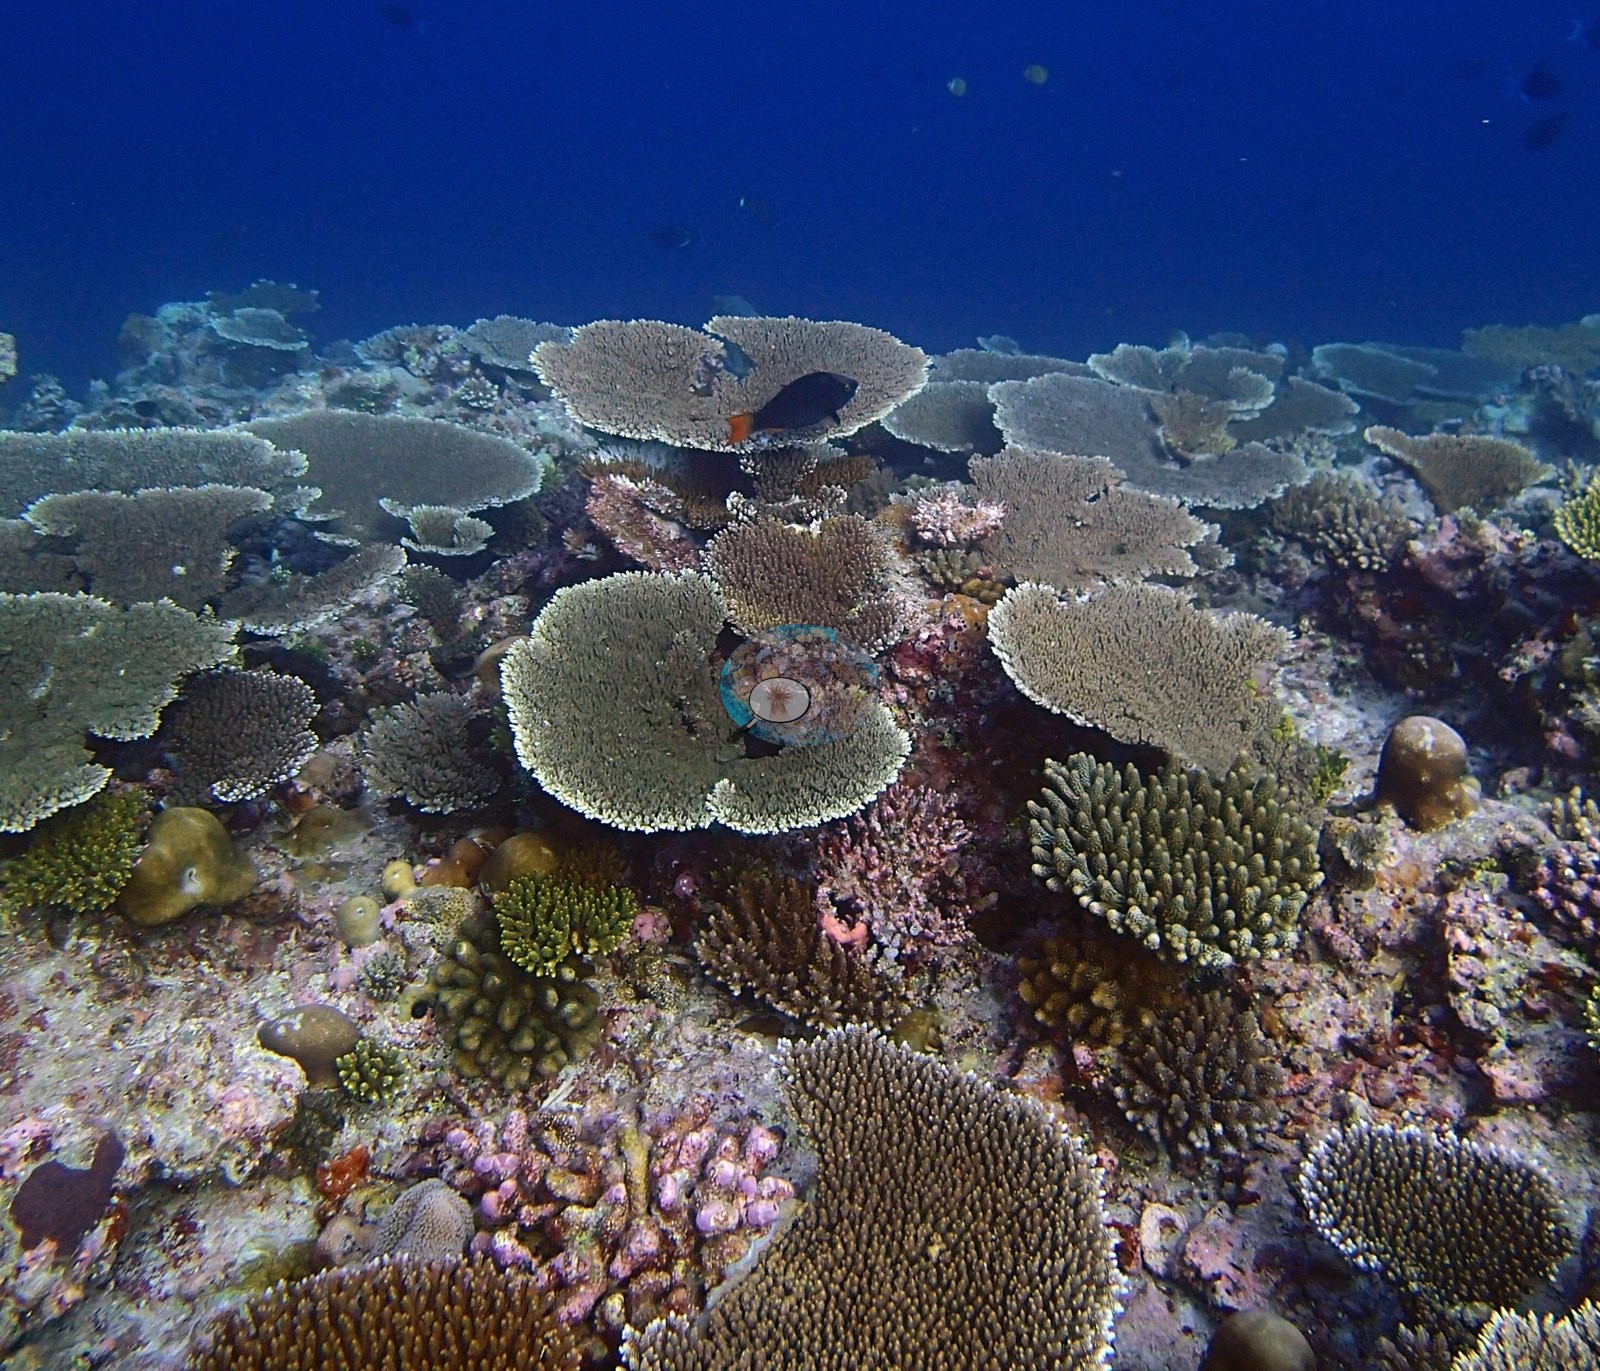
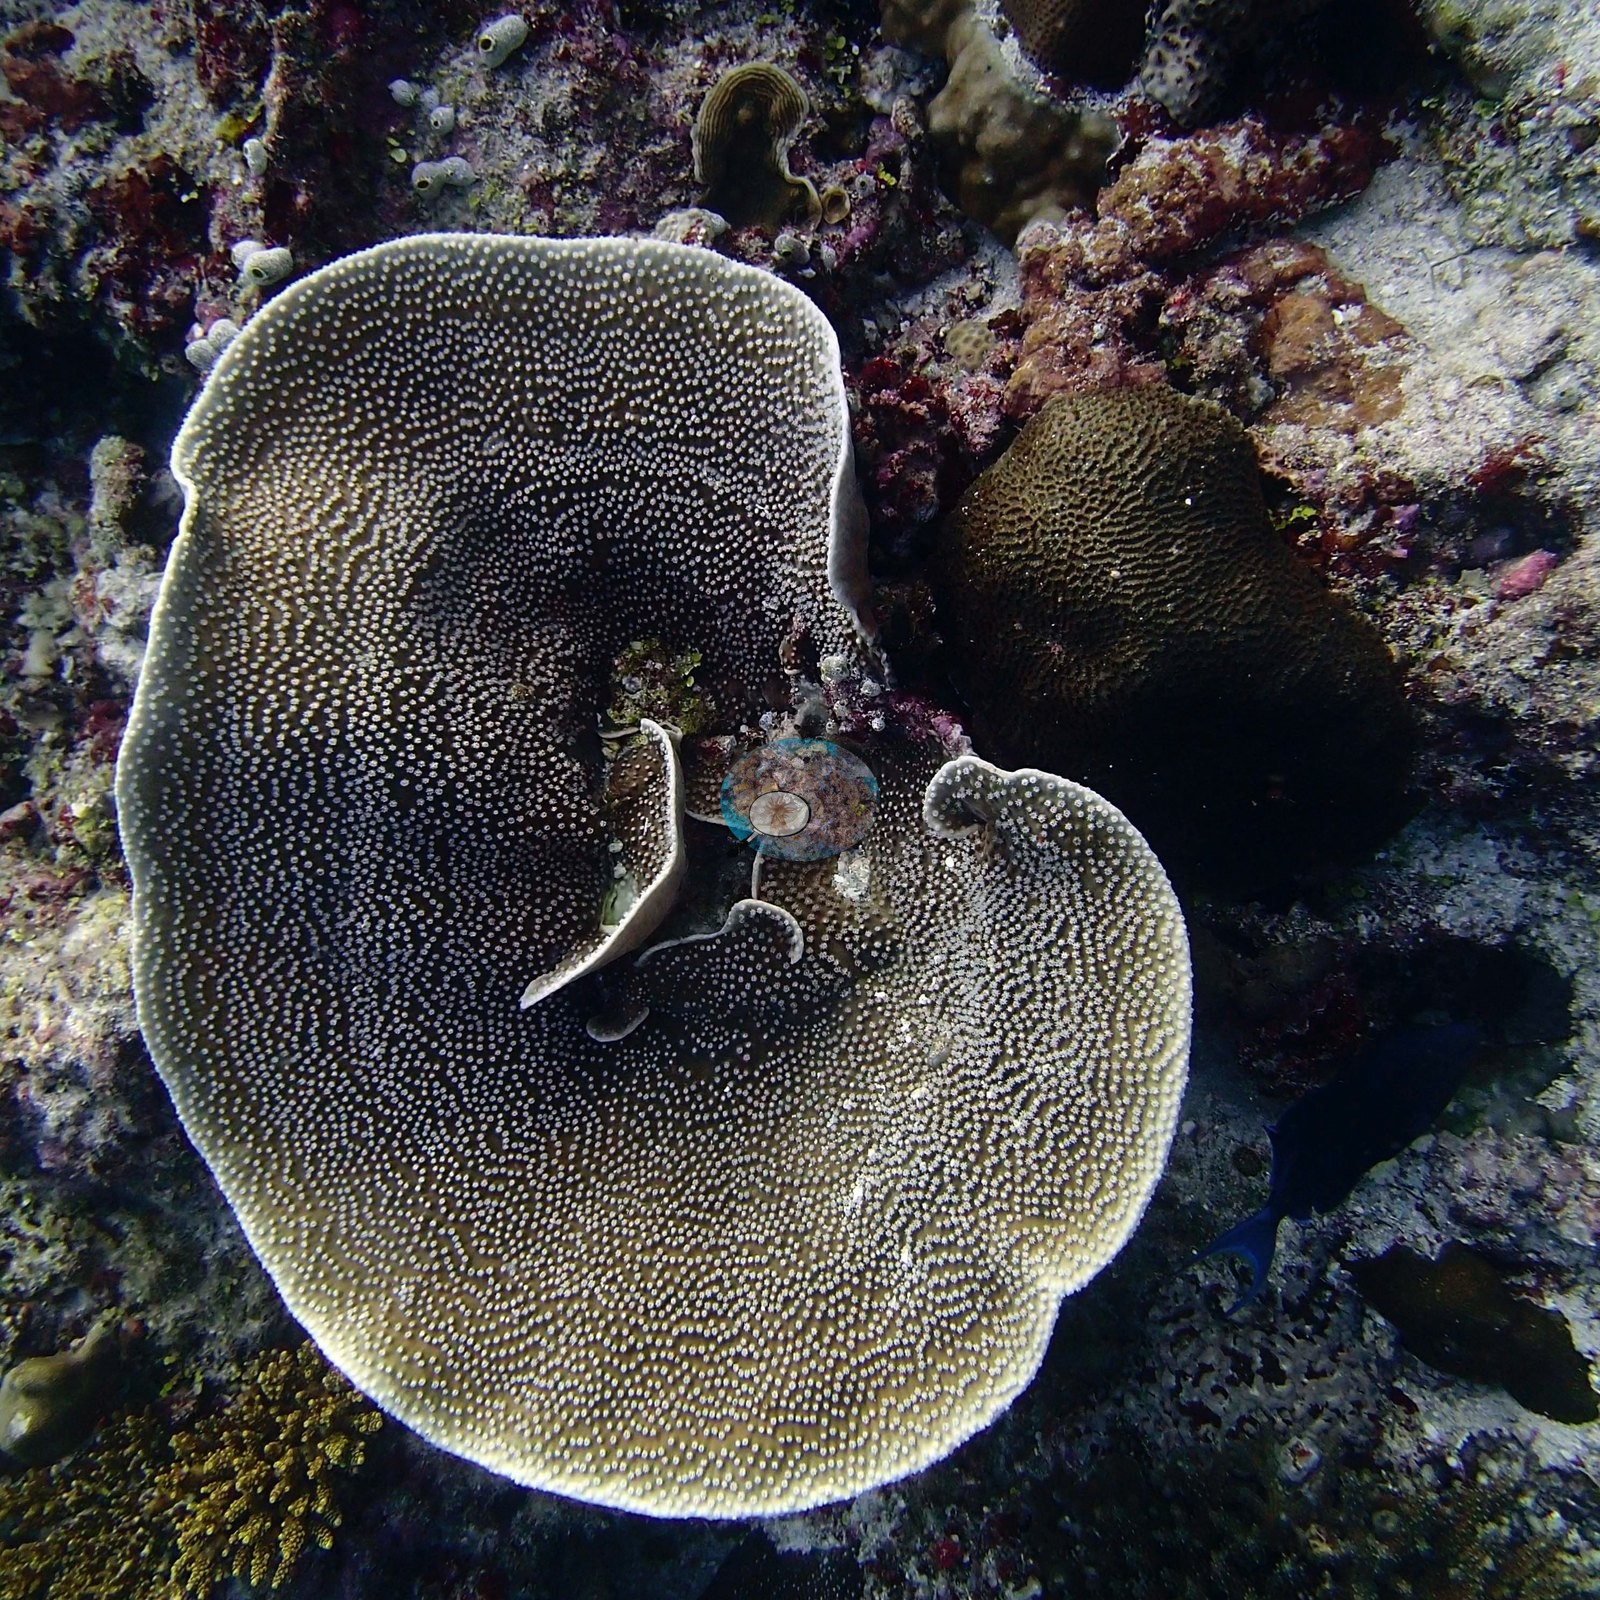
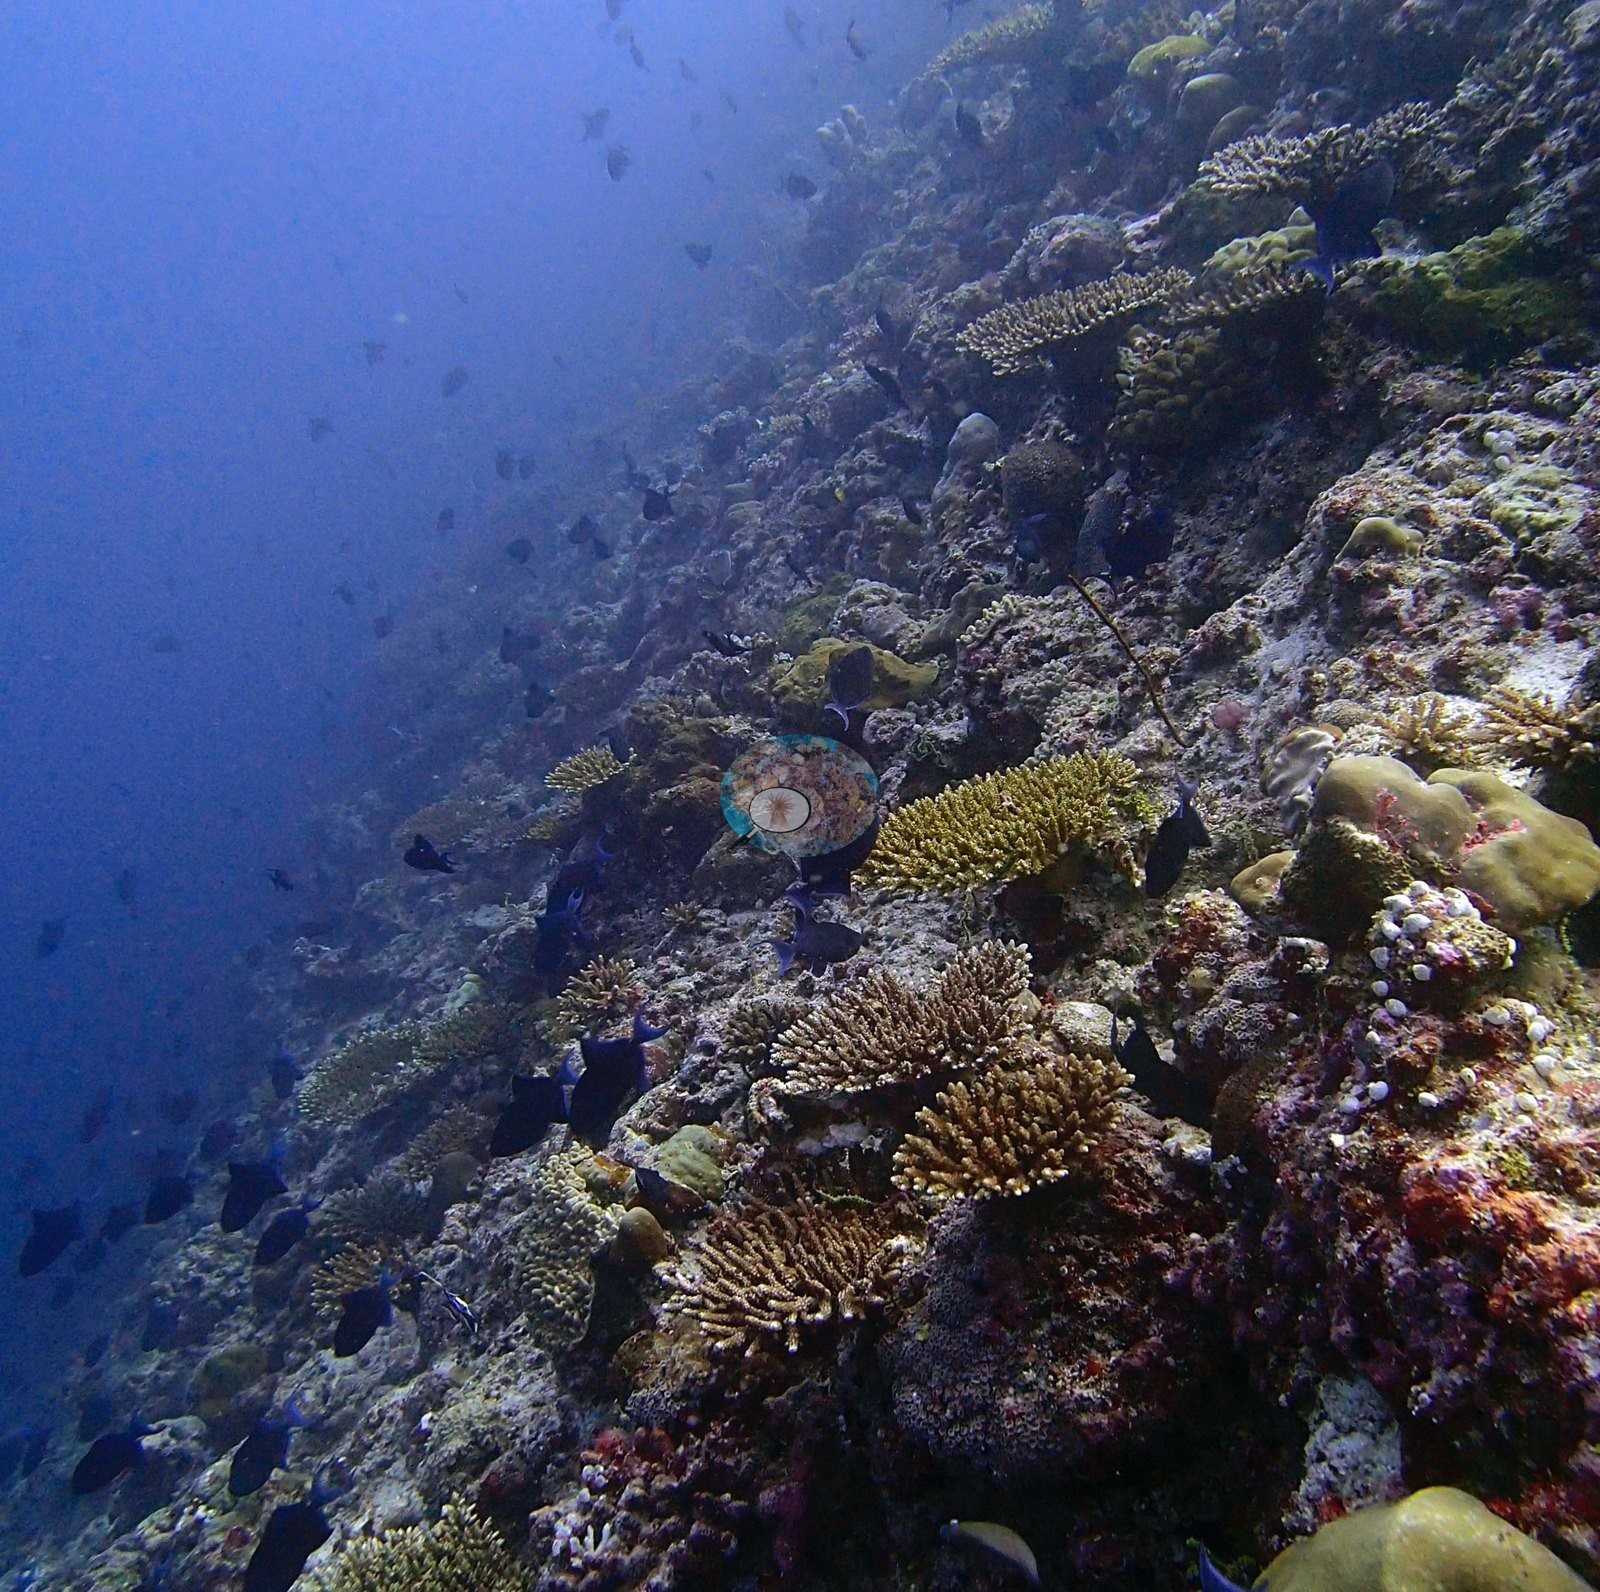
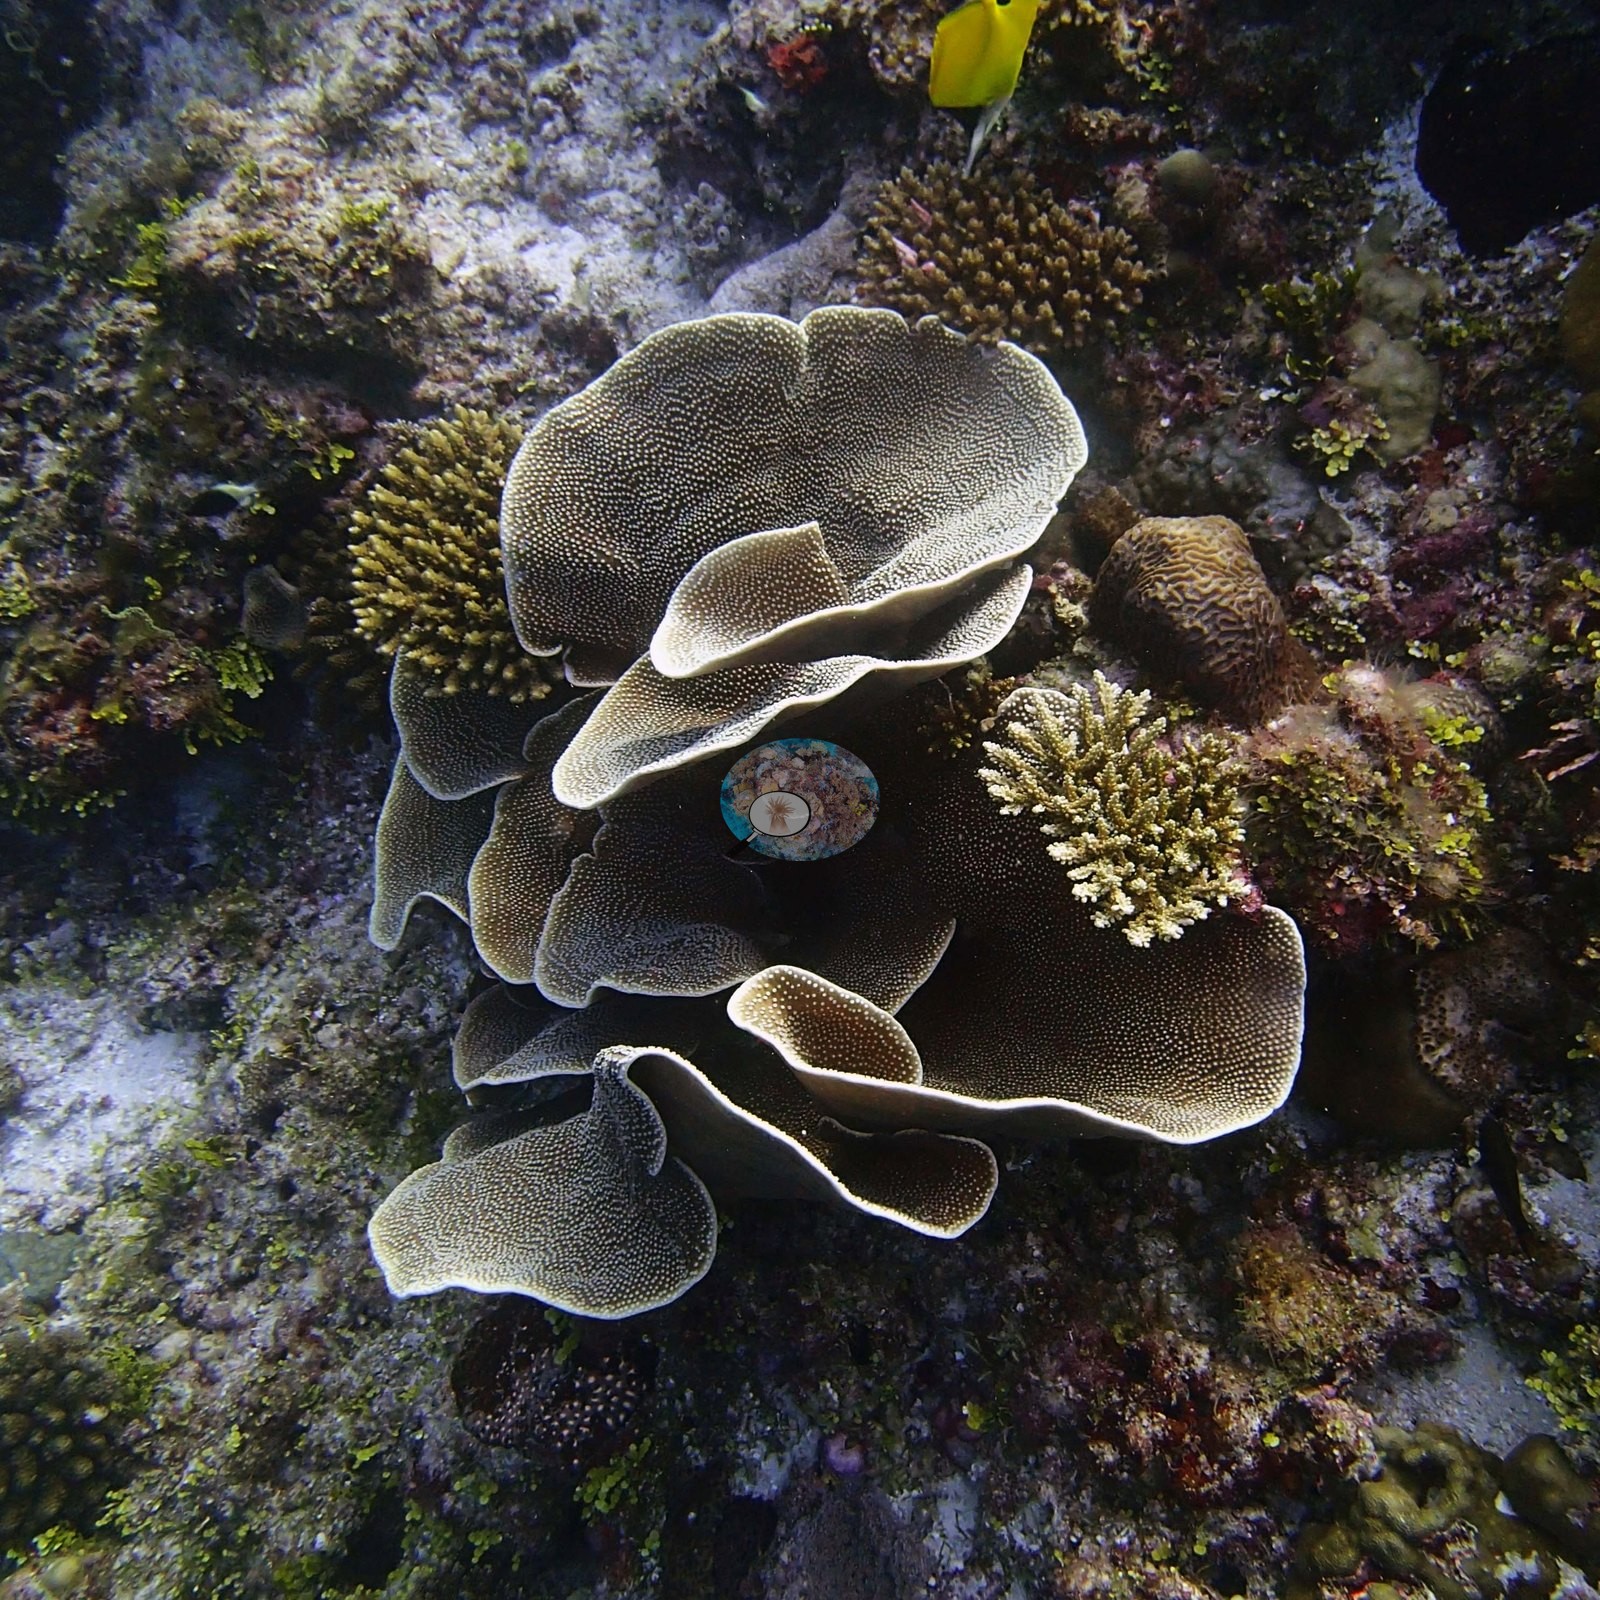
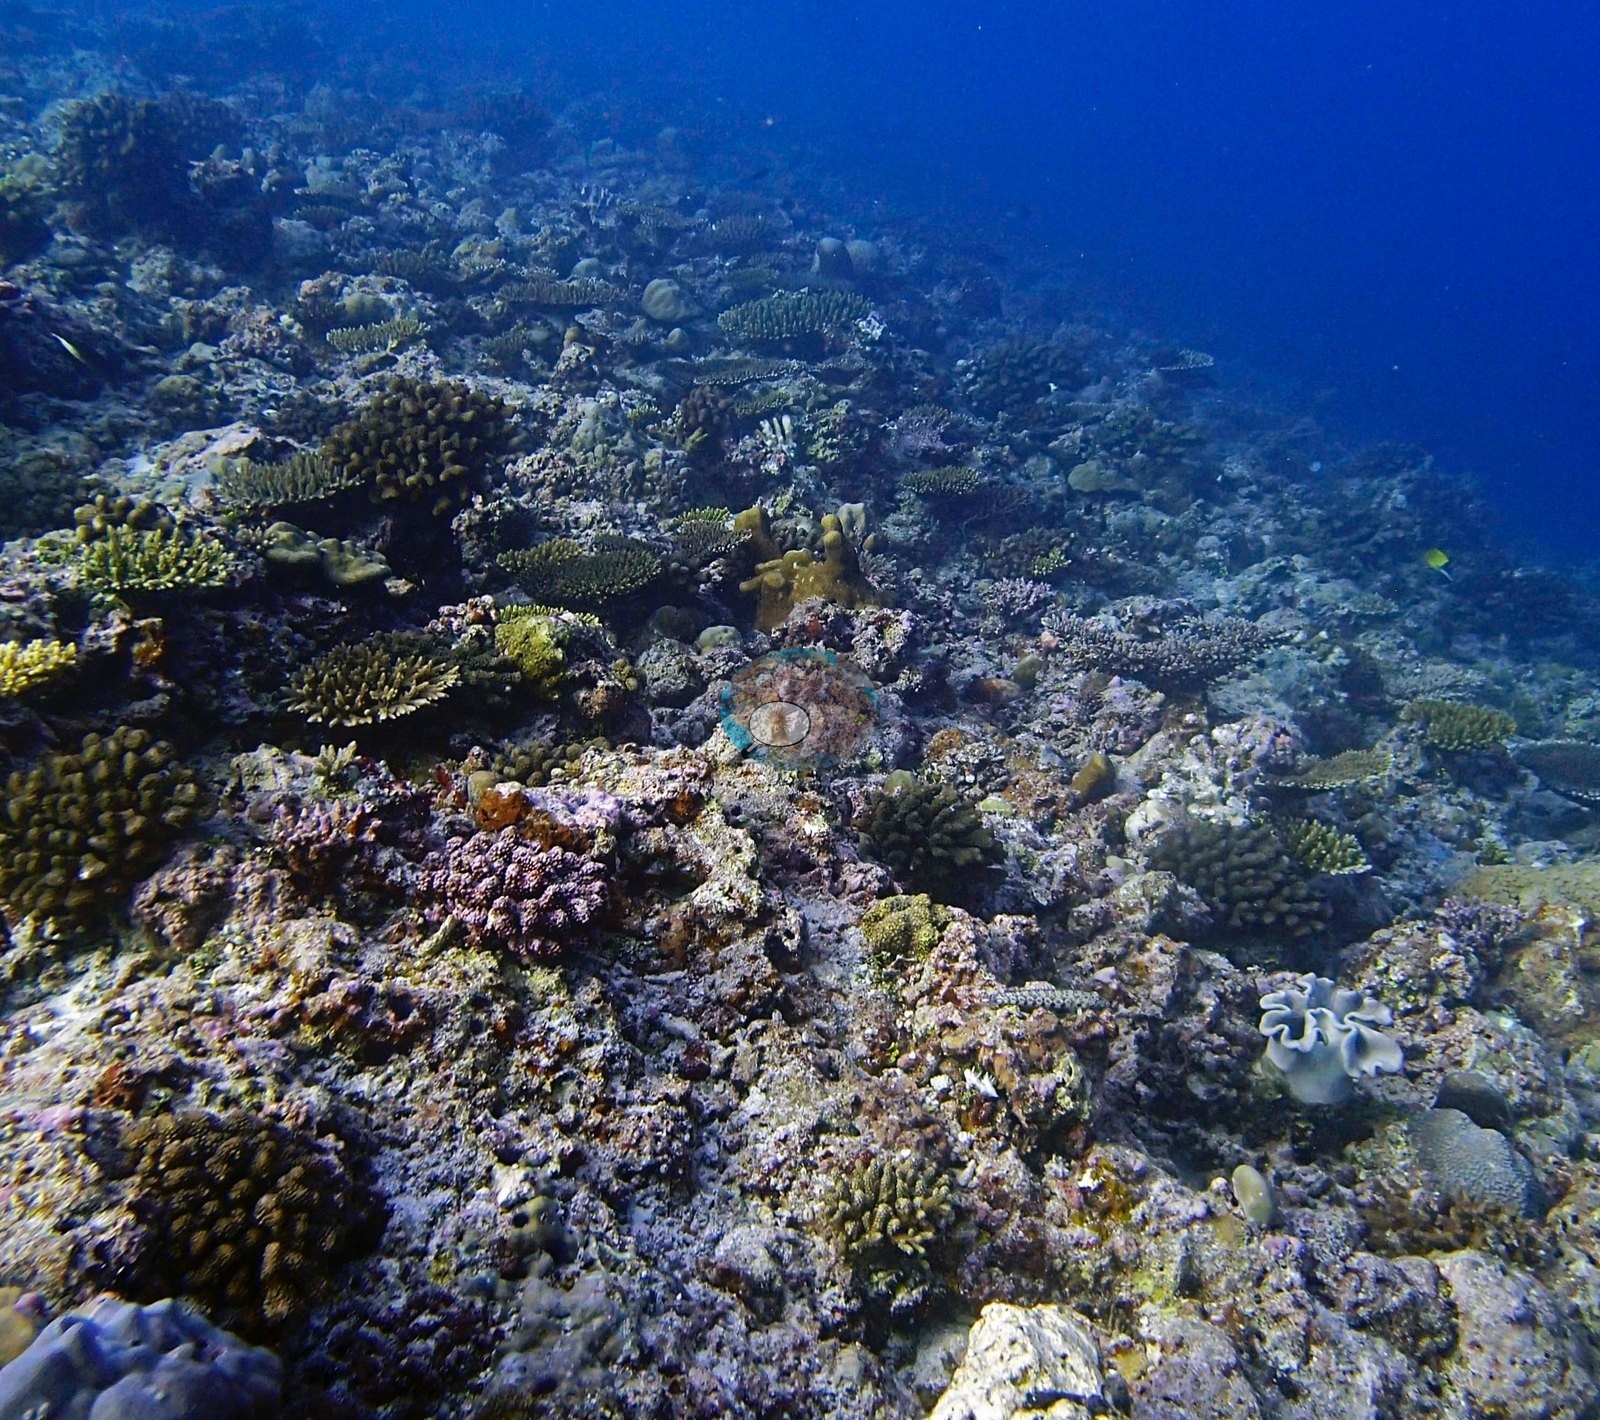
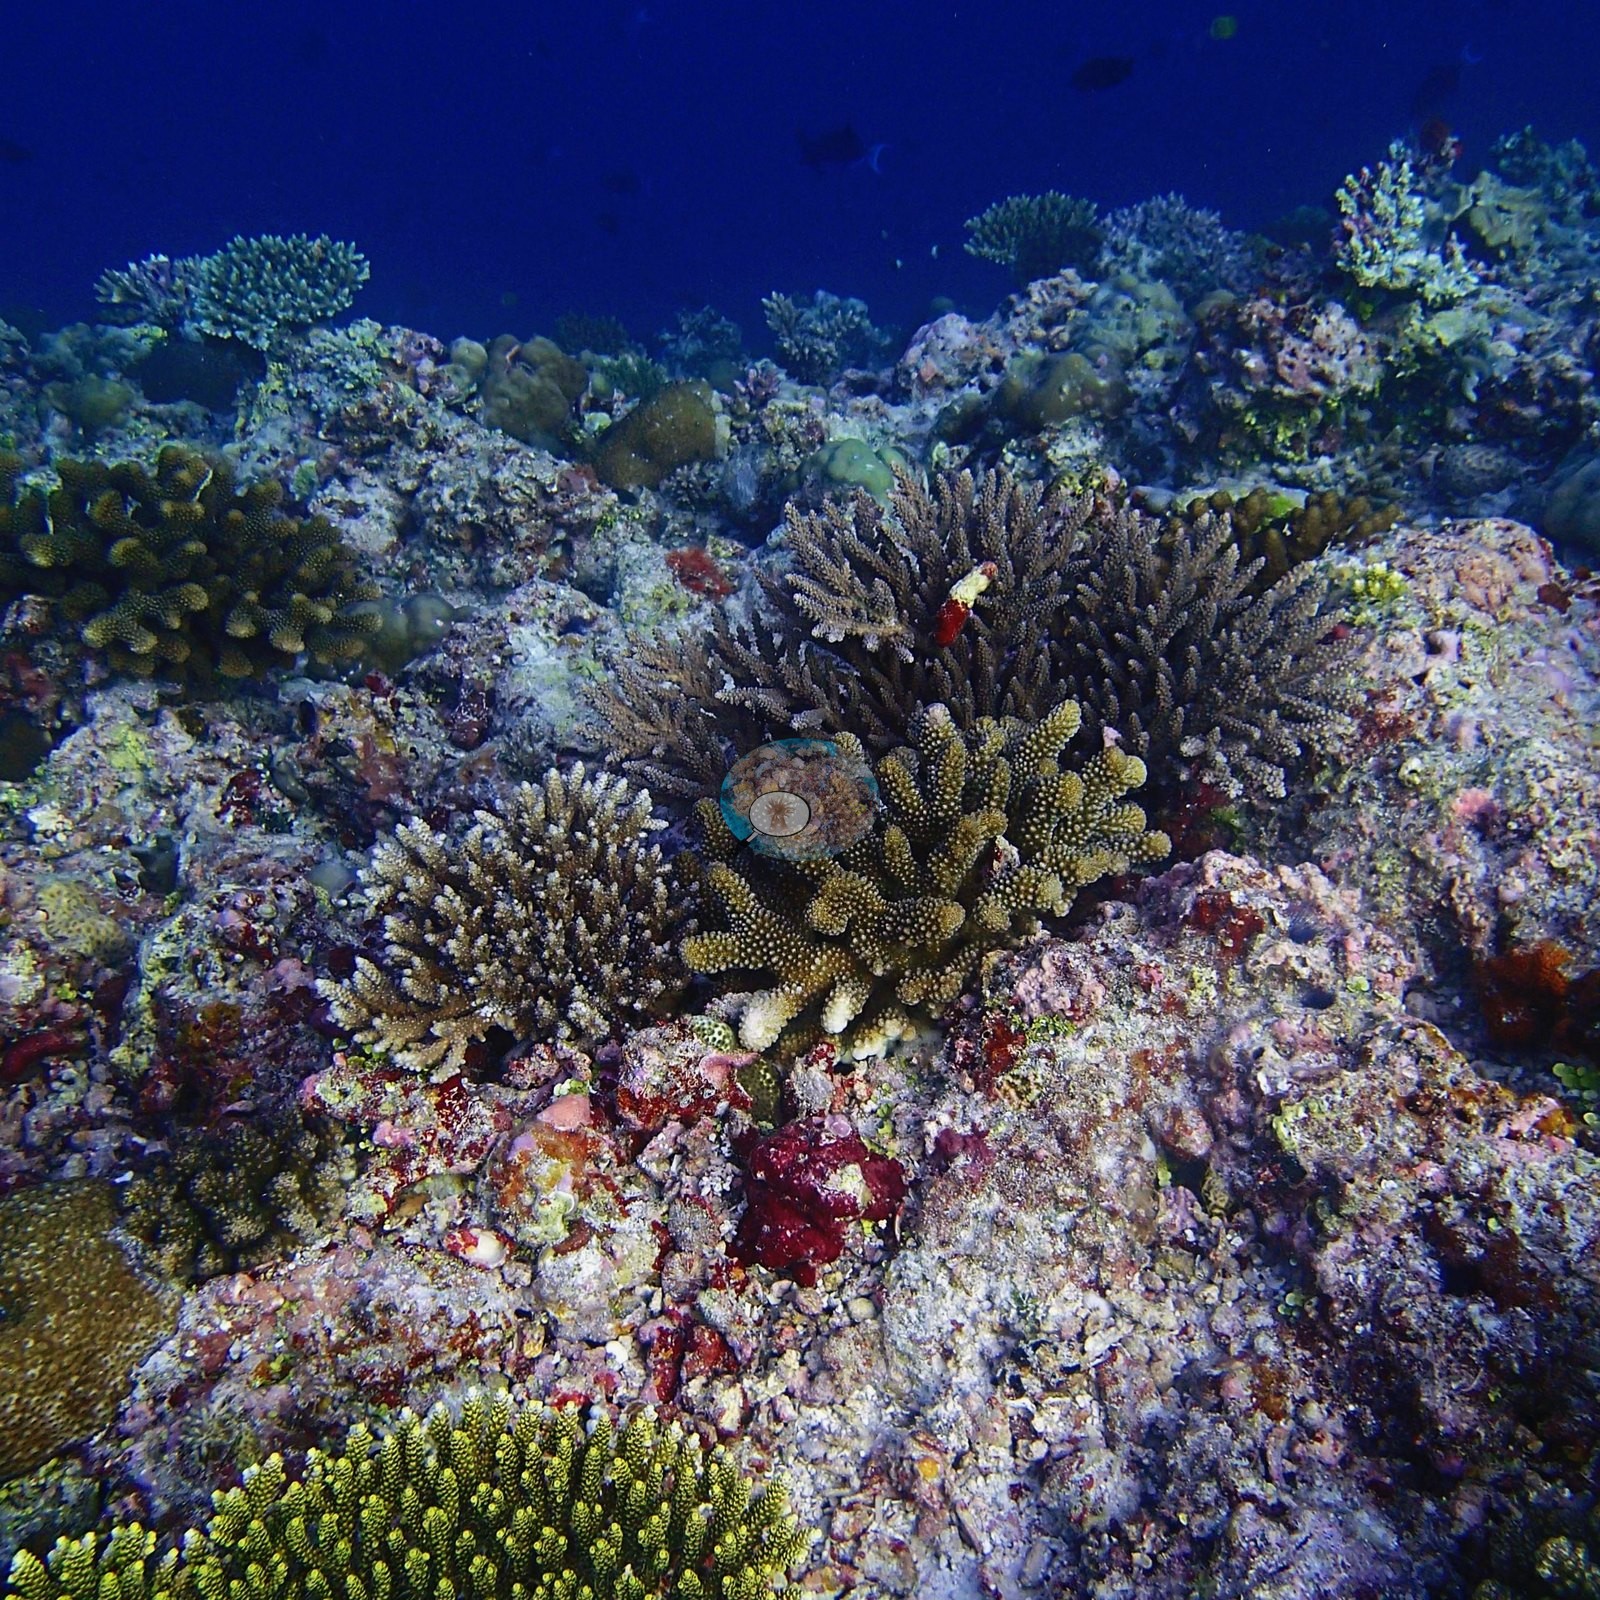
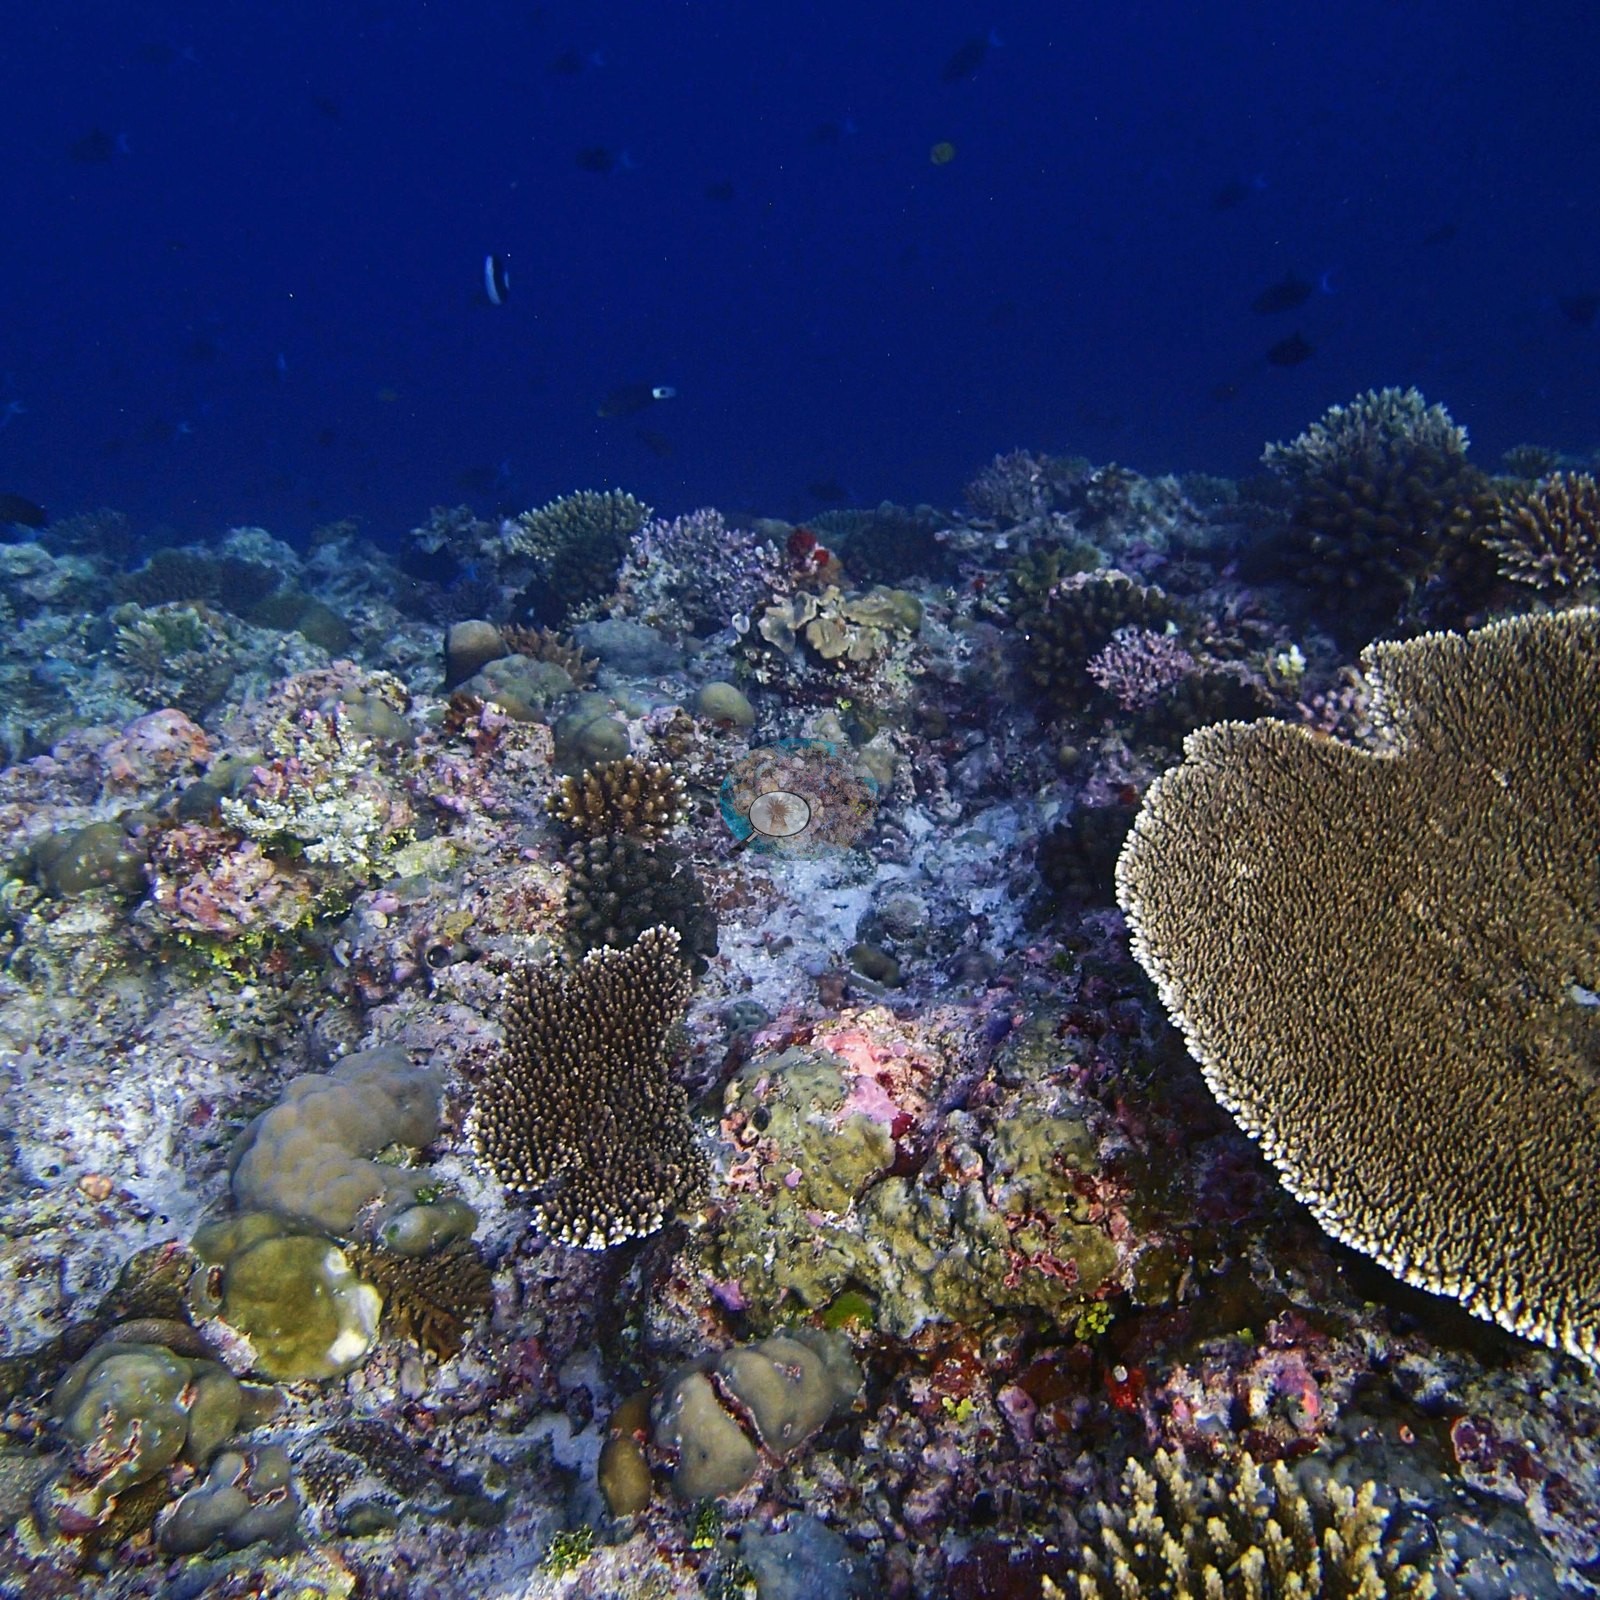
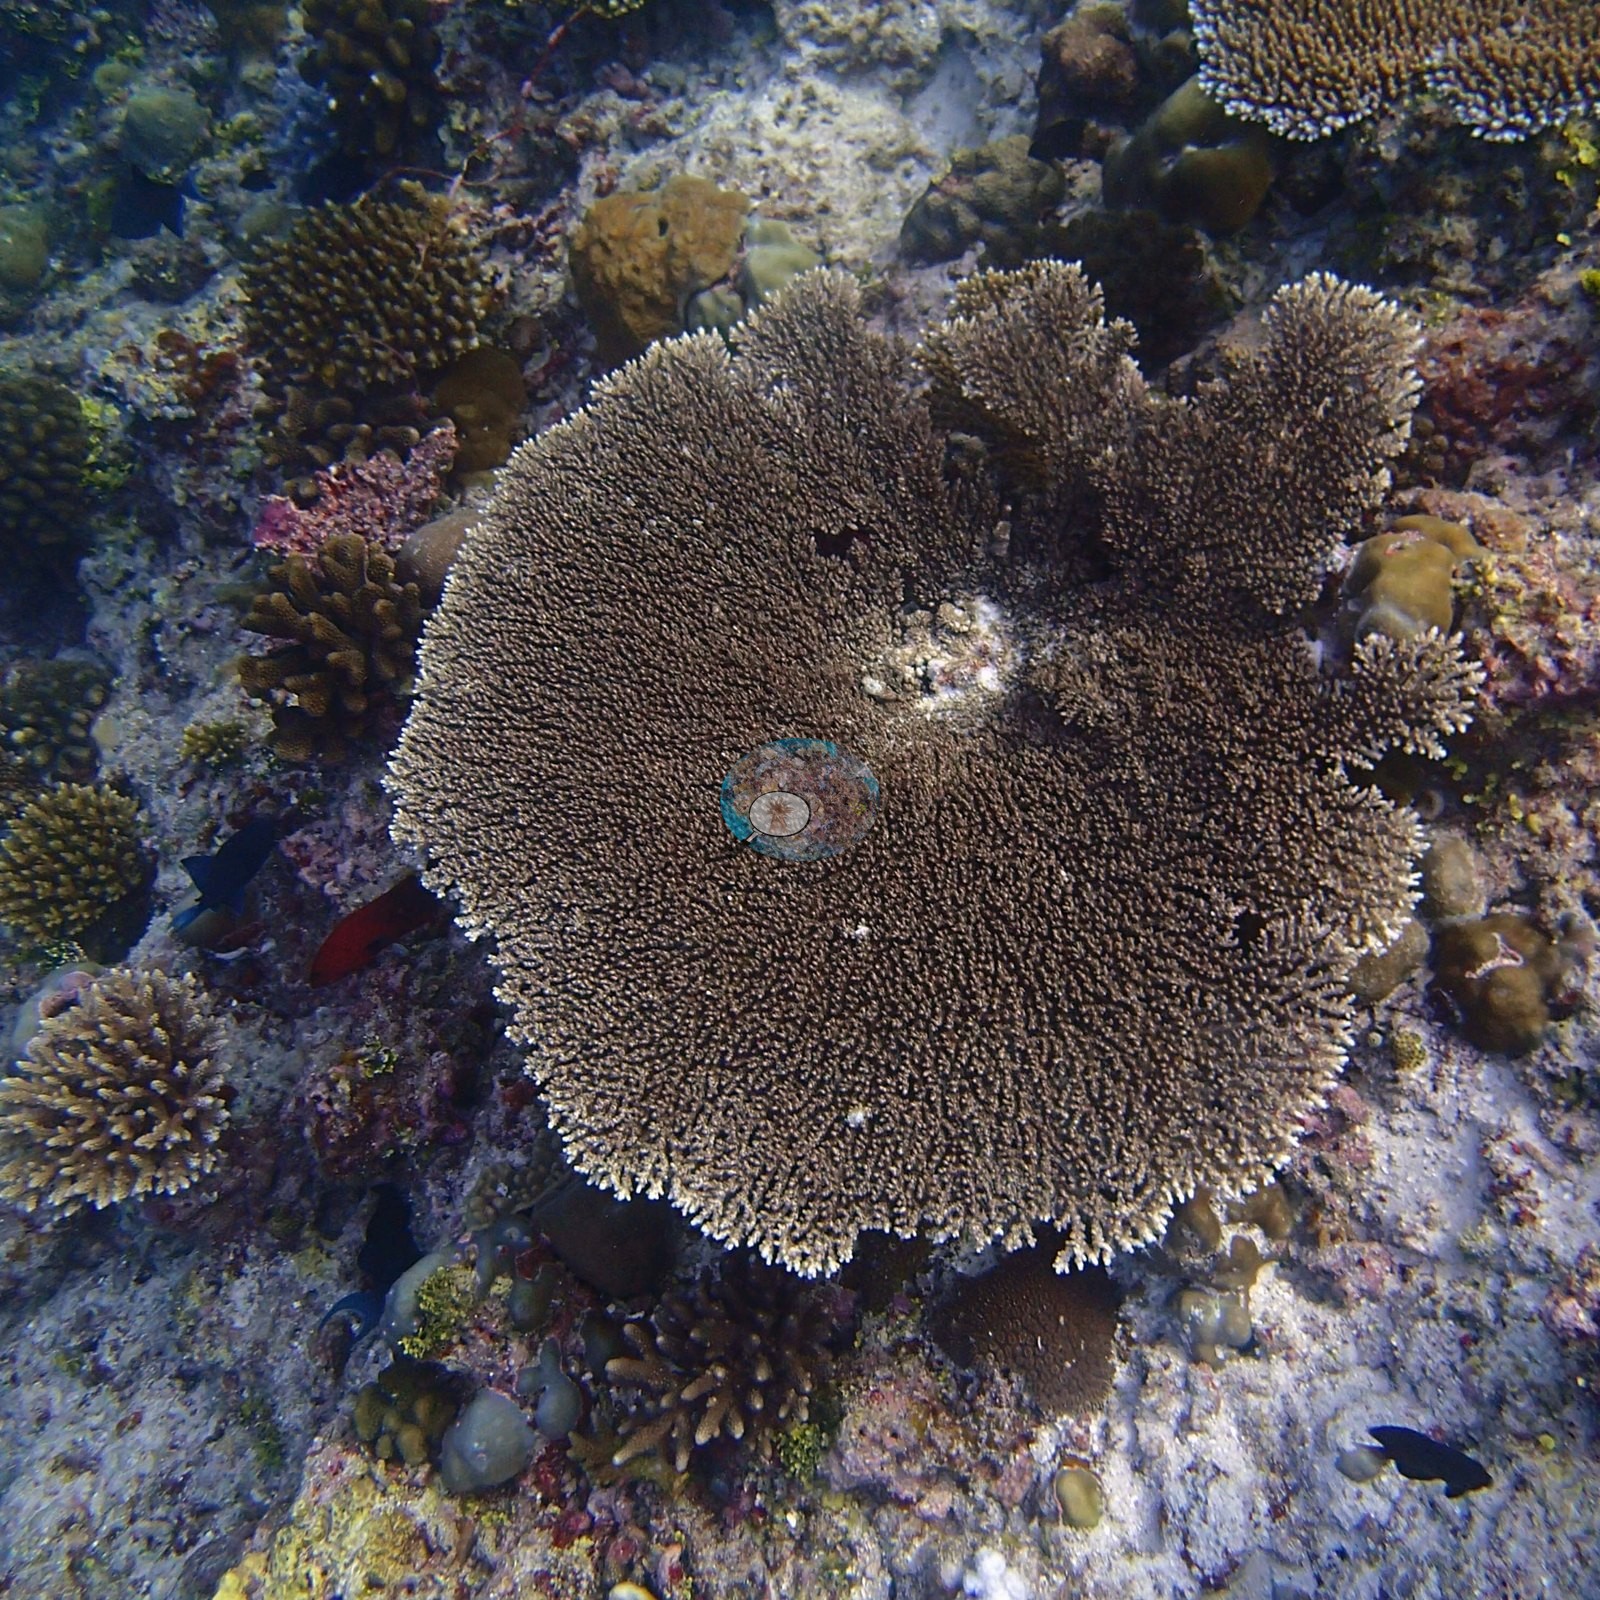
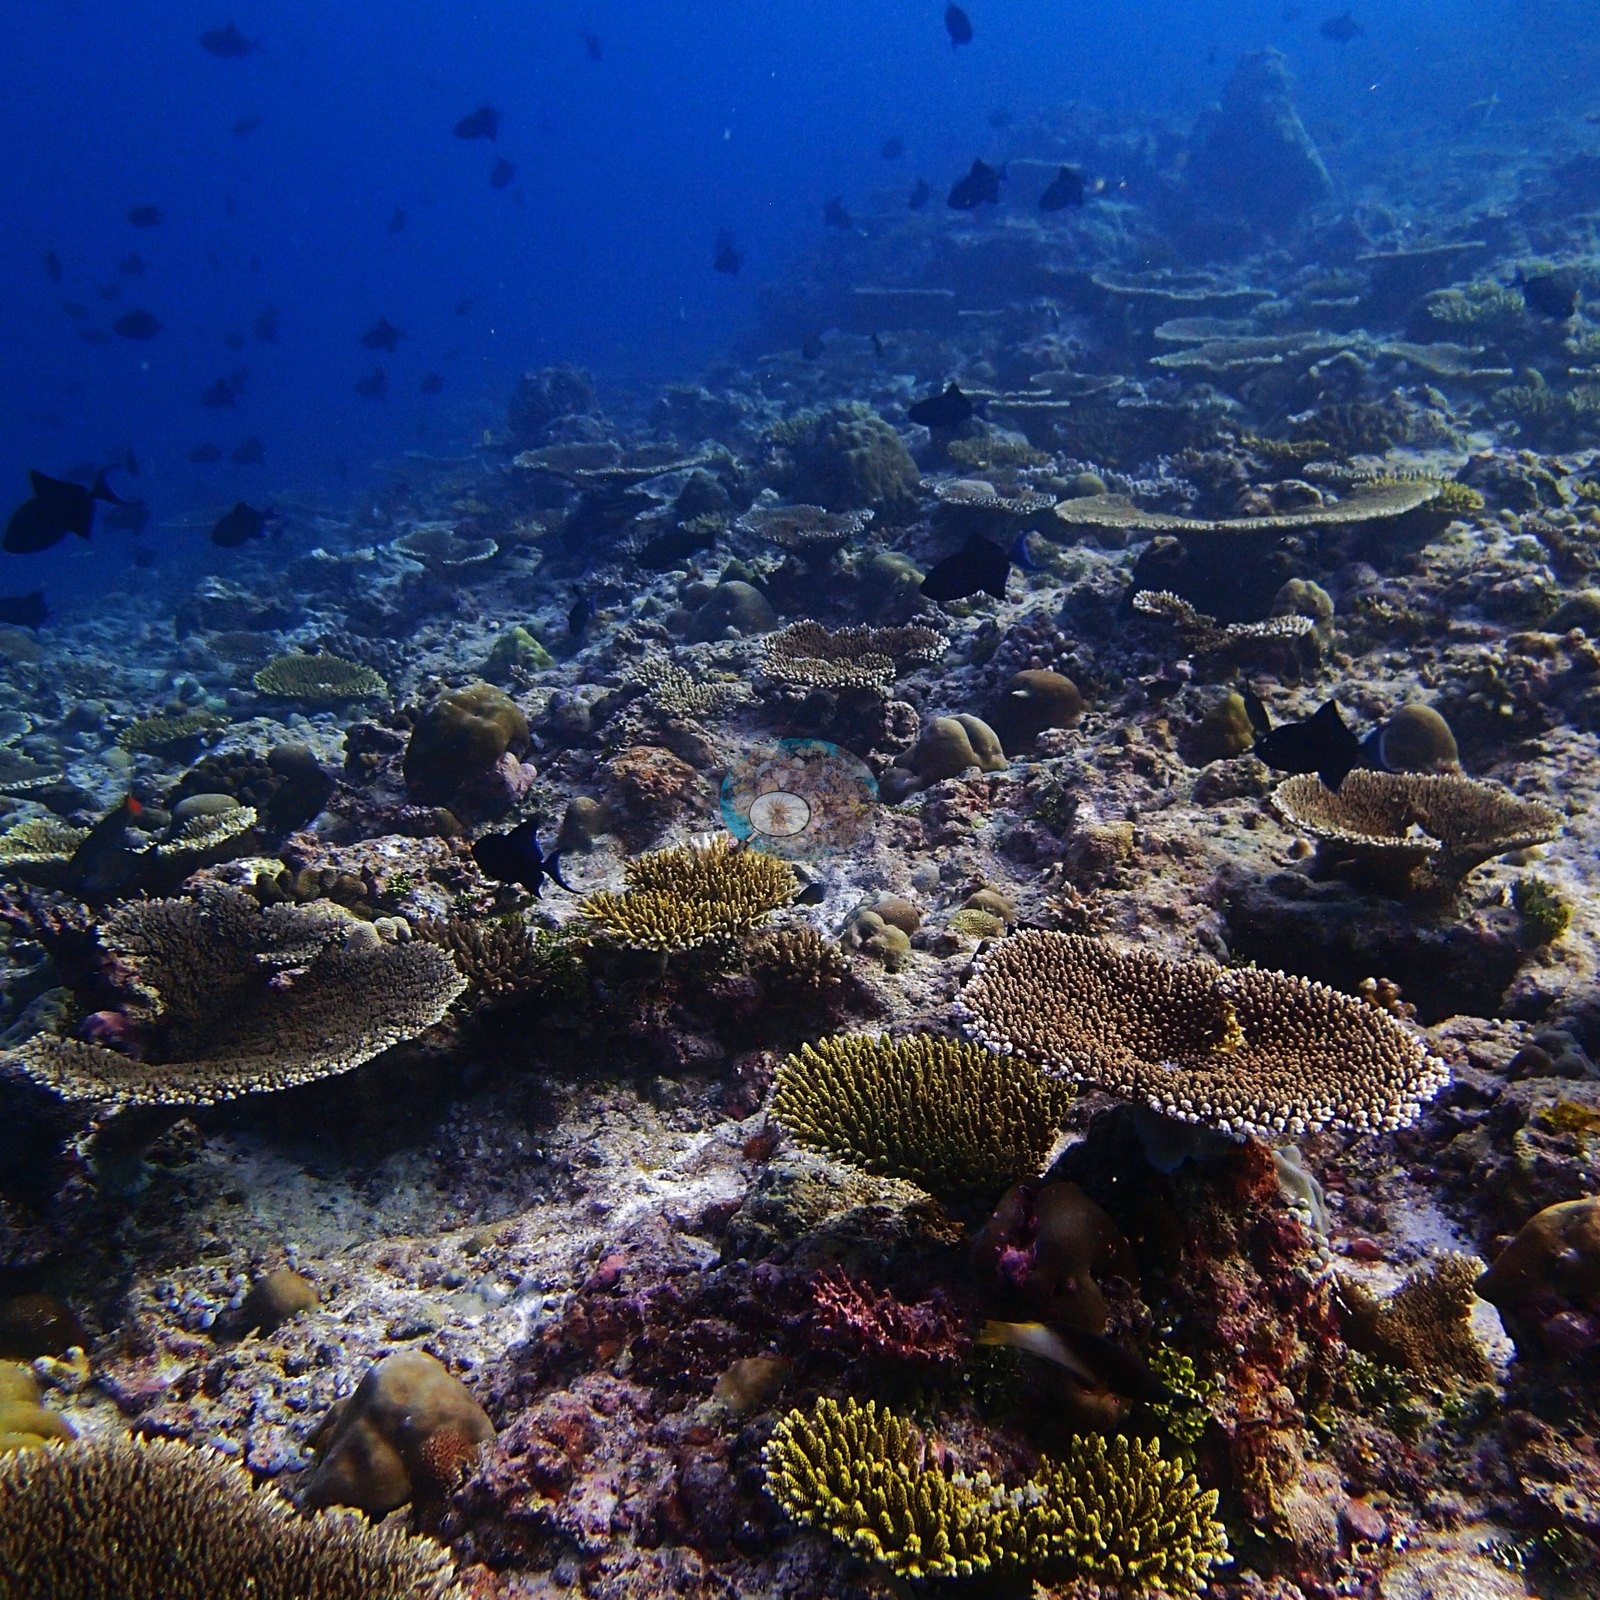
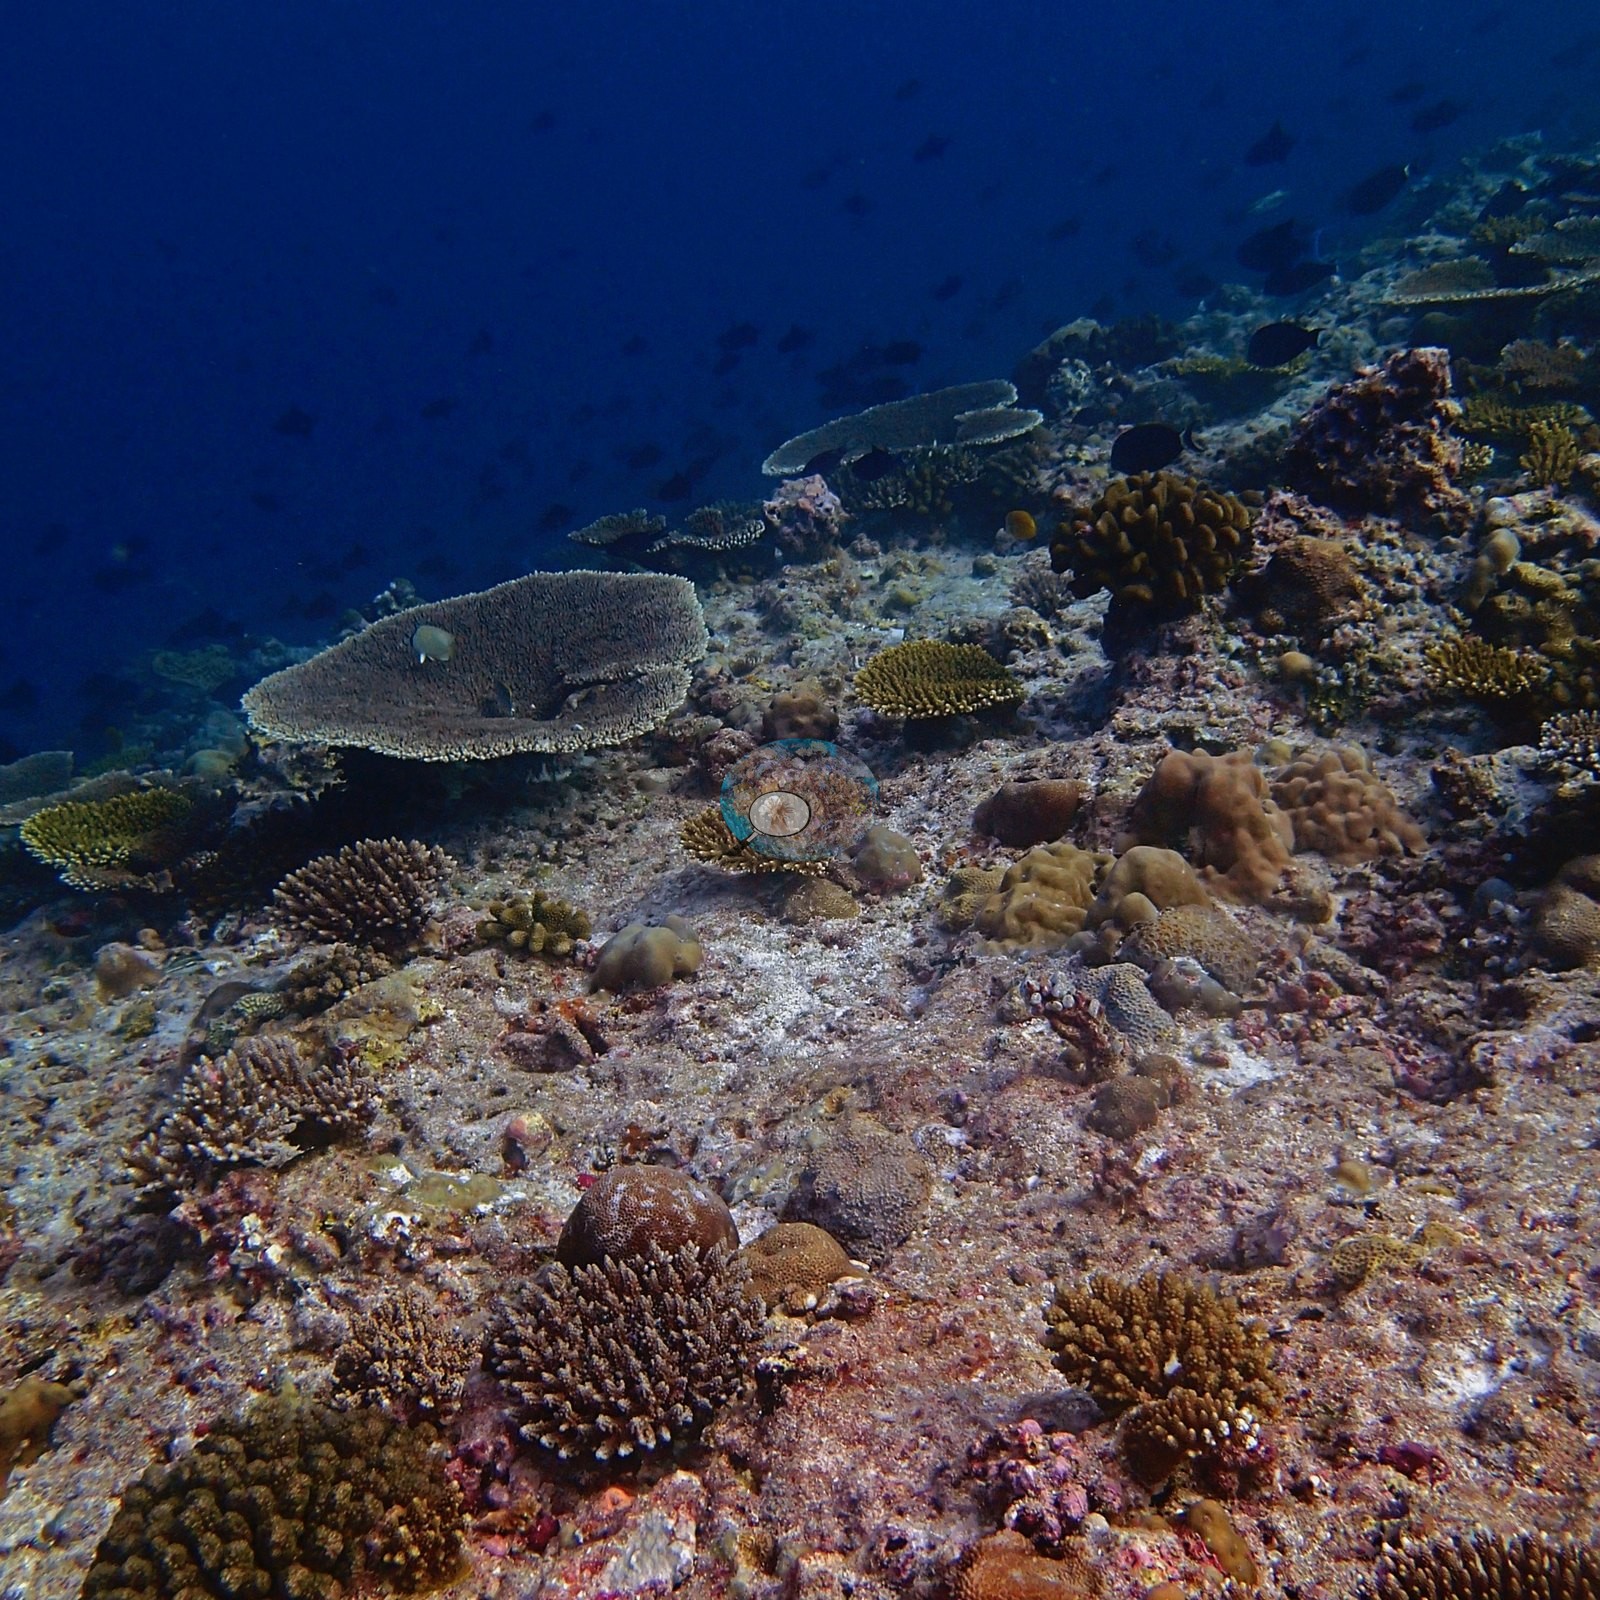
Few sights in the Maldives beat the top of this house reef in January 2016: tabletop corals by the hundred, tiered like café parasols and running unbroken to the edge of visibility (e.g., Image 1, Image 24, Image 25).
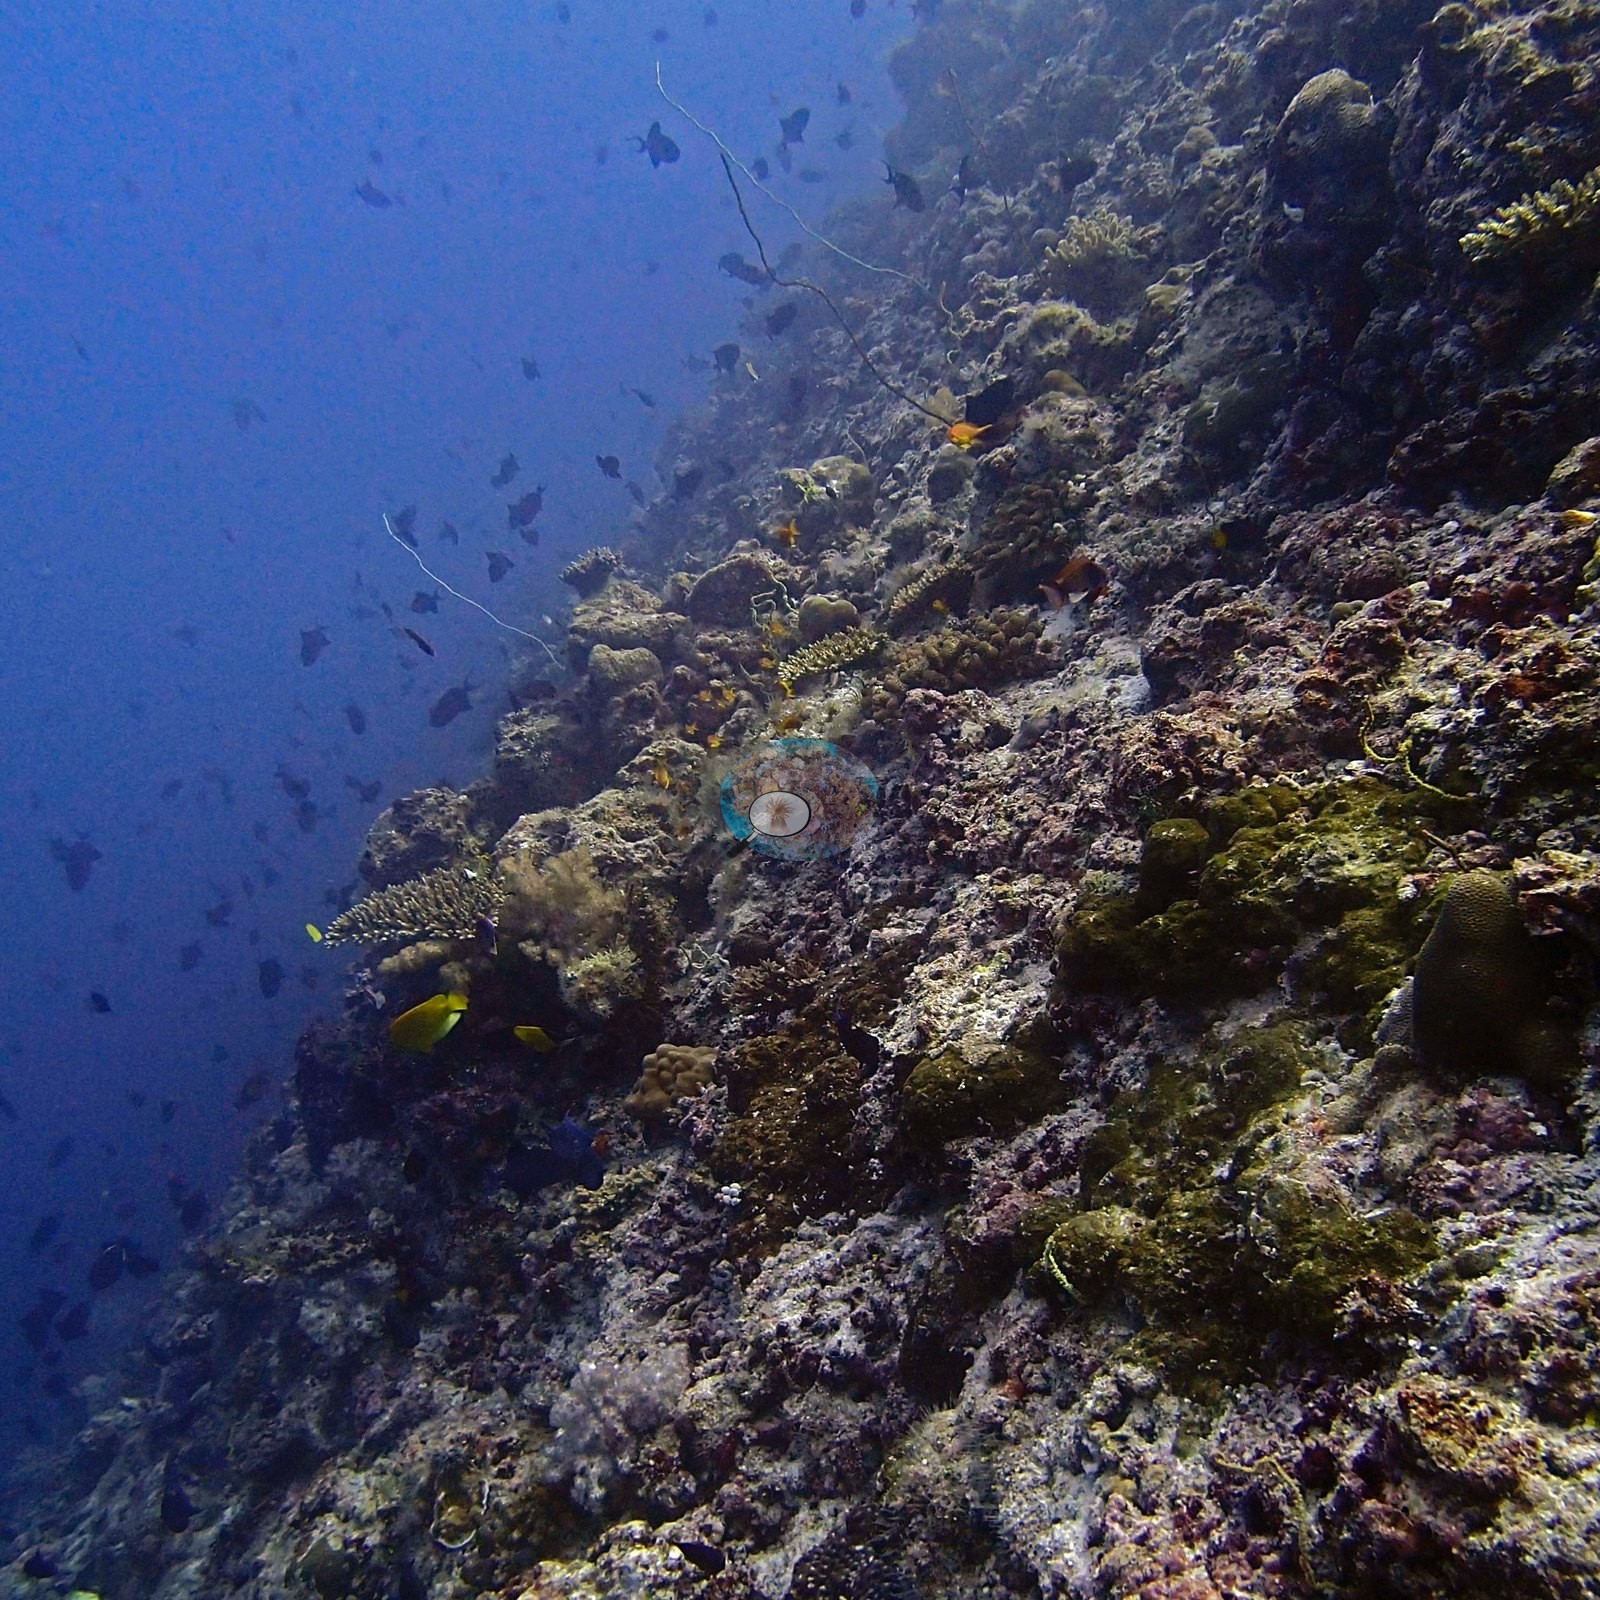
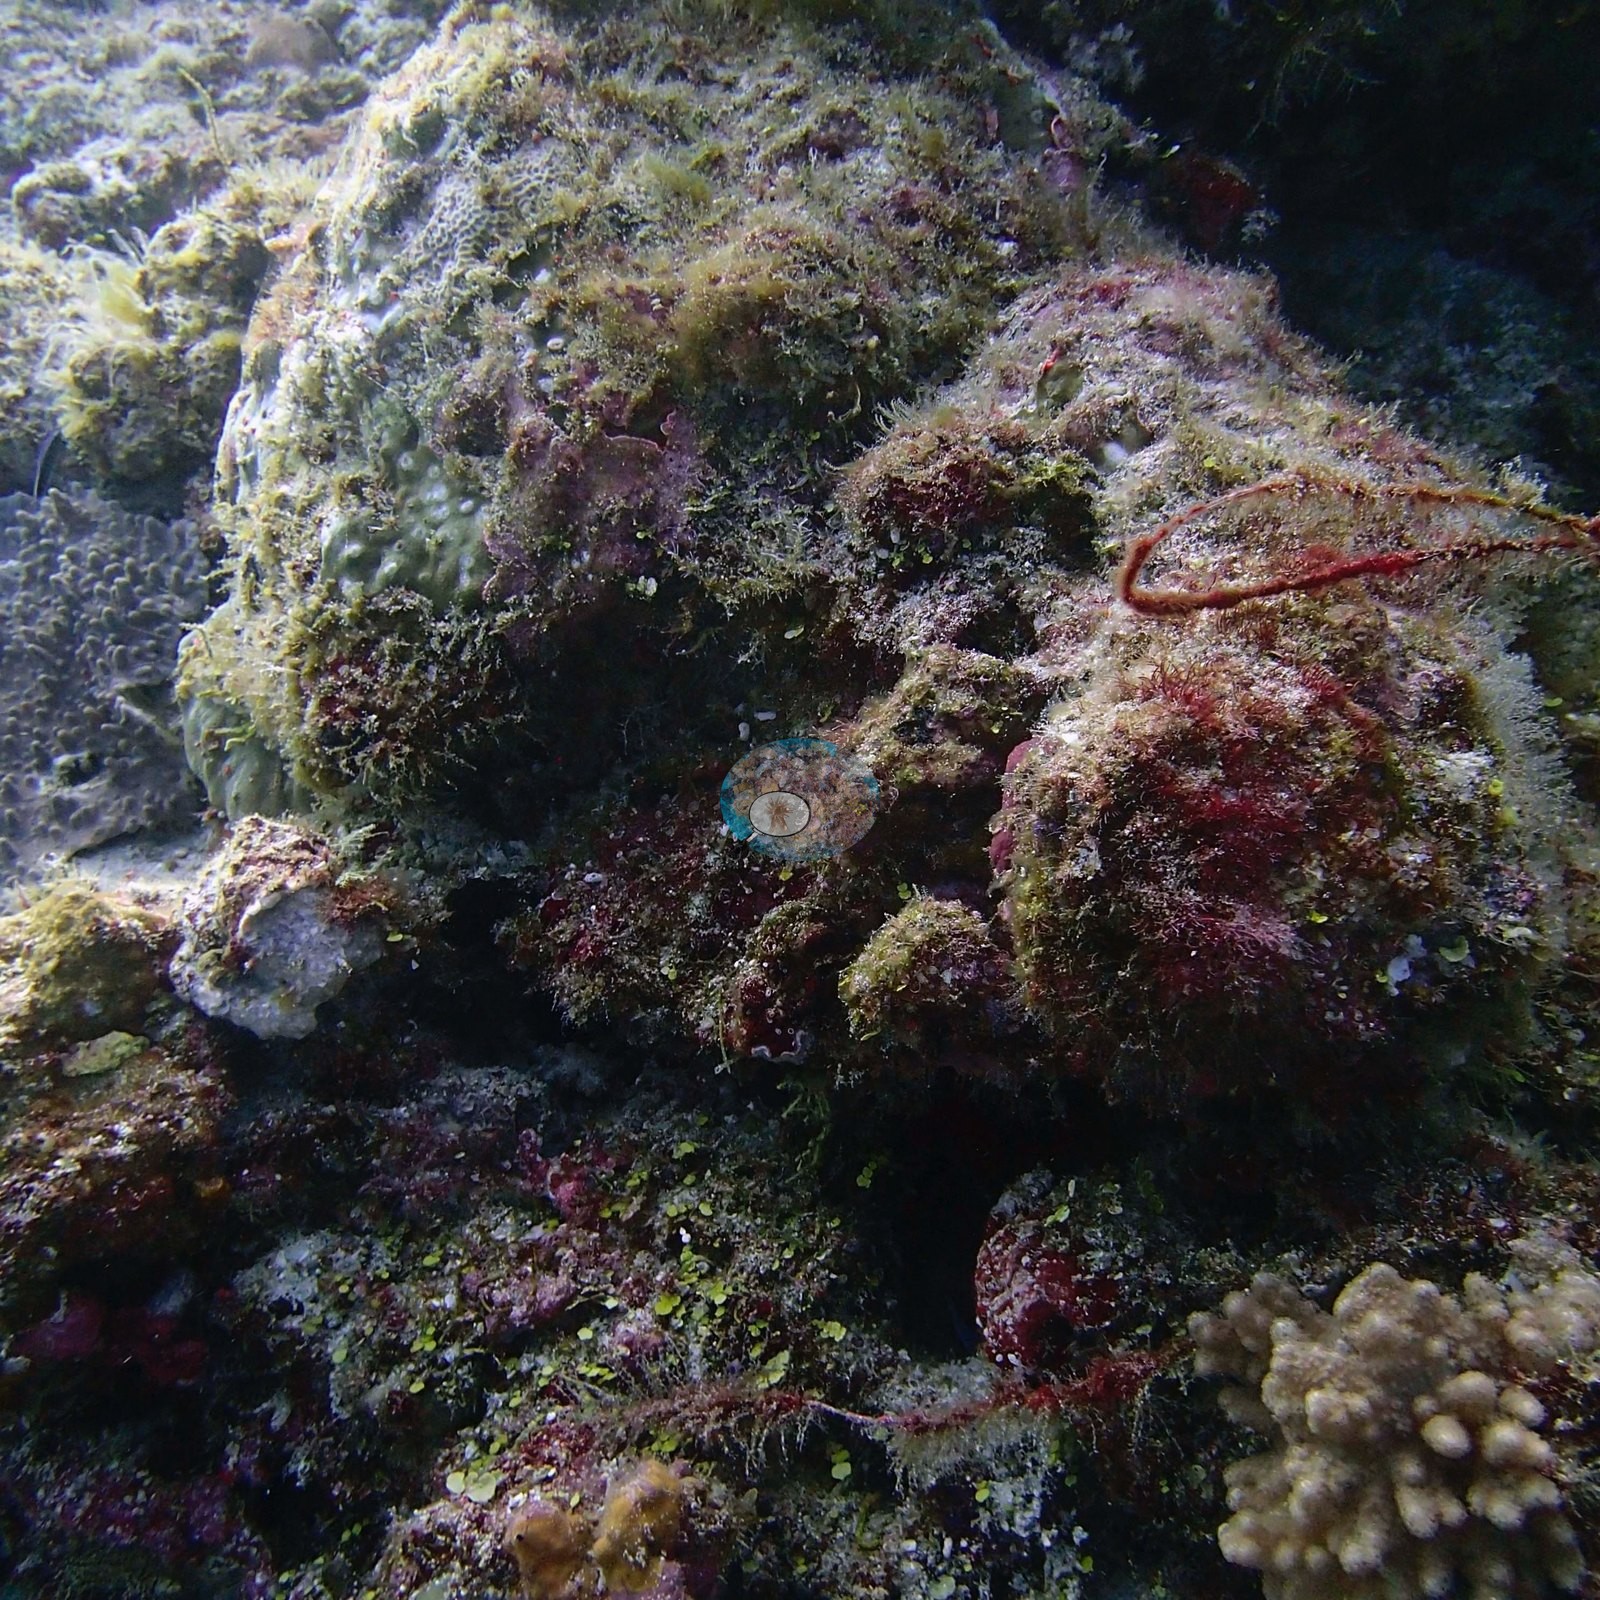
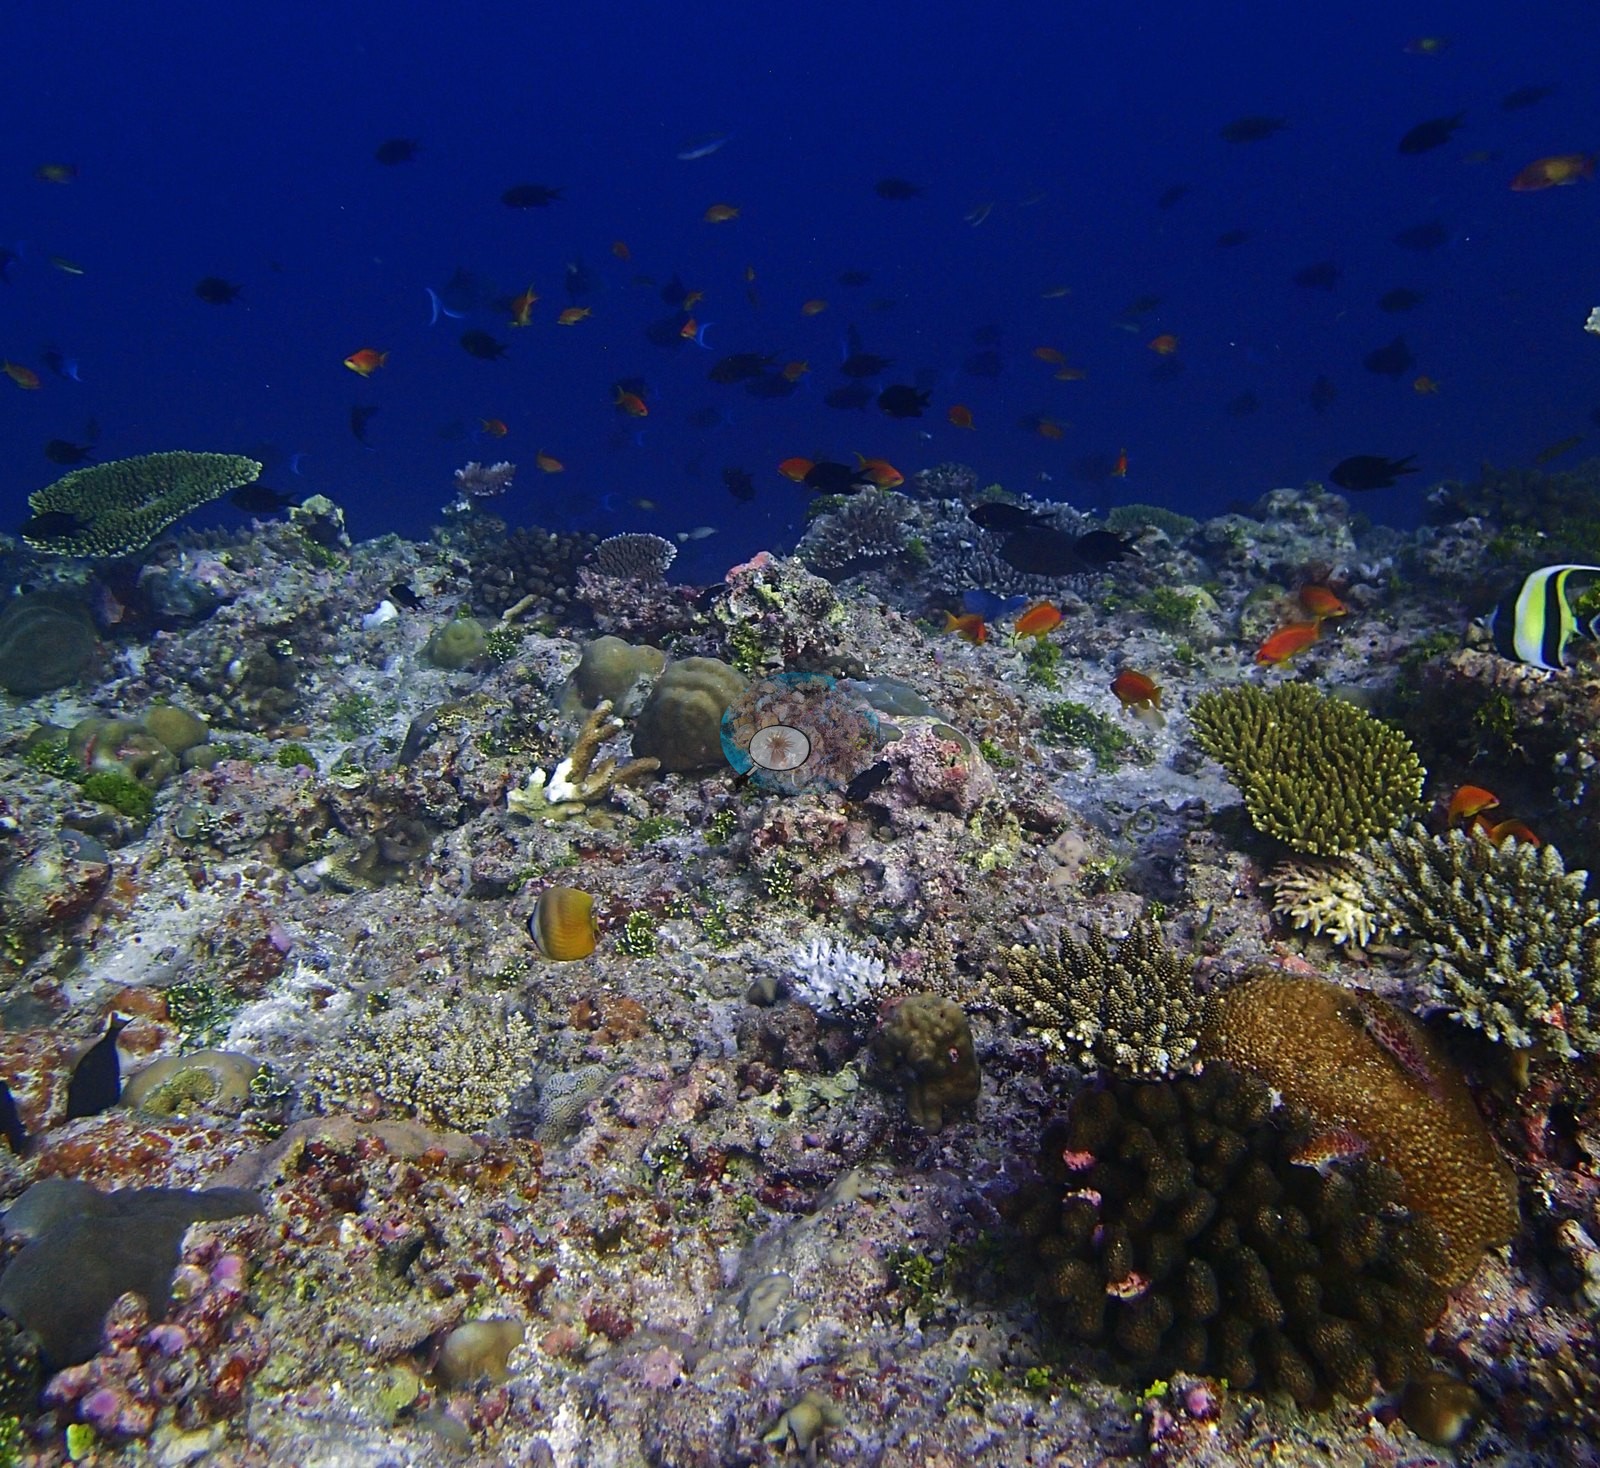
Slip over the edge and the slope turns wilder — rubble and pink coralline crusts, ledges daubed with red sponge, orange anthias swirling mid-water, and a river of silvery fusiliers passing overhead (e.g., Image 3, Image 4).
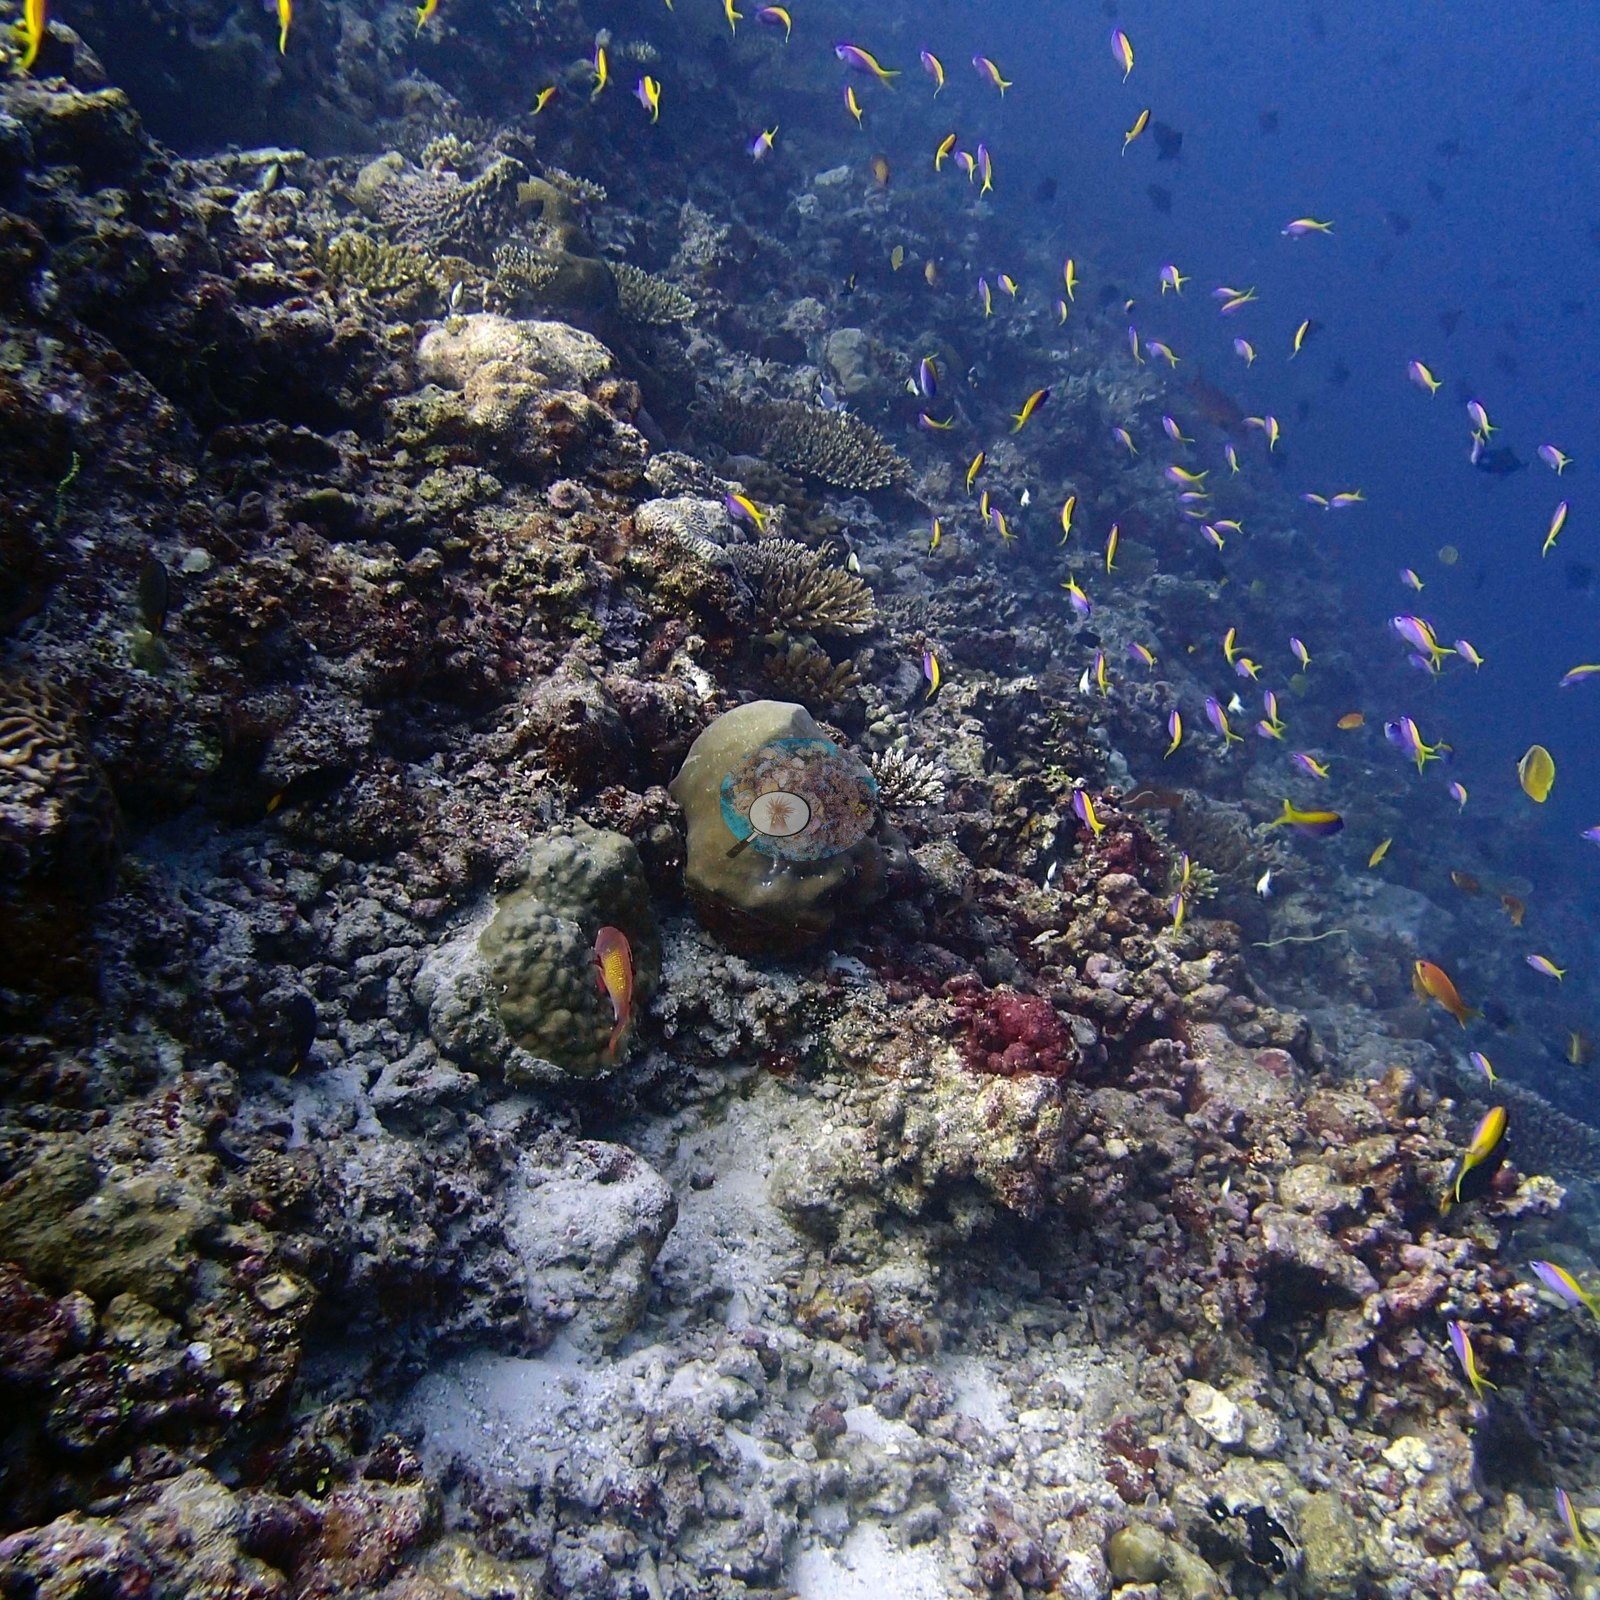
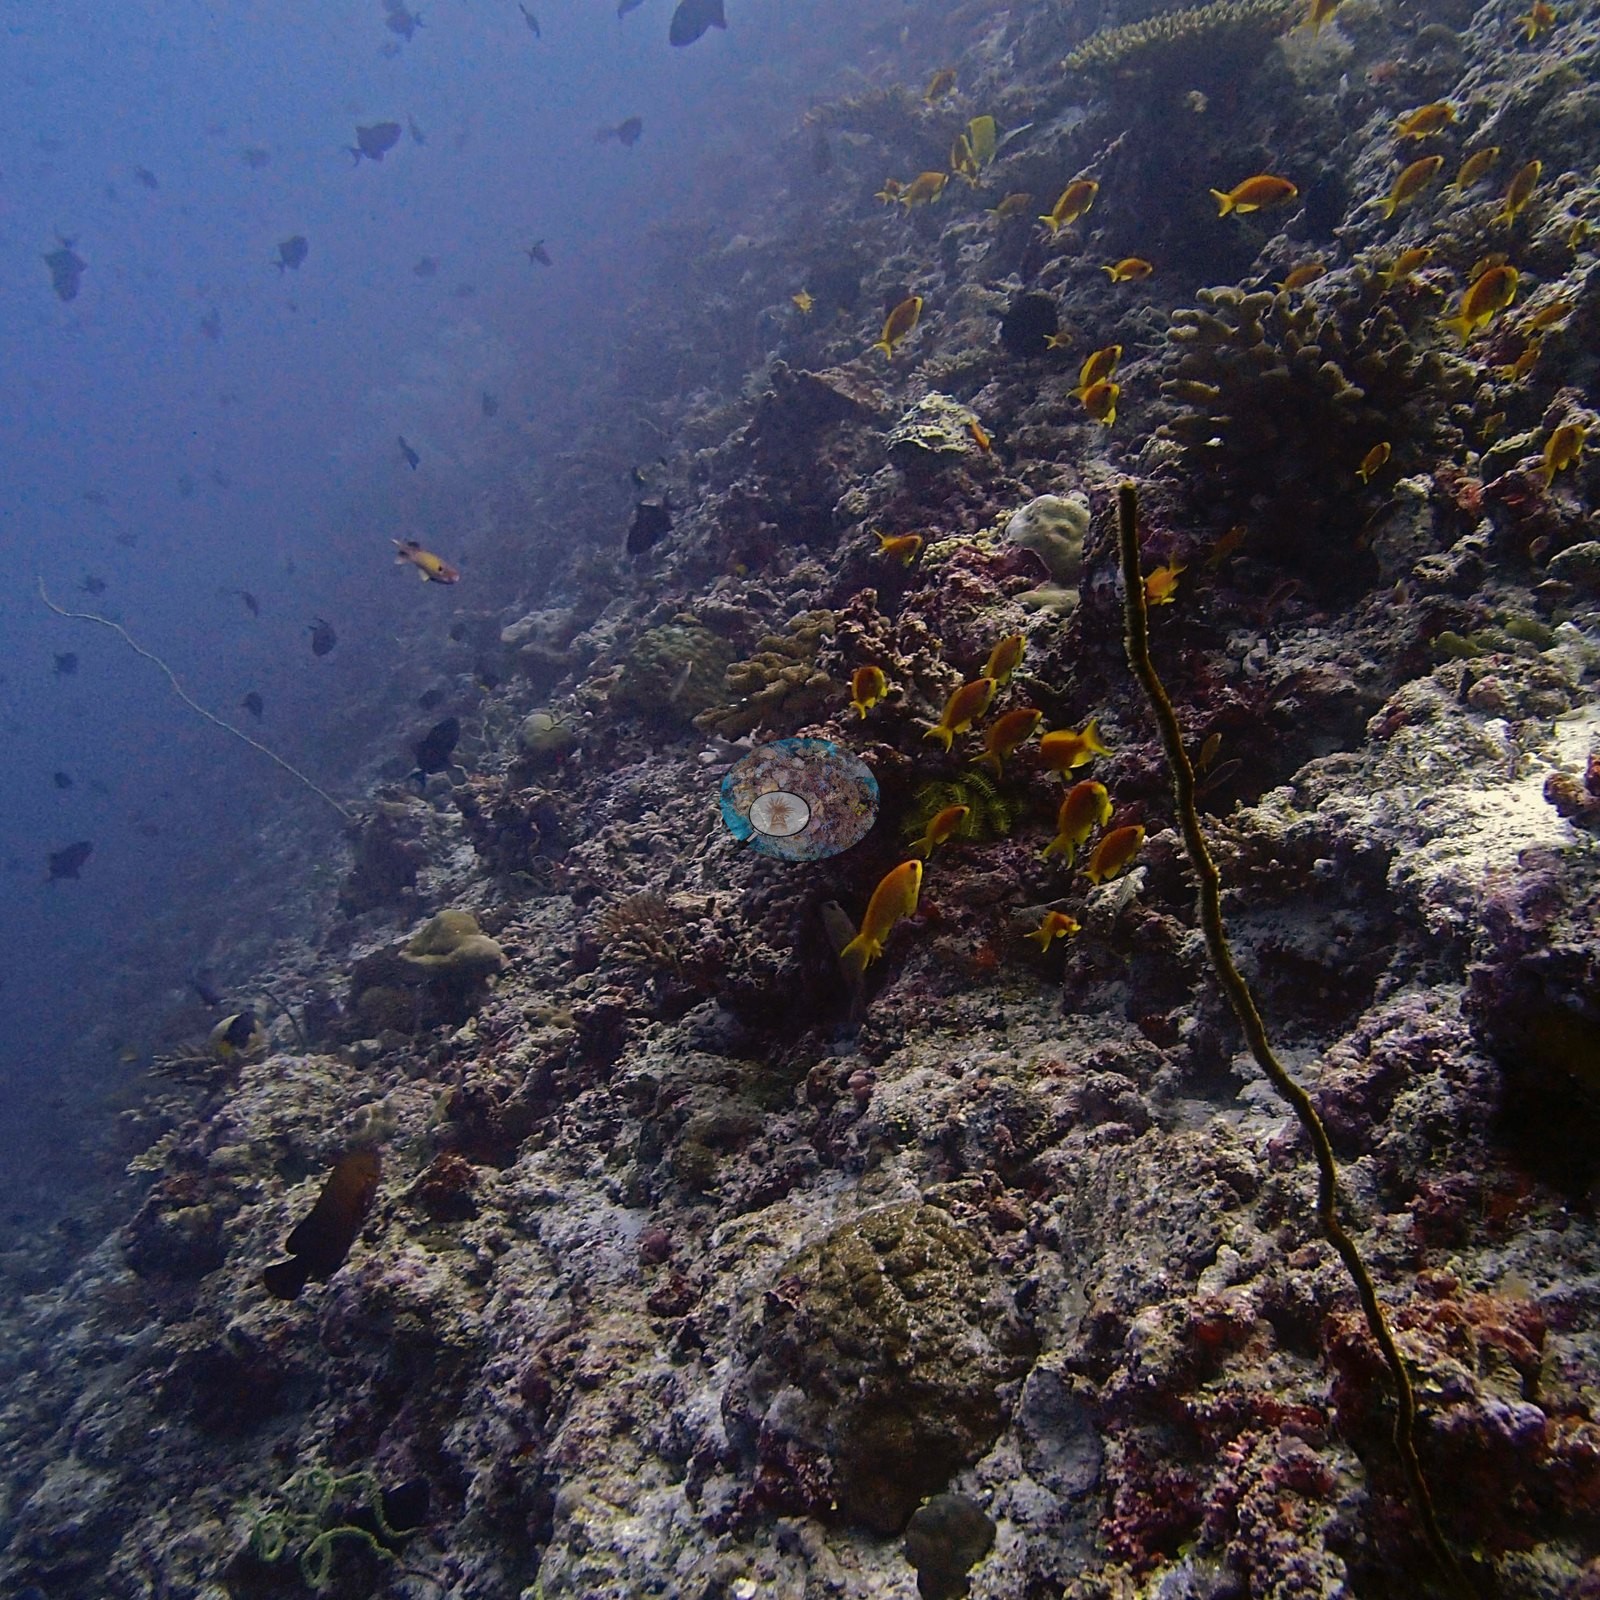
A January 22 drift along the reef's sheer outer wall found faces tiled in brilliant yellow soft corals -- the classic livery of a current-swept Maldivian drop-off -- set off by red sponge and pink coralline crusts, glassy sweepers seething beneath a feather star, fusiliers and damselfish streaming along the rim, and a spiny lobster giving itself away by its banded antennae.
Coral cover
Coral cover: 31% — photo-derived, and the two methods disagree by 13.2 pp; treat cover as a range (24–38%). This site's figure is the mean of two independent computer vision passes over Anderson's own frames: a DINOv3 calibrated point classifier reads 24.4% and a CoralSCOP computer vision reads 37.6%, a spread of 13.2 percentage points. The map publishes the mean so sites can be sorted against one another, but the honest statement of what is known here is the 24–38% range: the two products have different denominators and should not be treated as one measurement.
Stressors
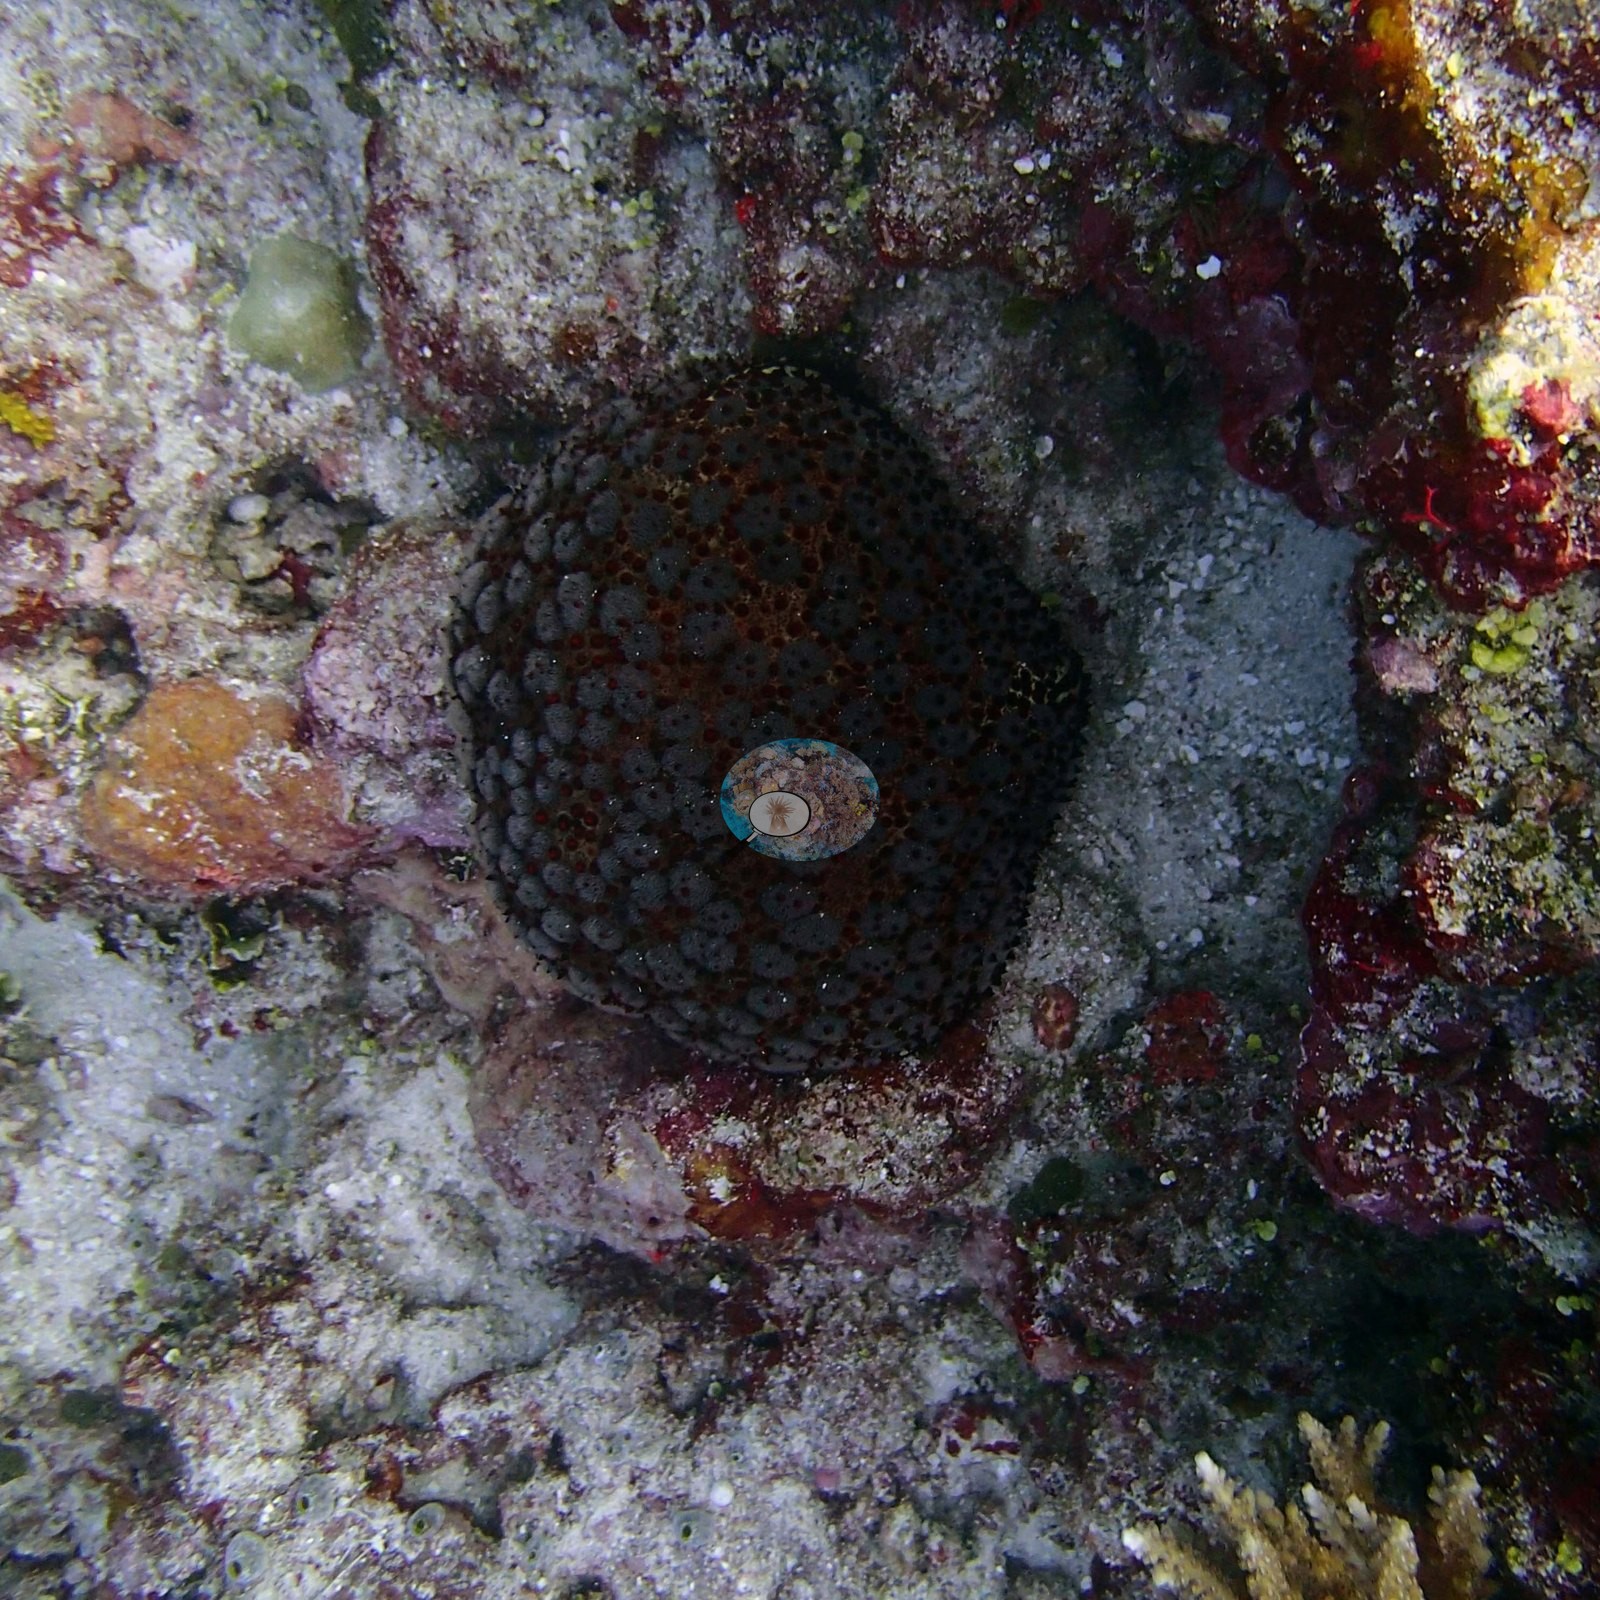
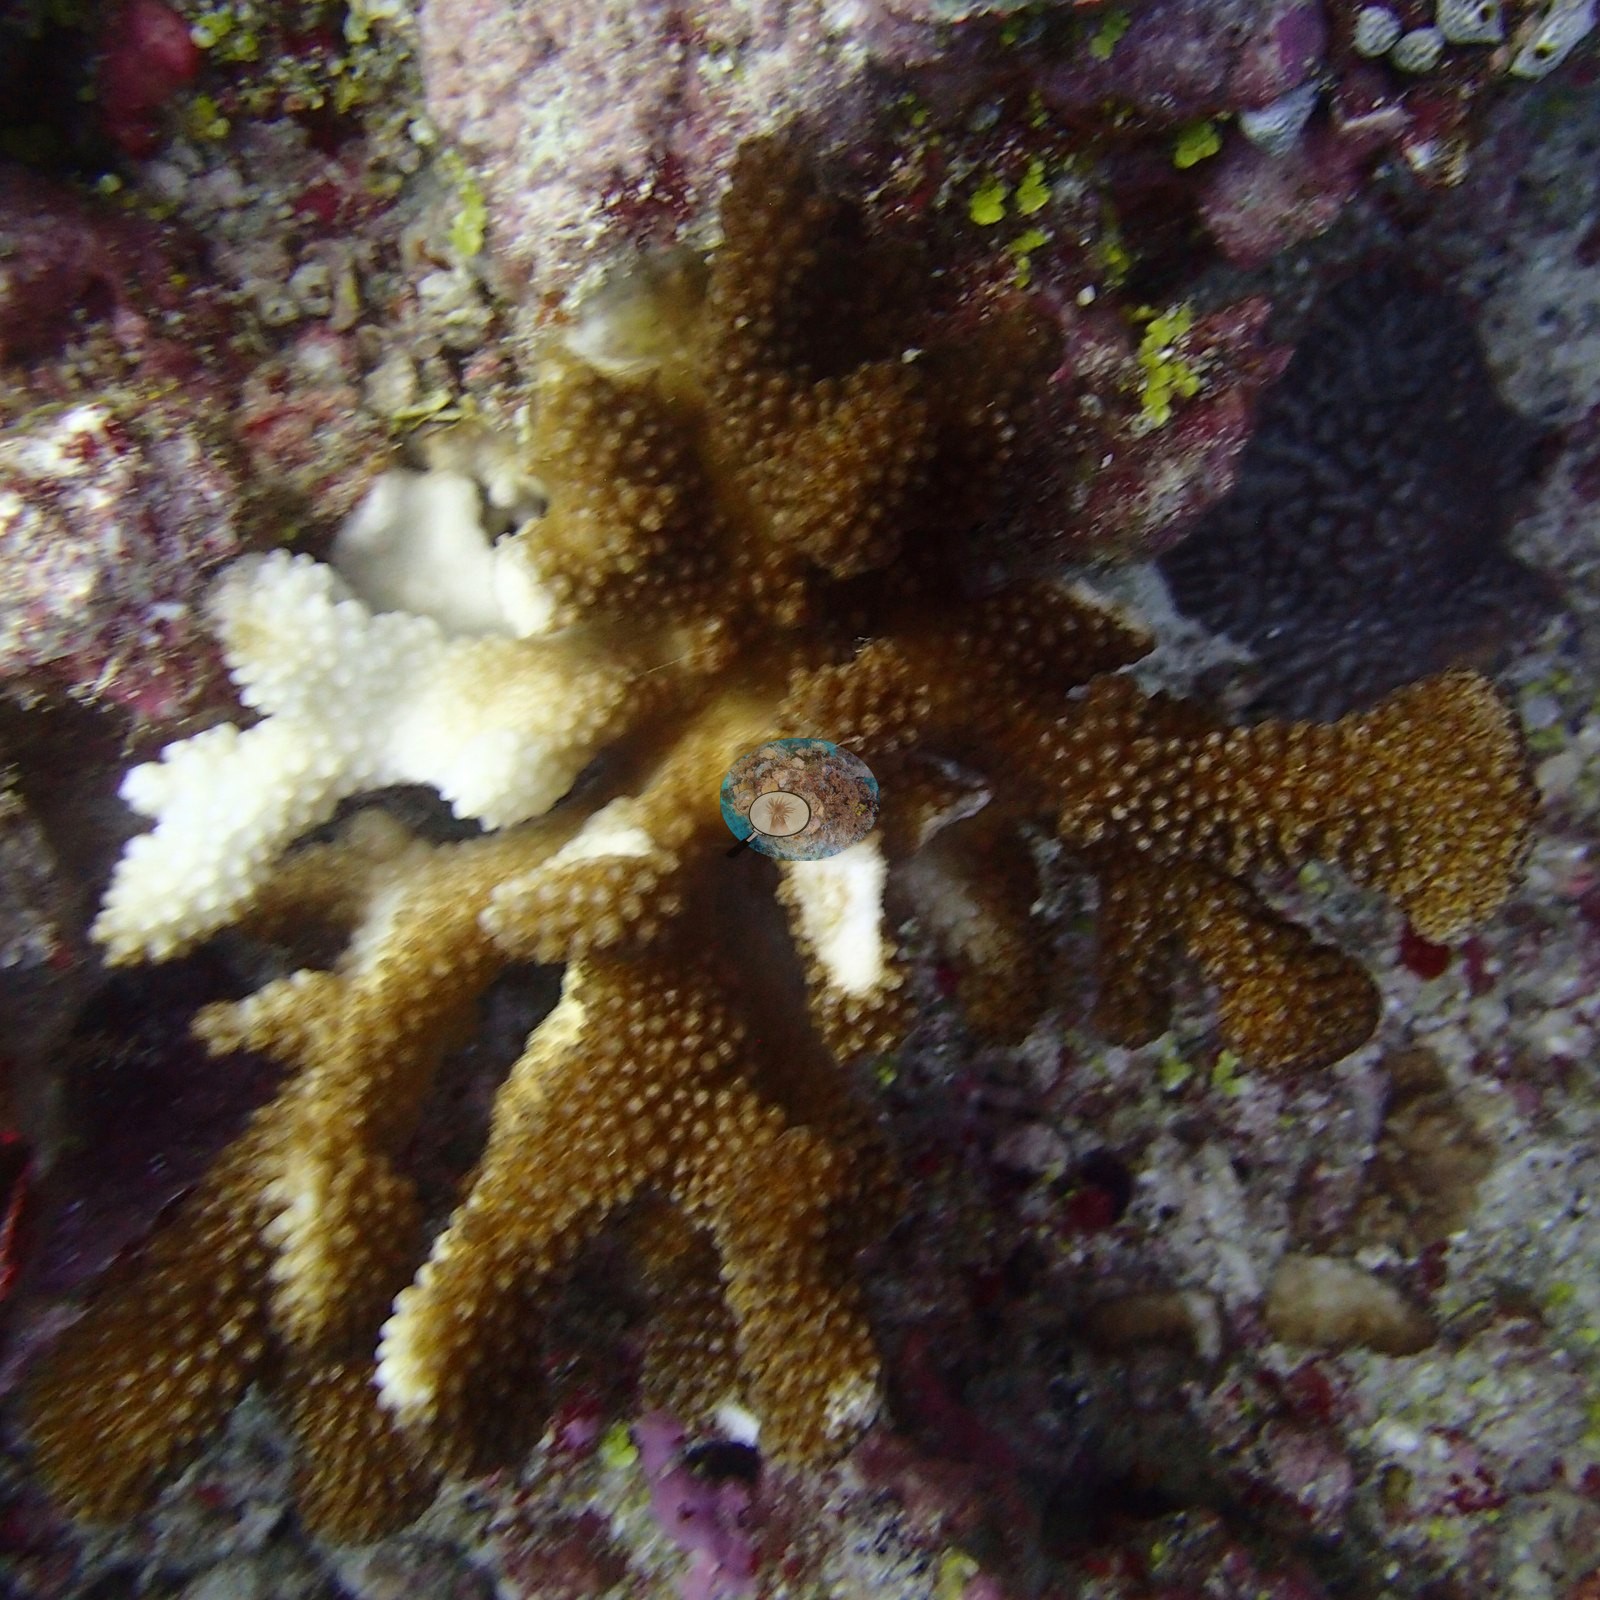
Months later the 2016 El Niño would bleach these reefs catastrophically; these photos catch the reef in full, oblivious health. Flag: the last frame of that dive holds a crown-of-thorns starfish out on the rubble, a likely author of stark white feeding scars on a couple of table corals upslope -- three months before the same reef was bleached by the 2016 El Nino.
Fish and other fauna
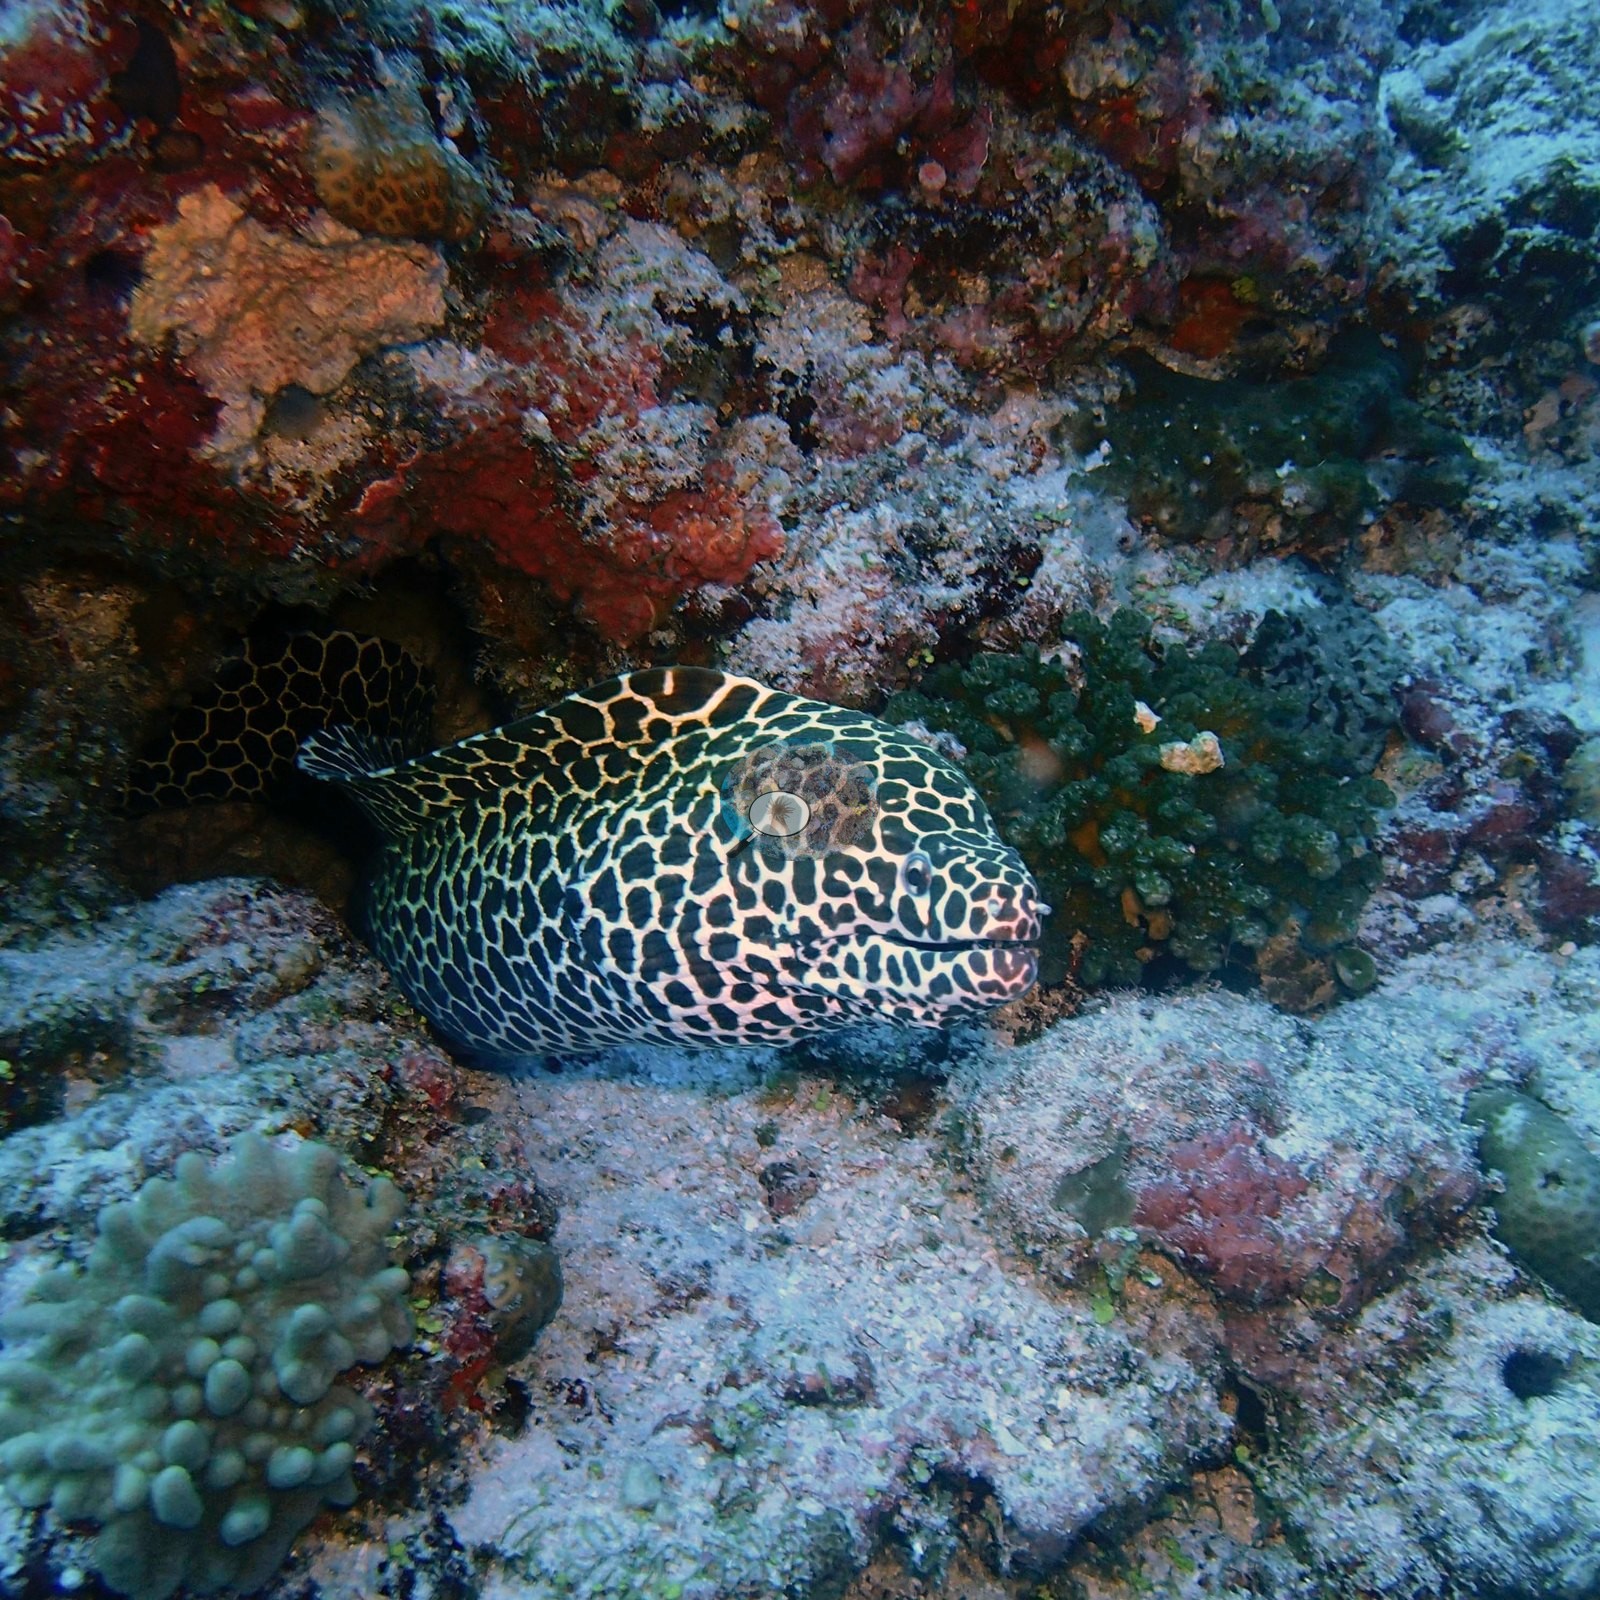
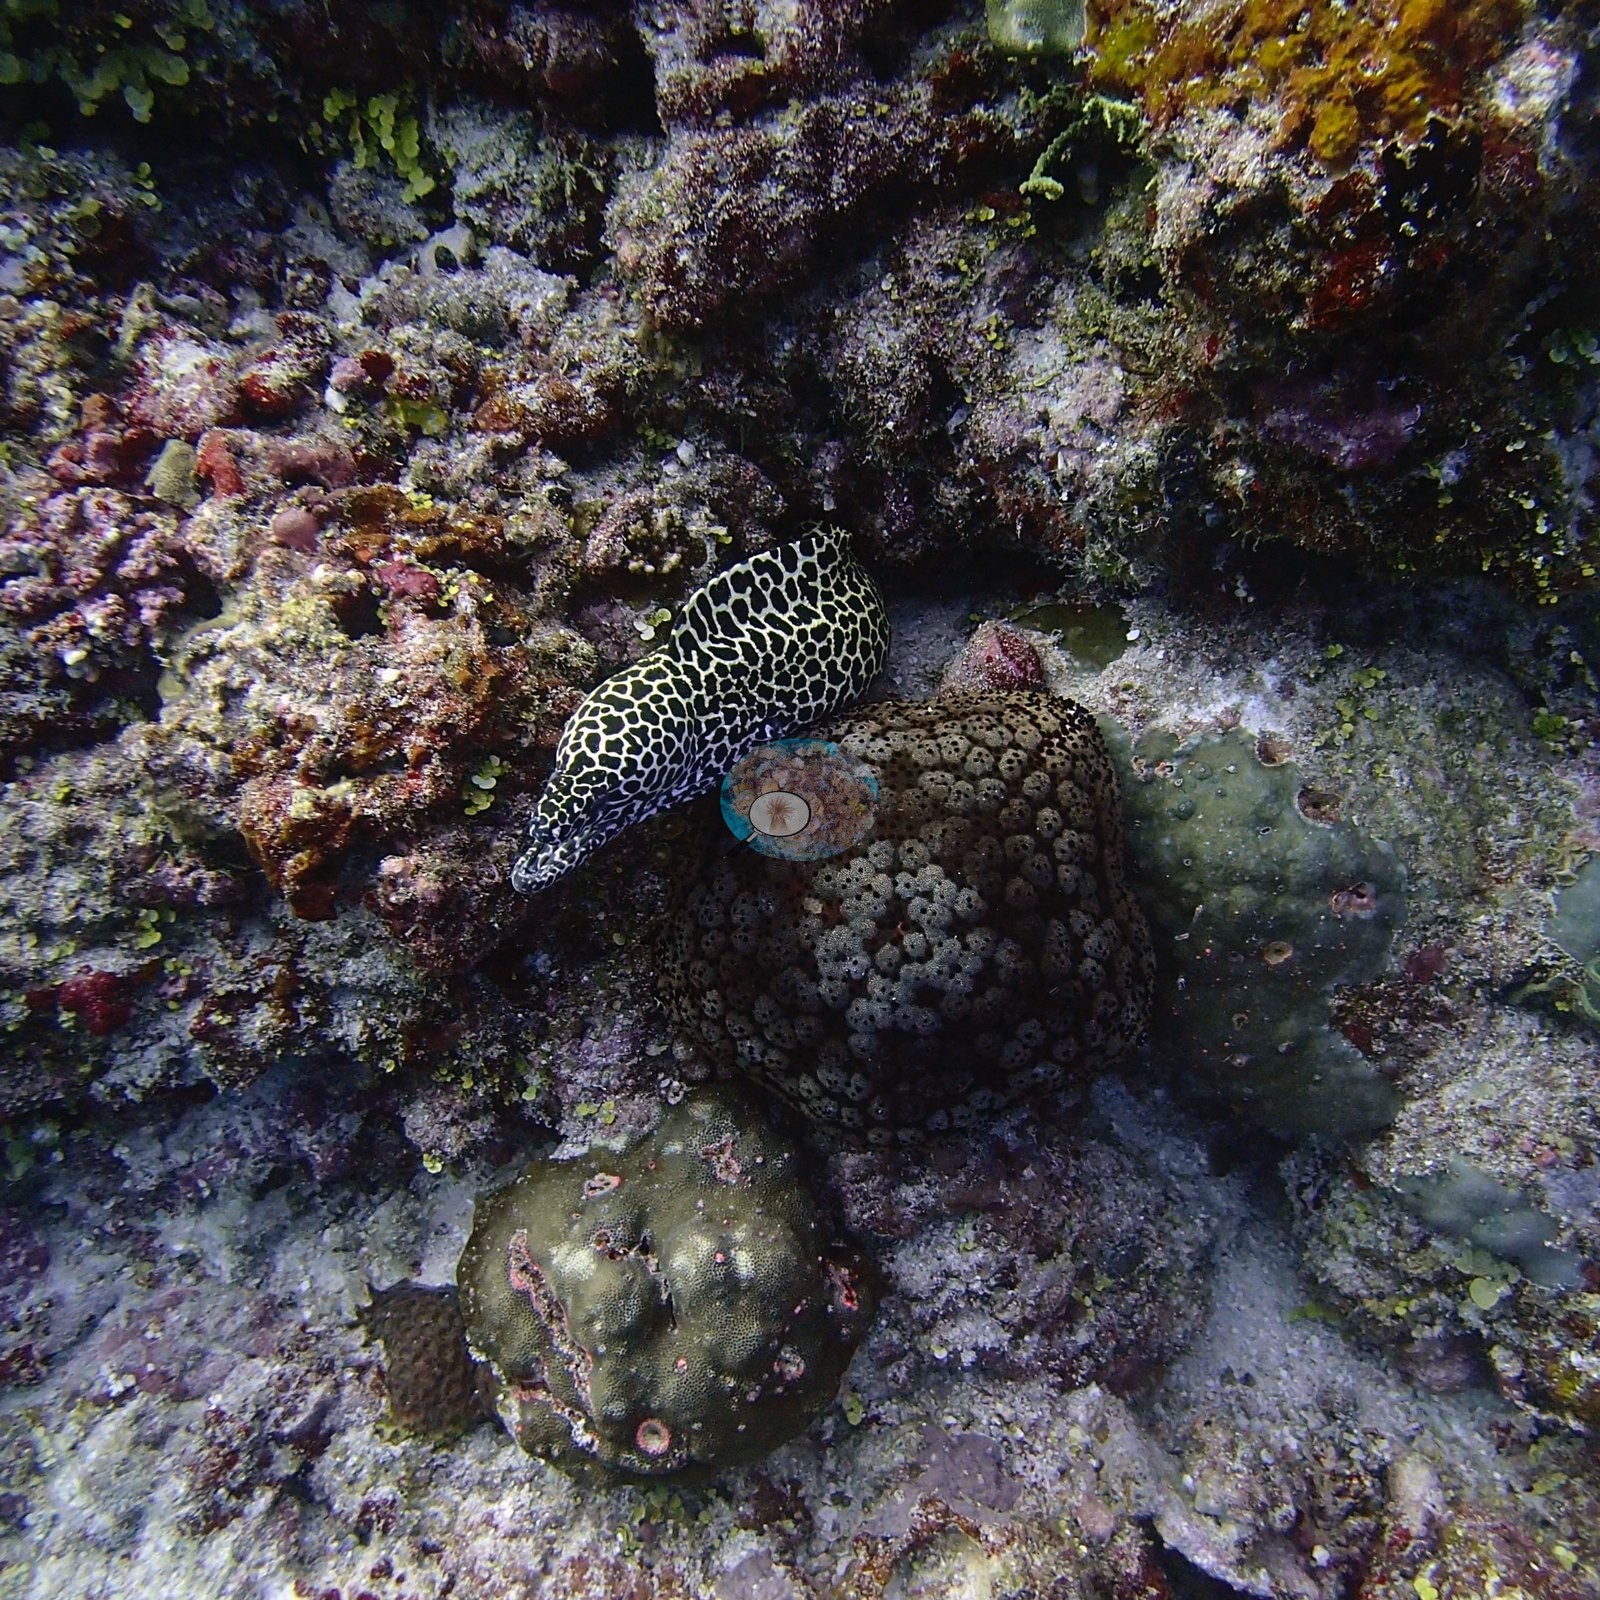
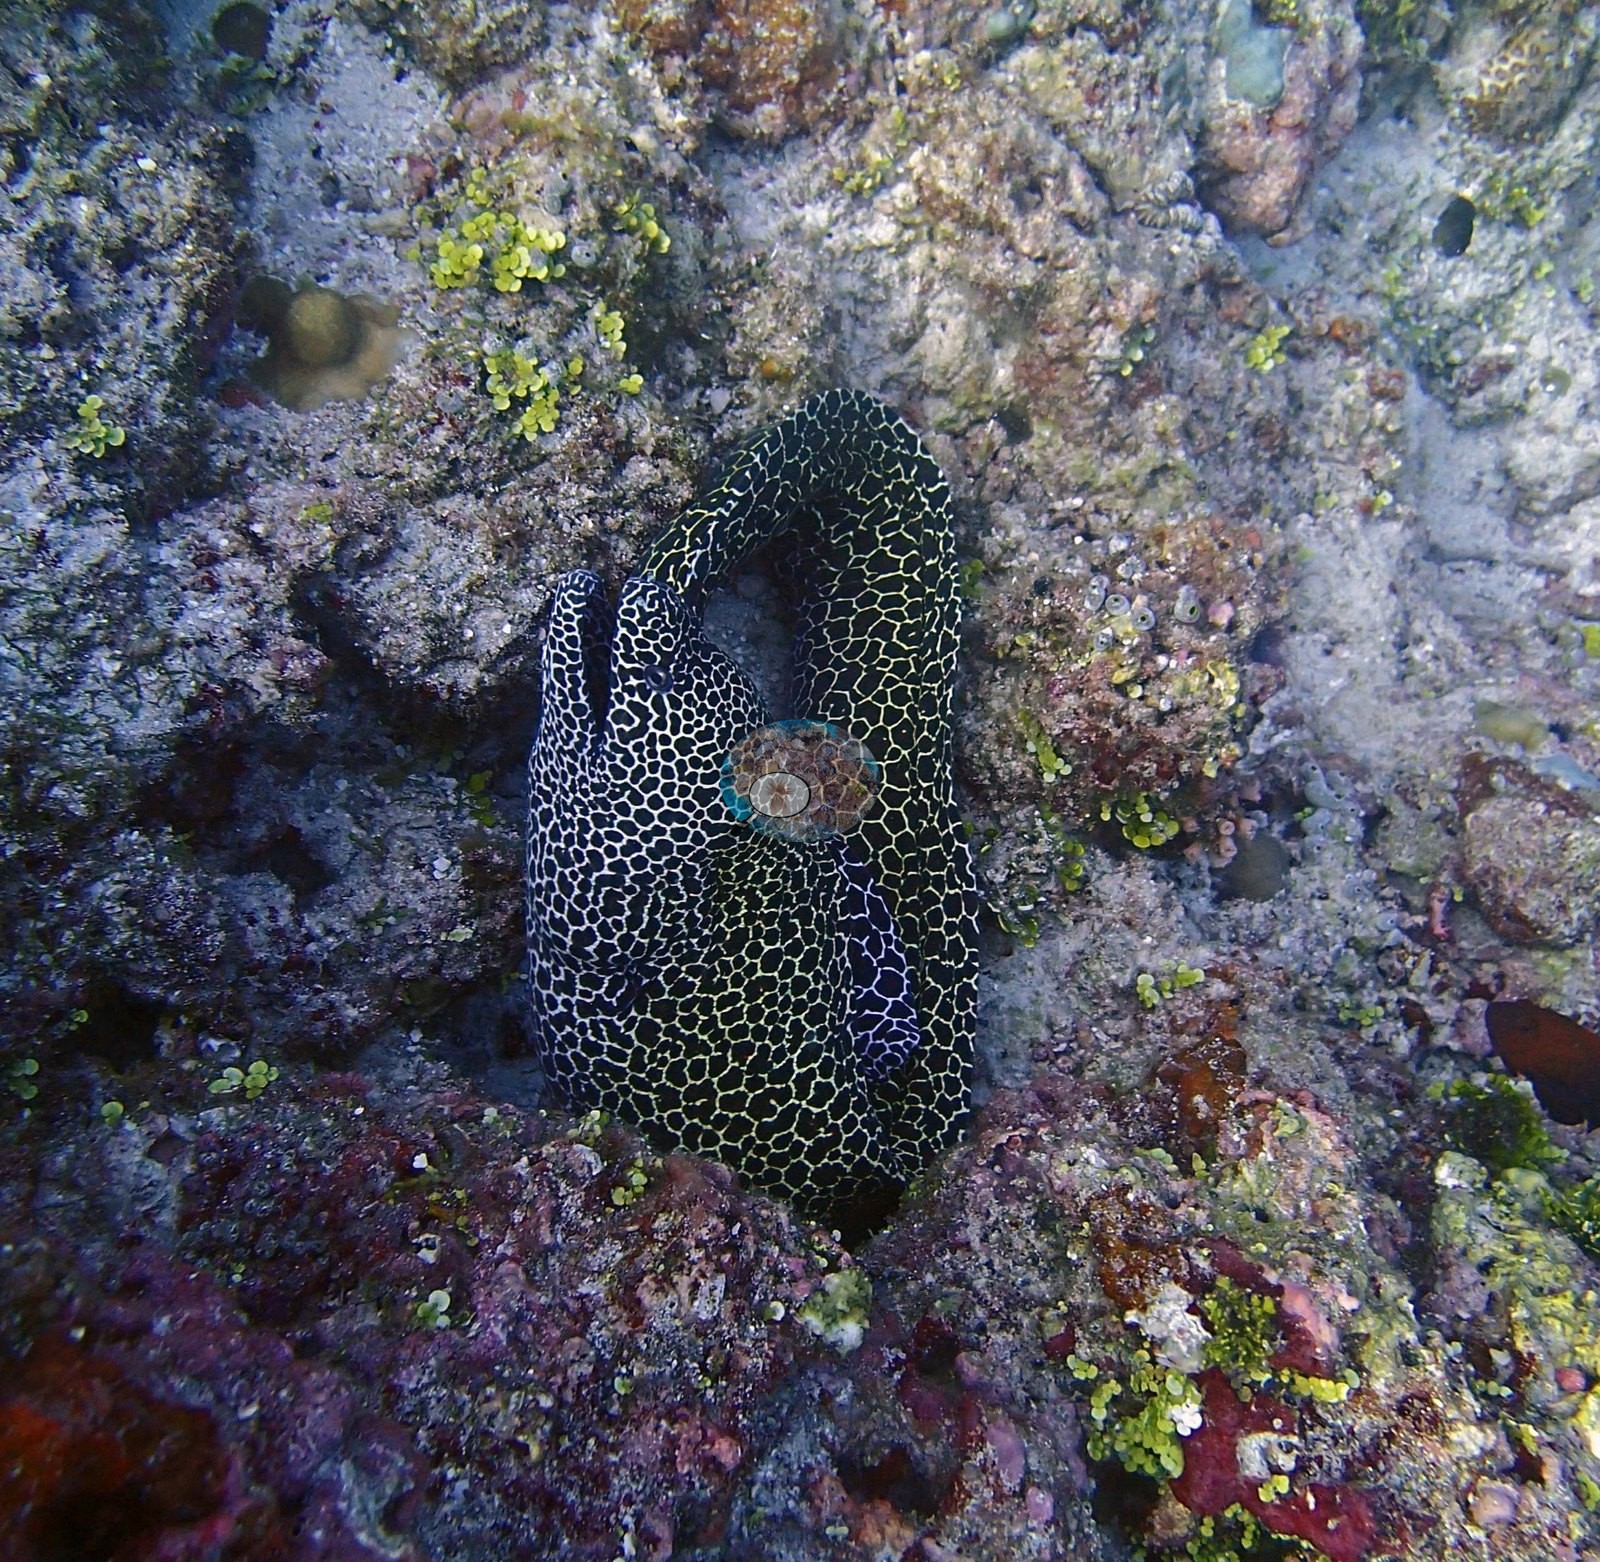
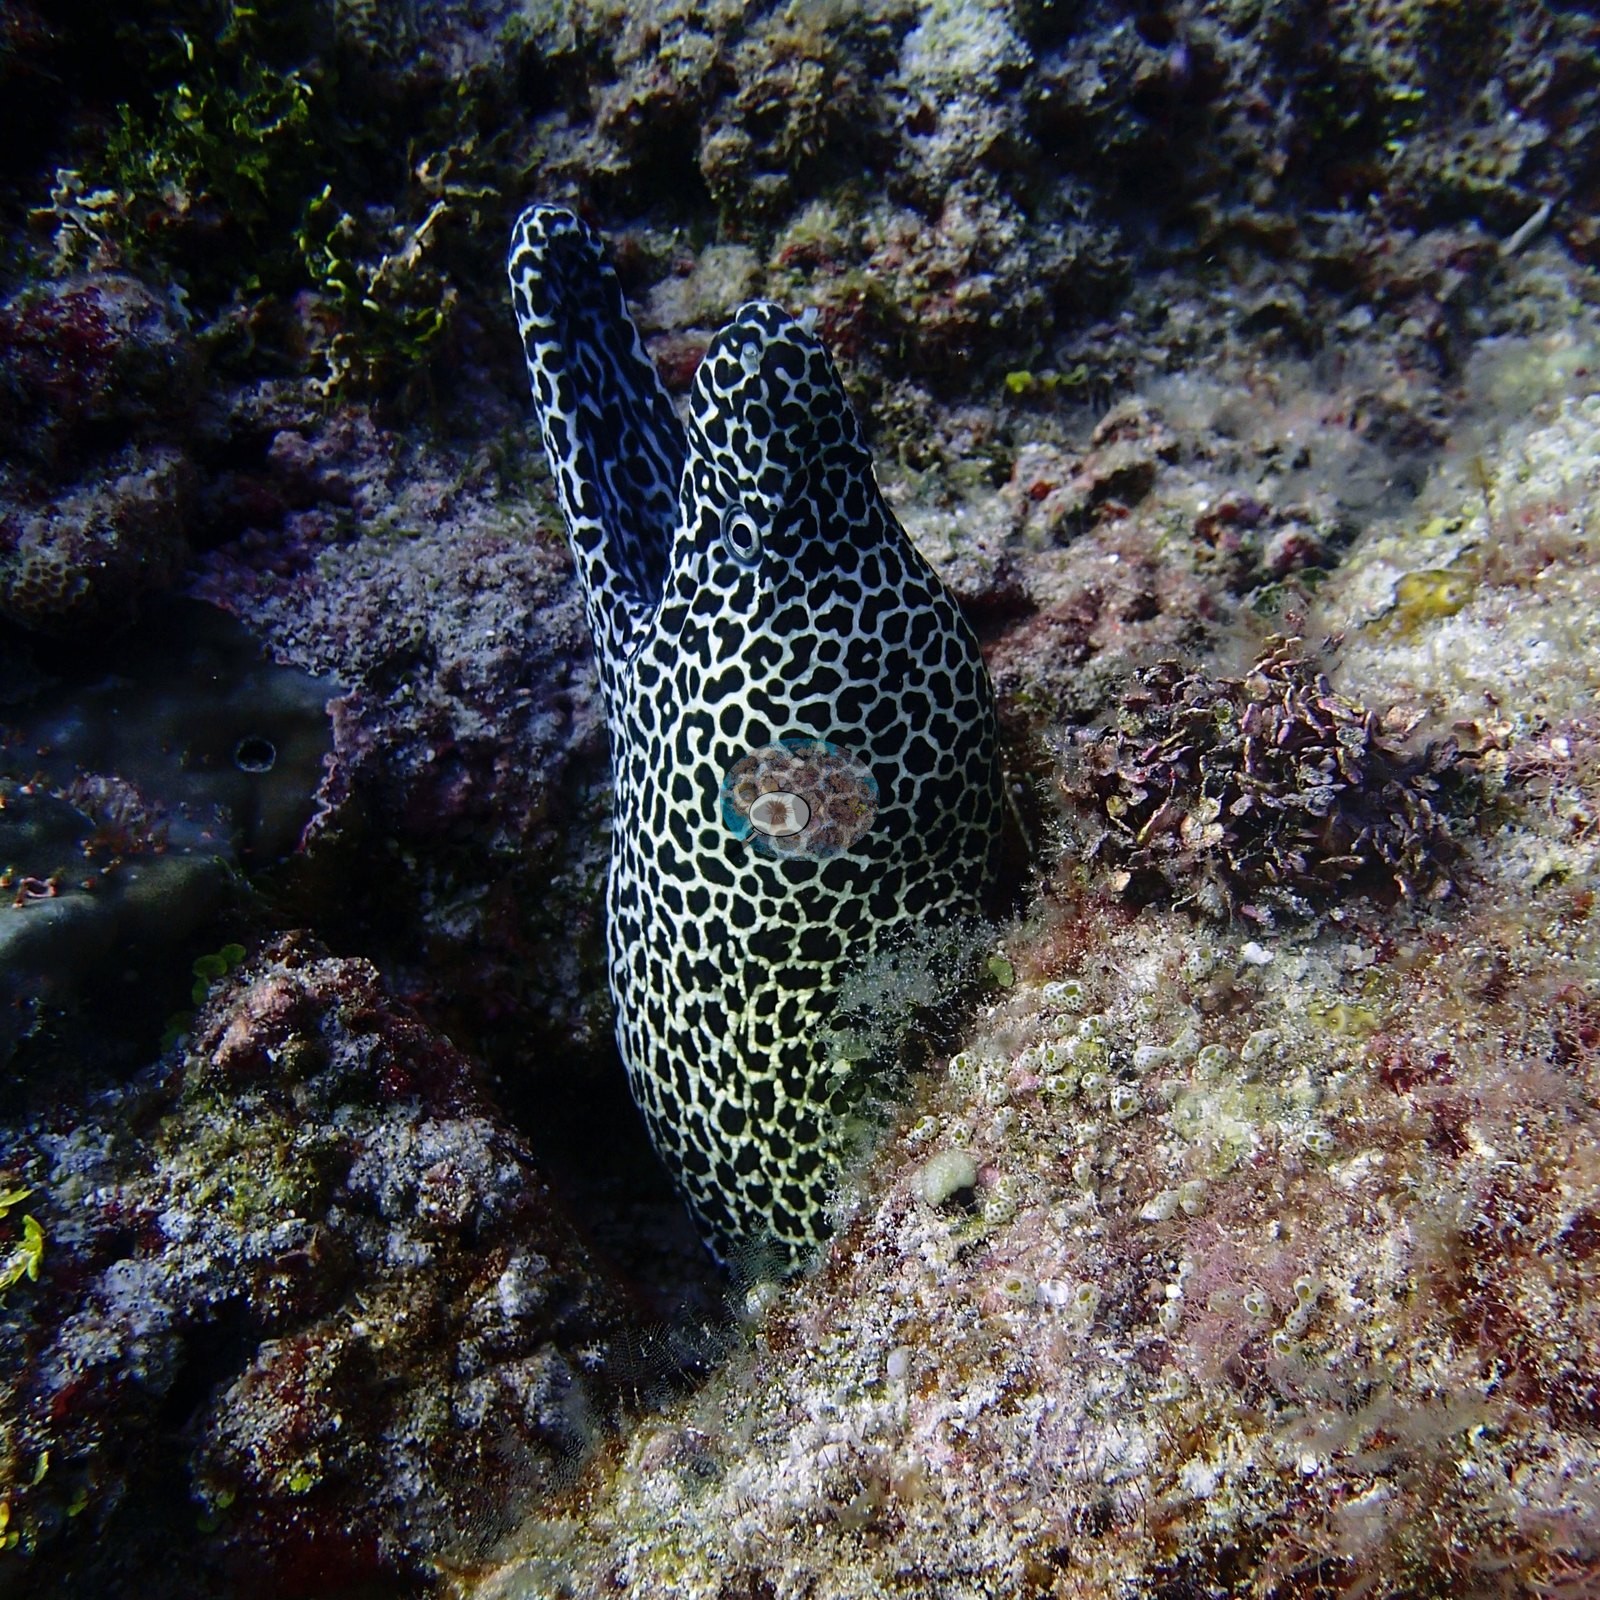
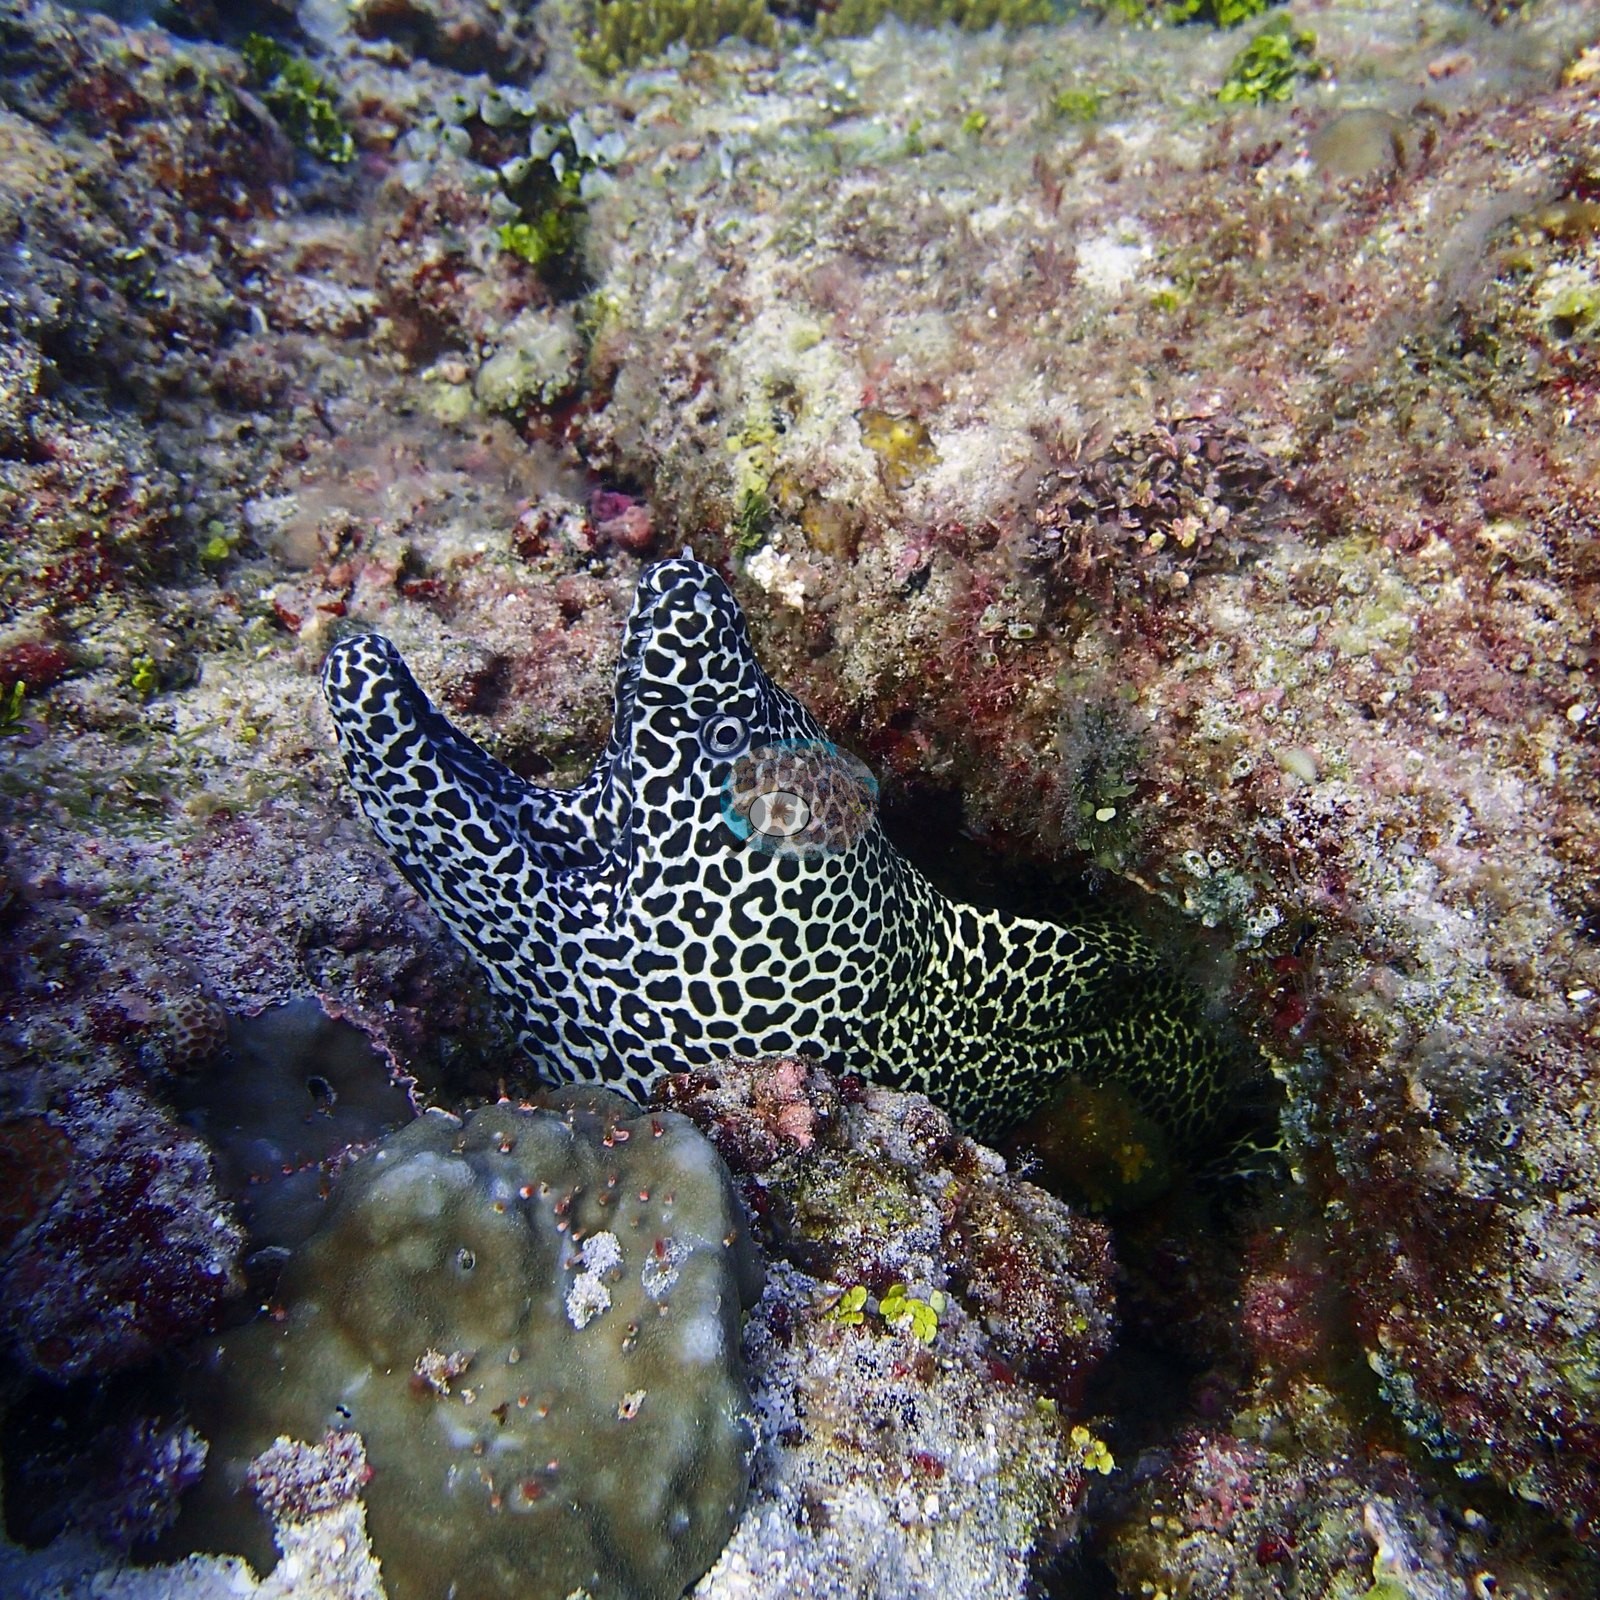
The dive belonged to a honeycomb moray: boldly patterned in giraffe-print black and white, it posed for portrait after portrait and then did something morays rarely do in daylight — slid fully out of its hole and swam free across the open reef (e.g., Image 6, Image 7, Image 22).
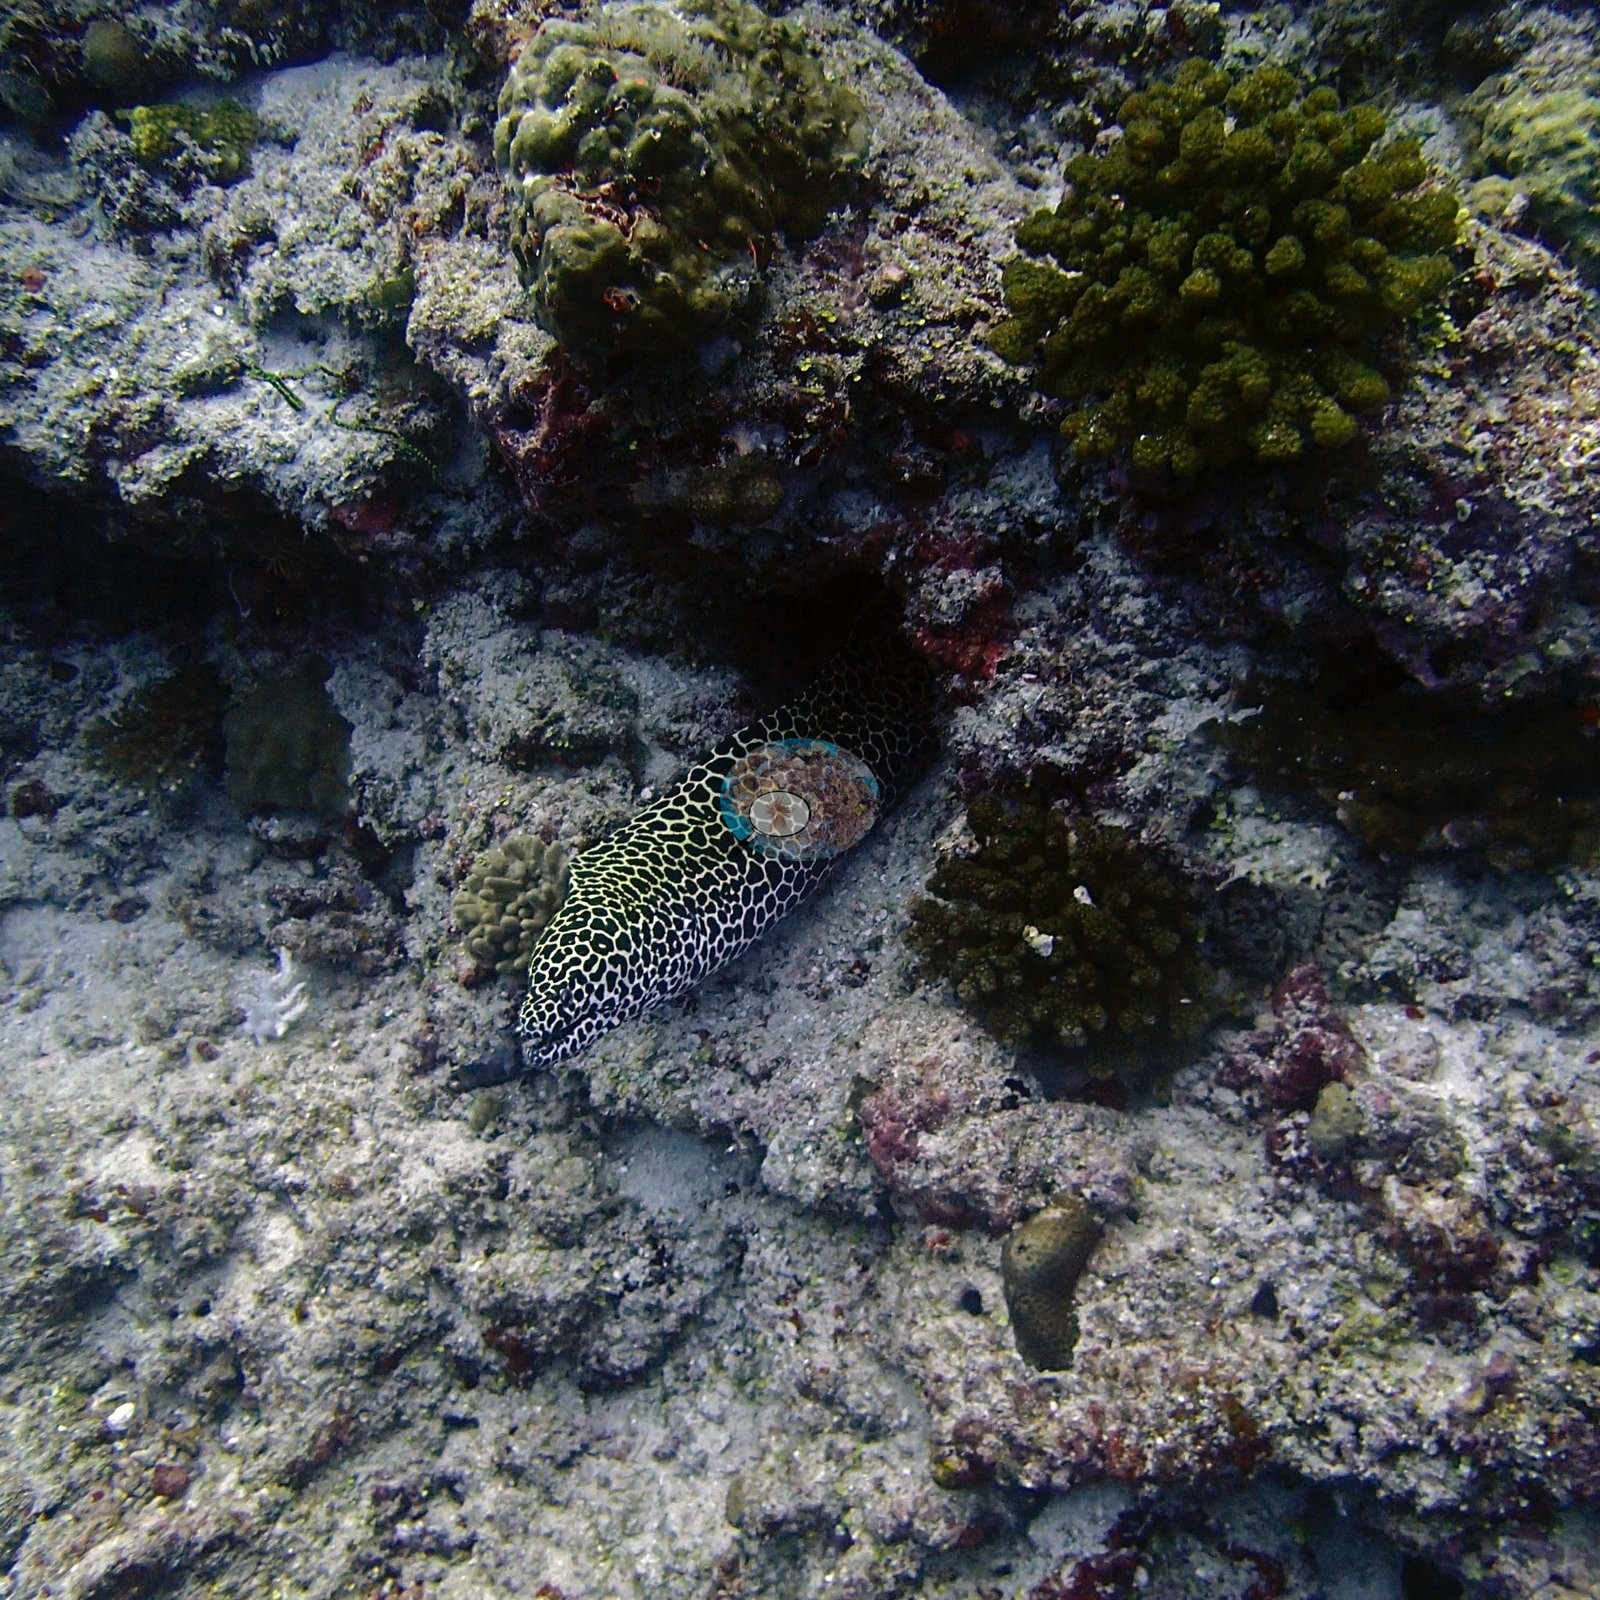
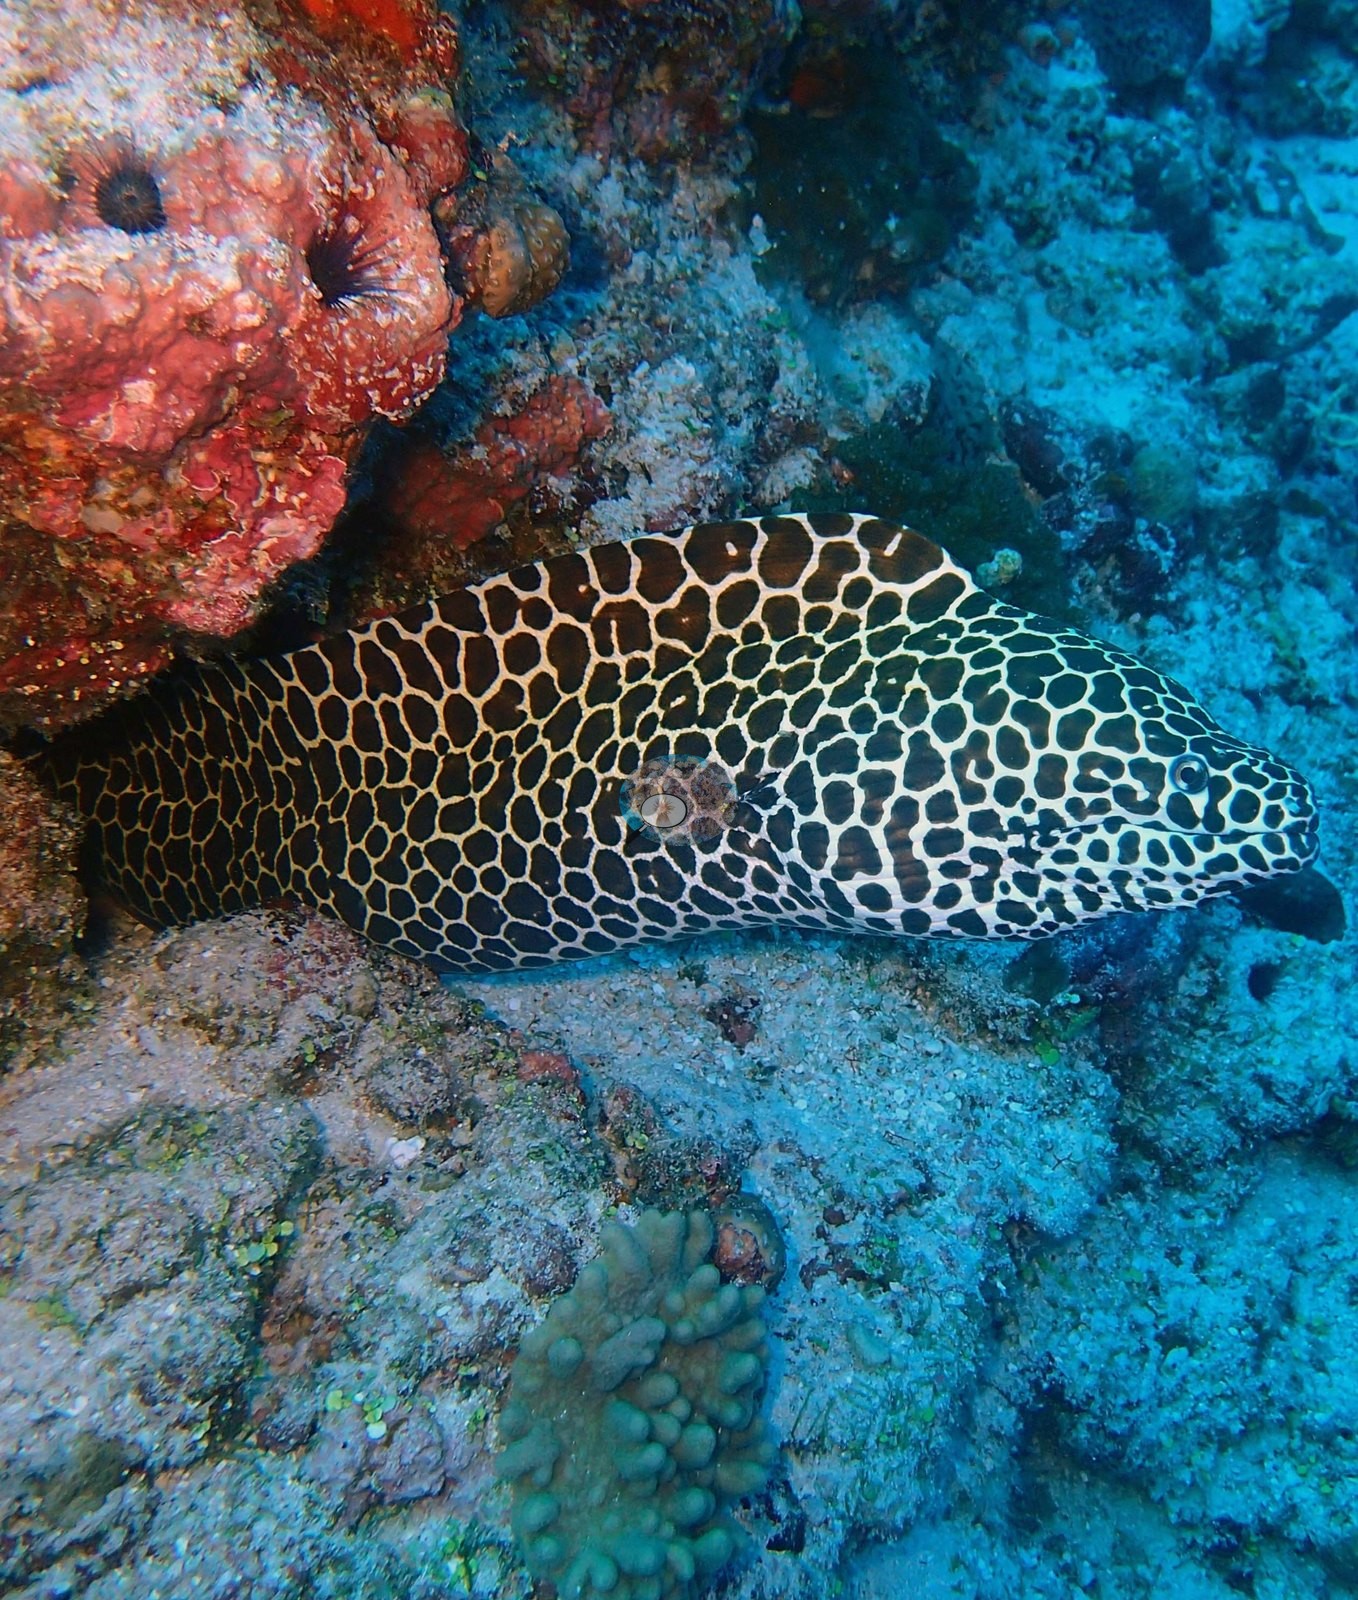
A spiny lobster's banded antennae gave away its hiding place under an overhang, and a sea cucumber sprawled across the coral.
Comparisons with other data
No independent survey was made at this exact site; the nearest ones are listed in the table below.
Dive record
Two more dives at this house reef followed later in the trip. On January 25, the trip's oddest dive toured the resort's underwater restaurant and the coral nursery planted around it: geodesic domes sprouting transplanted cauliflower and staghorn corals, some thriving and fist-sized, others toppled casualties in the rubble, with diners visible through the glass overhead and anemone carpets and damselfish crowding the terrace below.
CV model comparison
More info
As of September 2026 no computer-vision method estimates coral cover accurately on new images, so treat this as indicative rather than a measurement; it is revised as the methods improve.More info
The published figure is the mean of the two methods.| Method | Hard-coral cover (%) |
|---|---|
| In-house DINOv3 | 24.4 |
| CoralSCOP | 37.6 |
| Mean (± SD) | 31.0 ± 9.3 |
| Range | 24.4–37.6 |
Mean ± SD and range are across the computer-vision methods shown.
Independent surveys nearby
| Agency / program | Year(s) | Stations / distance | Link |
|---|---|---|---|
| Montefalcone et al. (2020) | 2015 | 1 station, 1.21 km | Records ↓ |
| Reef Check | 2022 | 1 station, 2.54 km | Records ↓ |
| XL Catlin Seaview Survey | 2015–2017 | 2 stations, 2.90–3.64 km | Records ↓ |
 Dr. Coral (CRD)Year-average (no detectable trend)
Within 5 km, 4 independent survey stations recorded hard coral cover in 5 records between 2015 and 2022. Of the 1 station surveyed in more than one year, 1 changed by less than 5 percentage points between their first and latest surveys. The longest record, transect 37035 (XL Catlin Seaview Survey, 2.90 km away), went from 7.1% in 2015 to 5.5% in 2017. One survey since 2021 recorded 19%. This site's own estimate (31%) sits 11.6 points above the recent value (19%); the methods differ, so the comparison is context, not a like-for-like test.
Collected by other programs using different methods (Reef Check uses point-intercept transects; the XL Catlin Seaview Survey uses photo-transects with automated image annotation), so these are context for the figures above, not a like-for-like comparison. Where a station was surveyed more than once the range is shown. Station names are not dive-site names. Values marked best patch exceed 70%: surveyors usually chose the richest area, so they are not site means.
| Agency | Site / location | Date | Hard coral cover (%) | Distance | Link |
|---|---|---|---|---|---|
| Montefalcone et al. (2020) | Cocoa Corner | 2015 | 76% best patch | 1.21 km | HeatCRD database |
| XL Catlin Seaview Survey | transect 37035 | 2015–2017 | 5.5–7.1% (2 images) | 2.90 km | — |
| XL Catlin Seaview Survey | transect 37036 | 2015 | 38% | 3.64 km | — |
| Reef Check | Gulhi Island Backreef | 2022 | 19% | 2.54 km | — |
Data & links
All images from Coral Reef Diagnostics. Data are from Coral Reef Diagnostics and the organizations named in the data-sources table above.
© Coral Reef Diagnostics.