
Maldives - Georgia's Reef

Part of the regional summaries: Maldives - Central (Male Atolls / Ari / Vaavu) and Maldives
More info
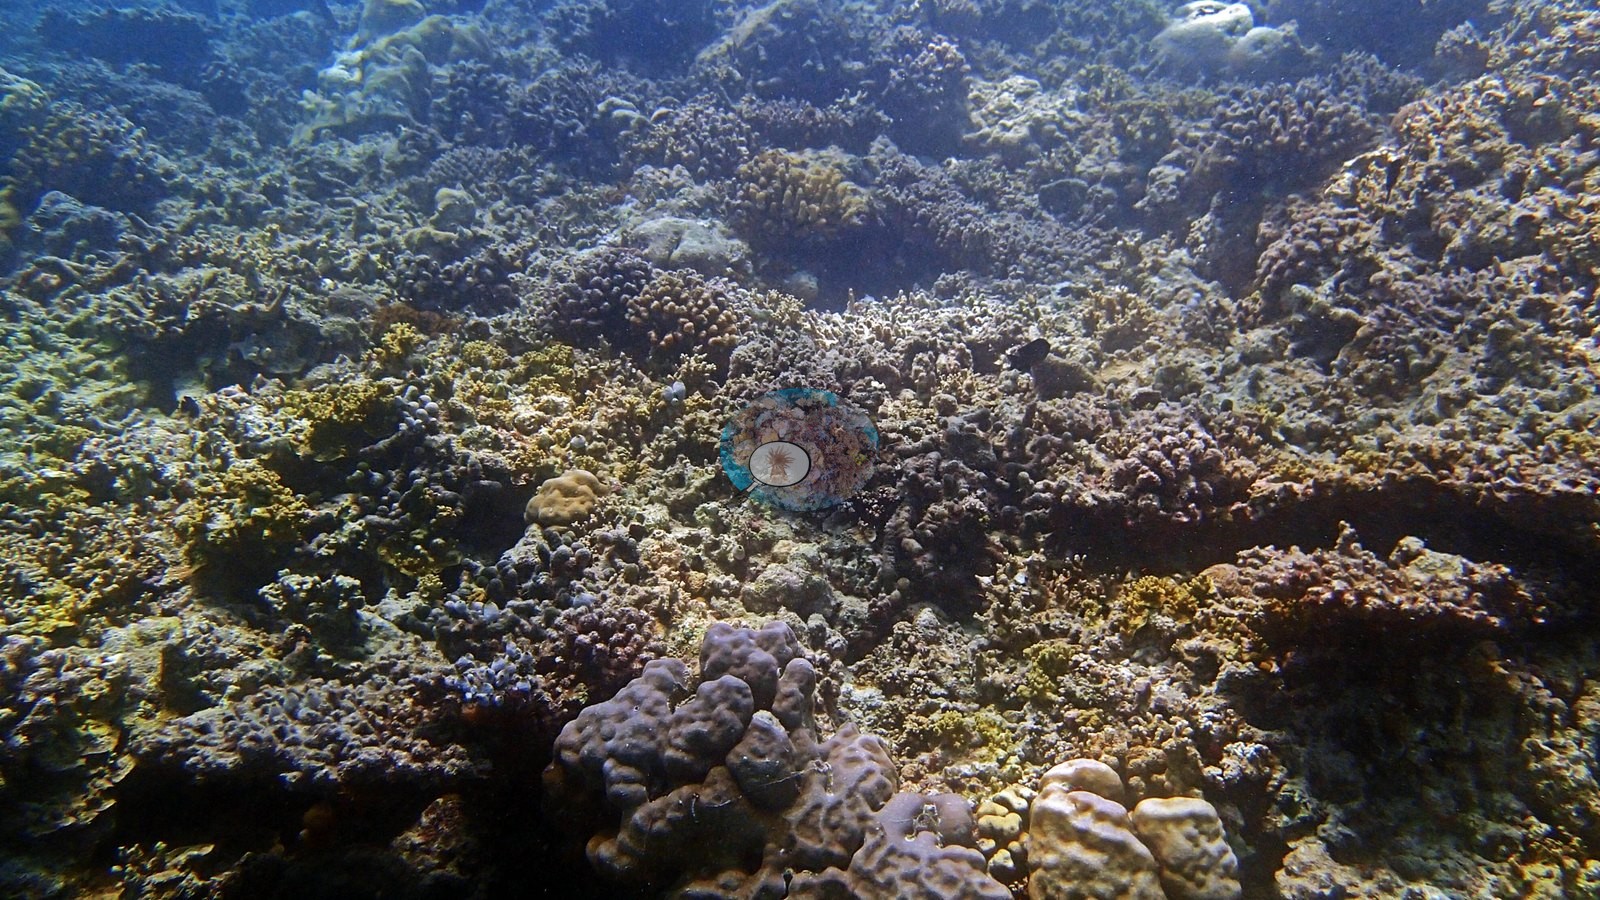
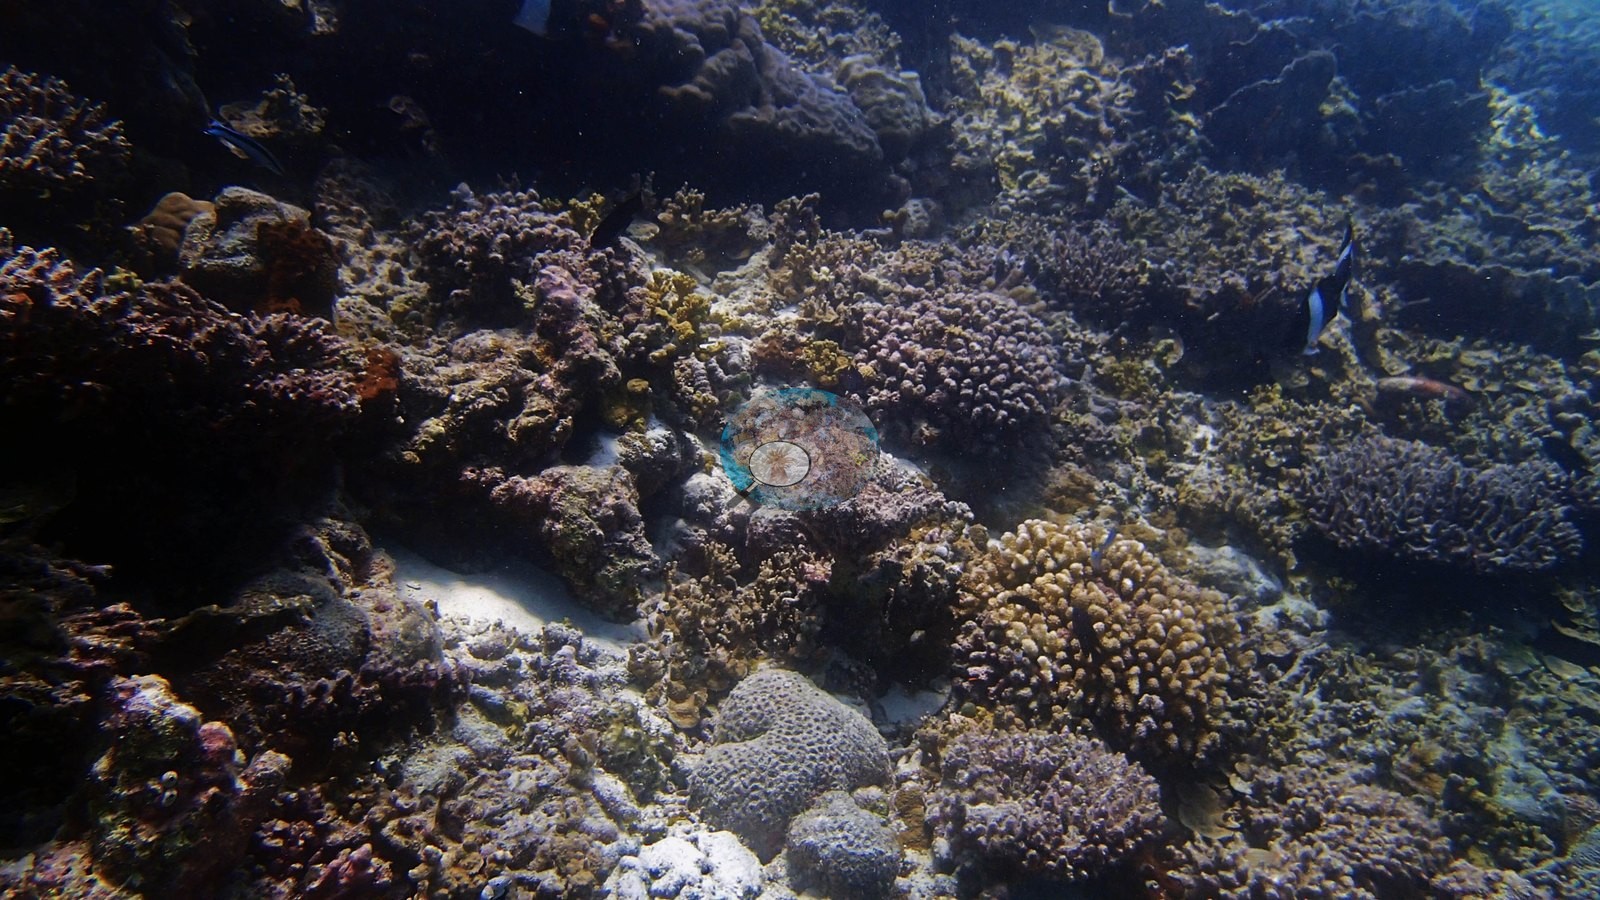
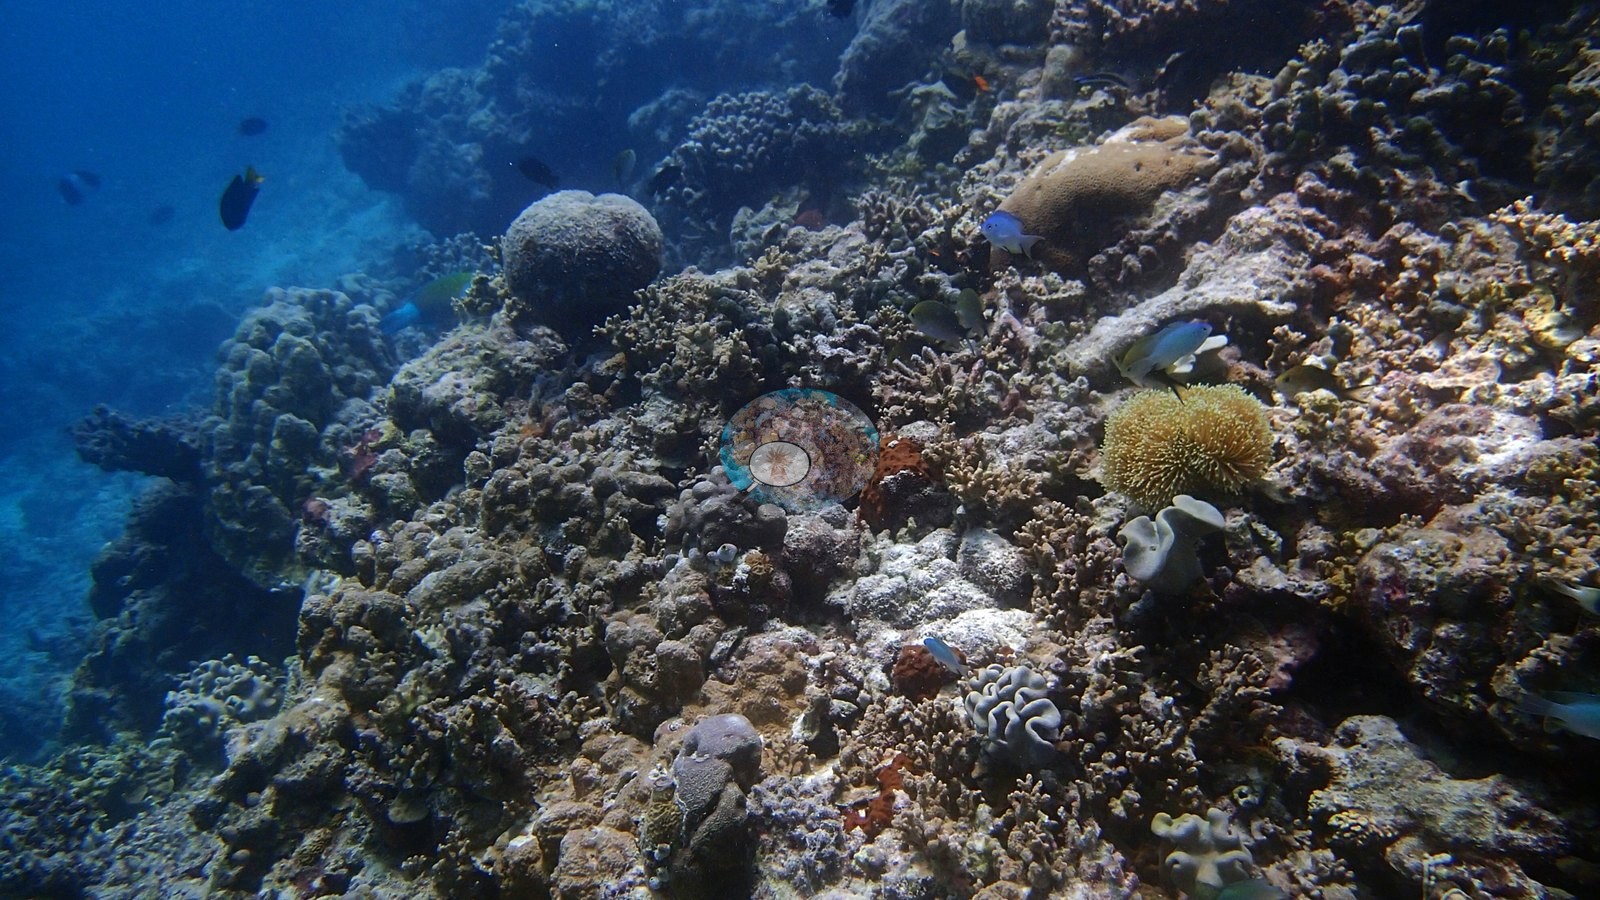
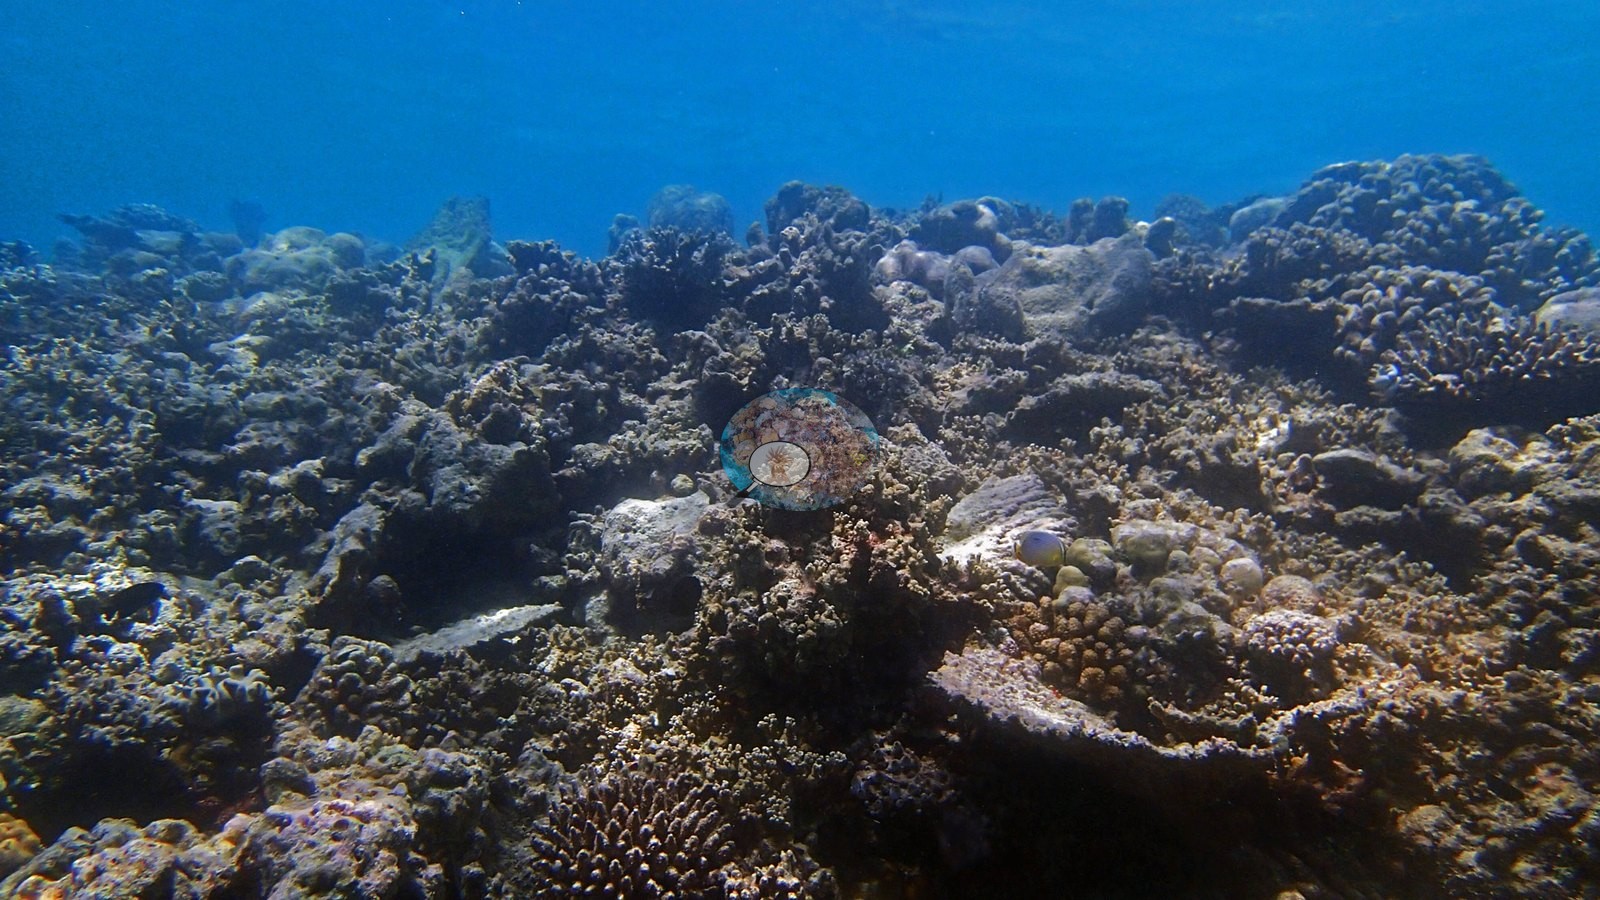
Maldives (NOAA CRW virtual station) · Maldives ecoregion mean=2.9°C-heating weeksA favorite first-leg site with genuine coral thickets - branching Acropora-type stands, finger Porites hillsides, shingled plate corals - though crown-of-thorns starfish keep turning up here, one caught beside the fresh white scar of its latest meal. Computer vision cover estimate is 17-23%, averaging 19.9%.
Three independent survey stations shown with the program’s logo — click one to see how far it is from this site.
12 of these 25 photographs are shown beside the text that discusses them under "Site description" below.
Site description
Setting
The first-leg favorite, dived twice in one day — and the first site where the camera runs out of rubble to photograph.
General benthic features
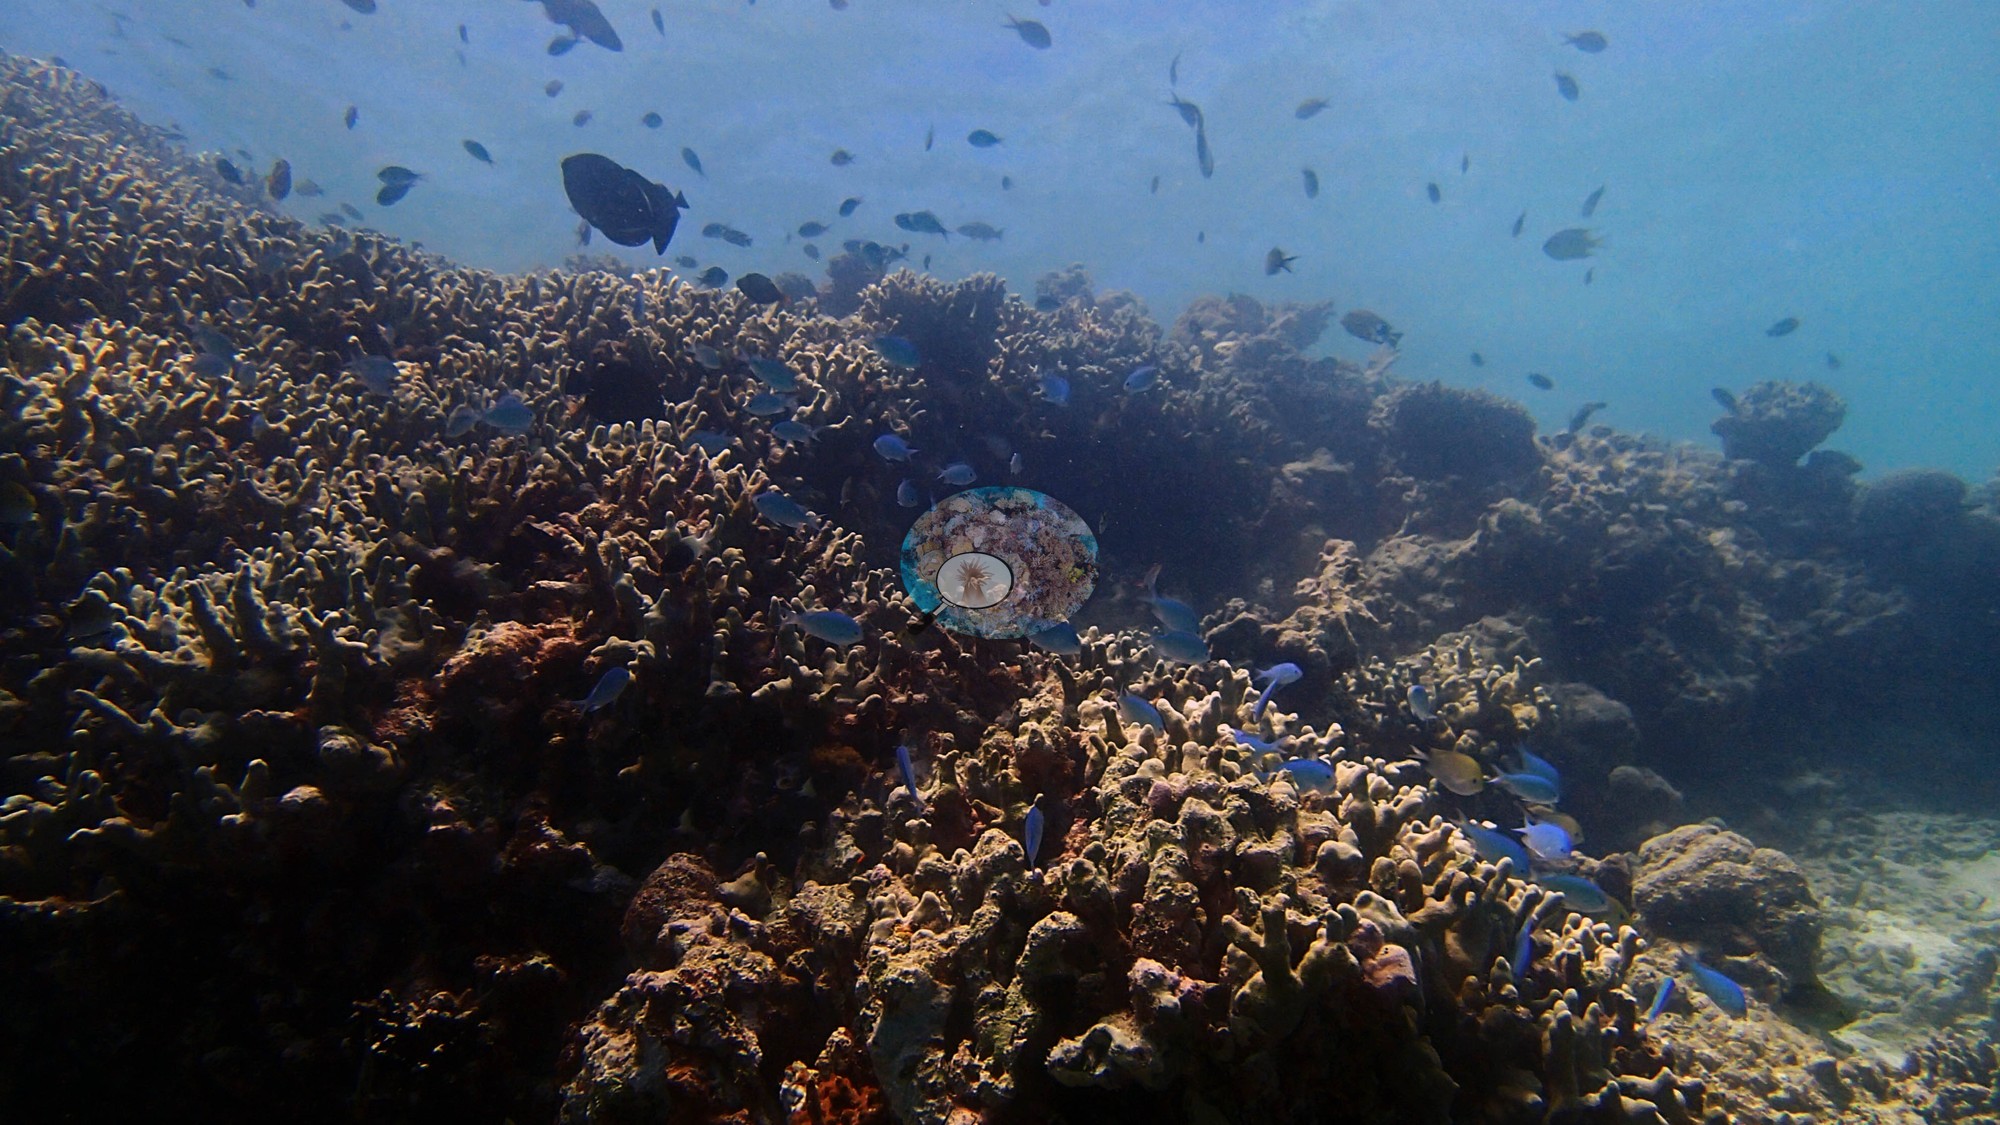
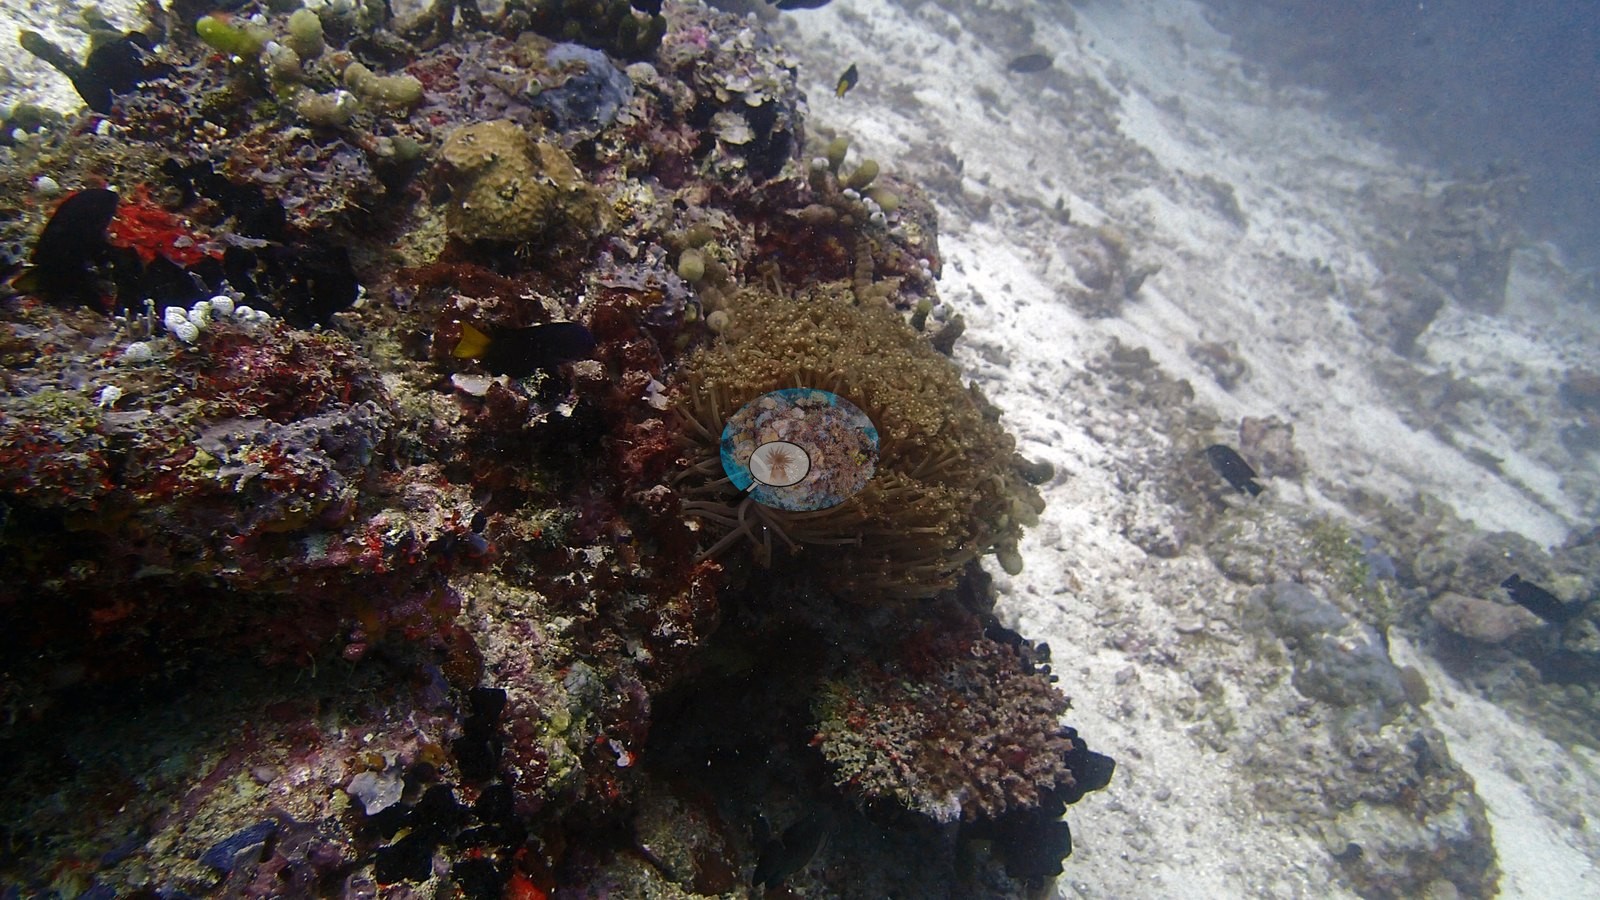
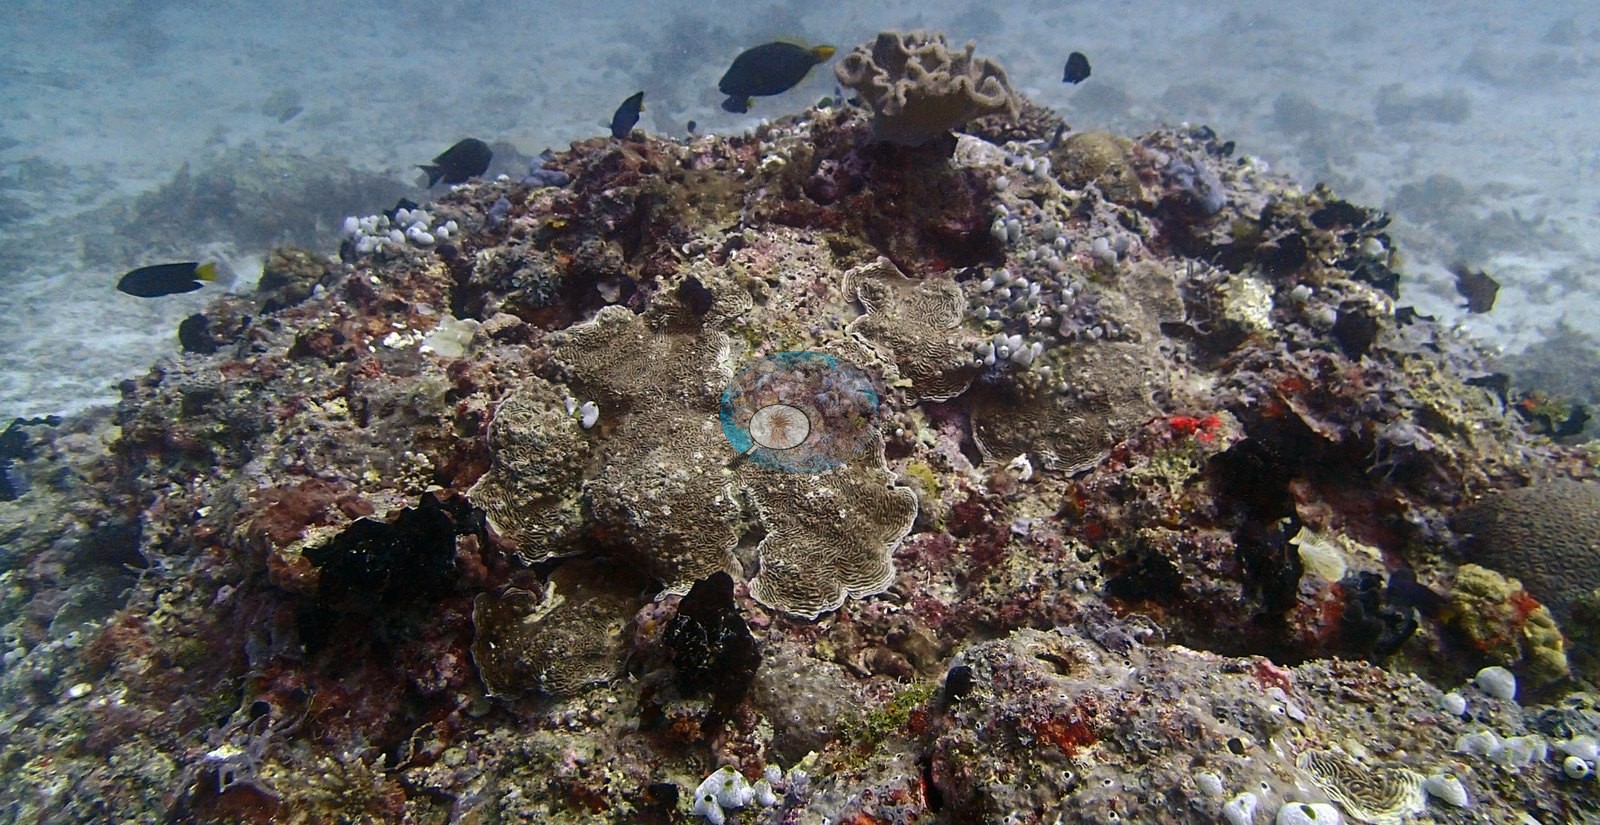
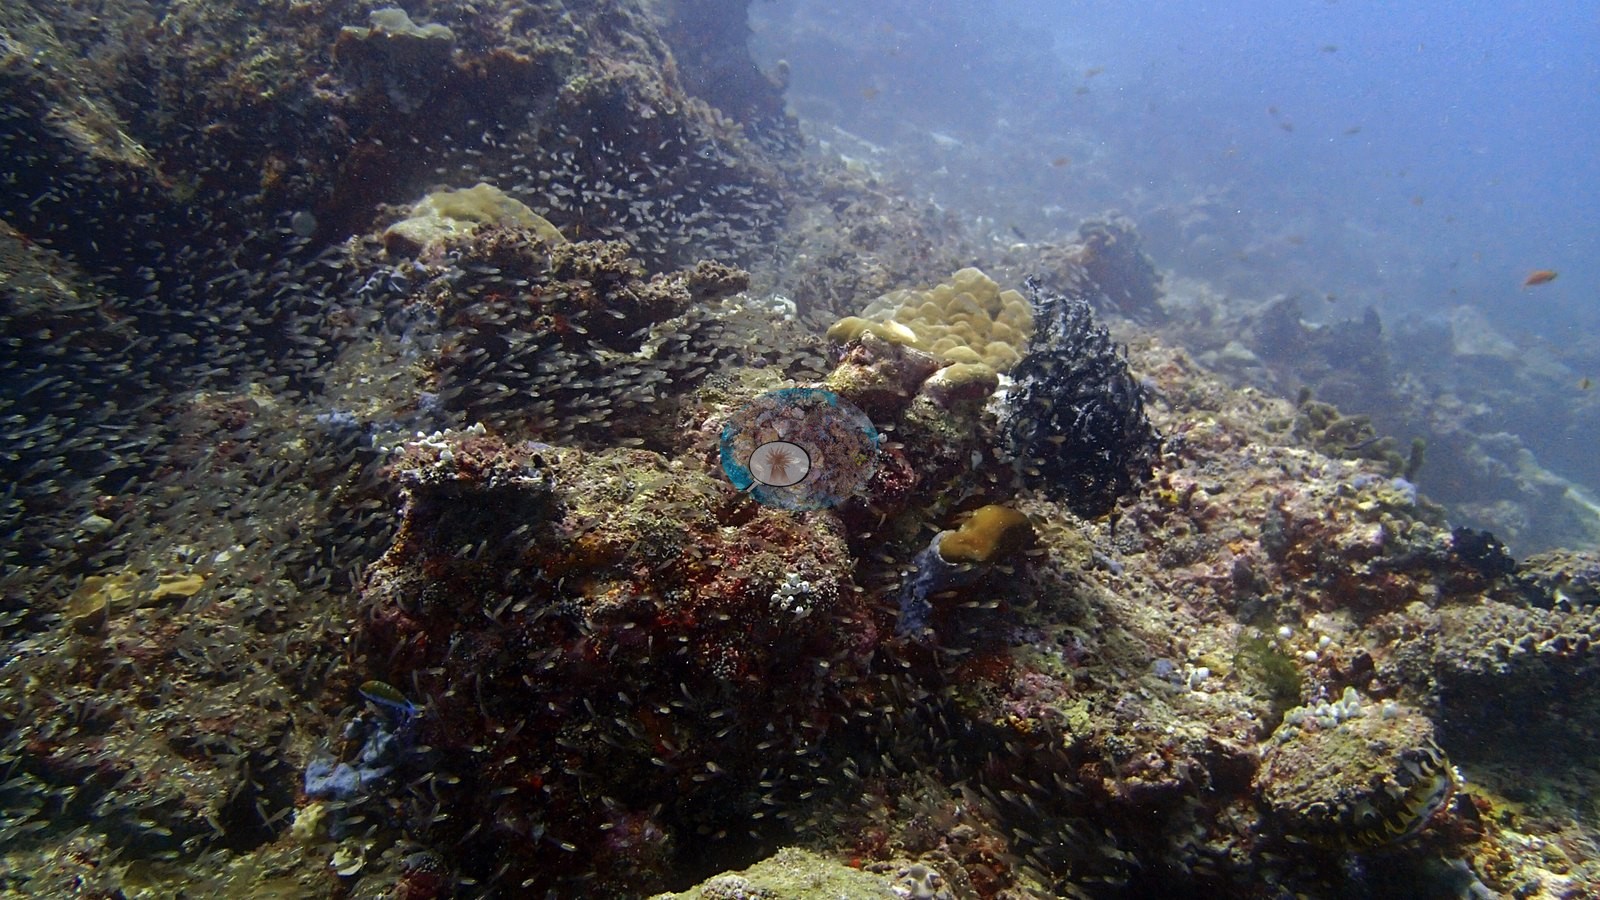
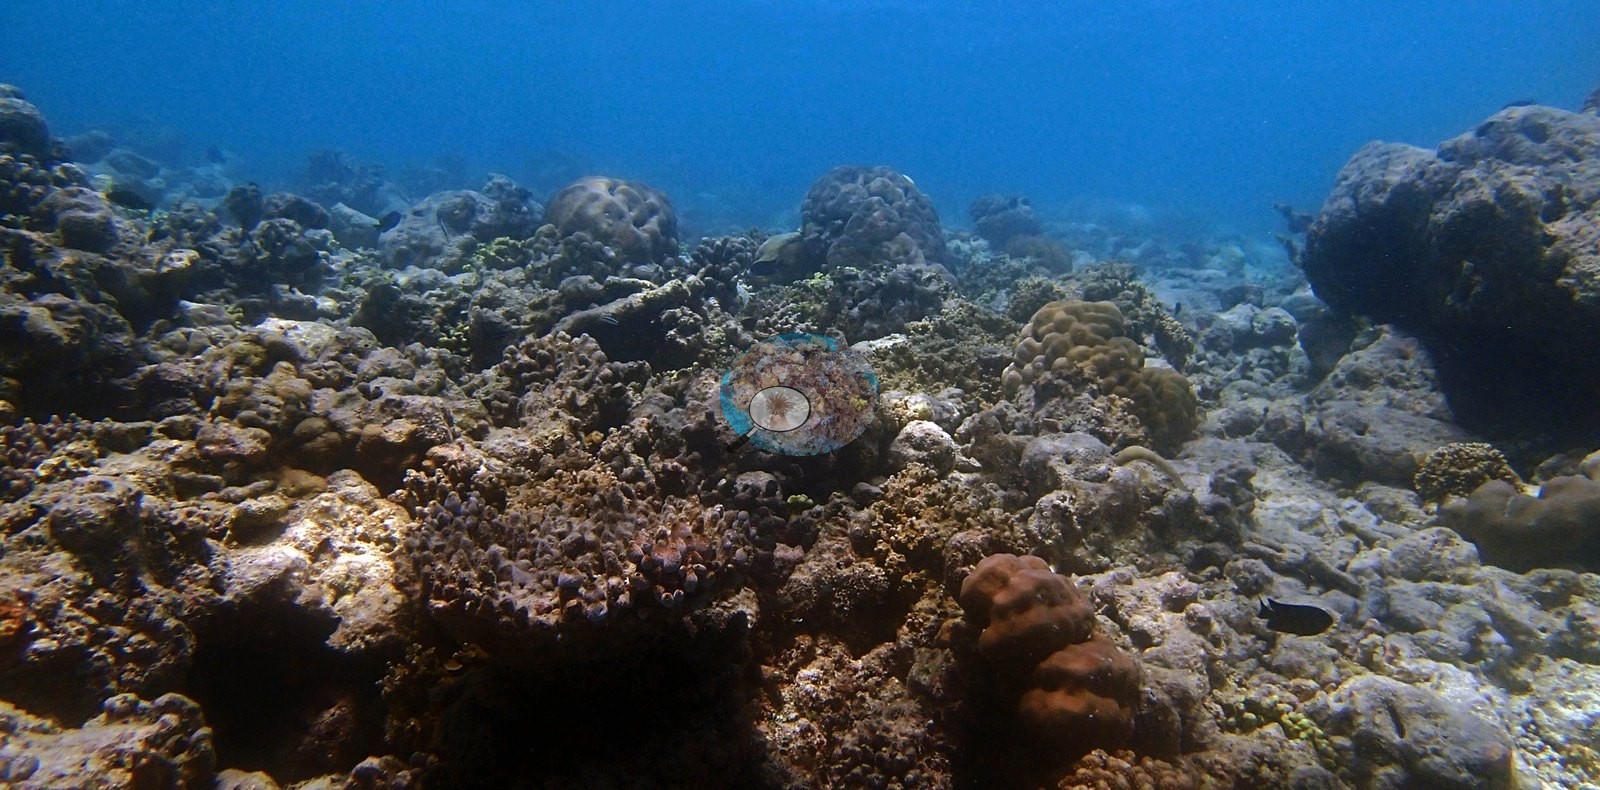
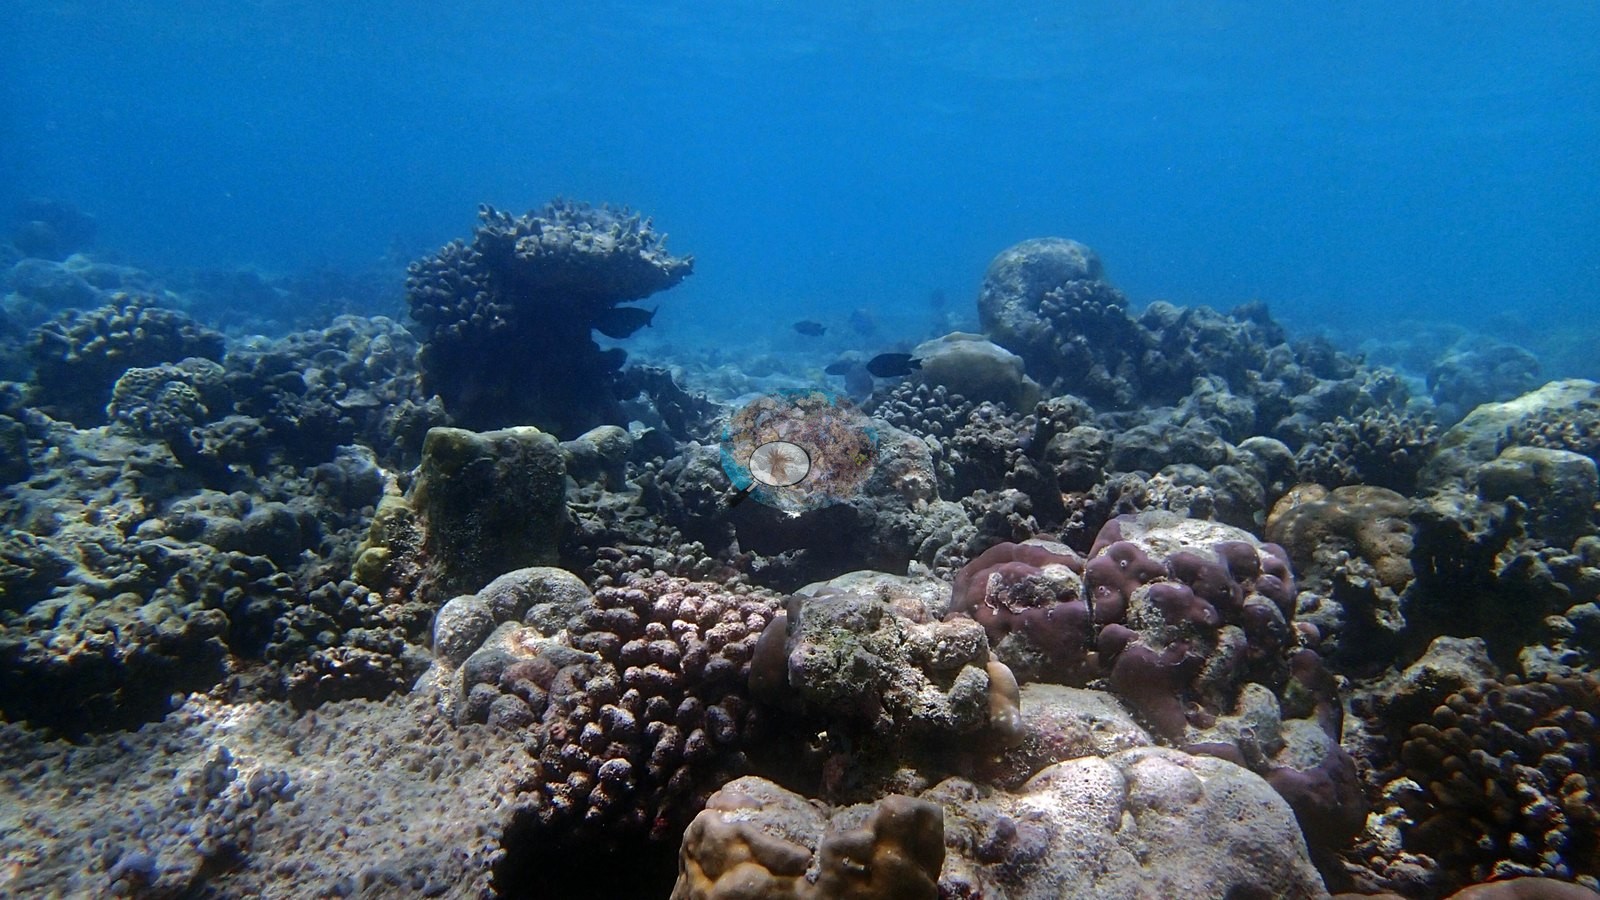
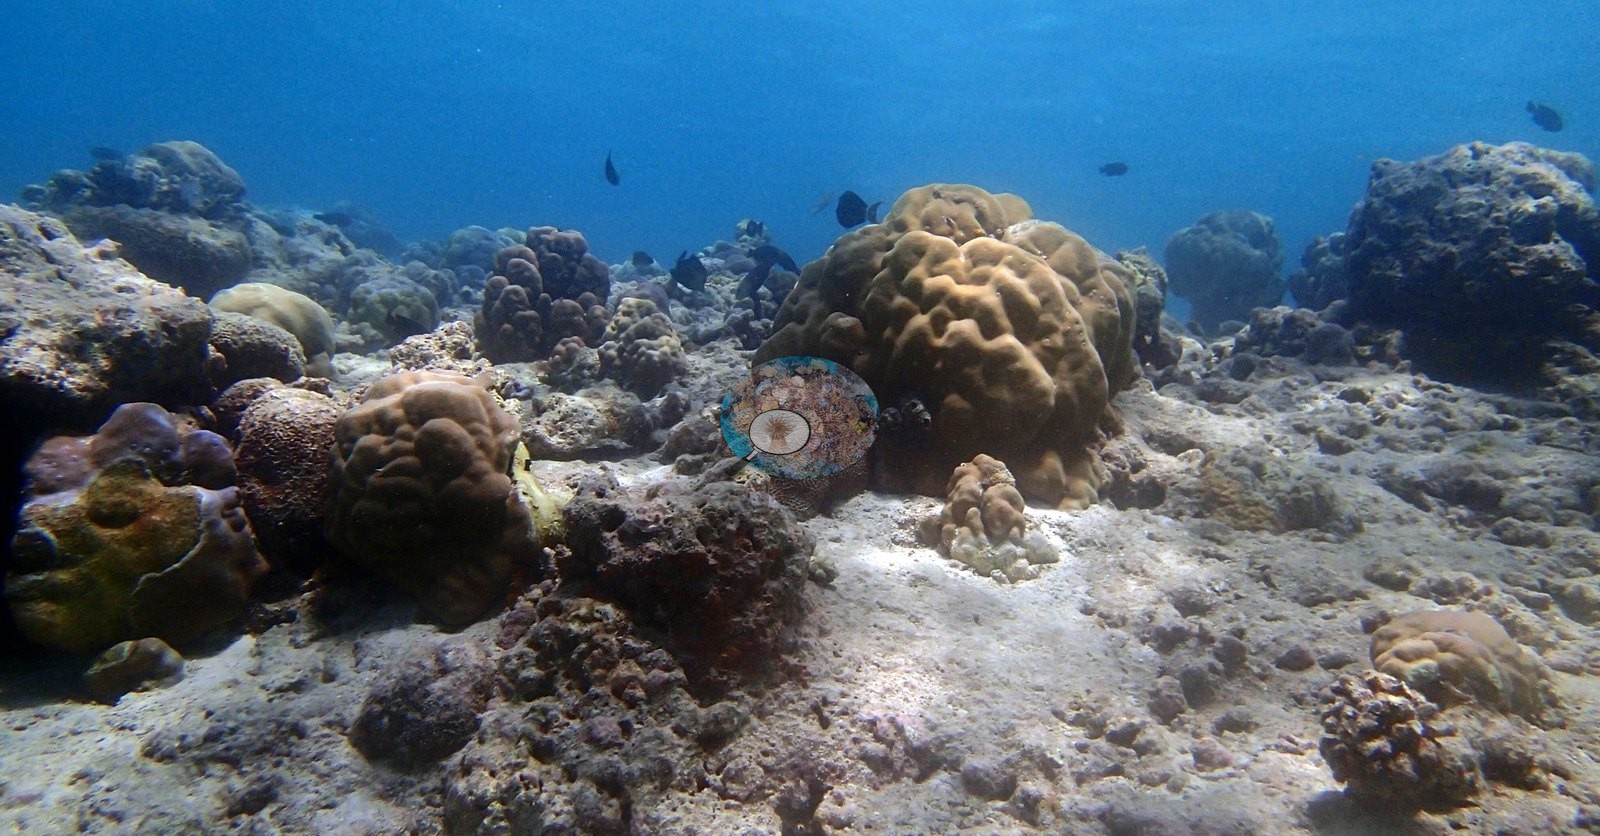
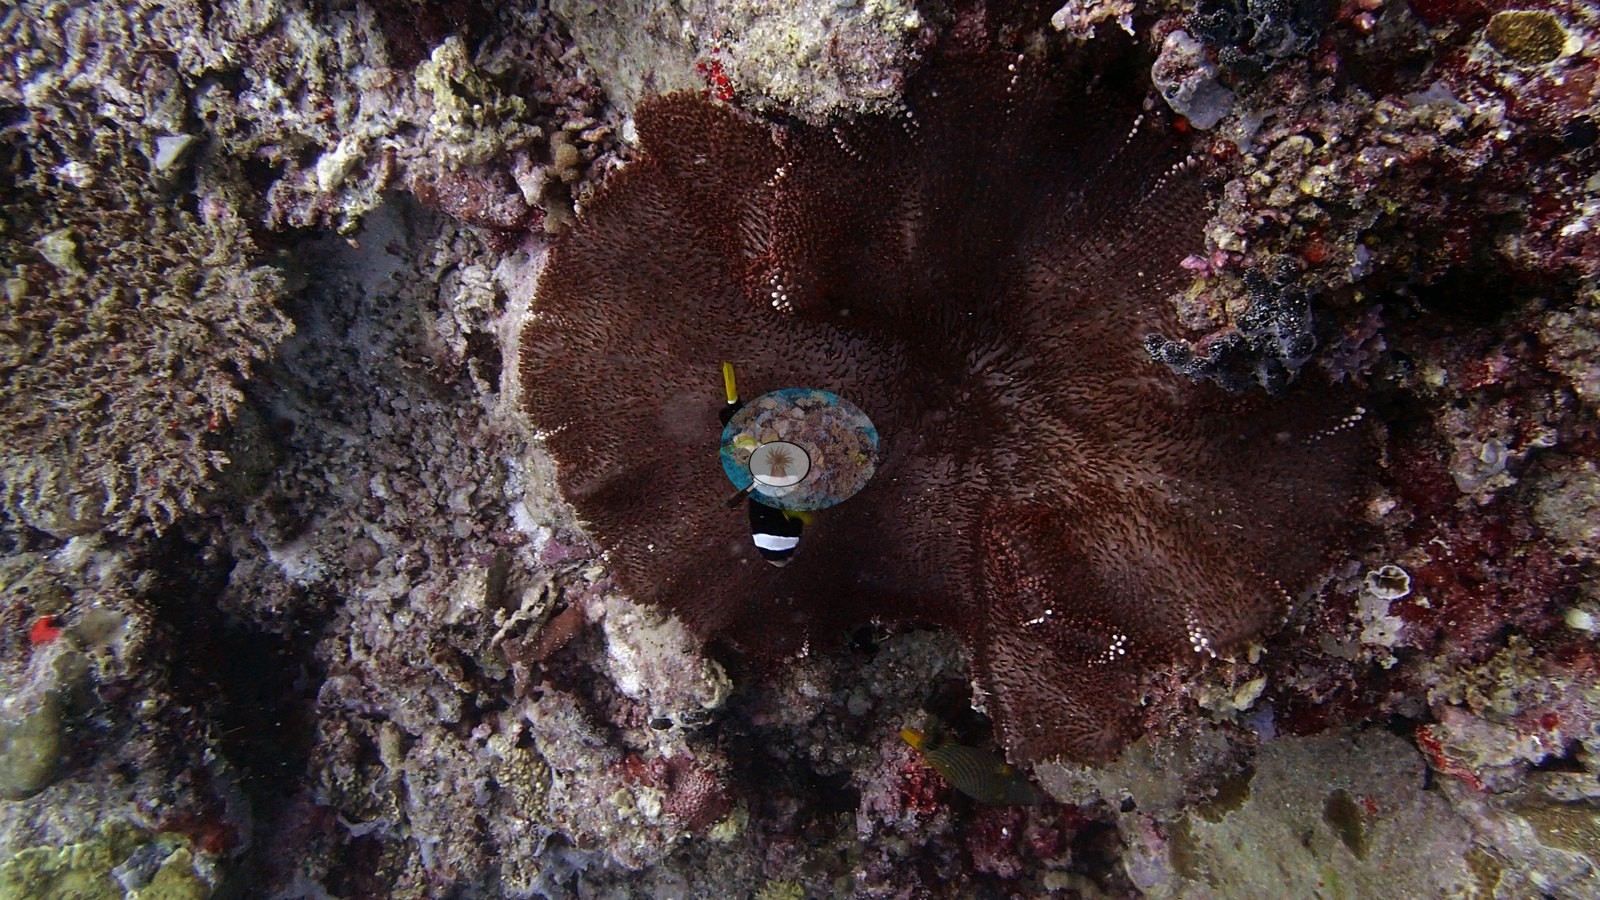
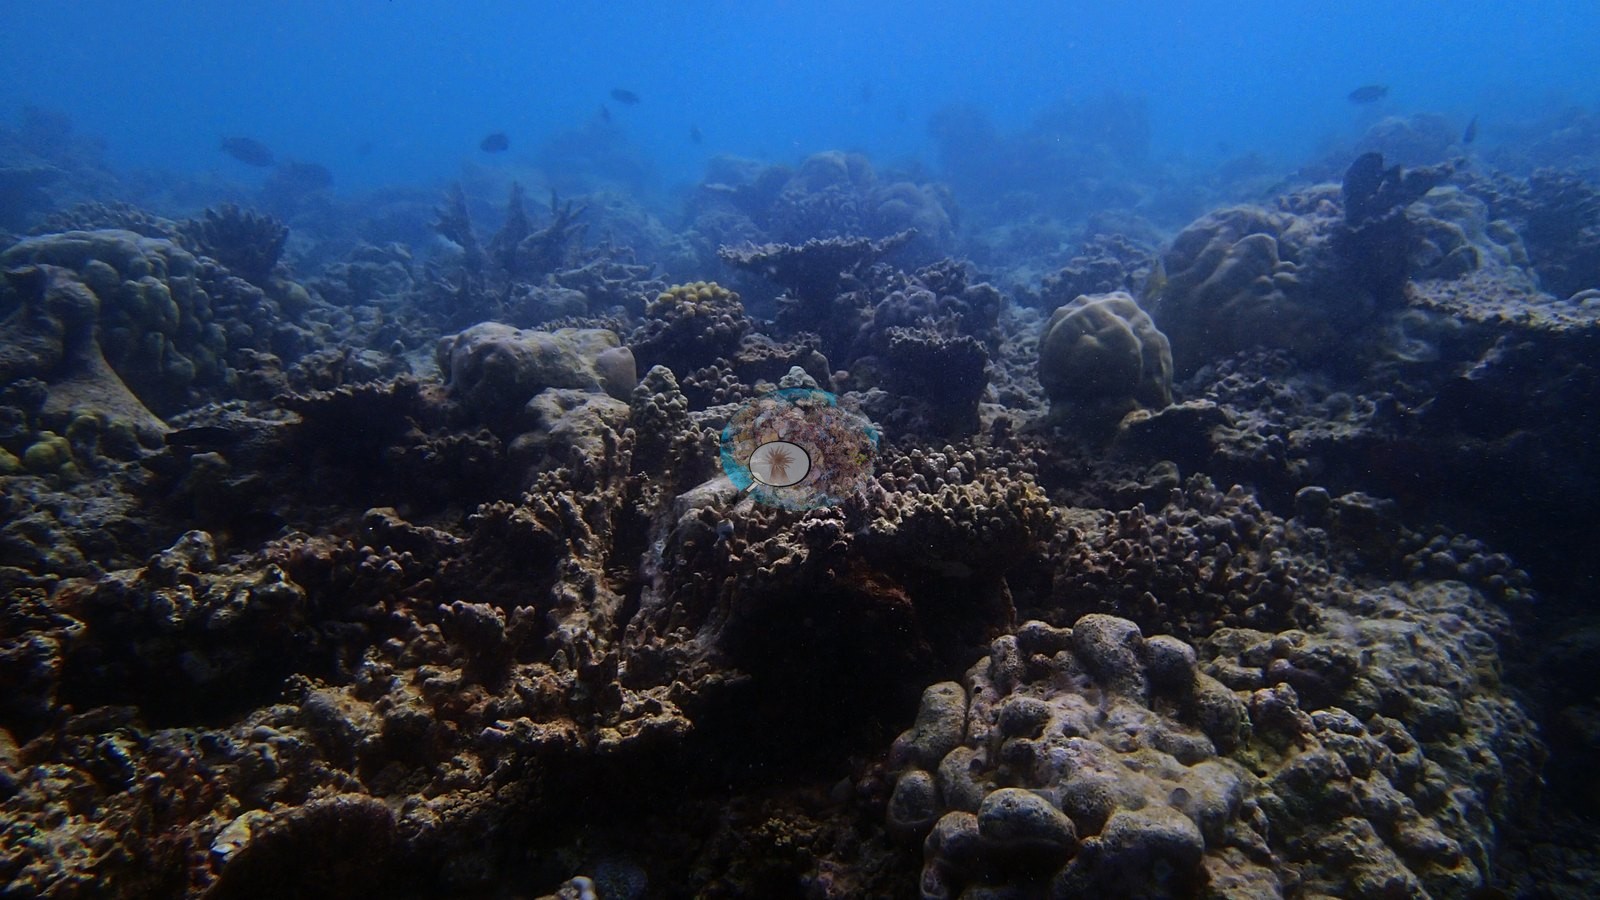
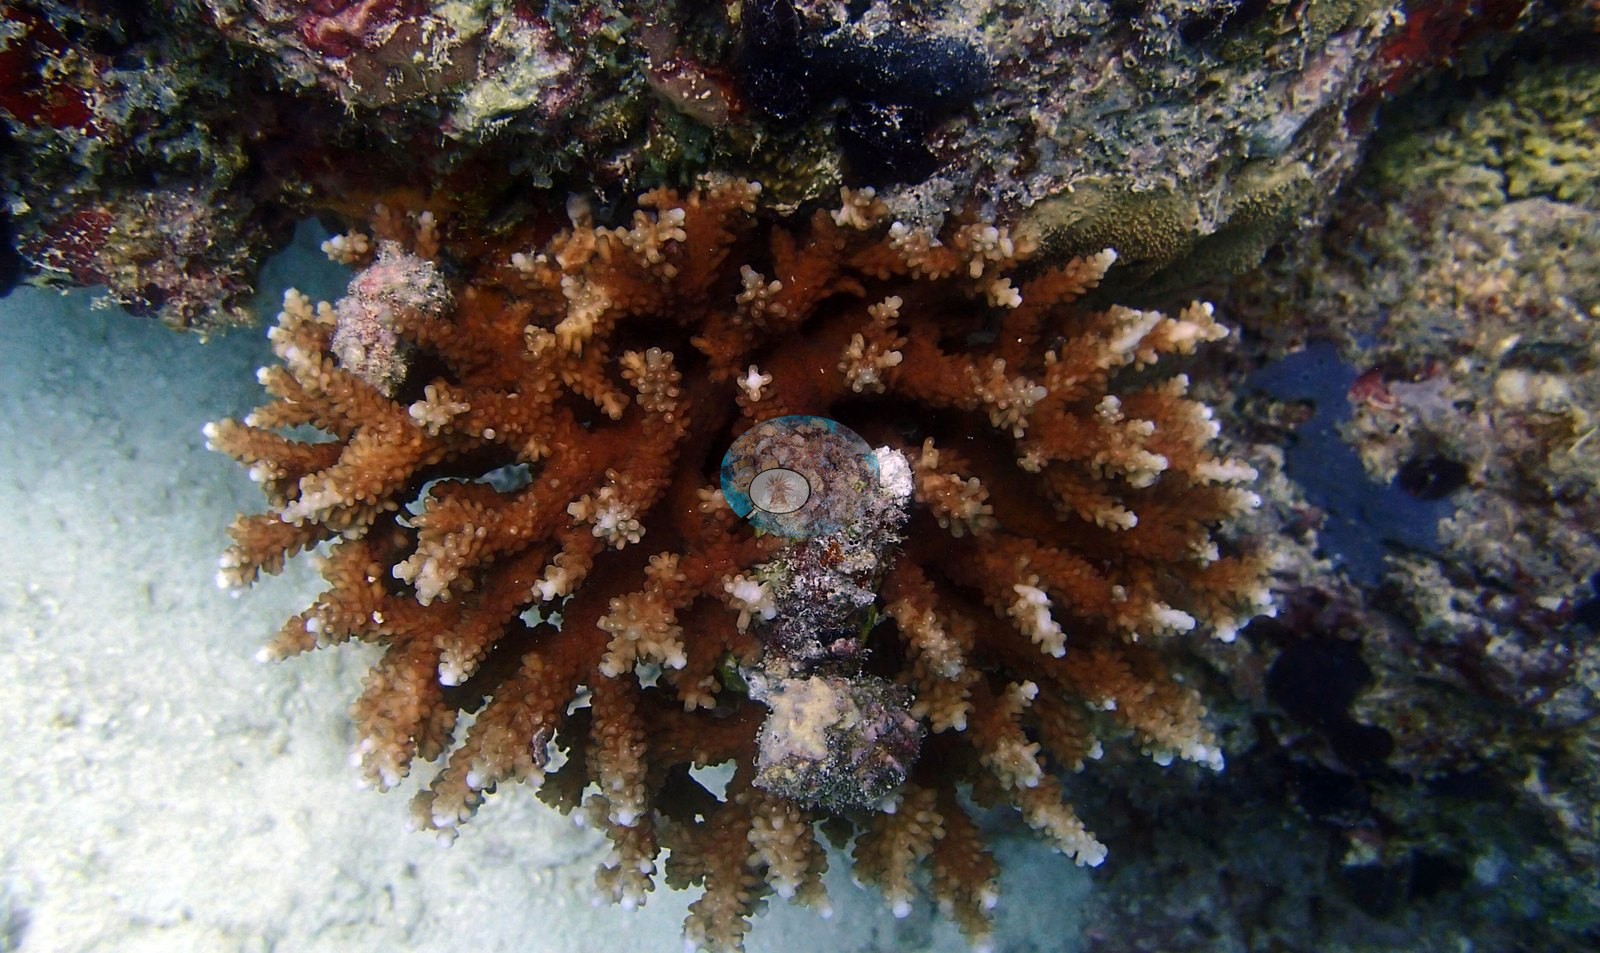
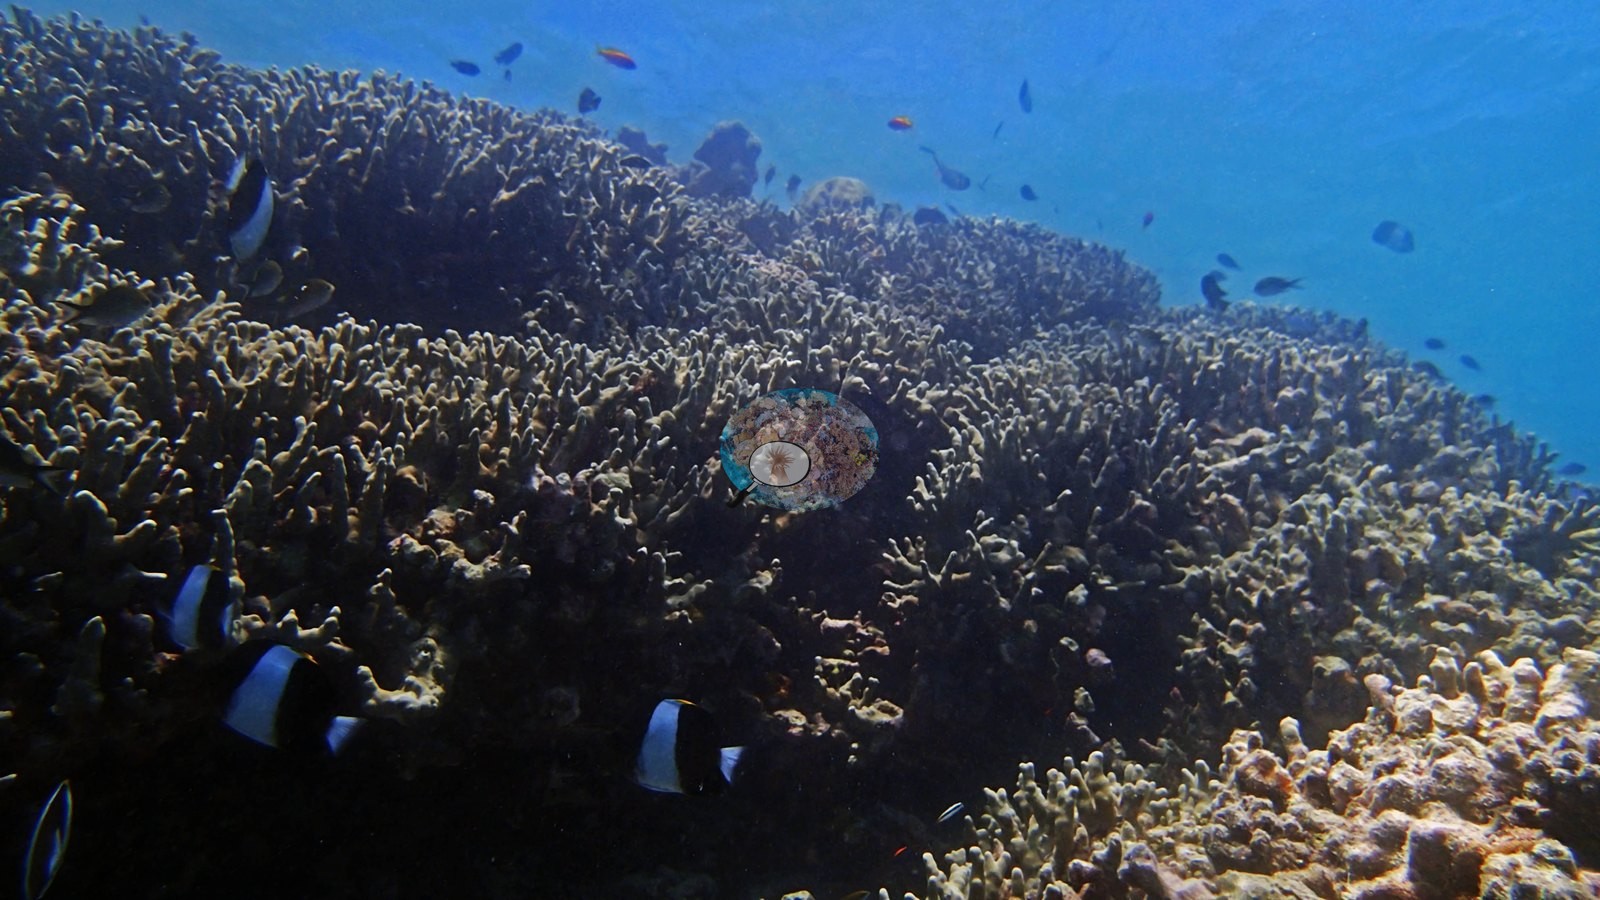
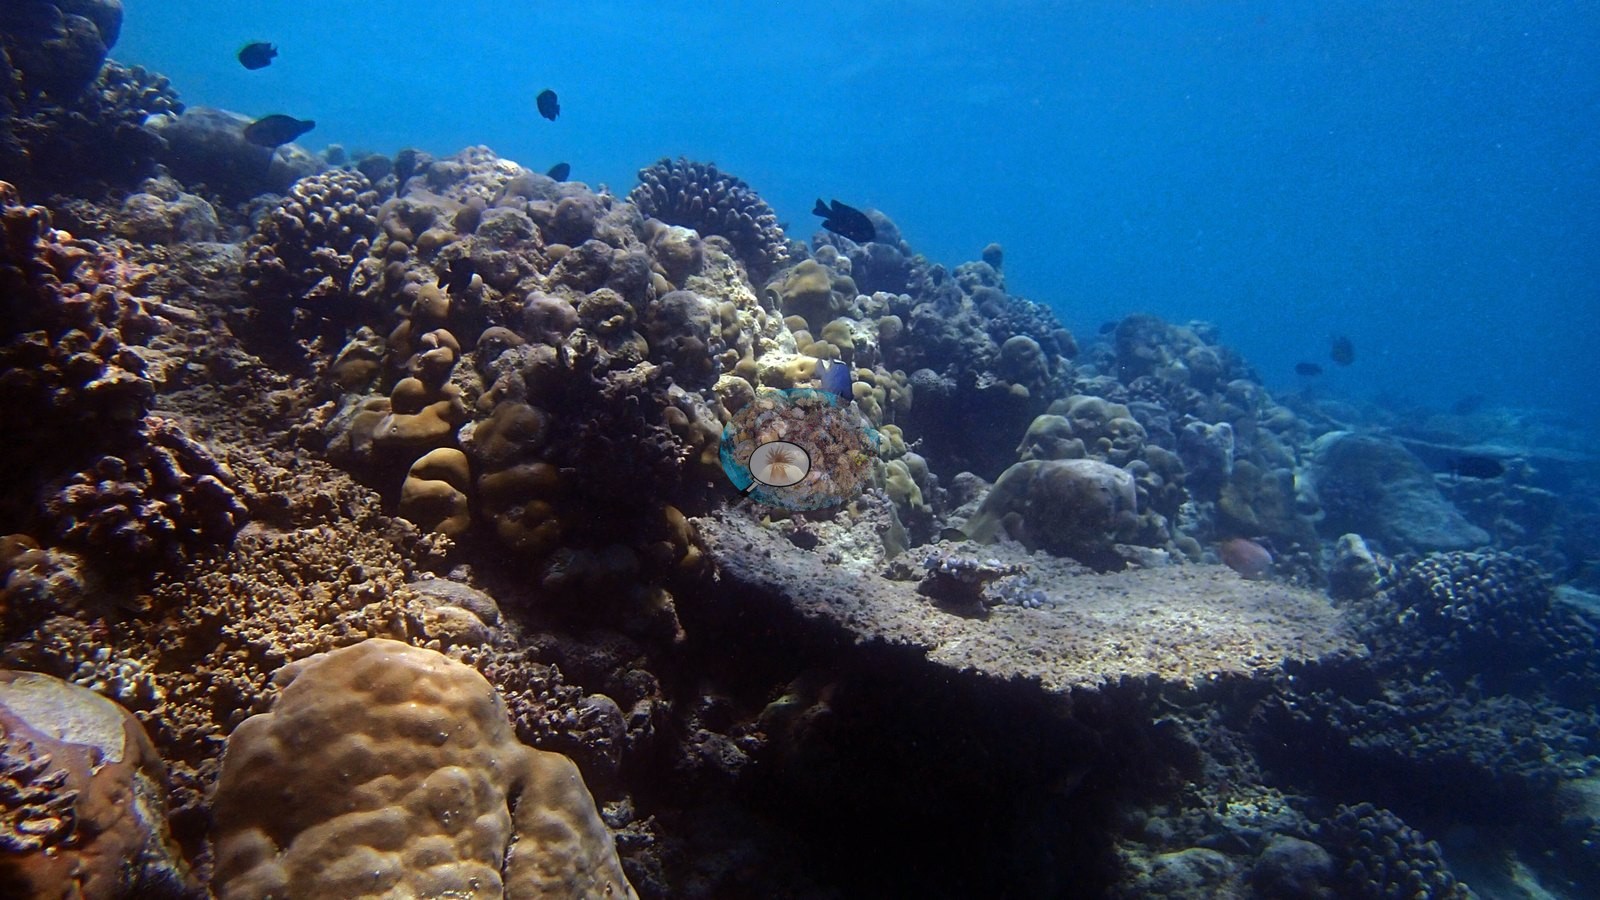
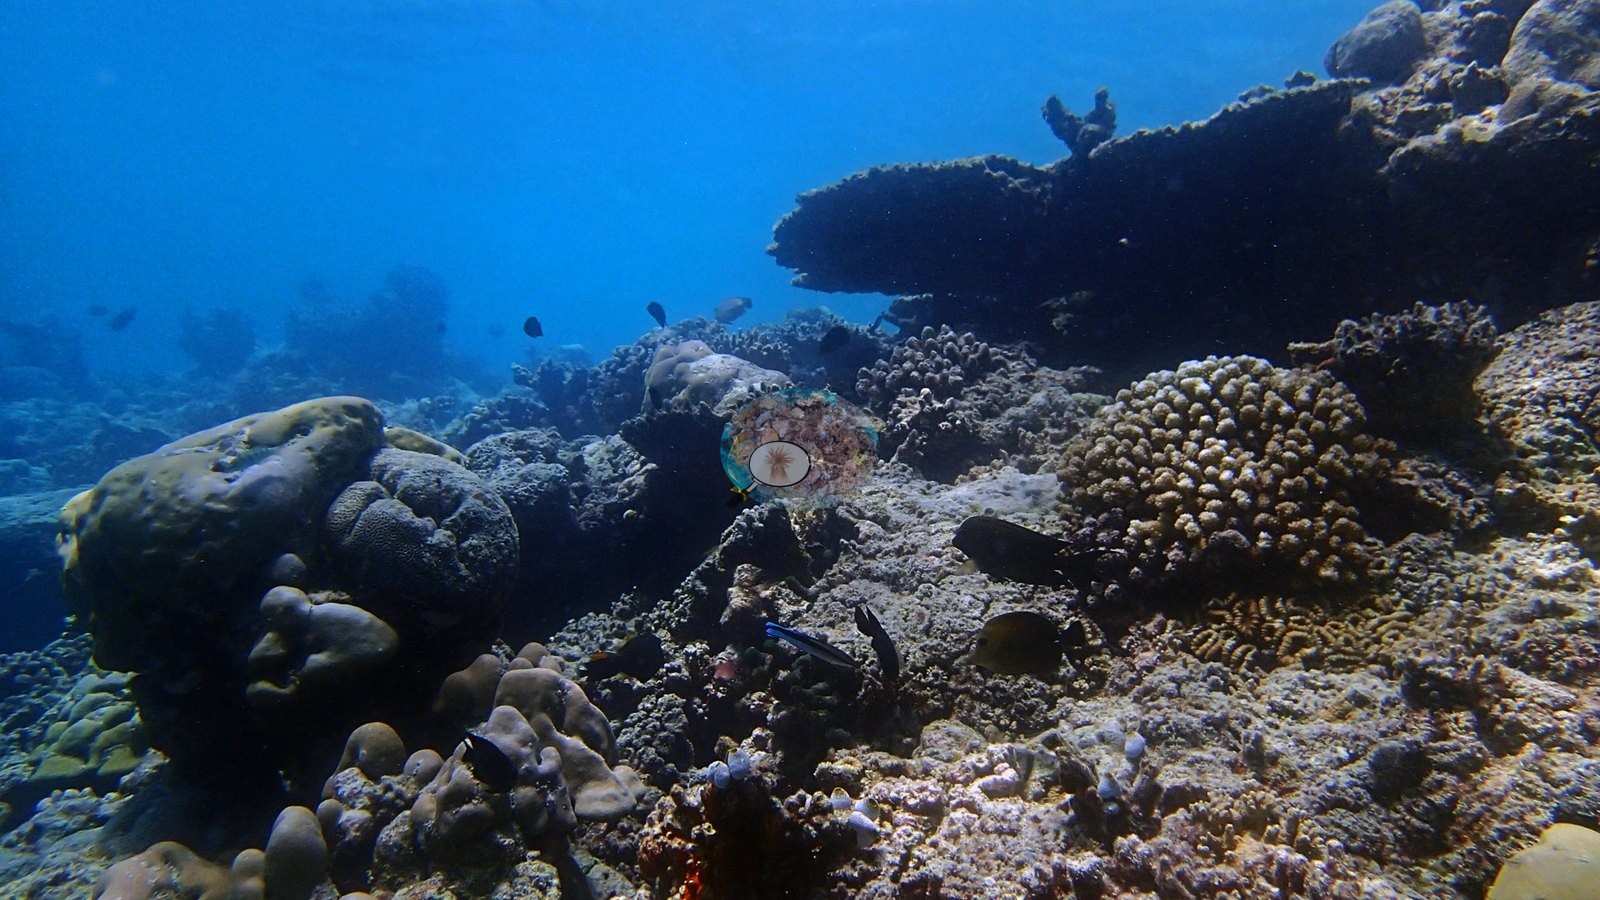
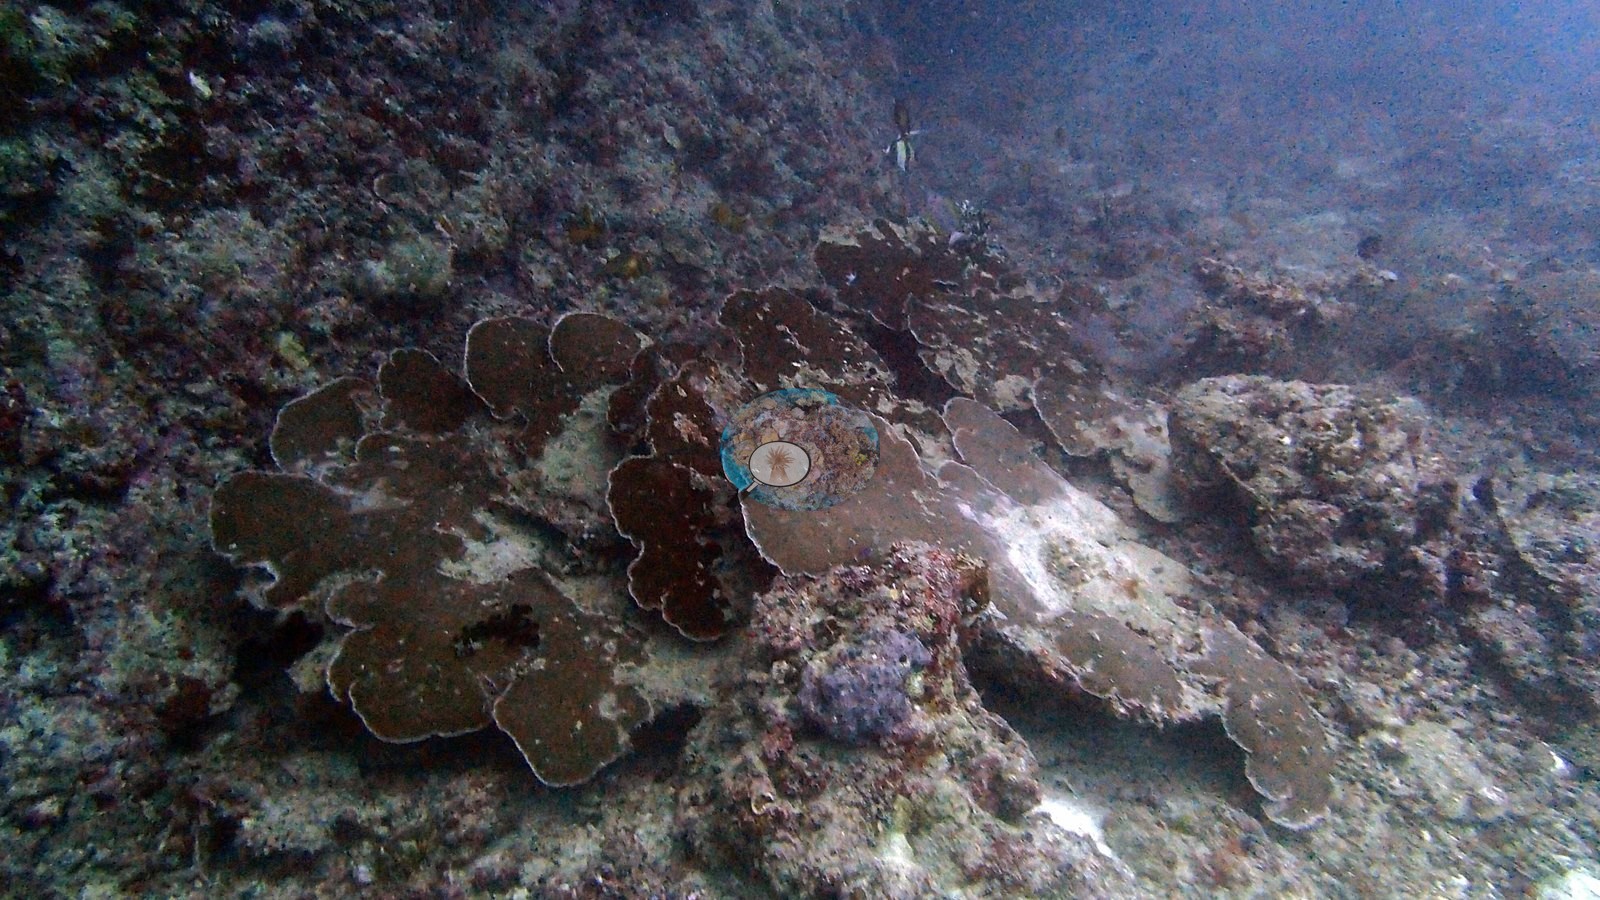
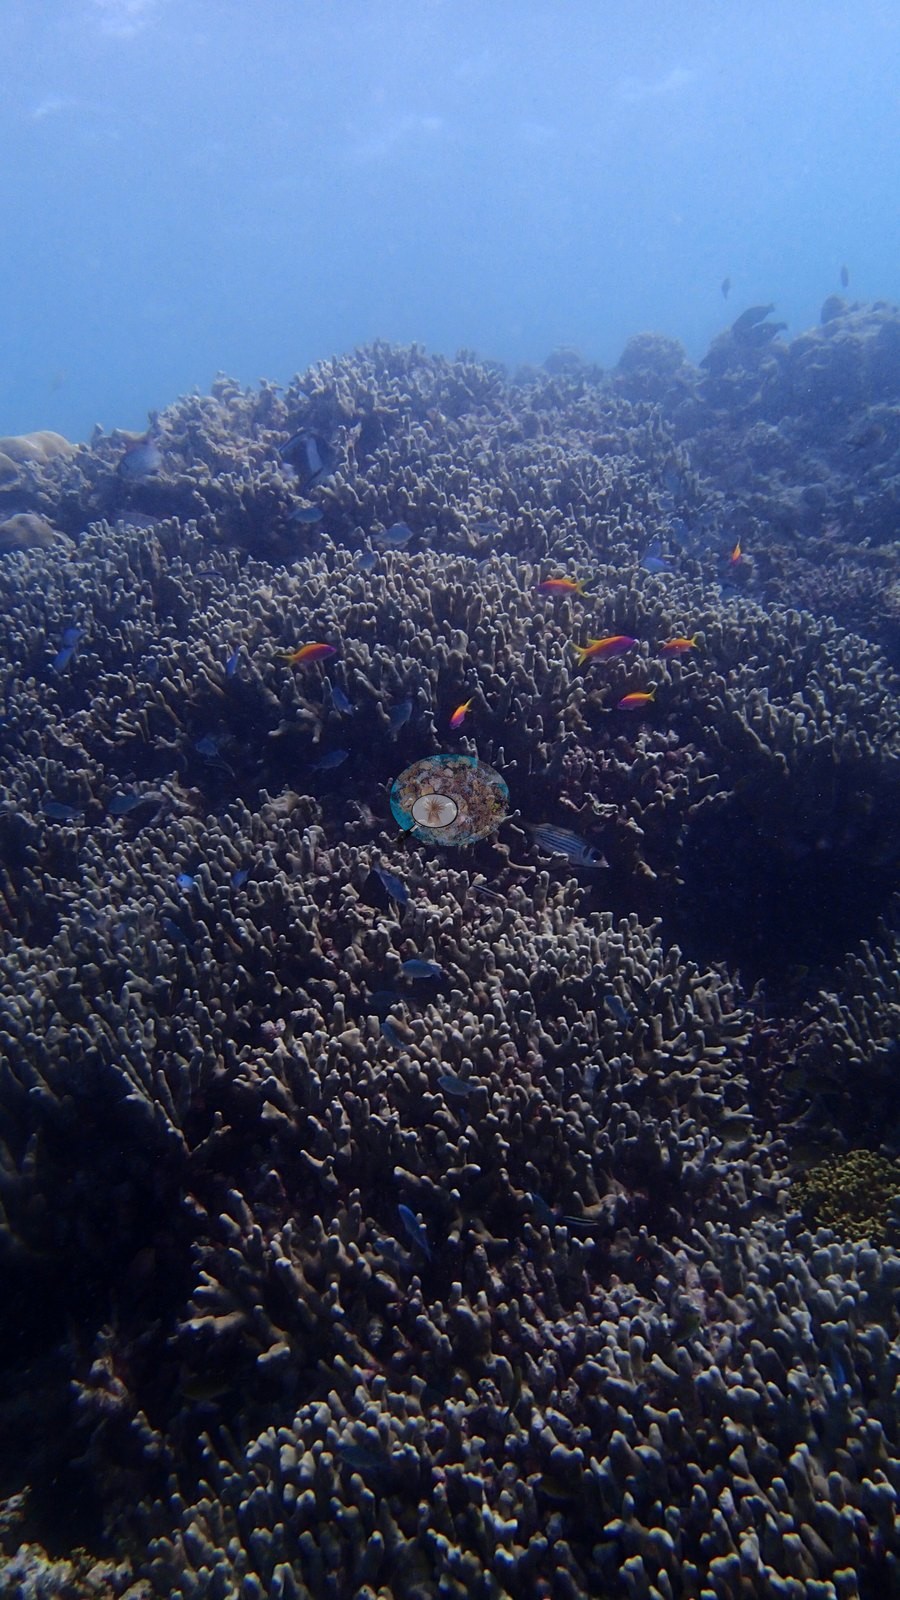
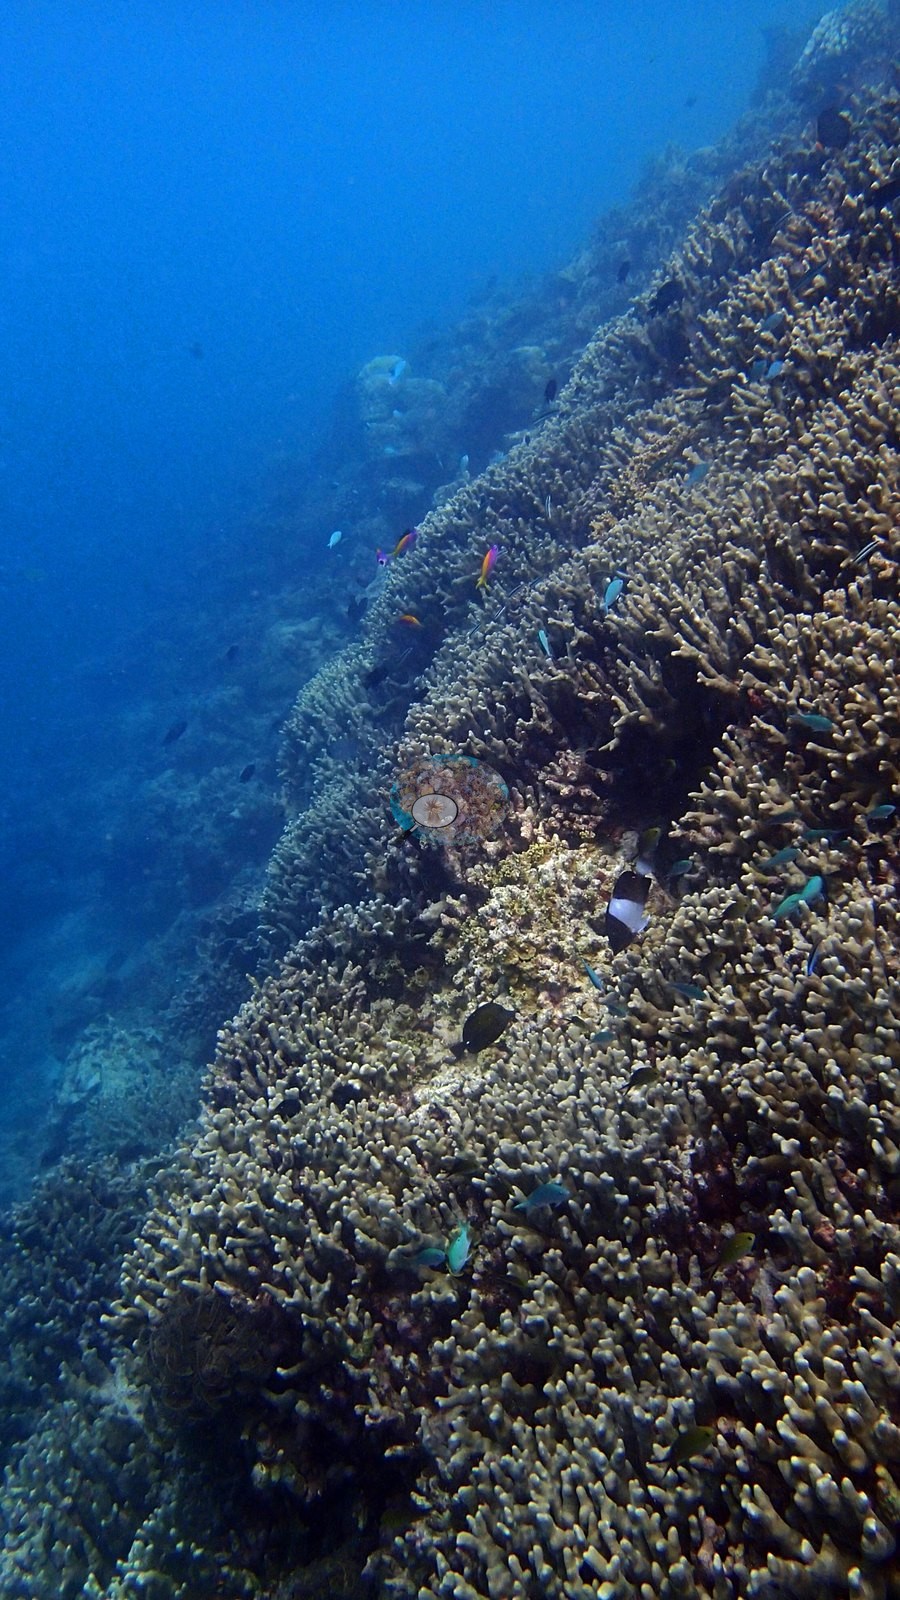
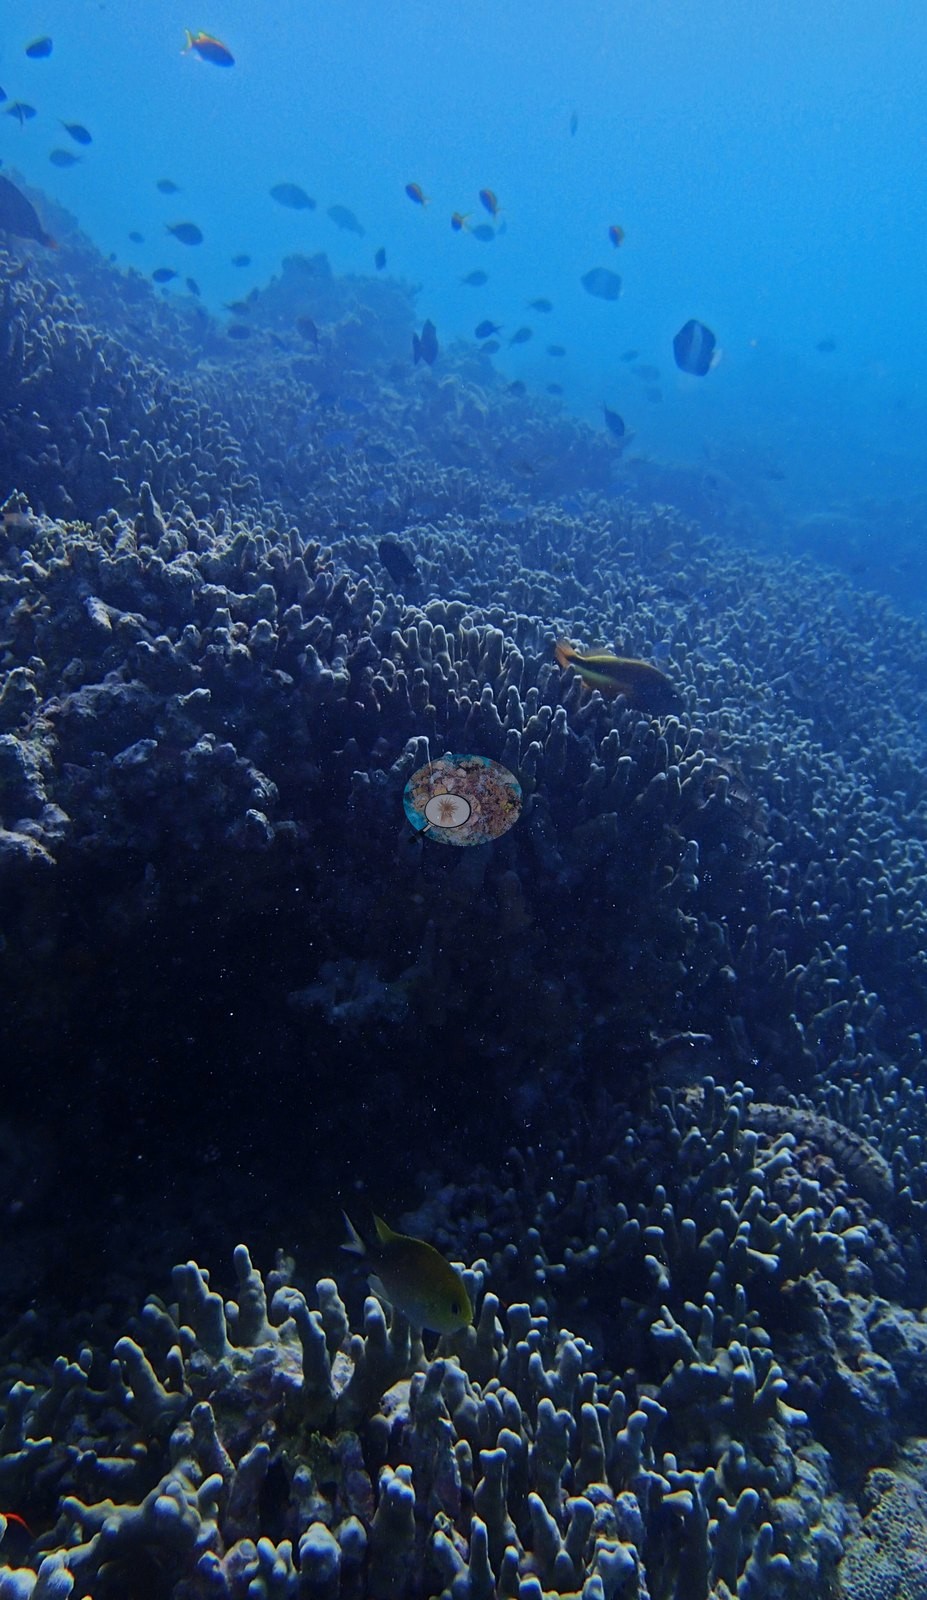
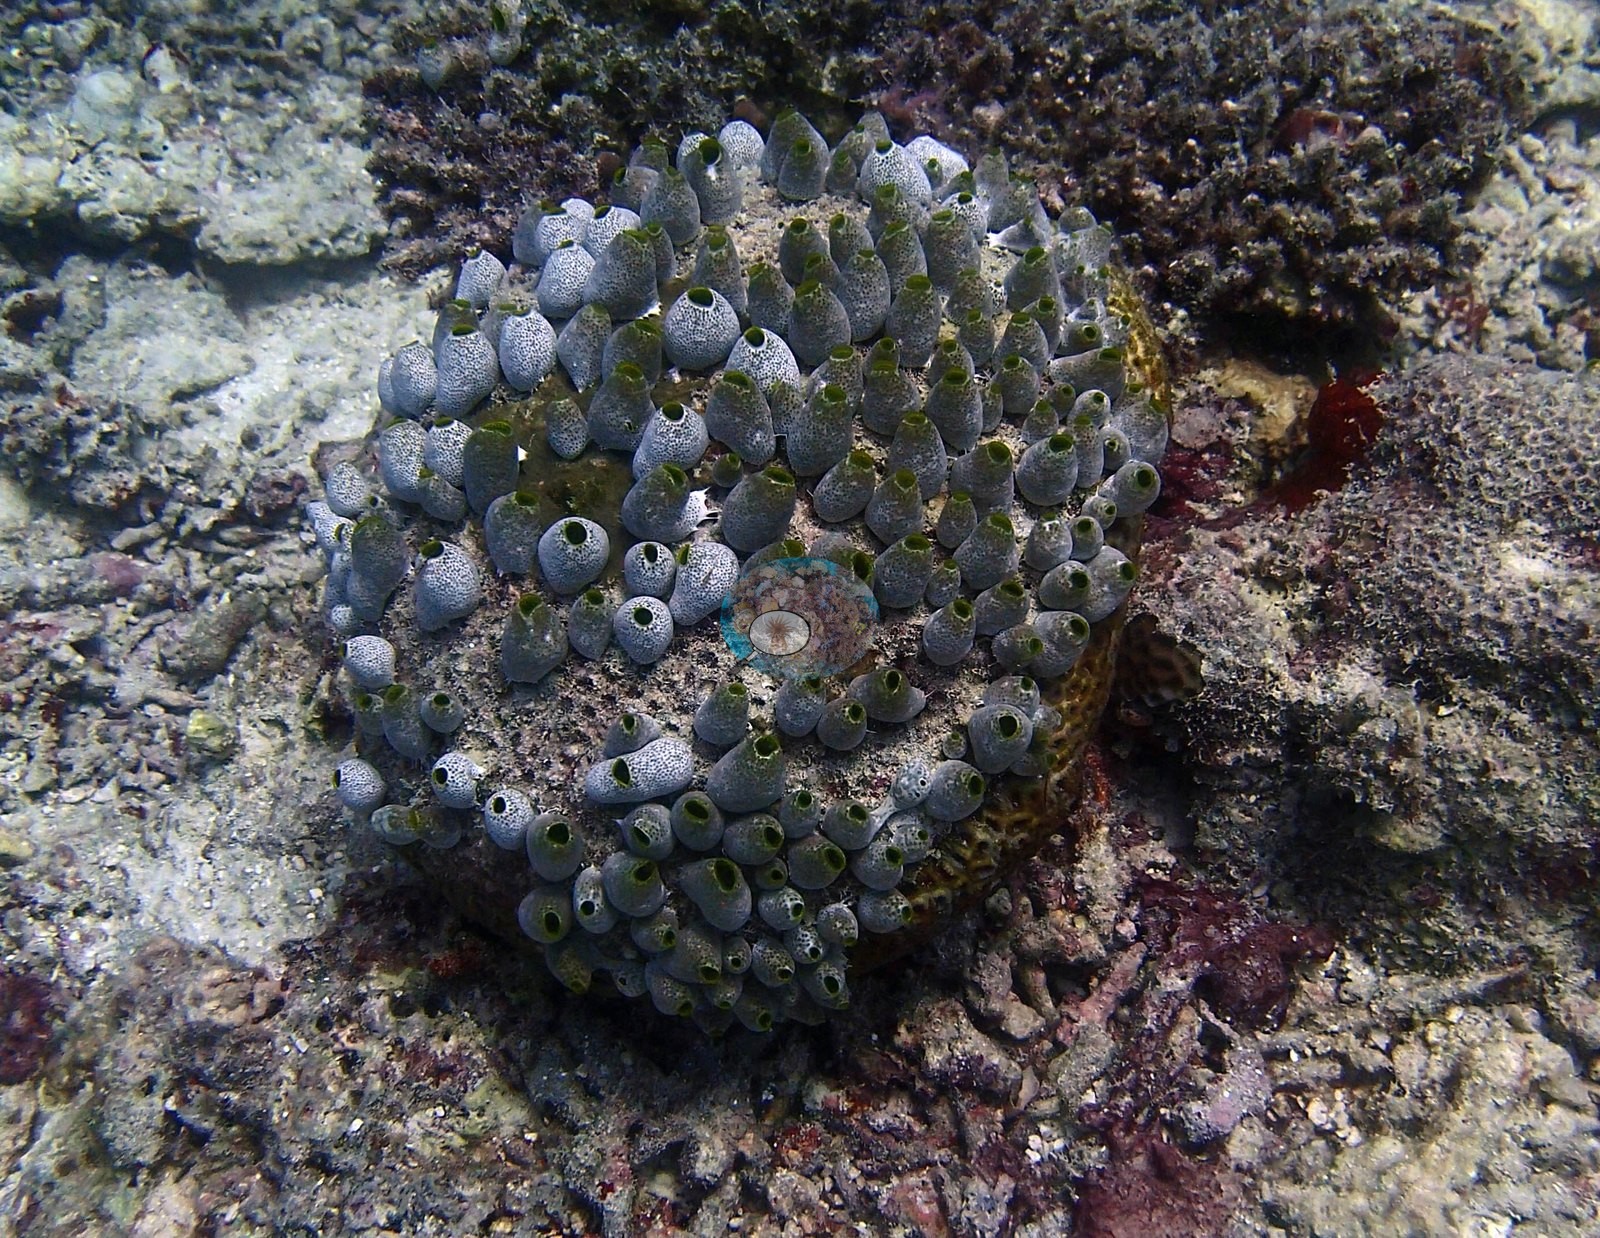
Georgia's Reef piles branching coral into honest-to-goodness thickets: bottlebrush and staghorn stands compatible with Acropora flickering with humbug damselfish, hillsides of living finger Porites, plate corals shingled like roof tiles, even a coral head studded with blue-gray urn tunicates and another draped in electric-blue sponge (e.g., Image 6, Image 7, Image 11, Image 12, Image 20, Image 21, Image 22, Image 24, Image 25).
Coral cover
Coral cover: 20% — photo-derived, and the two methods broadly agree (17% vs 23%). This site's figure is the mean of two independent computer vision passes over Anderson's own frames: a DINOv3 calibrated point classifier reads 16.7% and a CoralSCOP computer vision reads 23.1%, a spread of 6.4 percentage points. The map publishes the mean so sites can be sorted against one another, but the honest statement of what is known here is the 17–23% range: the two products have different denominators and should not be treated as one measurement. Anderson keeps an eye out for newer CV models and will refresh this CoralSCOP and DINOv3 figure once a more trustworthy option is available.
Stressors
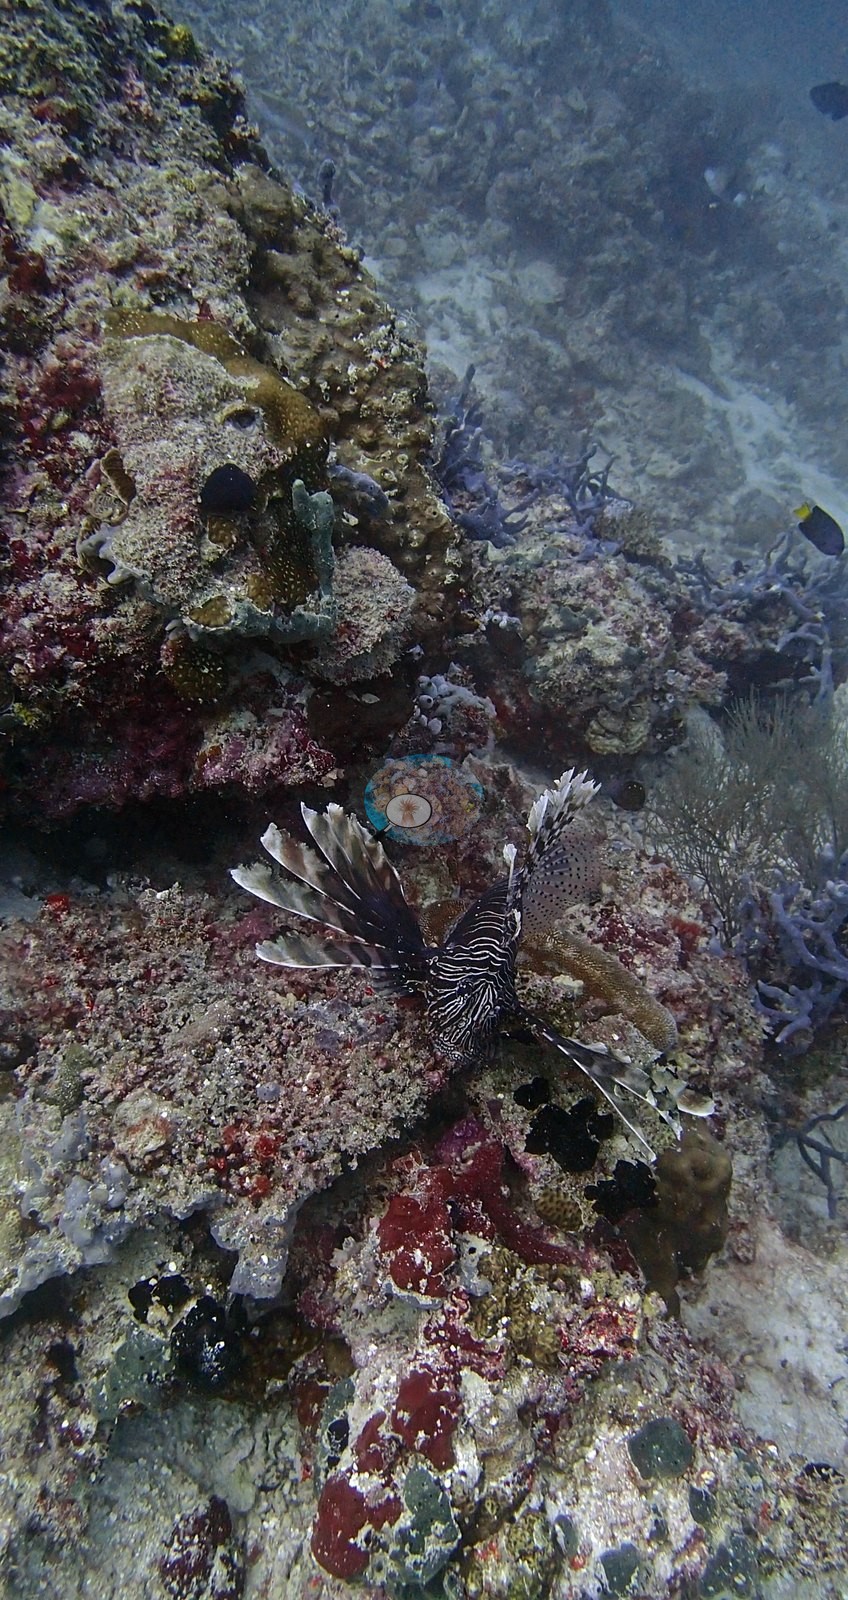
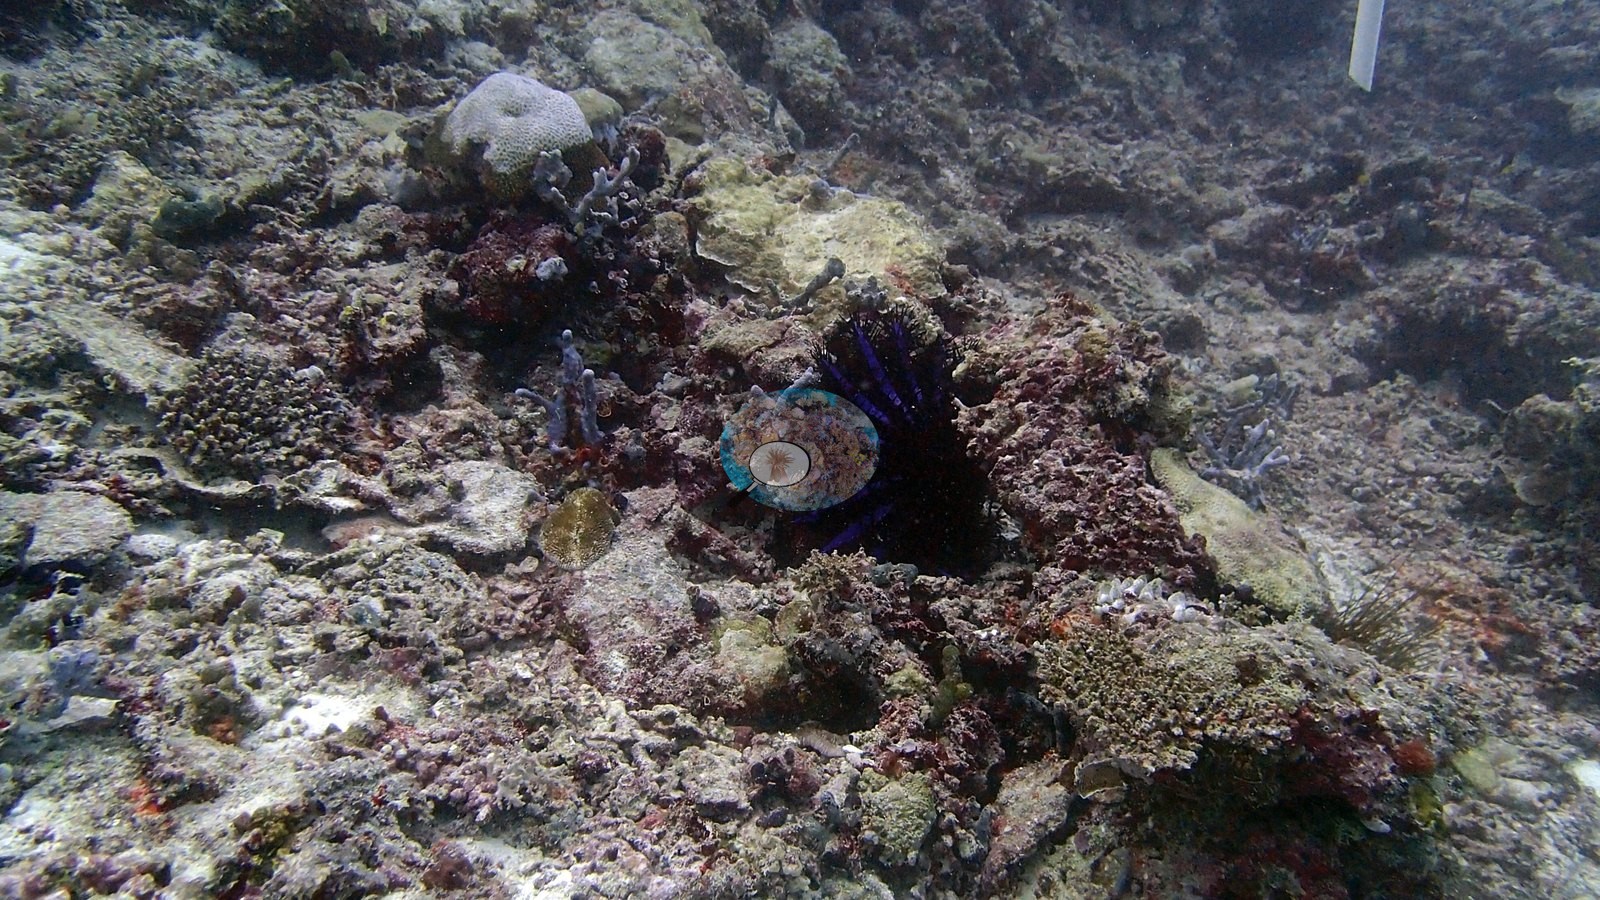
But paradise has a tax collector: crown-of-thorns seastars turned up repeatedly here, including one blue-spined "monster" caught beside the chalk-white scar of its last coral meal — a reminder that this reef's recovery from 2016 is being contested one colony at a time (e.g., Image 19).
Fish and other fauna
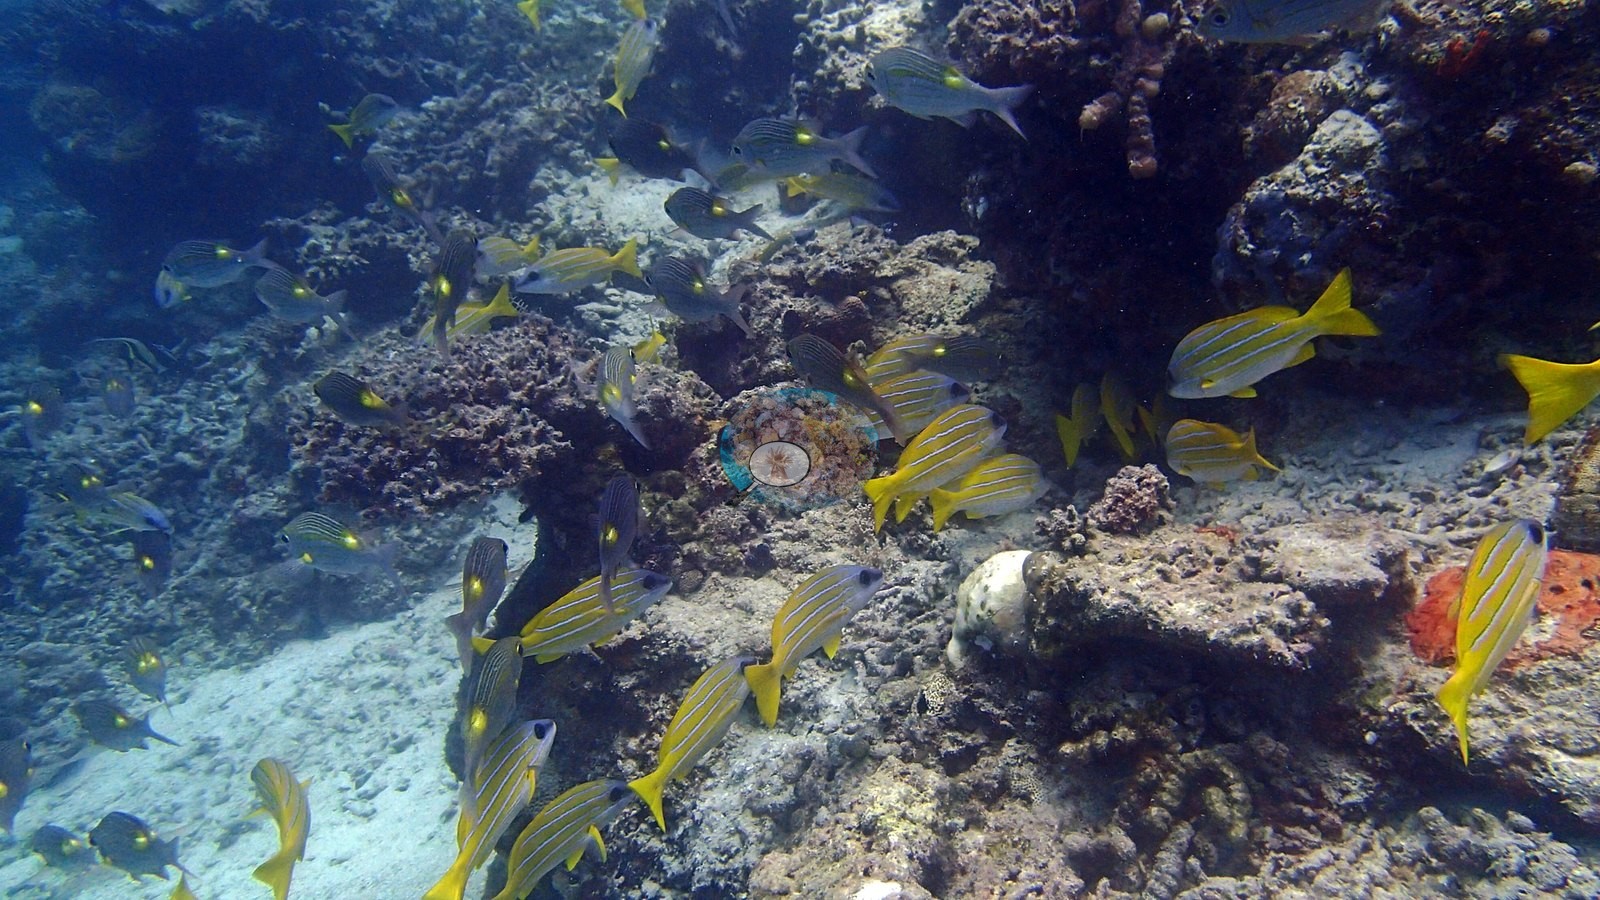
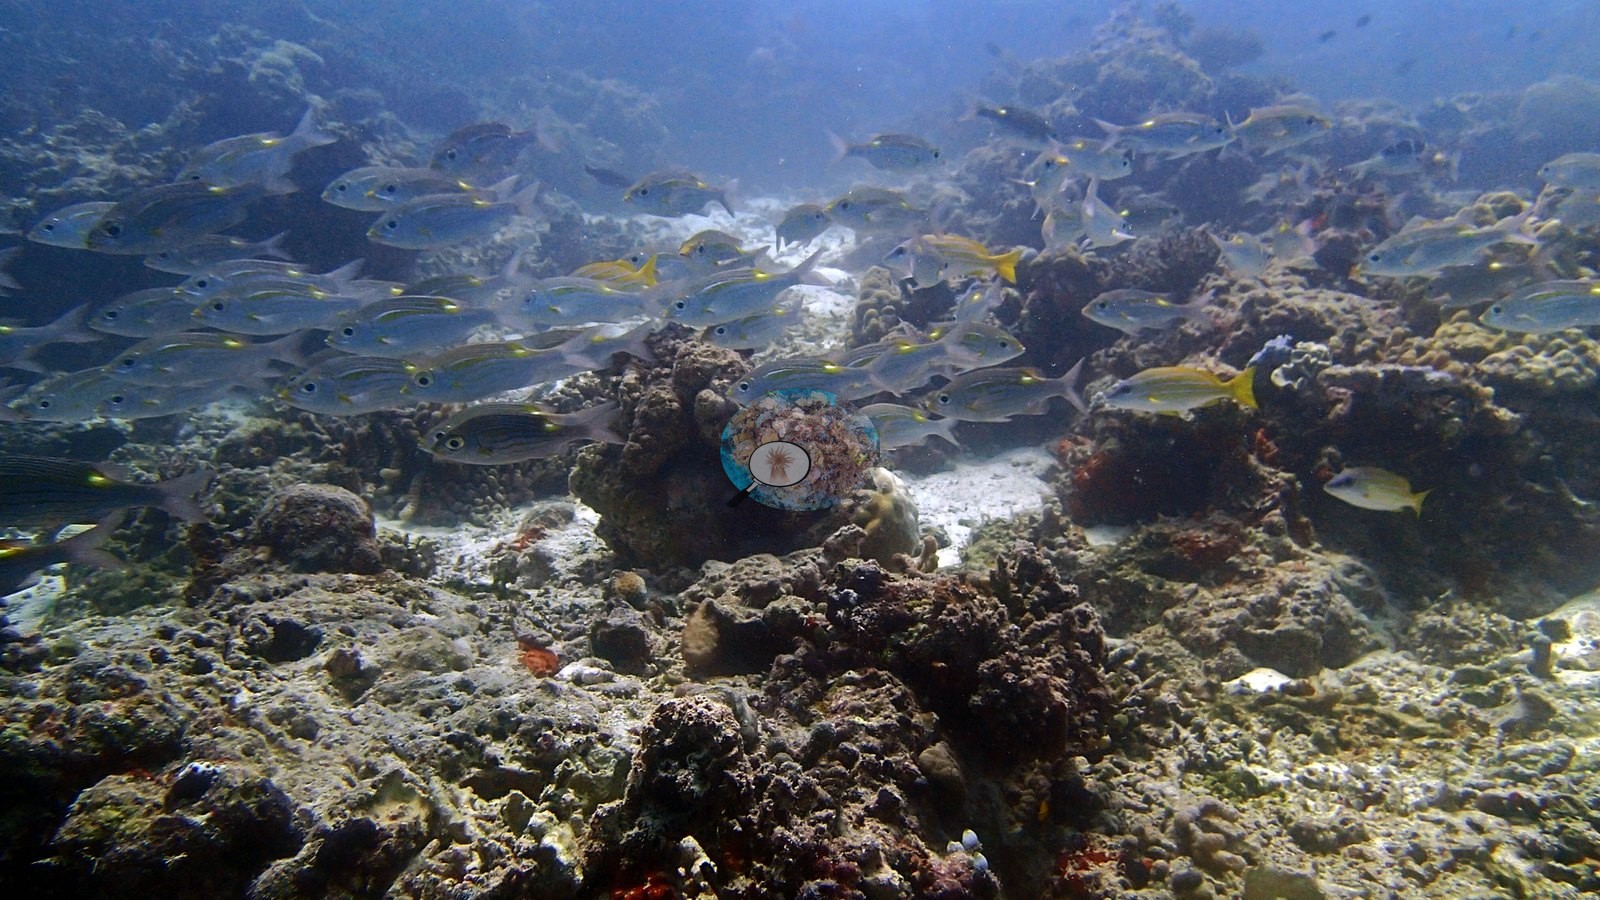
Yellow bluestripe-type snappers pour through the shallows in a solid golden river (e.g., Image 4, Image 5).
Comparisons with other data
No independent survey was made at this exact site; the nearest ones are listed in the table below.
CV model comparison
More info
As of September 2026 no computer-vision method estimates coral cover accurately on new images, so treat this as indicative rather than a measurement; it is revised as the methods improve.More info
The published figure is the mean of the two methods.| Method | Hard-coral cover (%) |
|---|---|
| In-house DINOv3 | 16.7 |
| CoralSCOP | 23.1 |
| Mean (± SD) | 19.9 ± 4.5 |
| Range | 16.7–23.1 |
Mean ± SD and range are across the computer-vision methods shown.
Independent surveys nearby
 Dr. Coral (CRD)
Within 5 km, 3 independent survey stations recorded hard coral cover in 9 surveys between 2010 and 2016. Of the 1 station surveyed in more than one year, 1 increased between their first and latest surveys. The longest record, Baros House Reef (Reef Check, 2.61 km away), went from 38% in 2010 to 43% in 2016. The most recent nearby survey is from 2016, so these values predate recent heat stress. This site's own estimate (20%) sits 10.1 points below the range of these surveys (30–43%); the methods differ, so the comparison is context, not a like-for-like test.
Collected by other programs using different methods (Reef Check uses point-intercept transects), so these are context for the figures above, not a like-for-like comparison. Where a station was surveyed more than once the range is shown. Station names are not dive-site names.
| Agency | Site / location | Date | Hard coral cover (%) | Distance | Link |
|---|---|---|---|---|---|
| Reef Check | Baros House Reef | 2010–2016 | 30–43% (6 surveys) | 2.61 km | — |
| Reef Check | Baros Housereef | 2012 | 38% | 3.40 km | — |
| Reef Check | Banyan Tree House Reef | 2013 | 33% (2 surveys) | 2.69 km | — |
Data & links
All images from Coral Reef Diagnostics. Data are from Coral Reef Diagnostics and the organizations named in the data-sources table above.
© Coral Reef Diagnostics.