
Maldives - Vaadhoo Caves

Part of the regional summaries: Maldives - Central (Male Atolls / Ari / Vaavu) and Maldives
More info
Maldives (NOAA CRW virtual station) · Maldives ecoregion mean=2.9°C-heating weeksA wall dive built around shadowed overhangs fringed in pale lavender soft corals, more about topography and current-fed fish life than coral cover, which computer vision puts around 11%.
Nine independent survey stations shown with the program’s logo — click one to see how far it is from this site.
11 of these 22 photographs are shown beside the text that discusses them under "Site description" below.
Site description
Setting
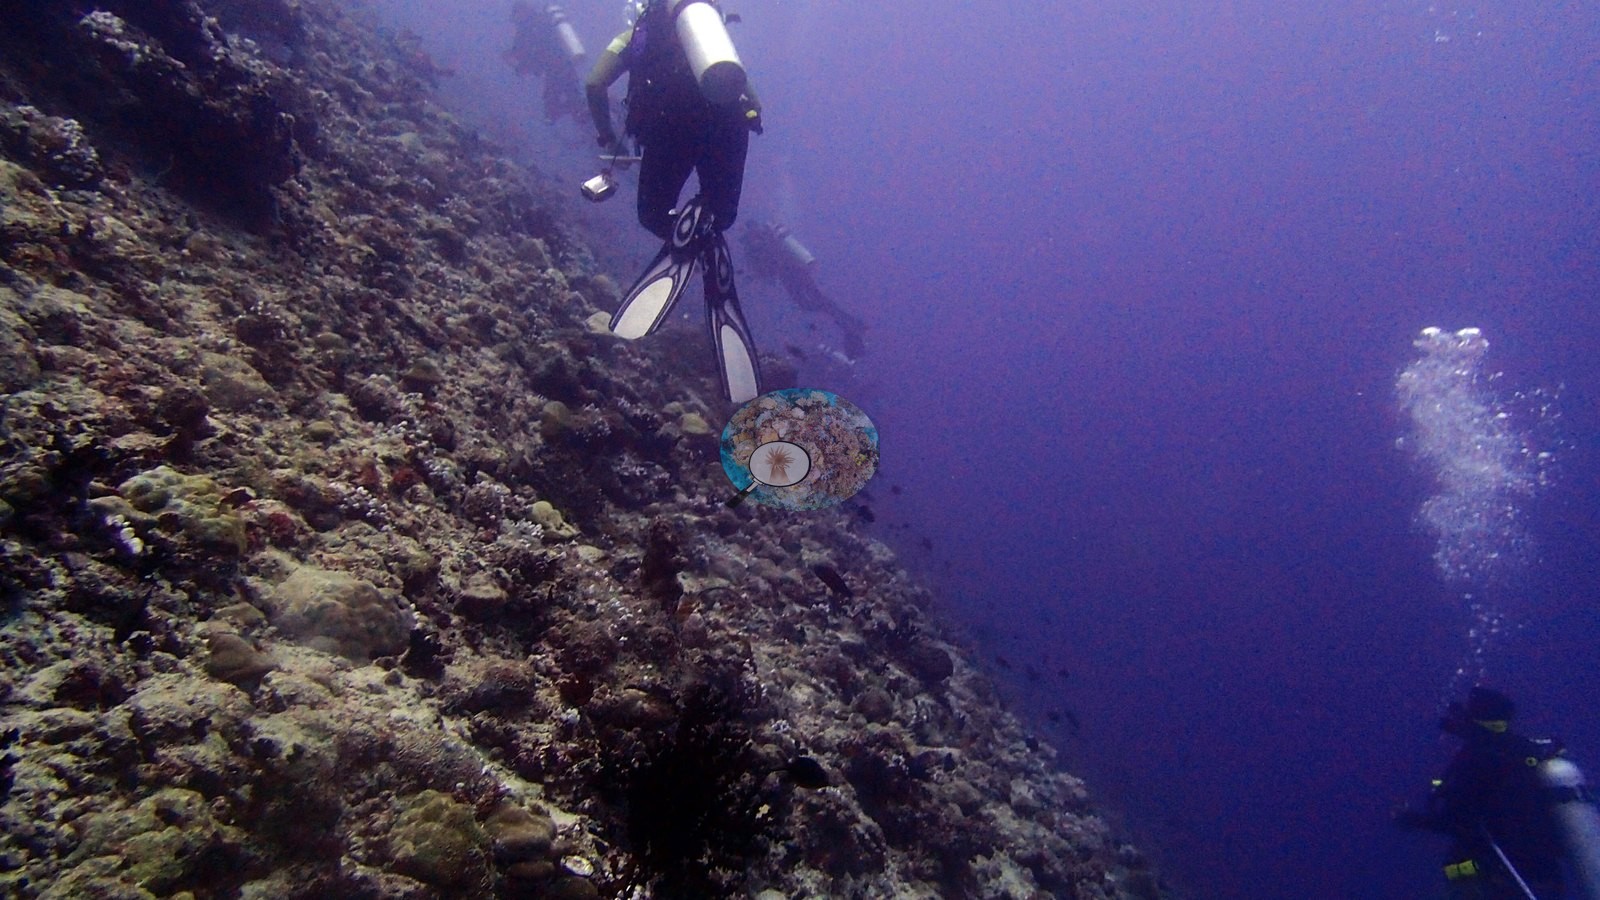
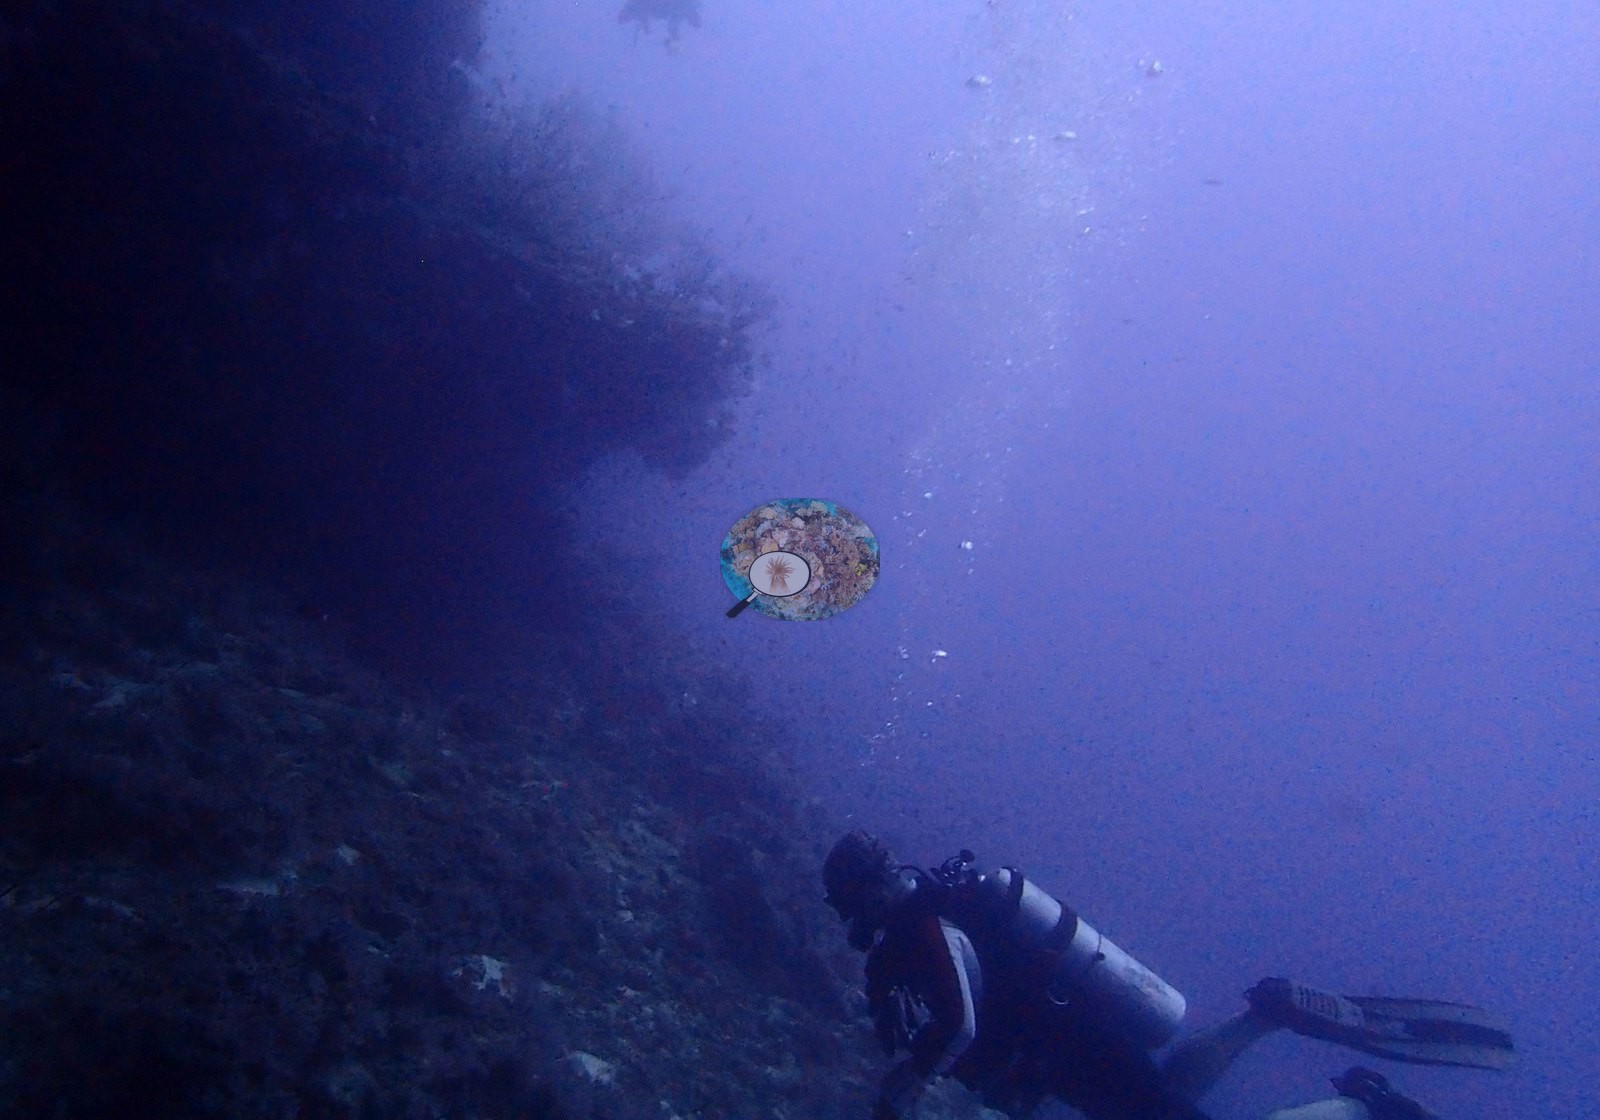
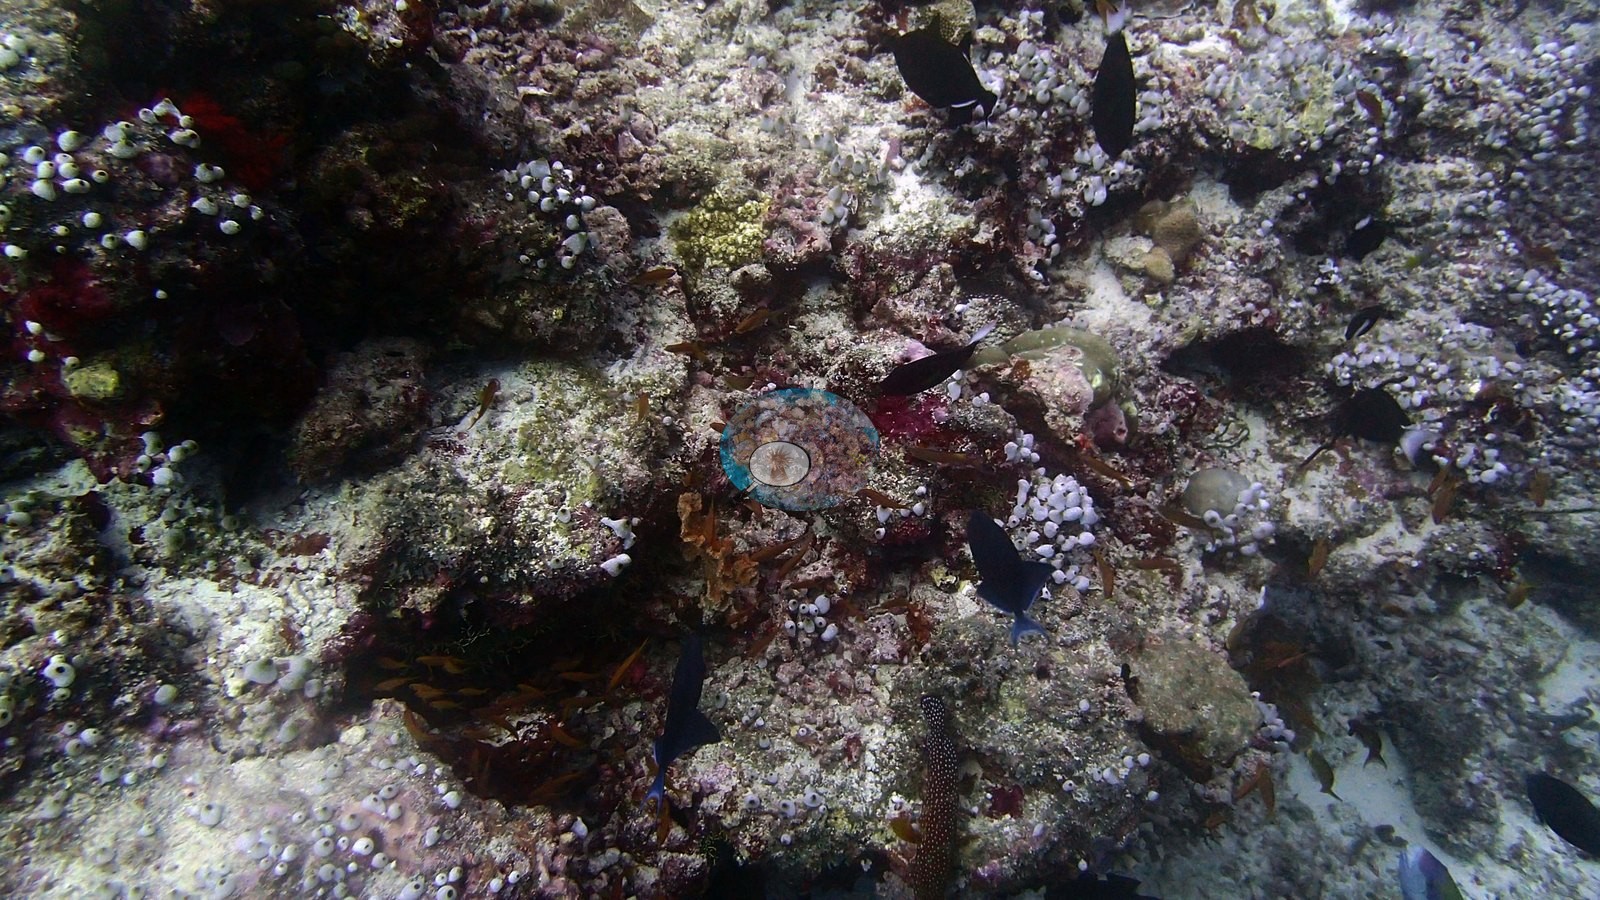
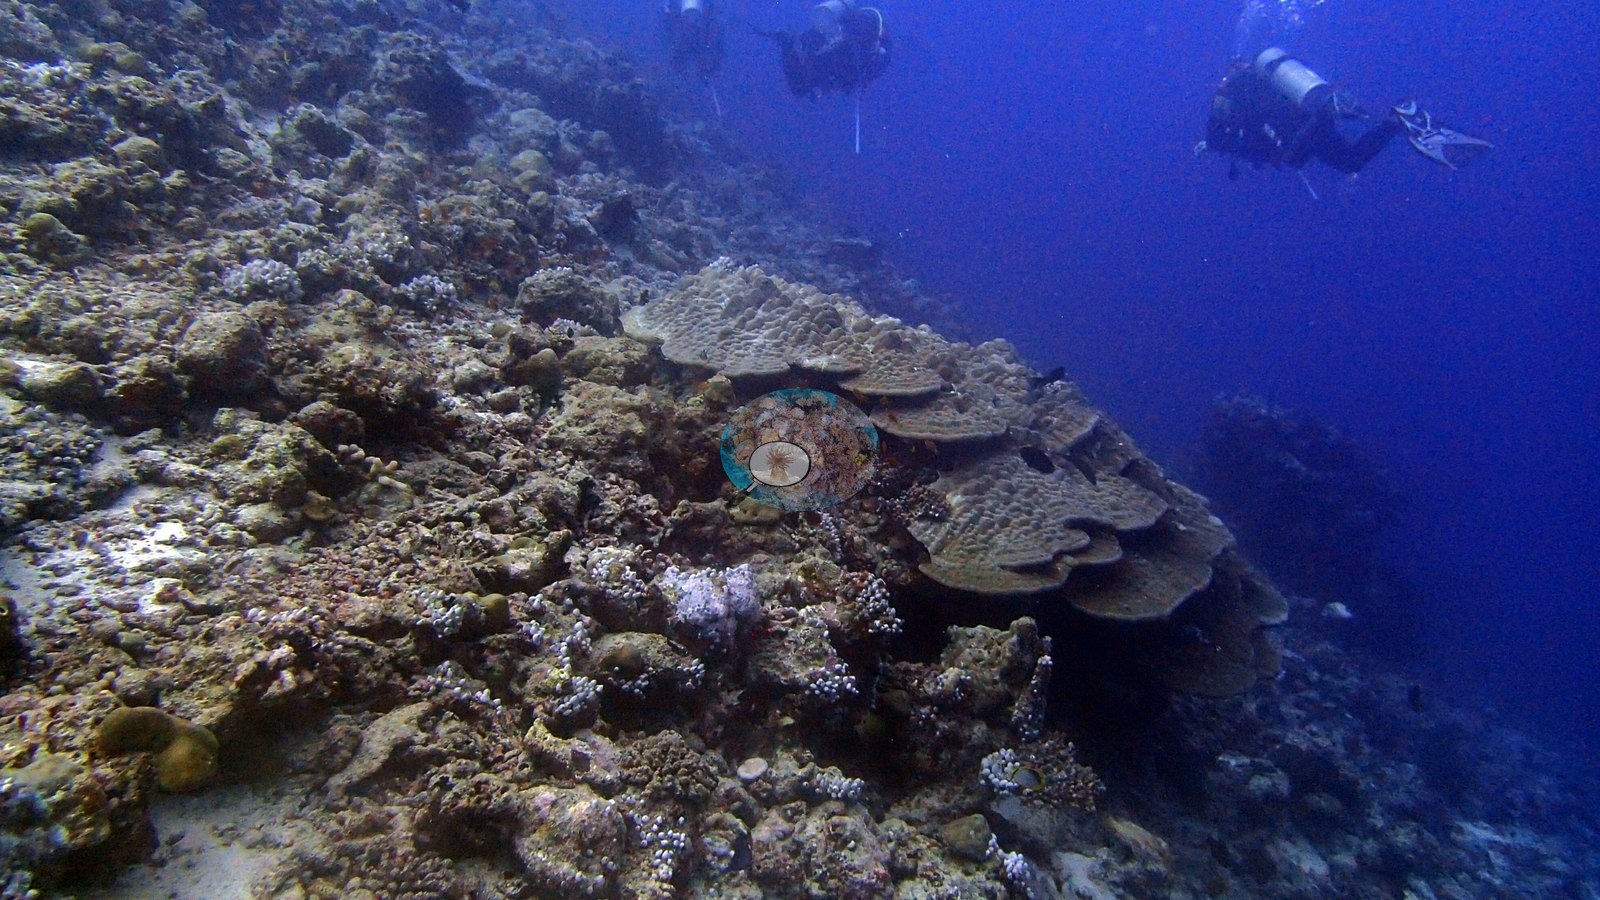
An early-morning drop onto a steep wall notched with deep, shadowed overhangs — the "caves" — each one trimmed along its lip with a frilly fringe of pale lavender soft corals that seem to glow against the dark (e.g., Image 2, Image 5).
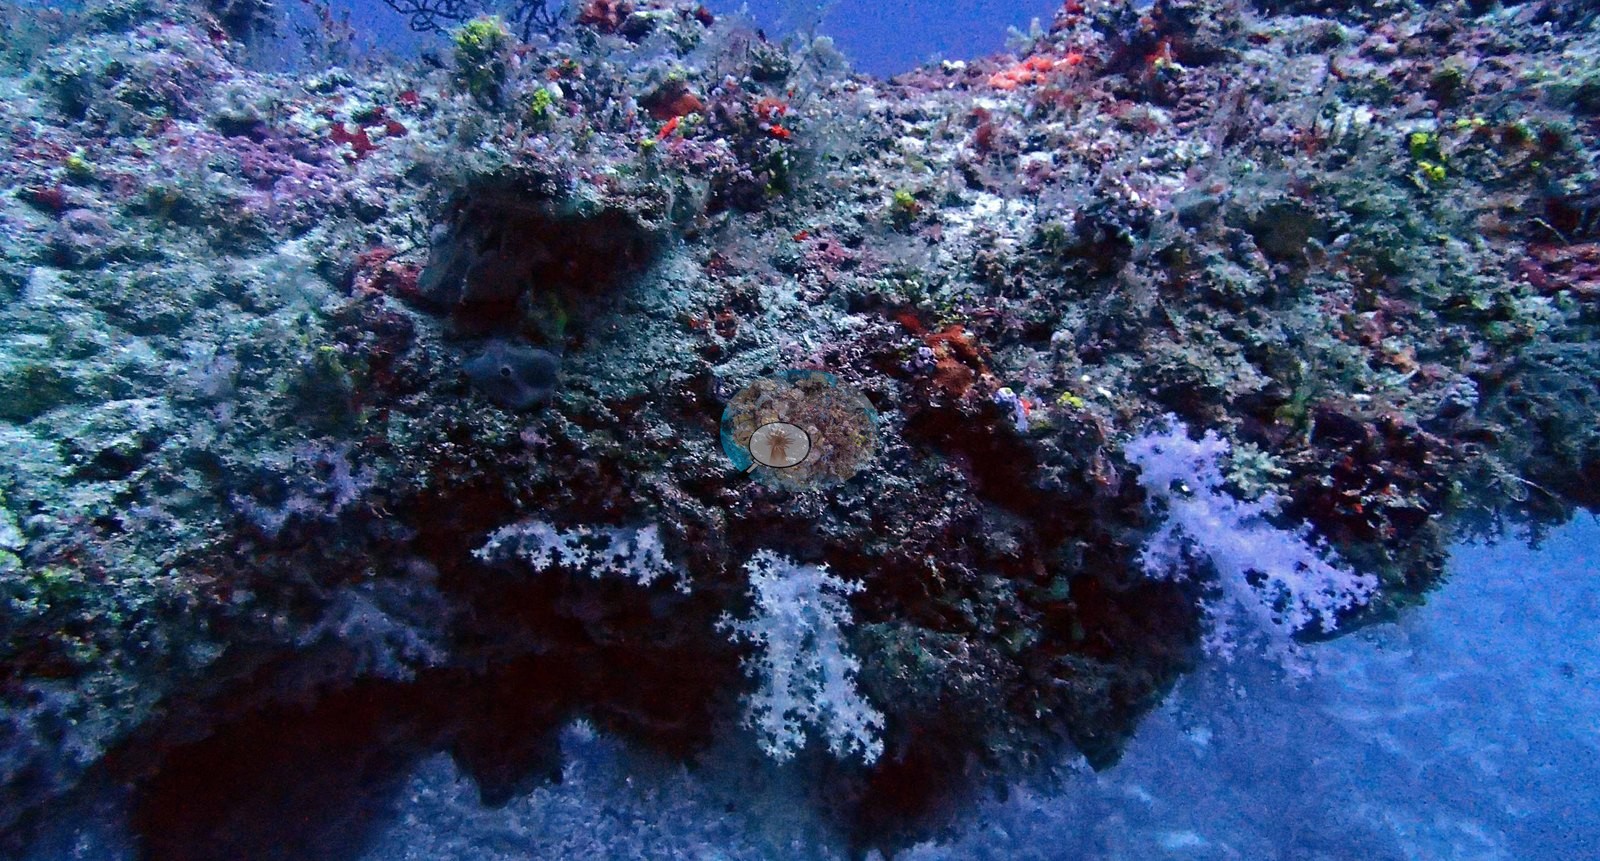
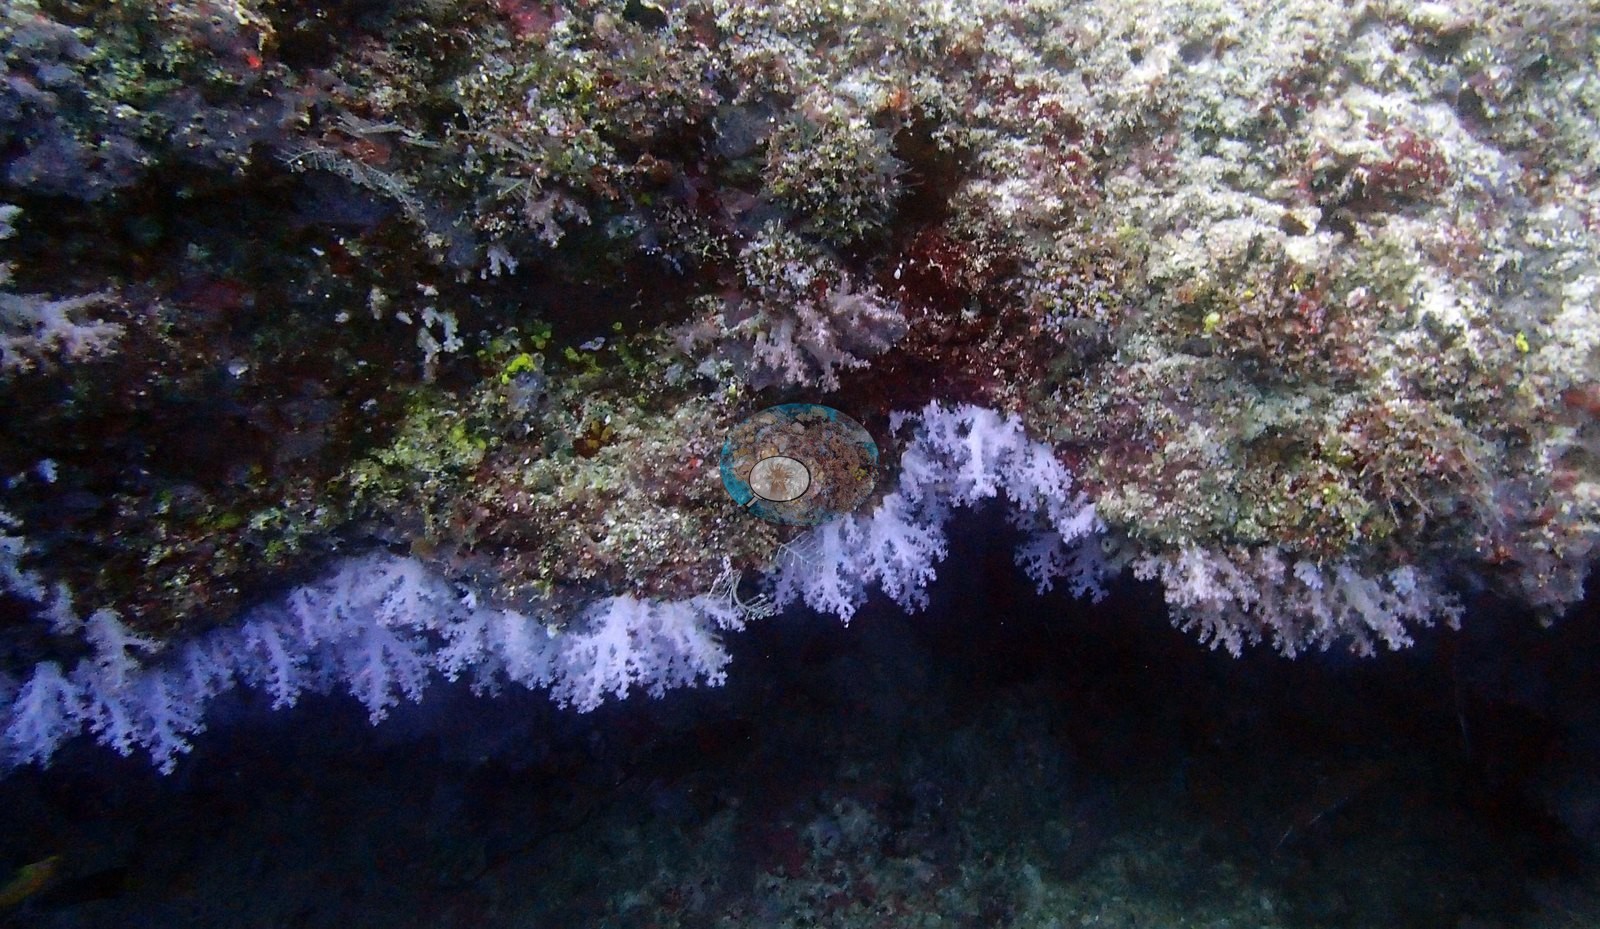
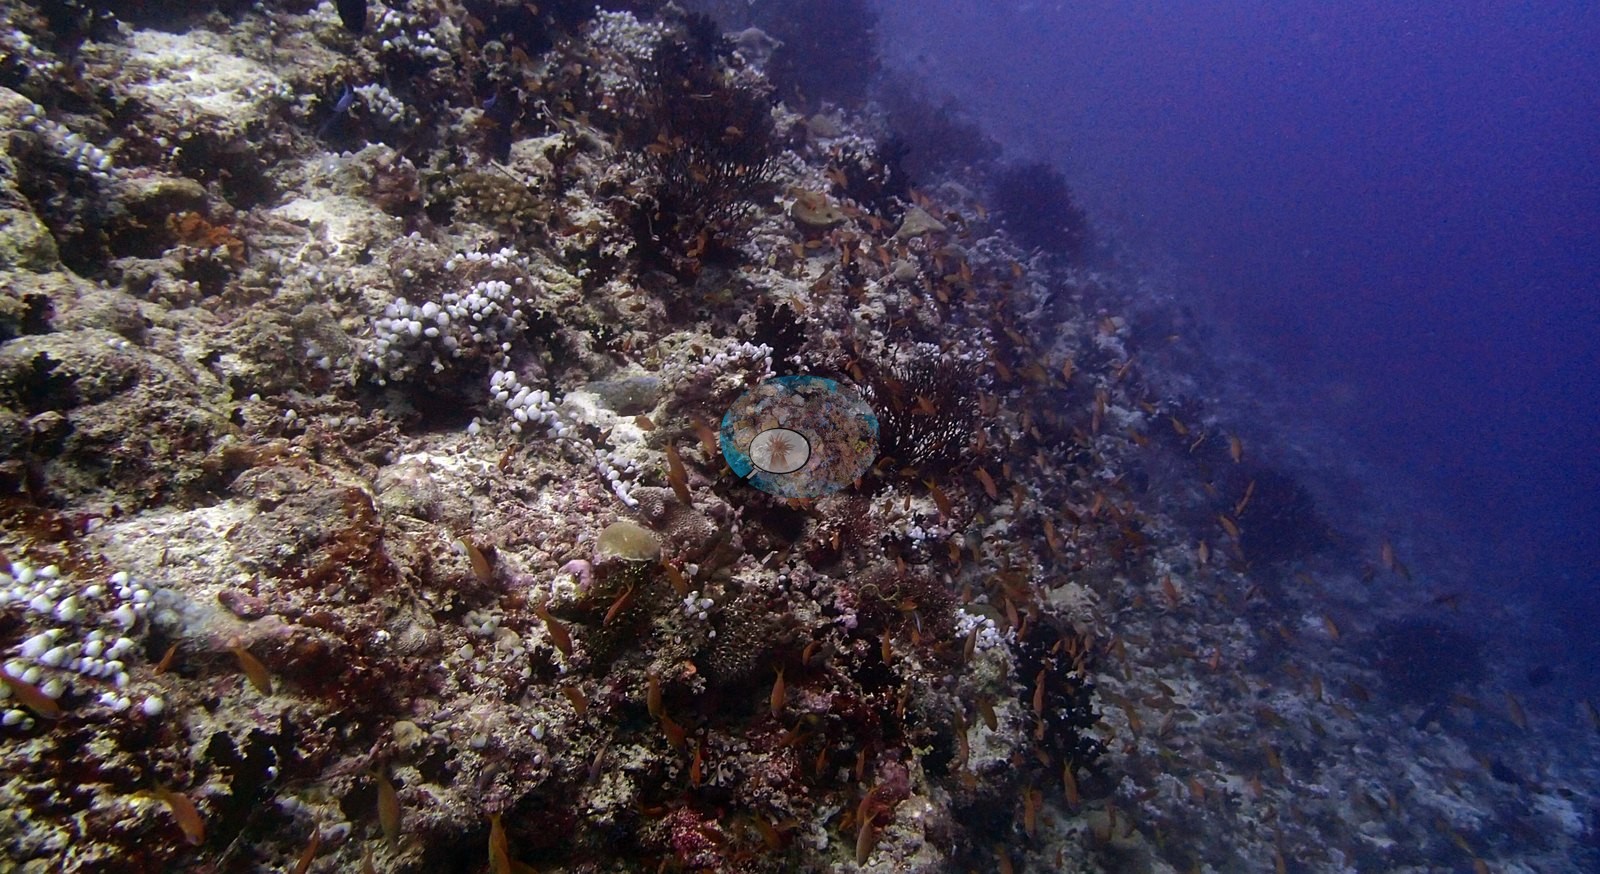
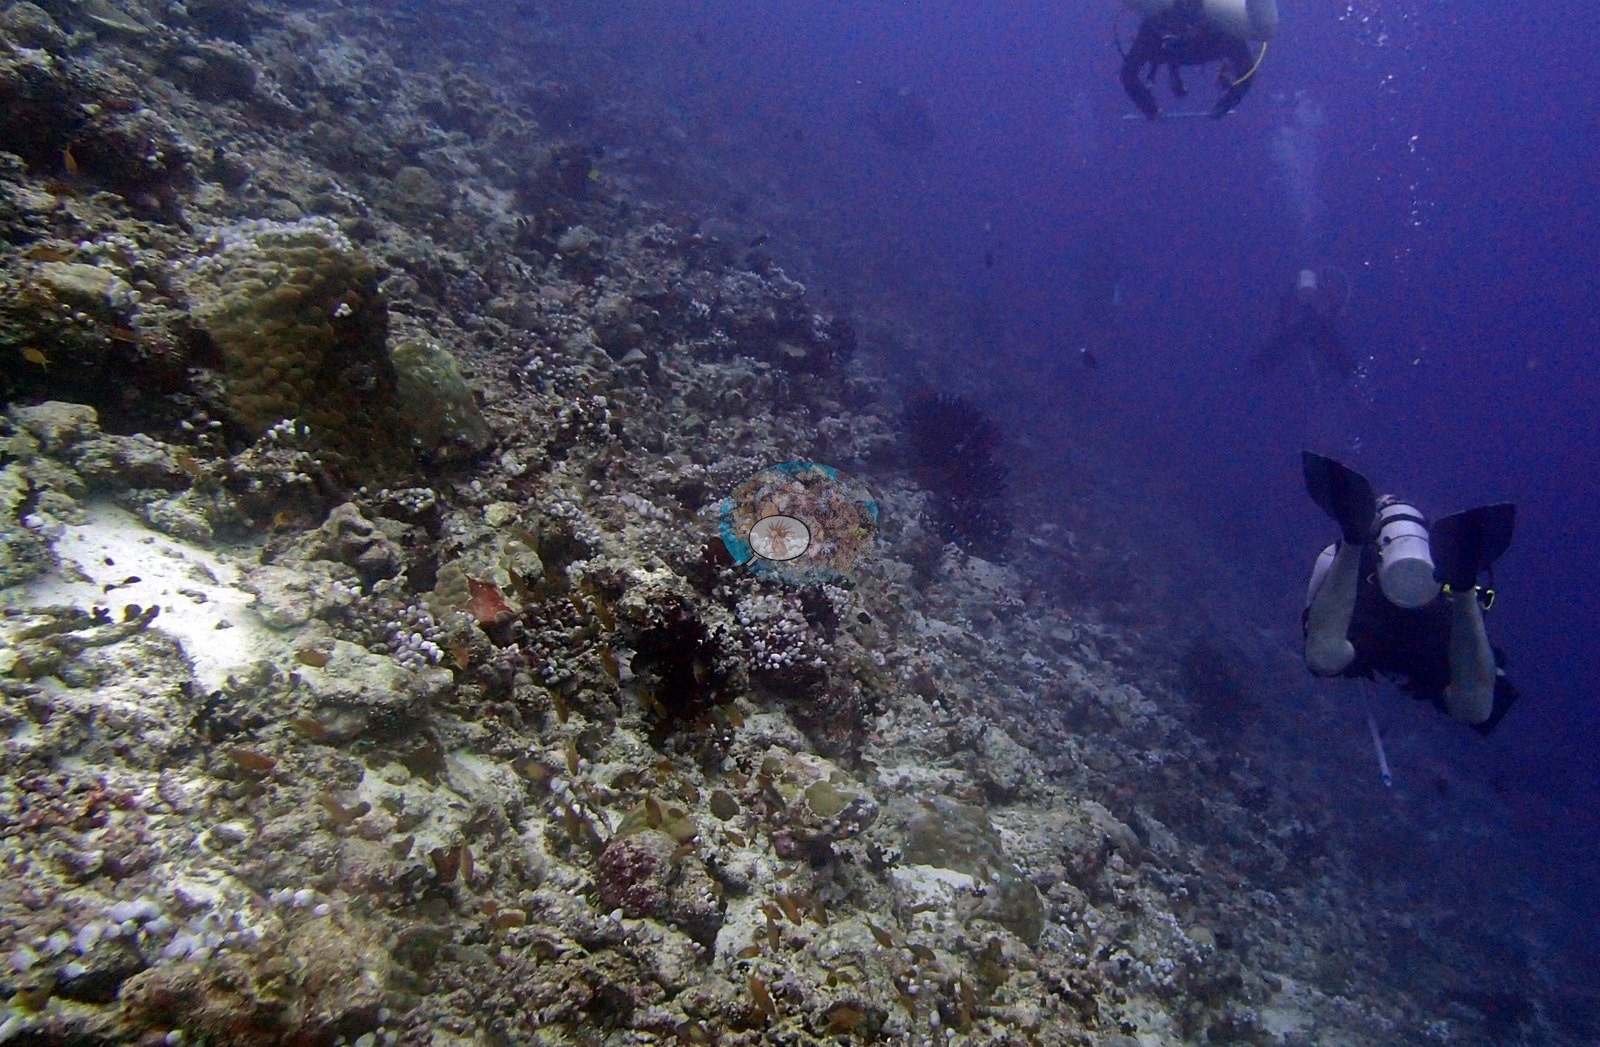
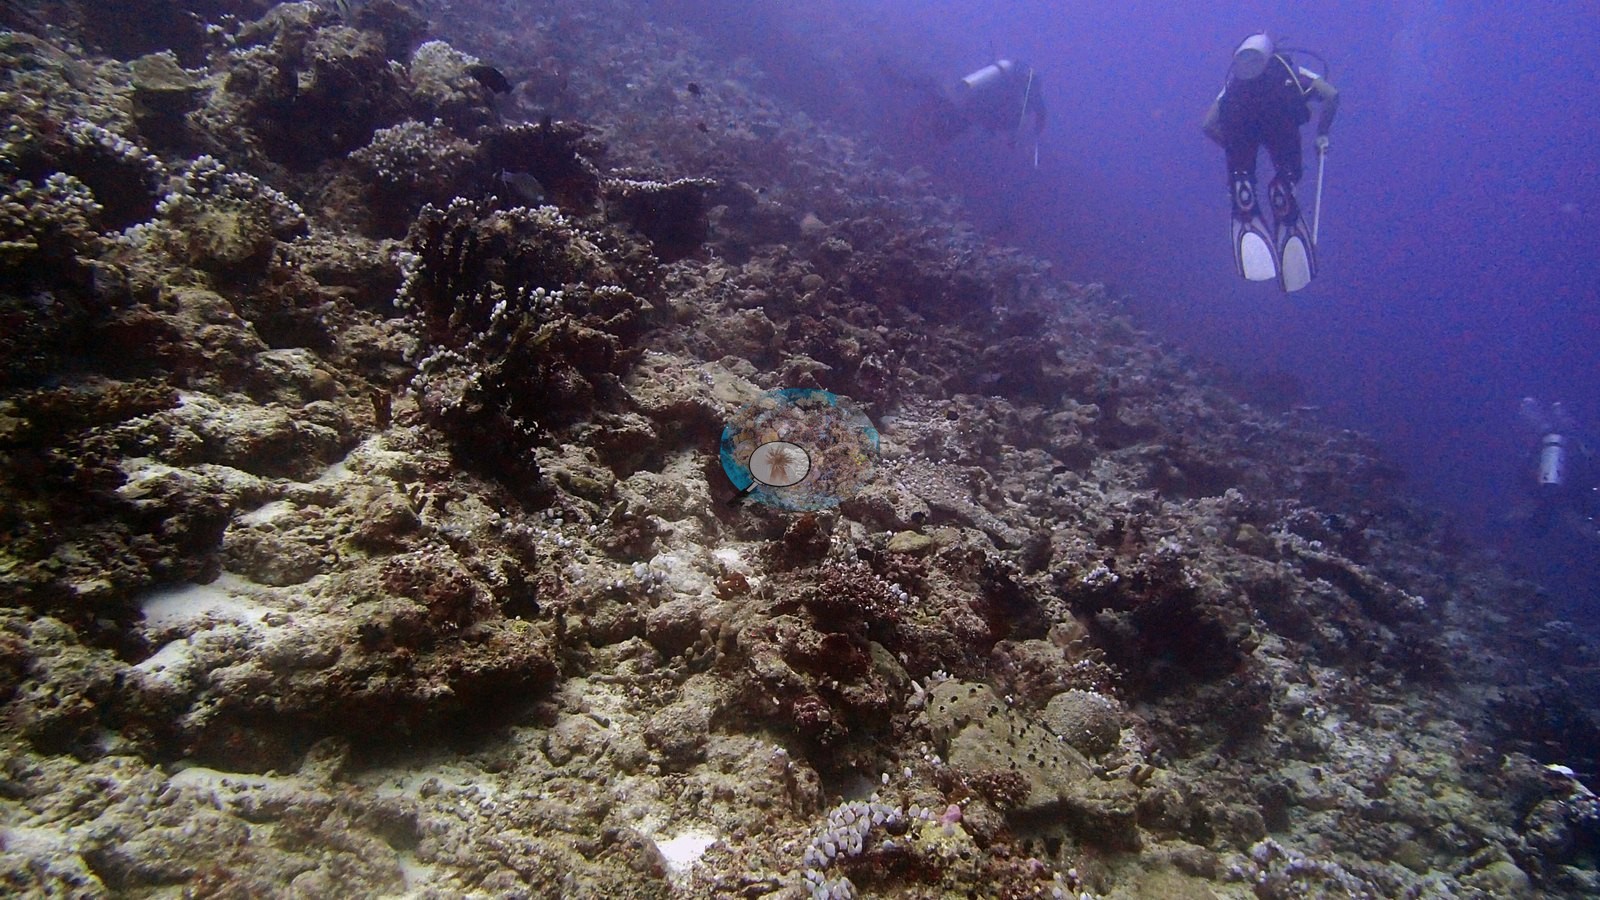
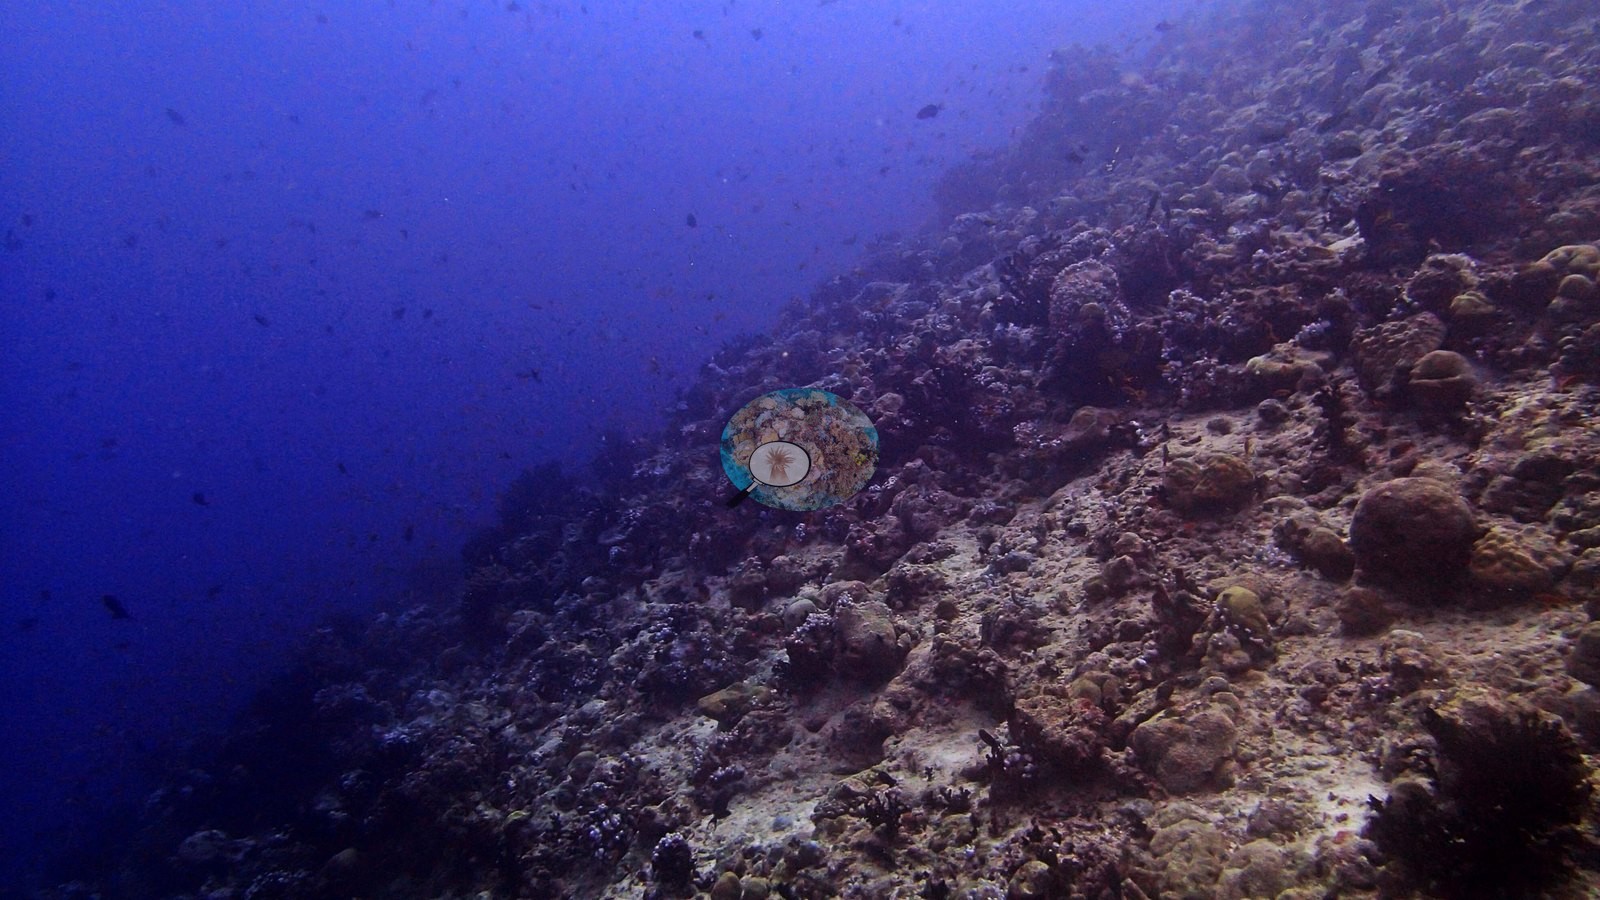
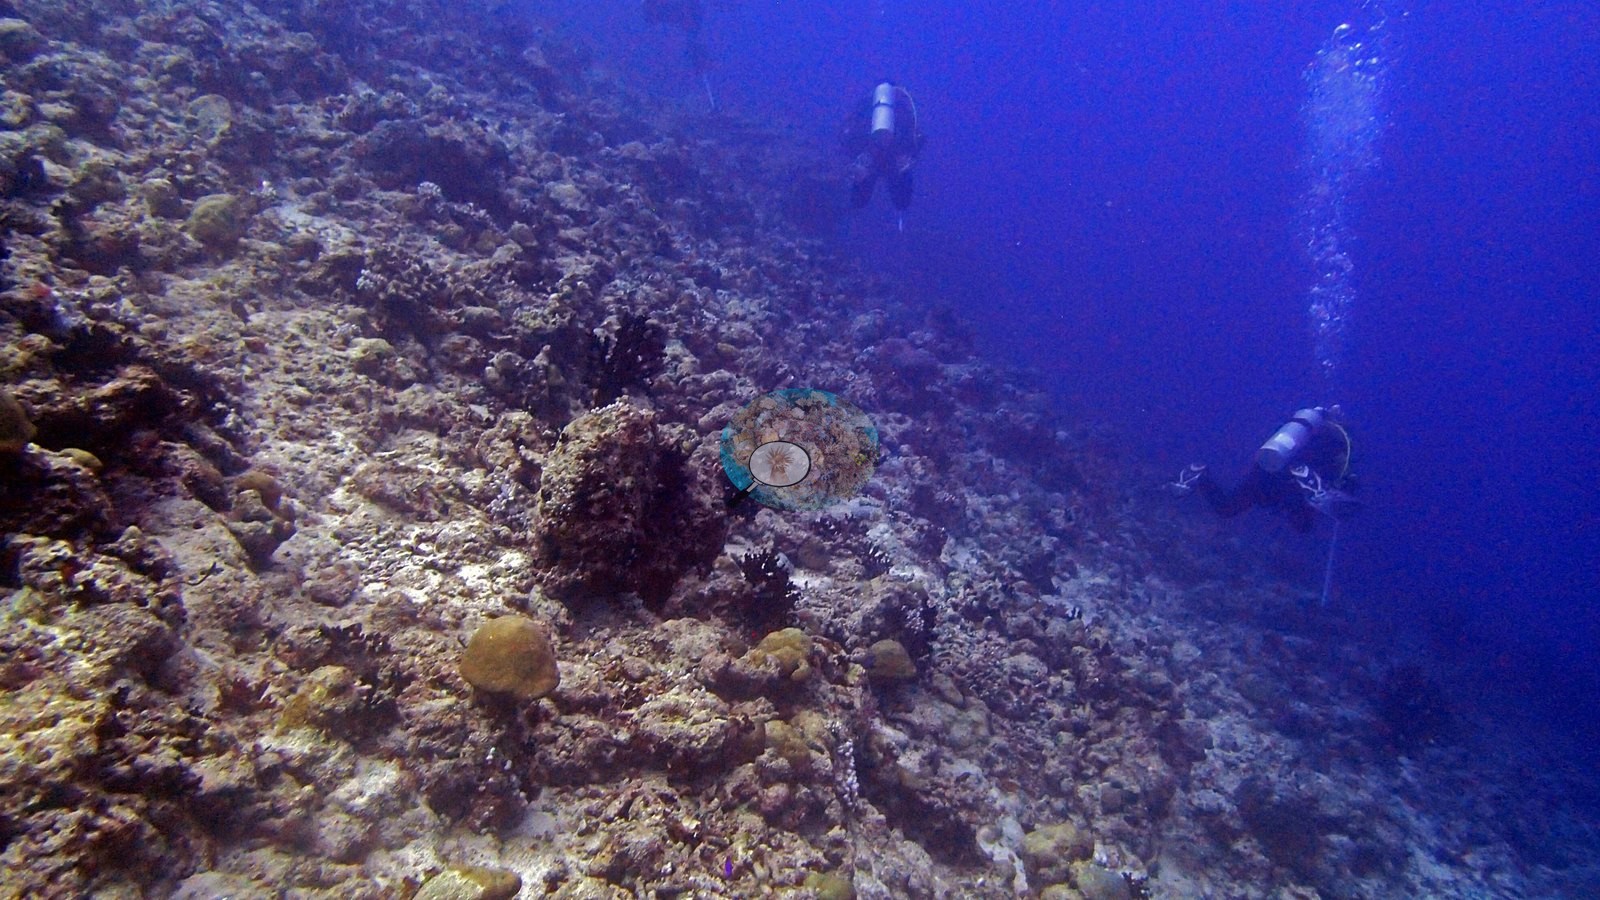
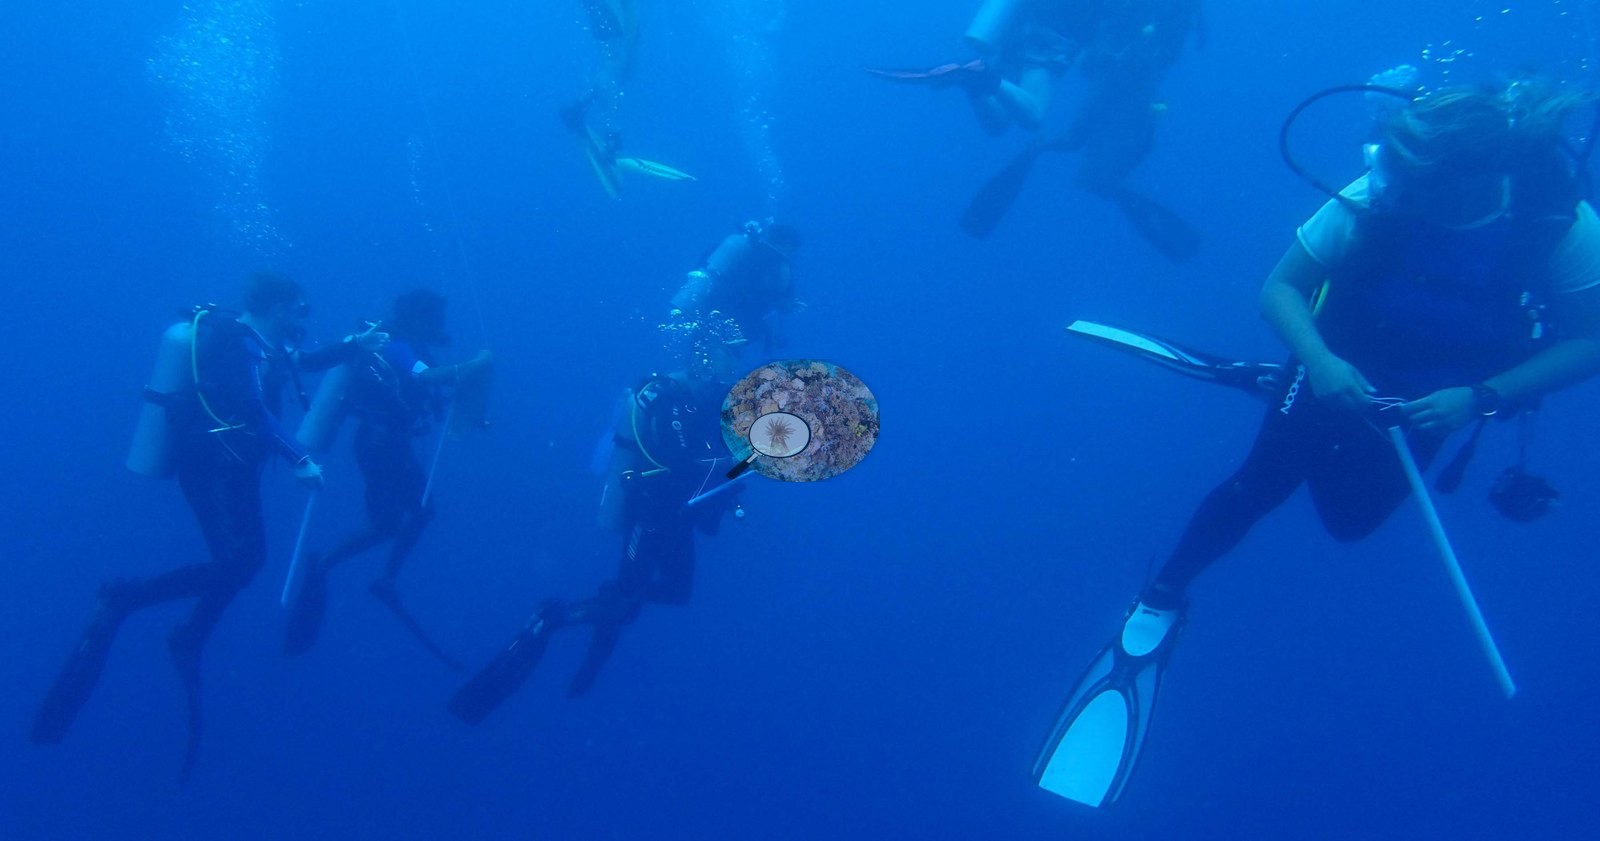
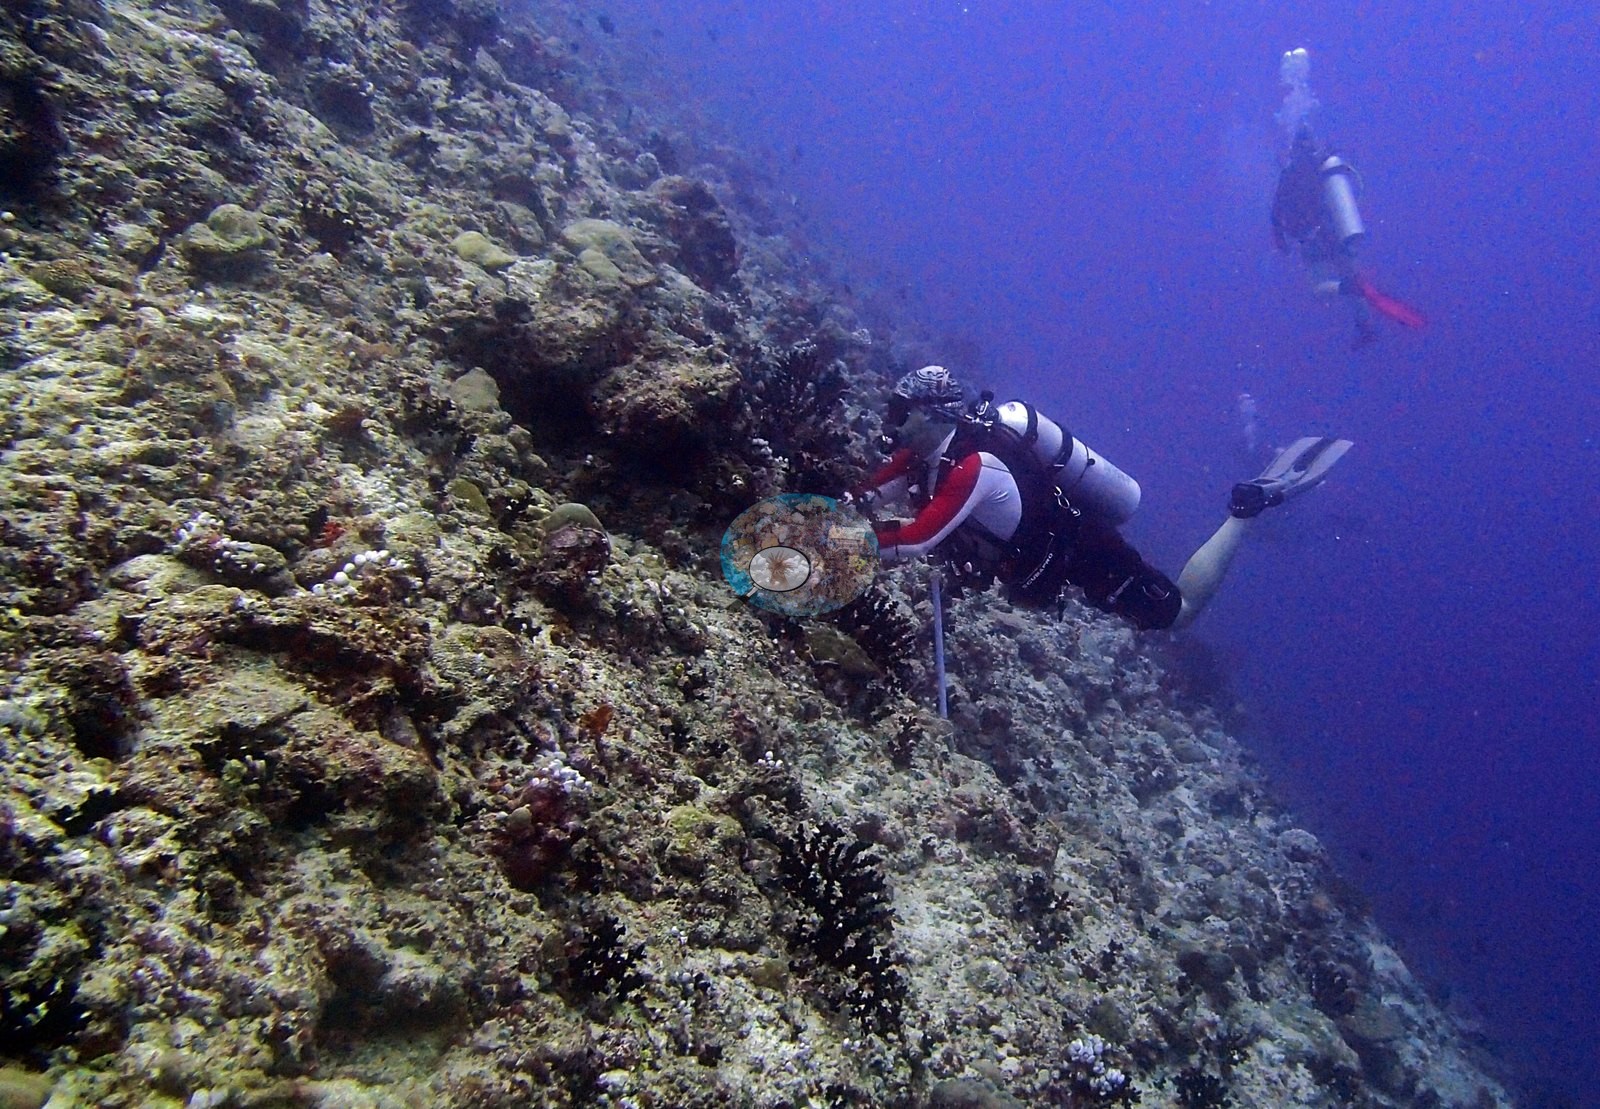
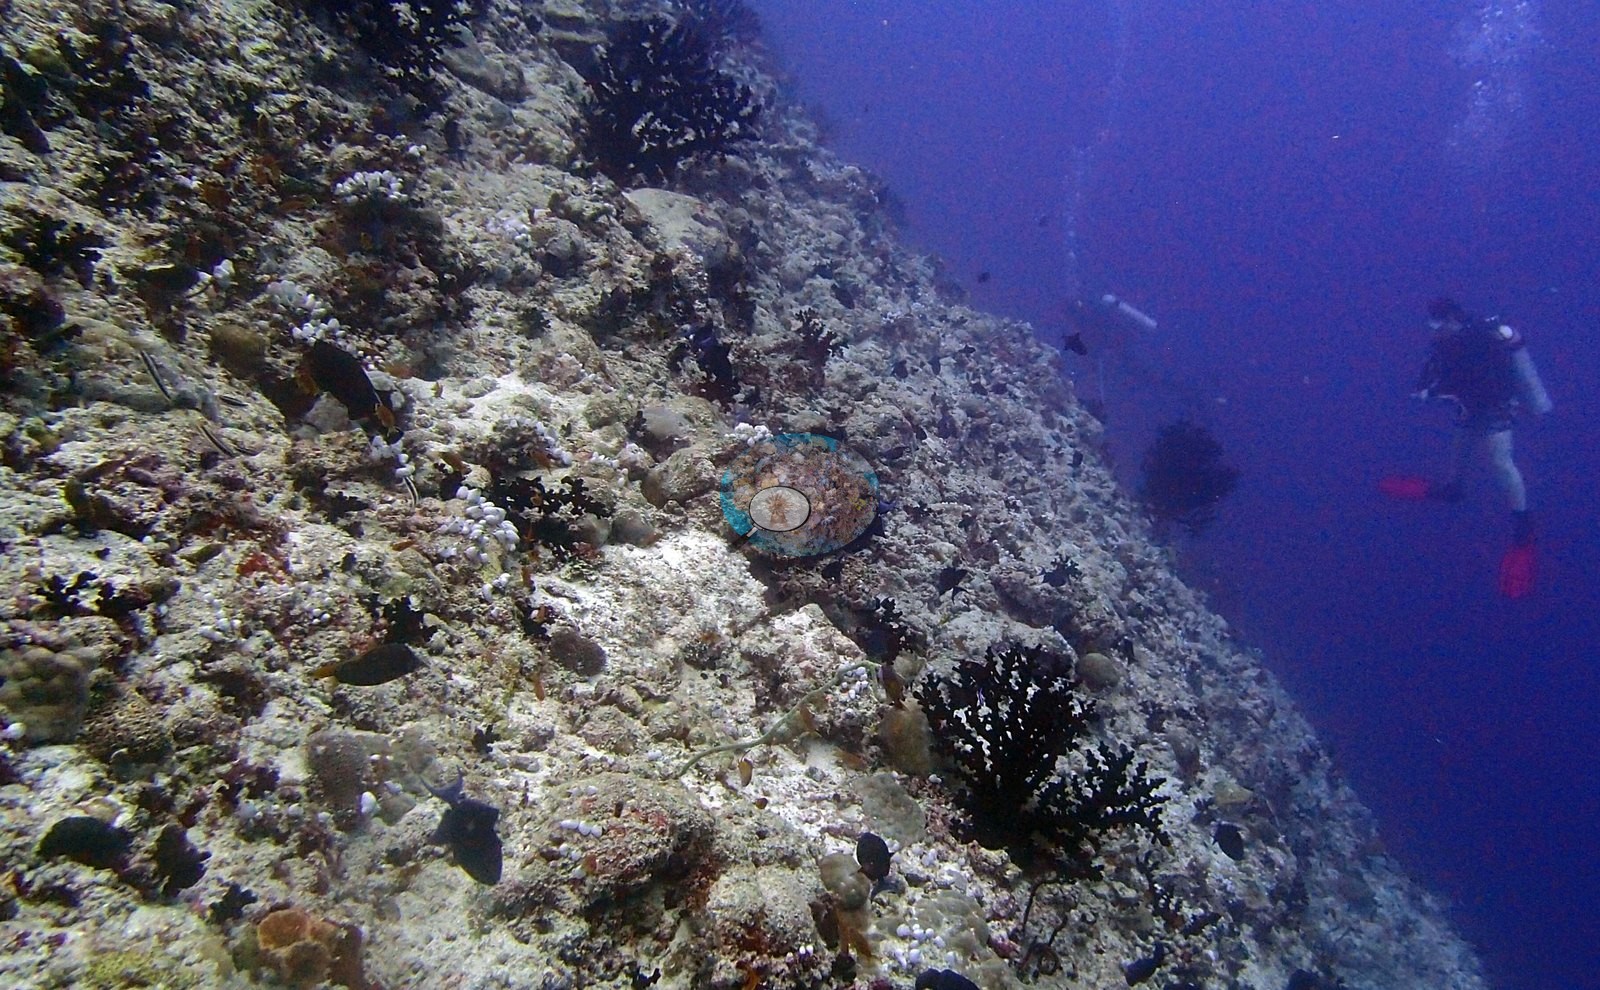
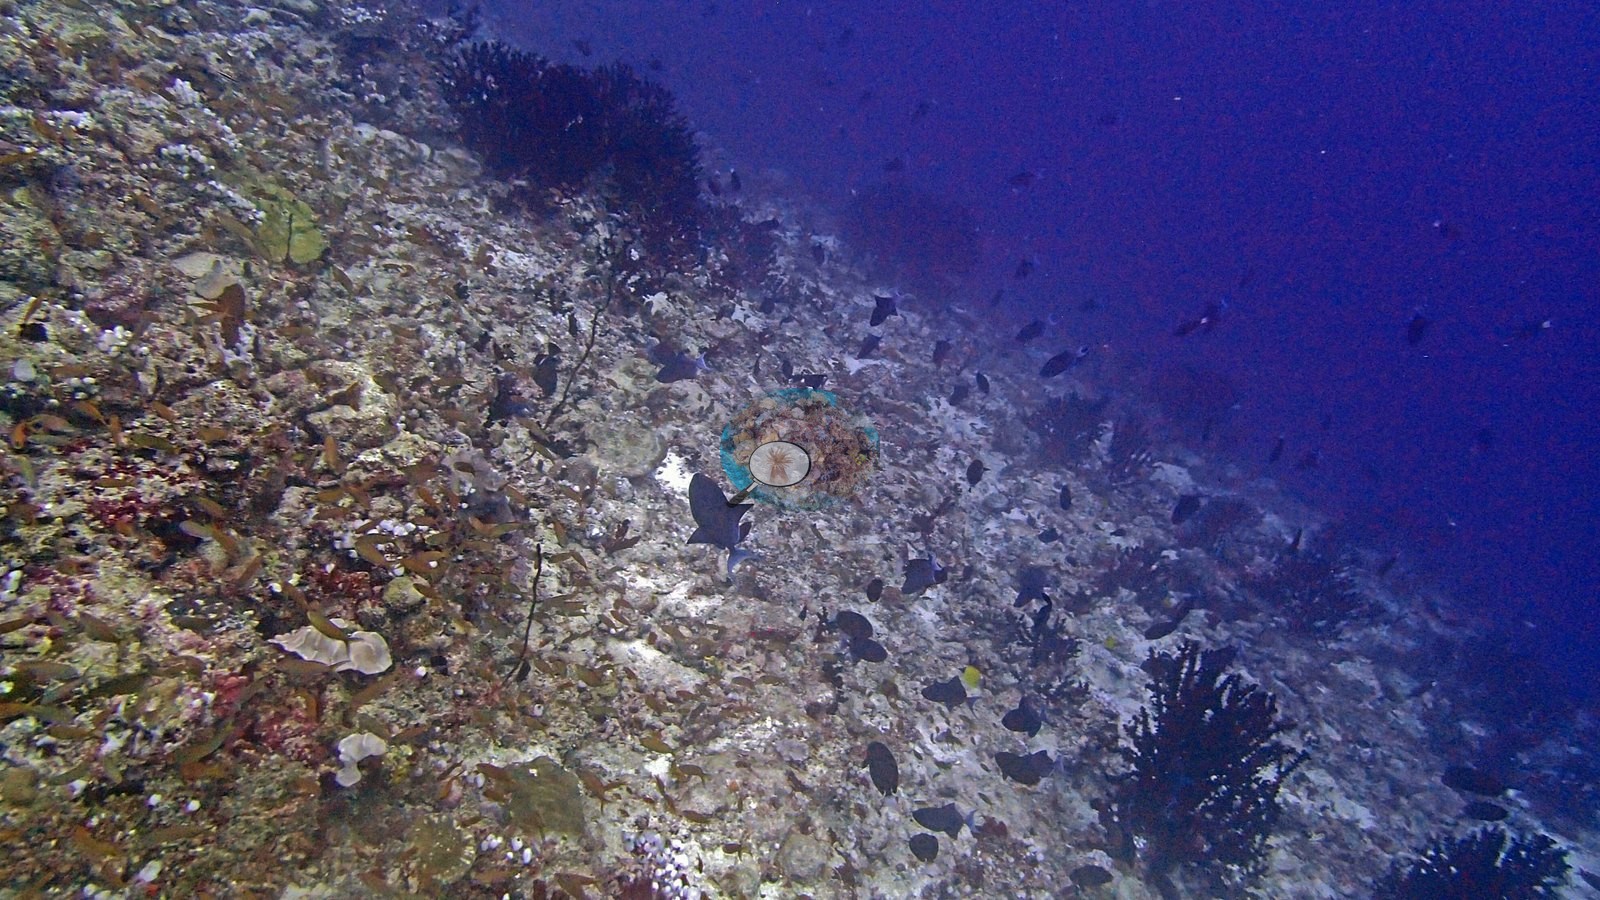
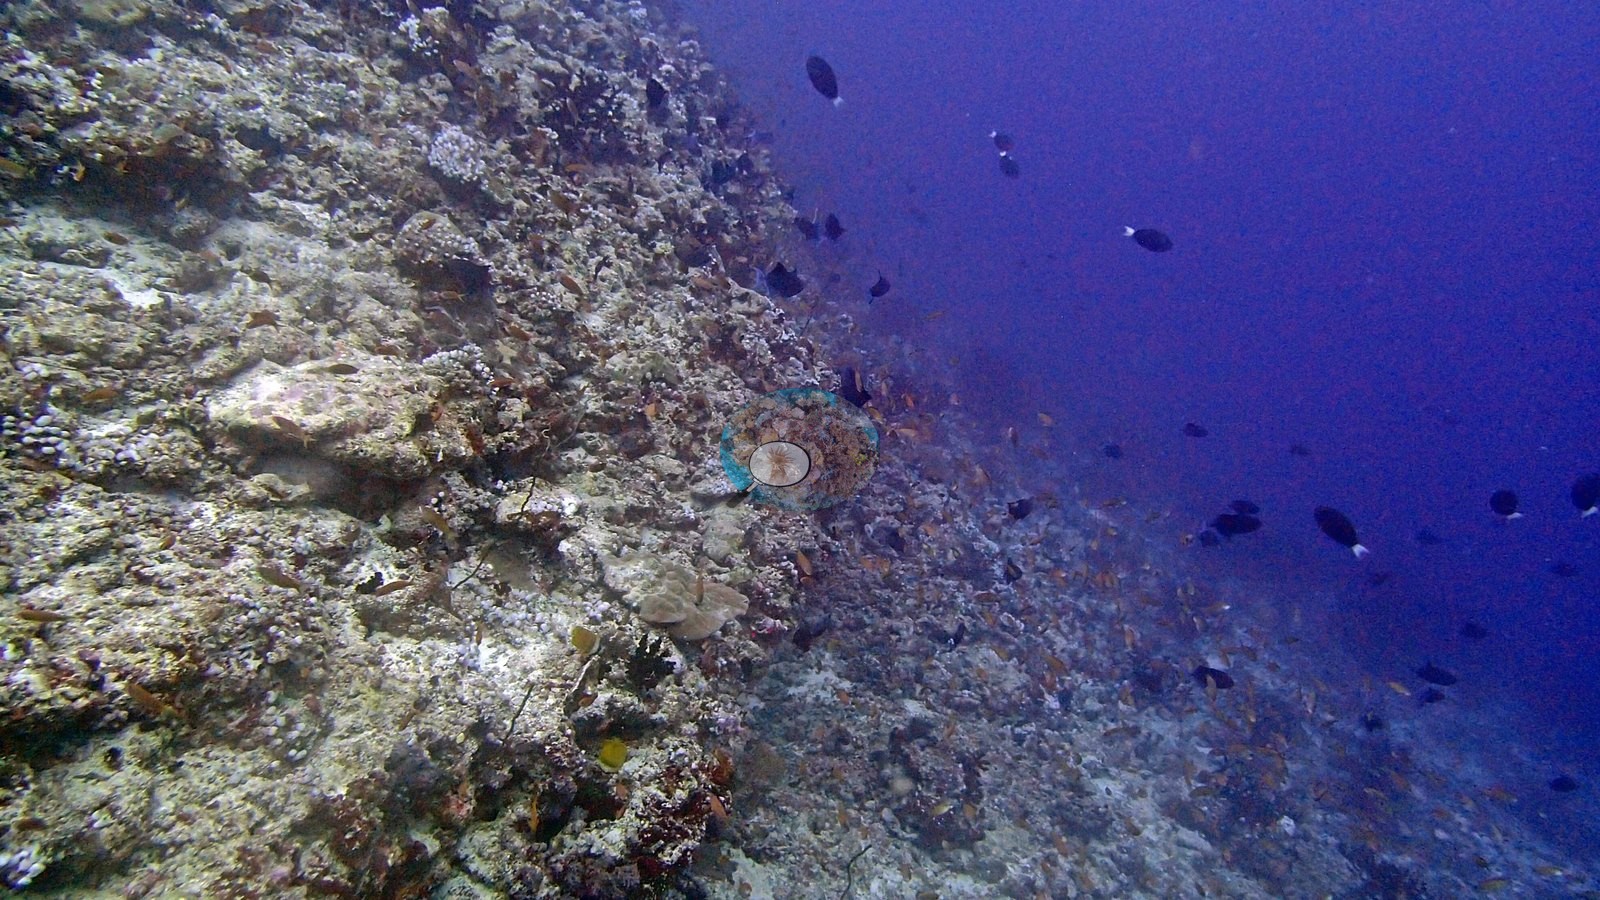
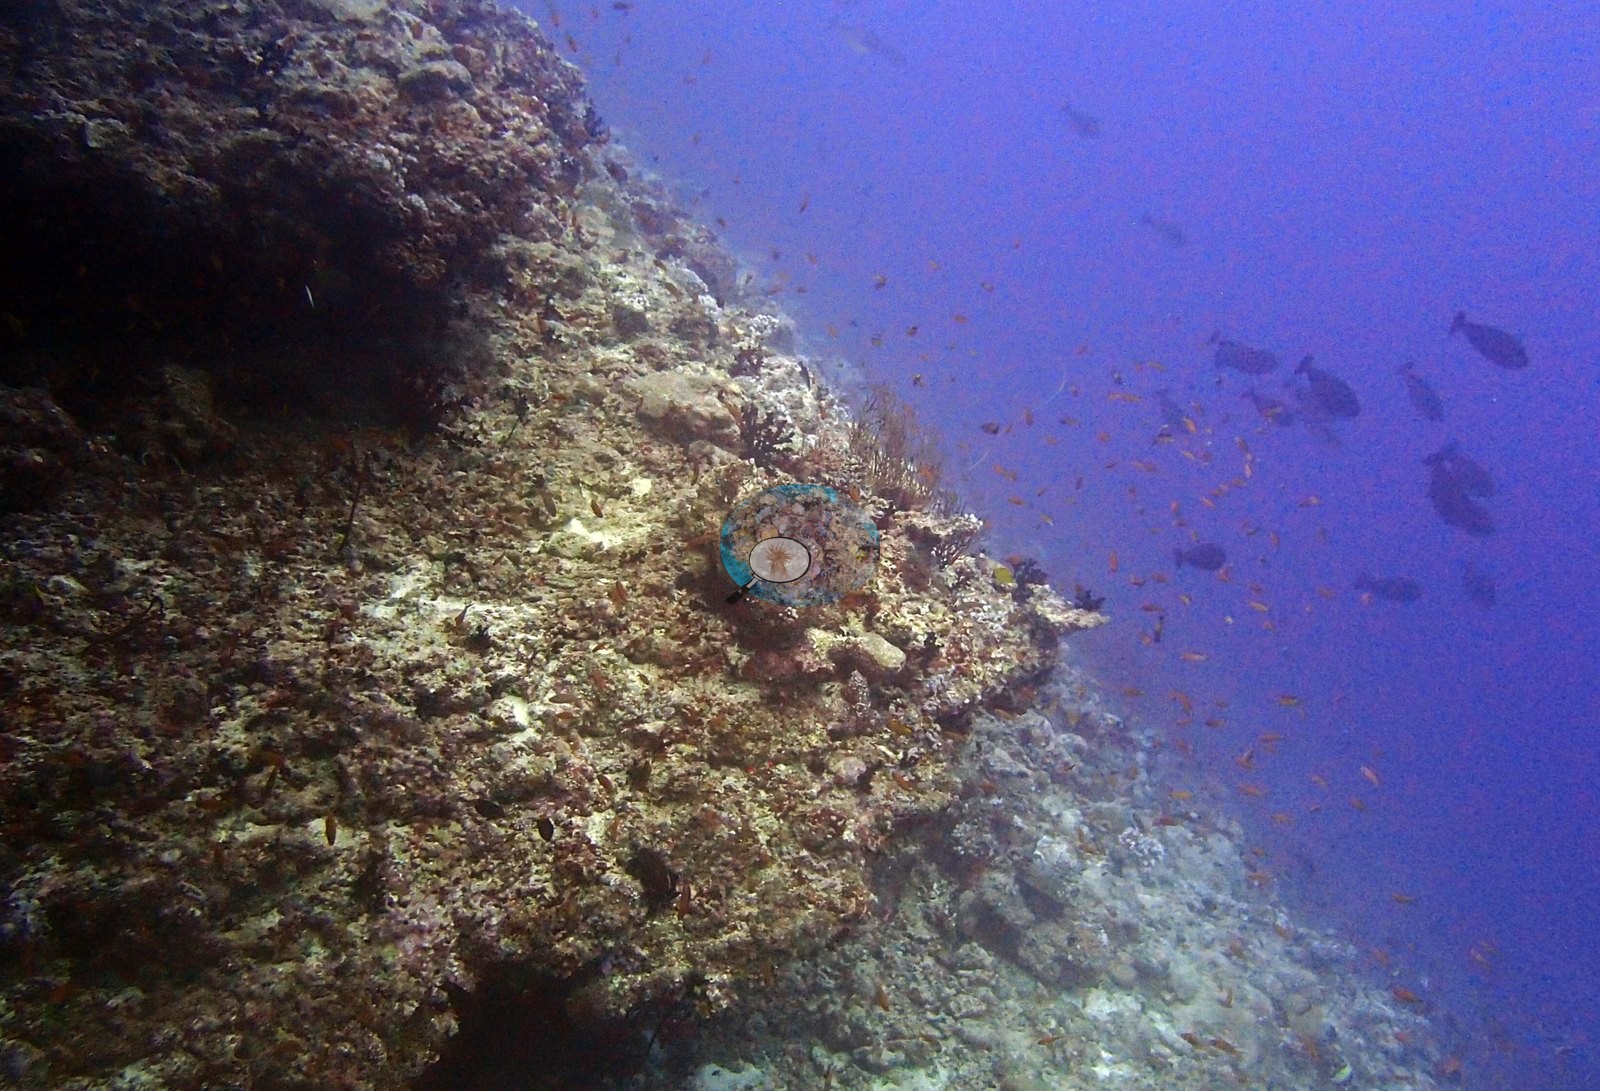
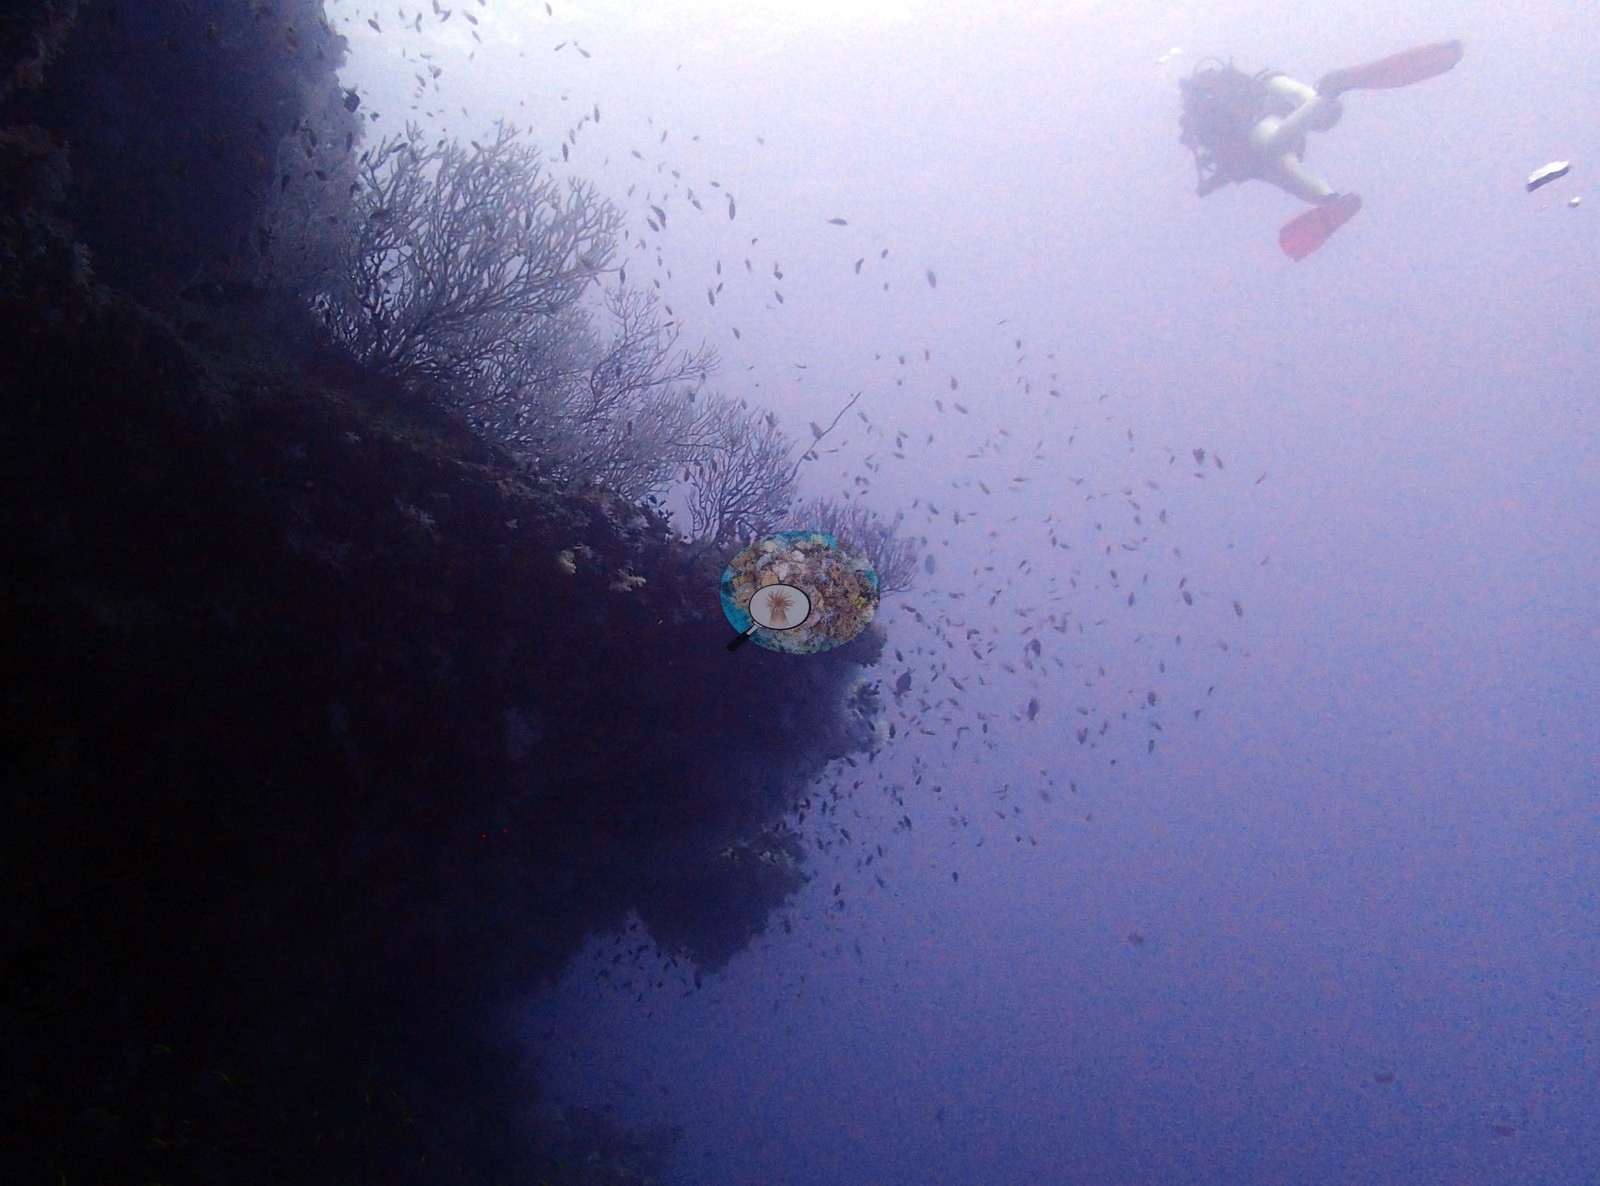
This is a topography dive: divers hang off the edge for scale, sunbeams rake past the ledges, feather stars and bushes compatible with black coral cling to the face, and clouds of small orange basslets stream along the drop-off where the current delivers breakfast (e.g., Image 1, Image 4, Image 10, Image 12, Image 14, Image 20).
Coral cover
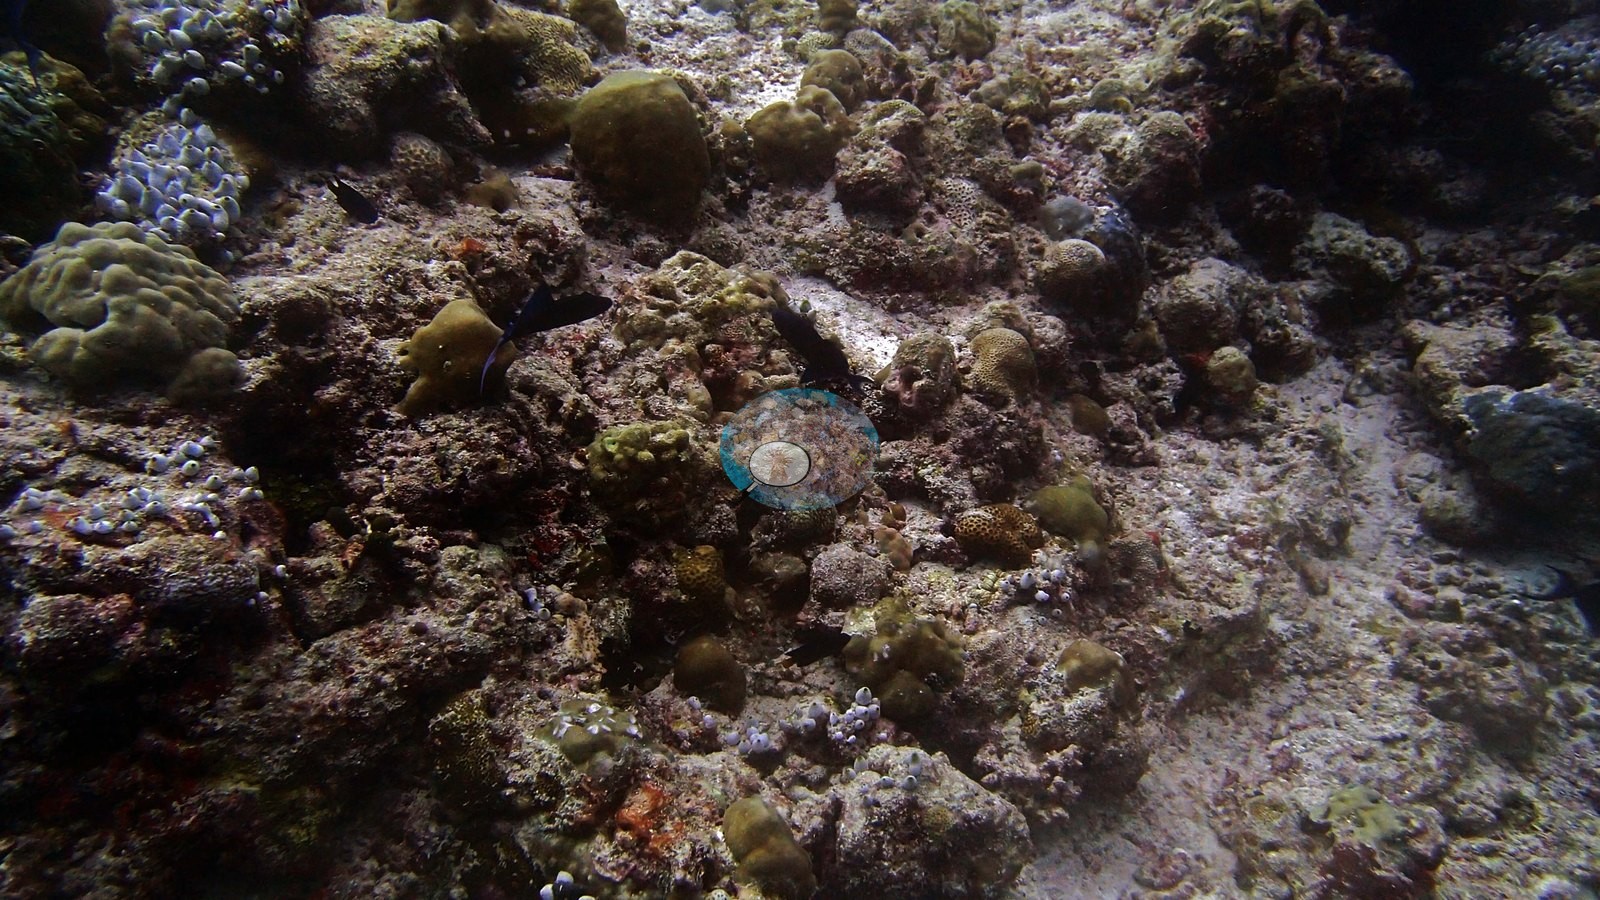
Coral cover: 11% — photo-derived, and the two methods differ by 7.5 pp (7.3% vs 15%). This site's figure is the mean of two independent computer vision passes over Anderson's own frames: a DINOv3 calibrated point classifier reads 7.3% and a CoralSCOP computer vision reads 14.8%, a spread of 7.5 percentage points. The map publishes the mean so sites can be sorted against one another, but the honest statement of what is known here is the 7.3–15% range: the two products have different denominators and should not be treated as one measurement.
Stressors
No crown-of-thorns starfish (COTS) or other corallivores evident.
Fish and other fauna
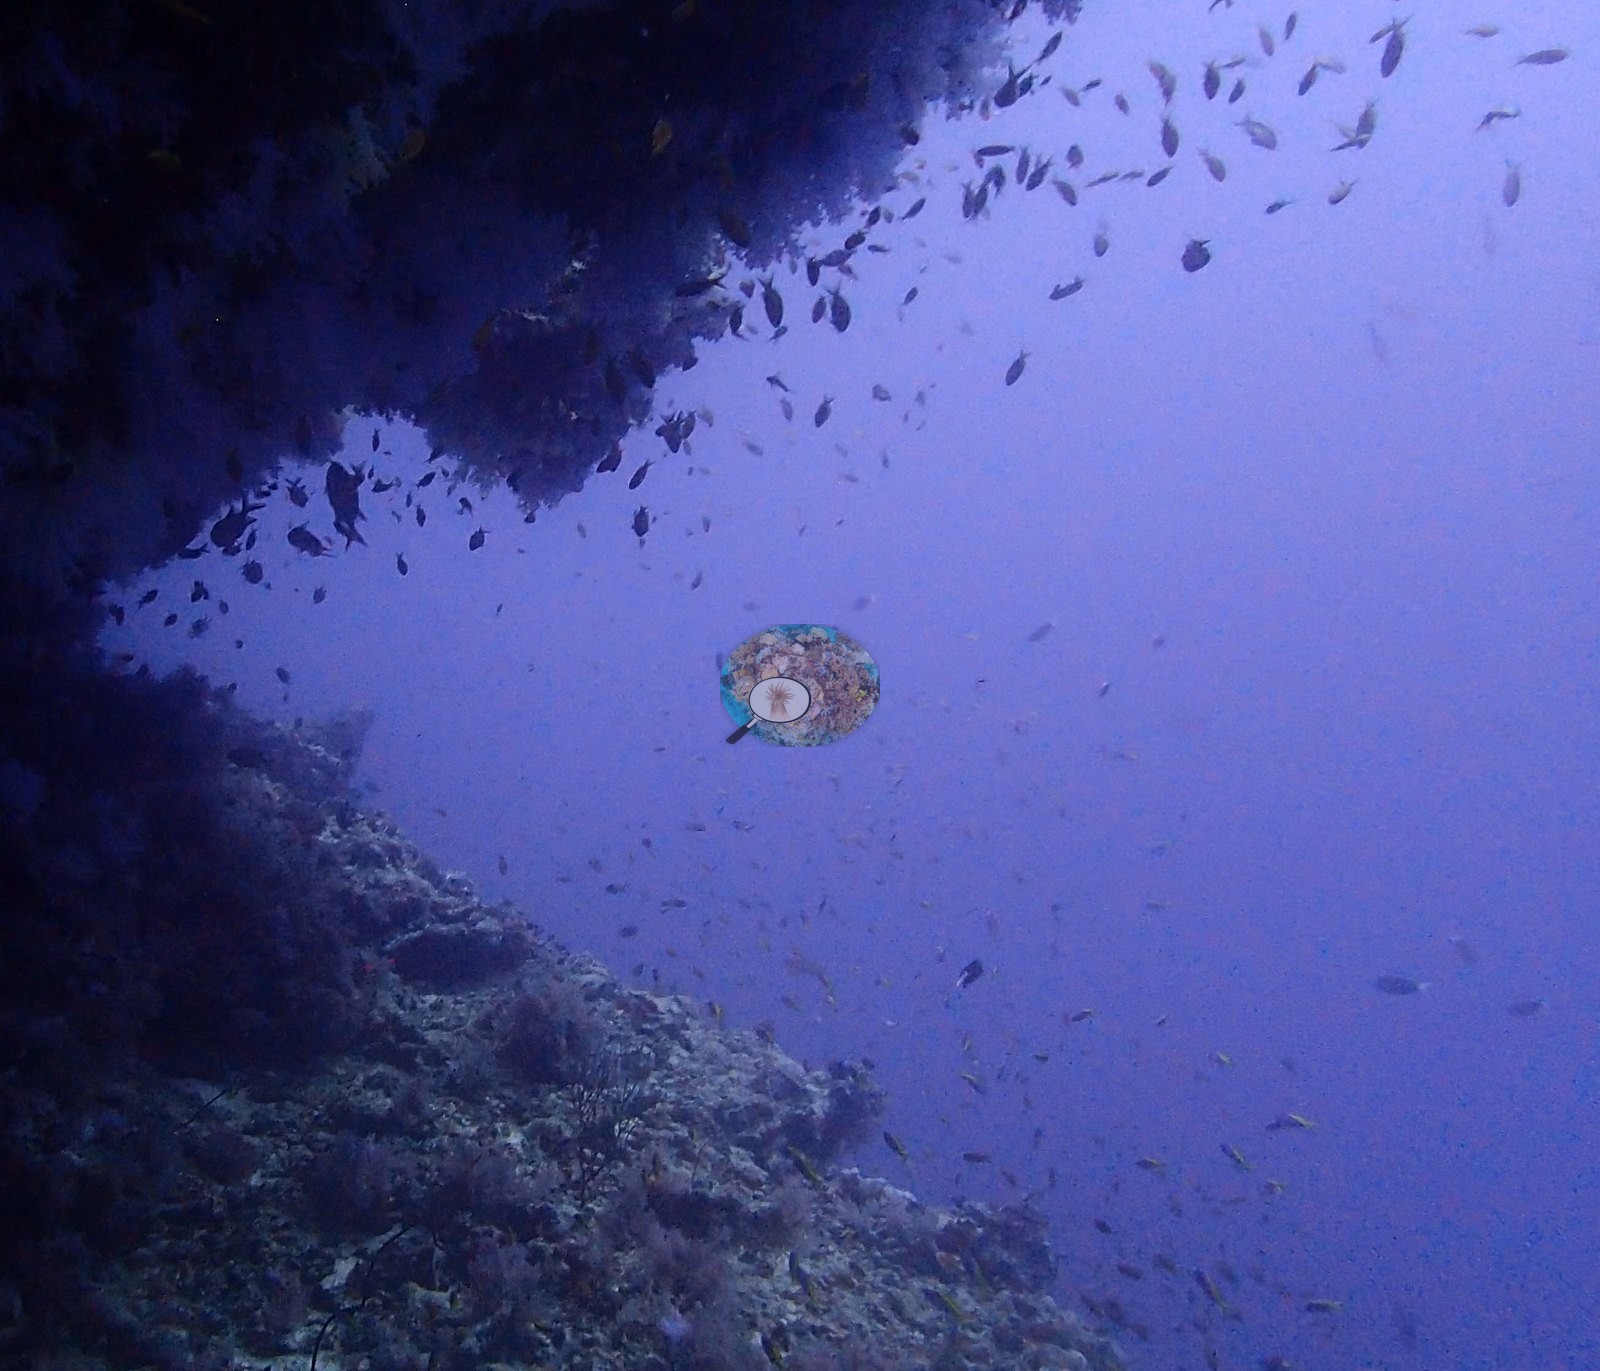
Inside one cave mouth, a school of silvery fish mills in the gloom like static on an old TV (e.g., Image 7).
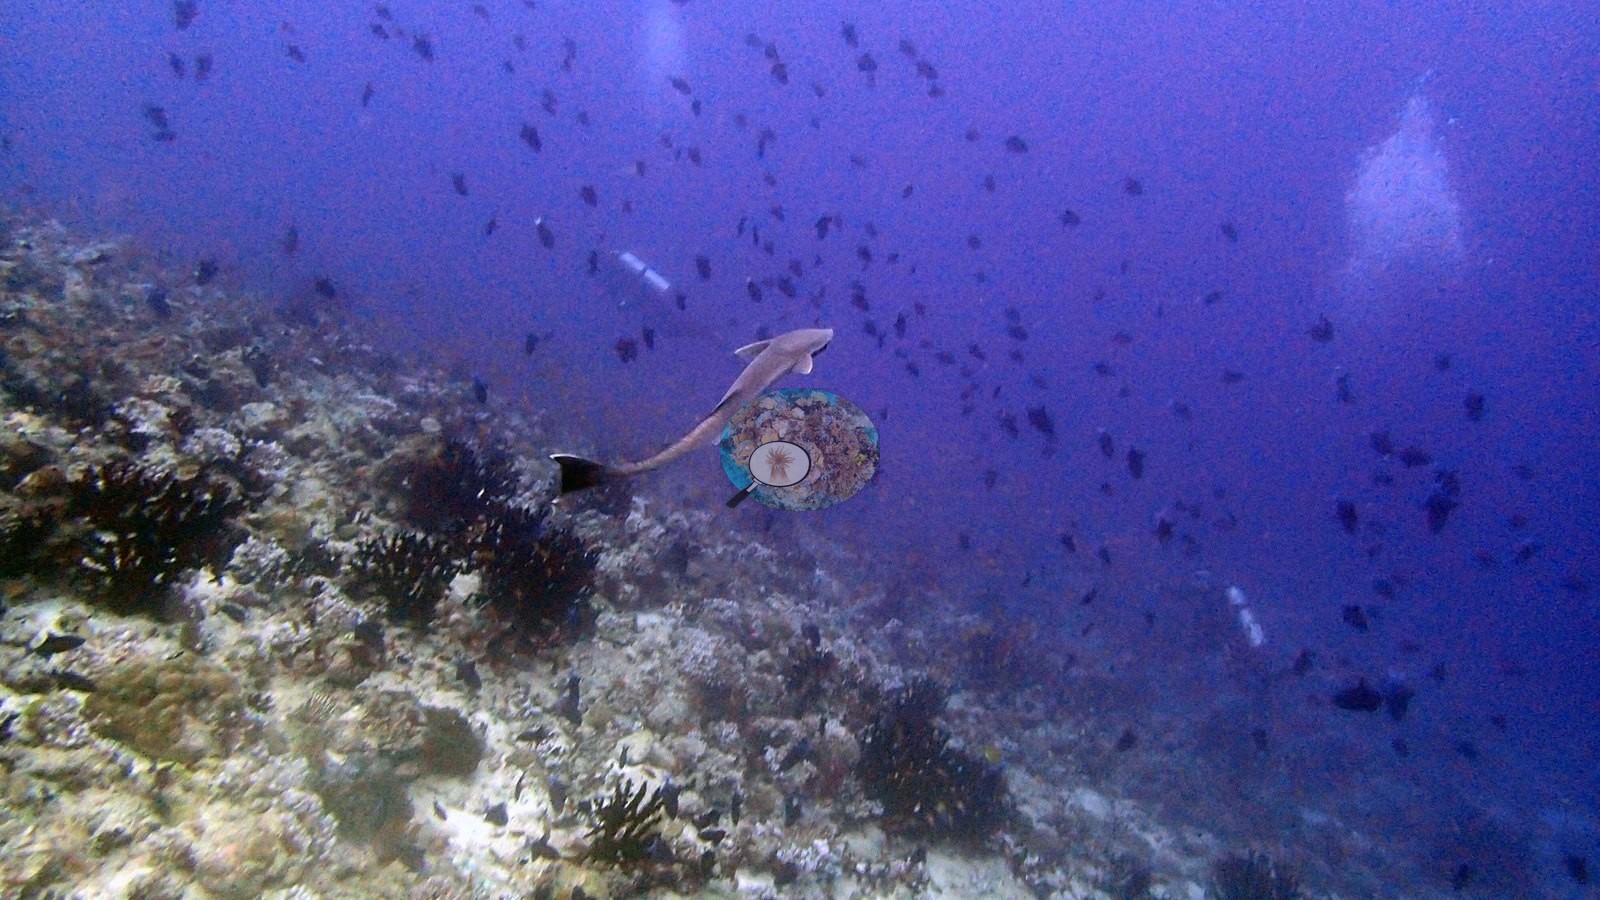
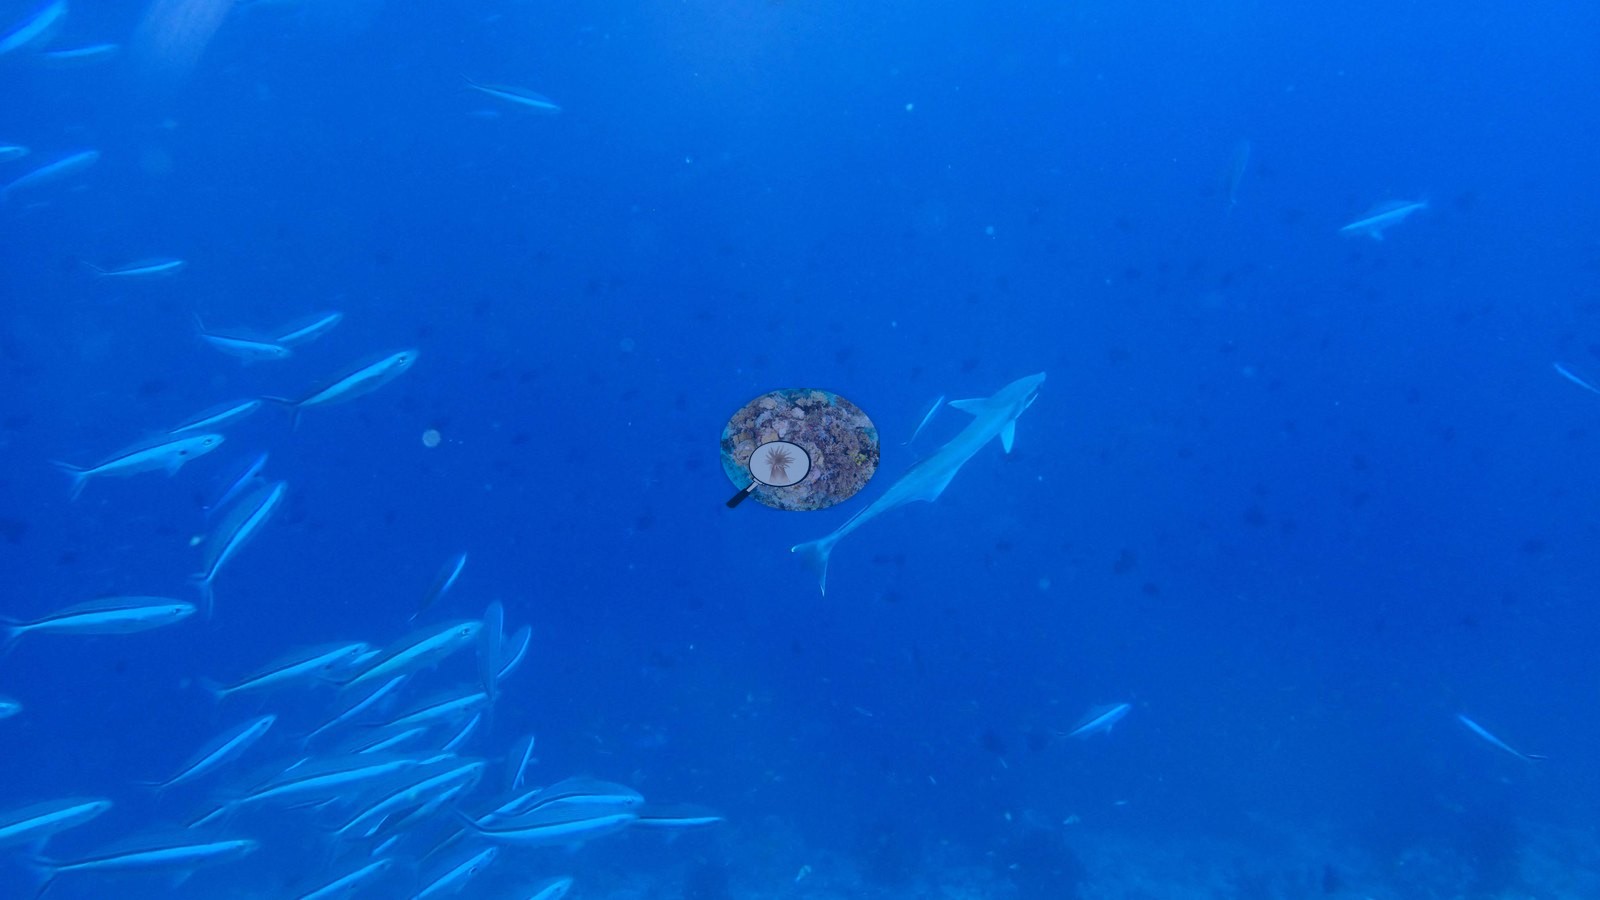
The morning's strangest guest was a remora, caught mid-water threading through a shoal of fusiliers with no shark, no turtle, no host in sight — just a hitchhiker between rides, photographed at the moment of unemployment (e.g., Image 15, Image 21).
Comparisons with other data
No independent survey was made at this exact site; the nearest ones are listed in the table below.
CV model comparison
More info
As of September 2026 no computer-vision method estimates coral cover accurately on new images, so treat this as indicative rather than a measurement; it is revised as the methods improve.More info
The published figure is the mean of the two methods.| Method | Hard-coral cover (%) |
|---|---|
| In-house DINOv3 | 7.3 |
| CoralSCOP | 14.8 |
| Mean (± SD) | 11.1 ± 5.3 |
| Range | 7.3–14.8 |
Mean ± SD and range are across the computer-vision methods shown.
Independent surveys nearby
| Agency / program | Year(s) | Stations / distance | Link |
|---|---|---|---|
| Montefalcone et al. (2020) | 2017–2019 | 2 stations, 0.74–3.85 km | Records ↓ |
| Reef Check | 2011–2019 | 5 stations, 0.32–3.96 km | Records ↓ |
| ReefCloud | 2011–2012 | 1 station, 1.94 km | Records ↓ |
| XL Catlin Seaview Survey | 2015–2017 | 1 station, 1.81 km | Records ↓ |
 Dr. Coral (CRD)Year-average (no detectable trend)
Within 5 km, 9 independent survey stations recorded hard coral cover in 19 records between 2011 and 2019. Of the 3 stations surveyed in more than one year, 2 increased and 1 changed by less than 5 percentage points between their first and latest surveys. The longest record, transect 37037 (XL Catlin Seaview Survey, 1.81 km away), went from 14% in 2015 to 9.1% in 2017. The most recent nearby survey is from 2019, so these values predate recent heat stress. This site's own estimate (11%) sits within the range of these surveys (8.8–48%); the methods differ, so the comparison is context, not a like-for-like test.
Collected by other programs using different methods (Reef Check uses point-intercept transects; the XL Catlin Seaview Survey uses photo-transects with automated image annotation), so these are context for the figures above, not a like-for-like comparison. Where a station was surveyed more than once the range is shown. Station names are not dive-site names.
| Agency | Site / location | Date | Hard coral cover (%) | Distance | Link |
|---|---|---|---|---|---|
| ReefCloud | Emboodhoo | 2011–2012 | 26–40% (4 surveys) | 1.94 km | HeatCRD database |
| Reef Check | Laguna Beyru House Reef | 2011 | 12% (3 surveys) | 3.96 km | — |
| Reef Check | Embudhoo | 2012 | 38% (2 surveys) | 1.86 km | — |
| XL Catlin Seaview Survey | transect 37037 | 2015–2017 | 9.1–14% (2 images) | 1.81 km | — |
| Reef Check | Embudhu (South Male) | 2017 | 9.4% | 1.72 km | — |
| Montefalcone et al. (2020) | Velassaru | 2017–2019 | 22–48% (2 surveys) | 3.85 km | HeatCRD database |
| Reef Check | Vadhoo Caves | 2018 | 13% (2 surveys) | 0.32 km | — |
| Montefalcone et al. (2020) | Vaadhoo Caves | 2018 | 23% | 0.74 km | HeatCRD database |
| Reef Check | Vellassaru beyru | 2019 | 8.8% (2 surveys) | 3.47 km | — |
Data & links
All images from Coral Reef Diagnostics. Data are from Coral Reef Diagnostics and the organizations named in the data-sources table above.
© Coral Reef Diagnostics.