
Maldives - Little Sandy Bank

Part of the regional summaries: Maldives - Central (Male Atolls / Ari / Vaavu) and Maldives
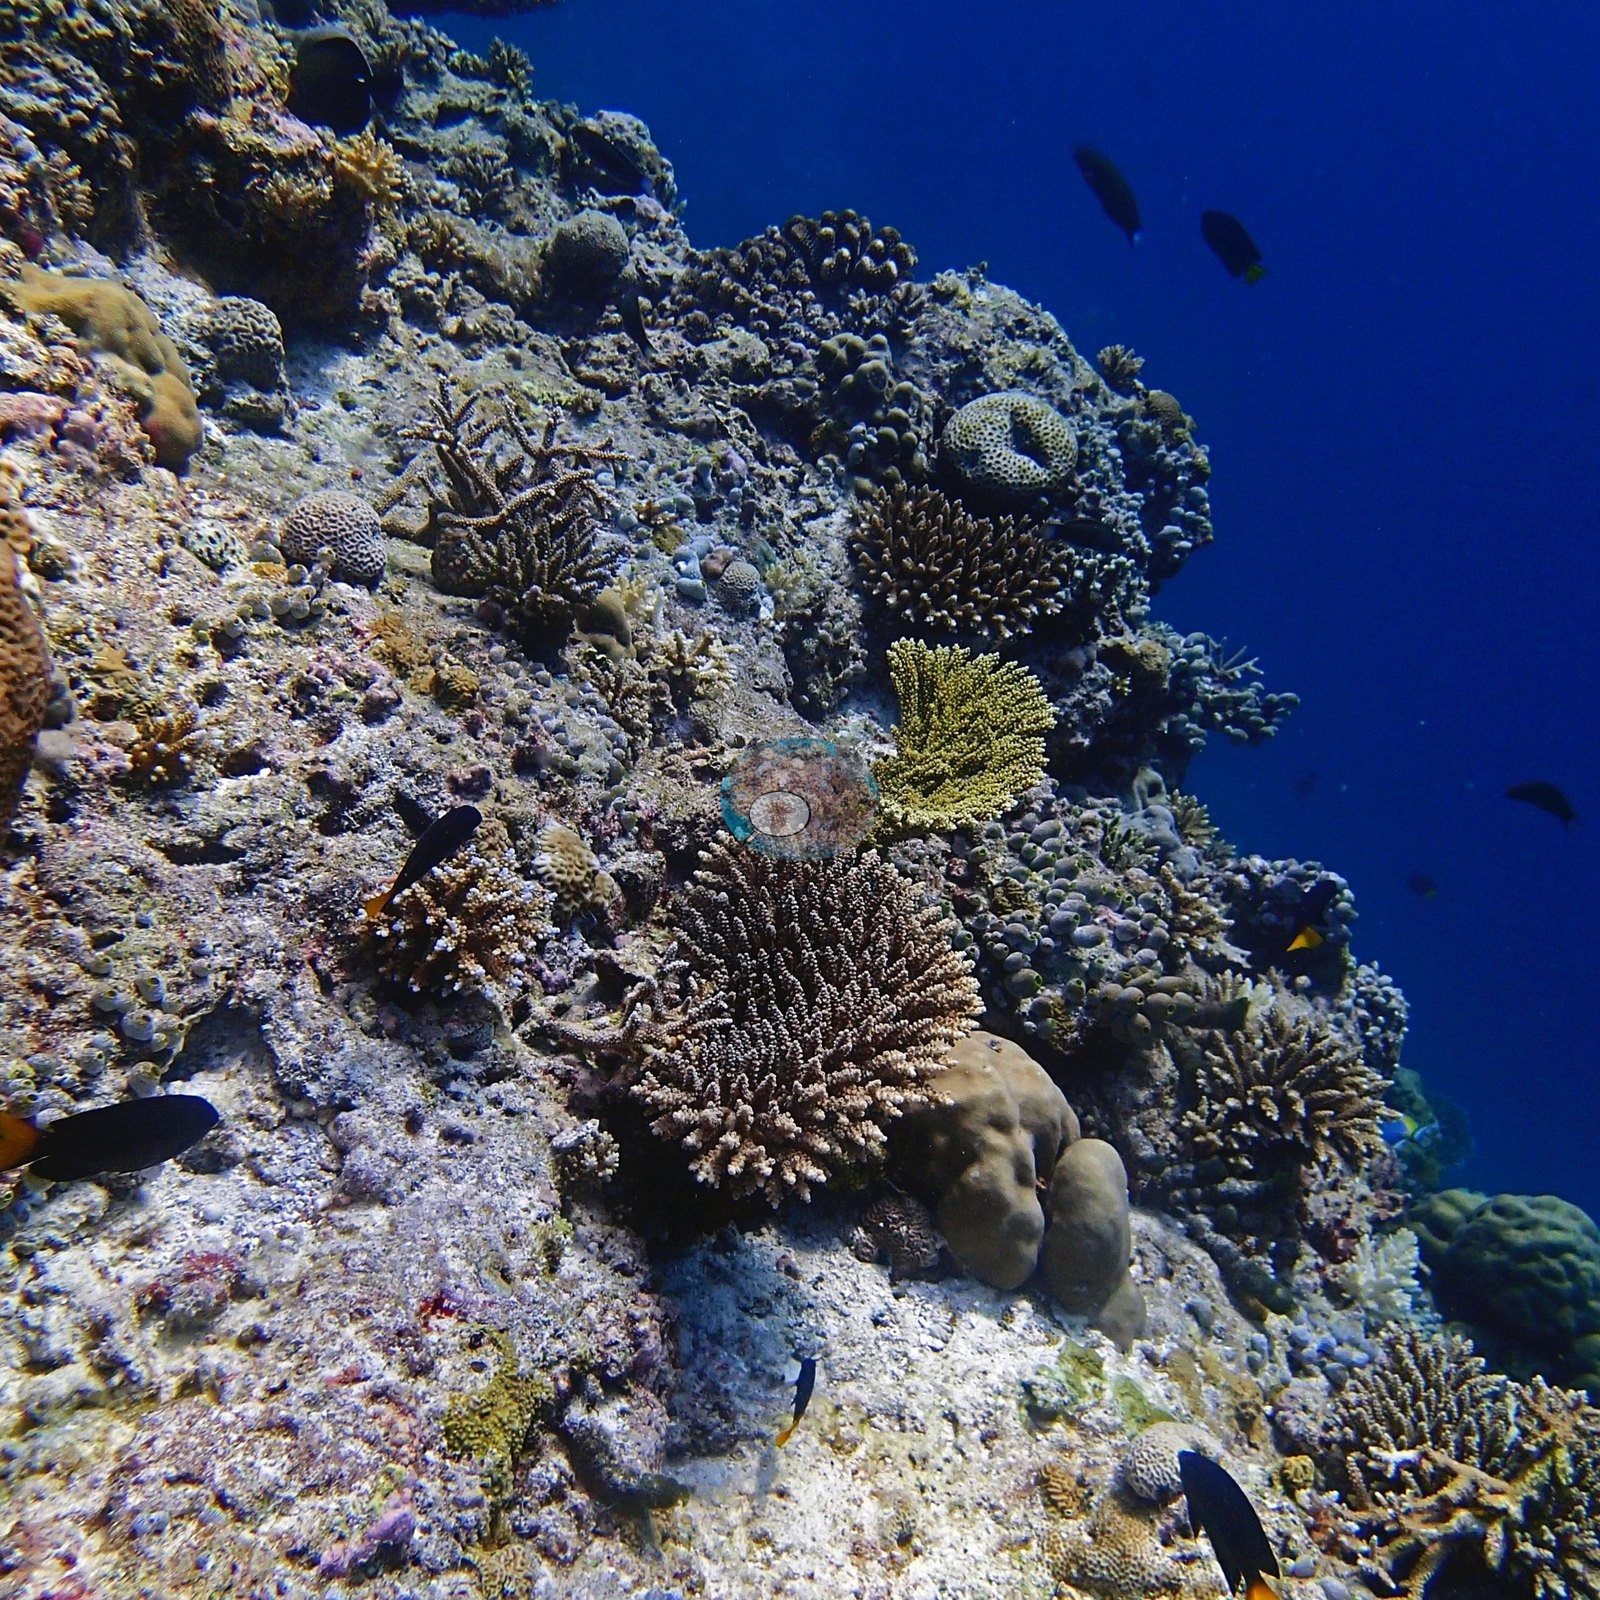
2016-01-19
April 2016 (transect survey)
July 2016 (transect survey)
More info
Maldives (NOAA CRW virtual station)Little Sandy Bank (the CPR coordinate file's Small Sand Bank) is a leeward lagoonal patch reef whose coralline-crusted reef top drops steeply into blue water, the first quadrat site of a January 2016 research baseline, where Anderson recorded 14 of the 15 colonies sampled as healthy and one as 5-10% sickly or pale. On the 14 January dive Anderson also noted one crown-of-thorns starfish and 5-10 Culcita cushion stars with extensive feeding damage in places, and by the April 2016 resurvey, at the height of El Niño, four out of five colonies here were bleached.
Little Sandy Bank (CPR ގެ ކޯޑިނޭޓް ފައިލްގައި Small Sand Bank) އަކީ ވައިން ރައްކާތެރި ފަރާތުގައި، ފަޅުގެ ތެރޭގައިވާ ކުދި ފަރެކެވެ (patch reef). coralline algae އިން ނިވާވެފައިވާ އޭގެ ފަރުމަތި، ނޫ ފެނަށް ސީދާ ފުންވެގެން ދެއެވެ. މިއީ 2016 ގެ ޖަނަވަރީގައި ފެށި ދިރާސާގެ ބޭސްލައިންގެ ފުރަތަމަ ކުއަޑްރެޓް (quadrat) ސައިޓެވެ. މިތާގައި Anderson ސާމްޕަލް ނެގި 15 ކޮލޯނީގެ ތެރެއިން 14 ކޮލޯނީ ސިއްޙަތު ރަނގަޅު ކަމަށާއި، އެއް ކޮލޯނީ 5-10% ބަލި ނުވަތަ ކުލަ މަޑު ކަމަށް ރެކޯޑްކުރިއެވެ. 14 ޖަނަވަރީގެ ފީނުމުގައި، އެއް crown-of-thorns ސްޓާފިޝް އާއި 5-10 Culcita ކުޝަން ސްޓާ (cushion star) ވެސް Anderson ފާހަގަކުރިއެވެ. ބައެއް ތަންތަނުގައި އެމީހުން ކާފައިވާ ގެއްލުން ފުޅާކޮށް ހުރިއެވެ. El Niño ގެ އެންމެ ގަދަ ހިނދުގައި، 2016 ގެ އޭޕްރީލްގައި ކުރި ދެވަނަ ސާވޭ ވަންދެން، މިތާގެ ފަހެއްގެ ތެރެއިން ހަތަރު ކޮލޯނީ ހުދުވެފައި ހުއްޓެވެ.
AI translation of this summary; the English is authoritative. (low confidence)
Four independent survey stations shown with the program’s logo — click one to see how far it is from this site.
Seven other CRD dive sites with their own pages within 5 km shown in orange — click a marker to open its page.
14 of the 37 photographs on this page are shown beside the text that discusses them under "Site description" below.
Site description
Setting
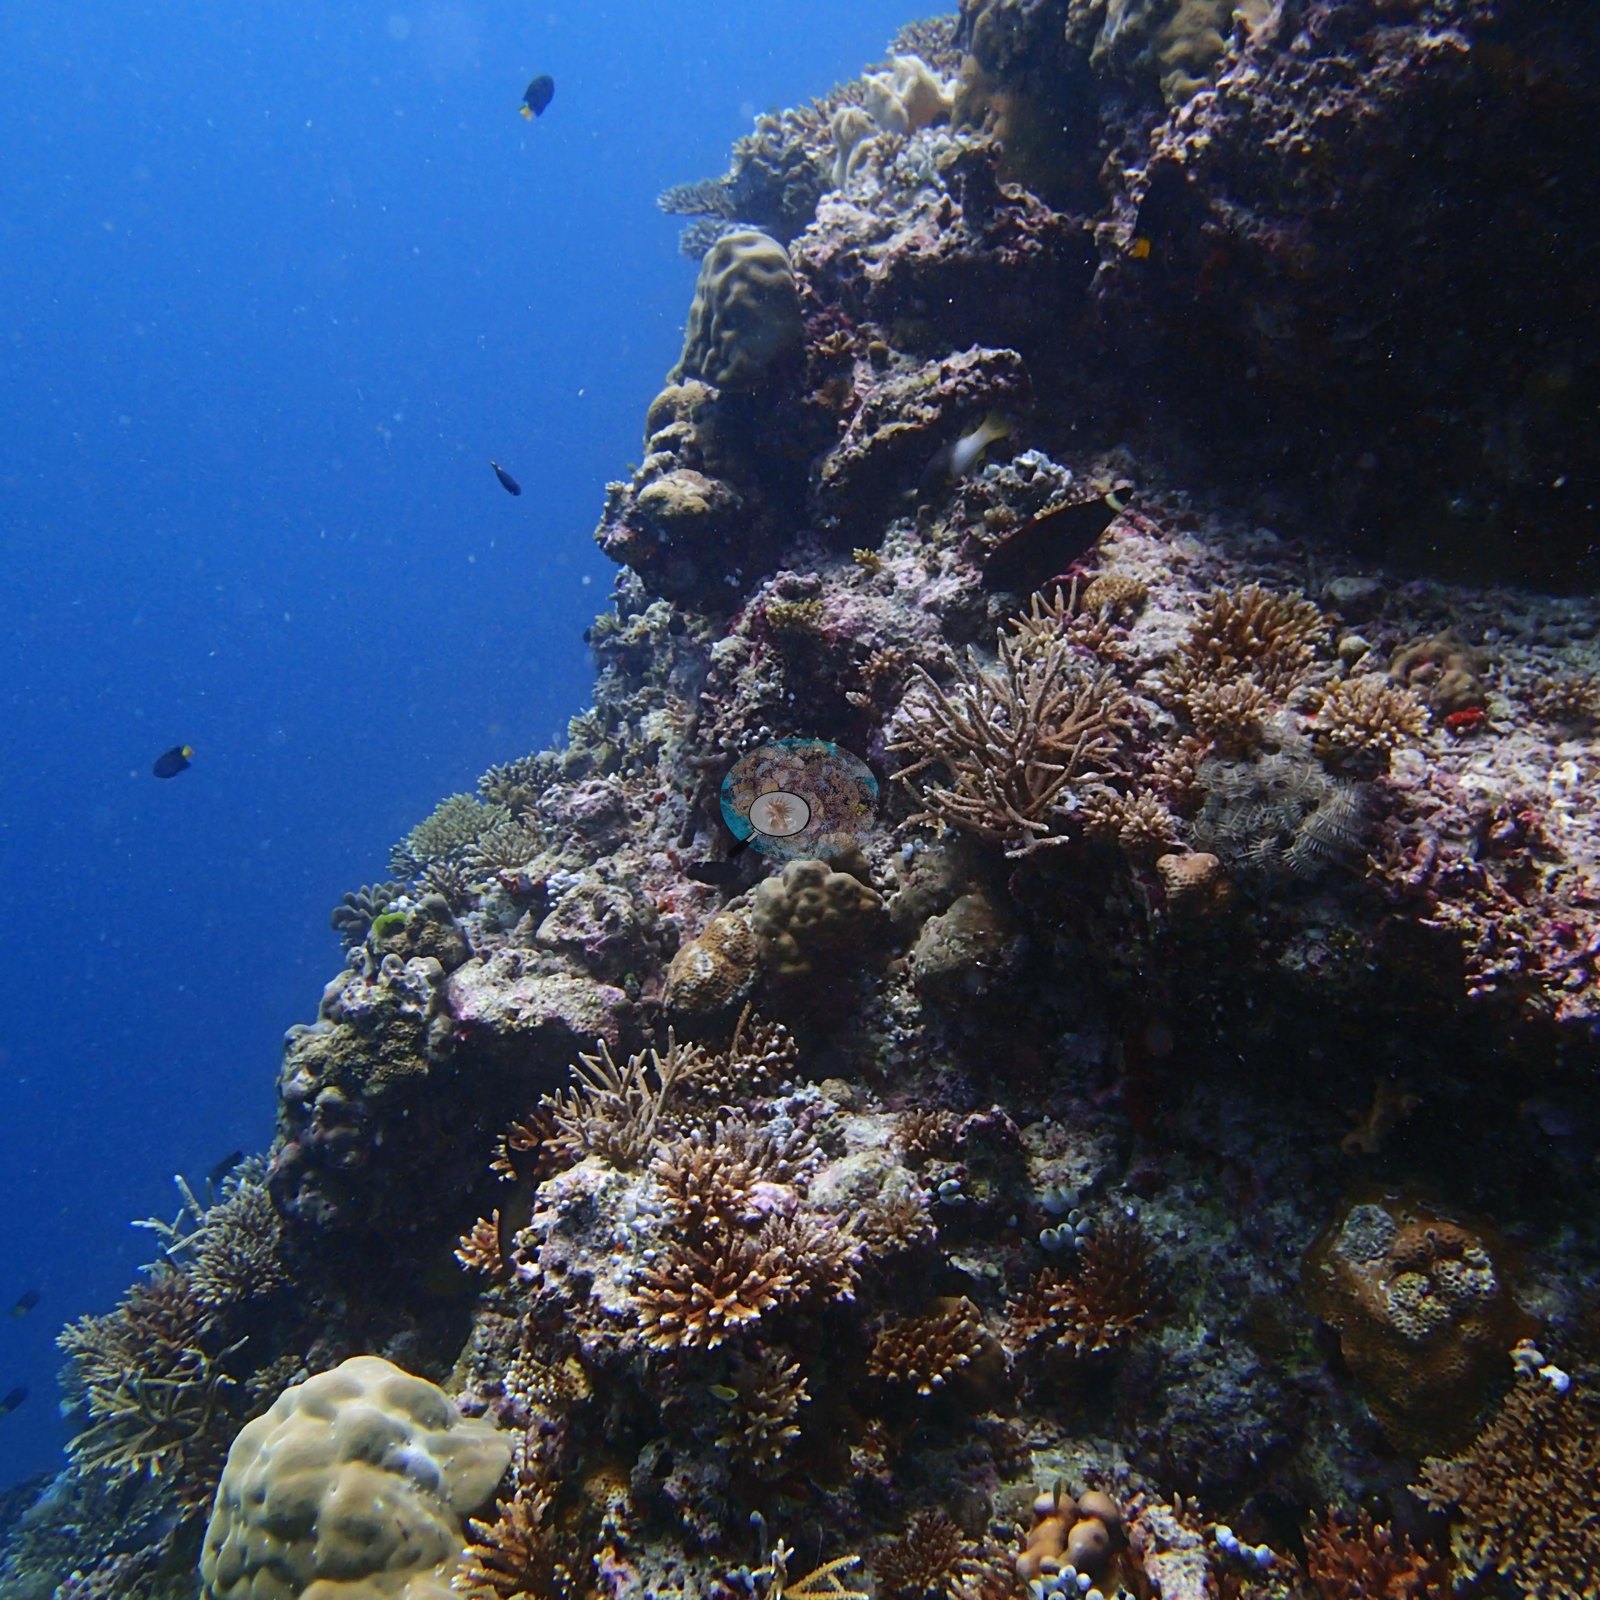
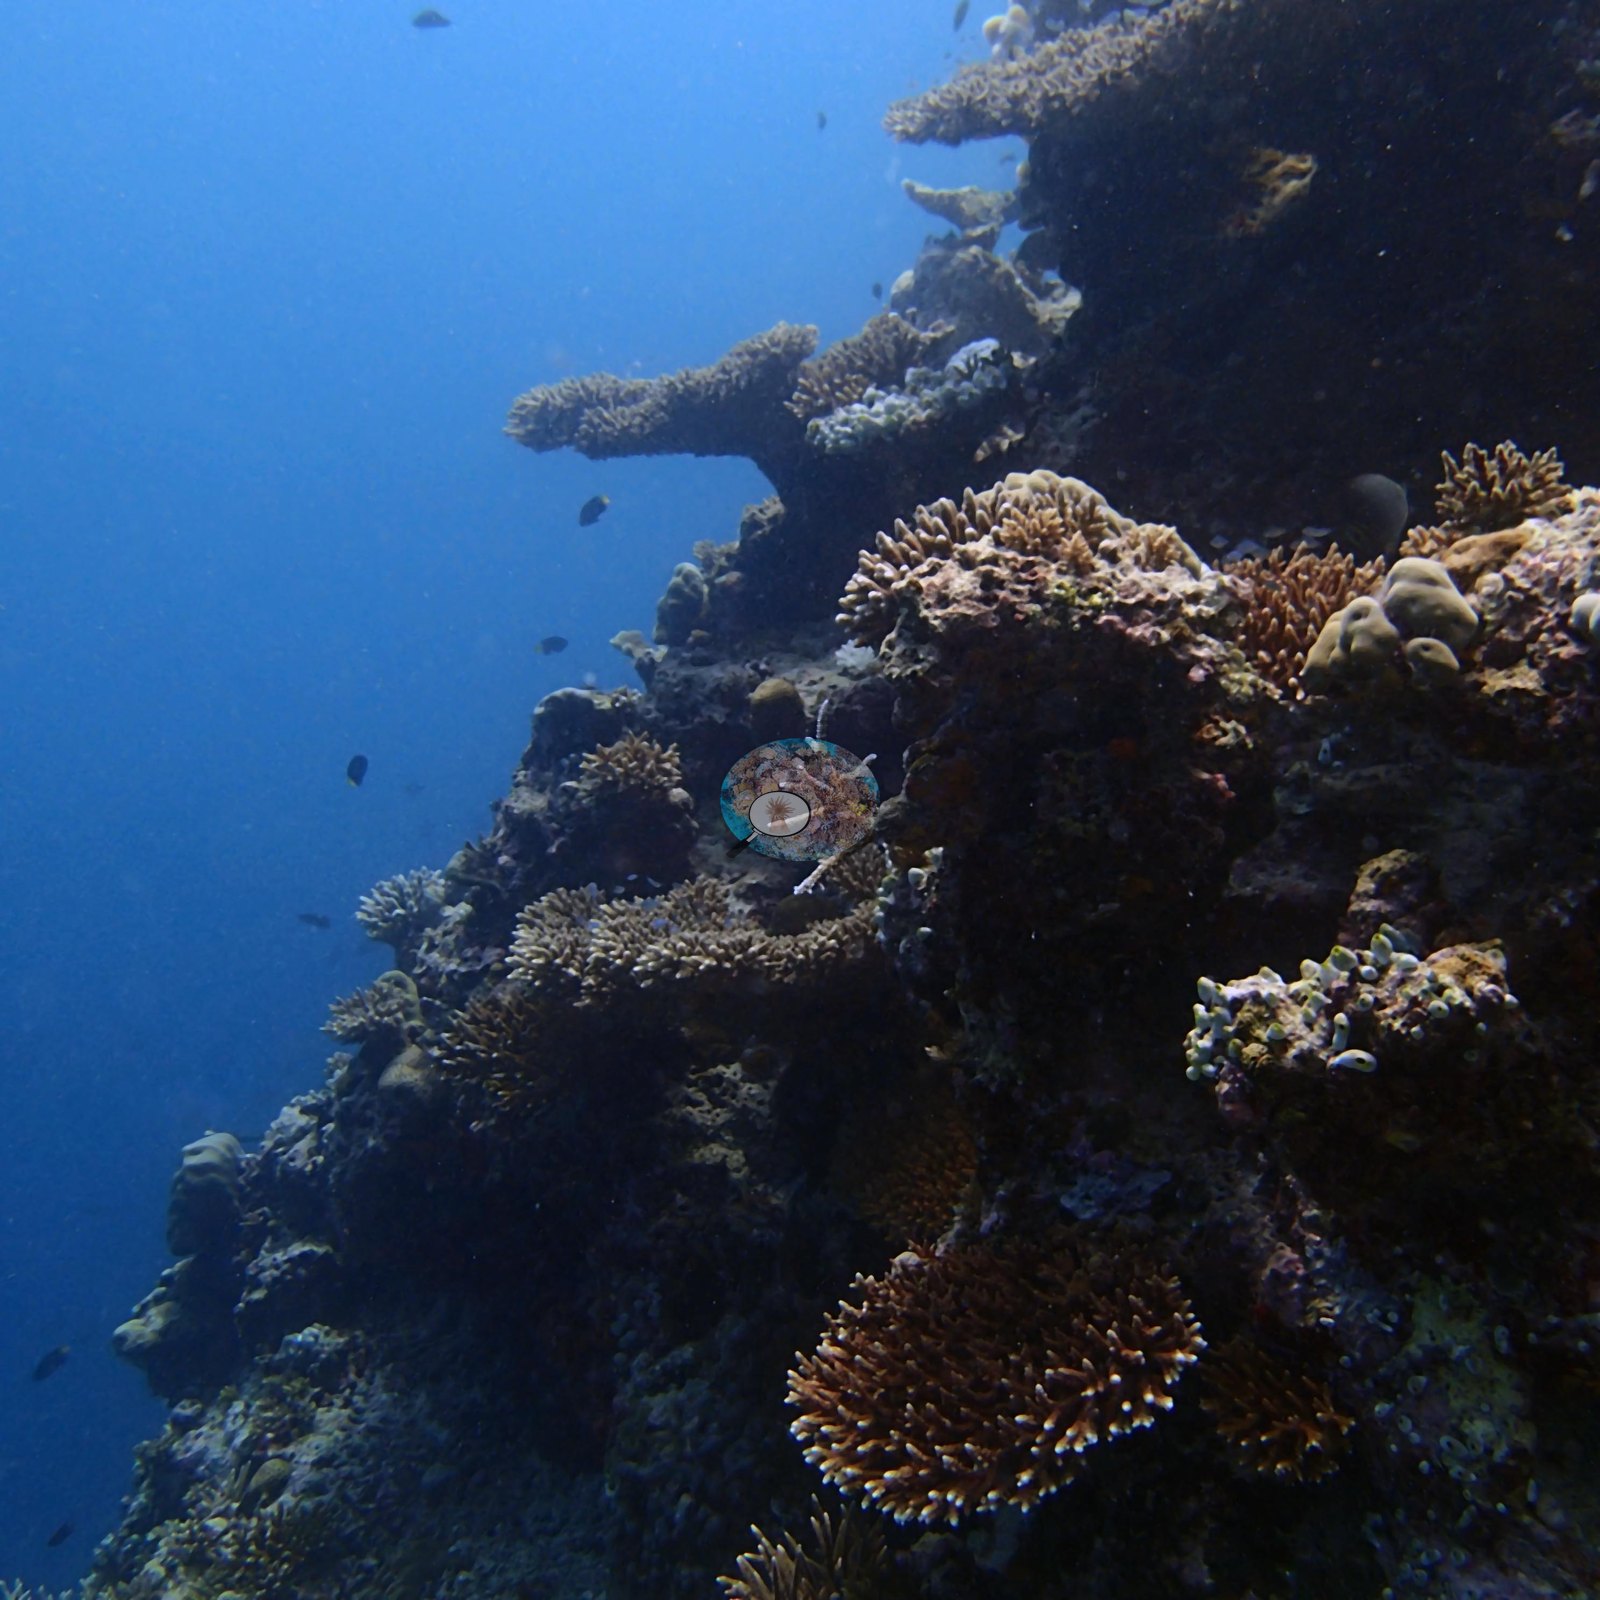
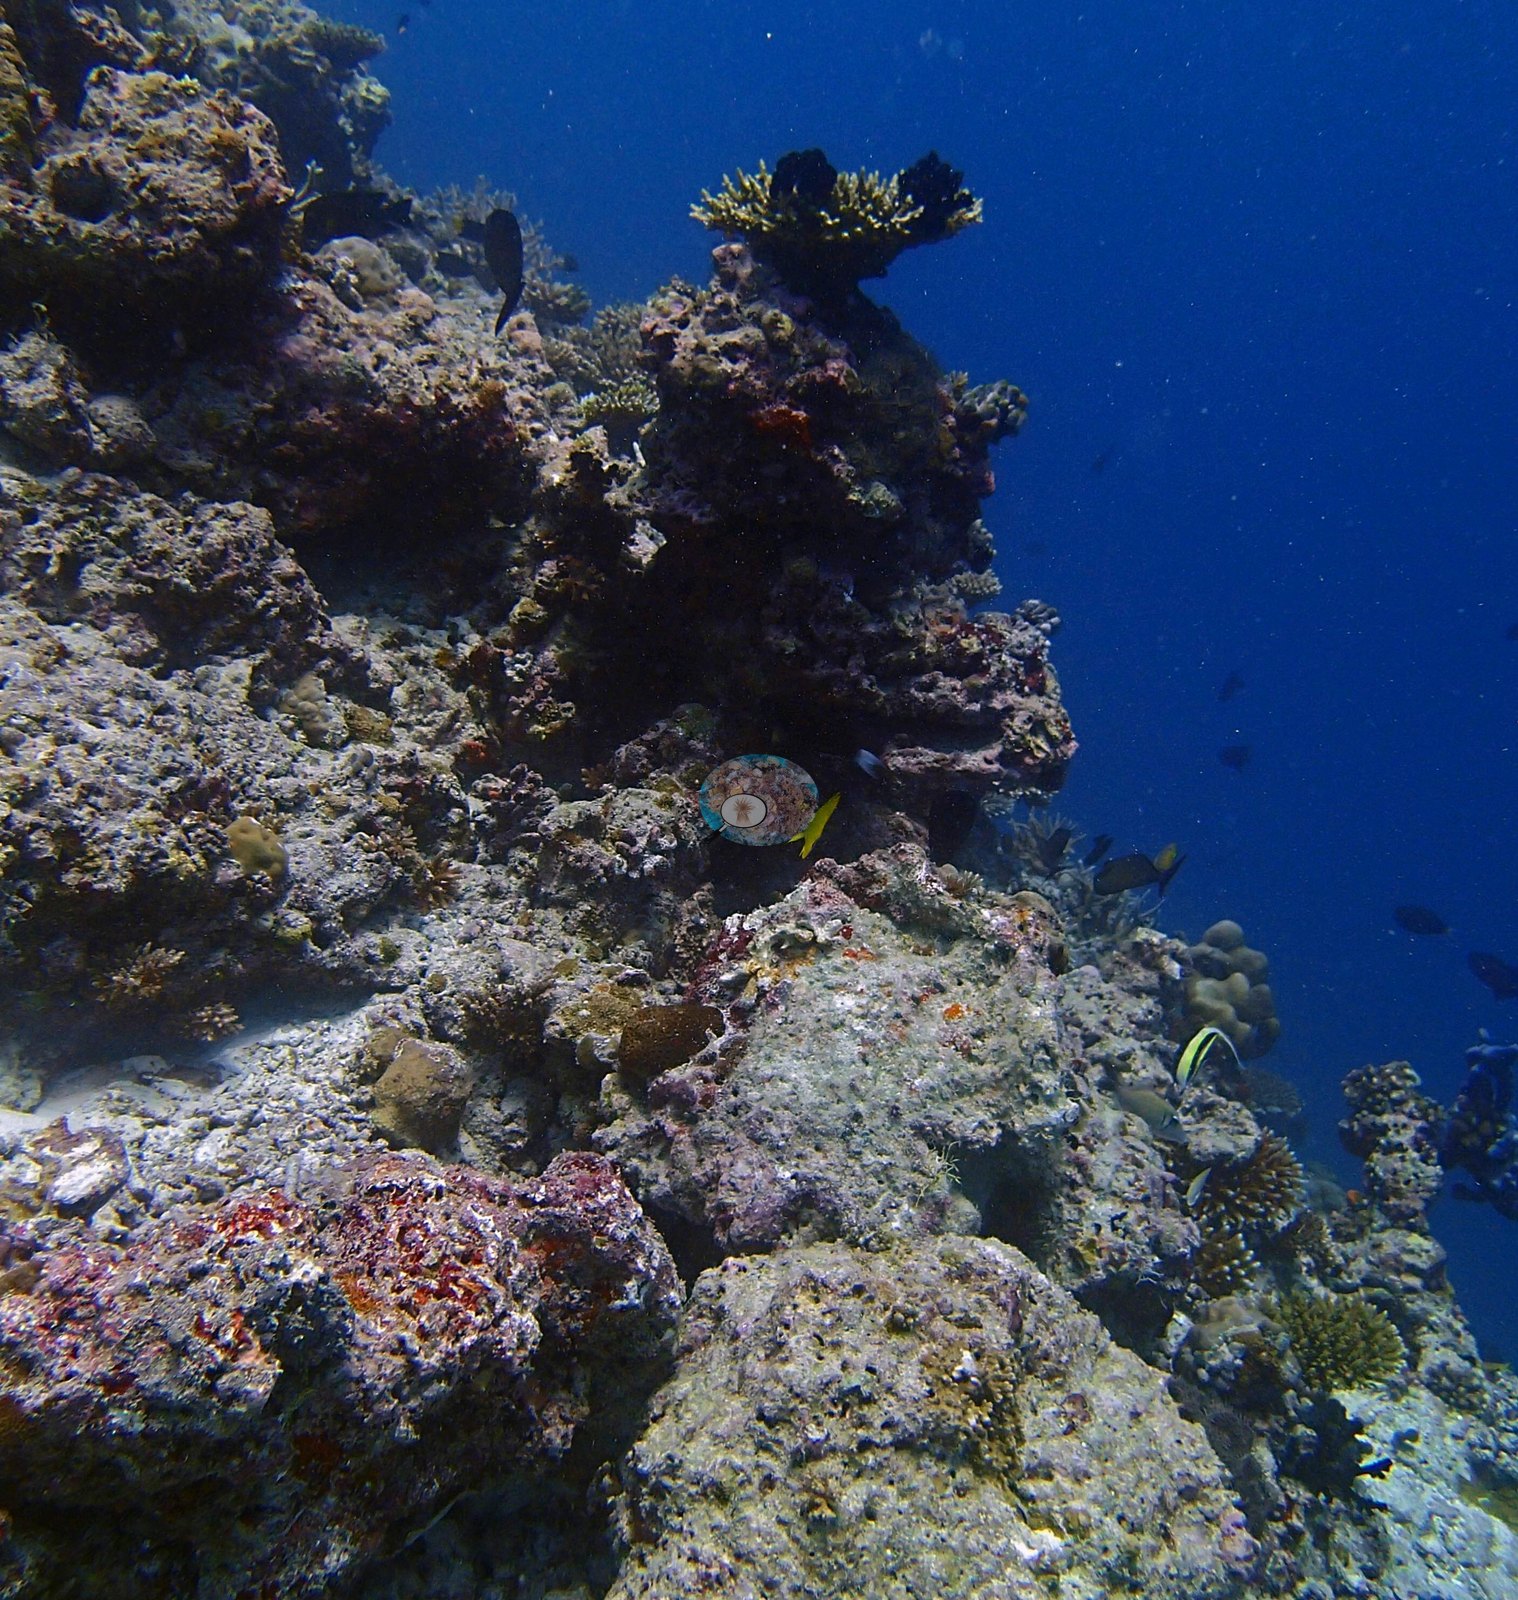
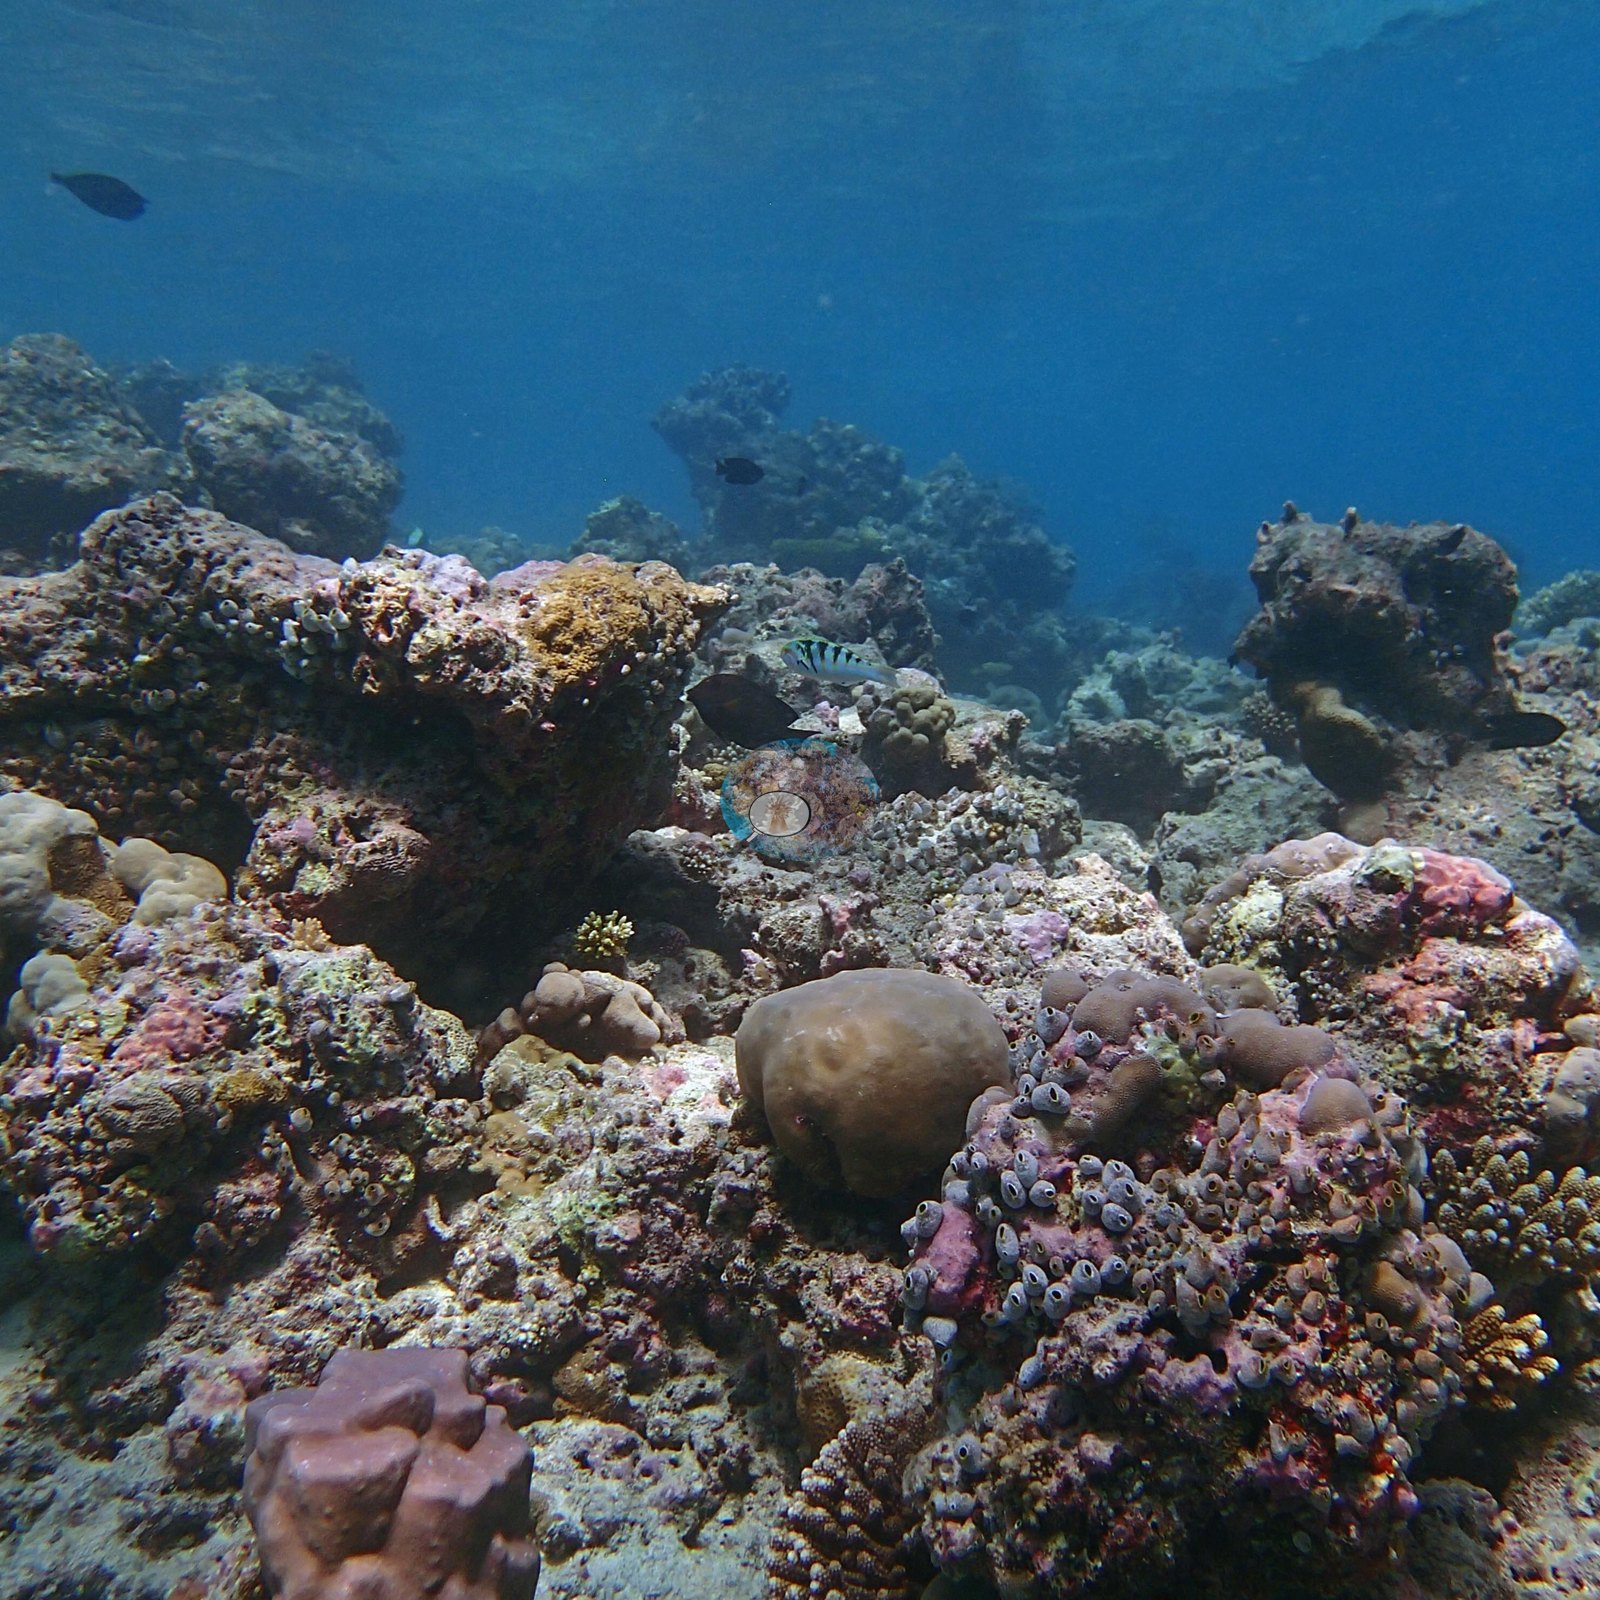
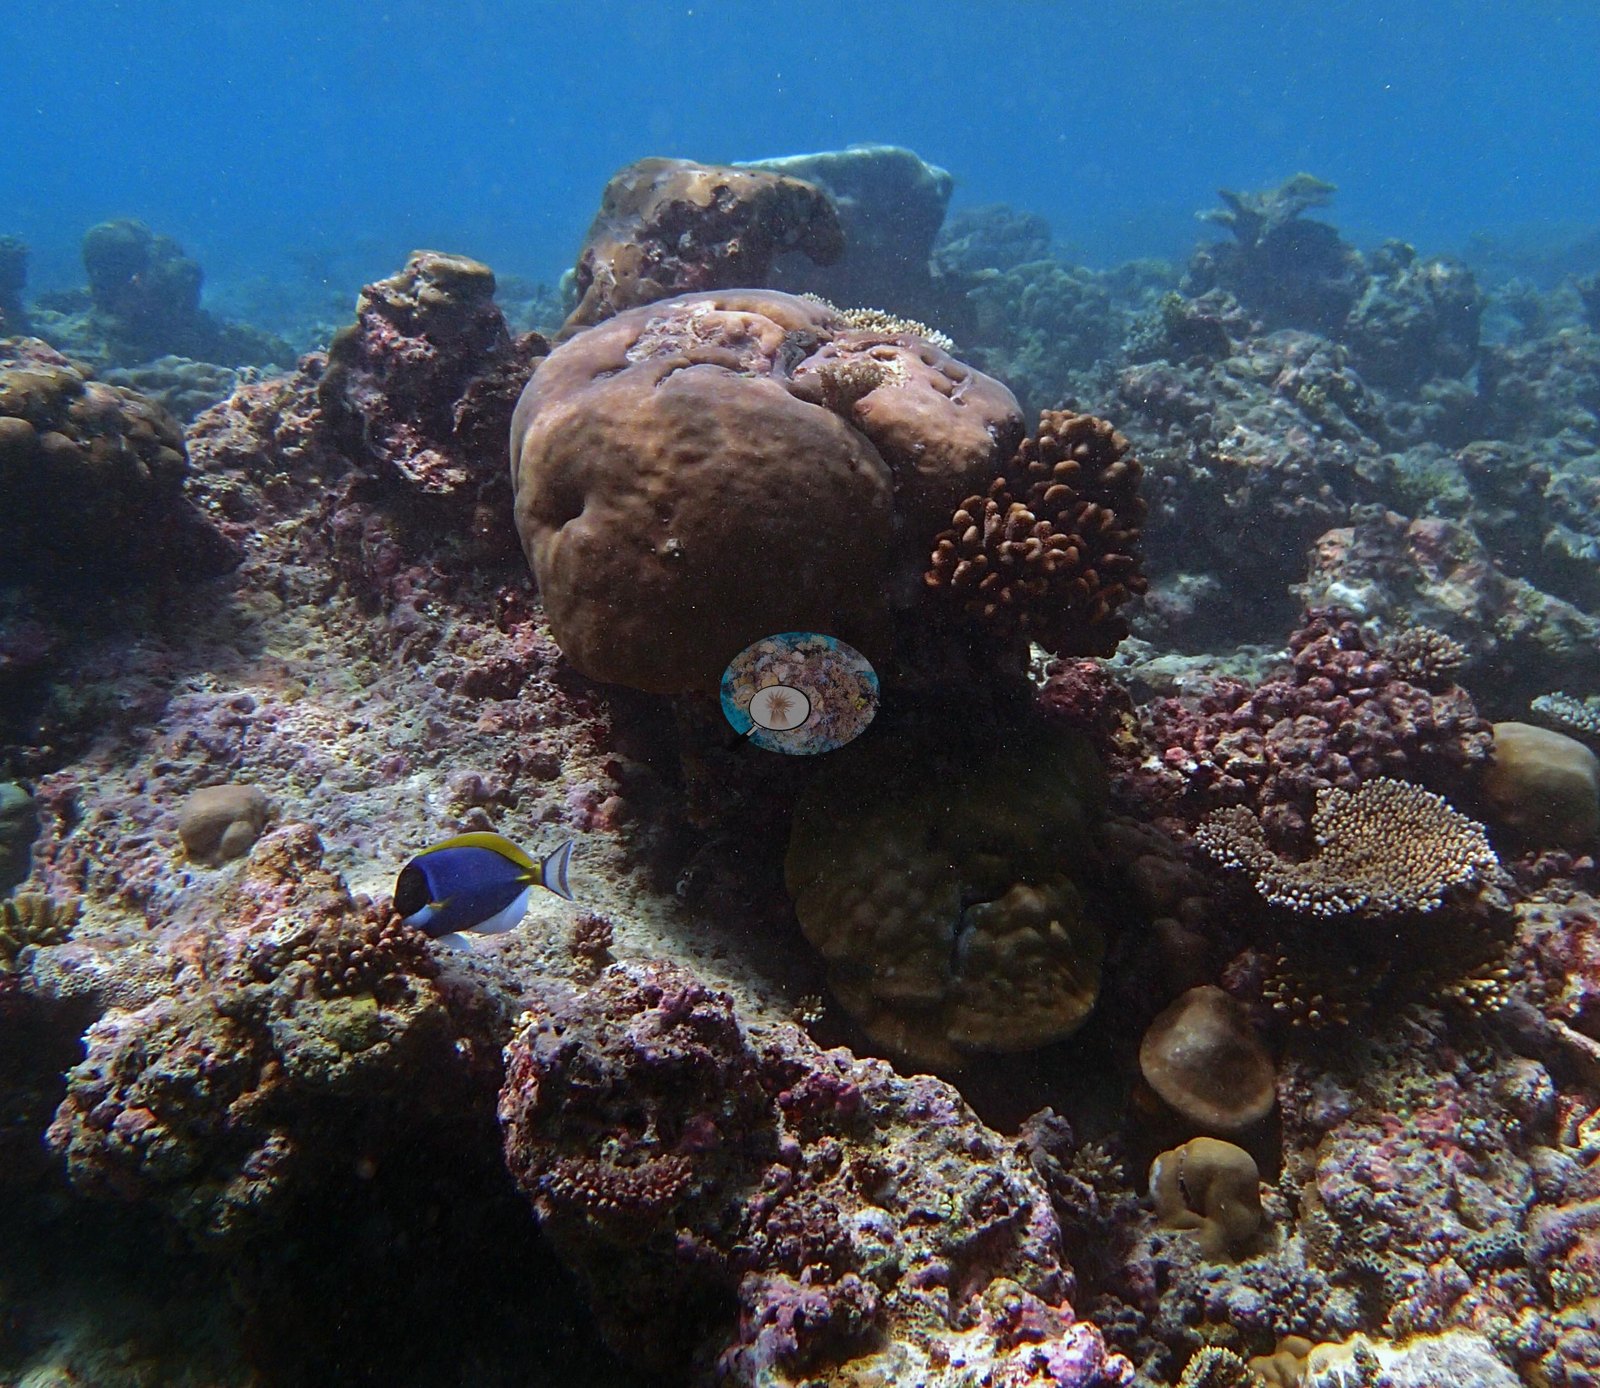
A leeward lagoonal patch reef in the interior of South Male Atoll, its hard-pavement top rolling over into a steep slope of blue water — and the first quadrat site of the January 2016 research baseline (e.g., Image 25).
General benthic features
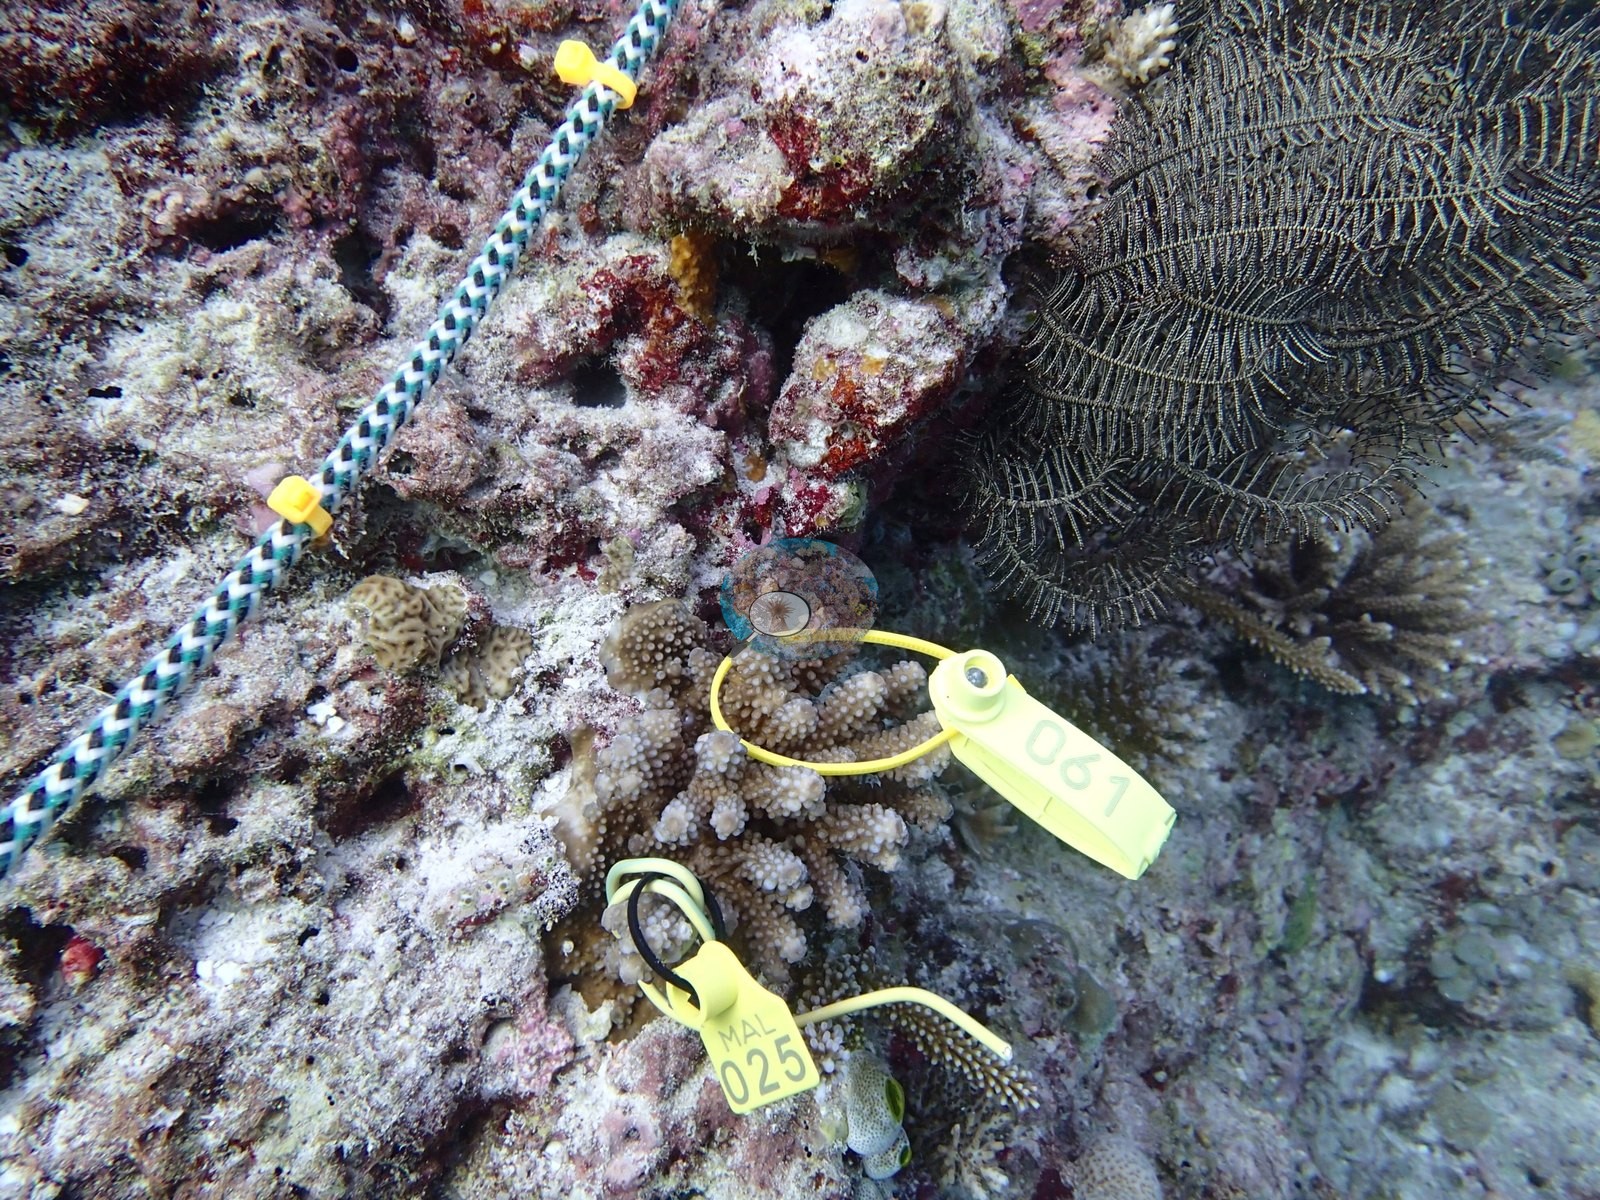
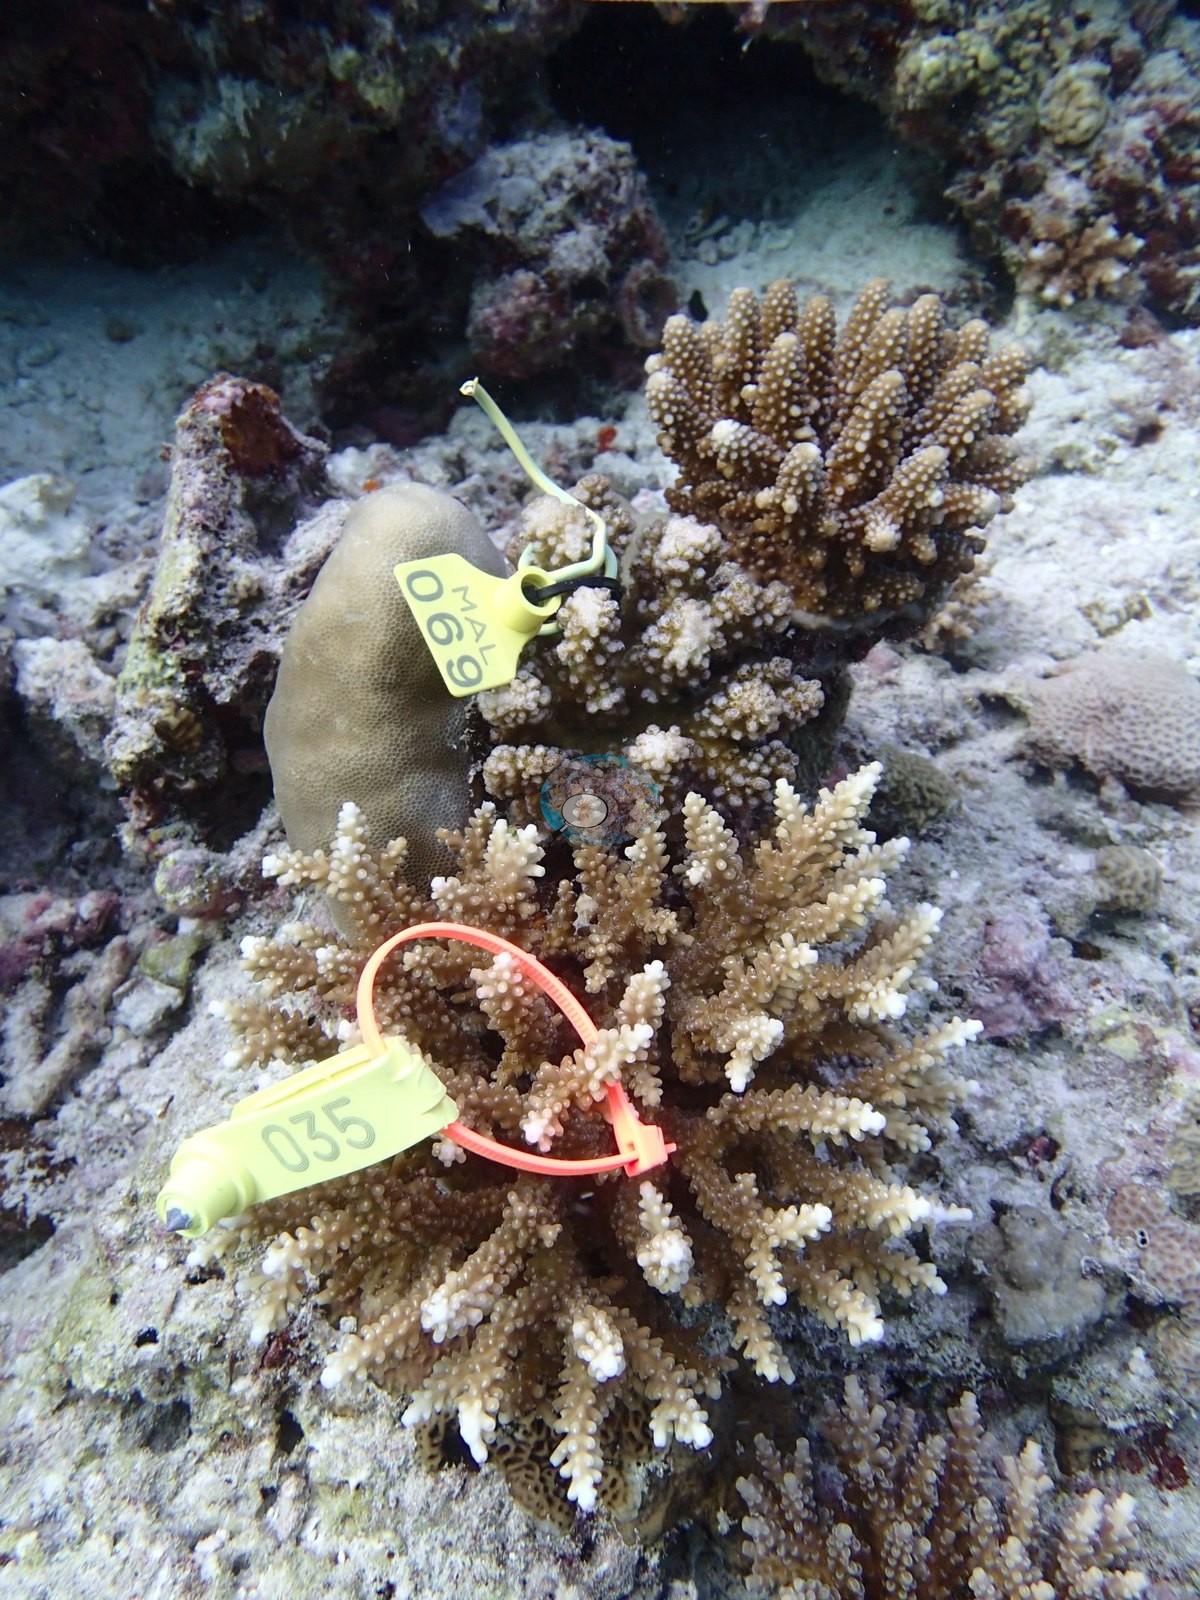
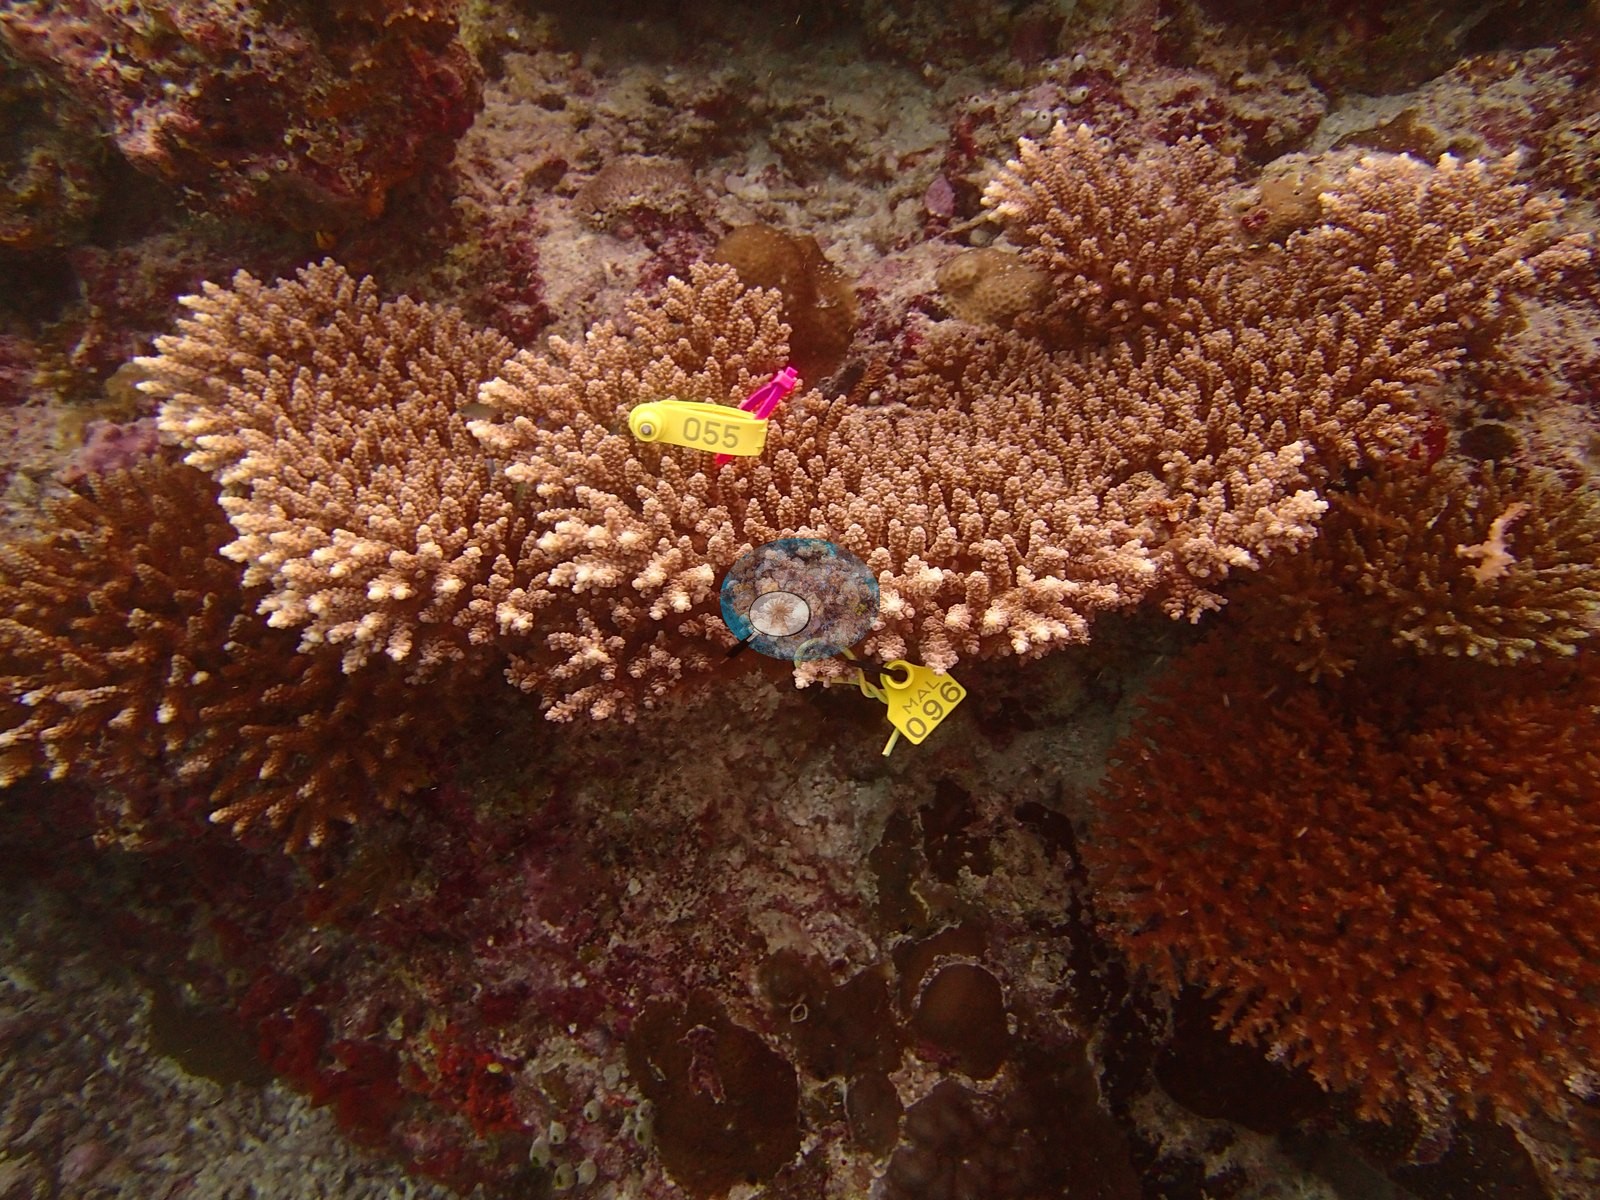
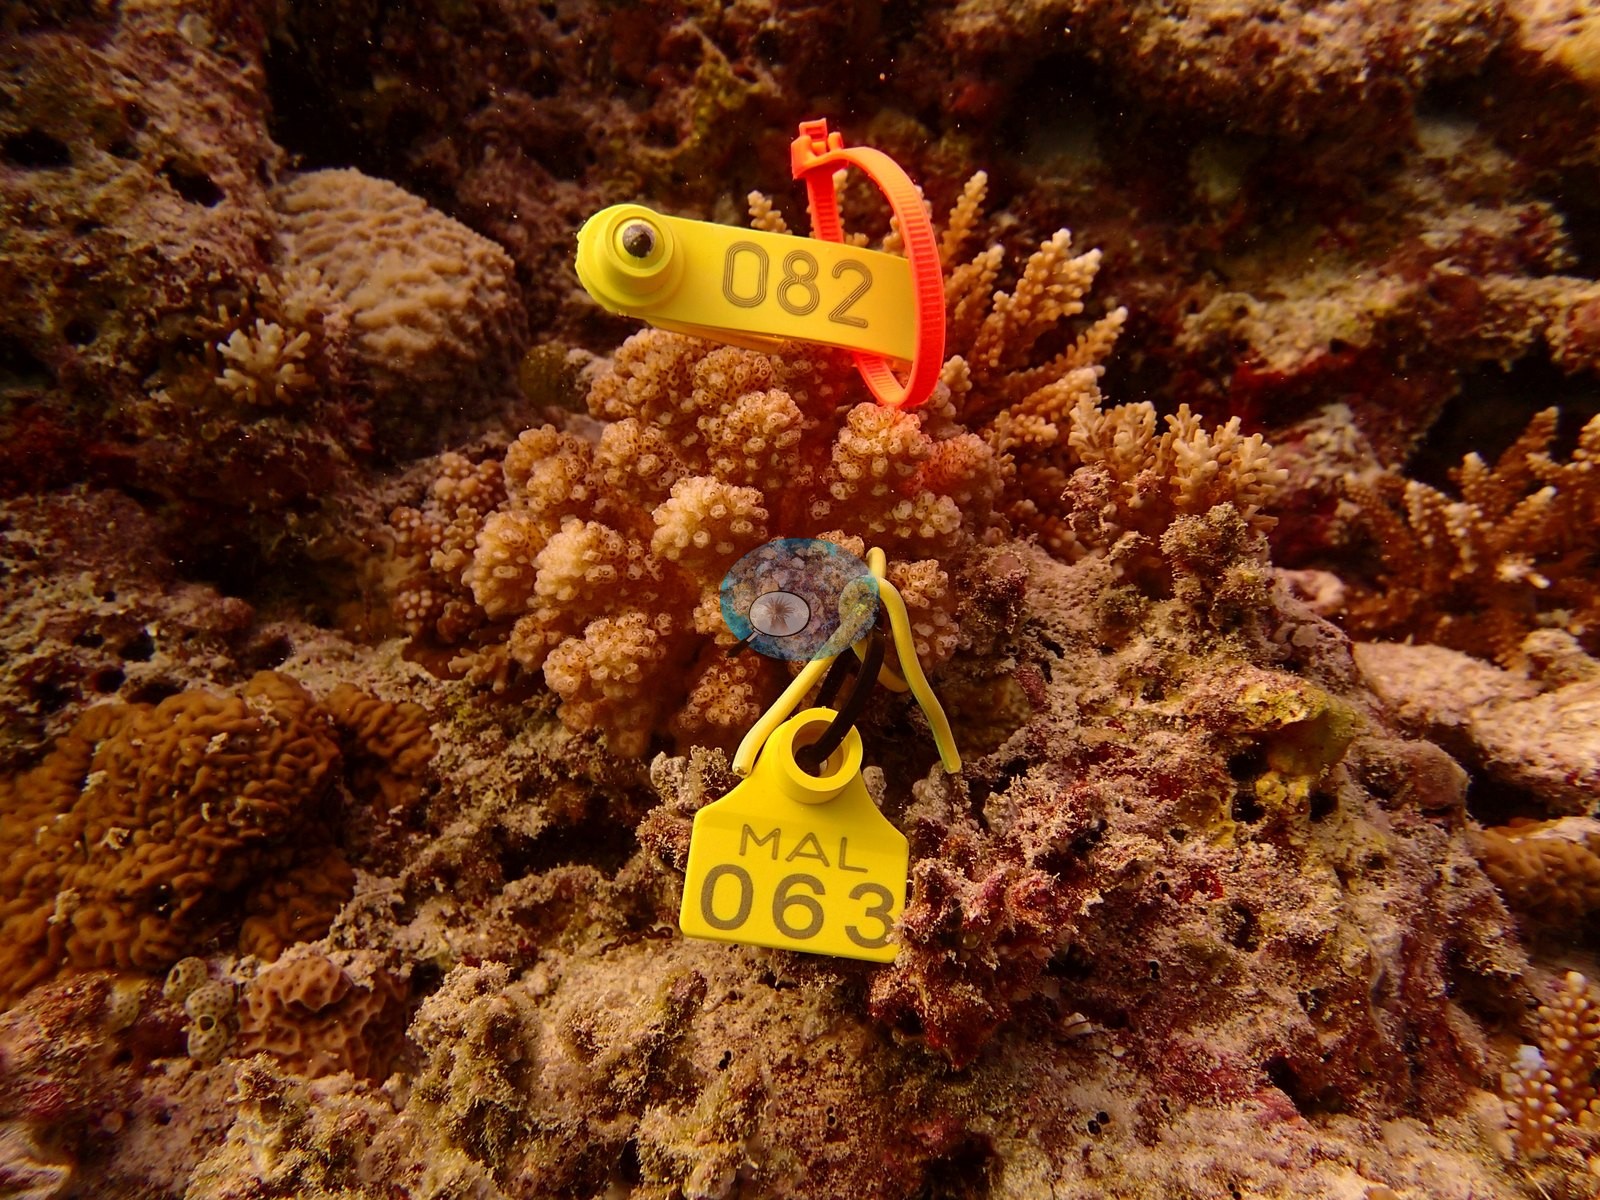
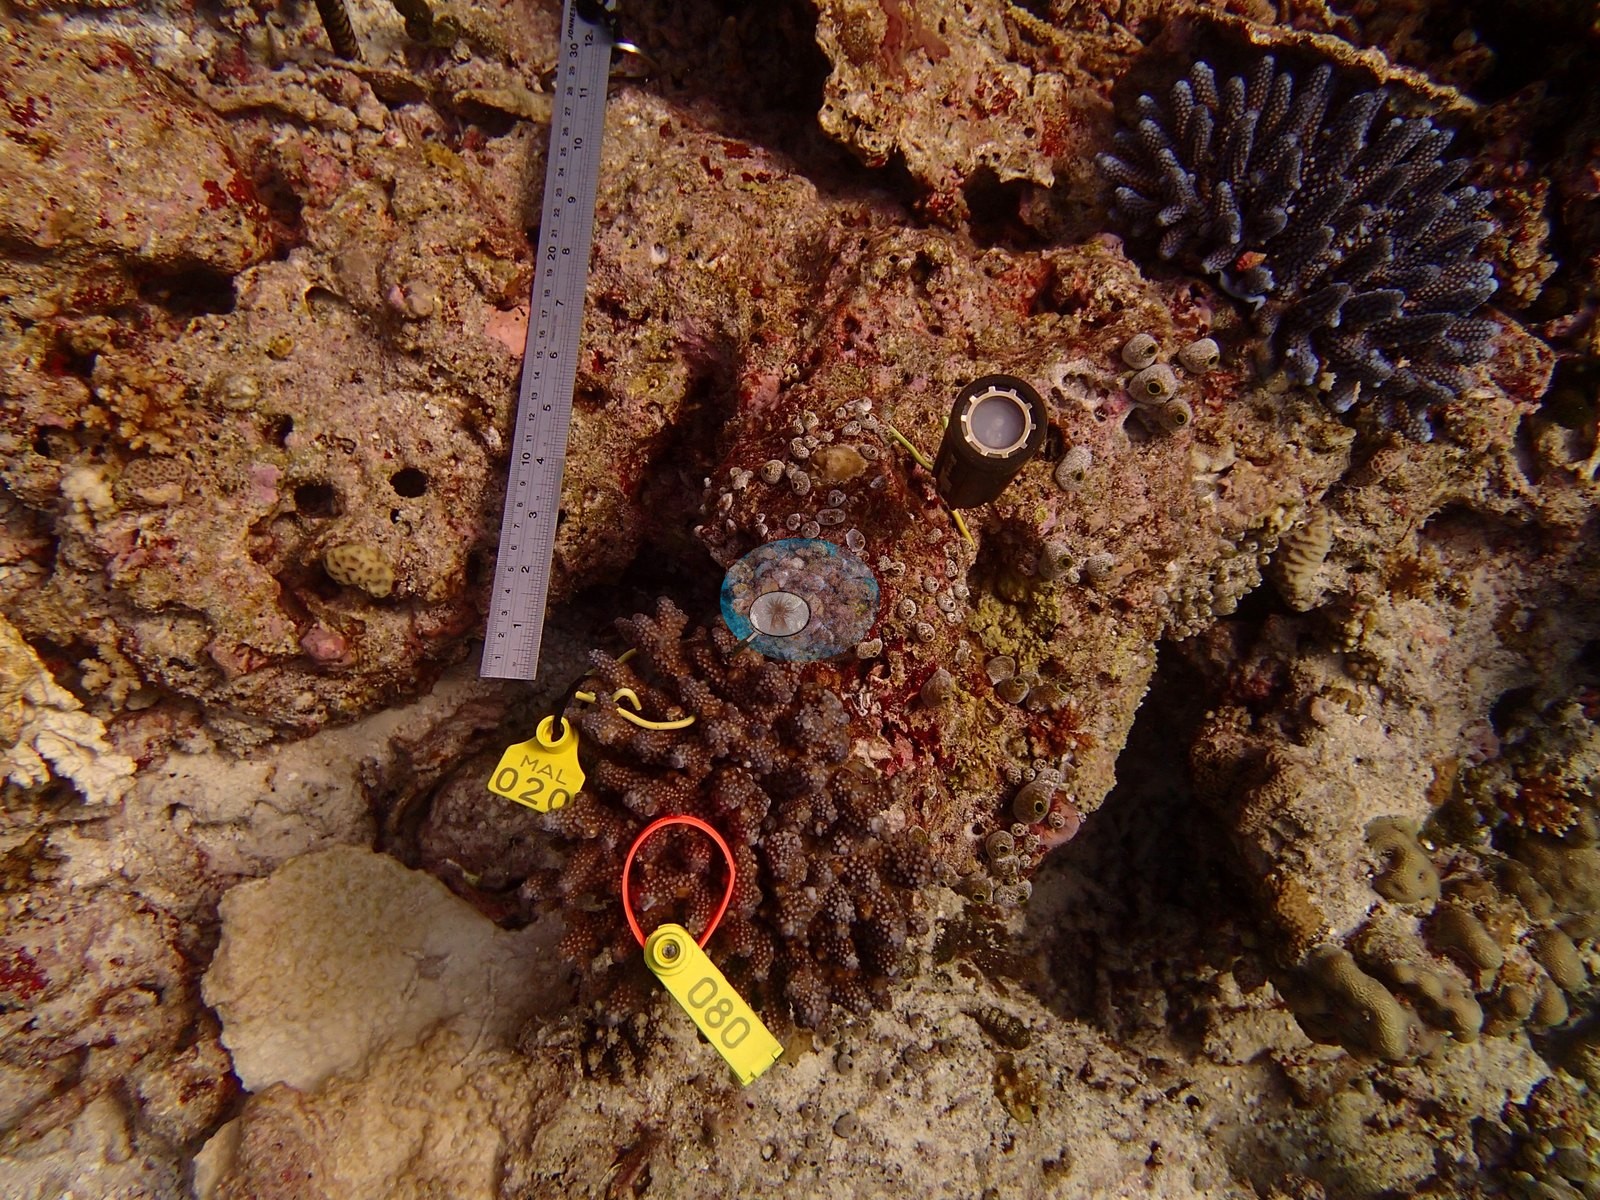
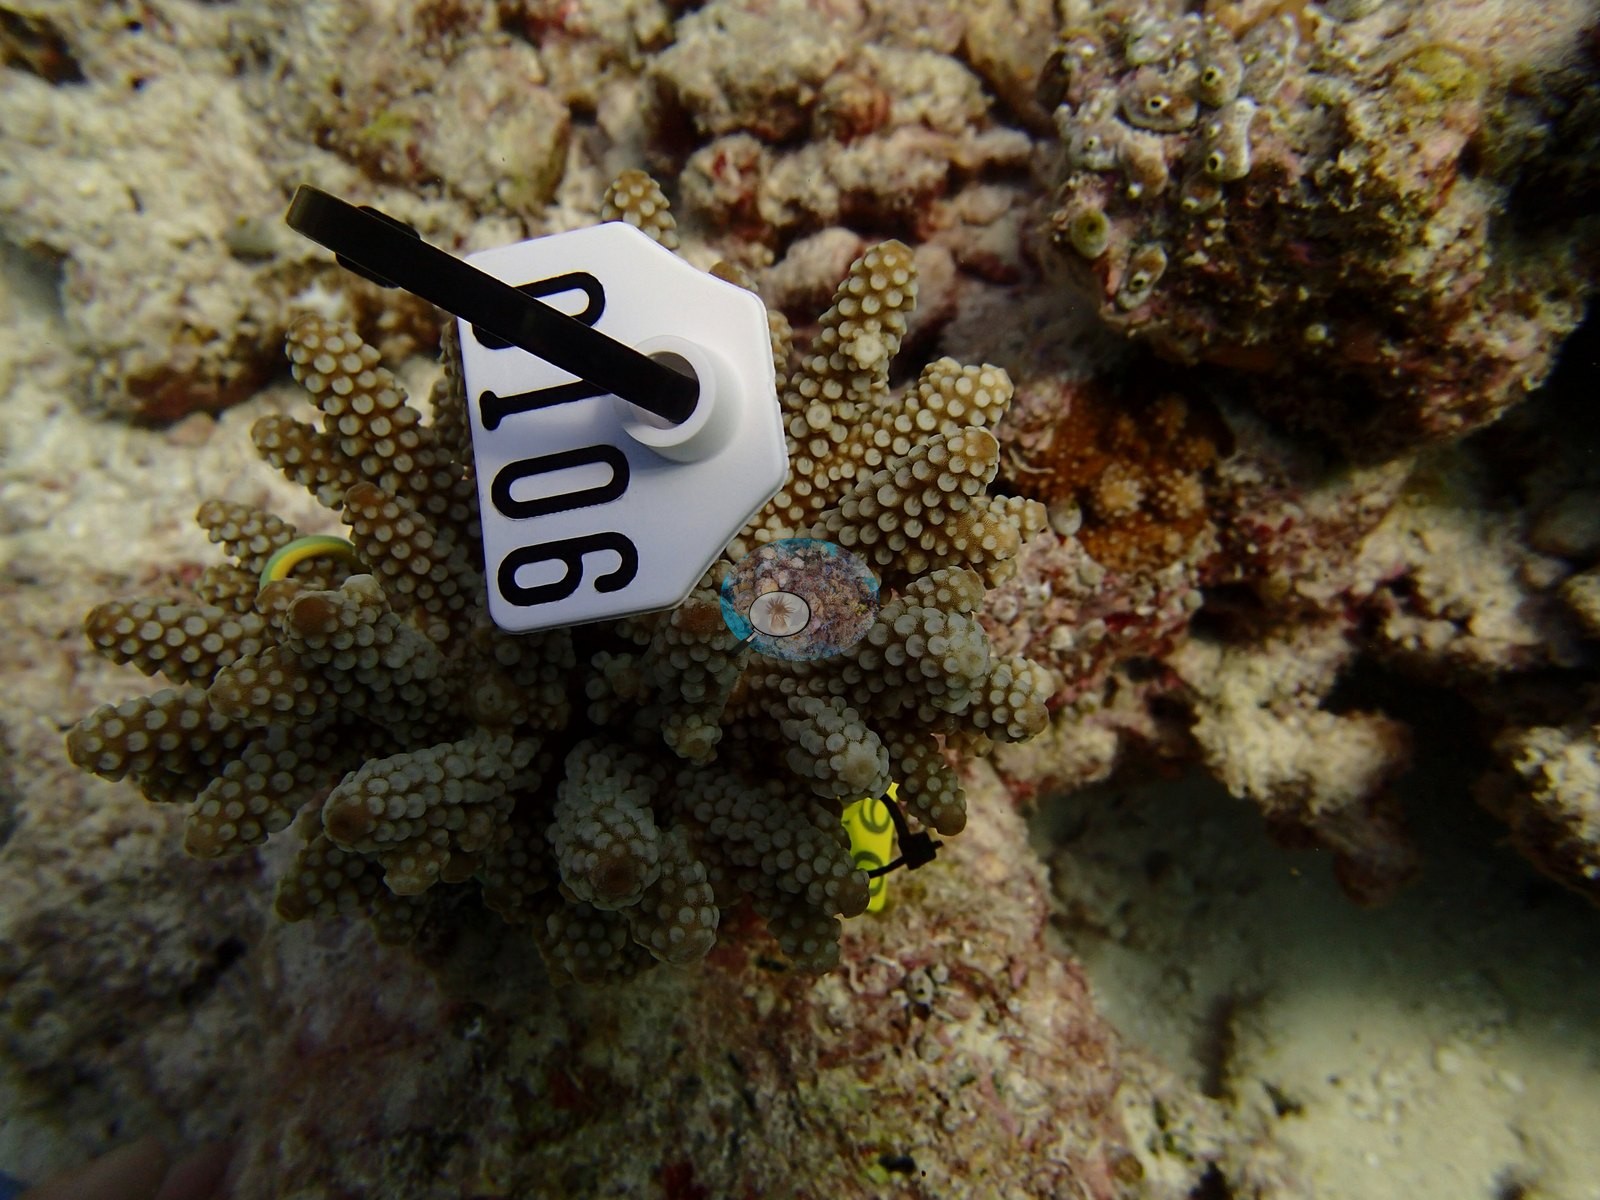
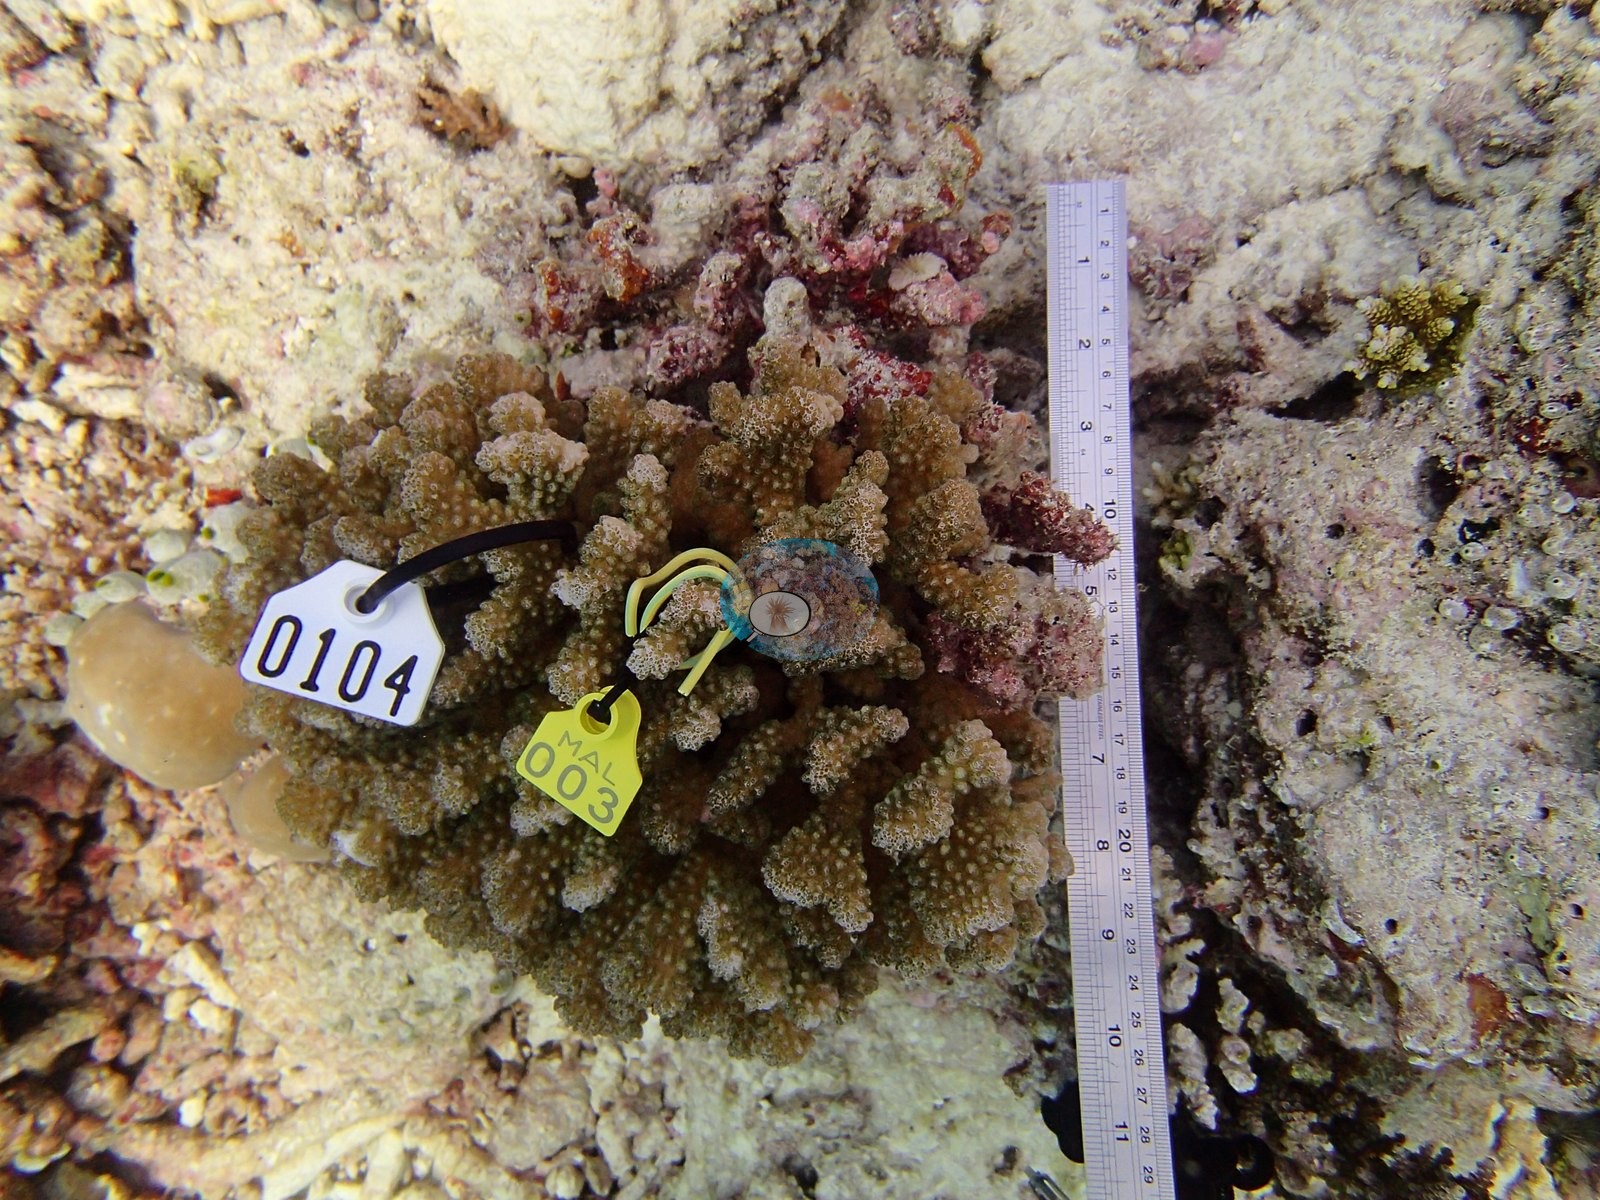
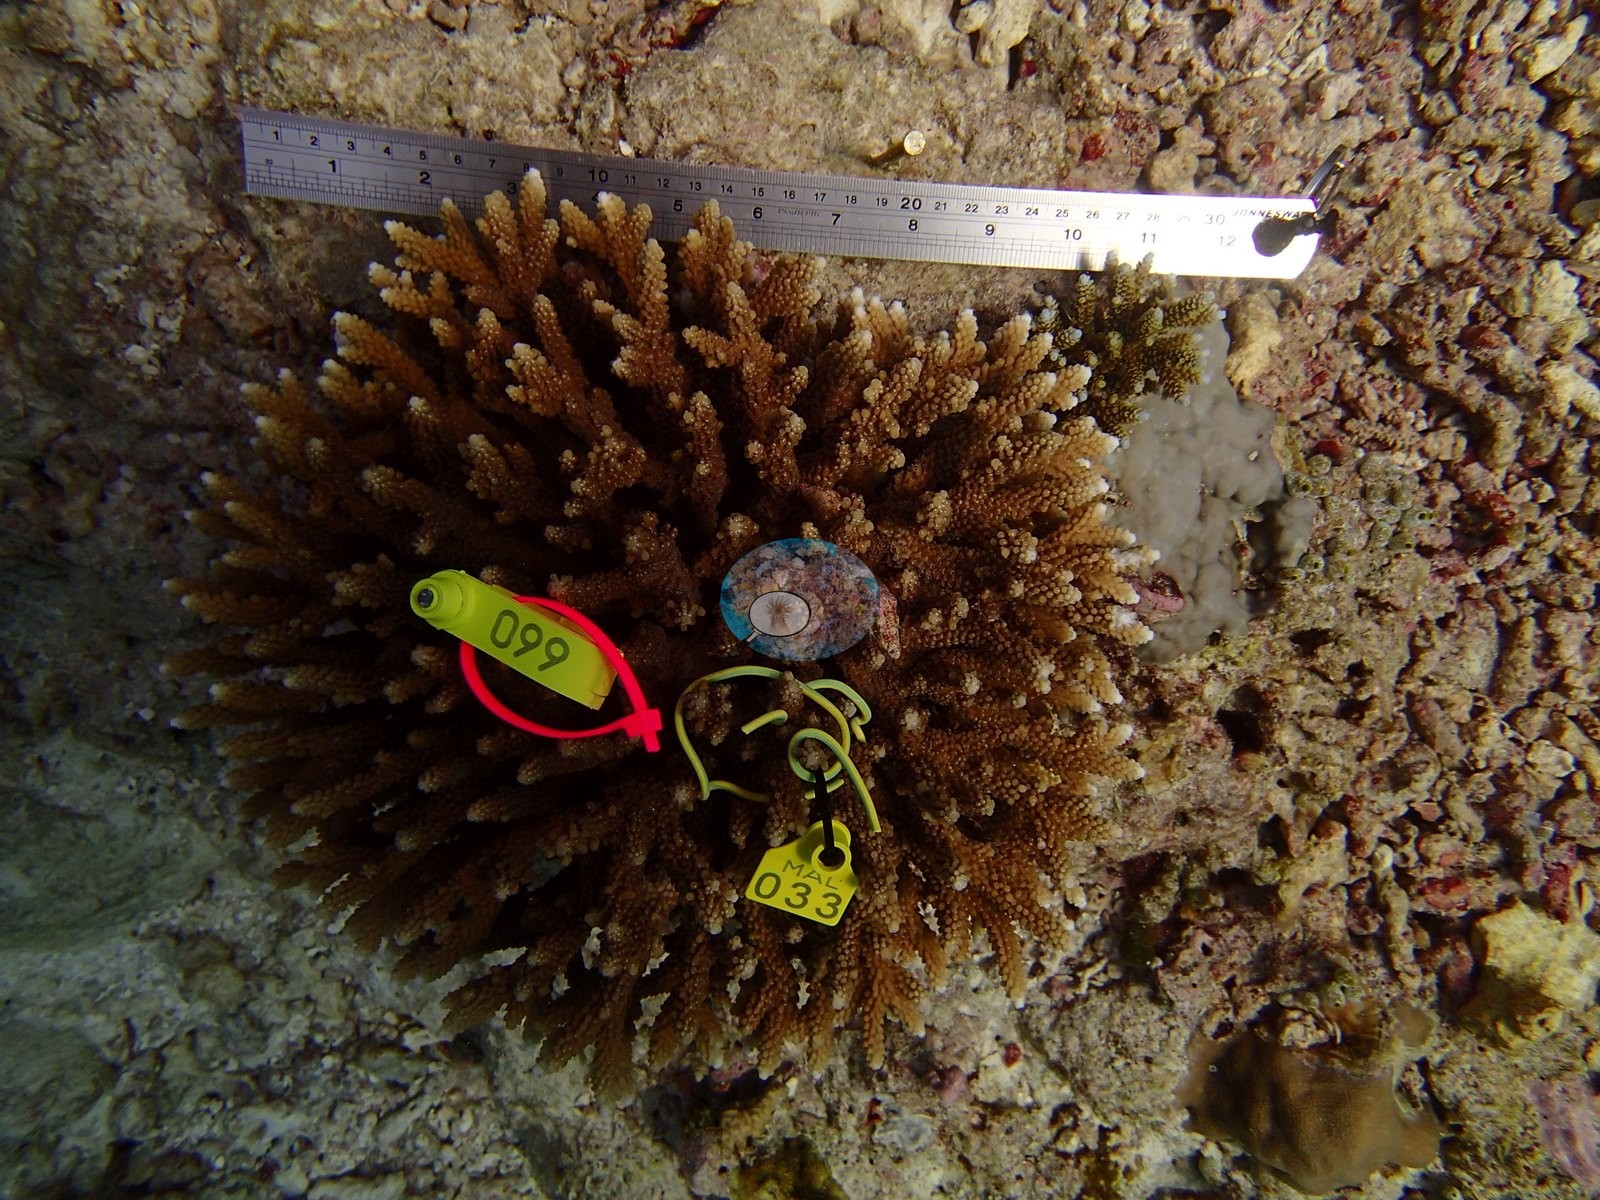
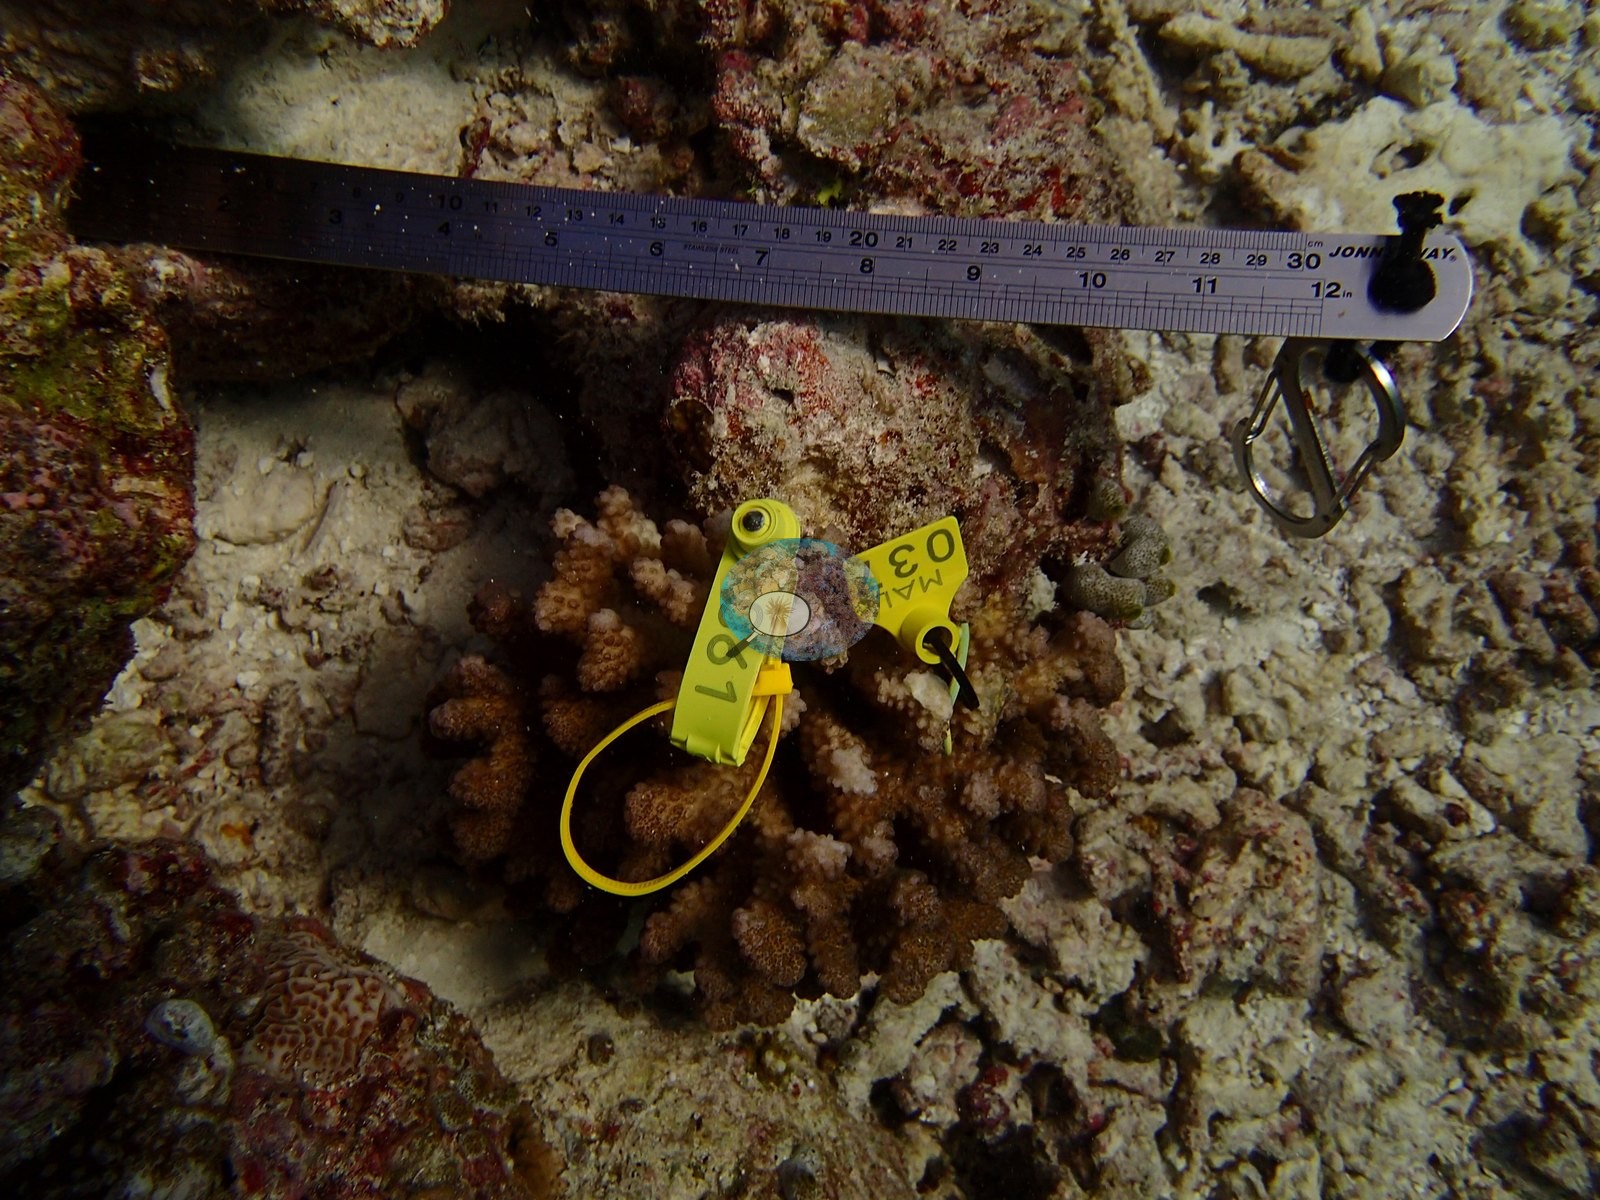
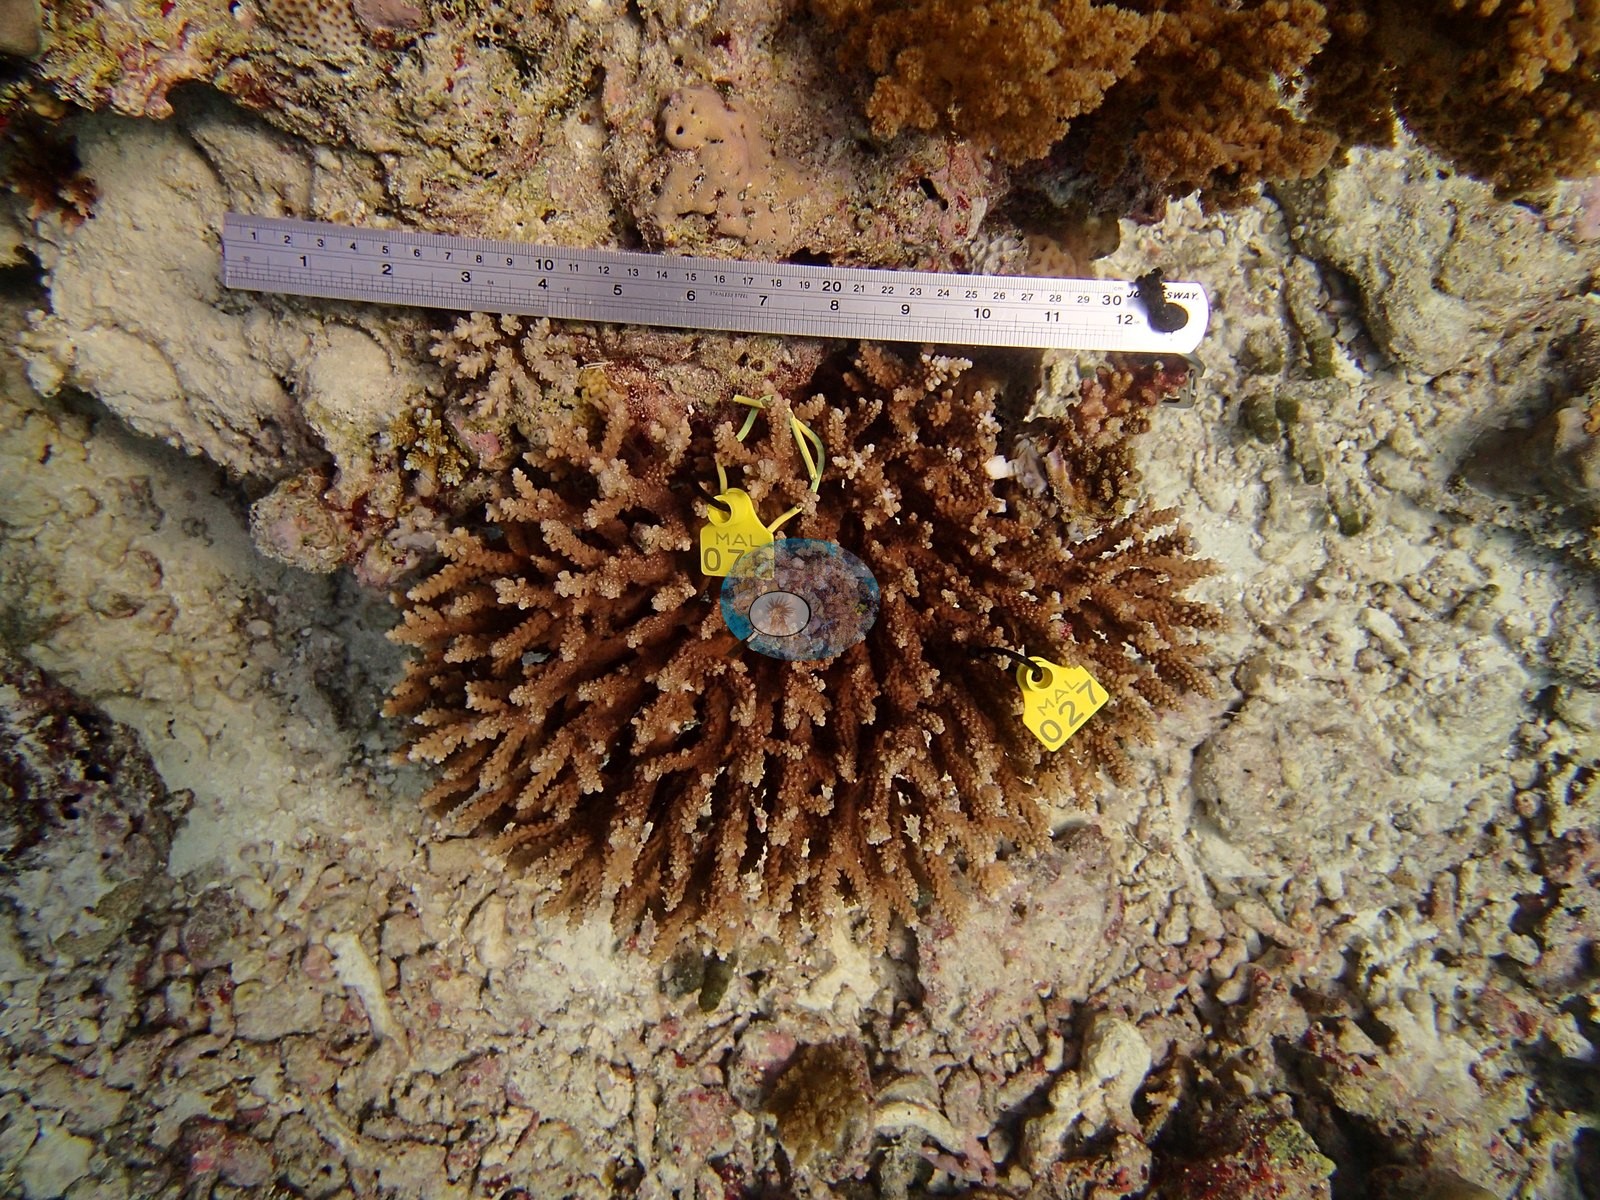
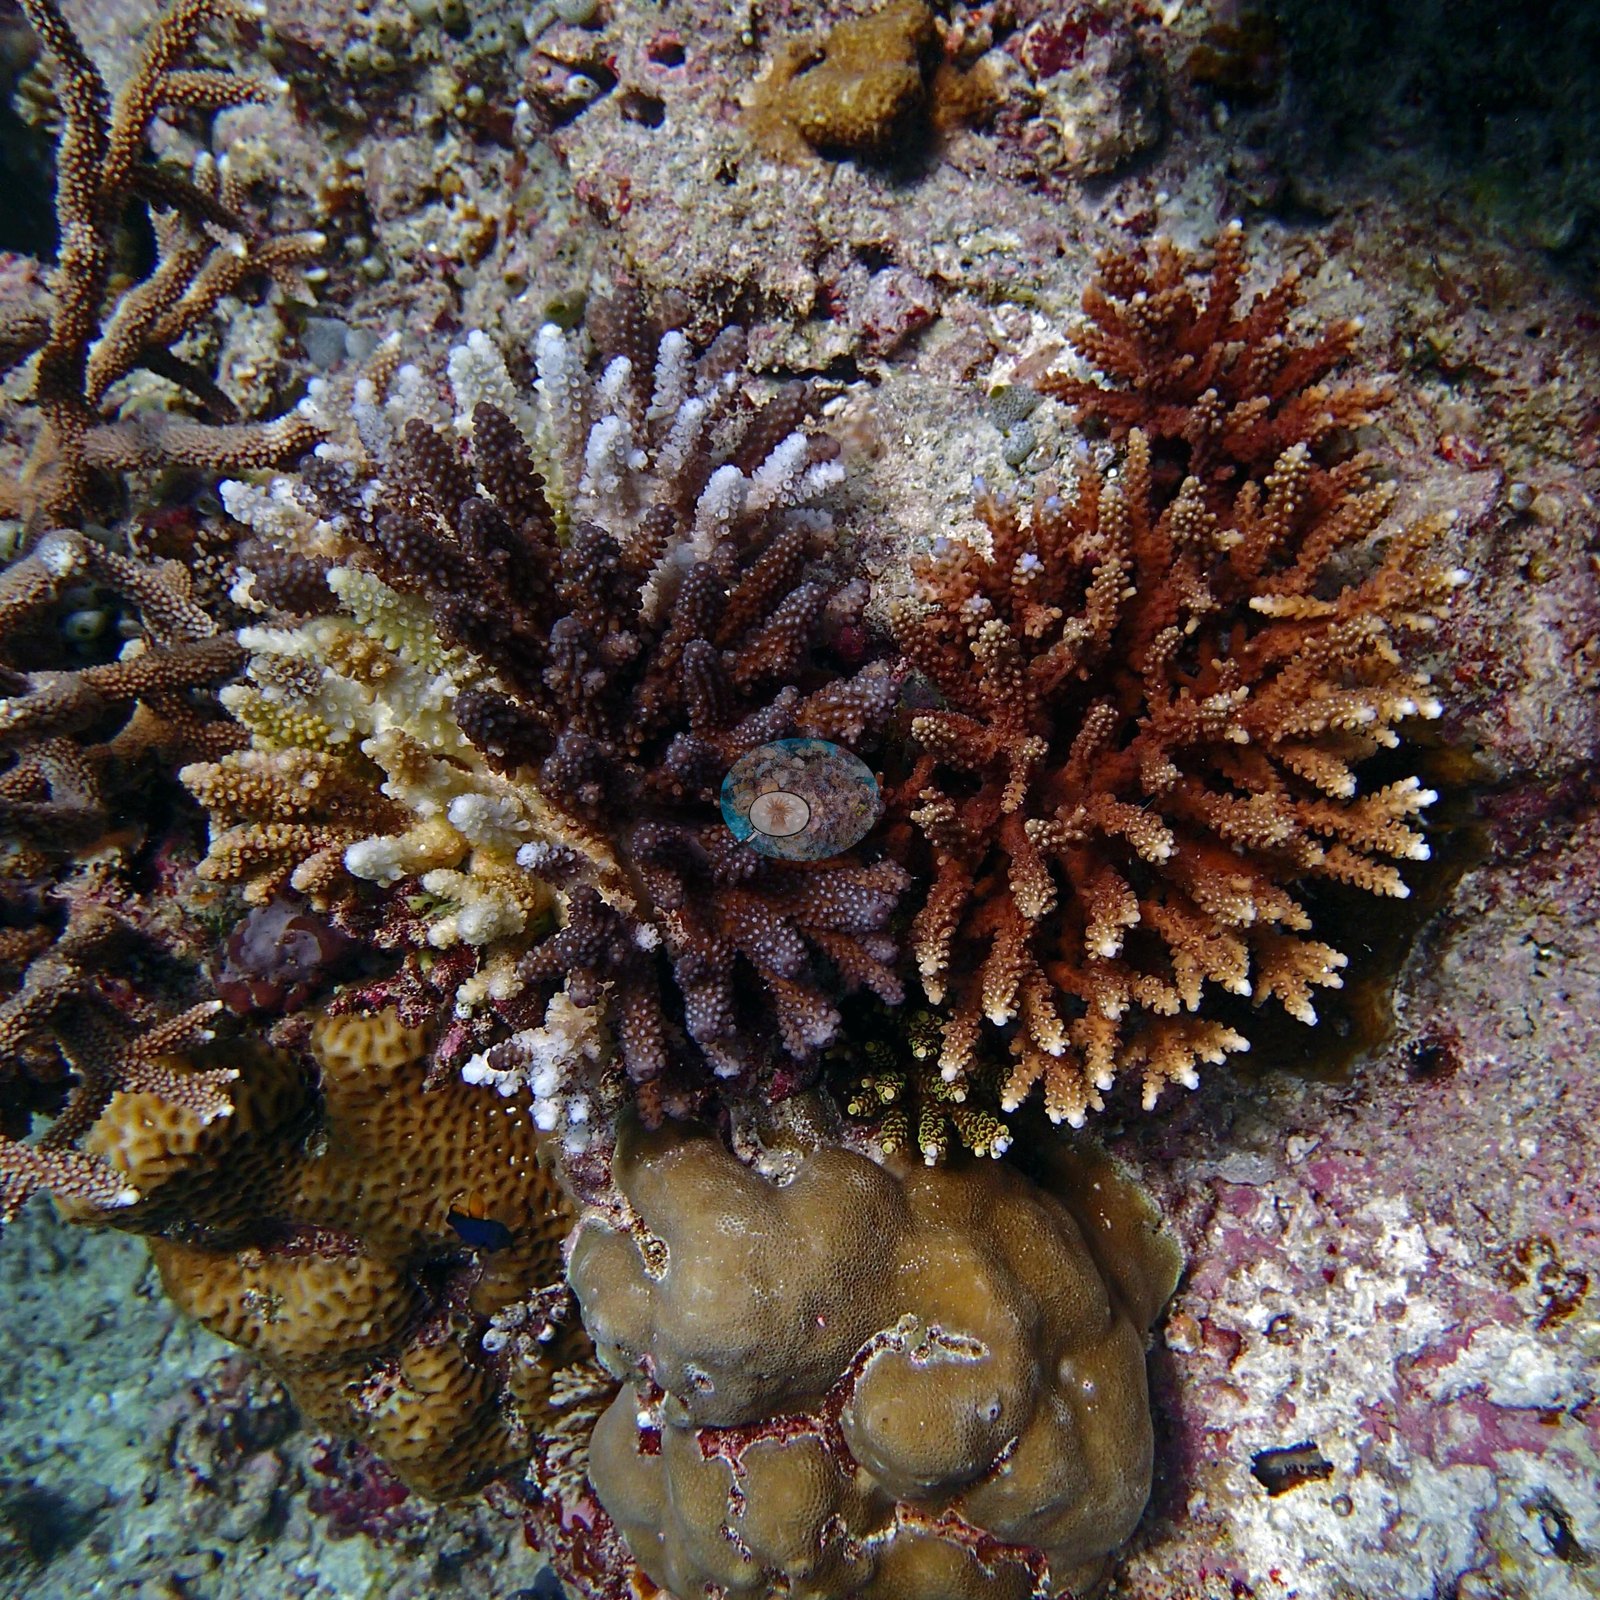
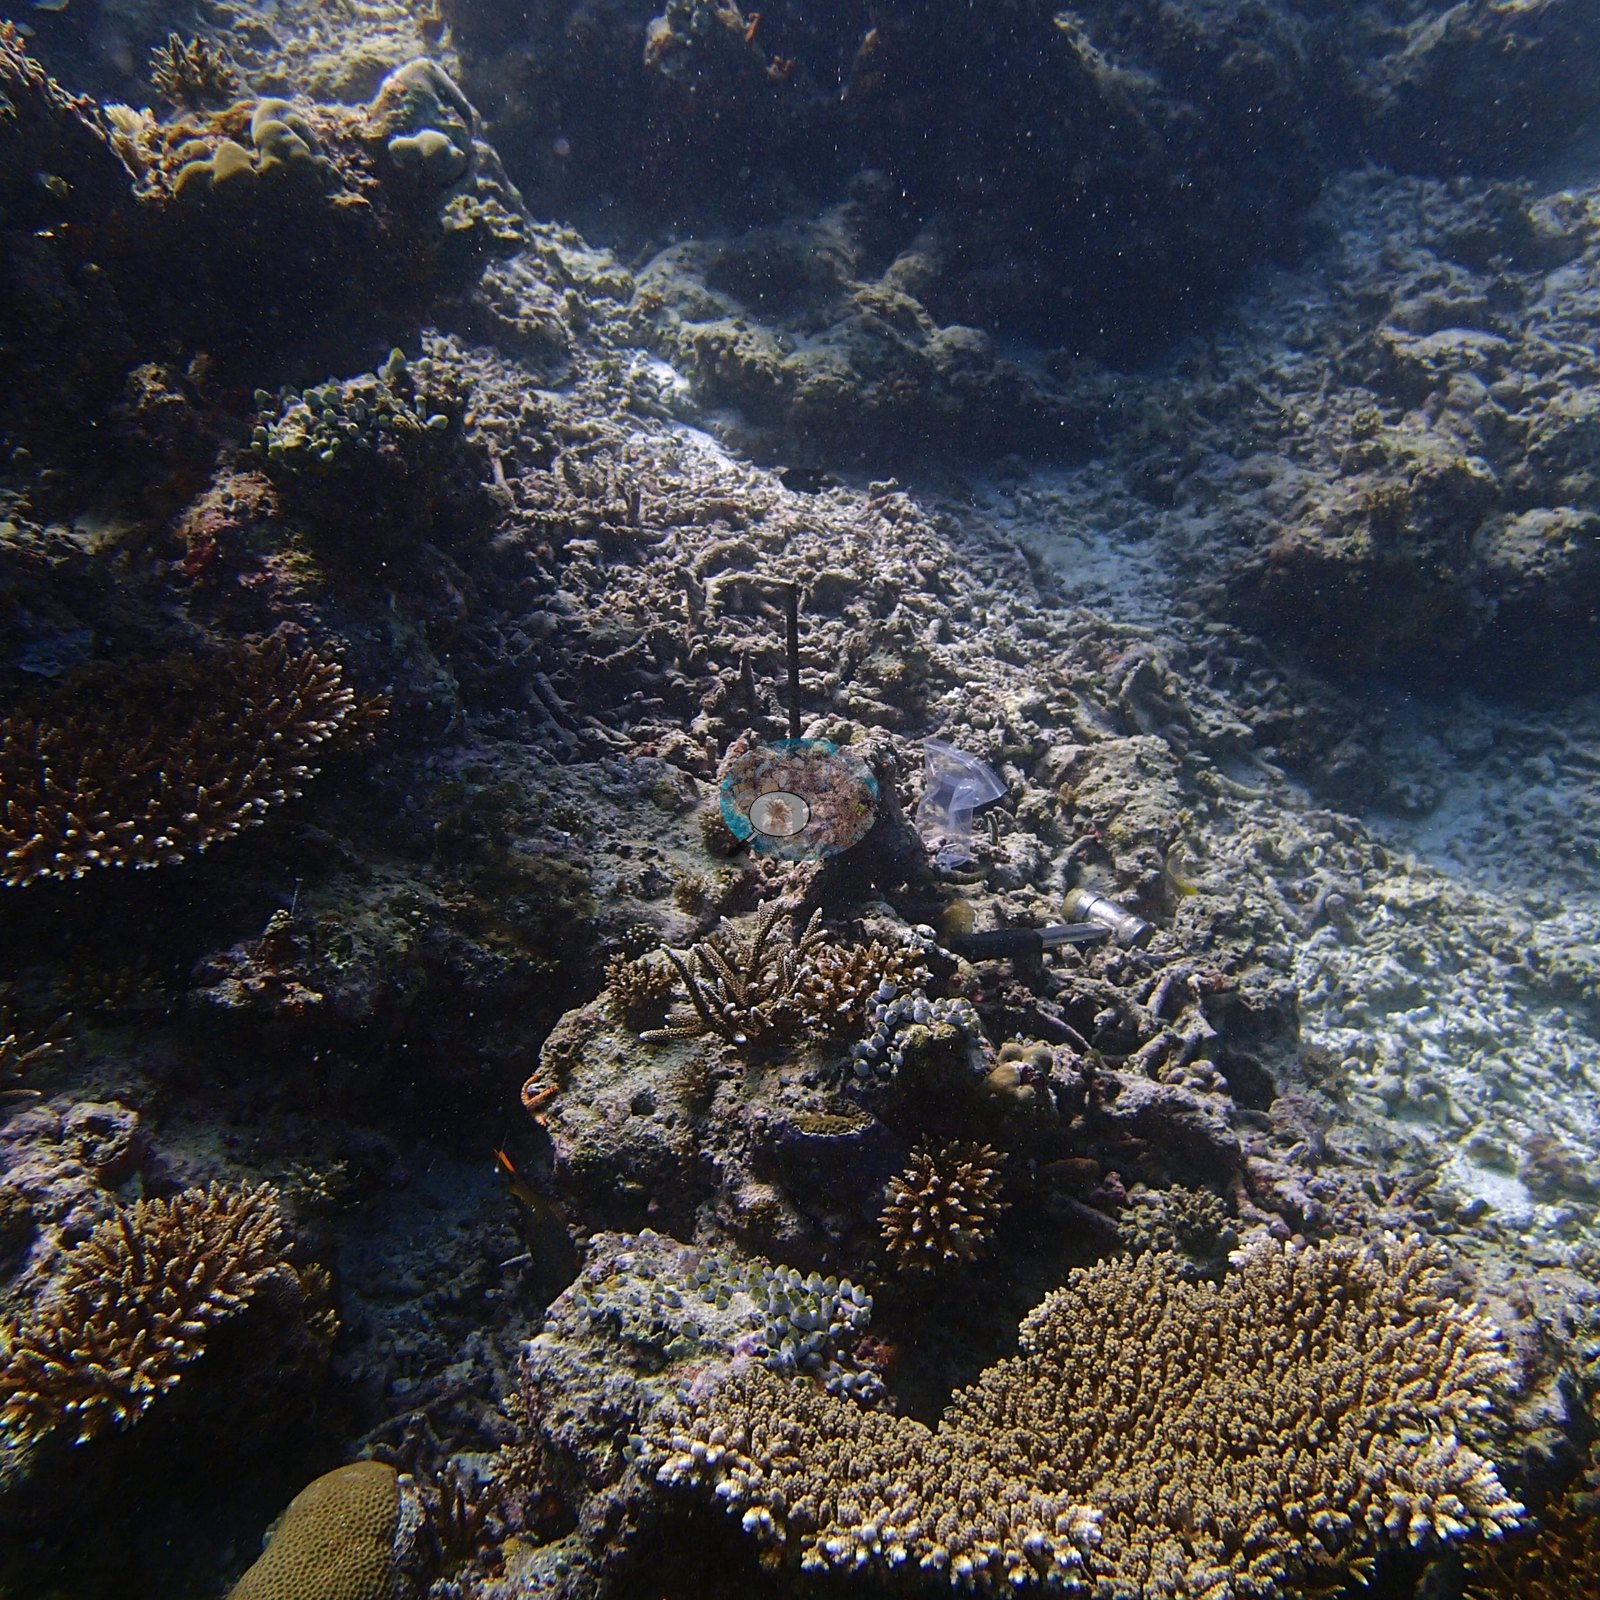
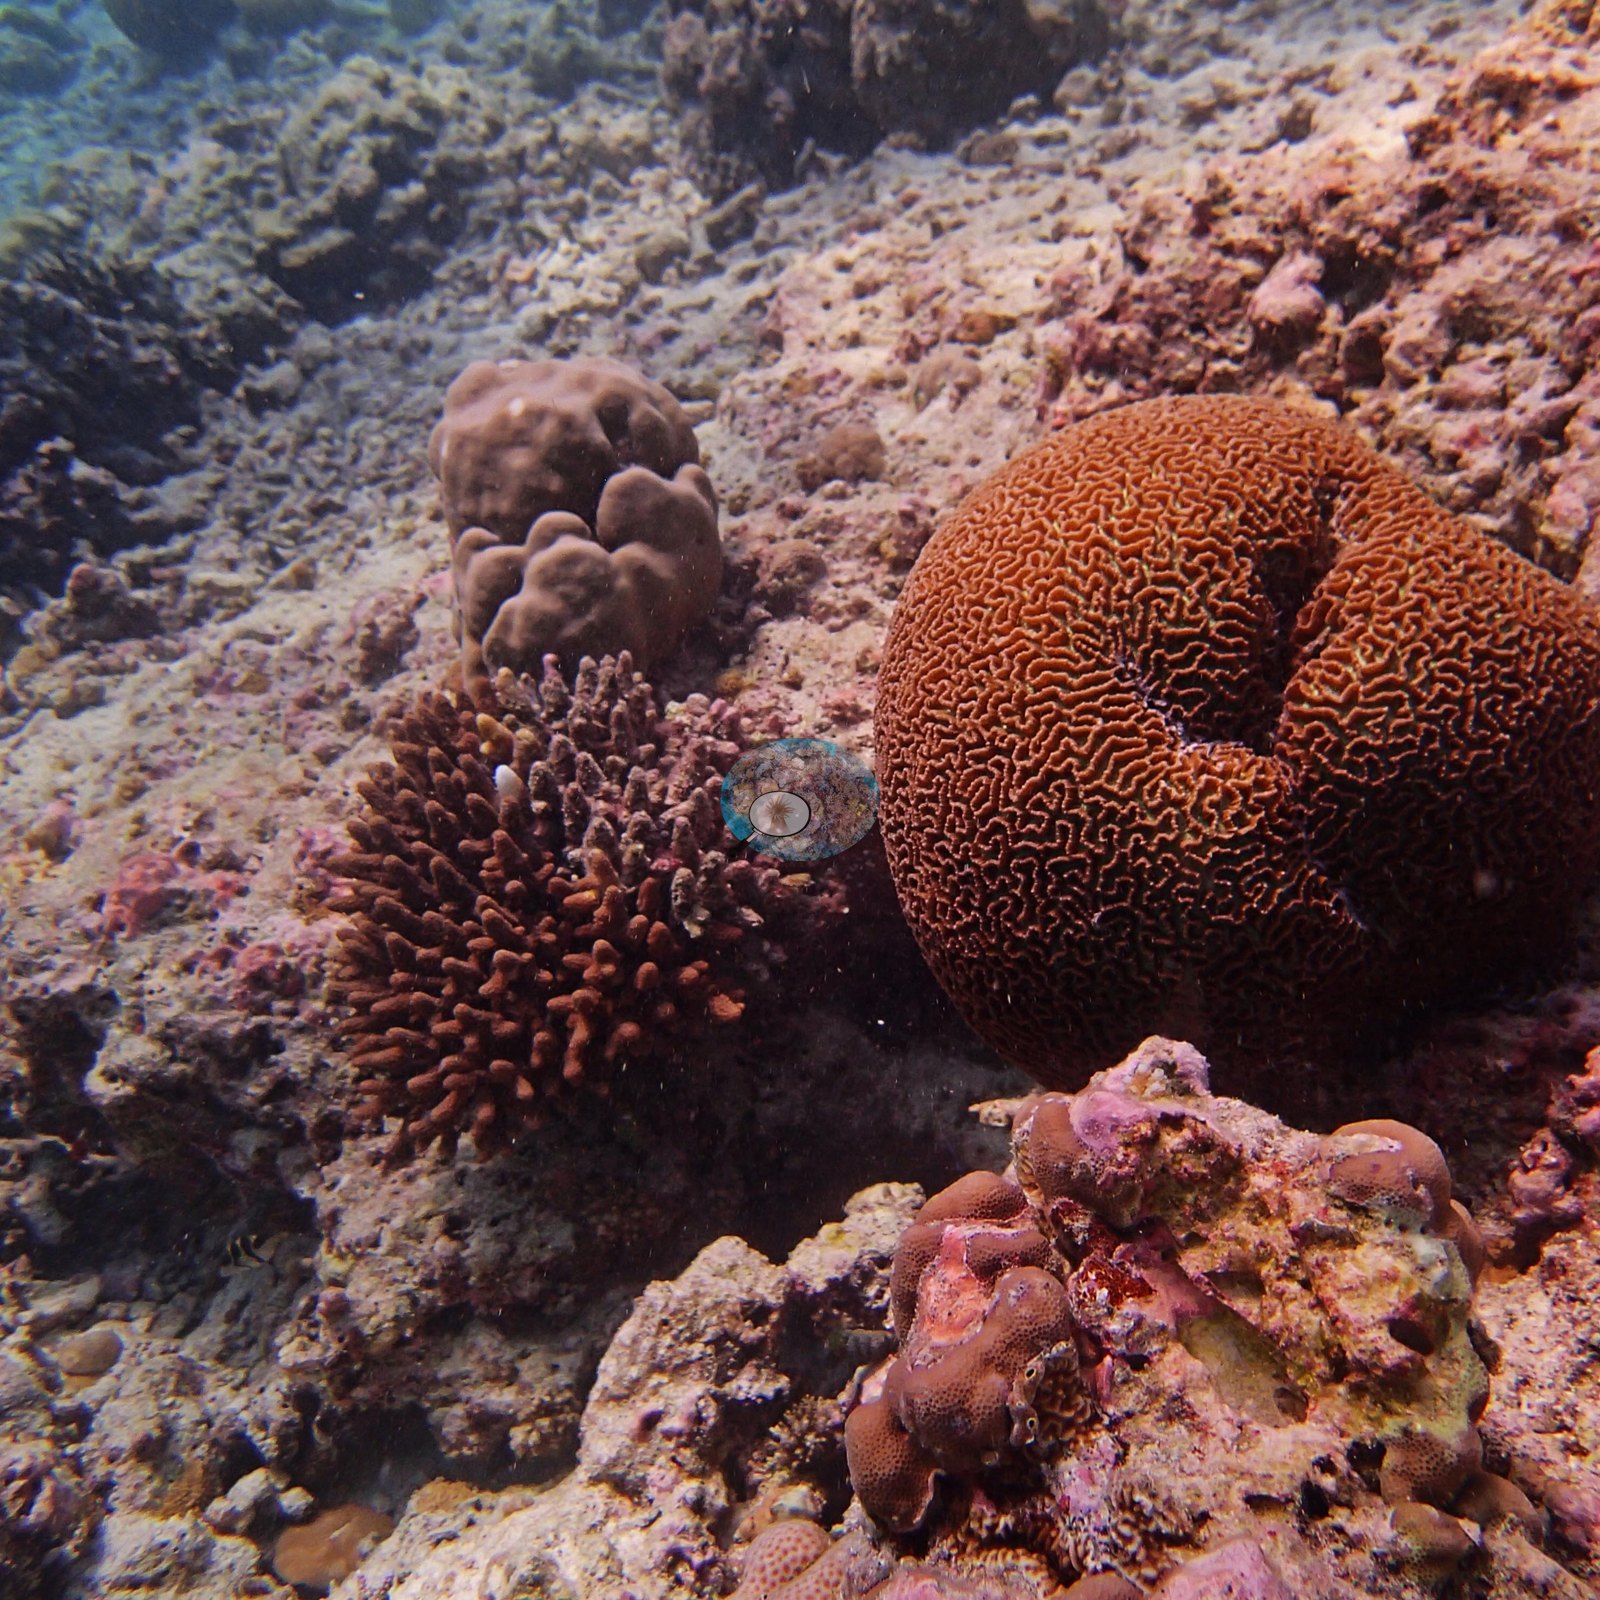
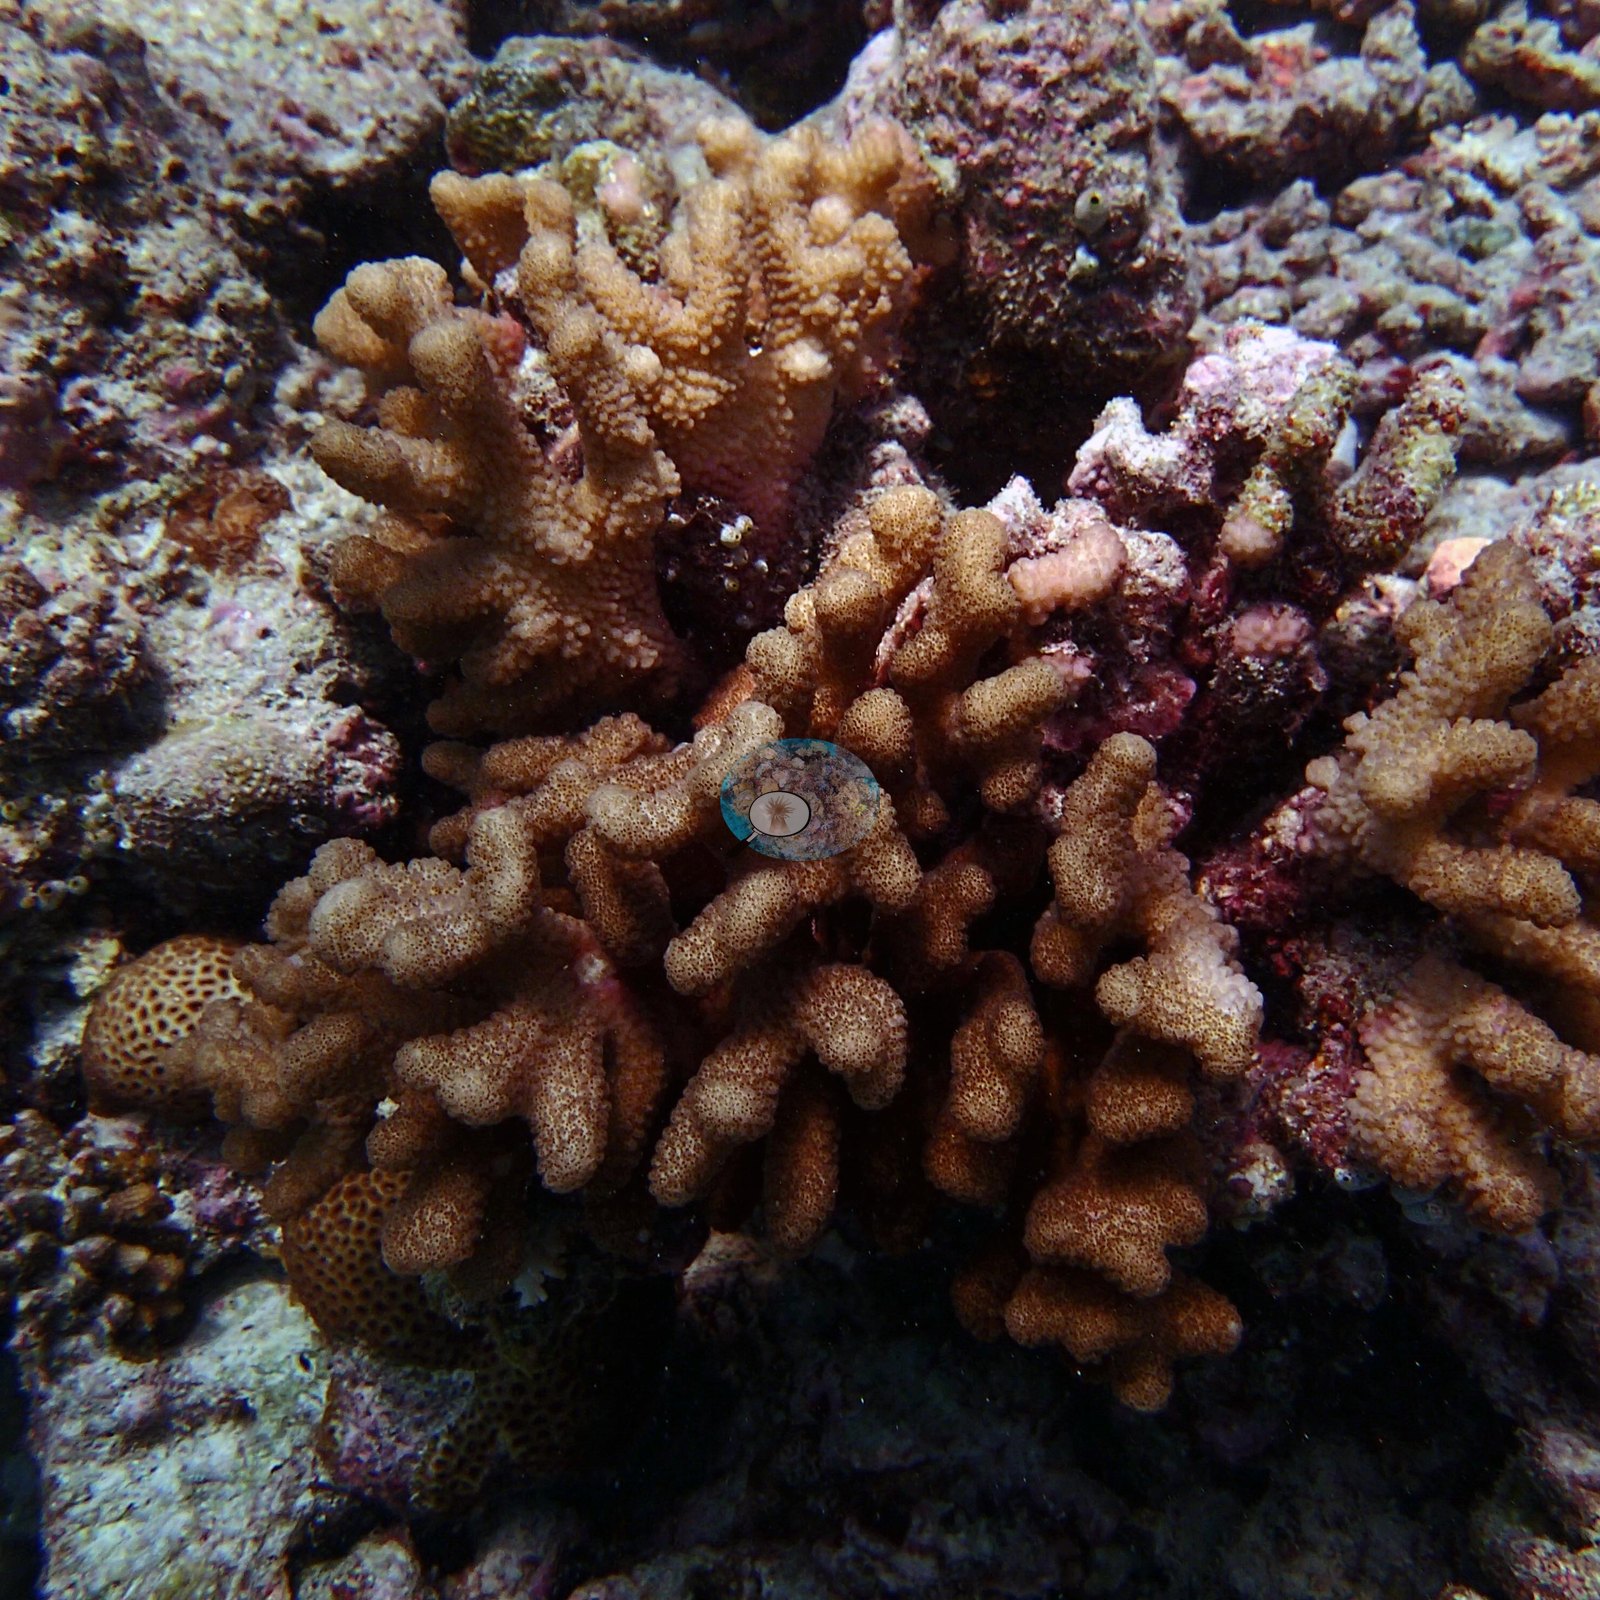
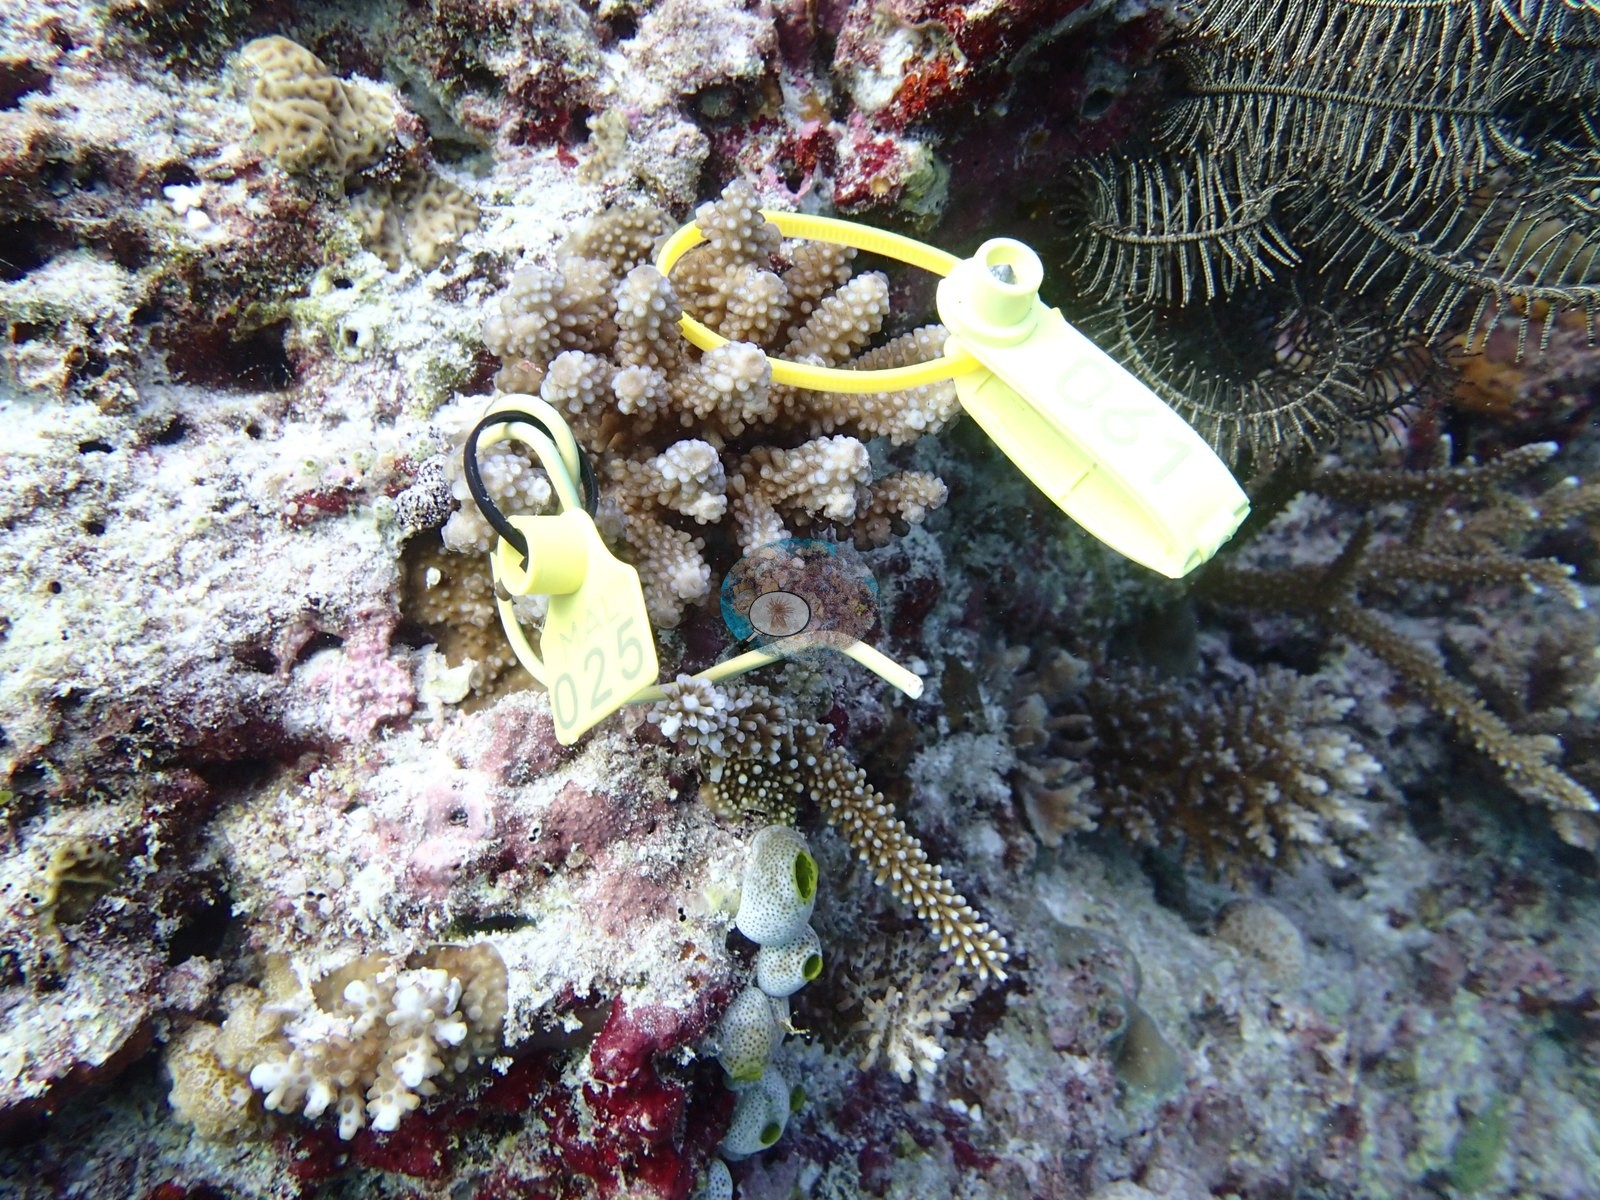
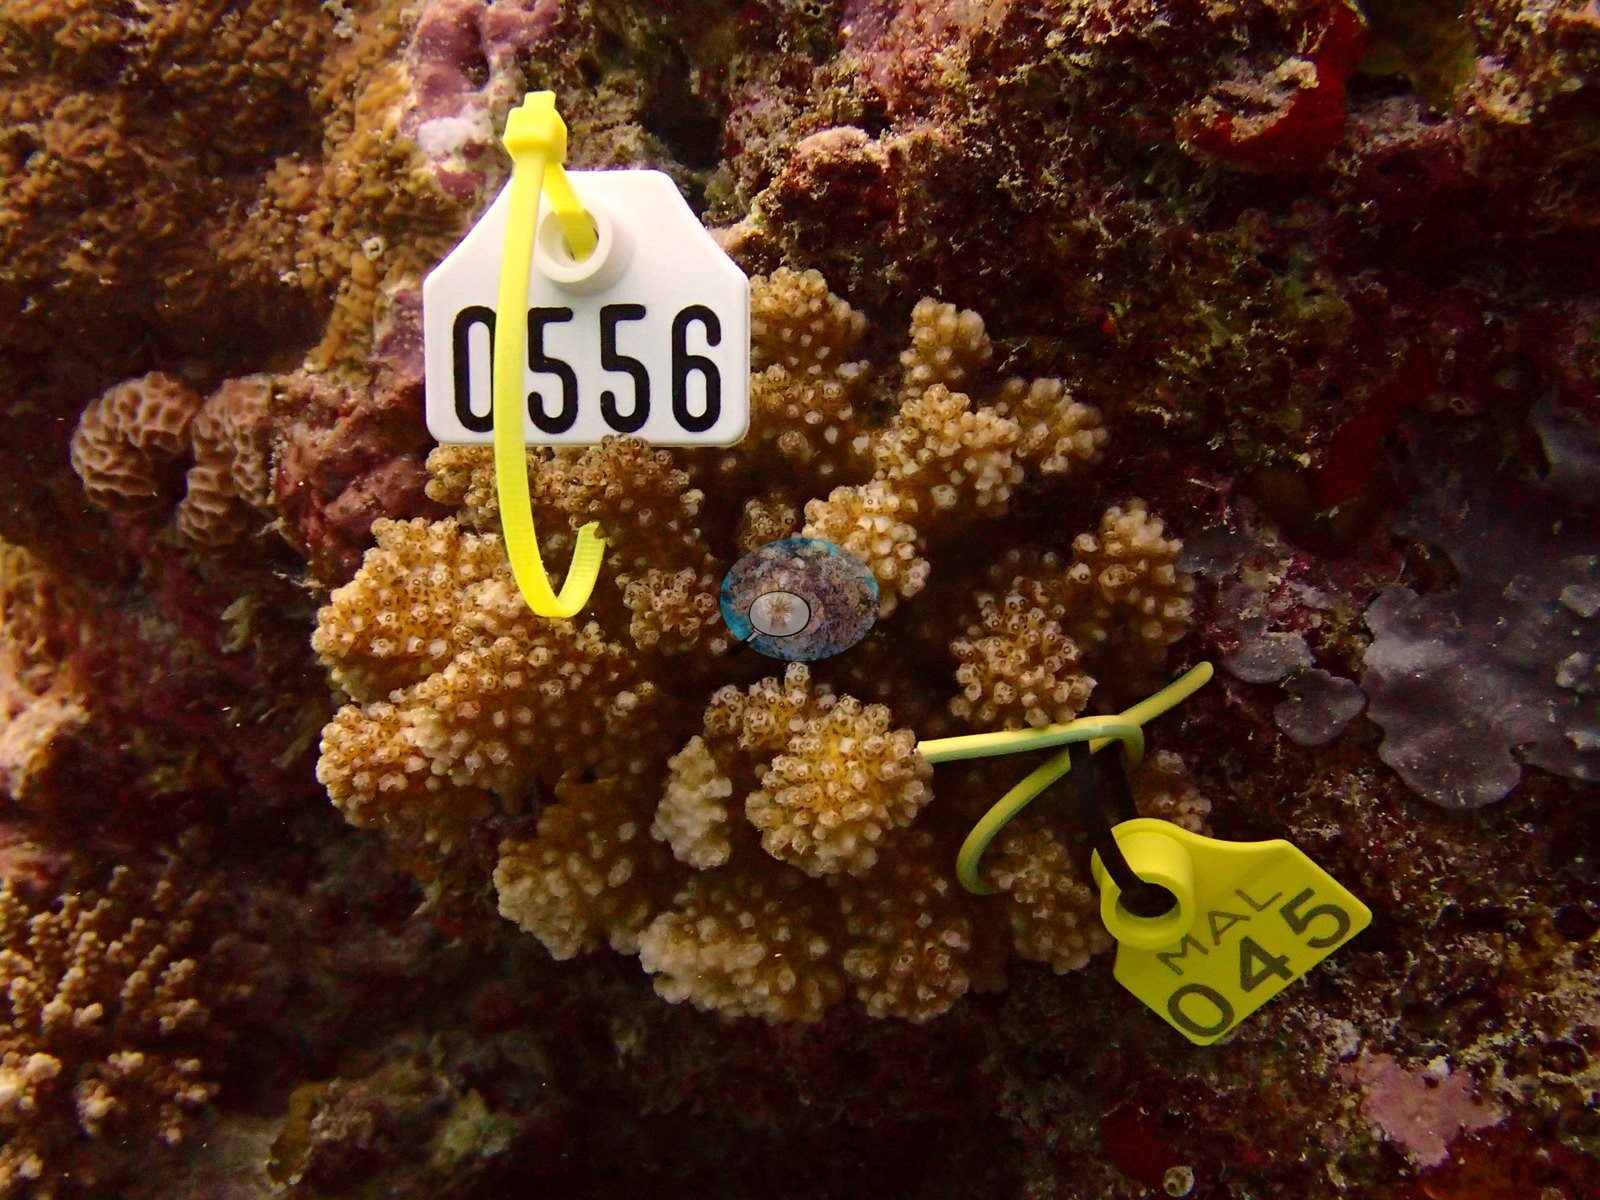
The reef top is crusted pink with coralline algae and dotted with tagged study colonies: cauliflower-shaped Pocillopora heads and branching, pale-tipped Acropora, each wearing a small numbered cattle-tag beside the transect line (e.g., Image 1, Image 5, Image 10, Image 18).
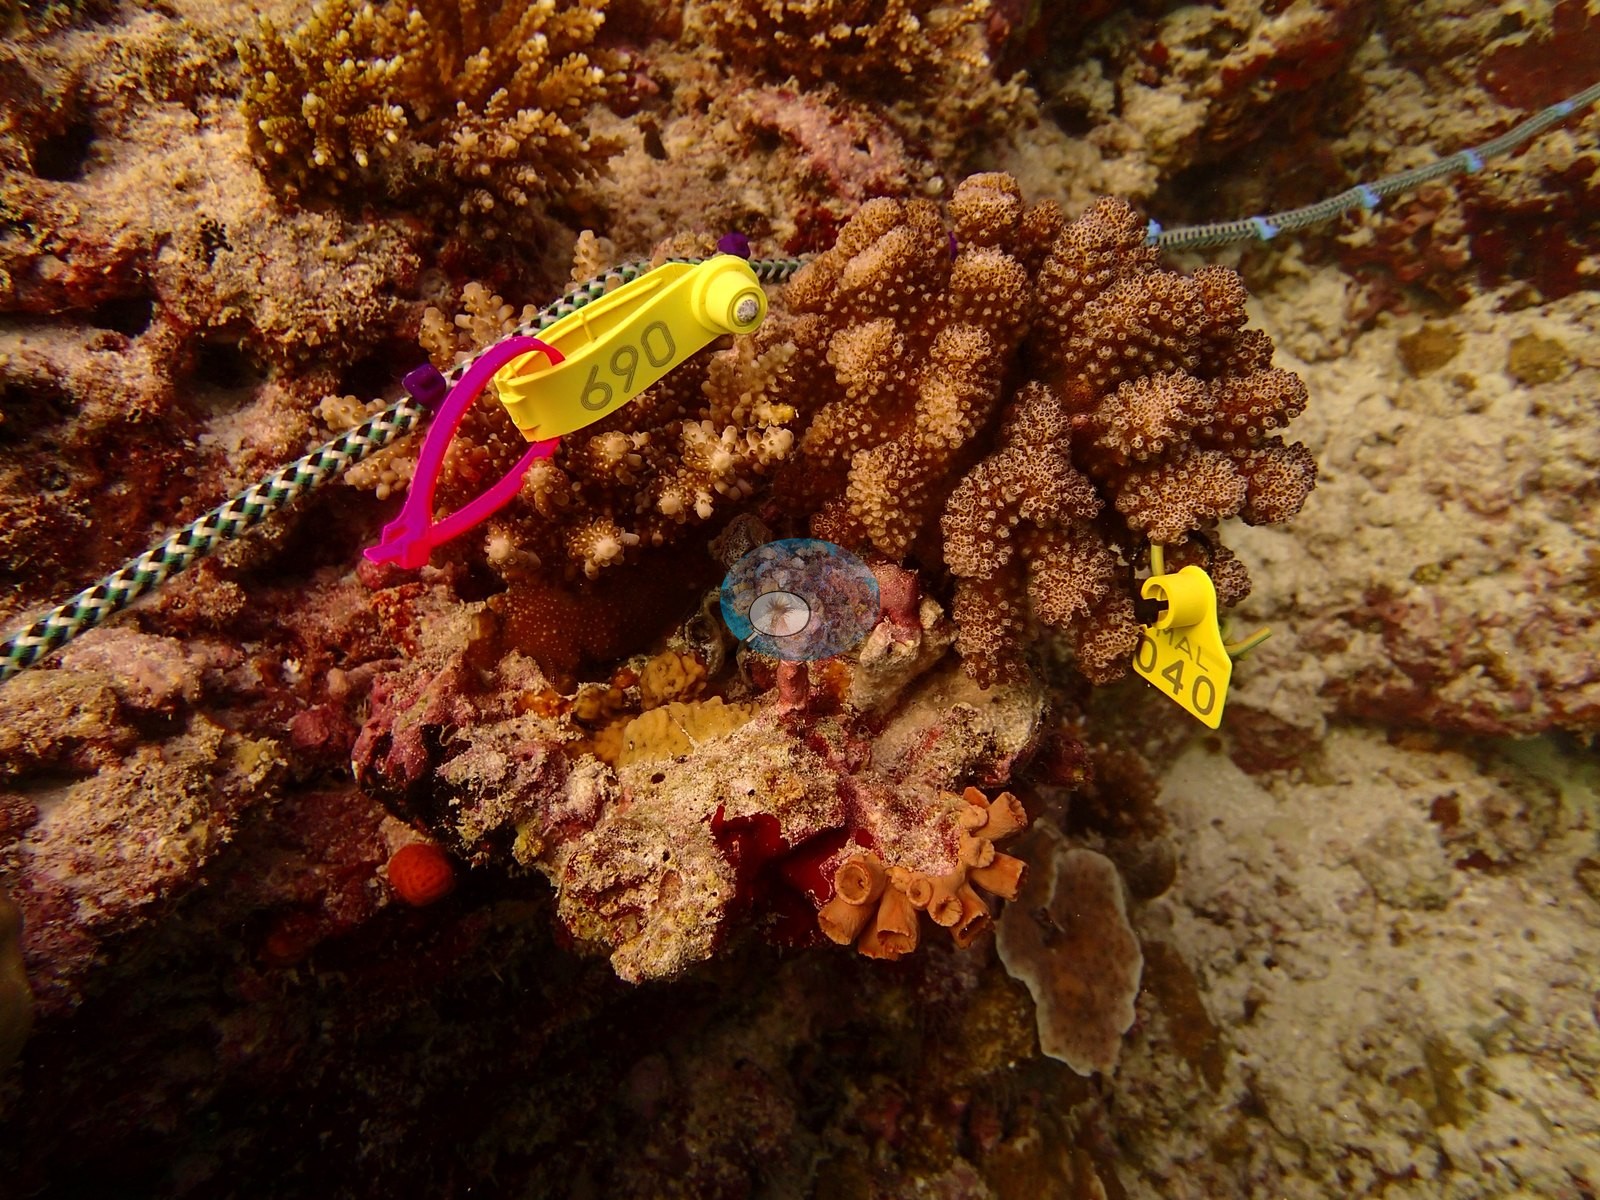
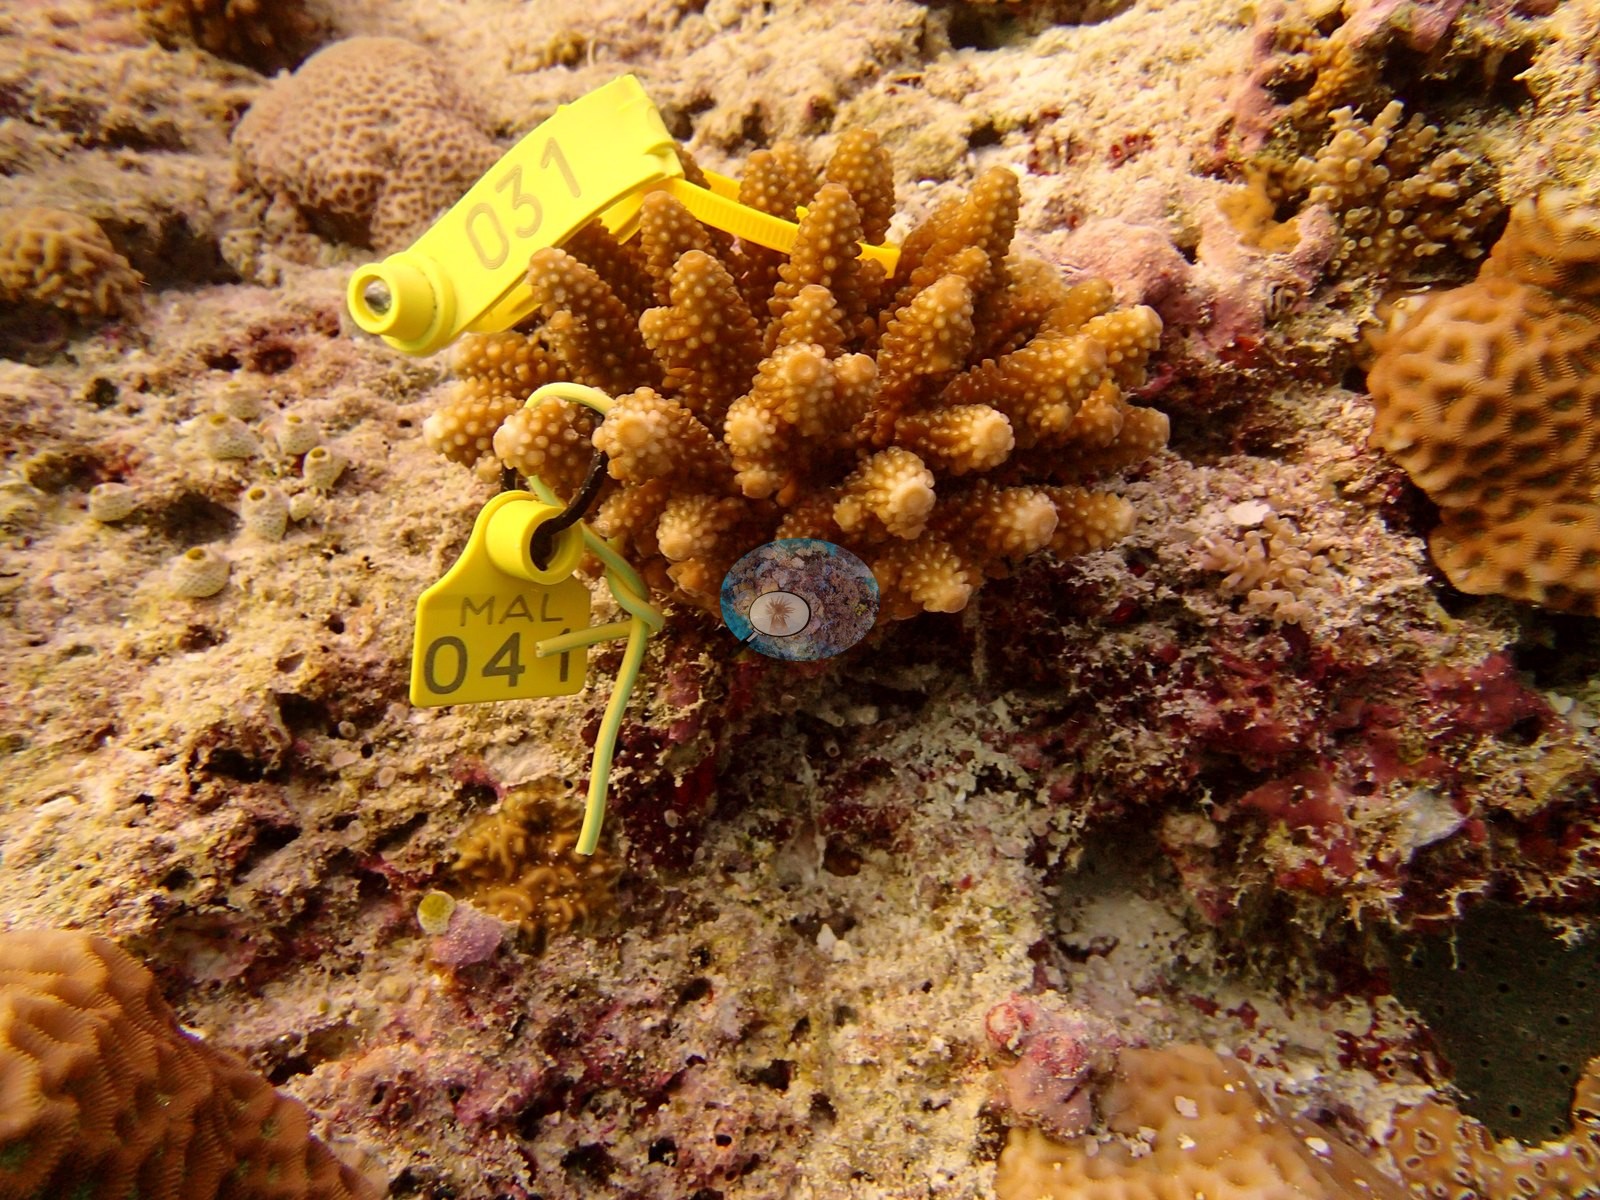
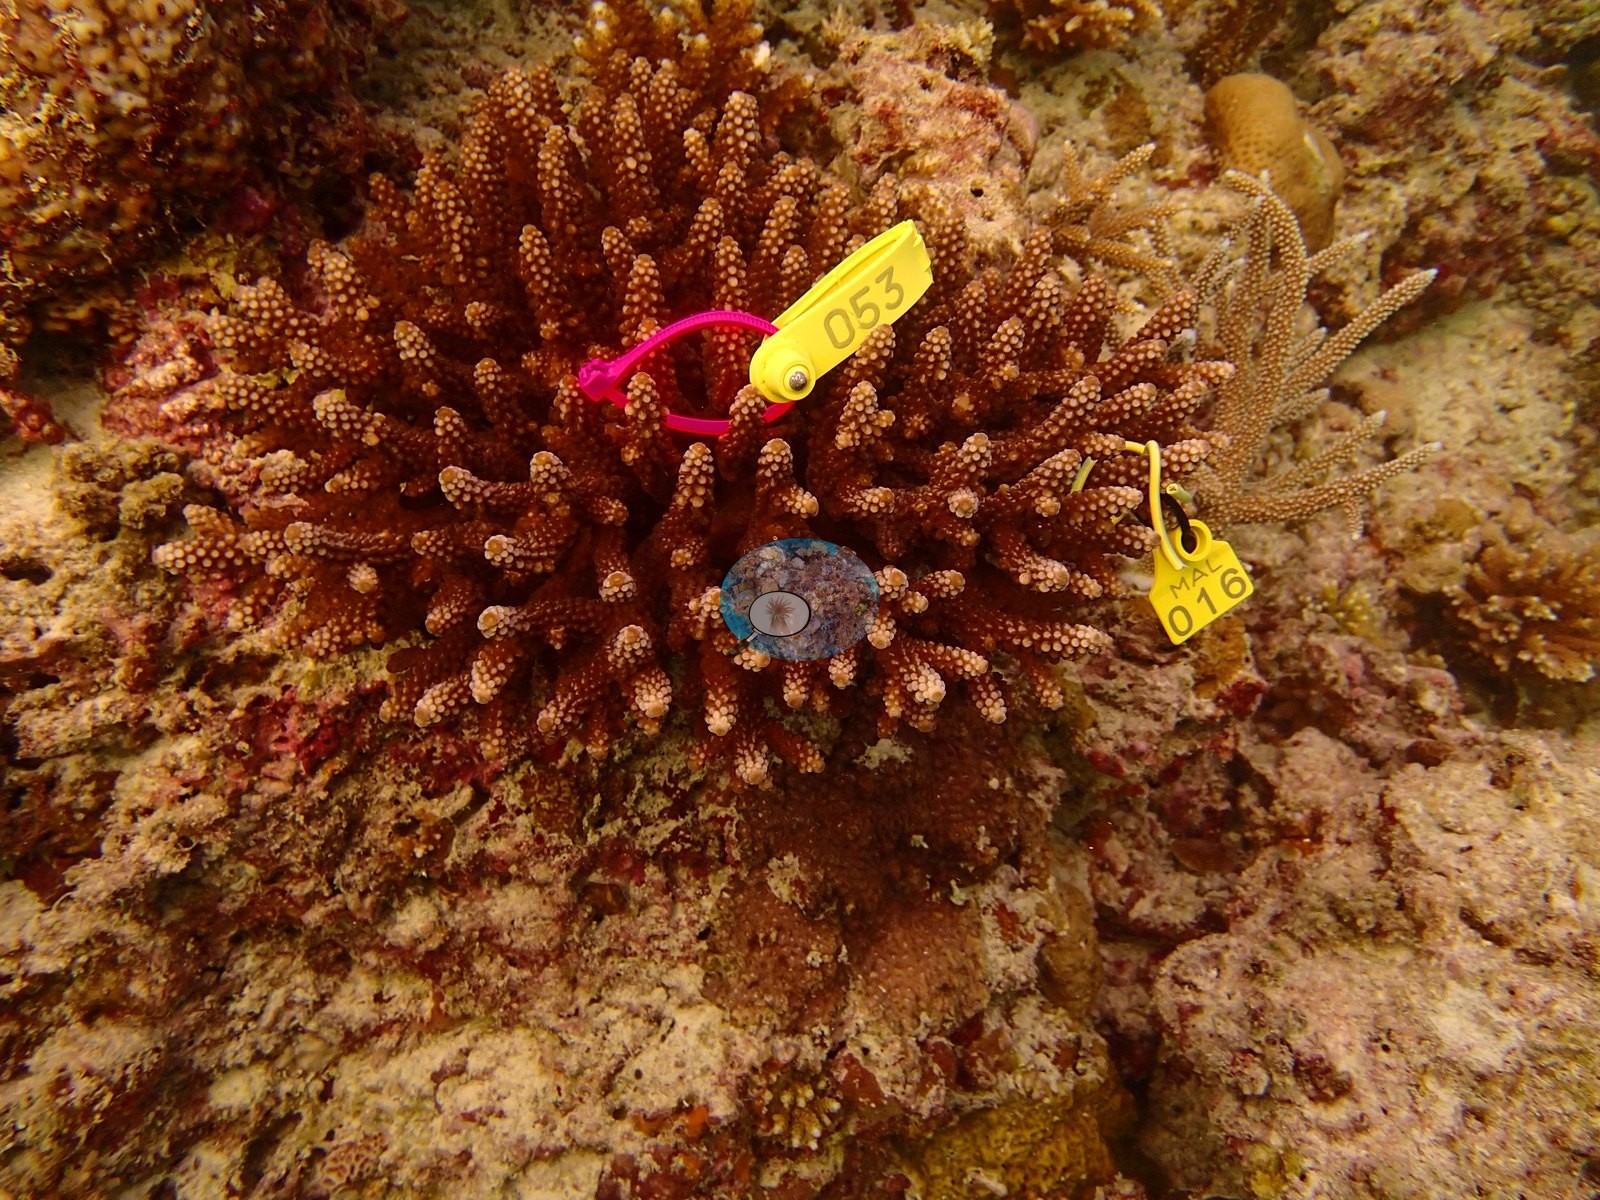
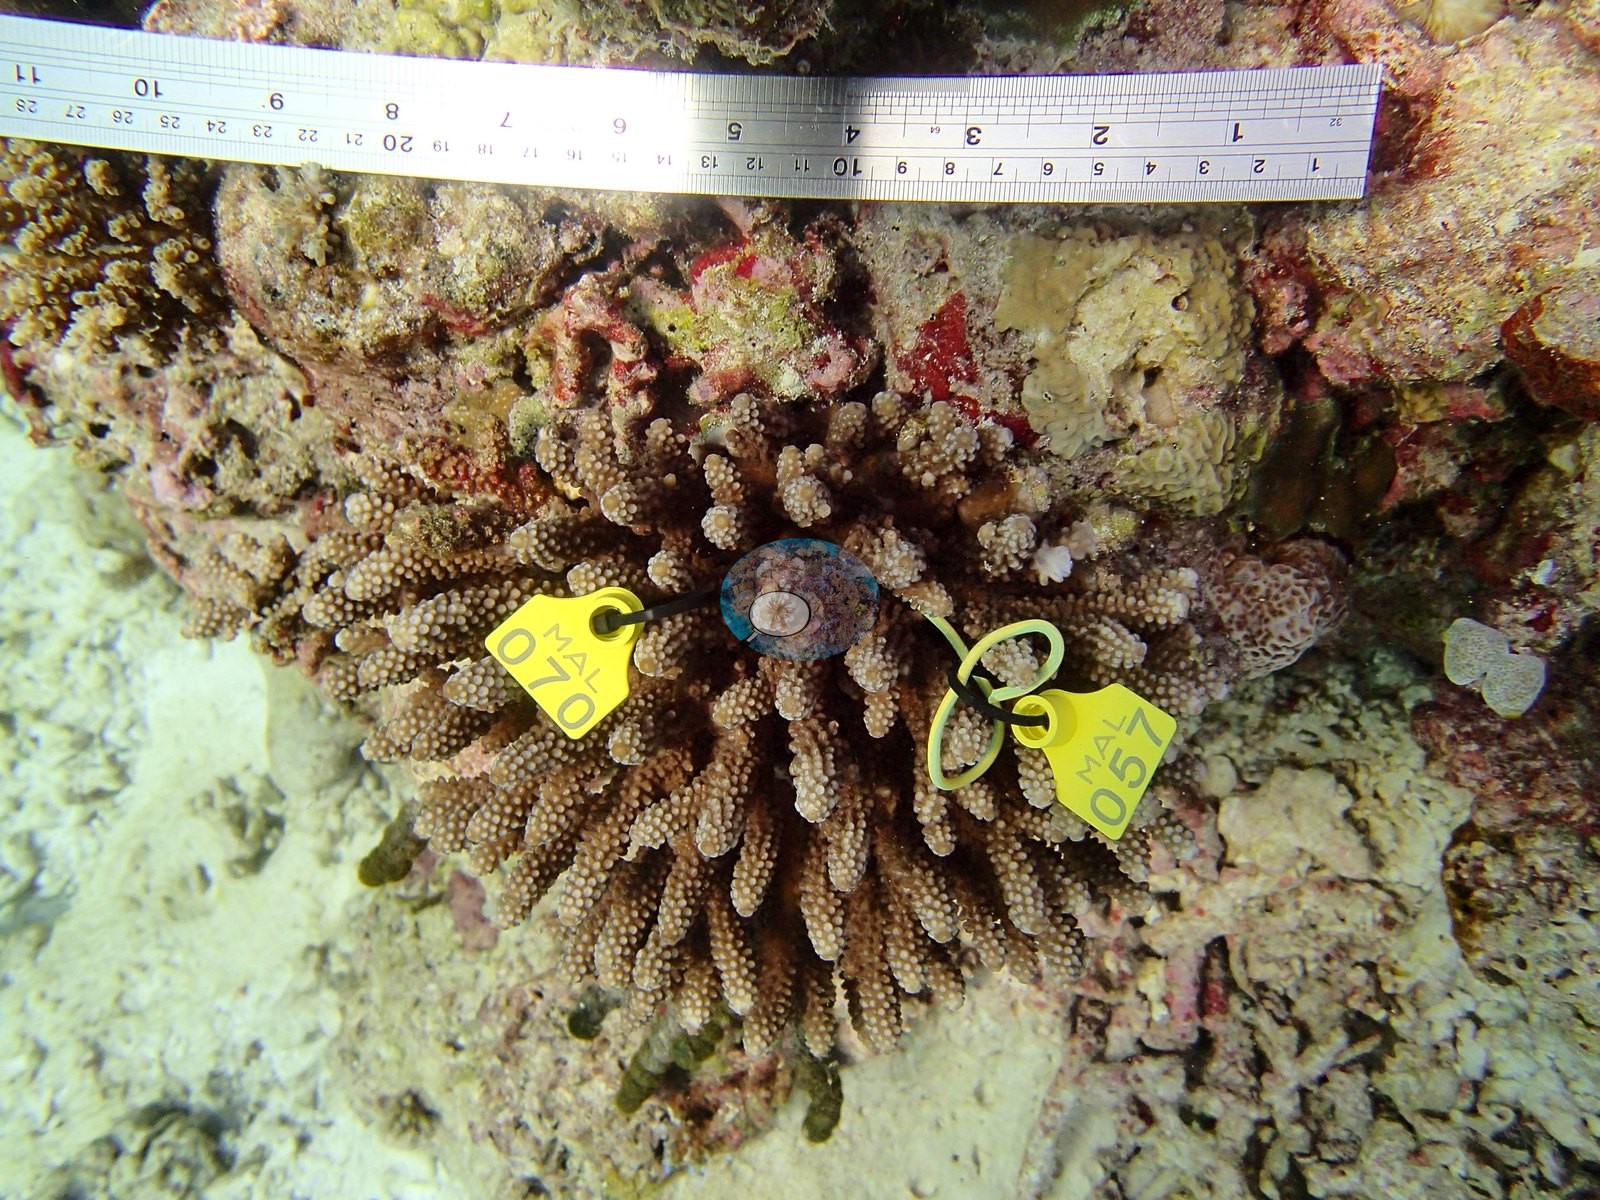
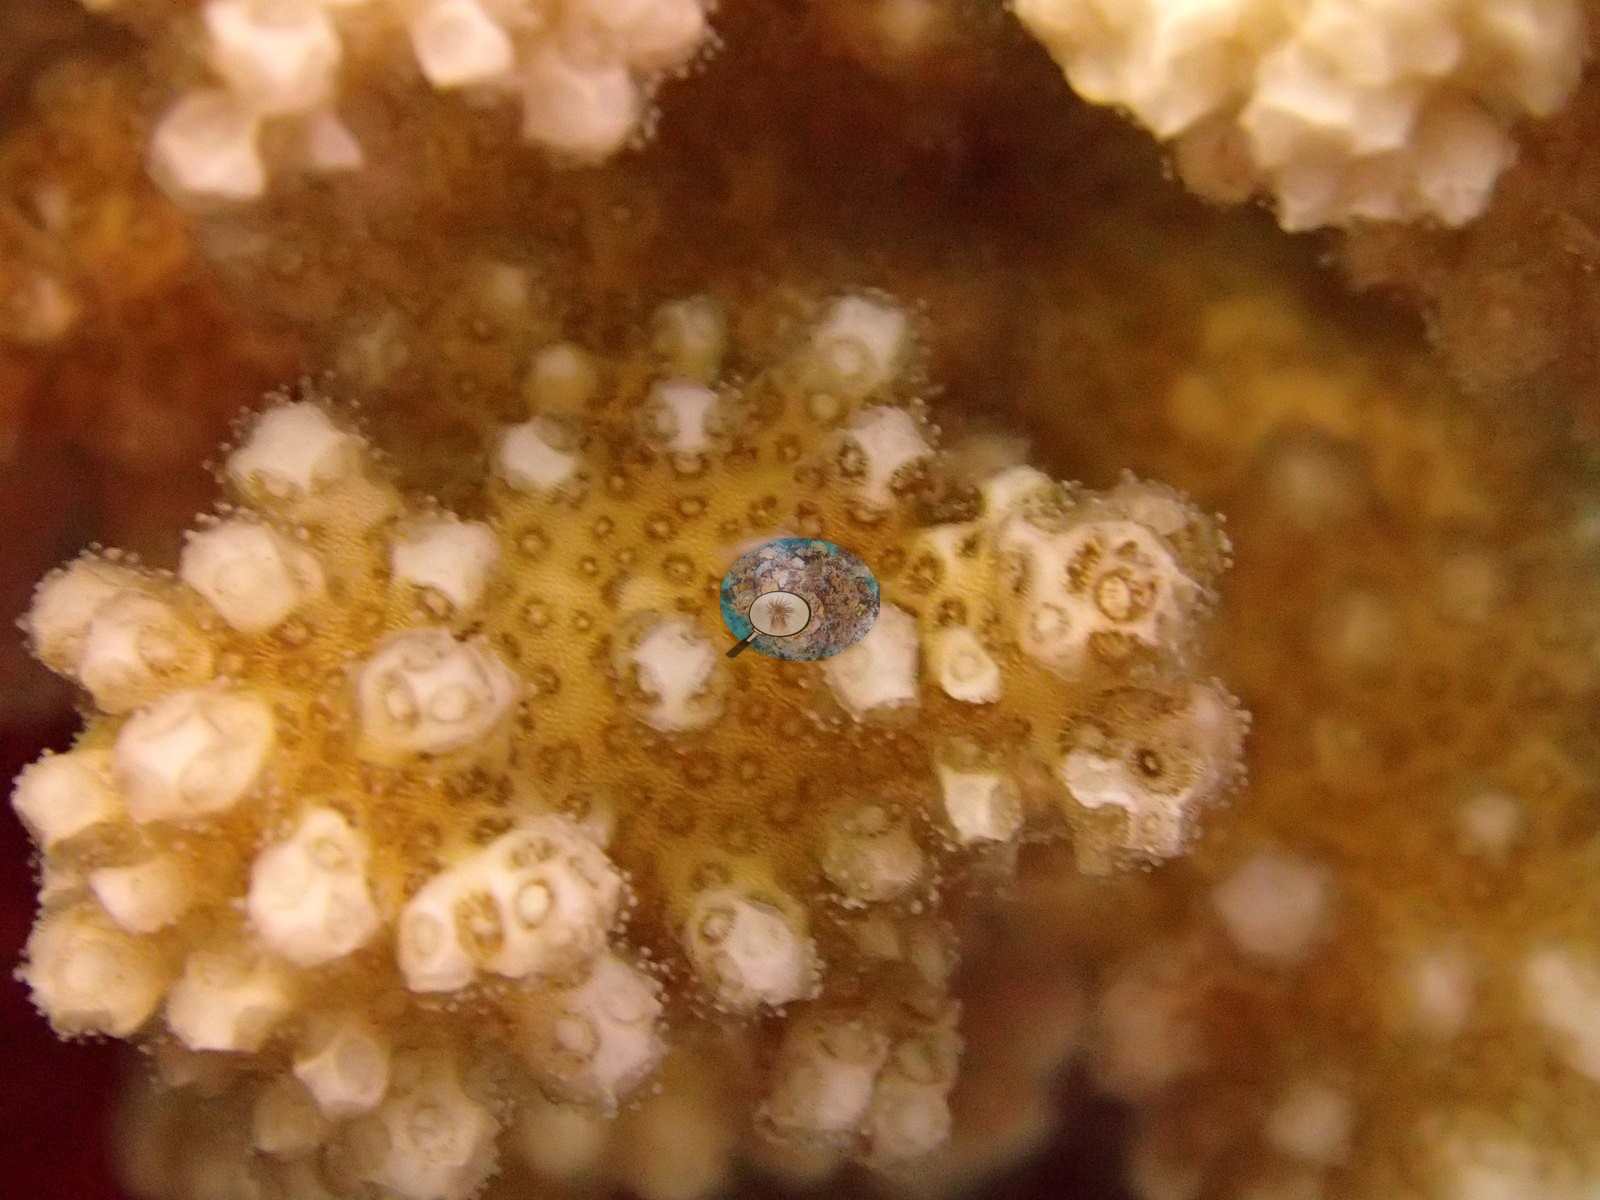
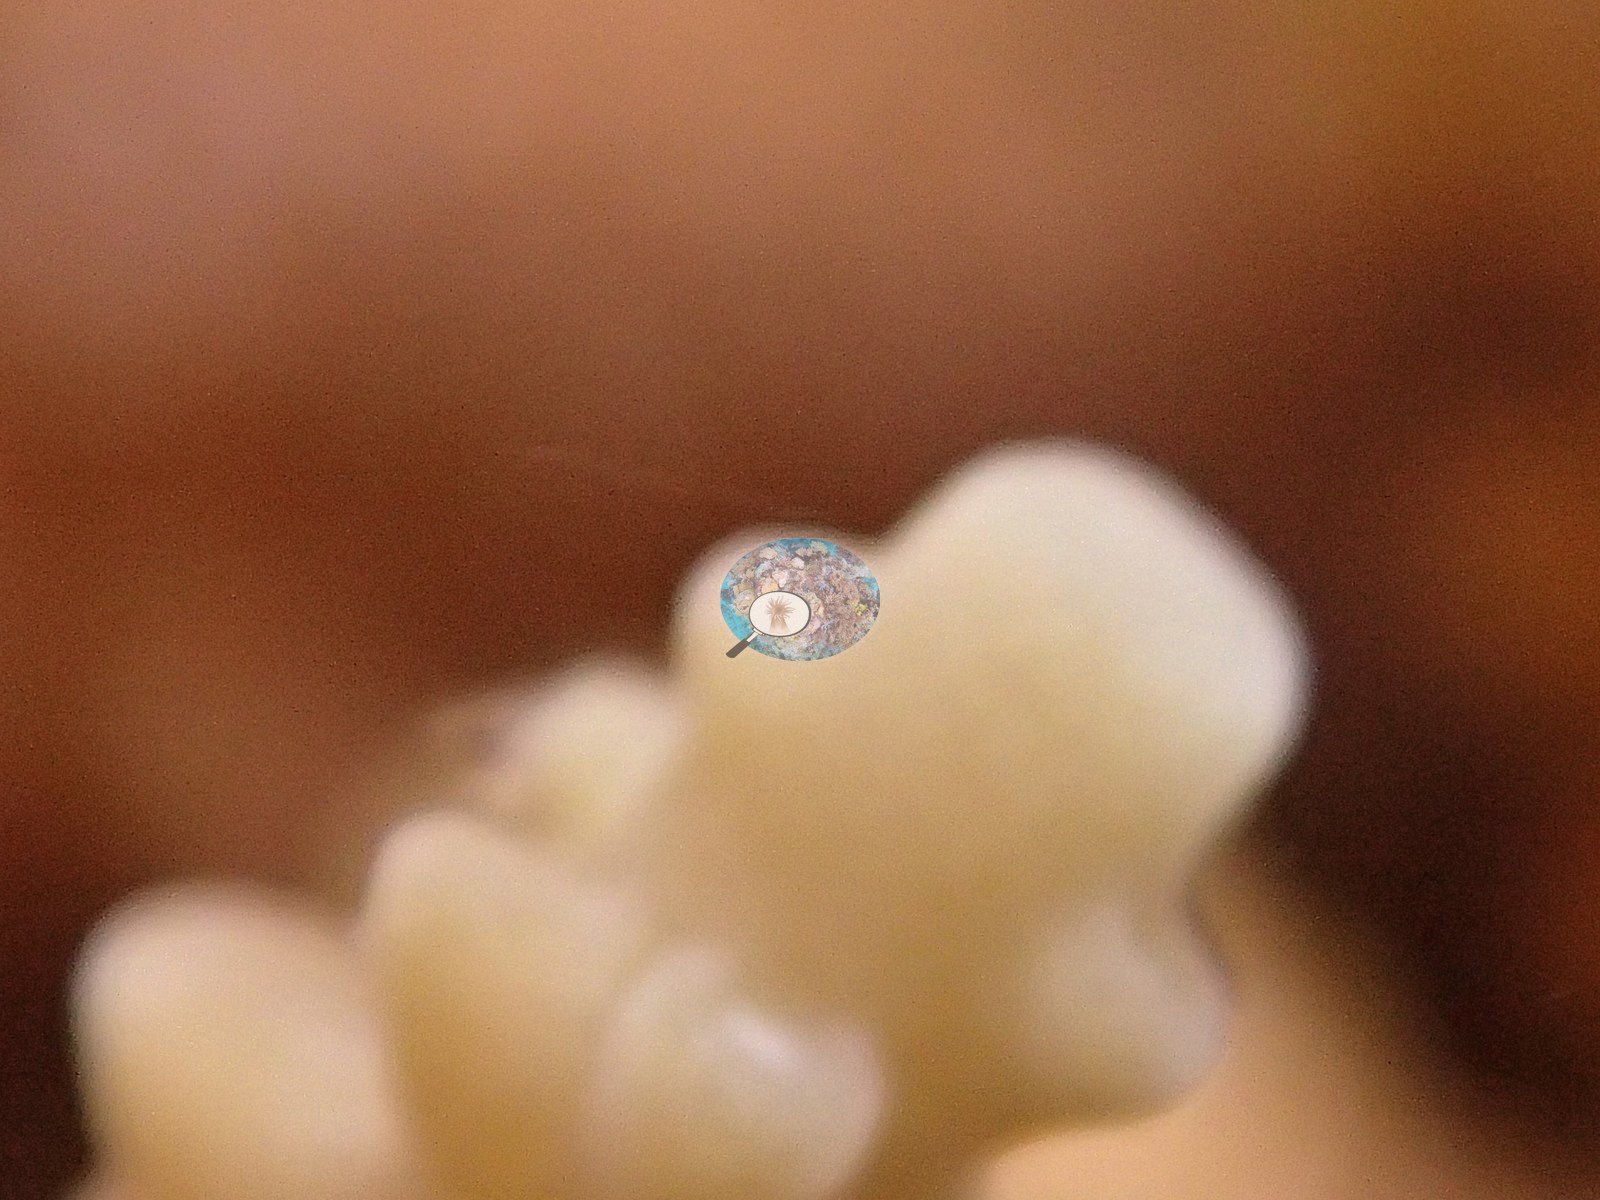
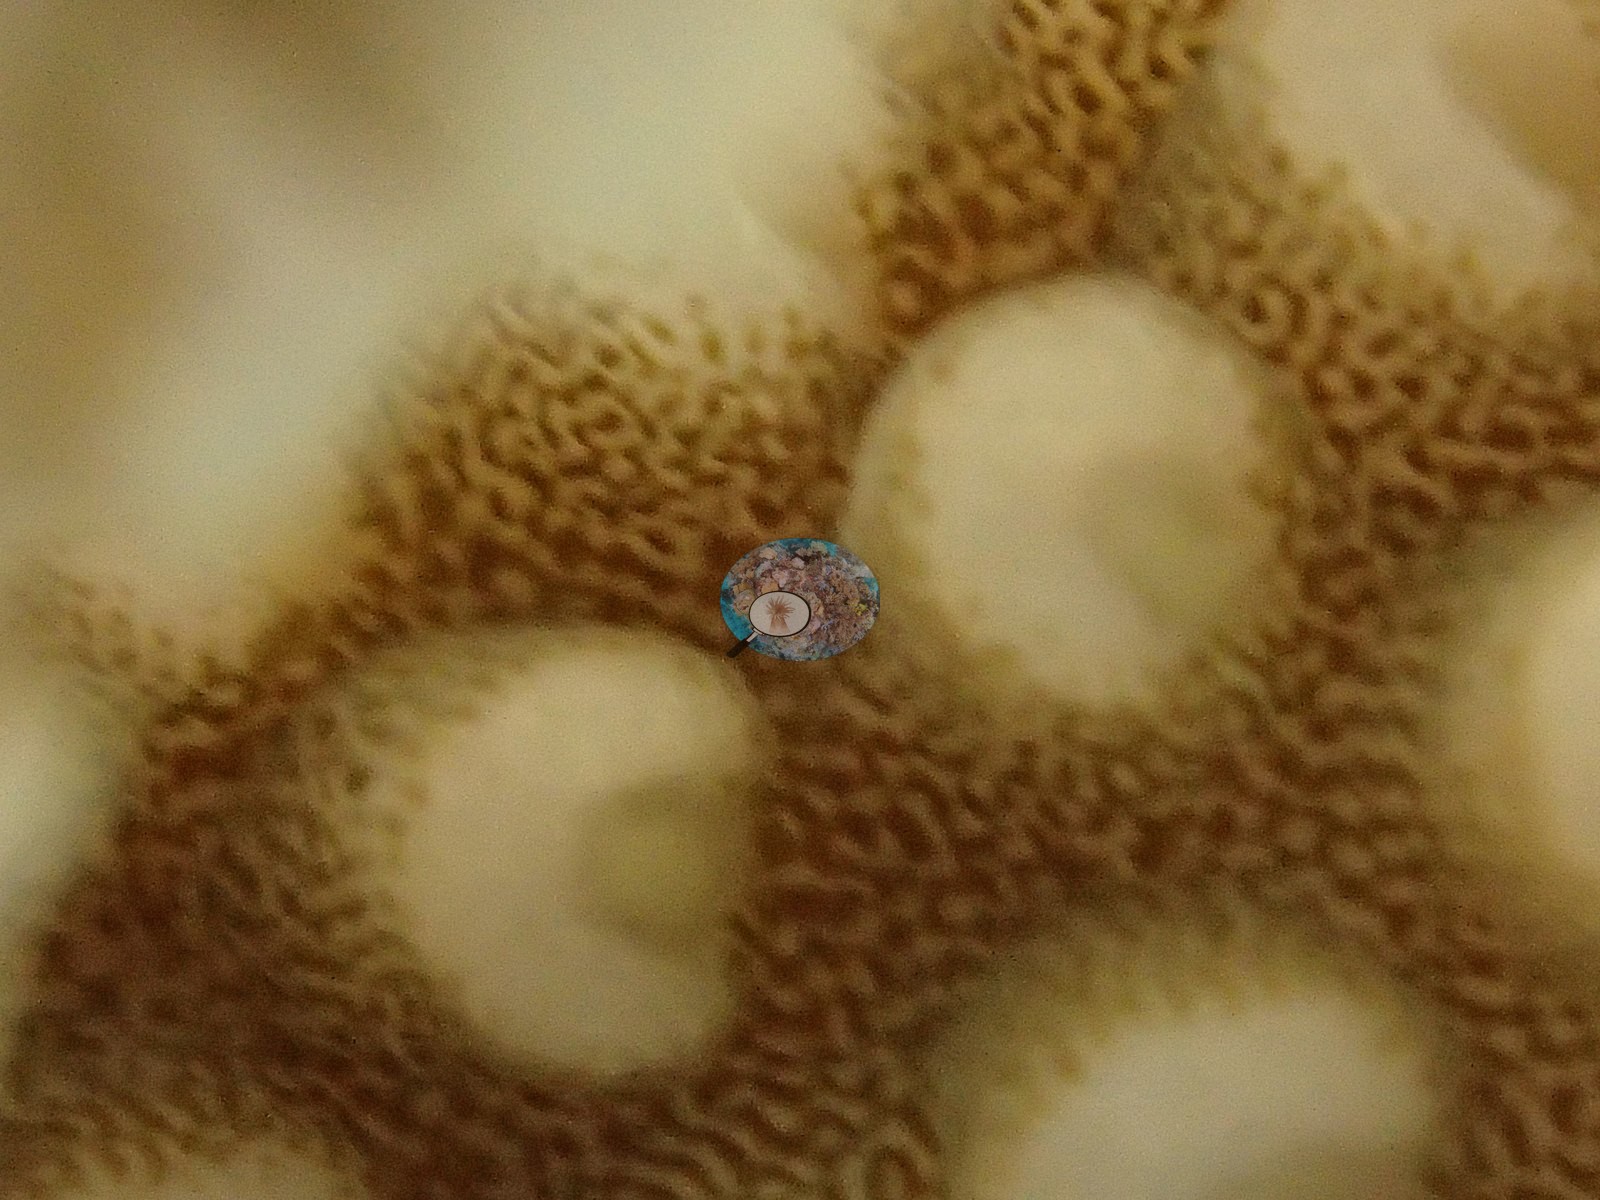
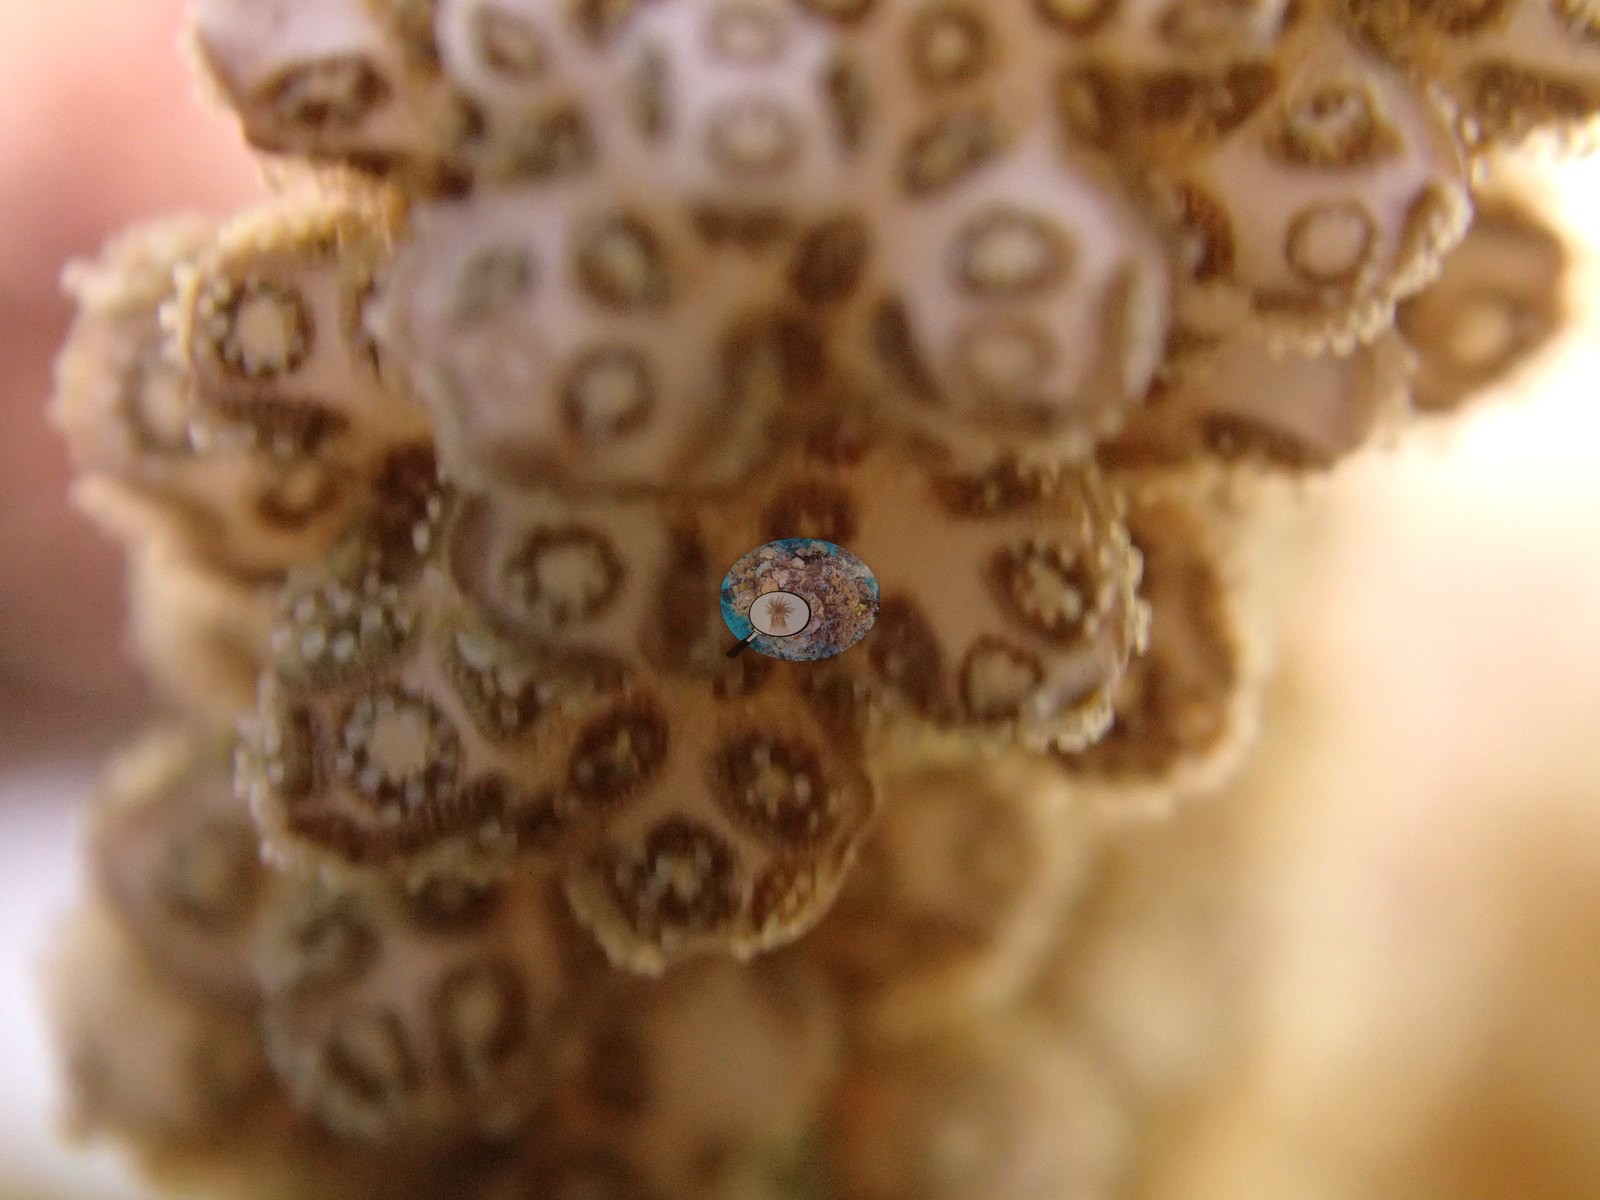
Macro frames catch their polyps fully extended, healthy and feeding, while feather stars perch on the rubble (e.g., Image 2, Image 11, Image 17, Image 20).
Coral cover
- Coral cover: 31% (SD 12%, n=10 transects, median 28%) in July 2016 — Coral Reef CPR point-intercept transects, after the 2016 bleaching; we were part of the CPR team.
- Live coral cover fell from 62% (April 2016) to 31% (July 2016) during the 2016 global bleaching event.
- The April 2016 survey, during the bleaching, read 62% (n=7 transects).
- For comparison, a blind Claude computer-vision point count of 49 of Anderson's January 2016 photographs (before the bleaching) reads 21%, shown beside both the April 2016 transects (during the bleaching) and the July 2016 transects (after it).
Stressors
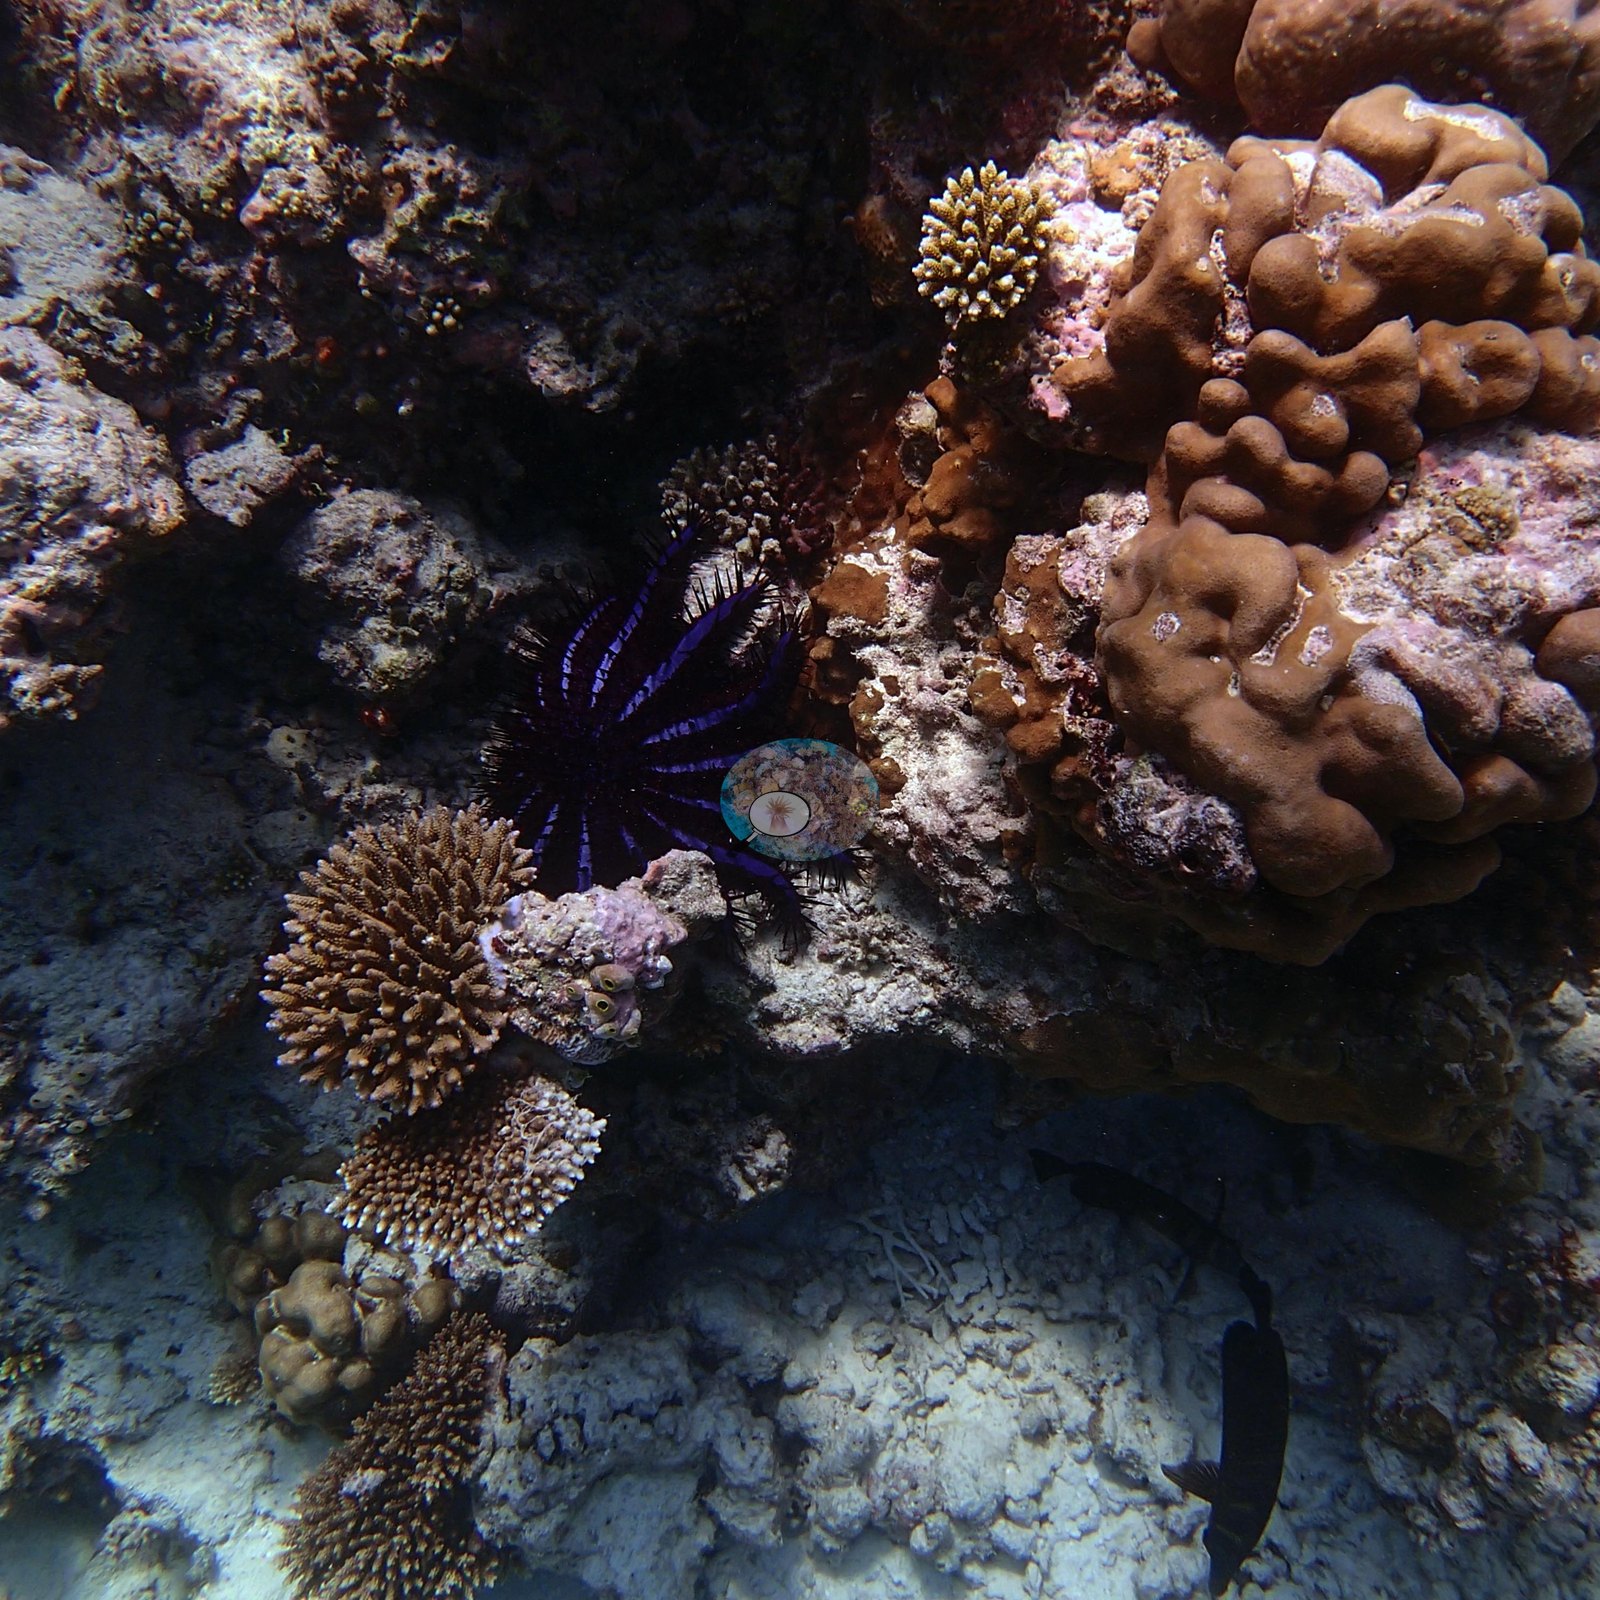
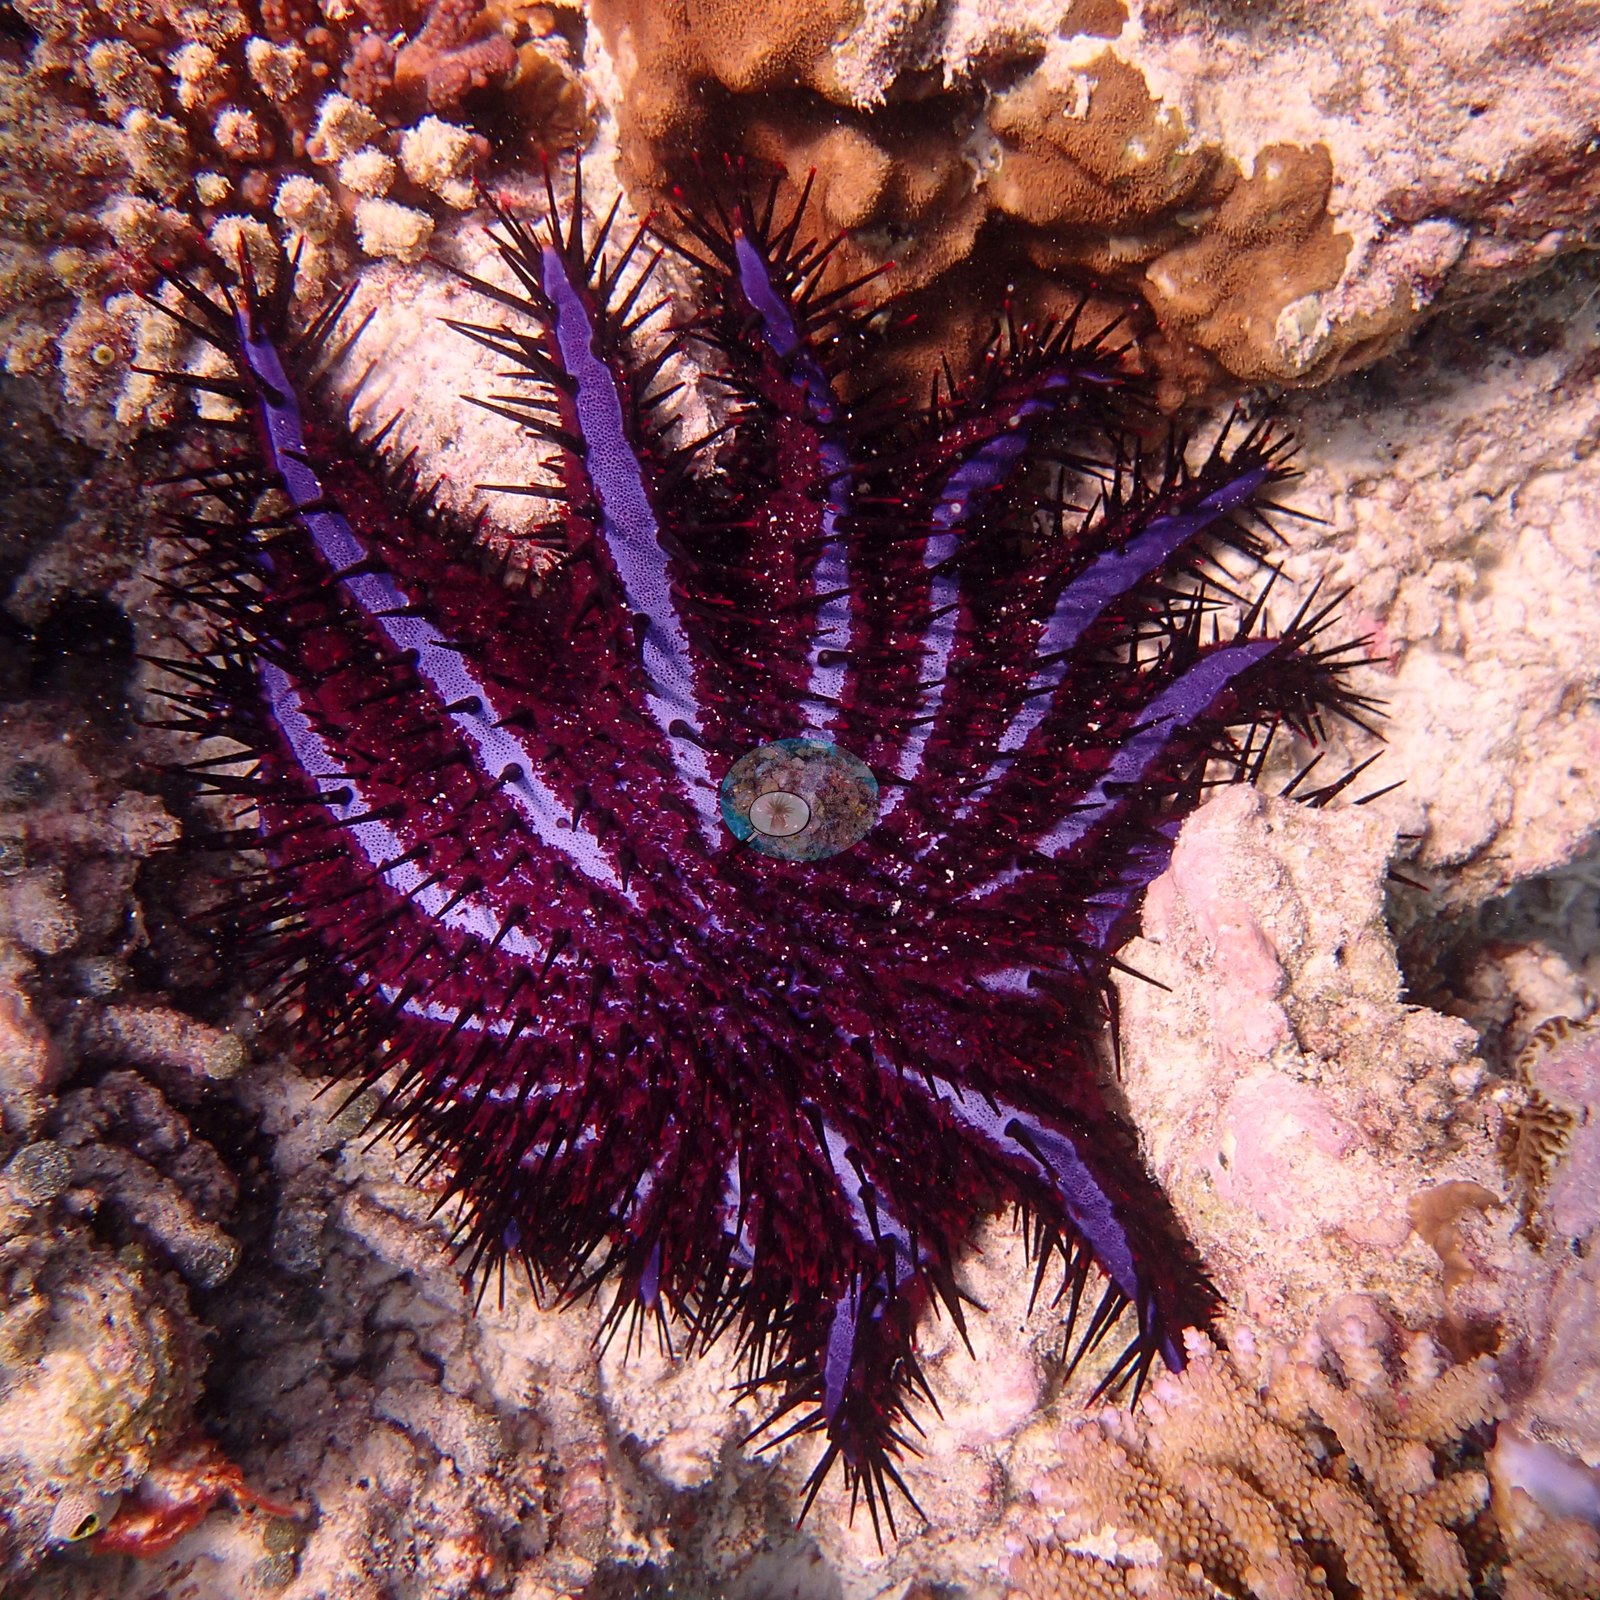
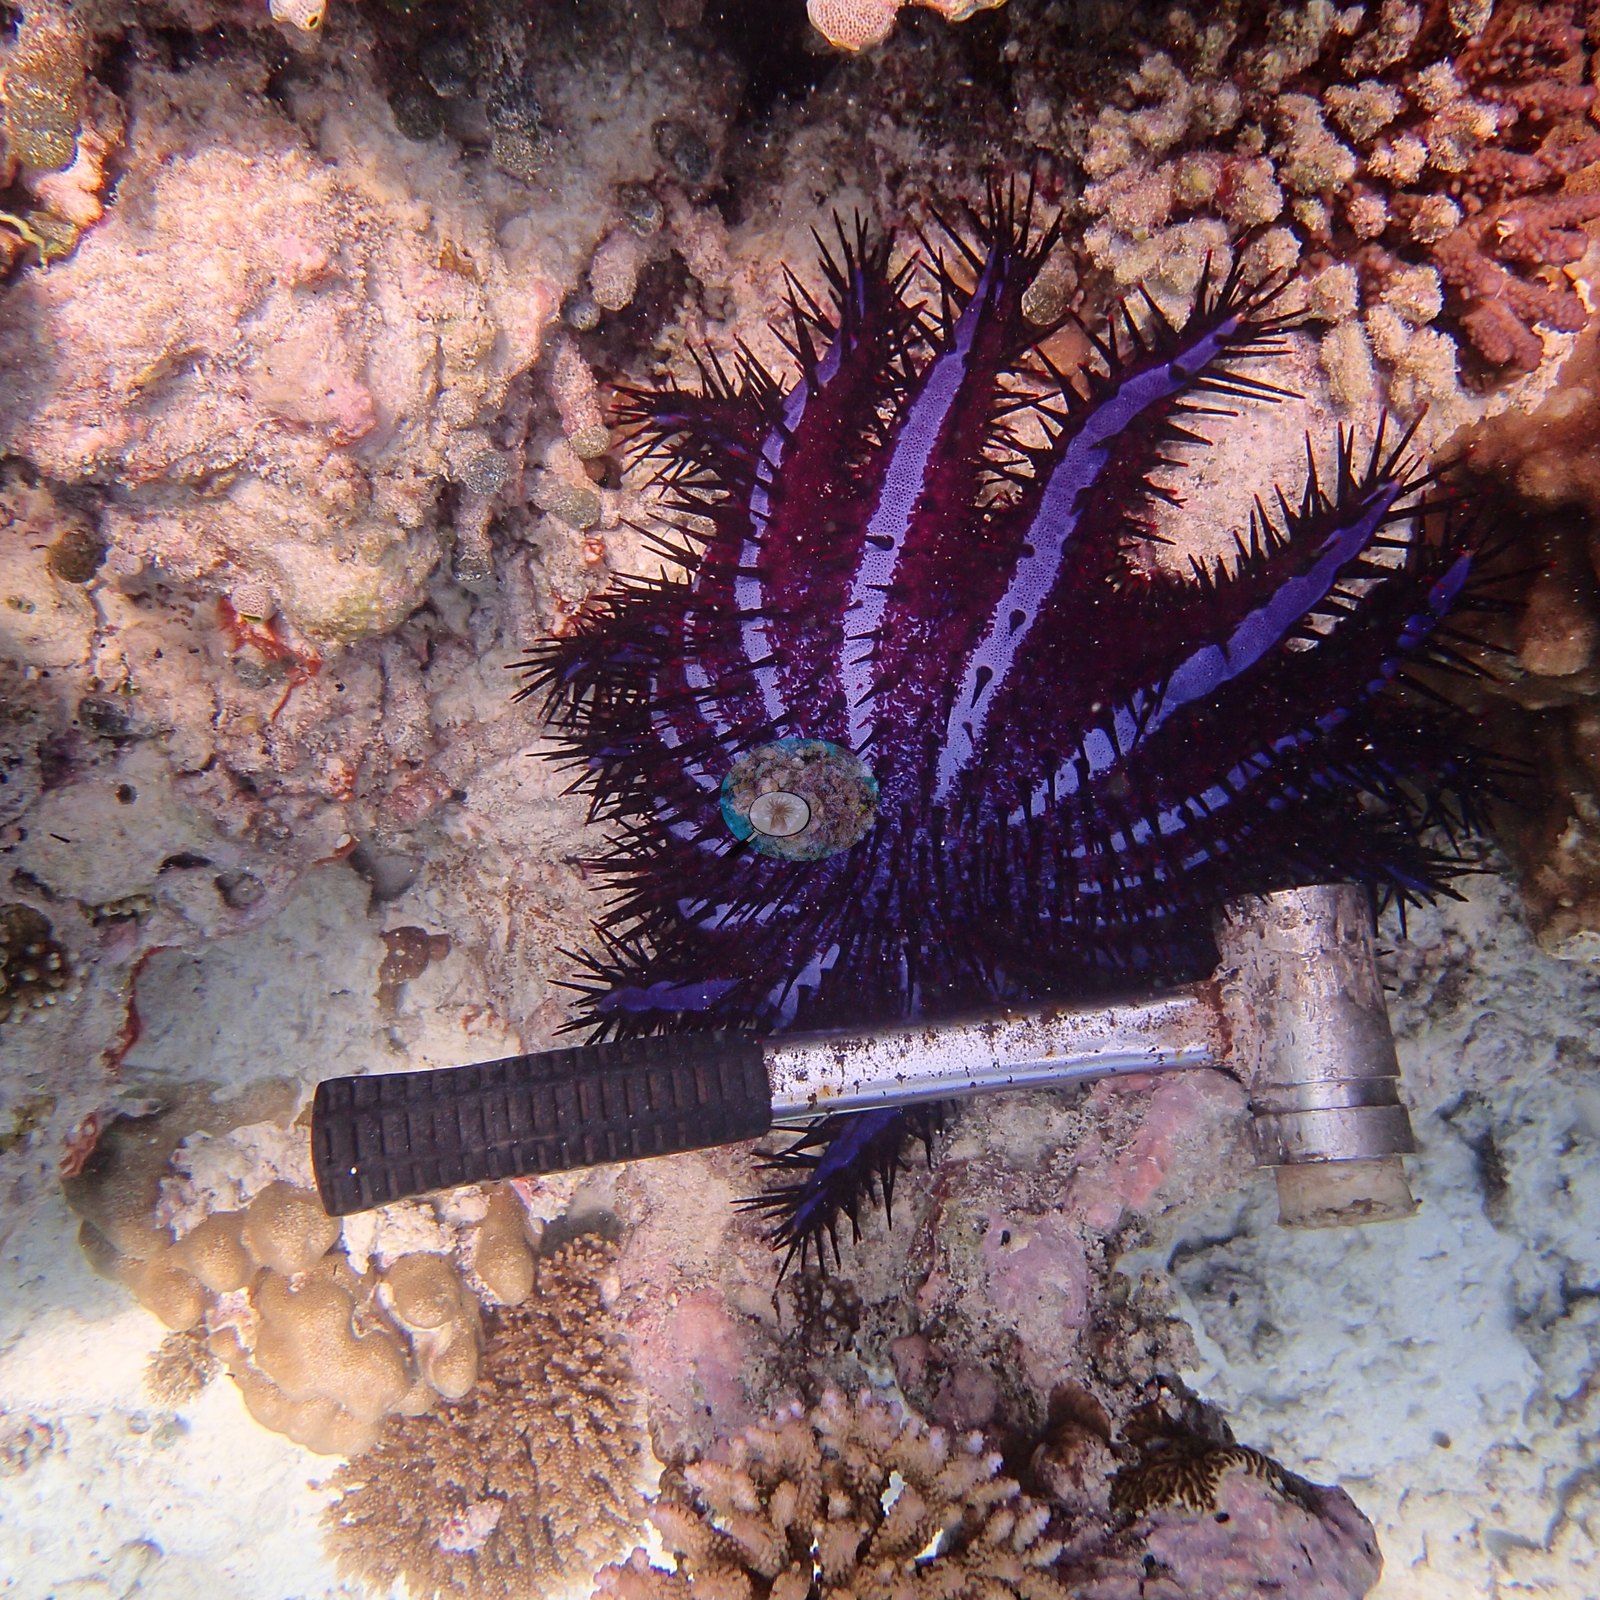
On the 14 January 2016 dive Anderson noted one crown-of-thorns starfish (e.g., Image 26, Image 38, Image 39), plus 5-10 Culcita cushion stars with extensive feeding damage in places; transect B also showed storm damage.
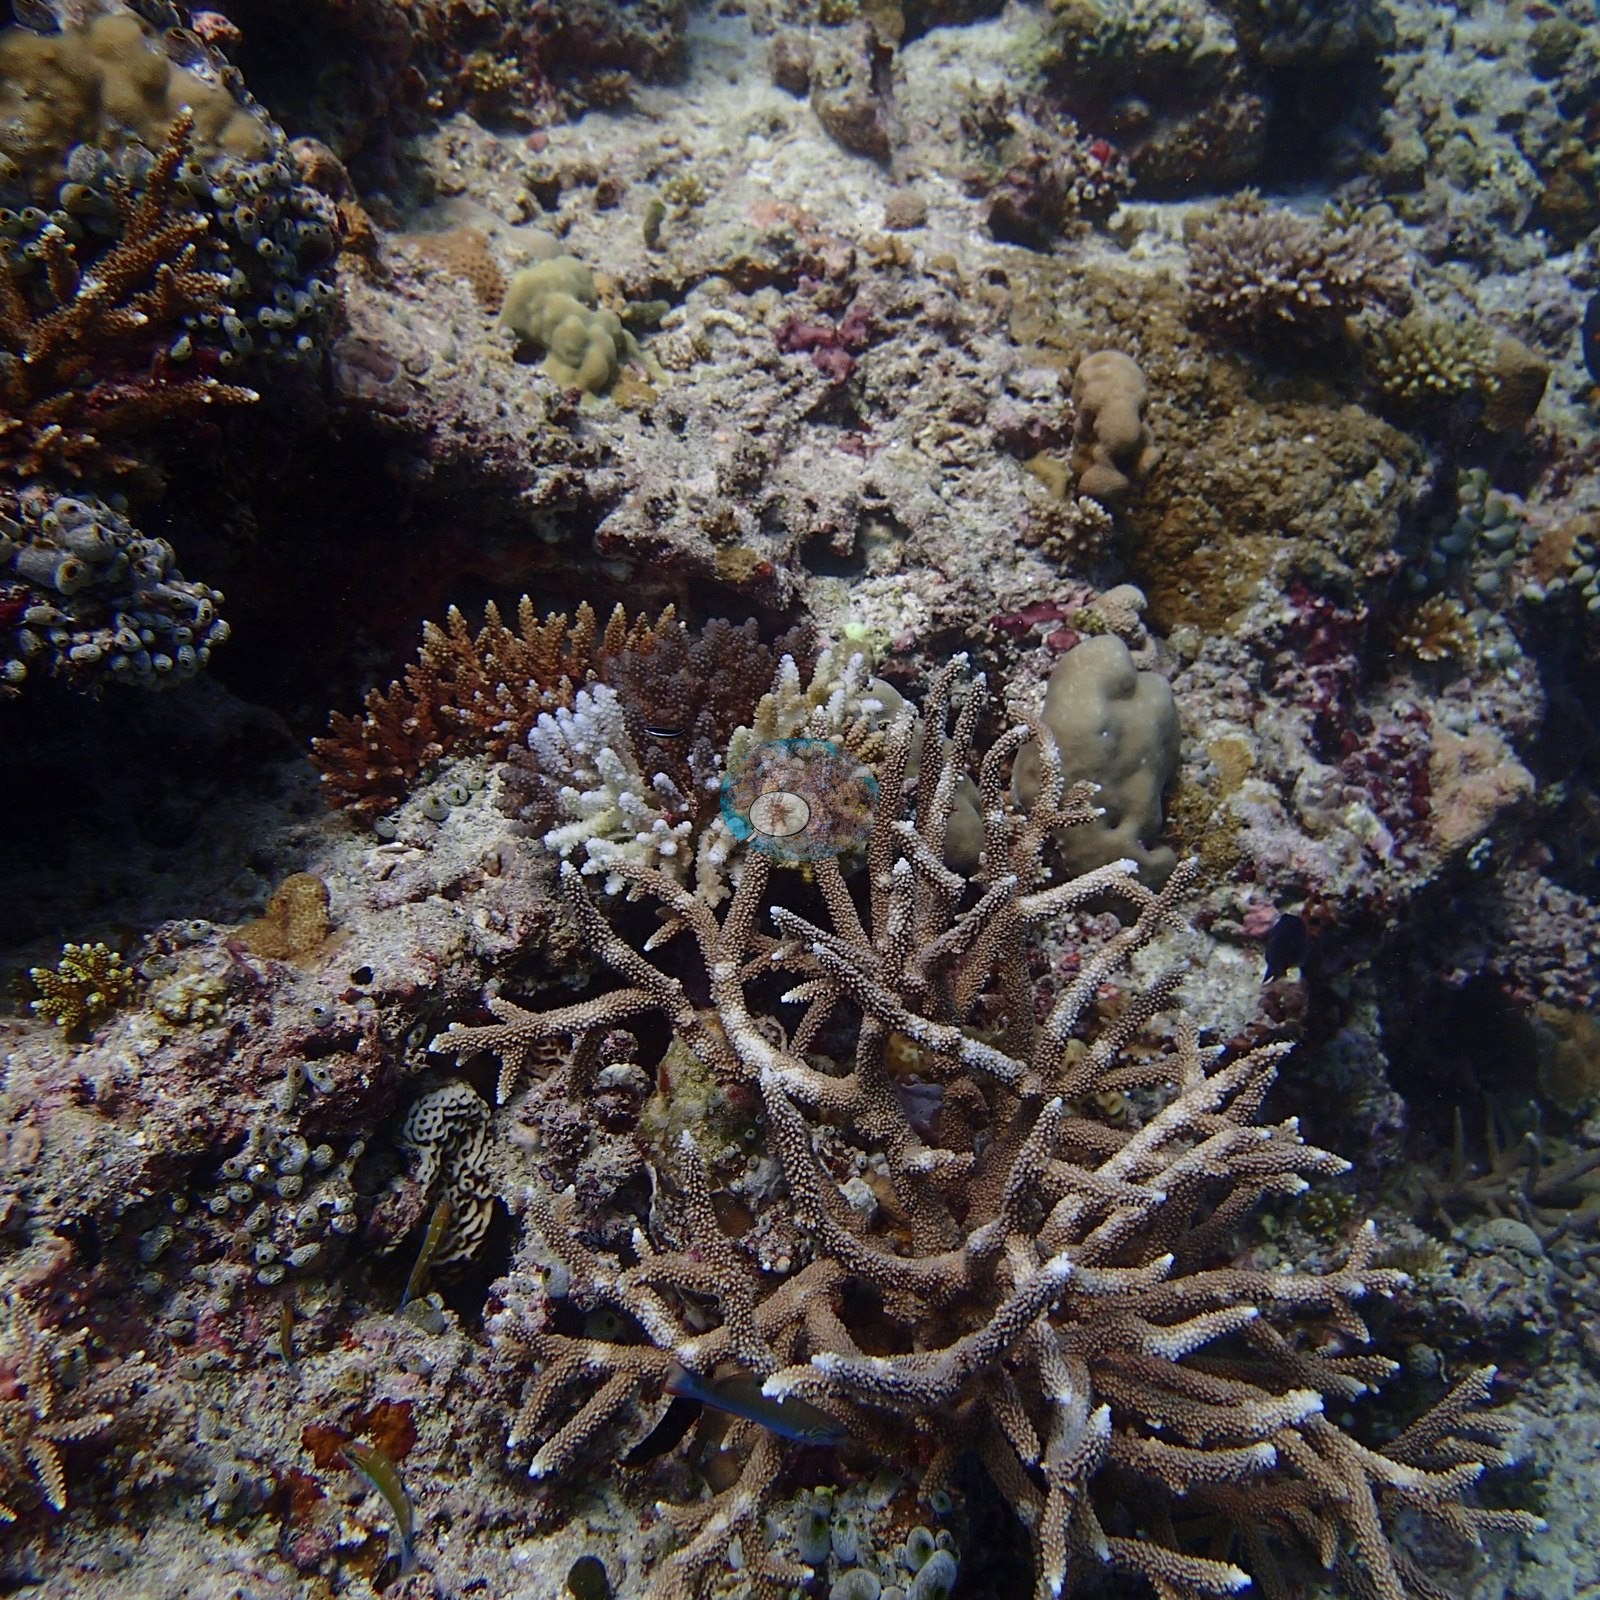
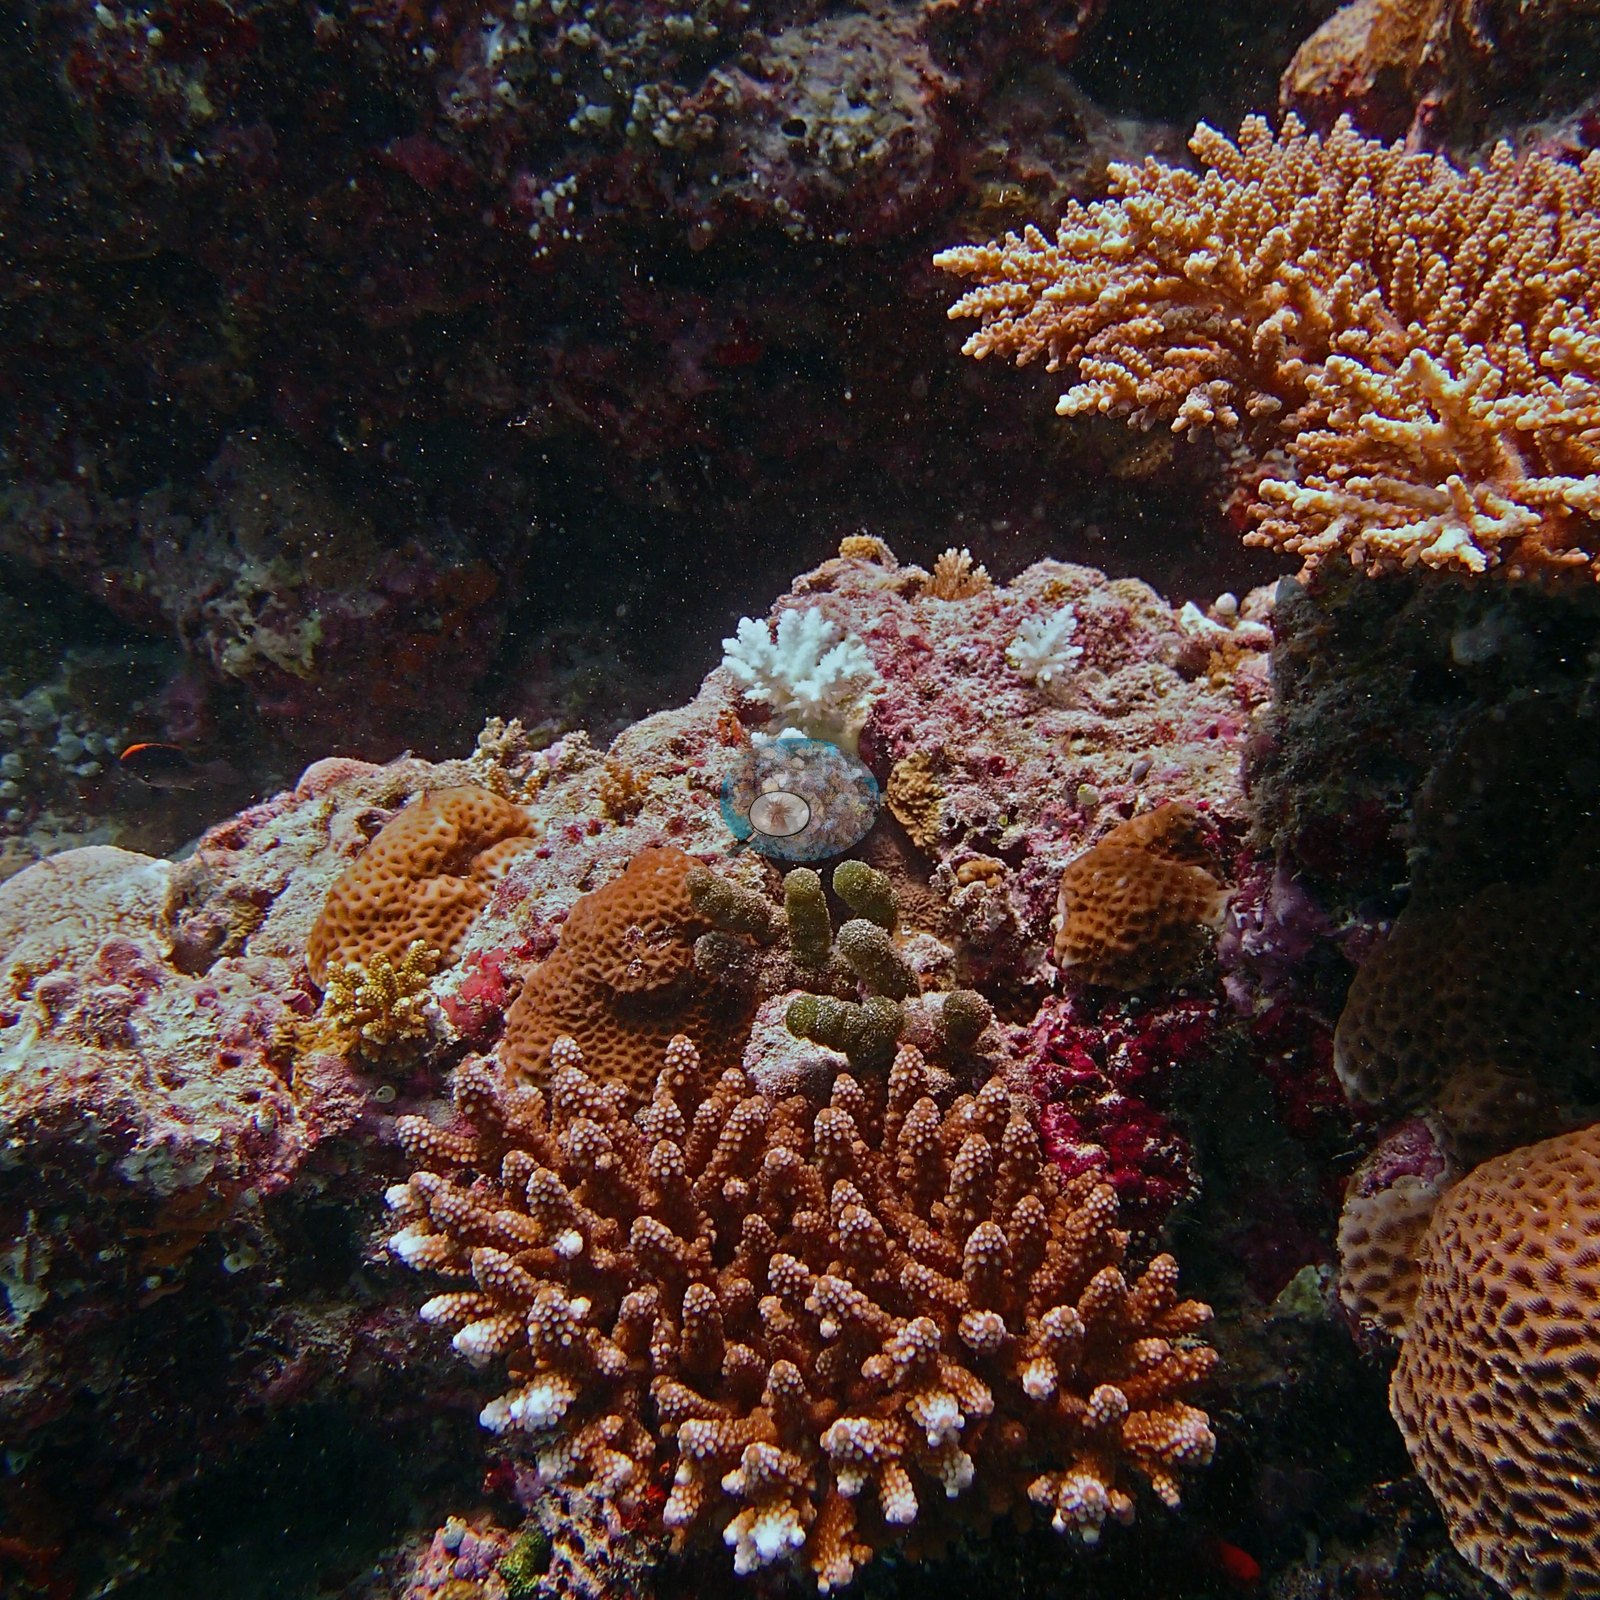
Several small branching colonies photographed on that dive were already stark white, recent mortality, cause not stated (e.g., Image 14, Image 35).
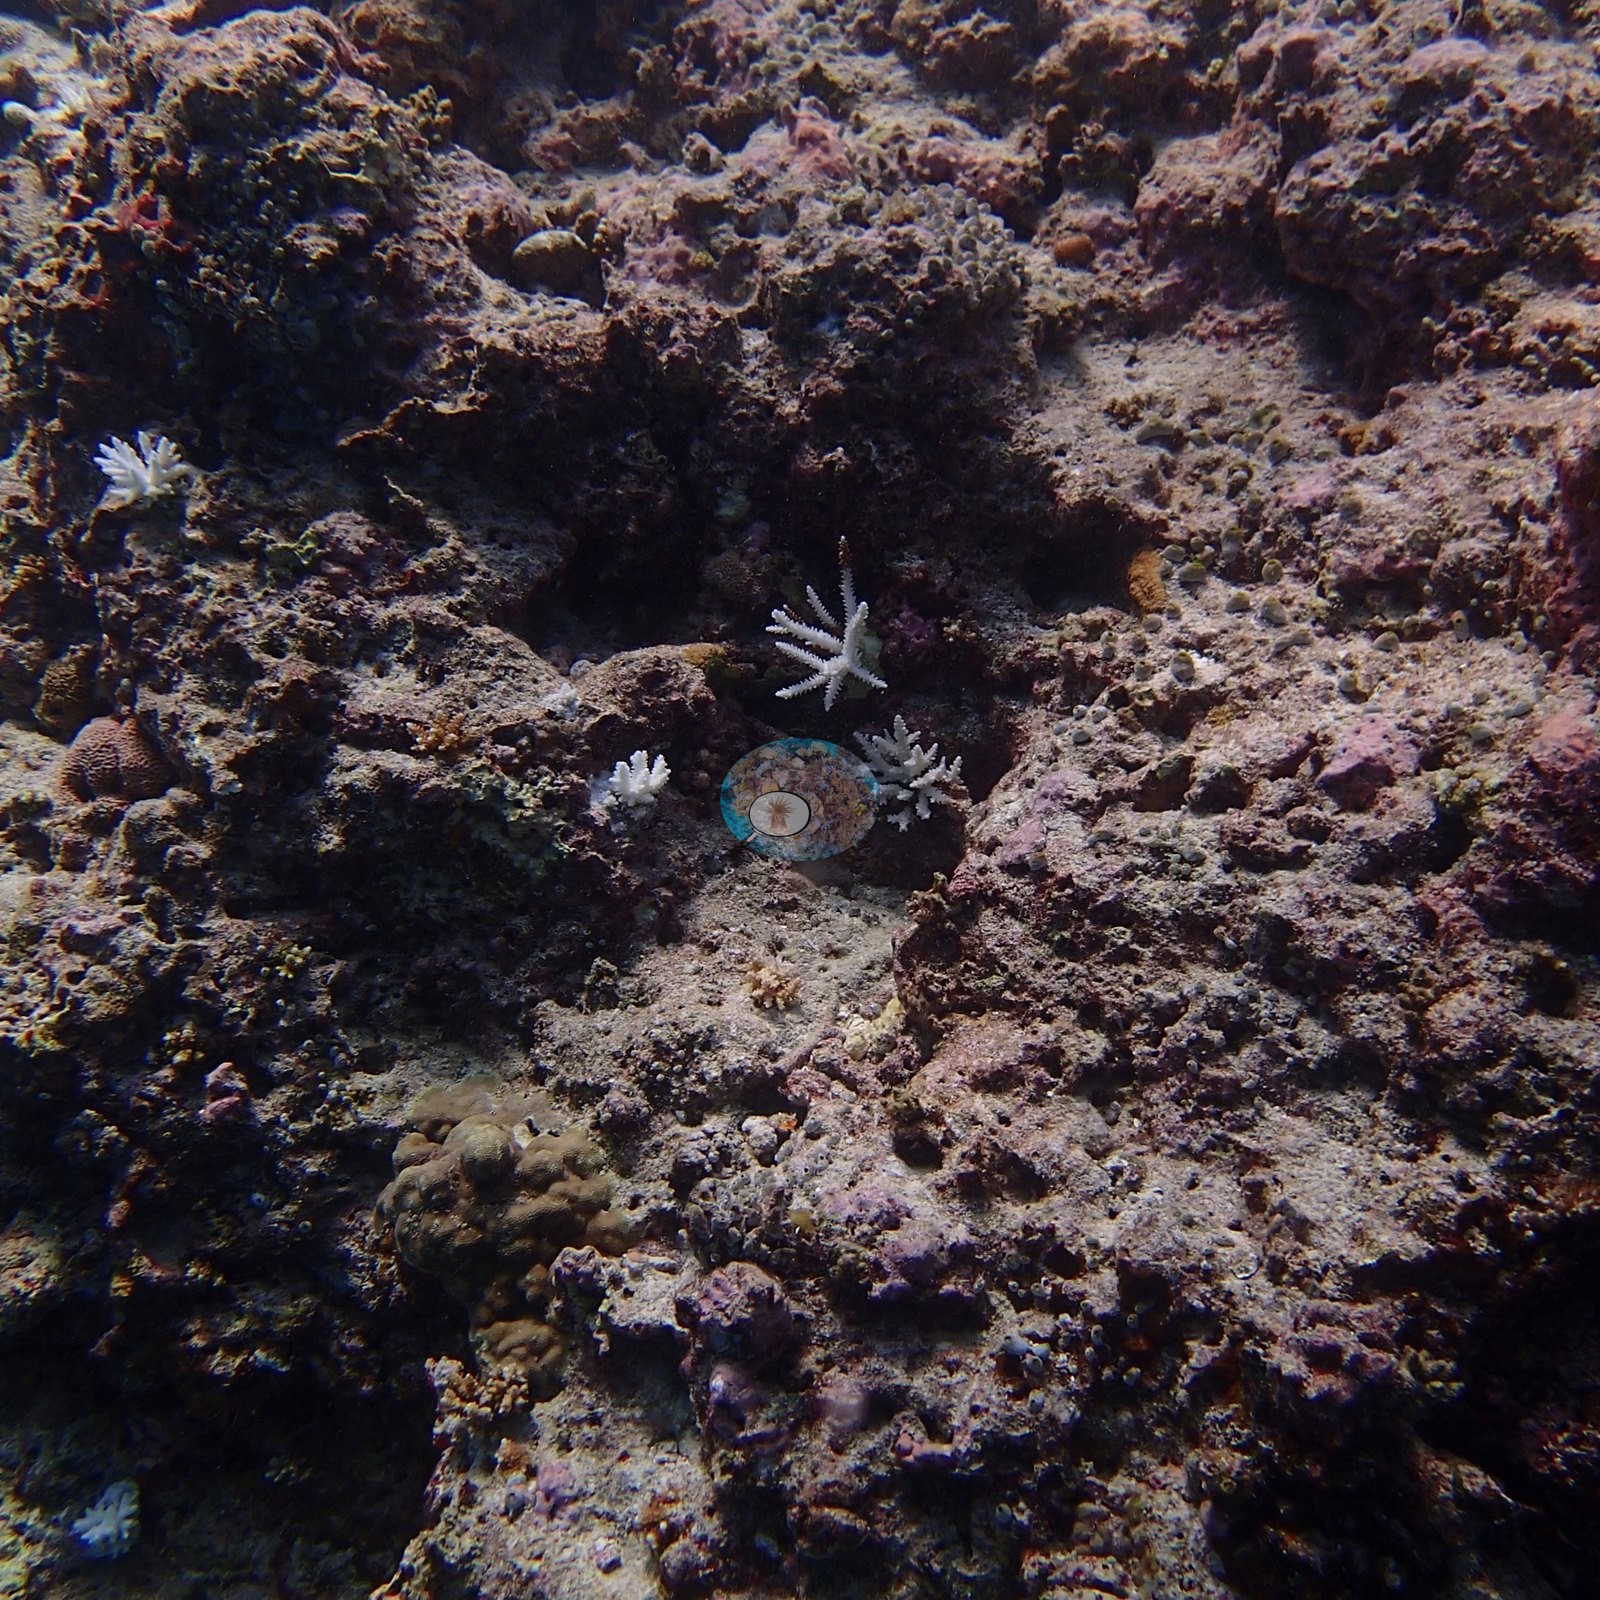
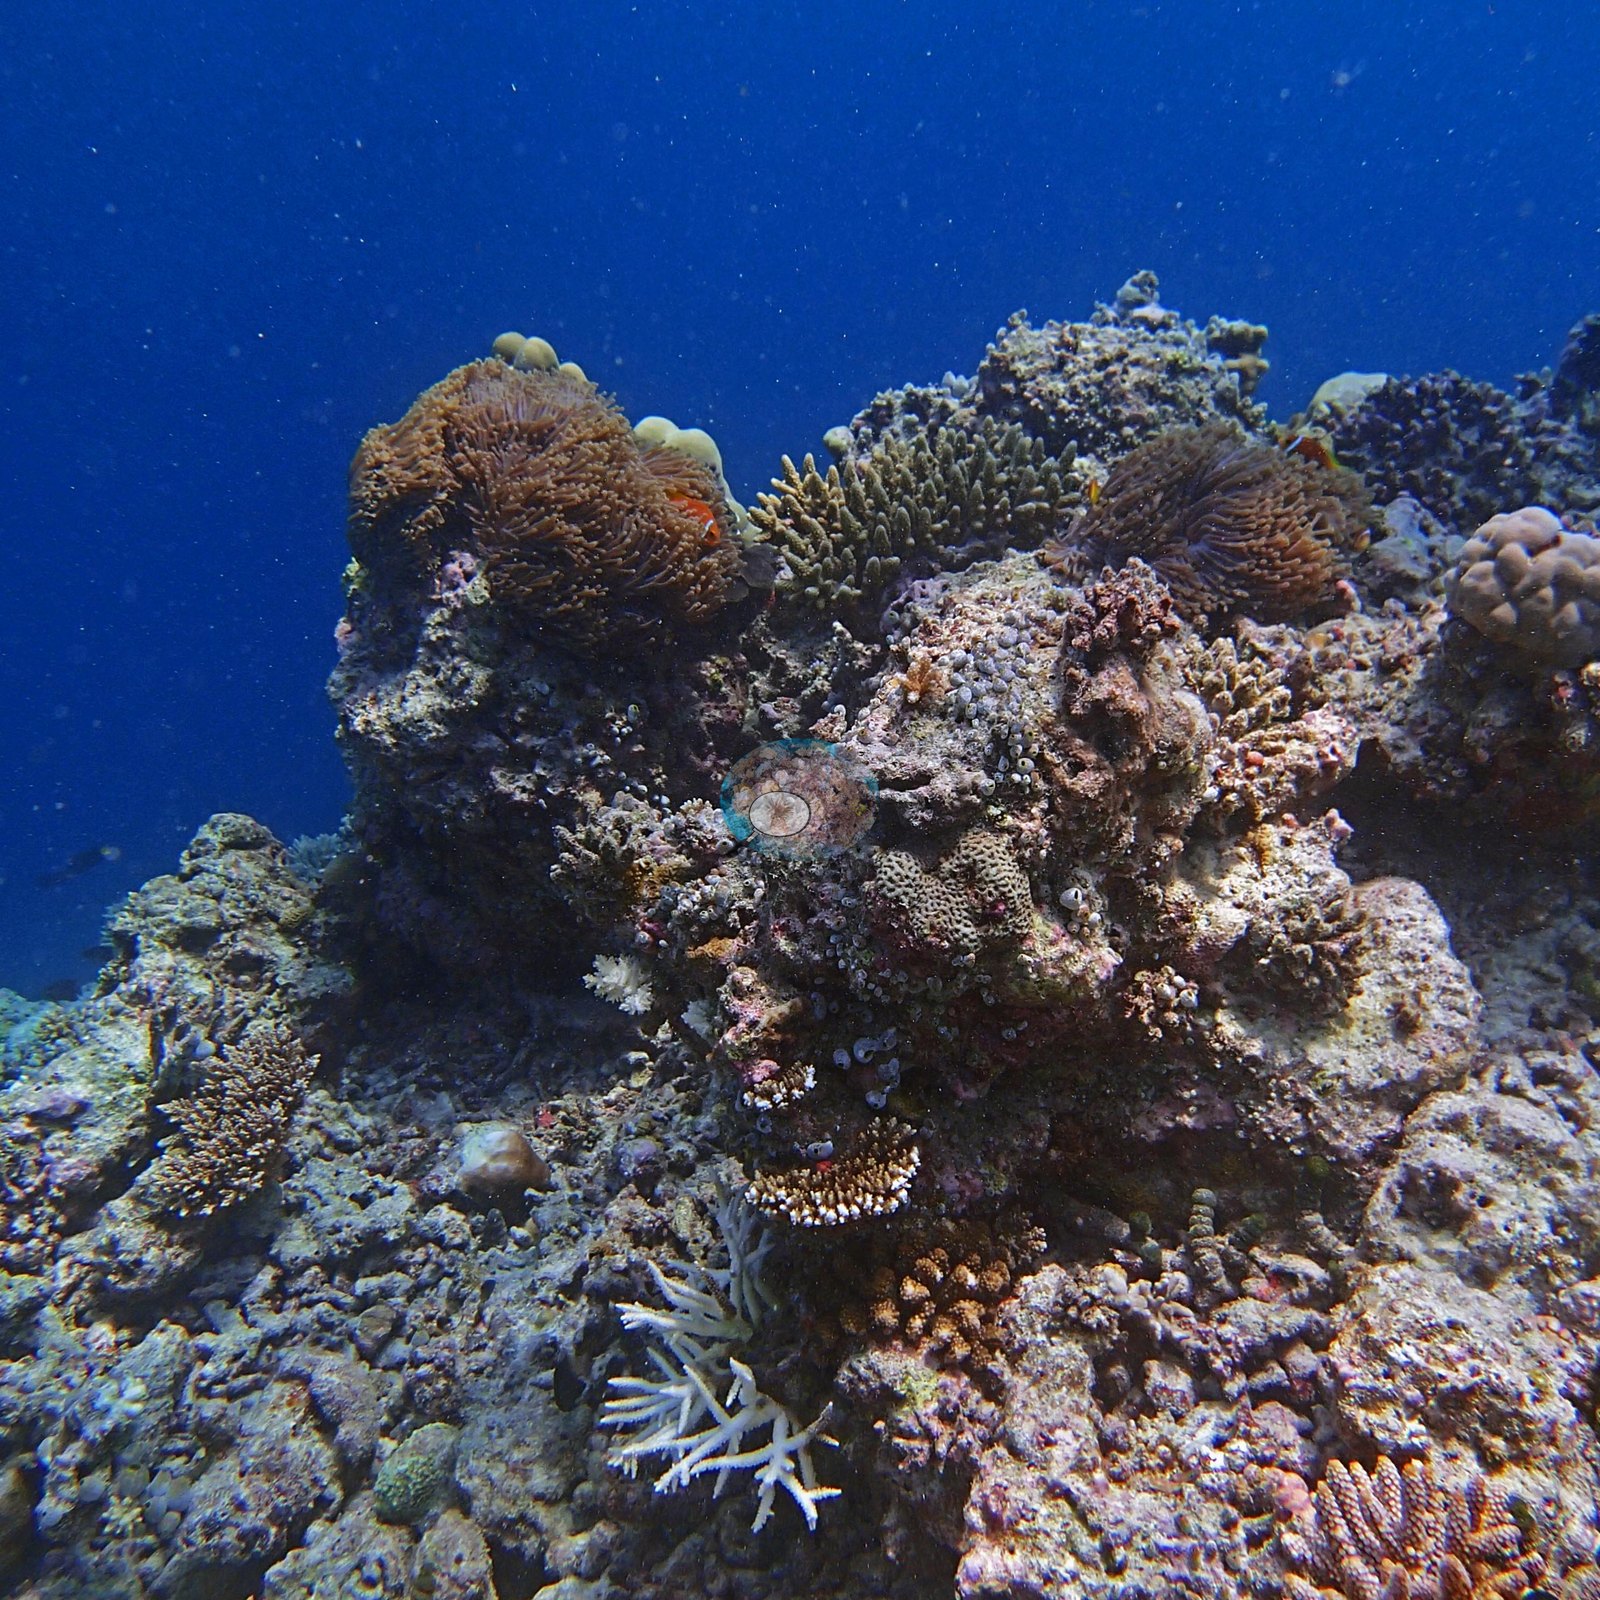
Of the 15 colonies sampled that week, 14 were healthy and one was 5-10% sickly or pale. When the team returned in April 2016, at the height of the El Niño, four out of five coral colonies here were bleached.
Comparisons with other data
Apart from our own transect survey shown here, we found no other surveys at this site as of 2026. Within 5 km, four independent stations recorded station-year means of 5.5–60% hard coral cover between 2015 and 2025; the nearest, Montefalcone et al. 2026 at Kuda Giri Wreck, 2.87 km away, read 39–43% between 2024 and 2025.
CV model comparison
More info
Same site, April 2016 → July 2016: 62% → 31% (Same reef, same survey program: Anderson's HARP / Coral Reef CPR long-term monitoring PIT transects, April 2016 → July 2016).More info
Claude computer vision on the January 2016 photos predates the bleaching and is shown beside both the April 2016 and the July 2016 transects; other rows are comparisons and are never averaged.| Method | Hard coral cover (%) | Photos (n) ± SE |
|---|---|---|
| Transect, July 2016 (headline) | 30.5 | |
| Transect, April 2016 (during the bleaching) | 61.6 | |
| In-house DINOv3, January 2016 photos | 23.1 | |
| CoralSCOP edited, January 2016 photos | 17.1 | |
| Claude, January 2016 photos (before the bleaching) | 20.9 | n = 49 · SE 2.0 |
The three computer-vision methods agree within 6.0 pp (17.1–23.1%) and read 7.4–13.4 pp below the in-water transect (30.5%); the headline is the in-water transect because a diver transect is independent of the photographs.
See a more detailed, stand-alone version of this table.
Independent surveys nearby
| Agency / program | Year(s) | Stations / distance | Link |
|---|---|---|---|
| Montefalcone et al. 2026 | 2024–2025 | 2 stations, 2.87–4.29 km | Records ↓ |
| Reef Check | 2022 | 1 station, 4.83 km | Records ↓ |
| XL Catlin Seaview Survey | 2015–2017 | 1 station, 4.79 km | Records ↓ |
 Coral Reef DiagnosticsYear-average (illustrative only, programs differ)
Within 5 km, 4 independent survey stations recorded hard coral cover in 7 surveys between 2015 and 2025. Of the 3 stations surveyed in more than one year, 2 were scored by divers or by people annotating photographs: 2 declined (by 4.0–17 points) between their first and latest surveys. The other 1 was scored by automated image analysis: changed by 7 points or less, inside the 7-point method-noise floor (inconclusive). The longest record, transect 37035 (XL Catlin Seaview Survey, 4.79 km away), went from 7.1% in 2015 to 5.5% in 2017. Since 2021, station-year means average 41% (range 19–60%; n = 5 station-years from 5 surveys). This site's own estimate (31%) is not compared with these surveys: none lies within 2 km.
Collected by other programs using different methods (Reef Check uses point-intercept transects; the XL Catlin Seaview Survey uses photo-transects with automated image annotation), so these are context for the figures above, not a like-for-like comparison. Where a station was surveyed more than once, the cell shows either the range of its values or, as a single value, the mean of surveys made in one year. Station names are not dive-site names.
| Agency | Site / location | Date | Hard coral cover (%) | Distance | Link |
|---|---|---|---|---|---|
| XL Catlin Seaview Survey | transect 37035 | 2015–2017 | 5.5–7.1% (2 surveys) | 4.79 km | doi:10.14264/uql.2019.930 |
| Reef Check | Gulhi Island Backreef | 2022 | 19% | 4.83 km | — |
| Montefalcone et al. 2026 | Kuda Giri Wreck | 2024–2025 | 39–43% (2 surveys) | 2.87 km | doi:10.1007/s00338-026-02850-x |
| Montefalcone et al. 2026 | Bajiy Giri | 2024–2025 | 43–60% (2 surveys) | 4.29 km | doi:10.1007/s00338-026-02850-x |
Data & links
All images from Coral Reef Diagnostics. Data are from Coral Reef Diagnostics and the organizations named in the data sources above.
© Coral Reef Diagnostics.
References
- Montefalcone M, Bianchi CN, Morri C, Ahmed H, Pancrazi I (2026). Outcomes of the fourth global coral bleaching (2023–2024) in the Maldives. Coral Reefs. DOI
- Gonzalez-Rivero M, et al. (2019). Seaview Survey photo-quadrat and image classification dataset. The University of Queensland (UQ eSpace) data collection. DOI