
Overview of 24 dive sites. Figures are averages across the sites that report them (n = sites with a value); each site's own page has its individual values. Part of the Red Sea overview. Regional summaries: Jeddah / KAUST (Thuwal) / Rabigh, Yanbu.
⬇ Download this overview as a report card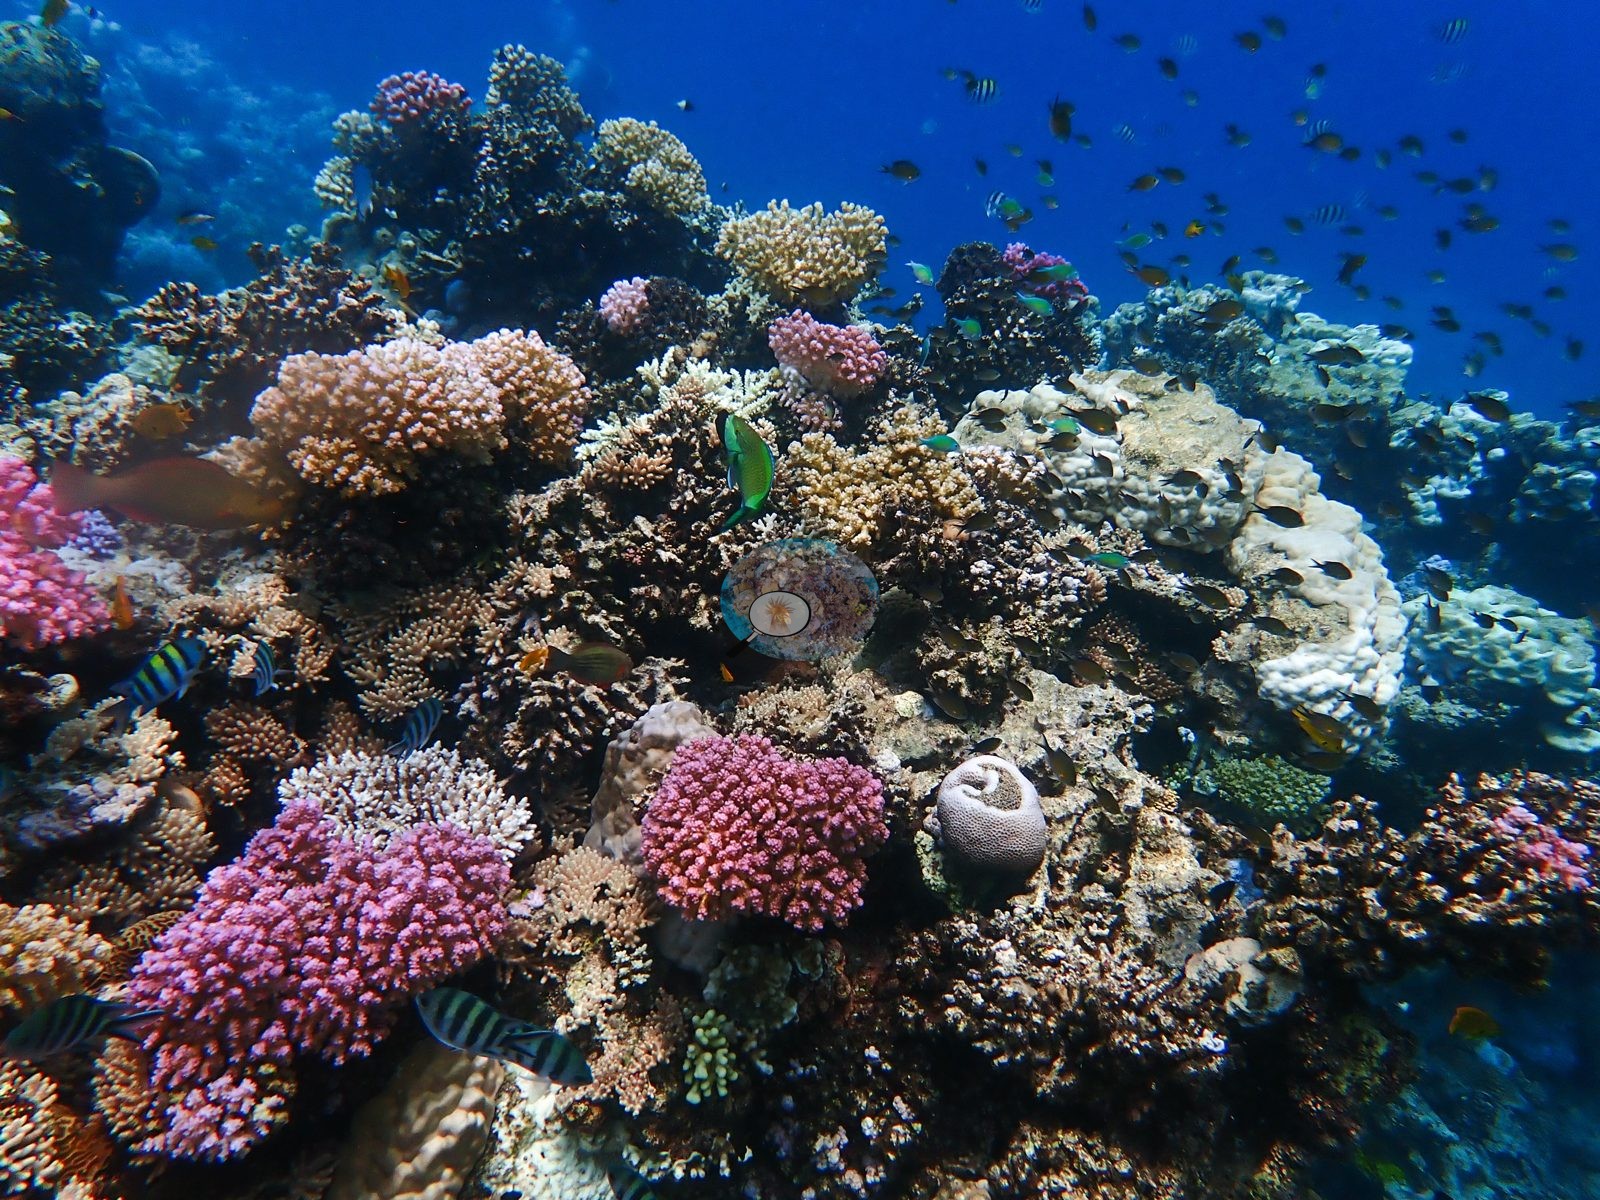

Heat stress
Long-term record: 10 years since 1985 reached 8 or more °C-weeks at NOAA’s Makkah-Madine Saudi Arabia station. Download the annual DHW data (CSV).
24 sites in this region — click a marker to open that site.
Overview
Saudi Arabia has more coral reef than any other country in the seas around Arabia, and its Red Sea coast runs from the Gulf of Aqaba to the Yemen border (Spalding et al. 2001). In the north the continental shelf is narrow or absent, reef flats are slim and reef profiles are often steep to sheer, and the shelf broadens southward, with a fairly rapid change around 20°N. Fringing reefs with narrow flats line much of the coast. Offshore, the Al Wadj Bank holds a complex of fringing, patch and barrier reefs with small islands, and from Al Wadj to Jeddah runs a broken barrier-type structure that has been called the Little Barrier Reef. The coast supports the full range of Red Sea species, including northern endemics, and surveys between 1997 and 1999 recorded about 260 hard coral species. In August and September 1998, reefs at some sites between Yanbu and Rabigh bleached heavily during a spell of high sea temperatures, and Souter et al. (2021) report that the 1998 impacts were most severe in the central-northern Saudi Red Sea, especially near Rabigh, although most bleached reefs across the region recovered. Spalding et al. (2001) estimate about 6,660 km² of coral reef for Saudi Arabia, a national figure that includes its Arabian Gulf coast; Souter et al. (2021) give 7,800 km² for the northern and central Red Sea subregion.
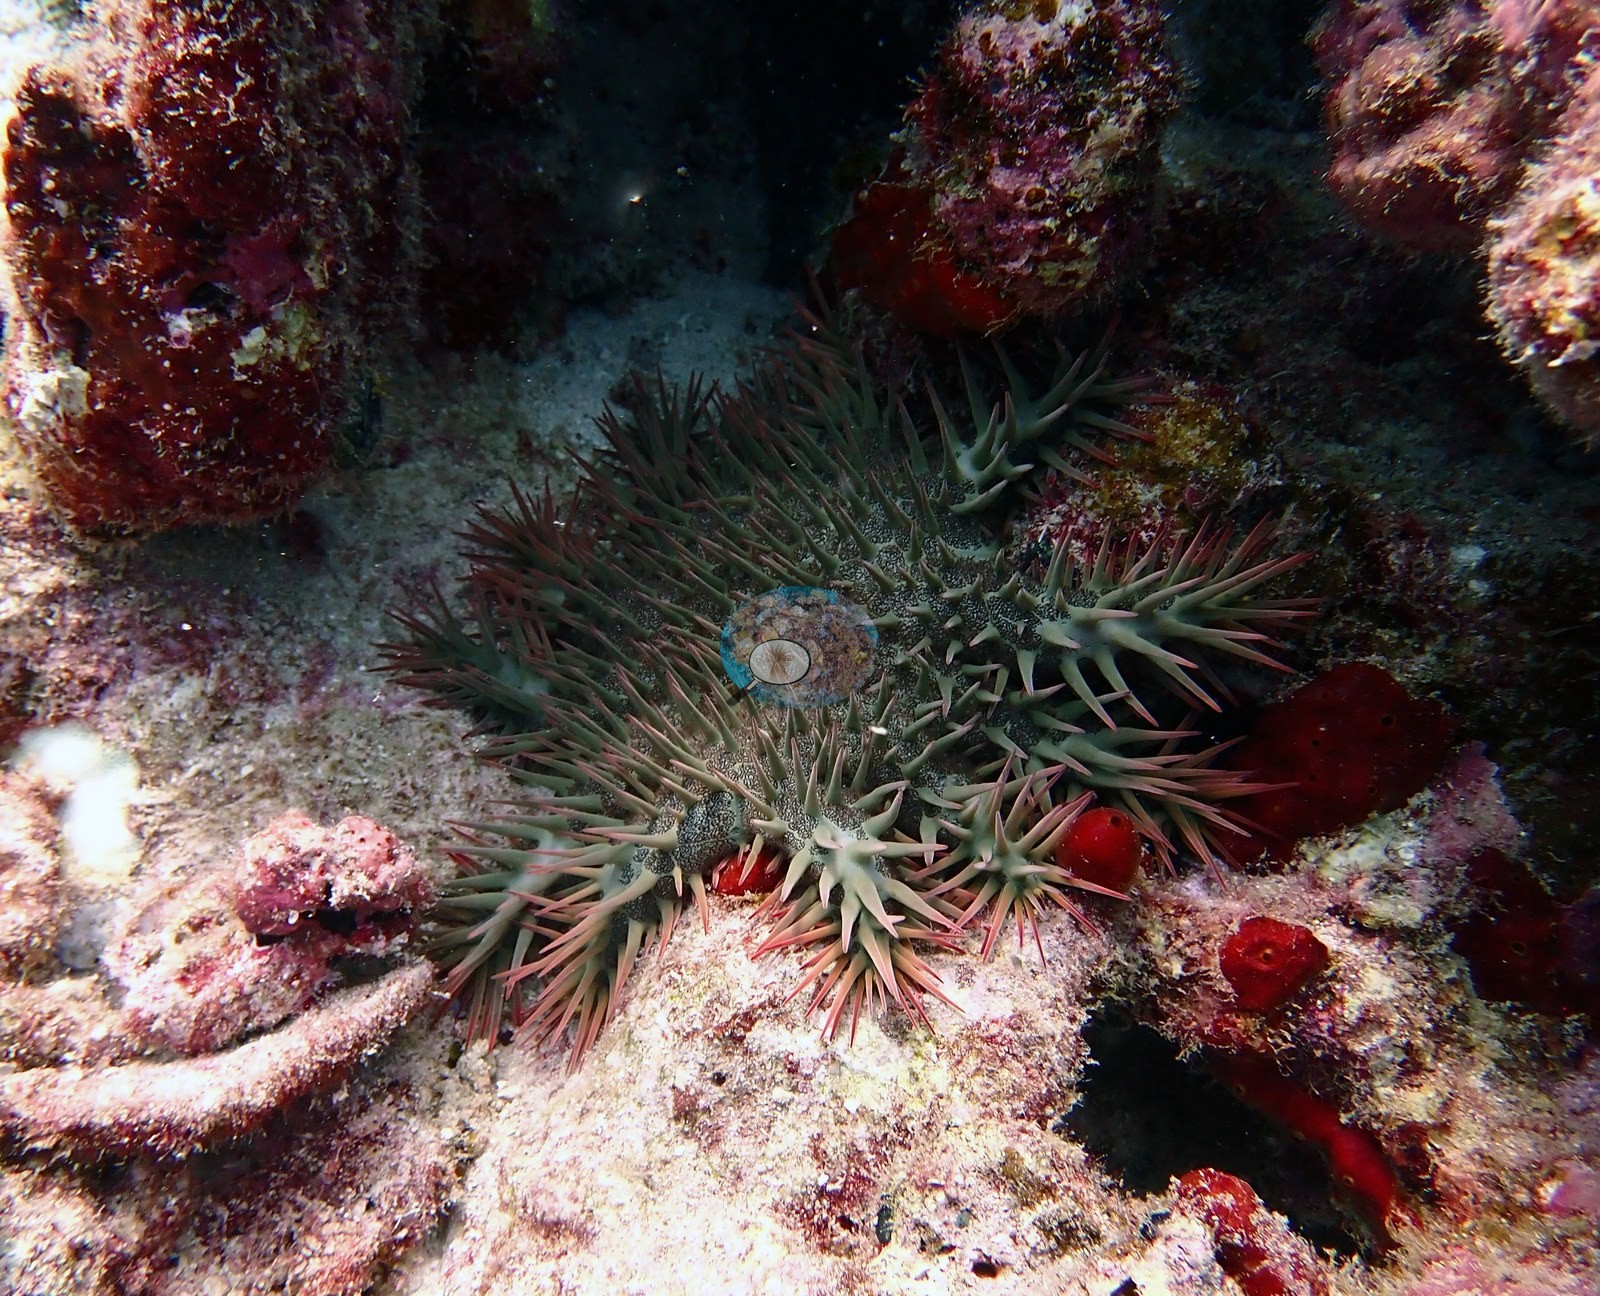
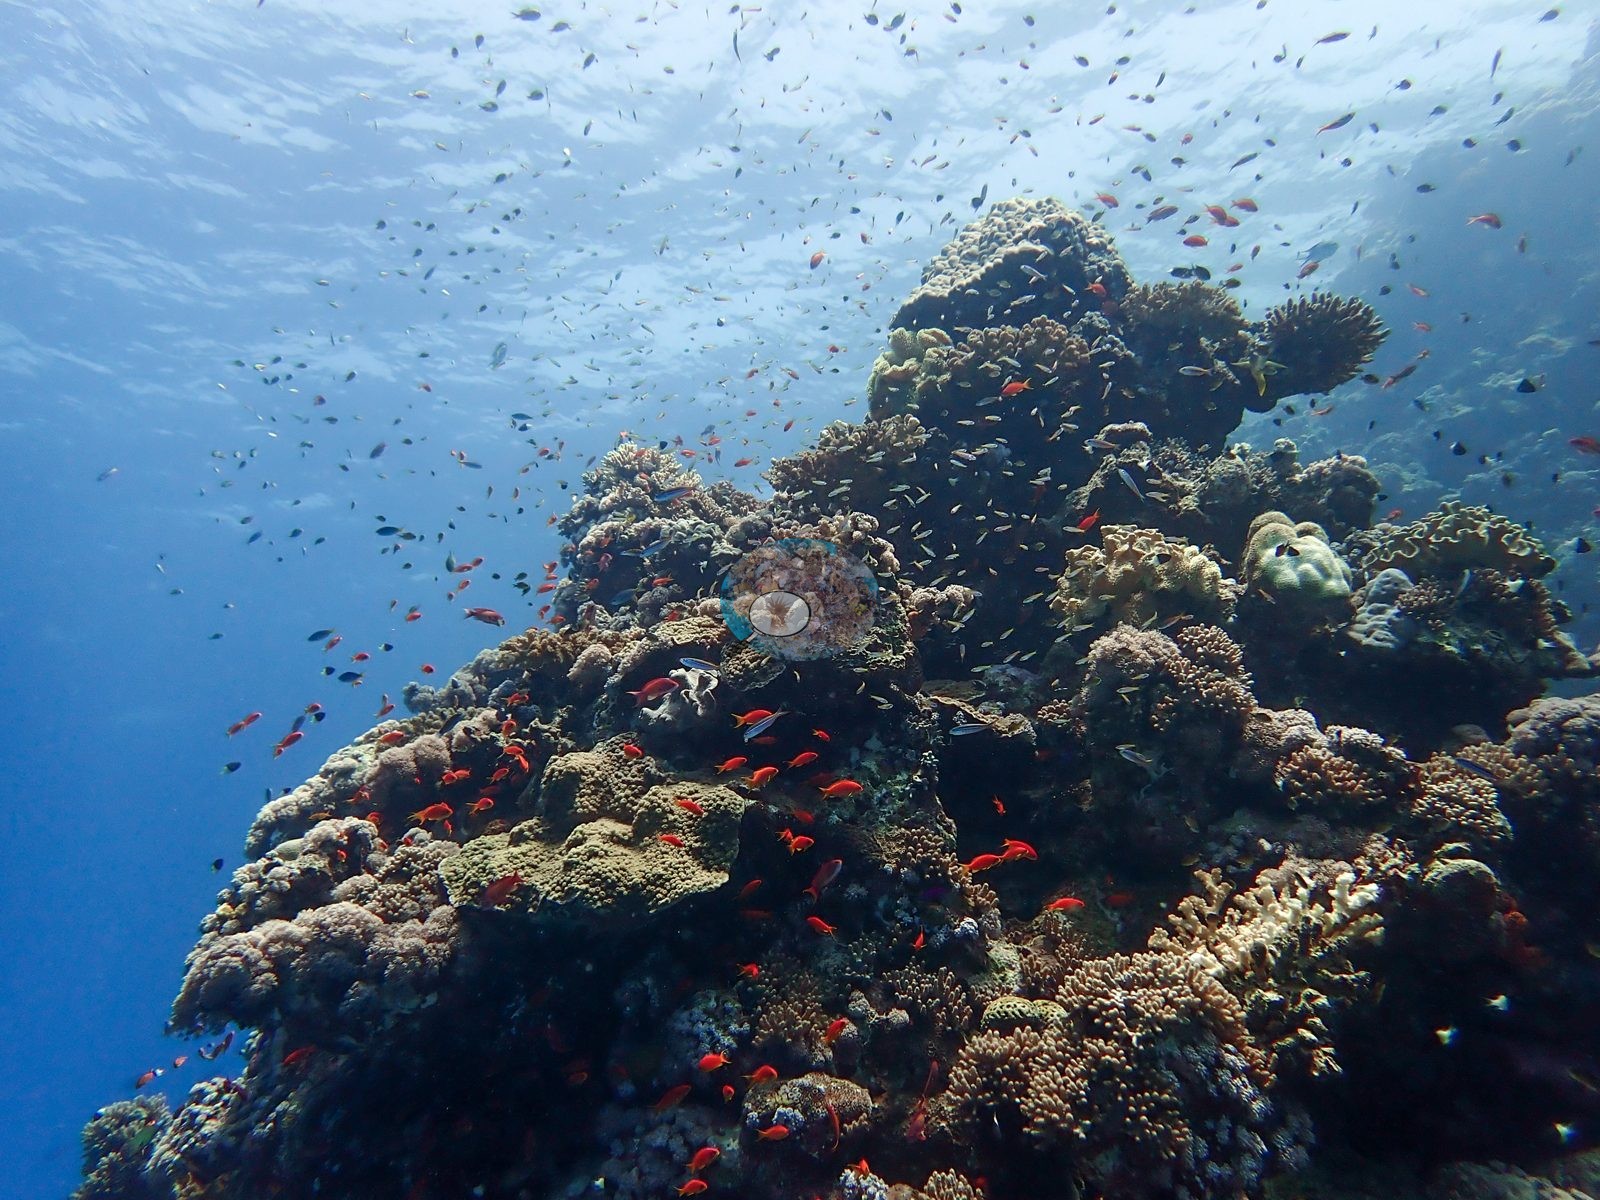
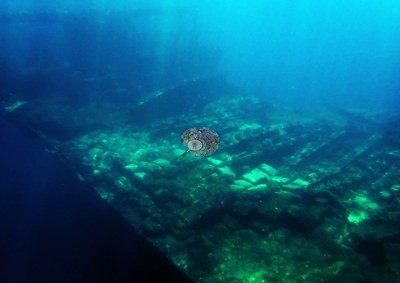
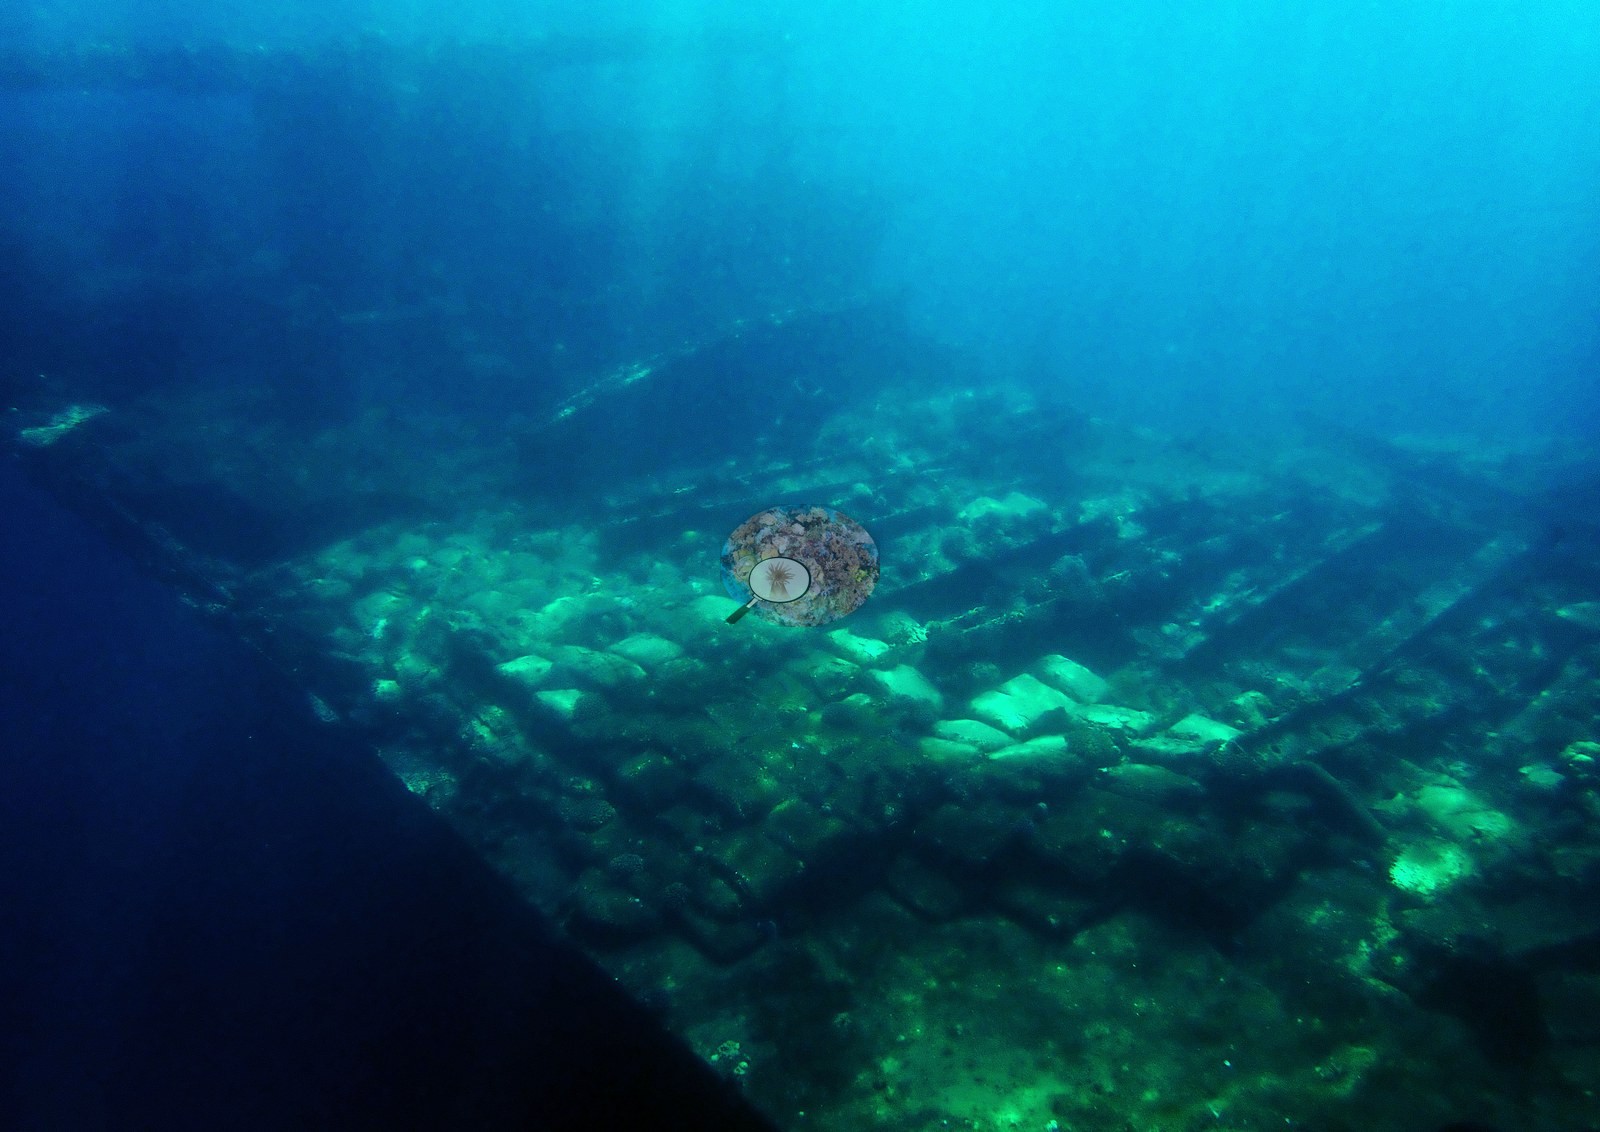
This page gathers 24 sites in three units, all dived between September 2023 and October 2024. Jeddah / KAUST (Thuwal) / Rabigh holds 15: eight off Thuwal worked with Coastline (KAUST), six off Jeddah, and one shore-entry reef north of Rabigh. Yanbu holds seven offshore reefs in the Yanbu and Umluj area, dived with Umluj Dive Center, and South of Jeddah holds two. Al Qunfudah lies far to the south of the rest, at 19.10°N, about 290 km below the Jeddah cluster and 560 km below Yanbu, and its two unnamed reefs were dived together on 30 August 2024 with Al Qunfudah Diver at 31.5°C. The first is an old, structurally complex framework carrying a thin living skin — consolidated rock and coralline-crusted rubble with colonies scattered rather than continuous, and a crown-of-thorns starfish photographed on rubble. The second, a few hundred meters away, has more standing structure, including a waist-high candelabra Acropora a couple of meters across and staghorn thickets over tiers of plating corals. The settings run from a wave-lit reef flat a meter or two under the surface at Alrass Alakhdar and a shallow gully-and-canyon complex at Al Fasmah, through high-relief spur-and-groove honeycombed with swim-throughs at Cement Reef and a Porites-carpeted slope at Um Mankout, to near-vertical walls at Rose Reef and Thetis and eroded, heavily bioeroded pinnacles and caverns rising from sand at Cave Reef. Four members are artificial or barely coralline: the Cement Wreck and Chicken Wreck at Thuwal and Jeddah, and Drogon Corals, which is mostly a sand plain with isolated bommies. Two sites have no photographs and no cover value at all, Middle Reef off Thuwal and Al Shbareer reef off Yanbu.
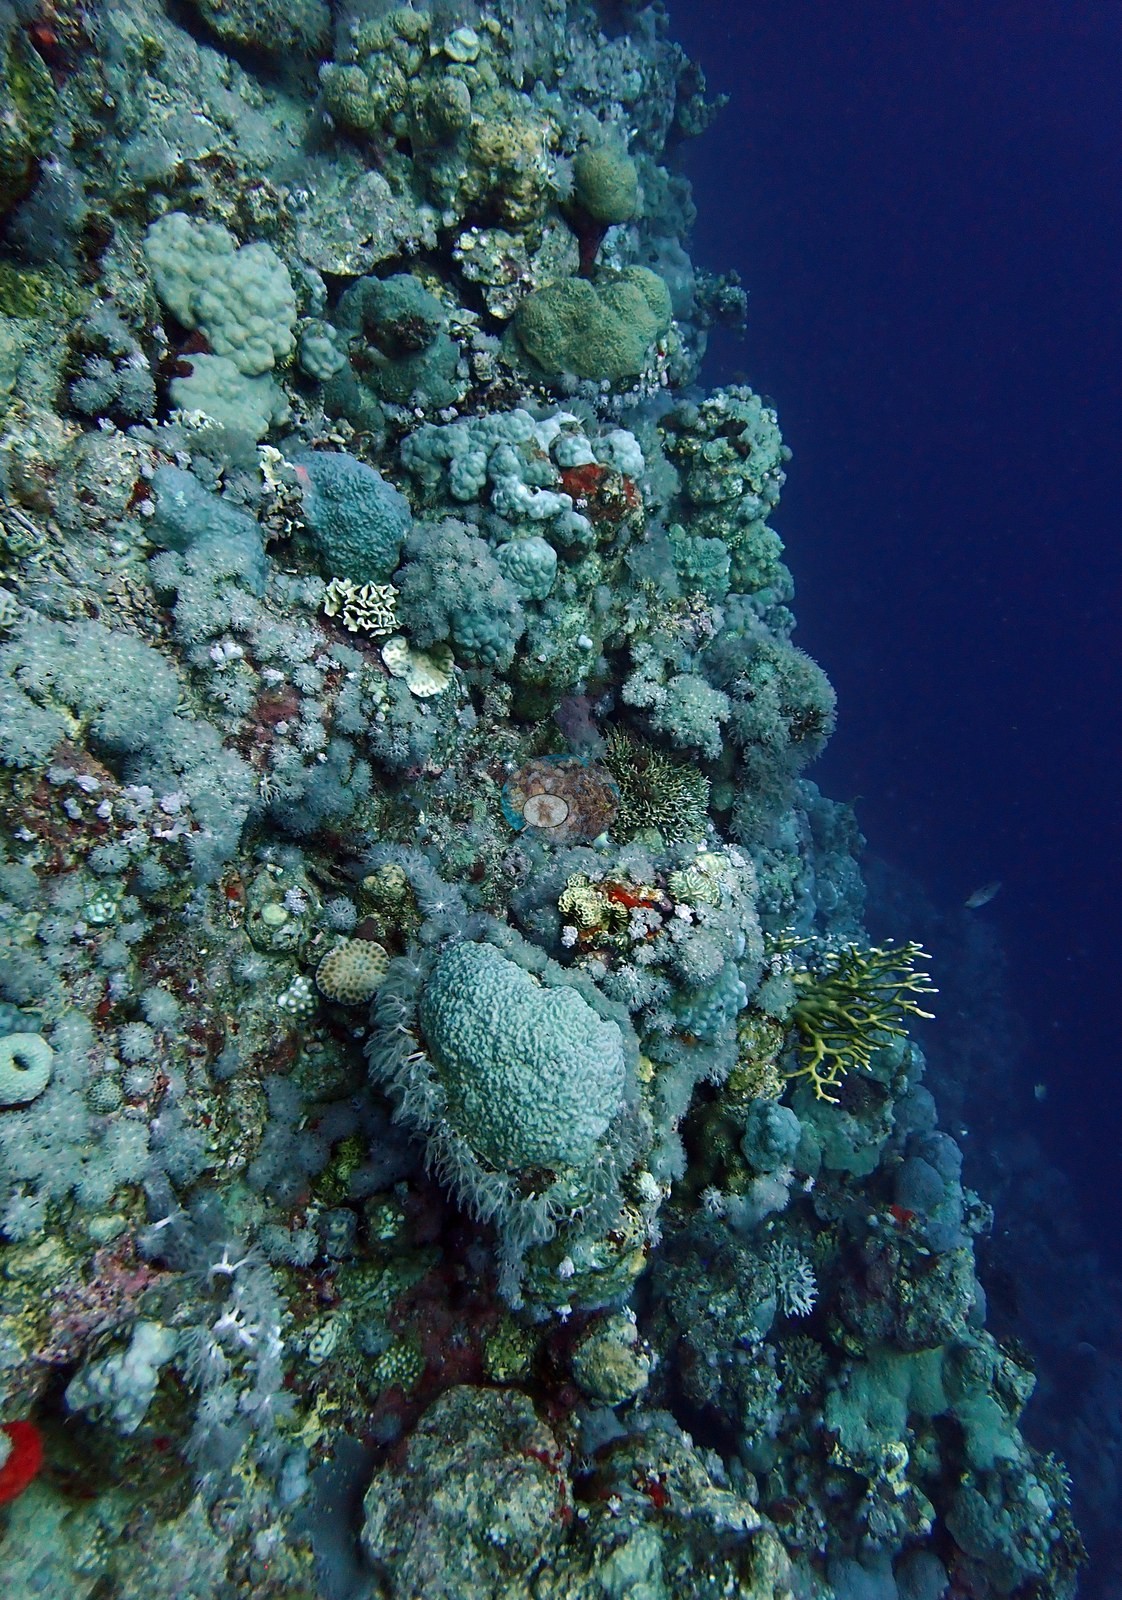
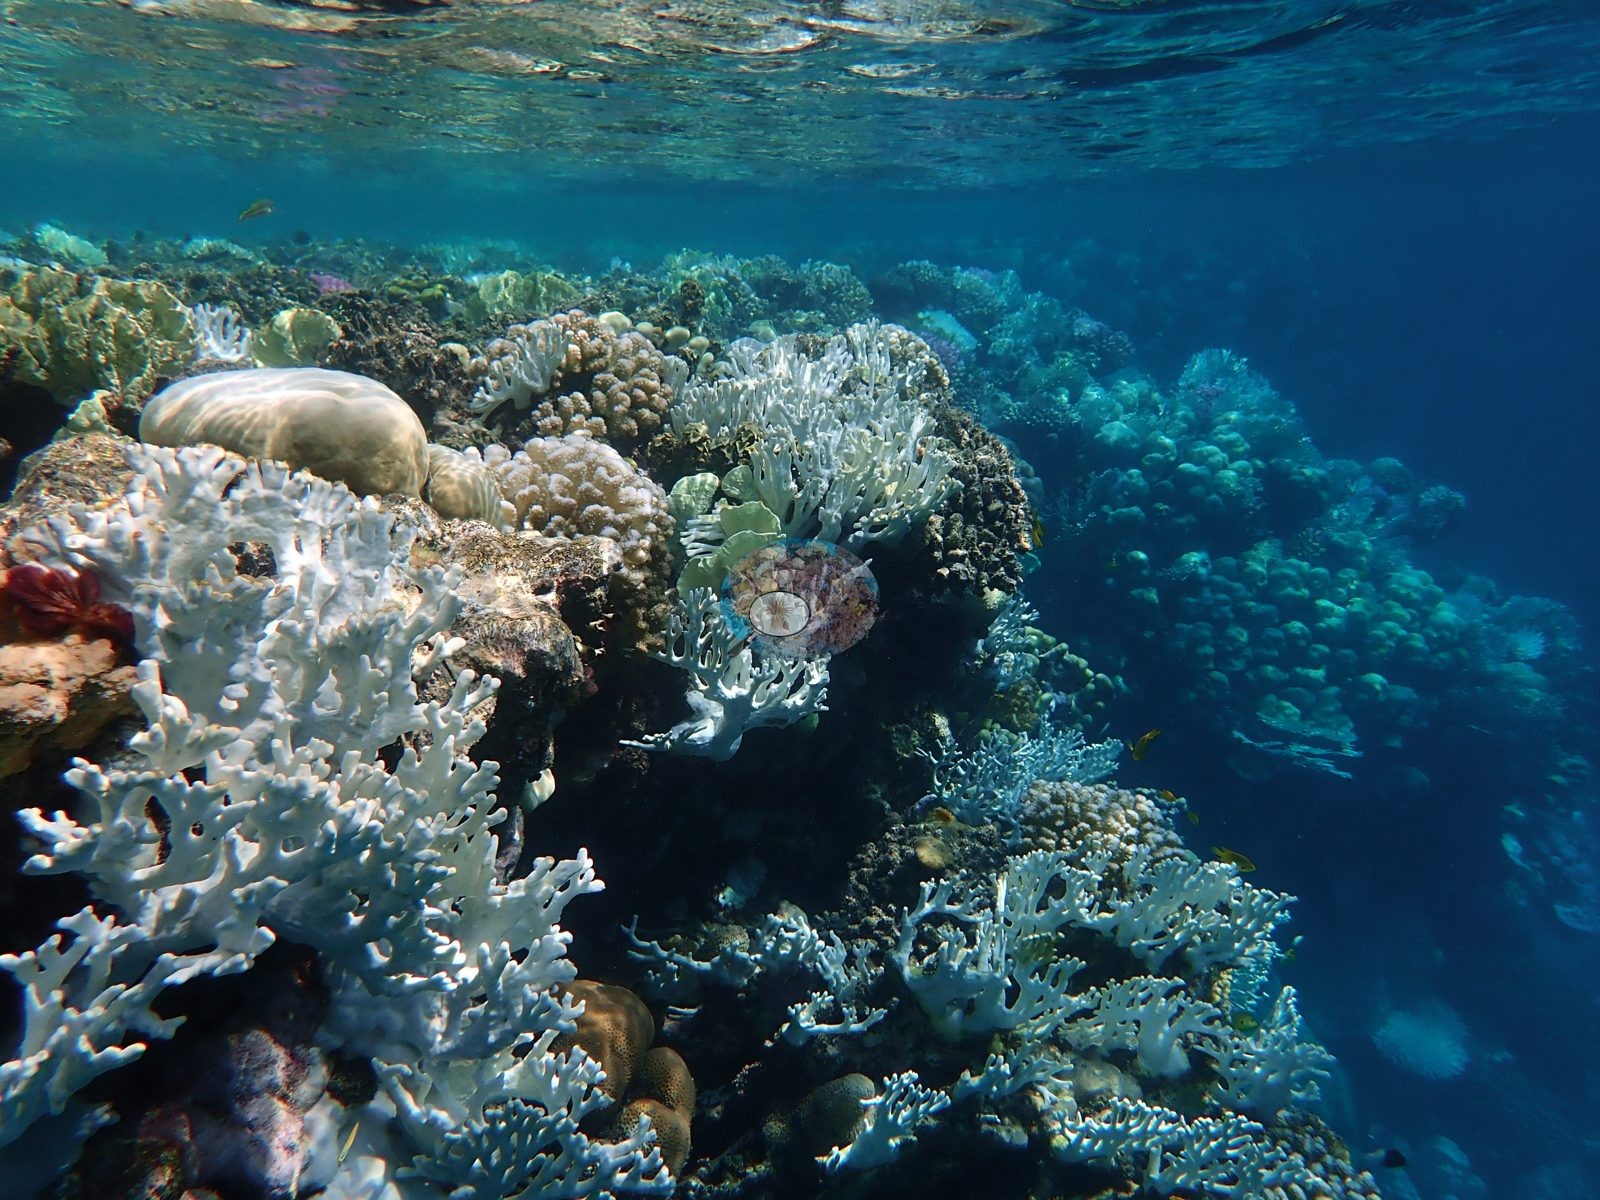
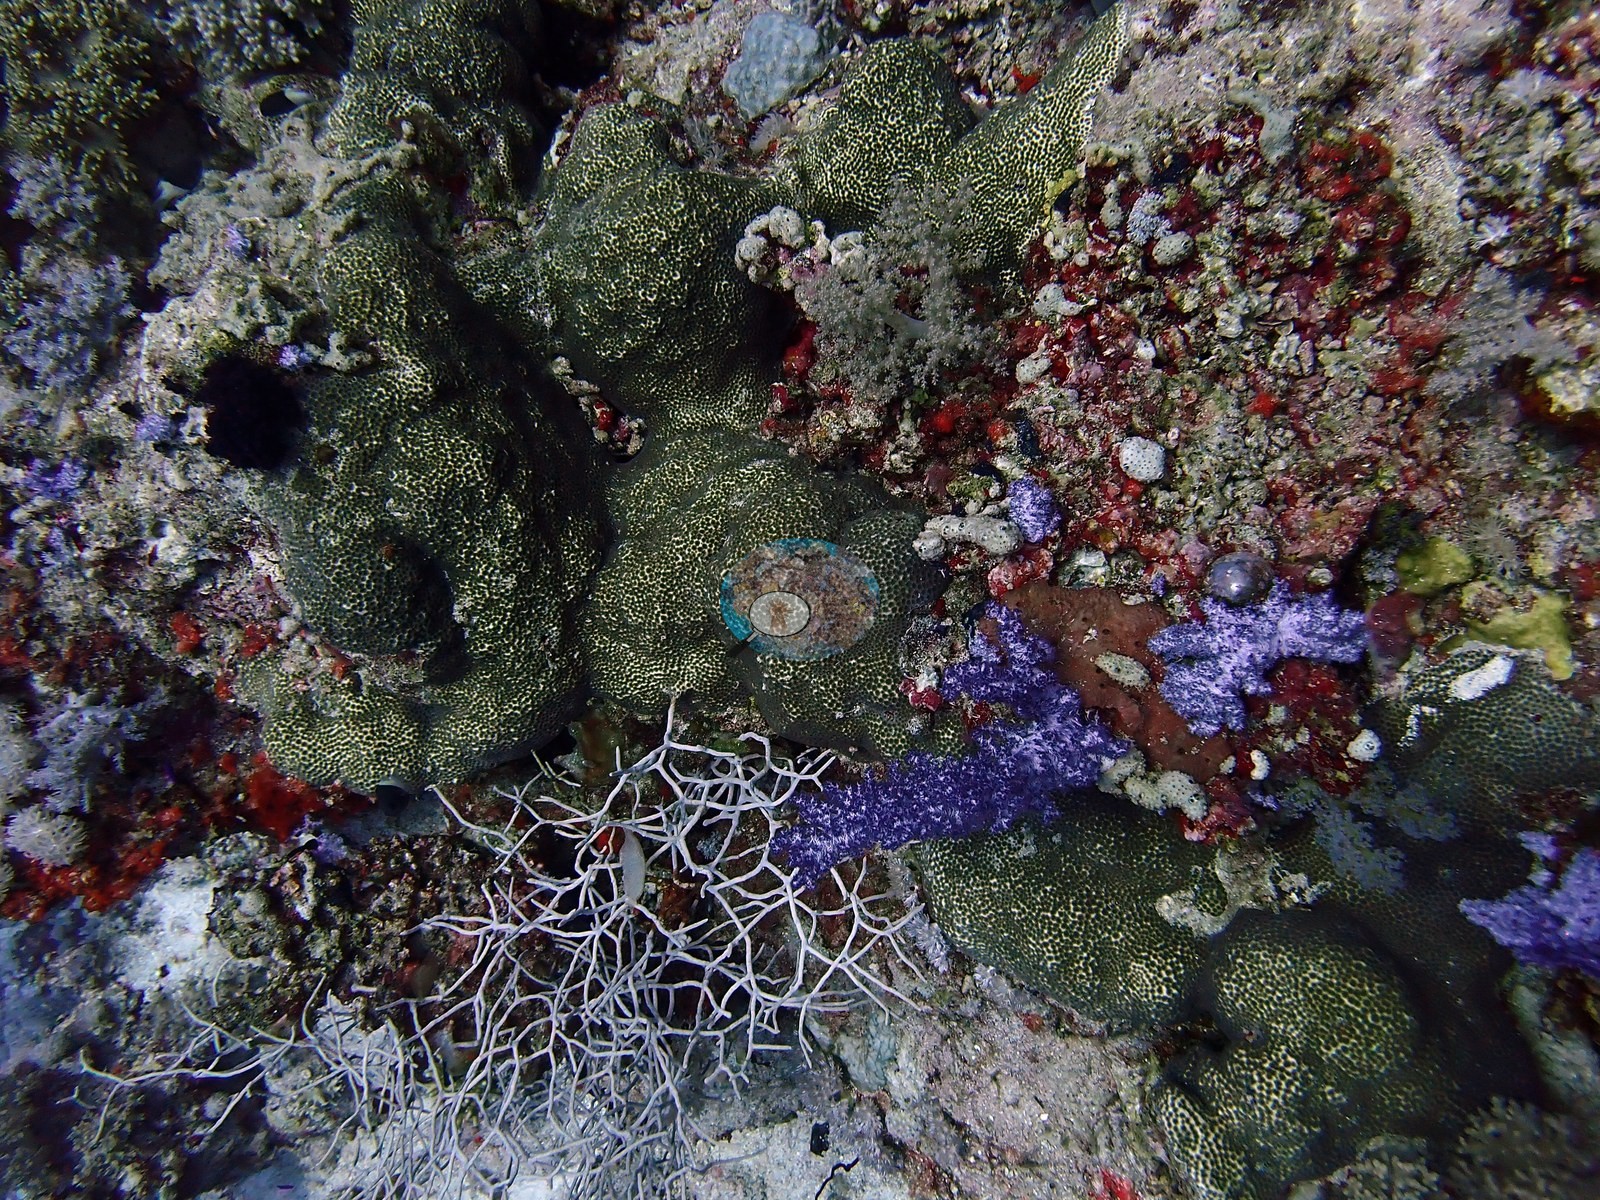
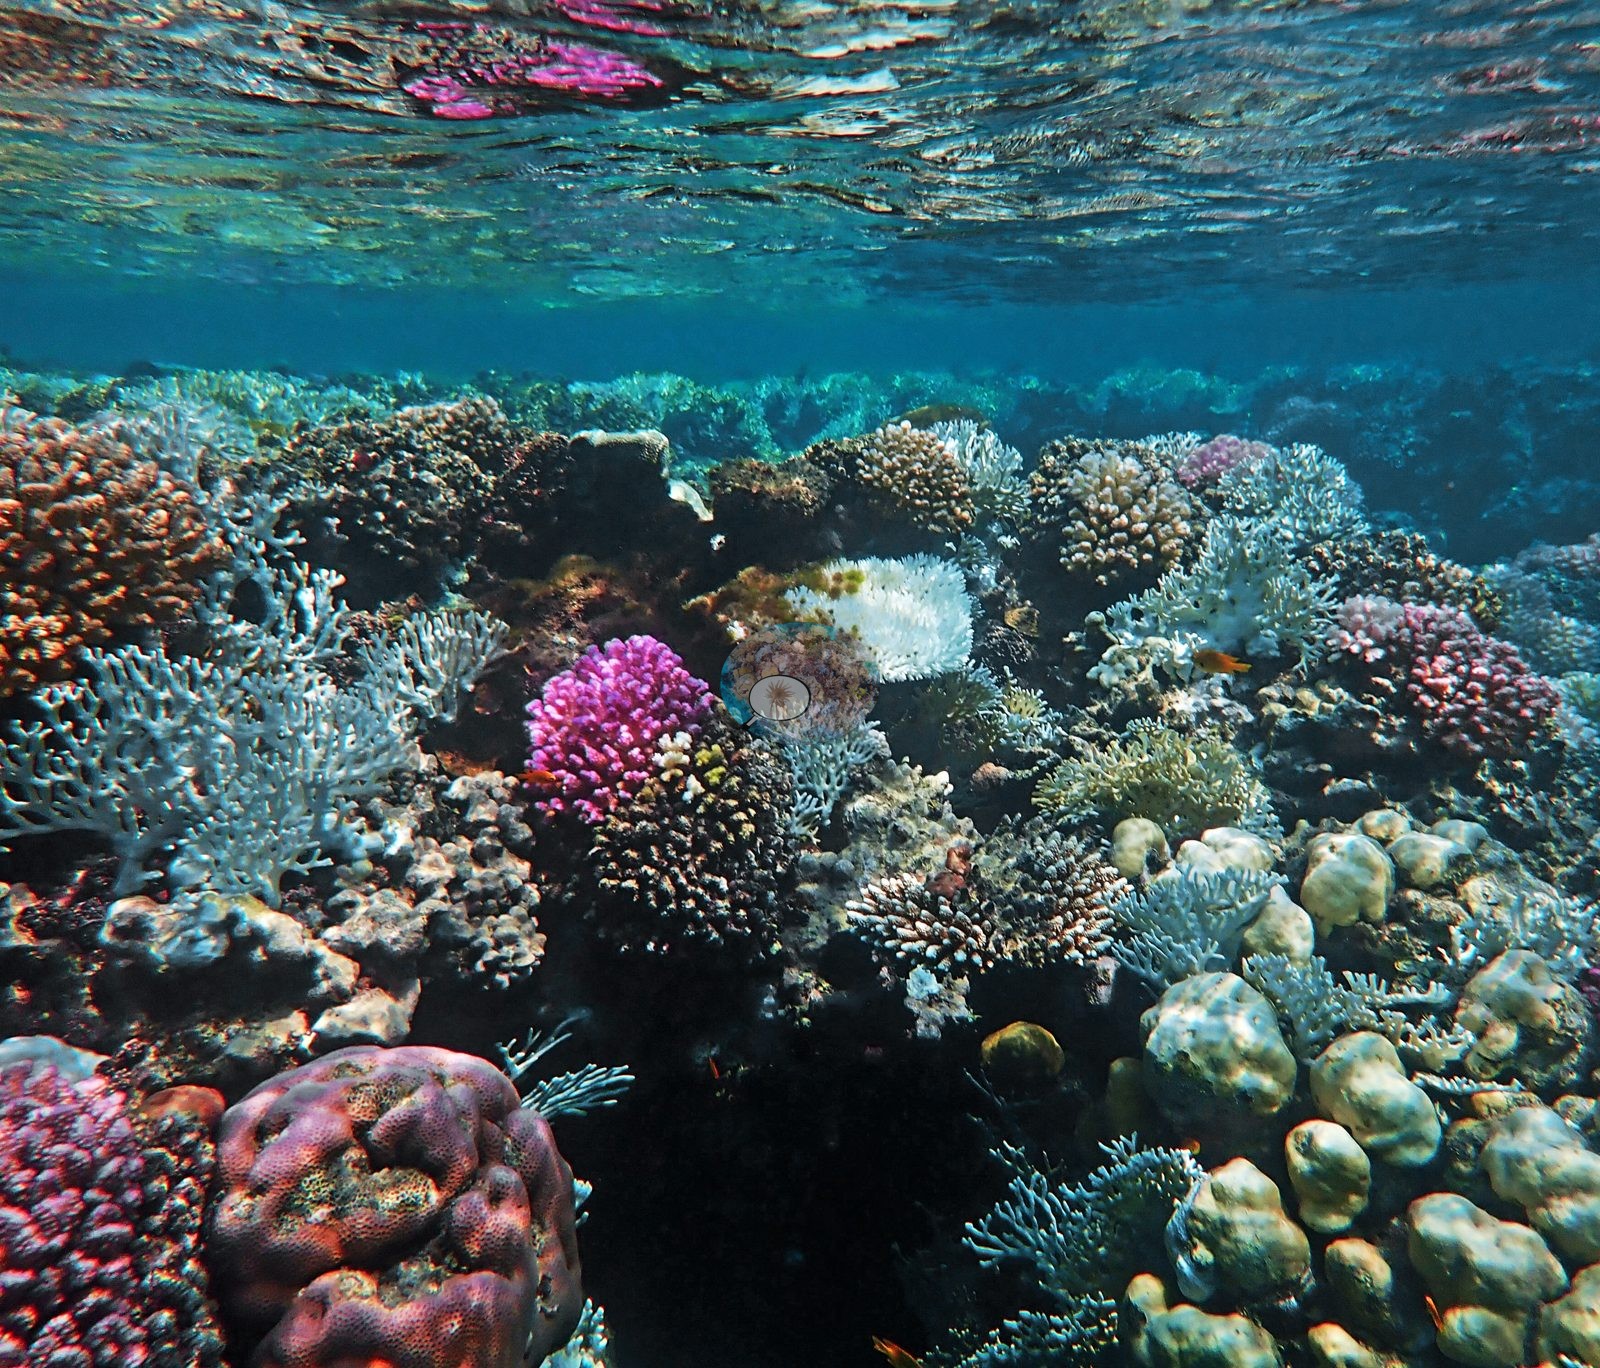
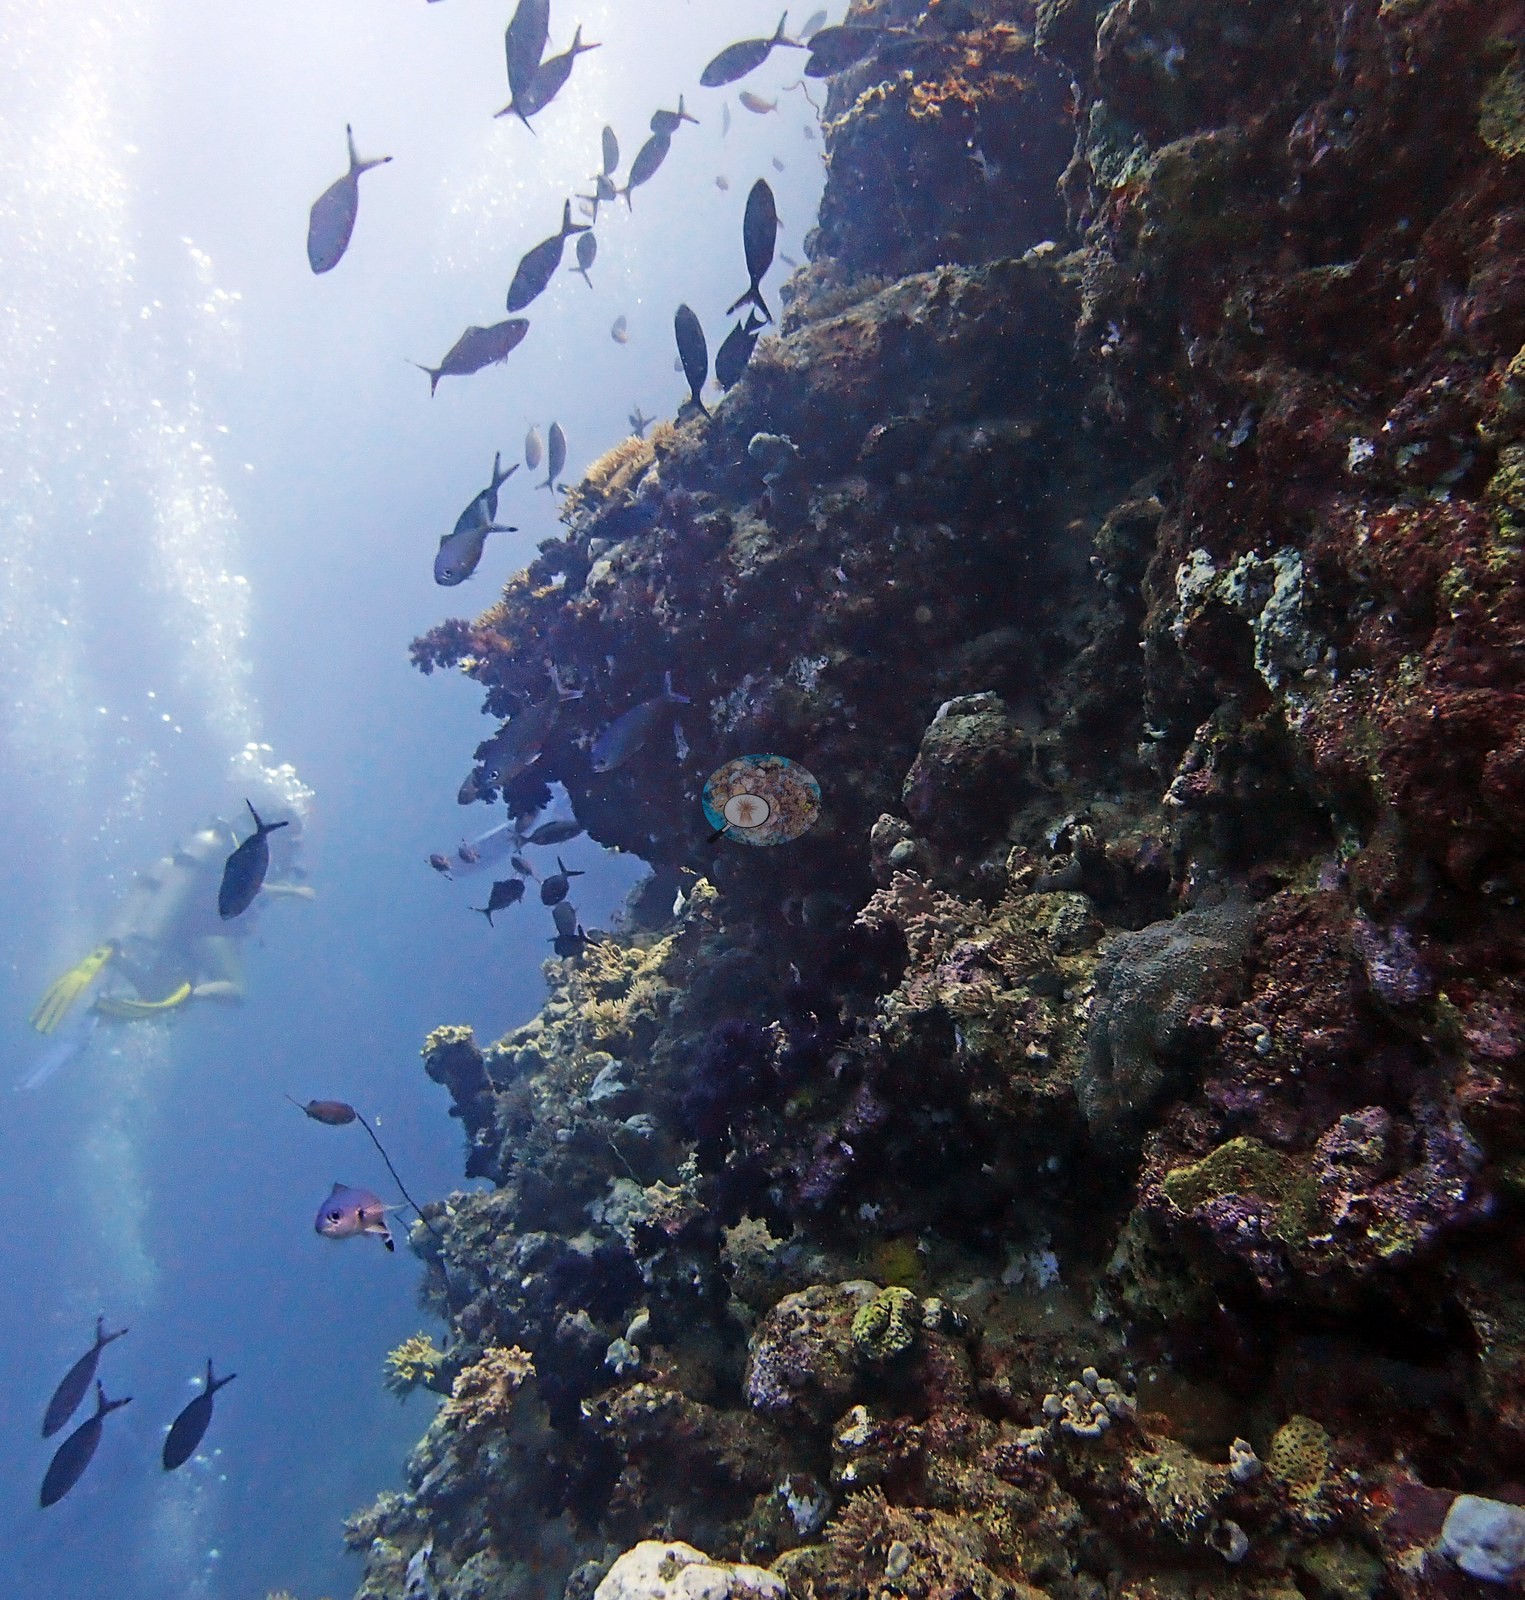
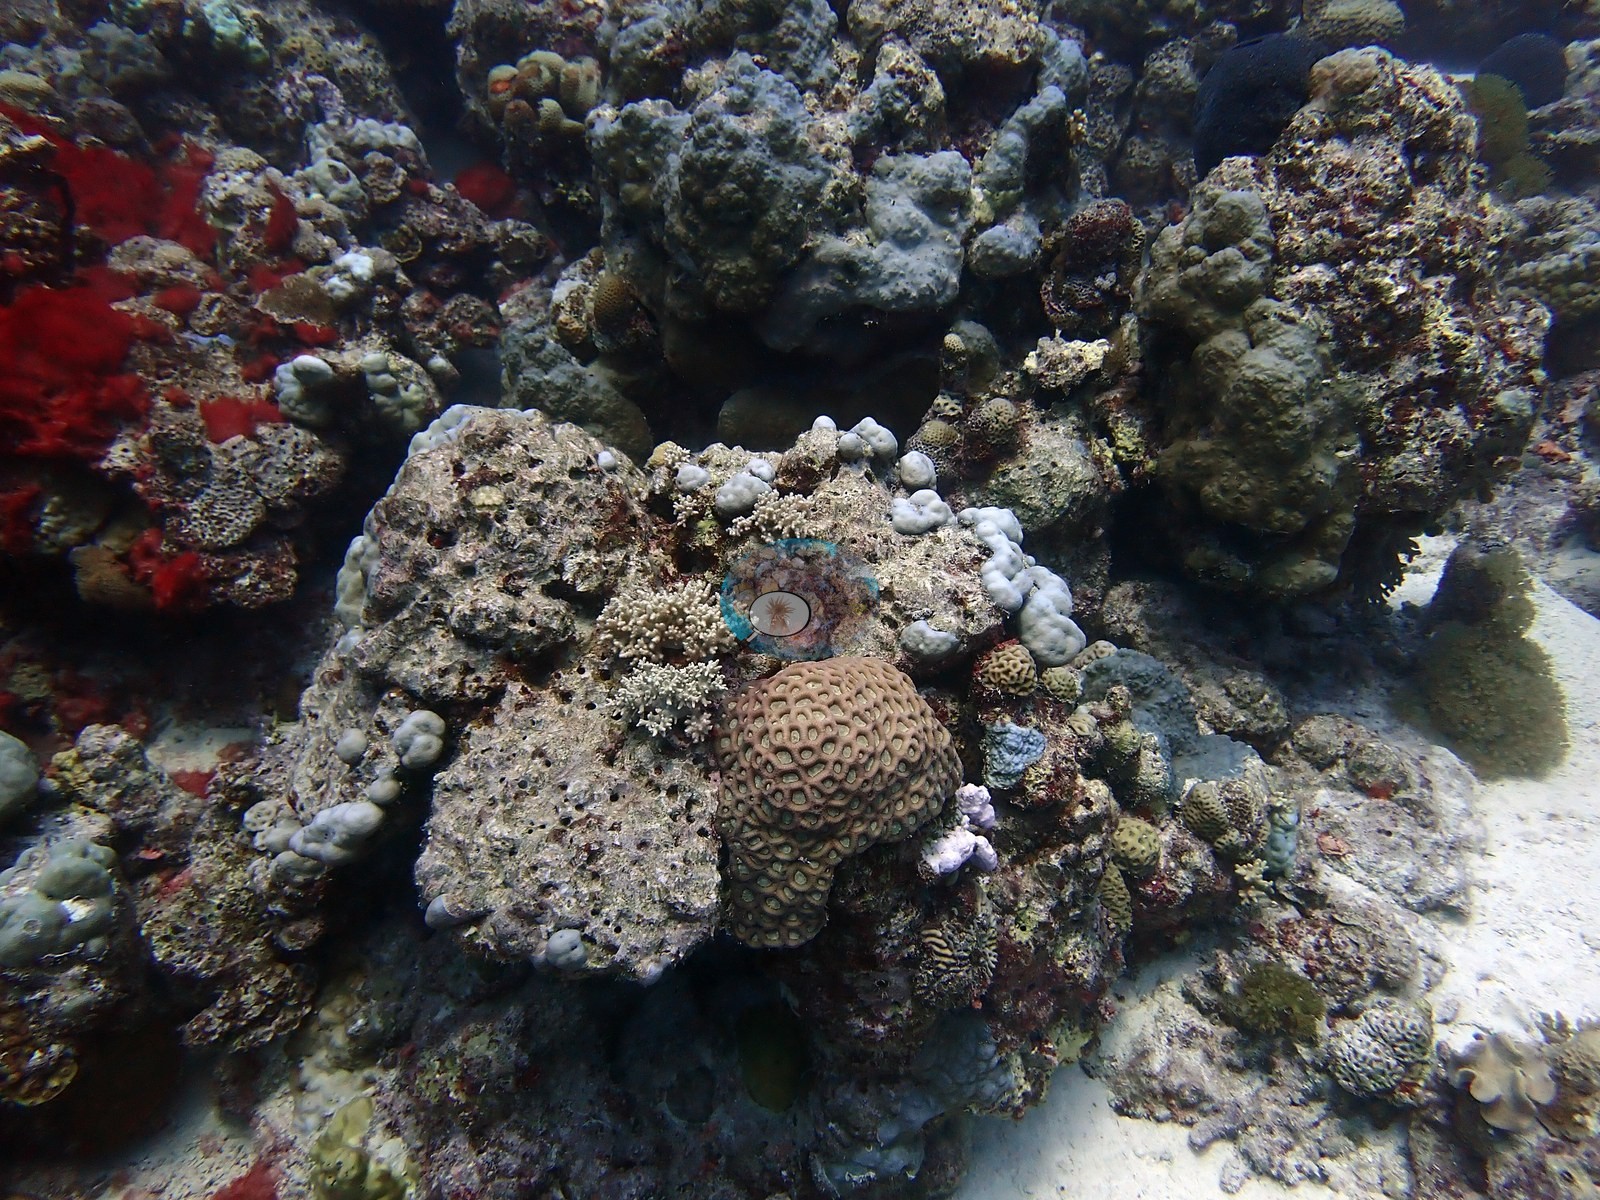
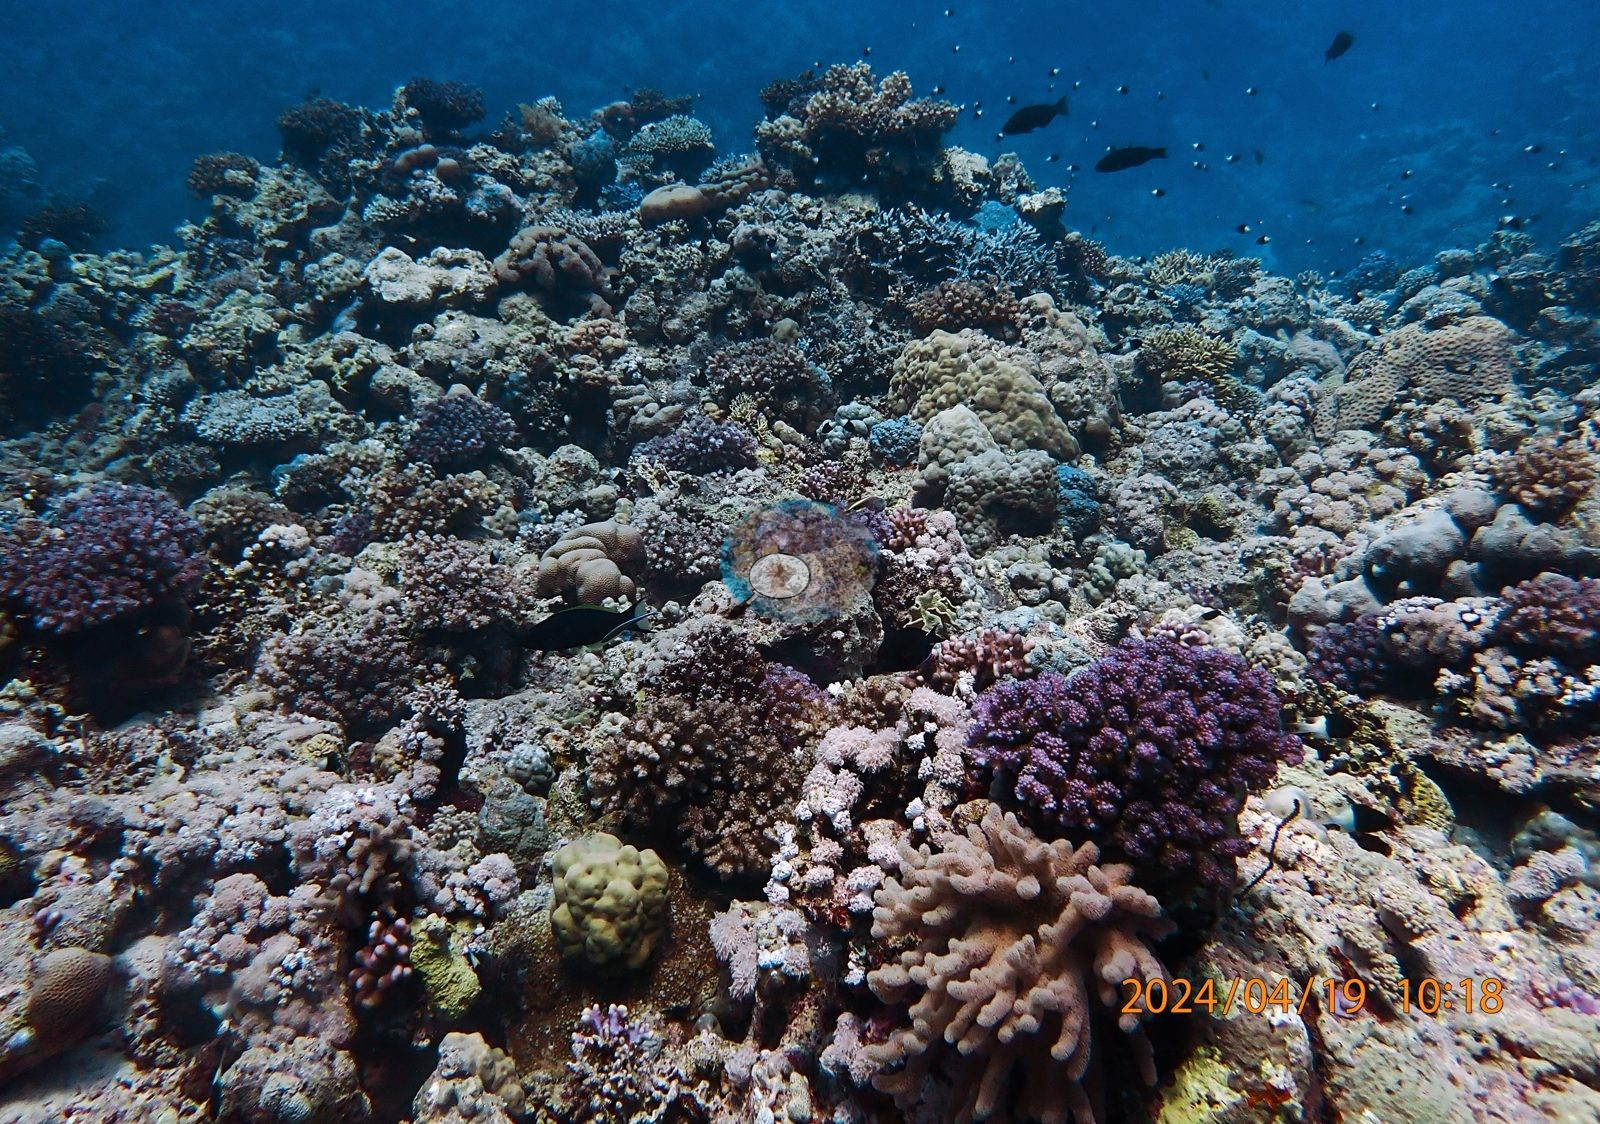
Published point-count cover exists for 22 of the 24 sites and averaged 19.0%, a narrow band from 12.8% on the Cement Wreck to 29.6% at Alrass Alakhdar; the three units are close together, at 18.4% (n = 14) off Jeddah and Thuwal, 21.5% (n = 6) off Yanbu and 16.5% (n = 2) at Al Qunfudah. Algal cover stayed low throughout, from 5.5% to 11.8%. The community is consistent along the whole stretch: pocilloporids in lavender, magenta, rose, and hot-pink color forms, corymbose, digitate, staghorn, and table Acropora, knobby, and columnar Porites, faviids, and Millepora-type fire coral. Individual sites stand out for structure rather than for cover. Coral Gardens off Jeddah is built on giant Porites mounds several meters across and holds the highest cover in the set; Um Mankout carries a near-continuous Porites framework with almost no bare pavement; Anderson's Reef-II is set apart by a bommie the size of a small building with its crown covered in lilac and gold arborescent soft corals. Recorded depths ran from 12.5 m at Cement Reef to 34.0 m at Thetis, with Rose Reef's wall dived to 32-36 m.
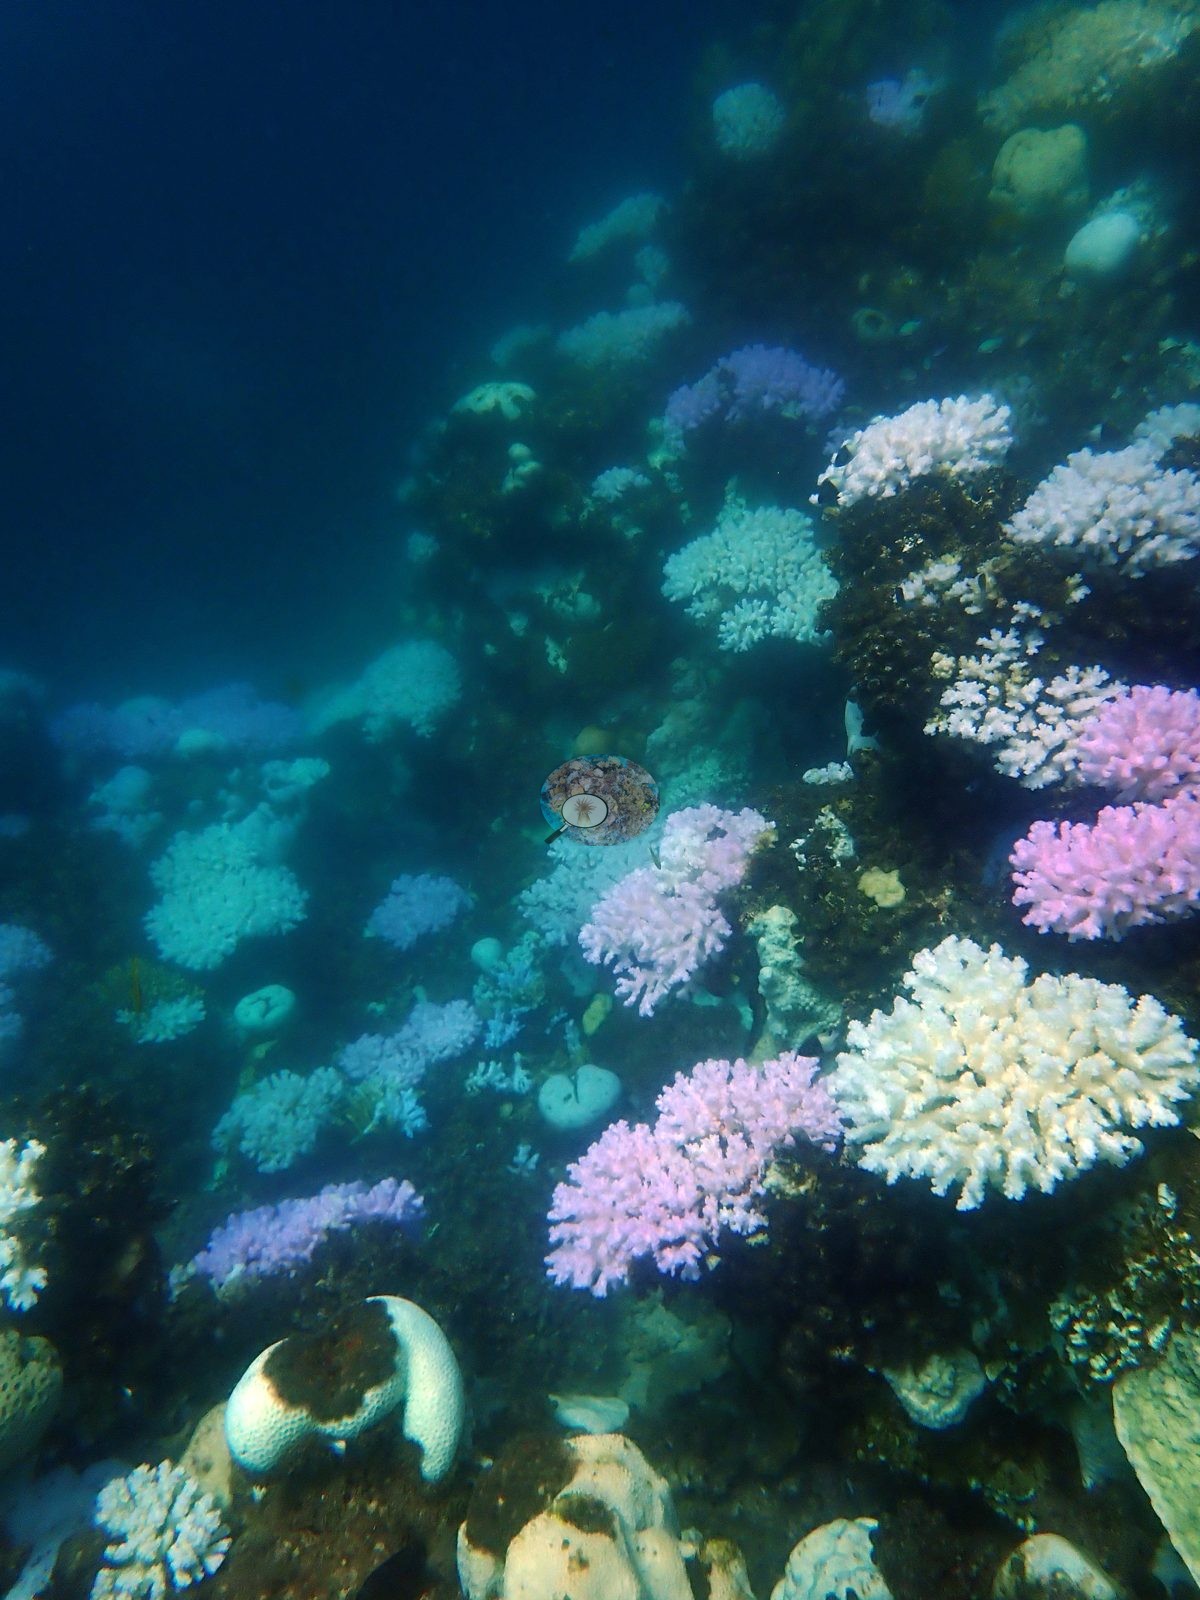
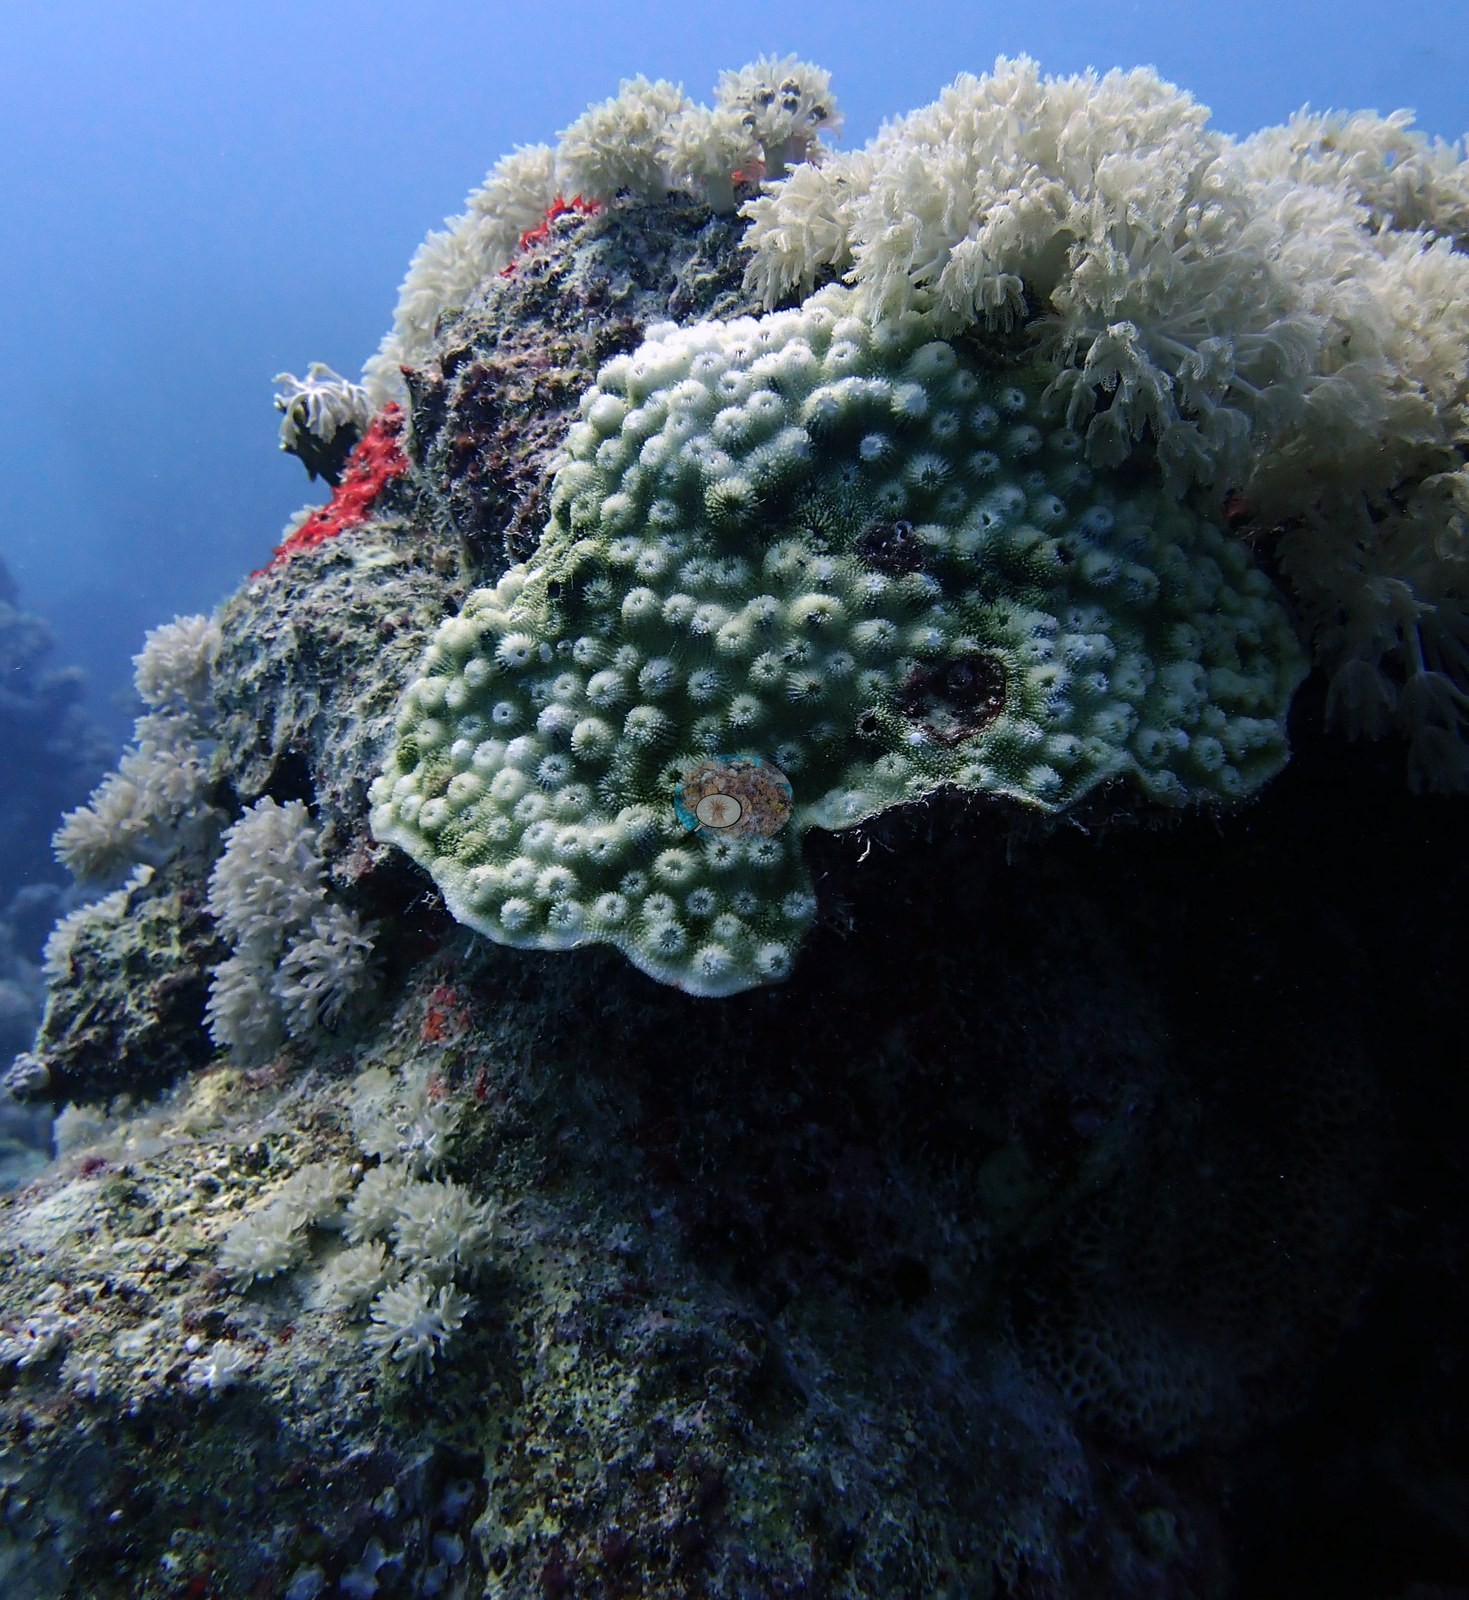
What this set records is the 2023-24 Red Sea marine heatwaves, and it is the only cluster on the map with a measured bleaching percentage at nearly every site. Across the 22 sites with a value, bleaching averaged 32.9% of coral tissue and ranged from 13.8% at the first Al Qunfudah reef to 71.7% at Shark Reef off Thuwal, where whole slopes were white and two crown-of-thorns starfish were photographed amid the bleaching. North Rabigh followed at 64.8% at about 16.9 degree-heating-weeks, and Bhadur Reef at 62.0% at about 22.3 degree-heating-weeks, where soft corals, fungiids, and anemones bleached along with the hard corals. Off Yanbu, Alrass Alakhdar was at 58.5% in September 2023, with multi-meter stands of knobby Porites bone-white beside fully pigmented pocilloporids, and Thetis at 62.1% in October 2023.
The striking thing is how sharply neighboring reefs differed and how little the pattern tracked accumulated heat. In the same August 2024 window in which Shark Reef read 72.7% and North Rabigh 64.8%, Anderson's Reef-I and Reef-II off Jeddah read 17.2% and 18.9%, and Coral Gardens rose only from 41.4% to 45.4% over one week. Rose Reef, the most heavily sampled site in the set with 720 photographs over six visits, ranged from 24.3% to 61.8%. The sharpest counterexample is Al Qunfudah. Its two reefs carried the heaviest accumulated heat of any Saudi visit bar one, about 20.4°C-weeks, and bleached the least of anywhere in the set: 13.8% and 18.1%. Bhadur Reef, at a comparable 22.3°C-weeks, bleached 62.0%. Two sites bleached with no accumulated heat stress recorded at all: Cave Reef at 26.8% in February 2024 and Abu Galawa at 25.3% in April 2024, and at Mr. Umluj bleaching barely moved between a cool April 2024 visit (27.7%) and August 2024 (26.6%, at 14.2 degree-heating-weeks). Cover fell where the heat bit hardest: Thetis went from 32.5% in October 2023 to 13.4% in August 2024, when the wall was darker and dominated by soft corals and sponges. Souter et al. (2021), writing before all of this, had coral cover in the northern and central Red Sea rising slowly to 39.1% by 2019 after a fall from 35.2% in 1997 to 29.7% in 2002, and named land runoff, eutrophication and overfishing as the main local drivers, with coastal development an added pressure under the kingdom's Vision 2030 plans.
Highlights
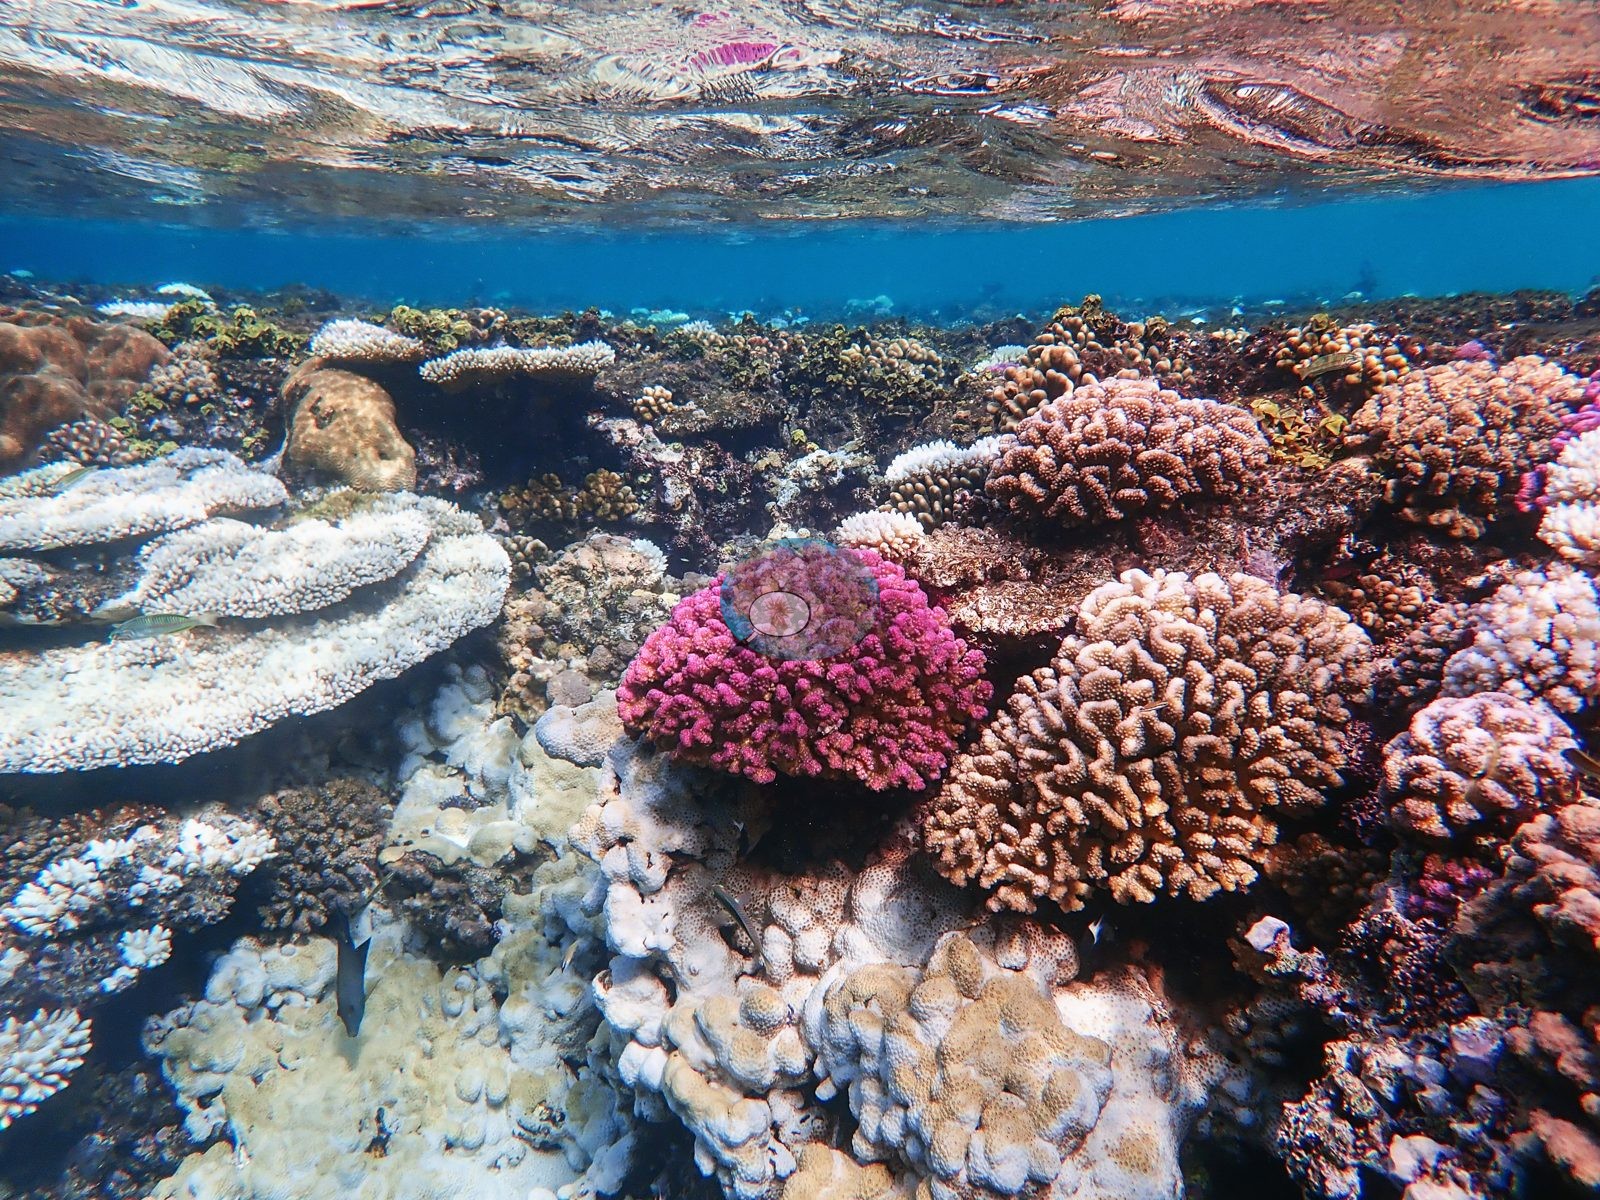
- Shark Reef (Thuwal) was the worst-hit site on the coast, with 72.7% and 70.9% of coral tissue bleached on two 2024 visits and two crown-of-thorns starfish photographed amid the bleaching.
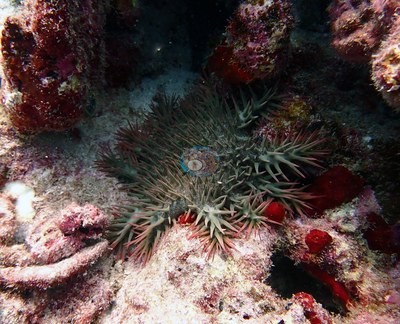 photo: Saudi Red Sea - Shark Reef (Thuwal)
 - Al Qunfudah, 290 km south of Jeddah, carried about 20.4°C-weeks of accumulated heat — among the highest in the set — yet bleached the least, 13.8% and 18.1%.
- Anderson's Reef-I and Reef-II off Jeddah had the lowest bleaching in the set, 17.2% and 18.9%, in the same August 2024 window.
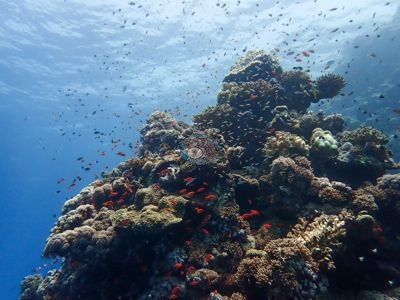 photo: Saudi Red Sea - Anderson's Reef-I (Jeddah)
 - Coral Gardens (Jeddah) is built on giant Porites mounds and held the highest cover in the set, 27.6%, while 41.4% of its tissue was bleached.
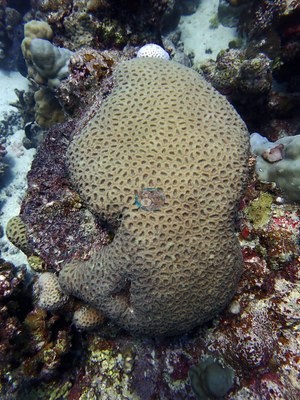 photo: Saudi Red Sea - Coral Gardens (Jeddah)
 - Alrass Alakhdar (Yanbu) held the highest cover of the Yanbu unit, 29.6%, while 58.5% of its coral tissue was bleached in September 2023.
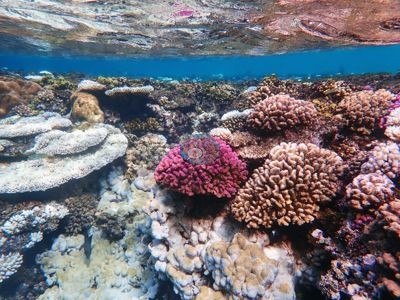 photo: Saudi Red Sea - Alrass Alakhdar (Yanbu)
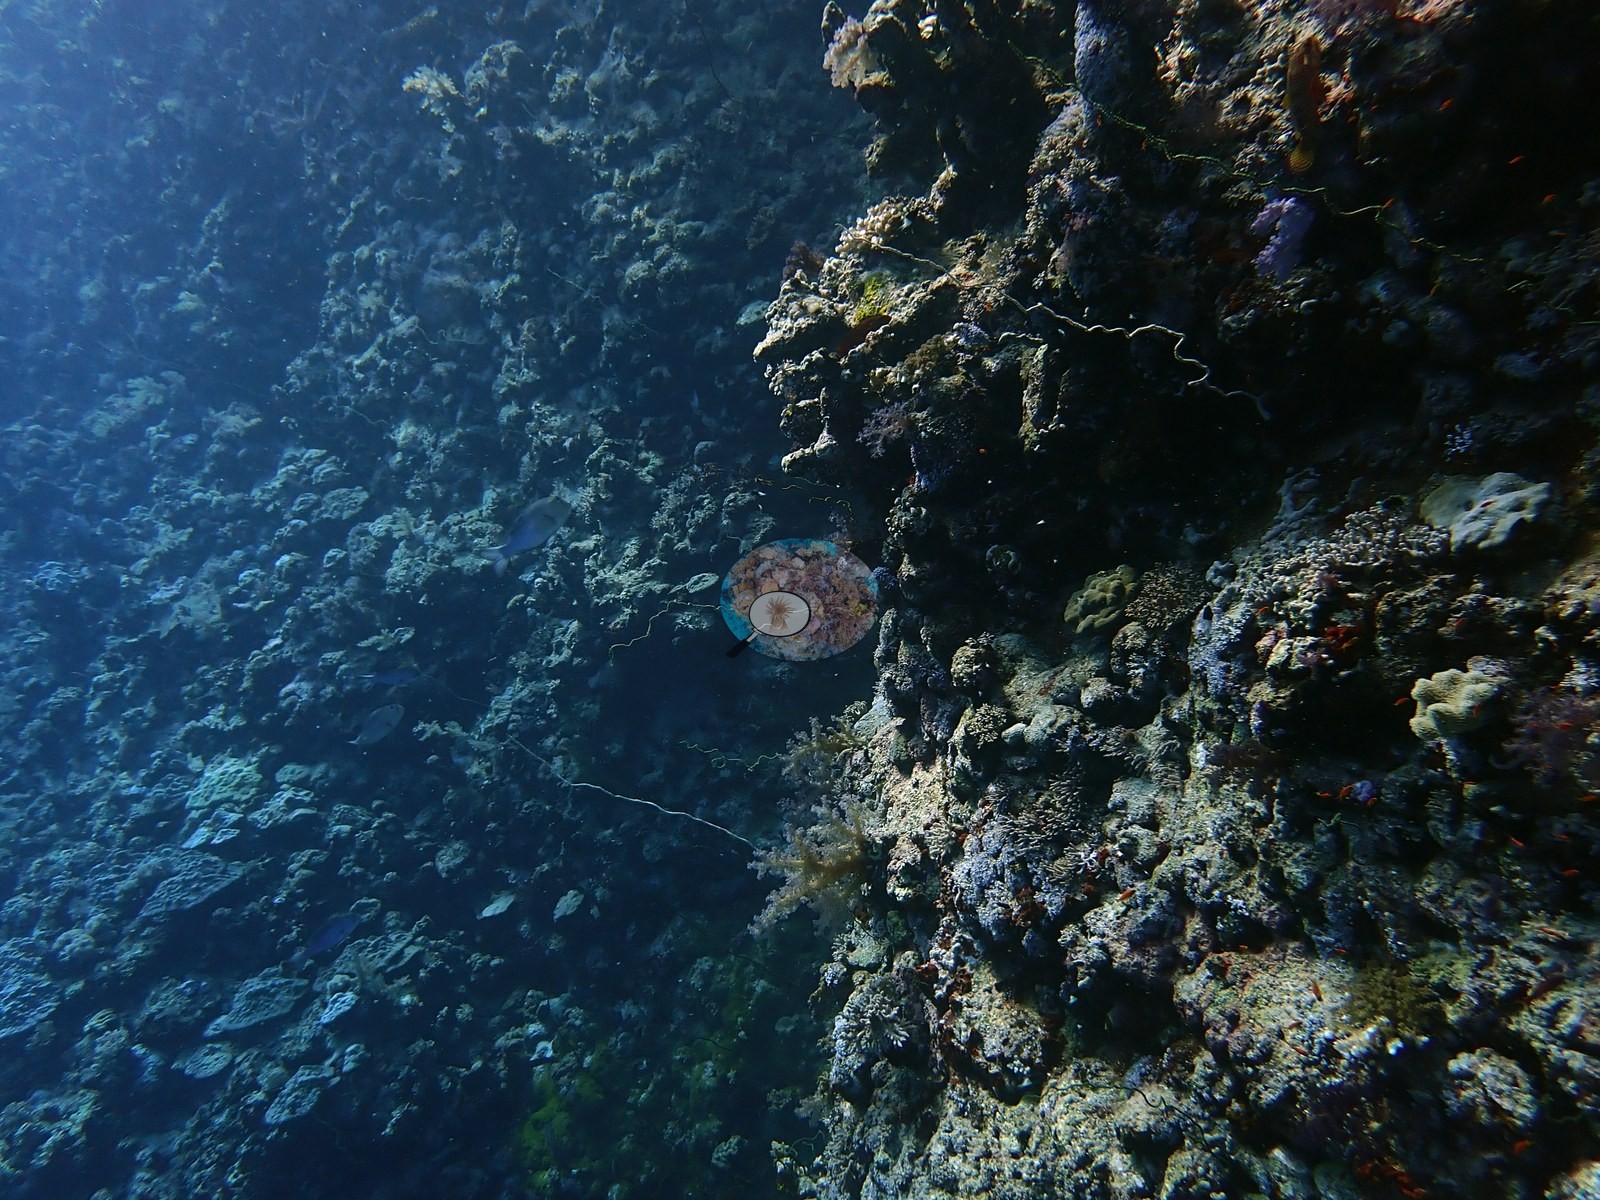
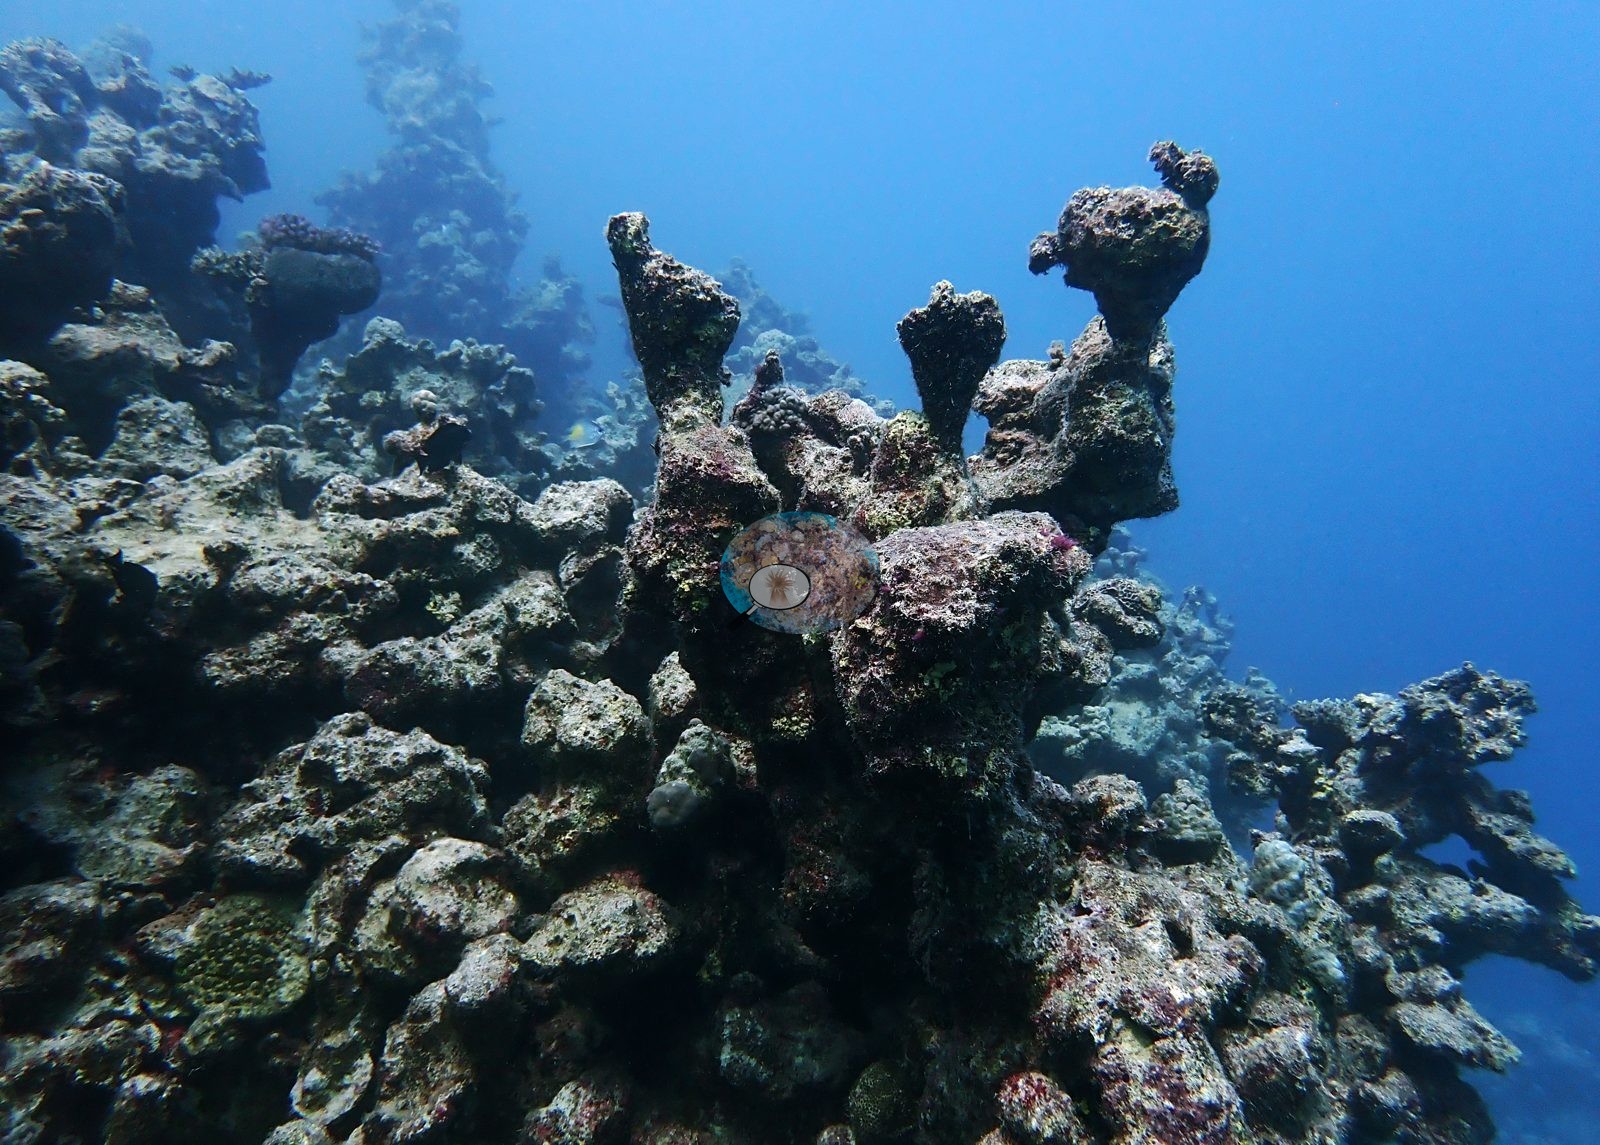
 - Thetis cover more than halved between October 2023 (32.5%, 62.1% bleached) and August 2024 (13.4%).
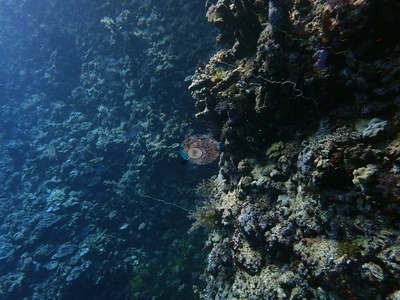 photo: Saudi Red Sea - Thetis (Yanbu)
 - Rose Reef is the most heavily sampled site, 720 photographs over six visits, with bleaching from 24.3% to 61.8%.
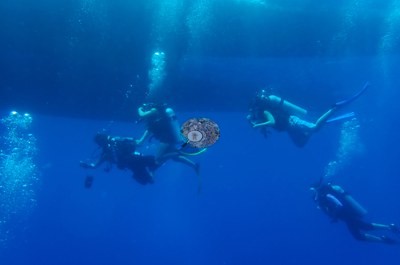 photo: Saudi Red Sea - Rose Reef (Thuwal)
 - Two sites bleached with no accumulated heat stress recorded: Cave Reef at 26.8% in February 2024 and Abu Galawa at 25.3% in April 2024.
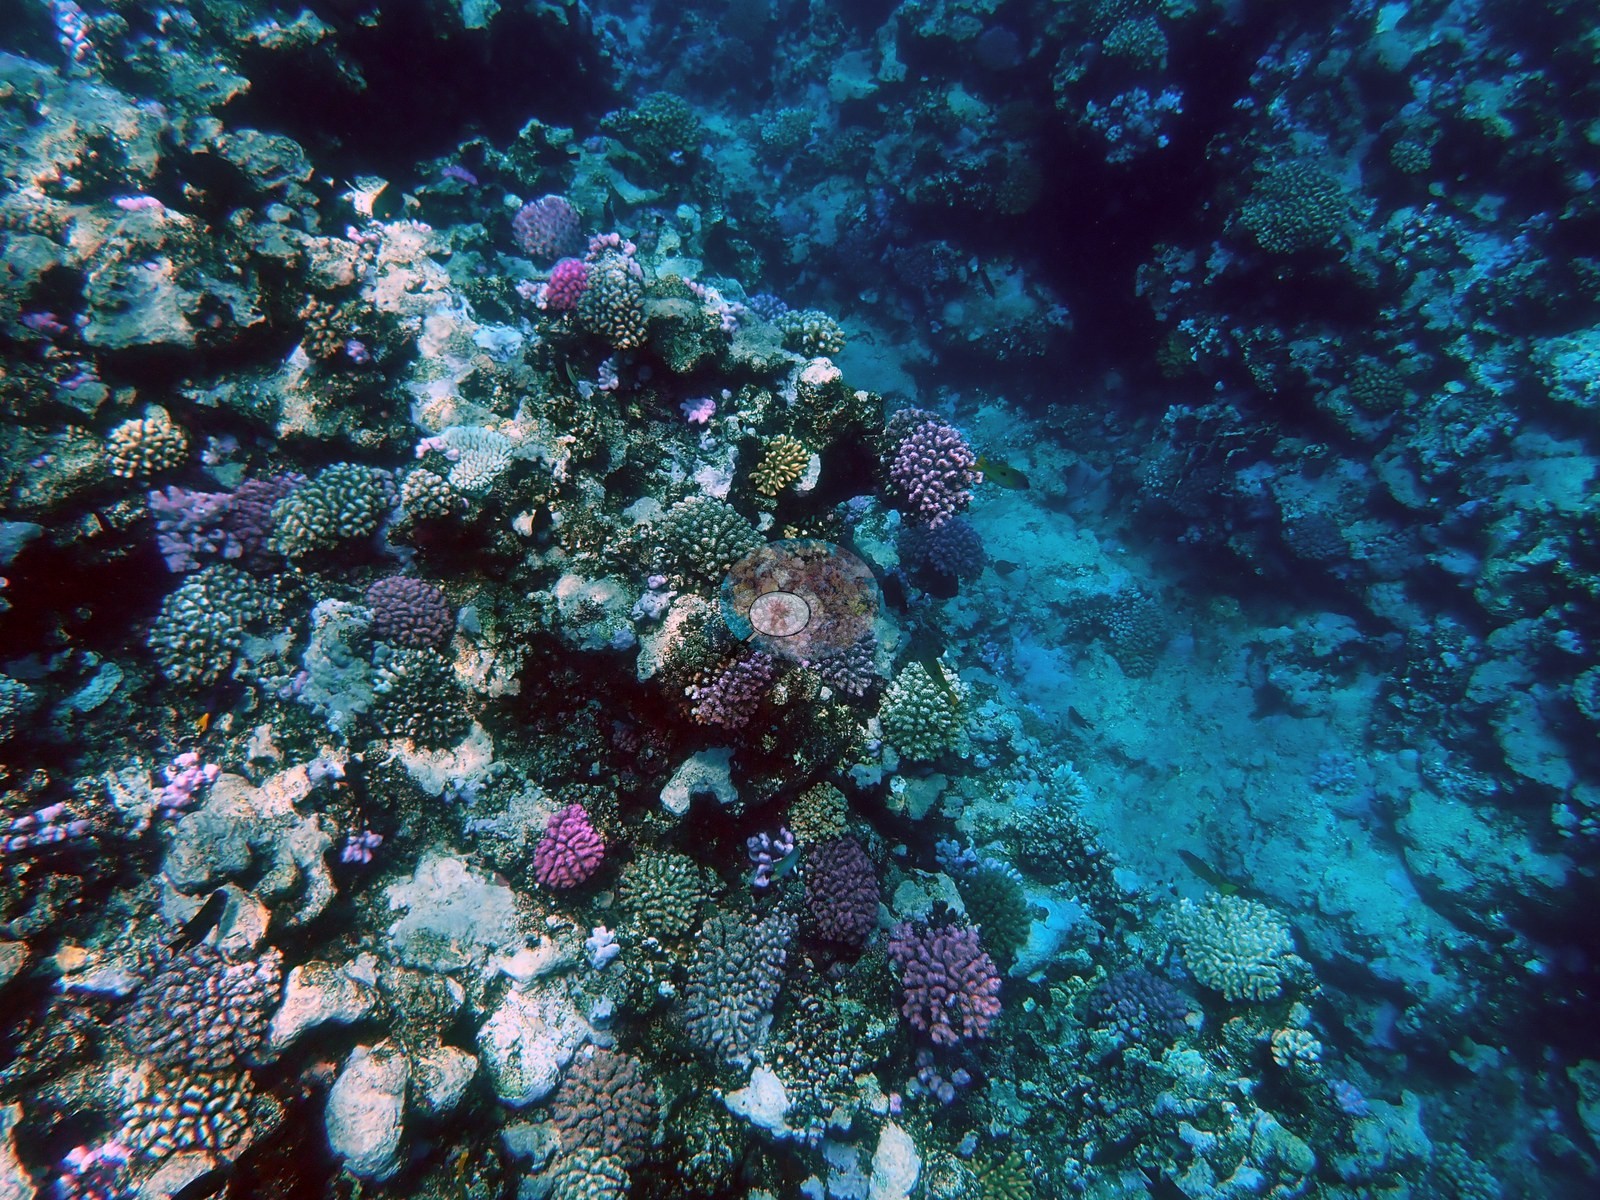
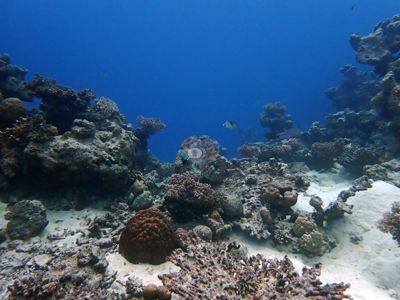 photo: Saudi Red Sea - Cave Reef (Thuwal)
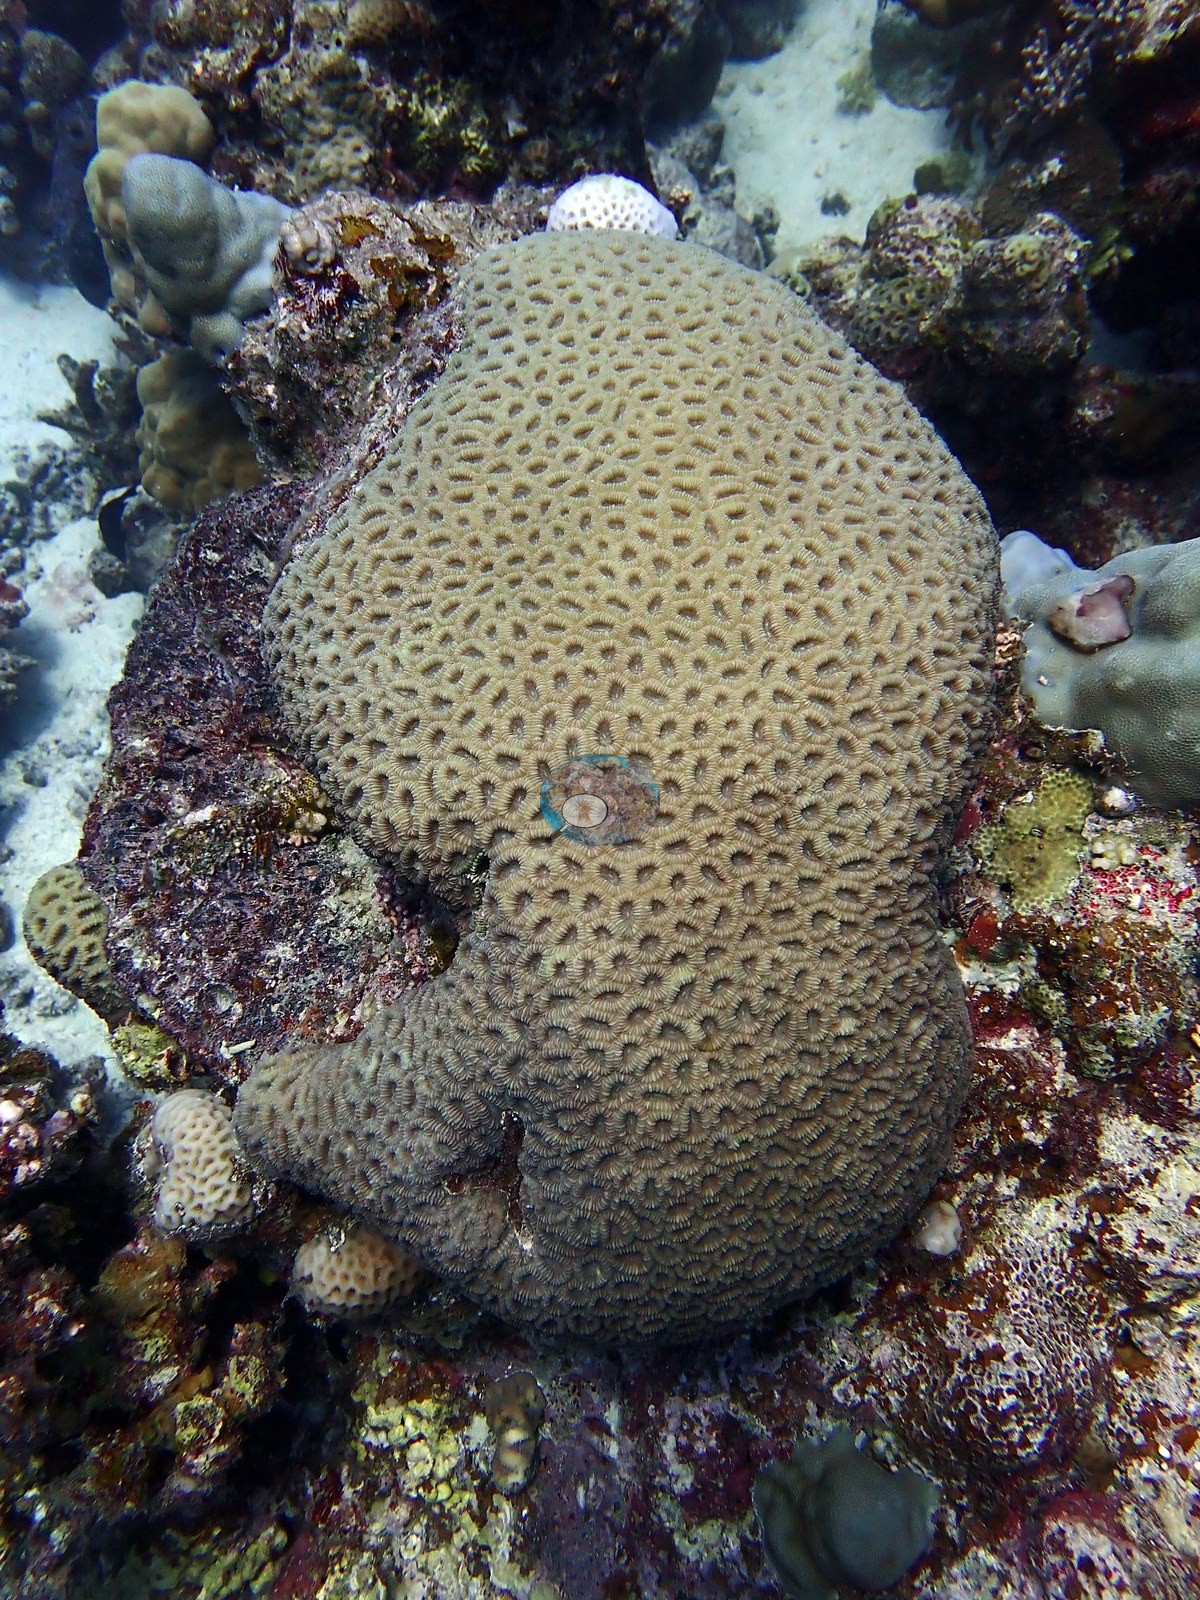
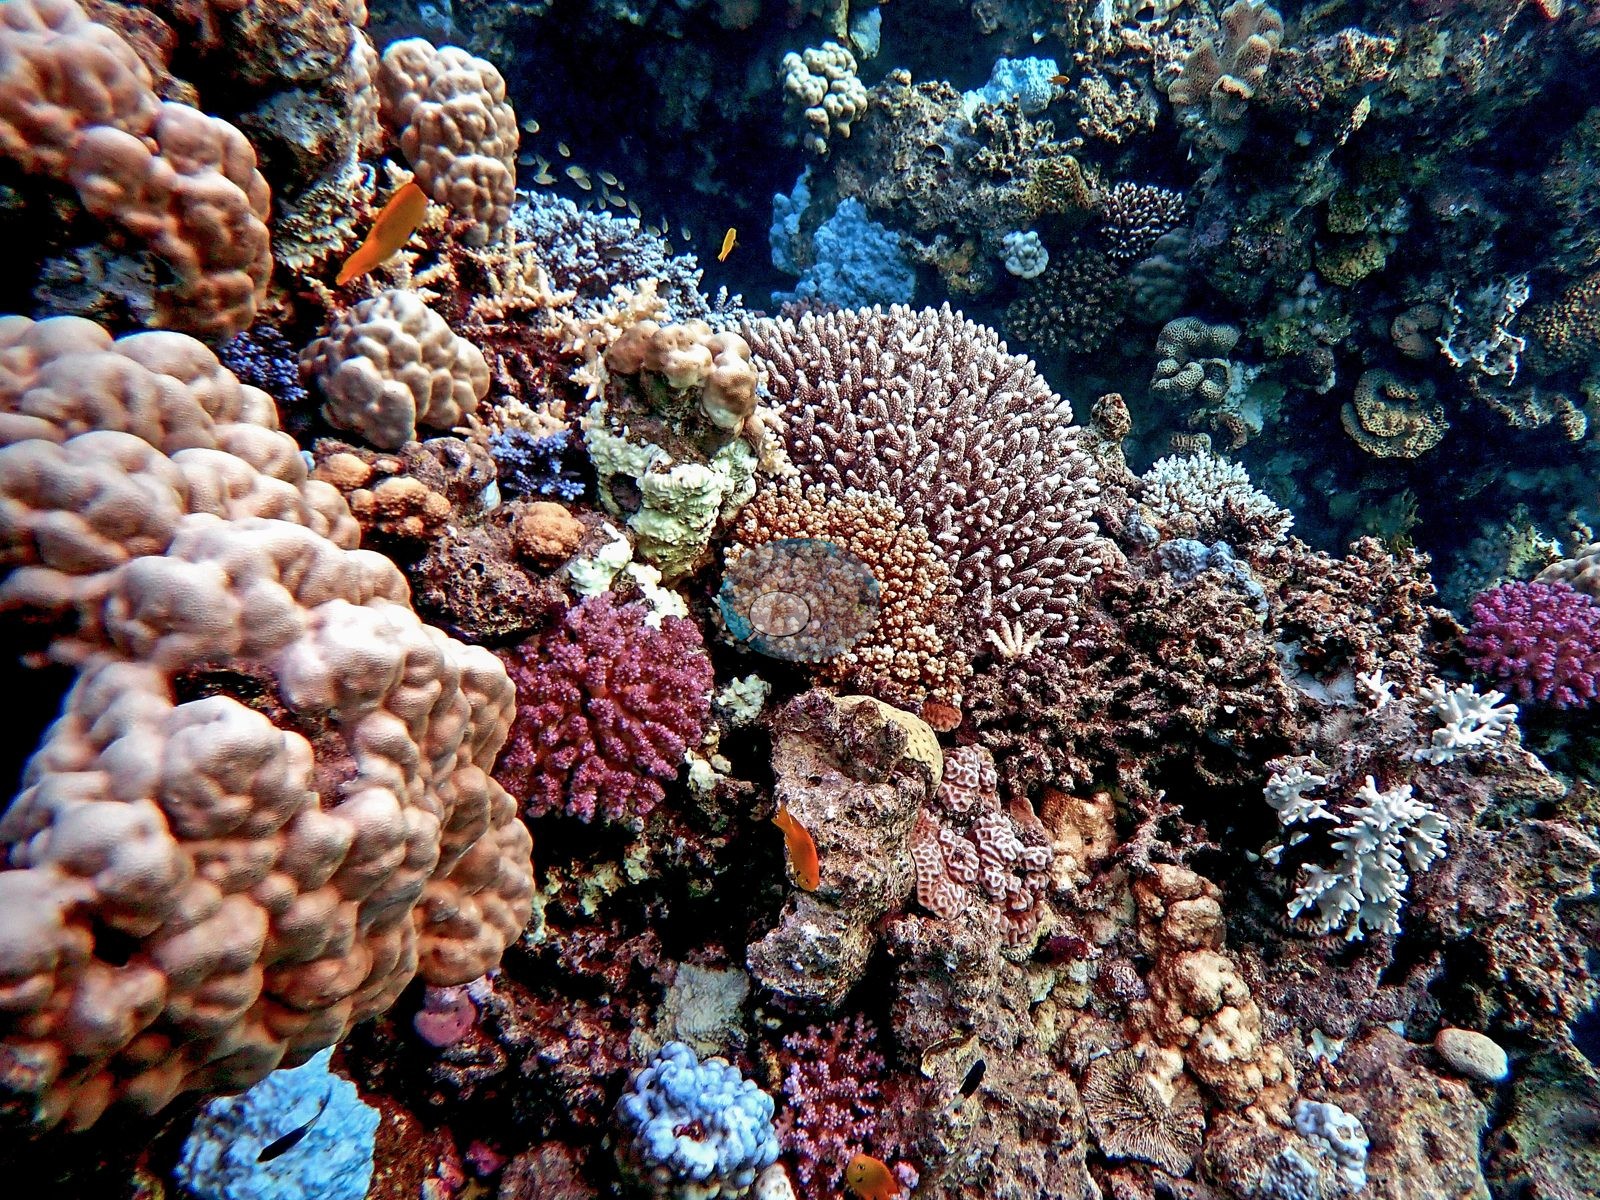
 - Cement Reef (Thuwal): high-relief spur-and-groove honeycombed with swim-throughs, dense pocilloporid thickets and cobalt Acropora on the upper slope.
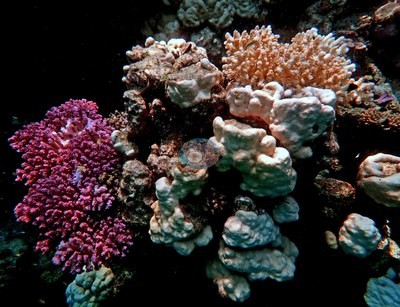 photo: Saudi Red Sea - Cement Reef (Thuwal)
 - Masked butterflyfish (Chaetodon semilarvatus), a Red Sea endemic, and a requiem shark at Abu Galawa.
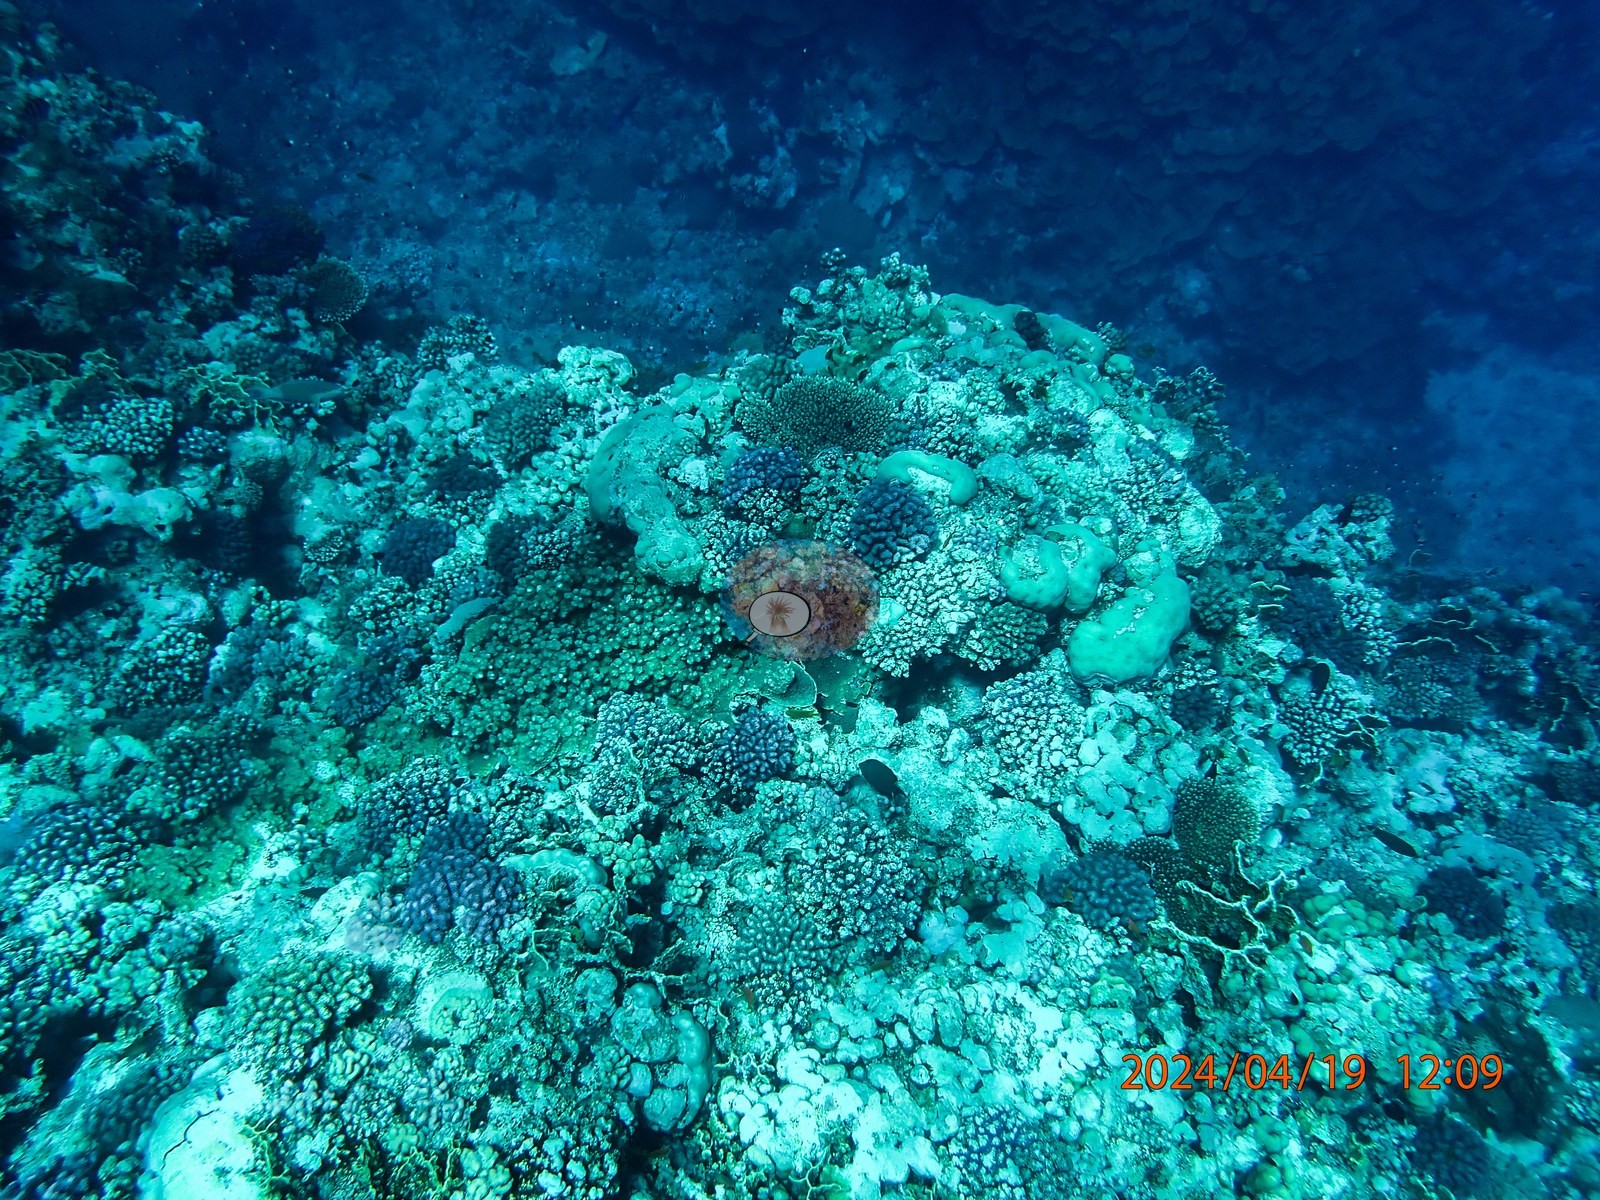
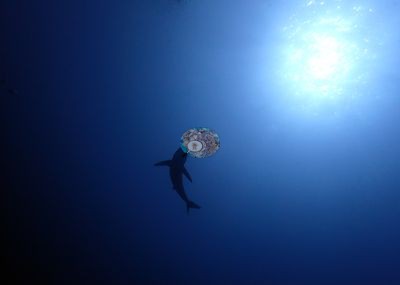 photo: Saudi Red Sea - Abu Galawa (Yanbu)
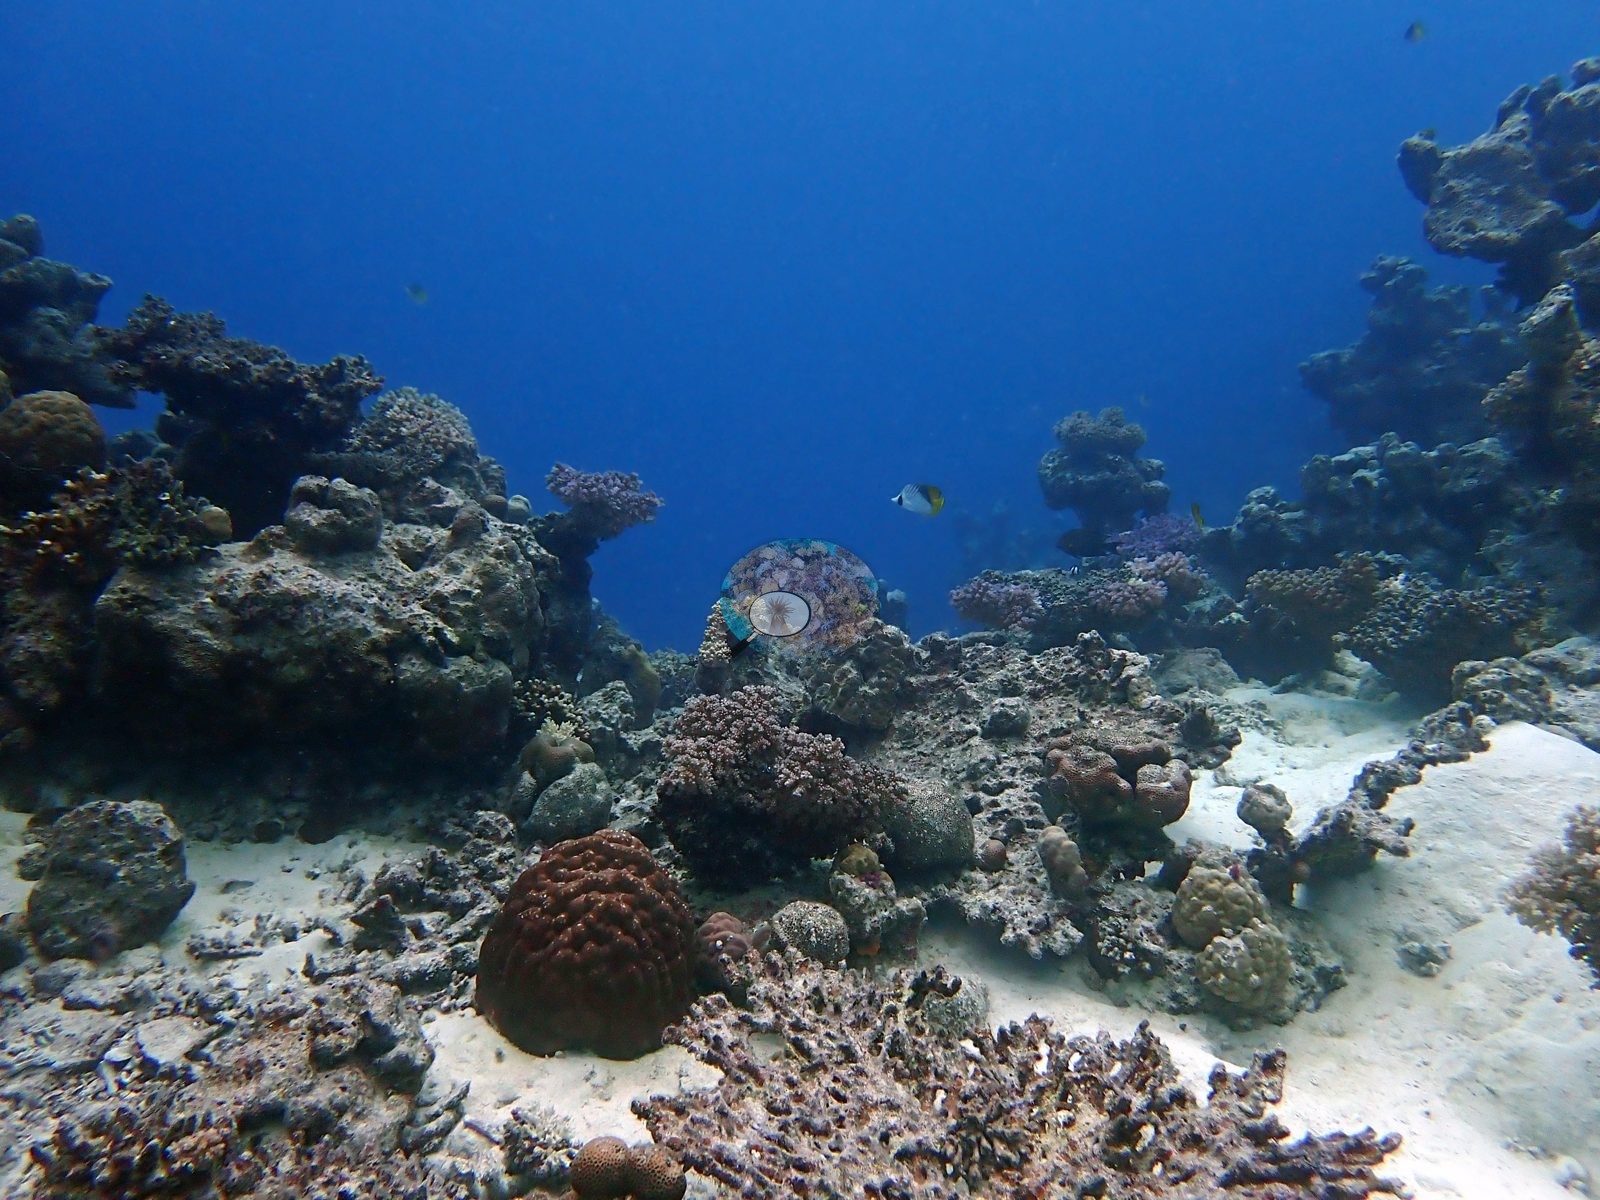
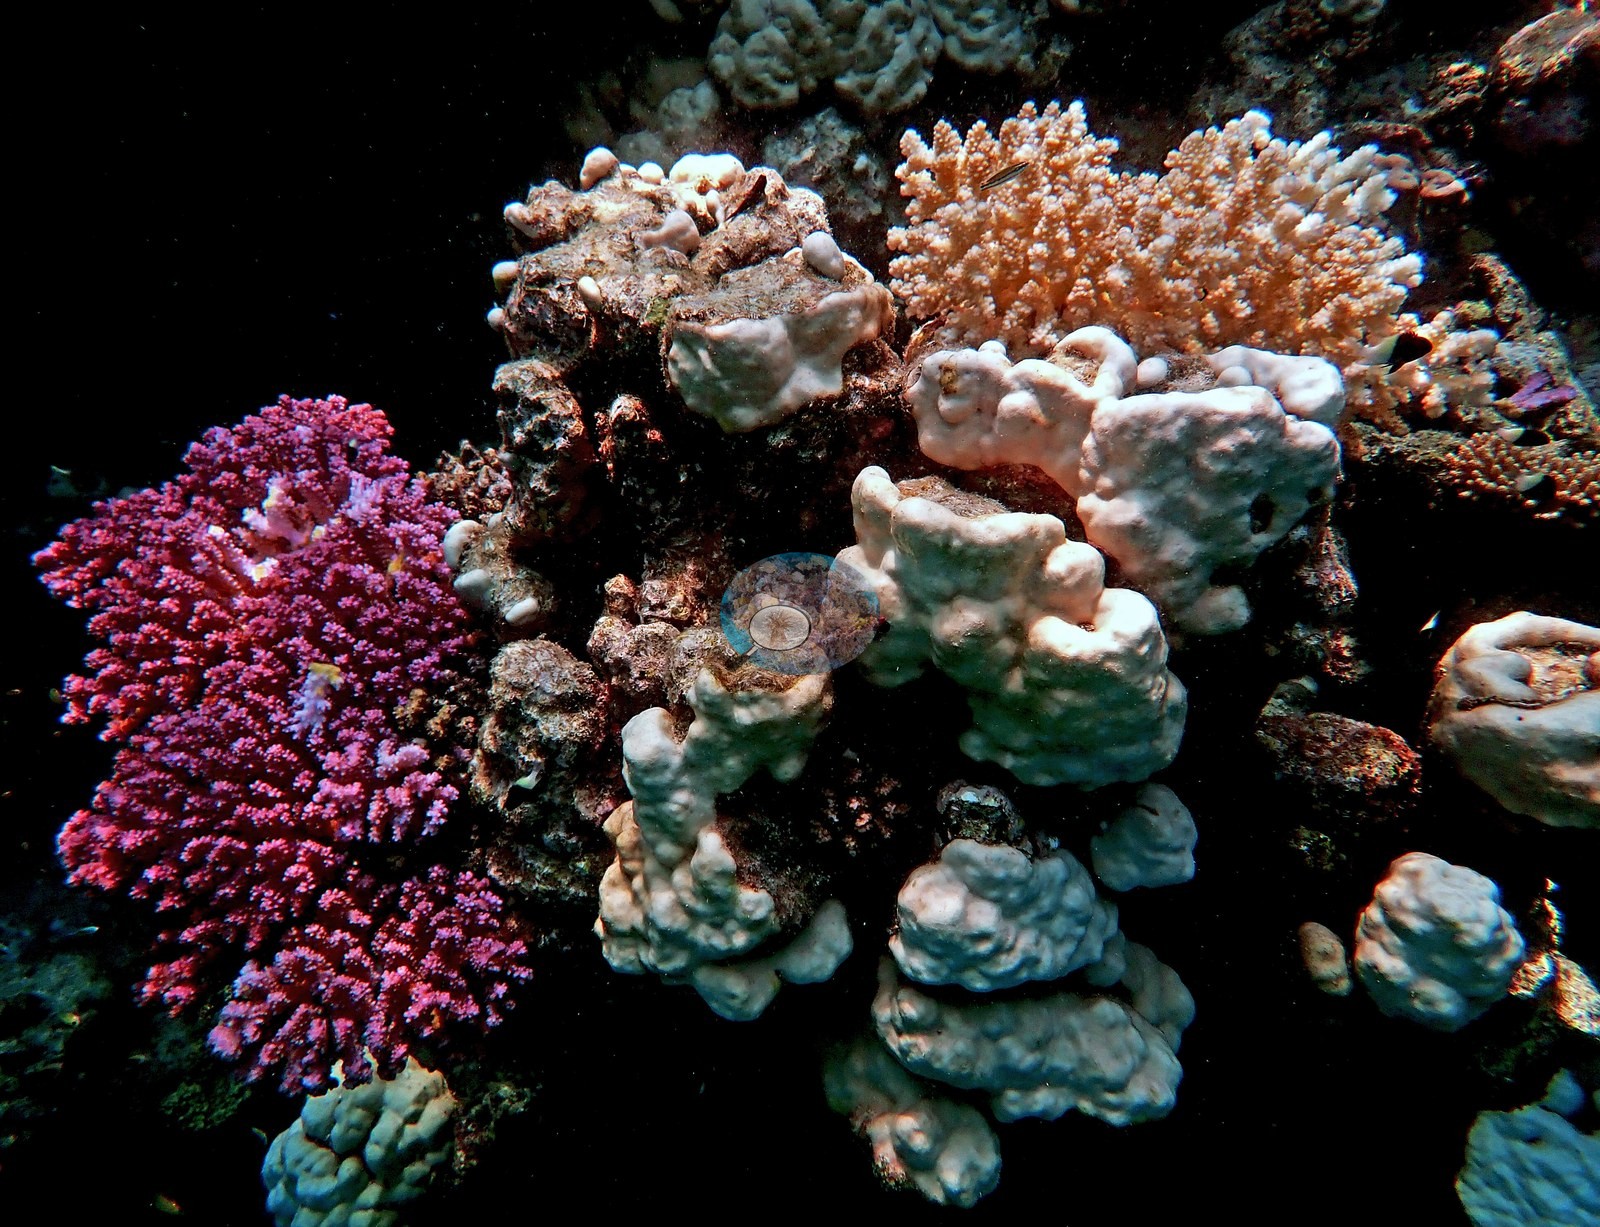
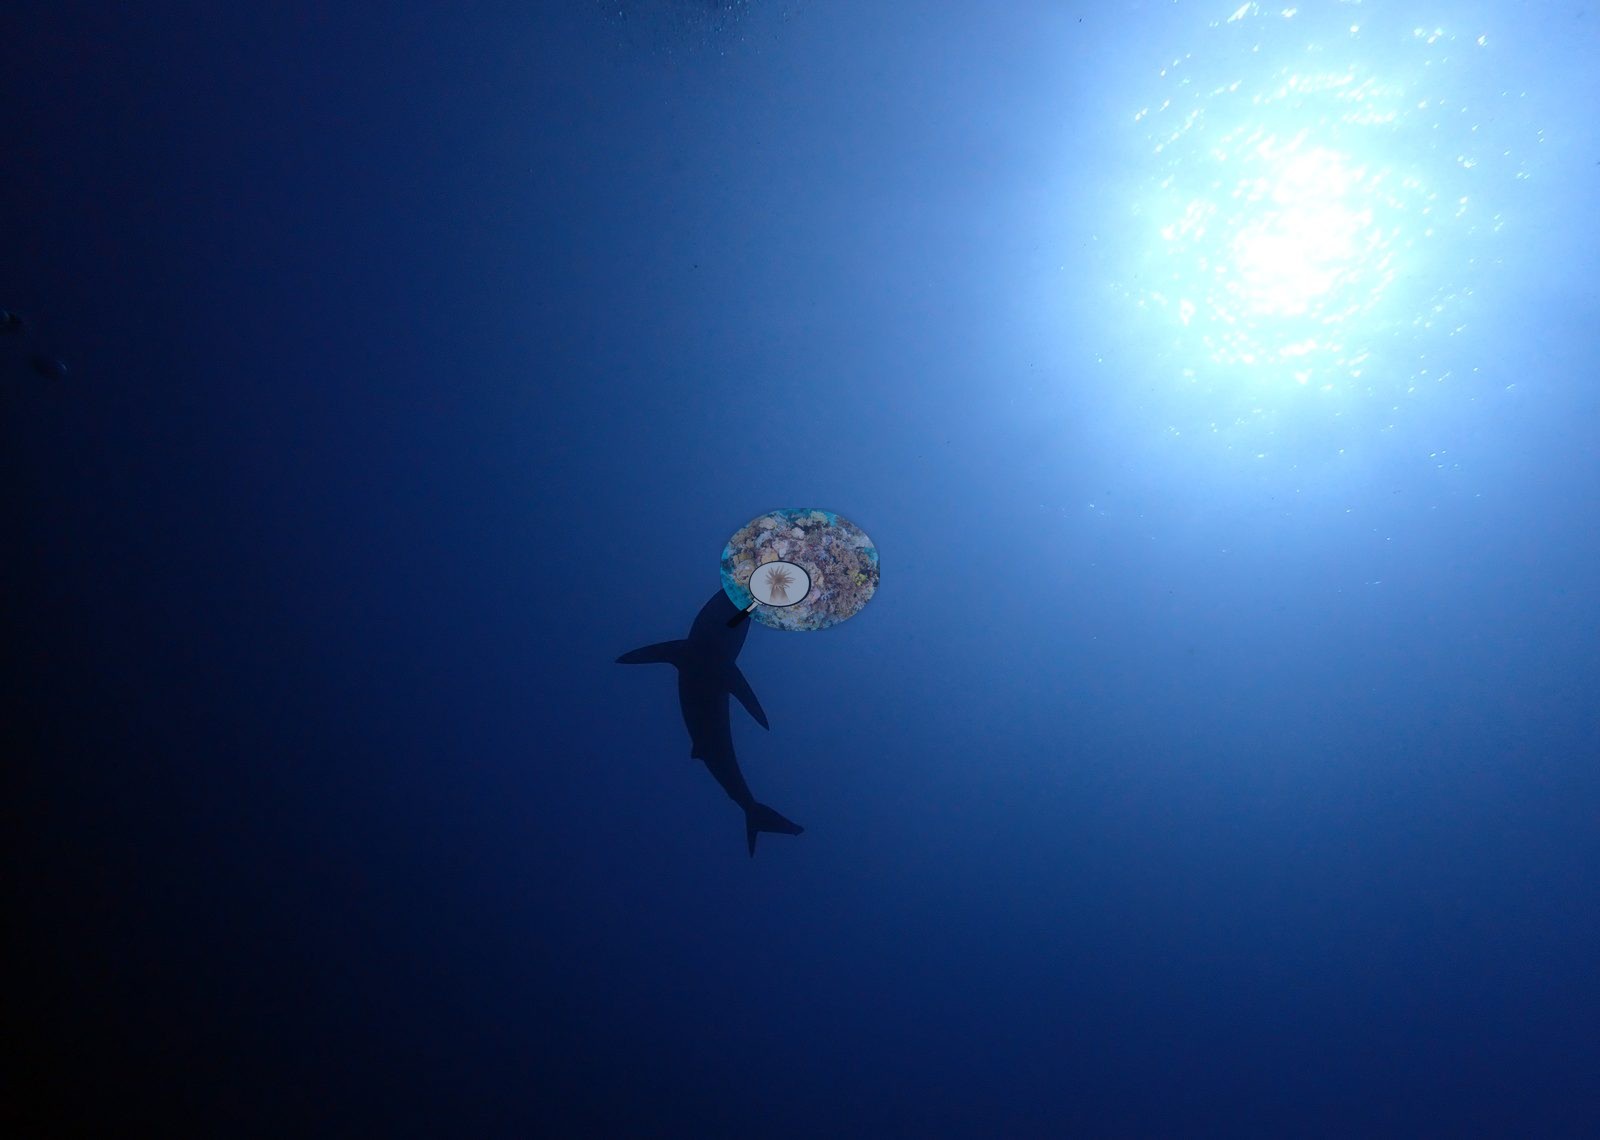
Notable observations (14)
- Saudi Red Sea - Shark Reef (Thuwal): Bleaching and crown-of-thorns: 72.7% of coral tissue bleached (31 Aug 2024) and 70.9% (14 Sep 2024), with whole slopes where most visible colonies are stark white. Two crown-of-thorns starfish, one on each survey day, photographed amid bleached and dying coral. Anderson's captions include 'severe bleaching', 'dead corals', 'dying reef'.
- Saudi Red Sea - north Rabigh (shore) (Rabigh): Bleaching: 64.8% of coral tissue bleached at about 16.9 degree-heating-weeks (16 Aug 2024); much of the branching framework stark bone-white, and a massive dome with freshly exposed skeleton already fouling brown.
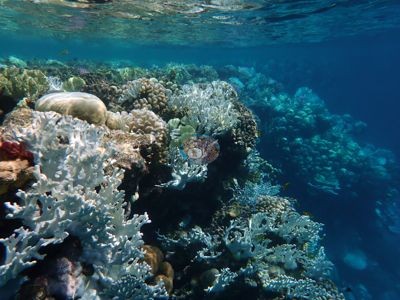
- Saudi Red Sea - Bhadur Reef (Jeddah): Bleaching and mortality: 61.8% of coral tissue bleached at about 22.3 degree-heating-weeks (7 Sep 2024); soft corals, fungiids and anemones bleached with the hard corals. Anderson's captions include '100% bleaching', 'dead acroporid', 'dying pocilloporid'.
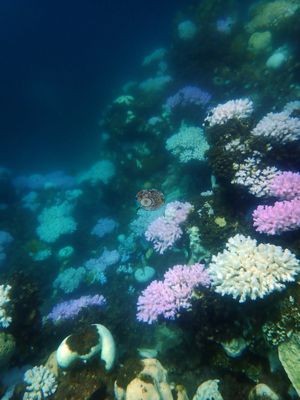
- Saudi Red Sea - Thetis (Yanbu): Bleaching and cover loss: 62.1% of coral tissue bleached in October 2023 (19.9 degree-heating-weeks) and 25.0% in August 2024; cover fell from 32.5% to 13.4% between the two visits.
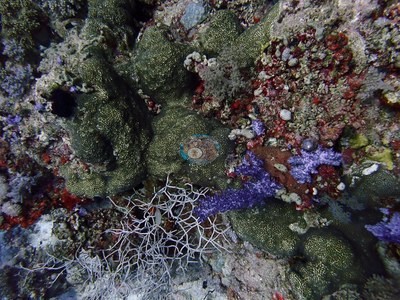
- Saudi Red Sea - Alrass Alakhdar (Yanbu): Bleaching: 58.5% of coral tissue bleached at about 14.9 degree-heating-weeks (16 Sep 2023); entire multi-meter stands of knobby Porites bone-white beside fully pigmented pocilloporids, on the highest-cover site in the Yanbu unit.
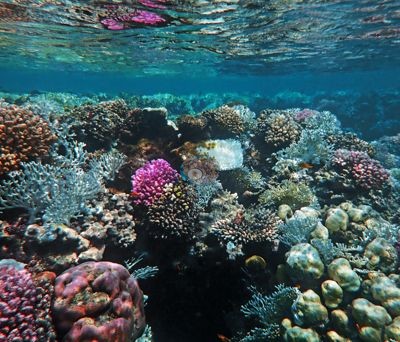
- Saudi Red Sea - Rose Reef (Thuwal): Bleaching: site-level 43.0% of coral tissue, ranging 24.3% to 61.8% across six visits; mass bleaching of tabulate and corymbose Acropora on the shallow flat in November 2023, with host anemones bleached white.
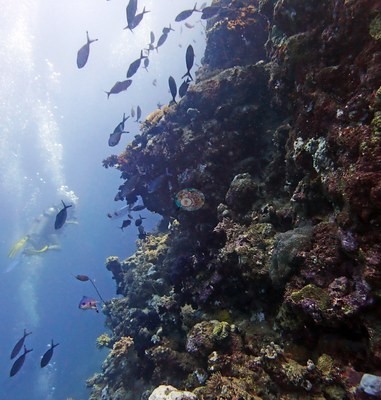
- Saudi Red Sea - Coral Gardens (Jeddah): Bleaching: 41.4% (10 Aug 2024) rising to 45.4% (17 Aug 2024) of coral tissue bleached; near-universal paling of the large Porites mounds and a stark-white Pocillopora verrucosa.
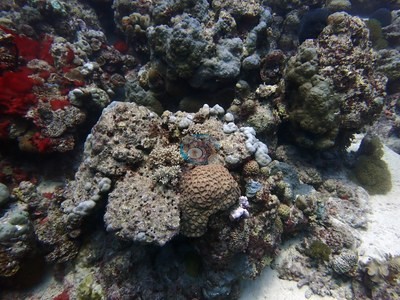
- Saudi Red Sea - Abu Ejeiah (Thuwal): Bleaching: 29.5% of coral tissue at site level, ranging 12.7% to 69.5% across four visits; July 2024 frames show a near-bare rubble plain of old, algal-filmed framework.
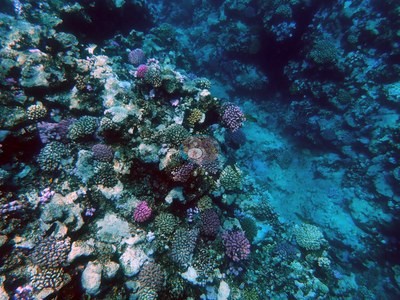
- Saudi Red Sea - Um Mankout (Yanbu): Bleaching and debris: 28.0% of coral tissue bleached (15 Sep 2023), with the columnar Porites carpet reading widely pale and a few frankly white colonies; a corroded discarded metal object on the sand at the reef base.
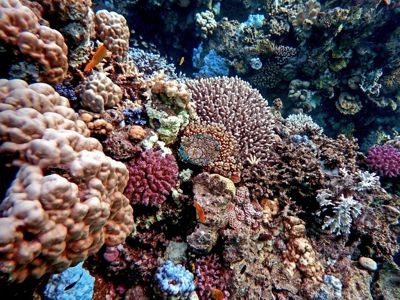
- Saudi Red Sea - Mr. Umluj (Yanbu): Bleaching without a clear heat signal: 27.7% of coral tissue bleached in April 2024 at zero degree-heating-weeks and 26.6% in August 2024 at 14.2; scattered pale and white colonies in both years.
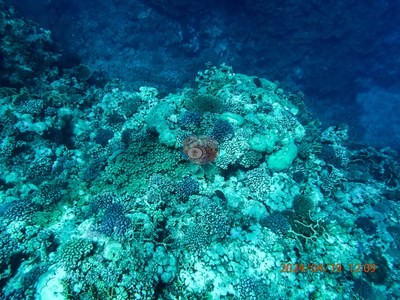
- Saudi Red Sea - Cave Reef (Thuwal): Bleaching and partial mortality without accumulated heat stress: 26.8% of coral tissue bleached on 9 February 2024; faviids with white dead-skeleton patches, and fresh parrotfish grazing scars captioned 'fish bites', not disease.
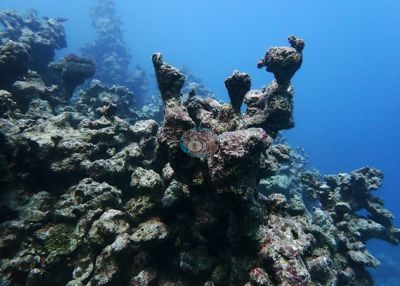
- Saudi Red Sea - Abu Galawa (Yanbu): Bleaching: 25.3% of coral tissue bleached on 19 April 2024 with no accumulated heat stress; the un-strobed frames are too washed out to confirm visually.
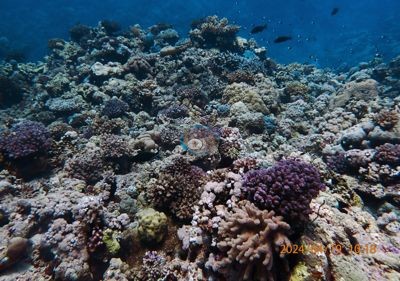
- Saudi Red Sea - Chicken Wreck (Jeddah): Disease and bleaching: a large encrusting or plating colony with an annular white-band lesion (captioned 'disease') and a Favites colony bleached and dying from the crown down; 20.3% to 28.3% of coral tissue bleached across three August 2024 visits.
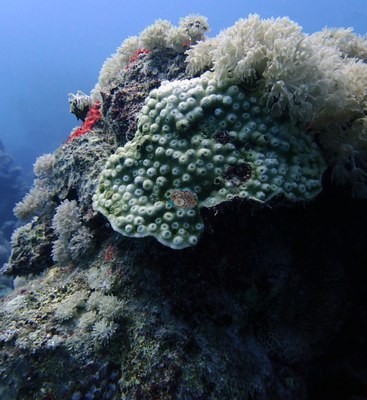
- Saudi Red Sea - Cement Wreck (Thuwal): Bleaching and lesions: 32.0% (Sep 2023), 26.1% (Apr 2024) and 18.7% (Jul 2024) of coral tissue bleached; a small faviid with a dark depressed lesion where tissue is missing, and old partial mortality on a large Diploastrea heliopora. Lowest cover in the set at 12.8%.
Coral cover over time (pooled)
Sites in this region (24)
- Saudi Red Sea - Abu Ejeiah (Thuwal) — 15% coral cover
- Saudi Red Sea - Abu Galawa (Yanbu) — 18% coral cover
- Saudi Red Sea - Al Fasmah (Yanbu) — 22% coral cover
- Saudi Red Sea - Al Shbareer reef (Yanbu)
- Saudi Red Sea - Alrass Alakhdar (Yanbu) — 30% coral cover
- Saudi Red Sea - Anderson's Reef-I (Jeddah) — 23% coral cover
- Saudi Red Sea - Anderson's Reef-II (Jeddah) — 21% coral cover
- Saudi Red Sea - Bhadur Reef (Jeddah) — 21% coral cover
- Saudi Red Sea - Cave Reef (Thuwal) — 17% coral cover
- Saudi Red Sea - Cement Reef (Thuwal) — 22% coral cover
- Saudi Red Sea - Cement Wreck (Thuwal) — 13% coral cover
- Saudi Red Sea - Chicken Wreck (Jeddah) — 17% coral cover
- Saudi Red Sea - Coral Gardens (Jeddah) — 28% coral cover
- Saudi Red Sea - Drogon Corals (Jeddah) — 14% coral cover
- Saudi Red Sea - Long Reef (Thuwal) — 14% coral cover
- Saudi Red Sea - Middle Reef (Thuwal)
- Saudi Red Sea - Mr. Umluj (Yanbu) — 17% coral cover
- Saudi Red Sea - north Rabigh (shore) (Rabigh) — 24% coral cover
- Saudi Red Sea - Rose Reef (Thuwal) — 15% coral cover
- Saudi Red Sea - Shark Reef (Thuwal) — 16% coral cover
- Saudi Red Sea - Thetis (Yanbu) — 16% coral cover
- Saudi Red Sea - Um Mankout (Yanbu) — 26% coral cover
- Saudi Red Sea - unnamed site 1 (Al Qunfudah) — 16% coral cover
- Saudi Red Sea - unnamed site 2 (Al Qunfudah) — 17% coral cover
% coral cover by method
Pooled across 4 published areas
| Method | Mean % coral cover | Std. dev. between published areas | n published areas | Note |
|---|---|---|---|---|
| Manual point count (author) | 20.4% | ±3.9 | 3 | frame-weighted 18.1% over 3,900 frames |
| Claude (Anthropic), blind point count | 27.2% | ±2.9 | 4 | frame-weighted 28.2% over 588 frames |
| In-house DINOv3 point classifier | 39.5% | ±10 | 4 | frame-weighted 39.4% over 211 frames |
The mean is an UNWEIGHTED mean of the published area values — each published area counts once, whatever its photo count — which is the convention of the published tables and of every other figure on this page. The frame-weighted alternative is given per method in the Note column; where the two differ, the difference is a photo-count imbalance, not a coral-cover finding.
Closest to the reference
Over the published areas where an independent reference exists, Claude (Anthropic), blind point count sits closest to it — a mean absolute deviation of 6.5 pp across 2 published areas, then In-house DINOv3 point classifier 18.9 pp (n=2). A mean absolute deviation is not an accuracy score: a model with a consistent offset is correctable, while one with the same deviation scattered in both directions is not.
By published area
| Published area | Manual point count | Claude | DINOv3 |
|---|---|---|---|
| Thuwal | 16.1% n=2,567 | 23.9% n=6 | 47.5% n=4 |
| Jeddah | 21.6% n=1,160 | 27.3% n=274 | 34.9% n=93 |
| Rabigh | 23.6% n=173 | 31.0% n=173 | 48.1% n=84 |
| unassigned region | — | 26.6% n=135 | 27.7% n=30 |
n under each value is the number of photographs that method scored at that published area. ⚠ marks a cell that is not an independent check.
Reference: point-count on the photographs (a human scoring the same pixels the models see). Denominator: coral points / (30 − WATER − FISH); `Unk` is IN the denominator (Mayfield 2025 convention); divers (`DVR`) are excluded as well, per the Red Sea paper. Source: published verbatim (Mayfield 2025, Environments 12:248, Table 4) ⚠ These rows are REGIONS, not dive sites. The published paper reports cover by region only — no individual dive-site name appears in it — so no CRD dive site has its own manual value here. ⚠ The manual column and the computer vision (CV) columns are on DIFFERENT FRAME SETS. The published cover spans the region's full photo set (173–2,567 frames, most of them CoralNet robot-labeled); the CV arms ran only on the hand-scored reference subset, which is 6 frames at Thuwal, 274 at Jeddah and 173 at Rabigh. Read Thuwal's model columns as indicative only. CoralNet is n/a by design: the reference set IS the hand-scored set, so those frames carry no independent robot label to compare against. DINOv3 is restricted to frames it never saw, and reads roughly double the published cover at every Red Sea region. ⚠ 'unassigned region' is not a place: 135 frames carry no region label in the CoralNet metadata and map to no published row. It has no manual value and is excluded from the pooled reference.
Nearby external survey stations
15 independent survey records within 5 km of a site in this region (deduplicated across sites).
- Aeby et al. (2021) — Qita al Kirsh (2015): 60% hard coral cover, 0.36 km from Saudi Red Sea - Shark Reef (Thuwal)
- Aeby et al. (2021) — Shi'b Nazar (2015): 39% hard coral cover, 1.31 km from Saudi Red Sea - Long Reef (Thuwal)
- Aeby et al. (2021) — Yanbu 2 (2015): 42% hard coral cover, 3.78 km from Saudi Red Sea - Mr. Umluj (Yanbu)
- Aeby et al. (2021) — Yanbu 3 (2015): 50% hard coral cover, 4.22 km from Saudi Red Sea - Mr. Umluj (Yanbu)
- Aeby et al. (2021) — Yanbu 4 (2015): 83% hard coral cover, 1.48 km from Saudi Red Sea - Al Fasmah (Yanbu)
- Aeby et al. (2021) — Yanbu 6 (2015): 51% hard coral cover, 1.79 km from Saudi Red Sea - Al Fasmah (Yanbu)
- Coral Vita — Coral Vita 1 (2025): 23% hard coral cover, 3.21 km from Saudi Red Sea - Coral Gardens (Jeddah)
- Furby et al. (2013) — Midshelf reef 2 (2010): 23% hard coral cover, 0.36 km from Saudi Red Sea - Shark Reef (Thuwal)
- Furby et al. (2013) — Offshore reef 1 (2010): 31% hard coral cover, 1.07 km from Saudi Red Sea - Cave Reef (Thuwal)
- Khalil et al. (2017) — — (2013): 26% hard coral cover, 1.05 km from Saudi Red Sea - Abu Ejeiah (Thuwal)
- Khalil et al. (2017) — — (2013): 31% hard coral cover, 3.81 km from Saudi Red Sea - Anderson's Reef-II (Jeddah)
- Monroe et al. (2018) — Midshelf reef 2 (2015): 37% hard coral cover, 0.36 km from Saudi Red Sea - Shark Reef (Thuwal)
- Monroe et al. (2018) — Offshore reef 1 (2015): 28% hard coral cover, 1.31 km from Saudi Red Sea - Long Reef (Thuwal)
- Reef Check — Sheraton, KSA (2024): 12% hard coral cover, 3.16 km from Saudi Red Sea - Bhadur Reef (Jeddah)
- Reef Check — Sheraton, KSA (2025): 11% hard coral cover, 3.16 km from Saudi Red Sea - Bhadur Reef (Jeddah)
All images from Coral Reef Diagnostics. Data are from Coral Reef Diagnostics and Reef Check Foundation.
 © Coral Reef Diagnostics.
References
- Mayfield AB (2025). Using Tourist Diver Photos to Assess the Effects of Marine Heatwaves on Central Red Sea Coral Reefs. Environments 12:248. PDF
- Aeby GS, Shore A, Jensen T, Ziegler M, Work T, Voolstra CR (2021). A comparative baseline of coral disease in three regions along the Saudi Arabian coast of the central Red Sea. PLOS ONE 16:e0246854. PDF
- Furby KA, Bouwmeester J, Berumen ML (2013). Susceptibility of central Red Sea corals during a major bleaching event. Coral Reefs 32:505-513. DOI
- Khalil MT, Bouwmeester J, Berumen ML (2017). Spatial variation in coral reef fish and benthic communities in the central Saudi Arabian Red Sea. PeerJ 5:e3410. DOI
- Monroe AA, Ziegler M, Roik A, Röthig T, Hardenstine RS, Emms MA, et al. (2018). In situ observations of coral bleaching in the central Saudi Arabian Red Sea during the 2015/2016 global coral bleaching event. PLOS ONE 13:e0195814. PDF