
Saudi Red Sea - Rose Reef (Thuwal)
Part of the regional summaries: Saudi Arabia - Jeddah / KAUST (Thuwal) / Rabigh, Saudi Arabia, and Red Sea
2023-11-11
2023-11-17
2024-02-09
2024-09-28
2024-10-04
More info
Makkah-Madine Saudi Arabia (NOAA CRW virtual station) · Northern and Central Red Sea ecoregion mean=12.2°C-heating weeksRose Reef is the most heavily surveyed Thuwal site (720 photographs across six visits), a near-vertical wall dropping to 32-36 m with a fine mosaic of encrusting faviids, small pocilloporids, and foliose plates, plus black wire corals off the lip. Its shallow reef flat showed unambiguous mass bleaching in November 2023 - multiple tabulate and corymbose Acropora colonies glowing white alongside pigmented neighbors, and even host anemones bleaching white while their resident anemonefish stayed in place - and the paper's bleaching figures here range from 24.3% to 61.8% of coral tissue, the widest swing of any site in the set.
شعبة الورد هي الأكثر مسحاً بين مواقع ثول (720 صورة عبر ست زيارات)، وهي جدار شبه عمودي يهبط إلى عمق 32–36 م بفسيفساء دقيقة من المرجان المتقشر من فصيلة Faviidae، ومرجانيات شوكية صغيرة، وصفائح ورقية، إضافة إلى المرجان الأسود السلكي عند حافة الجدار.
ترجمة هذا الملخص بالذكاء الاصطناعي؛ النص الإنجليزي هو المعتمد. Translated from the site’s shorter map summary.
Two independent survey stations shown with the program’s logo — click one to see how far it is from this site.
8 of these 11 photographs are shown beside the text that discusses them under "Site description" below.
Site description
Setting
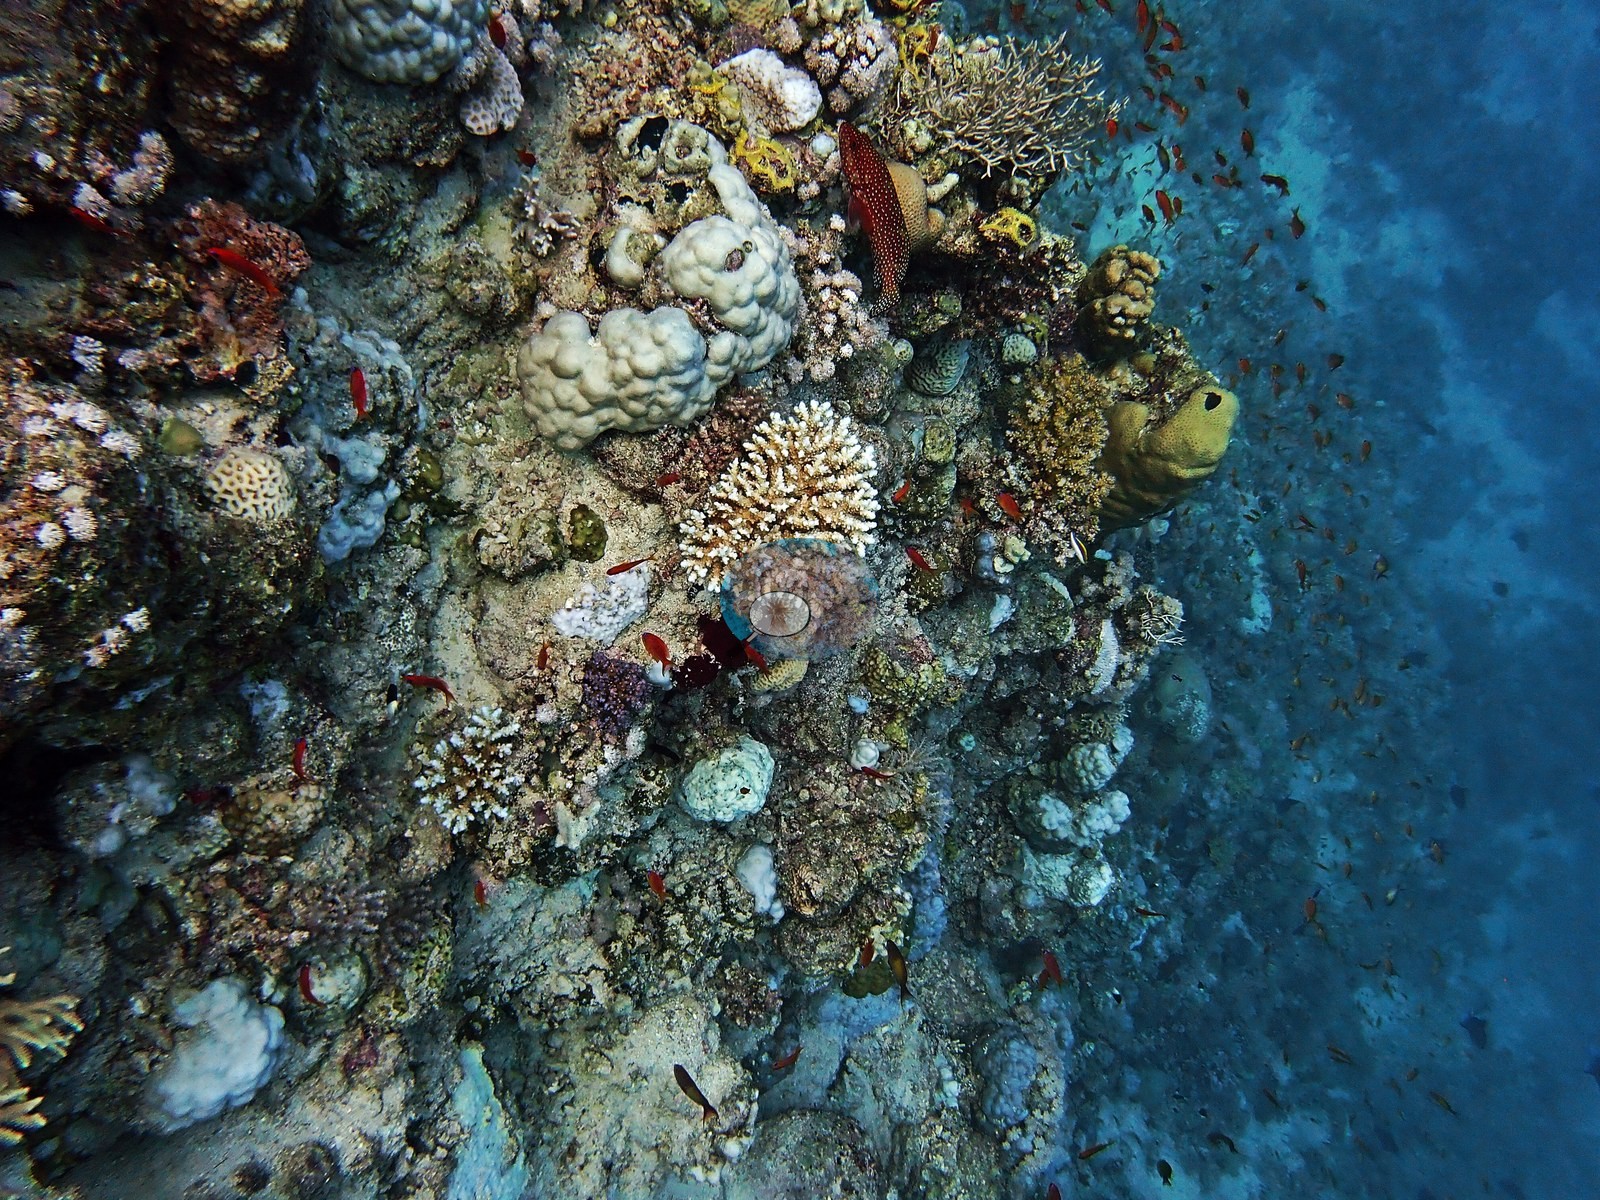
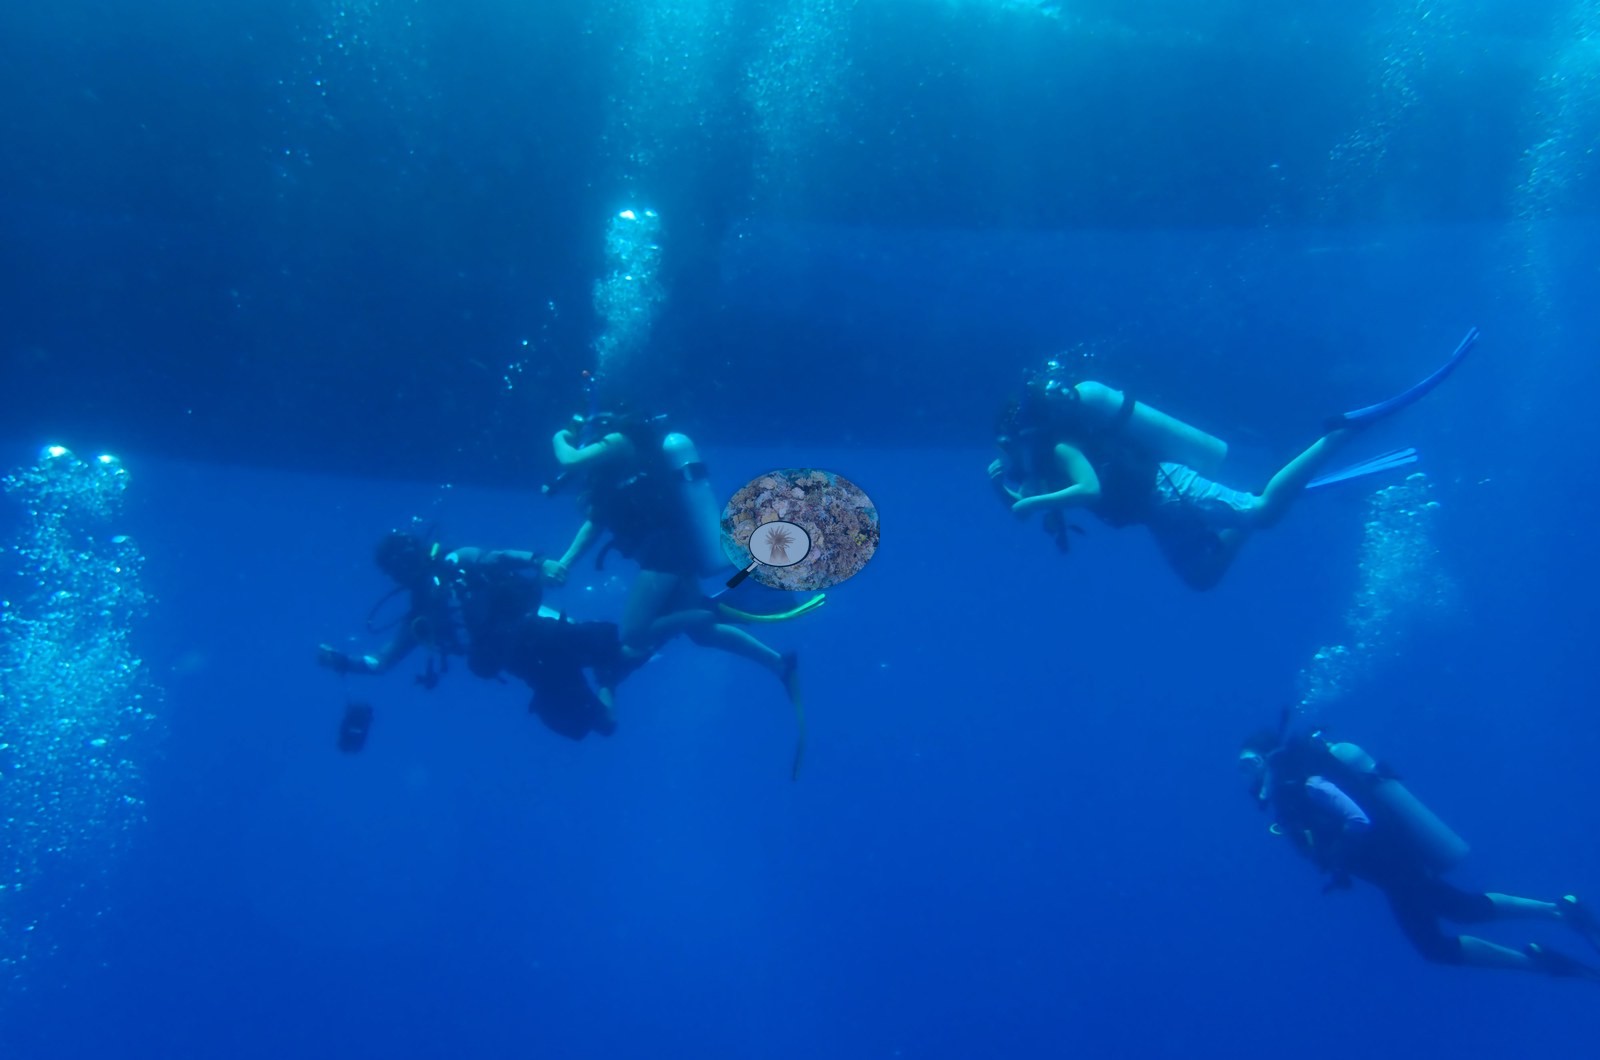
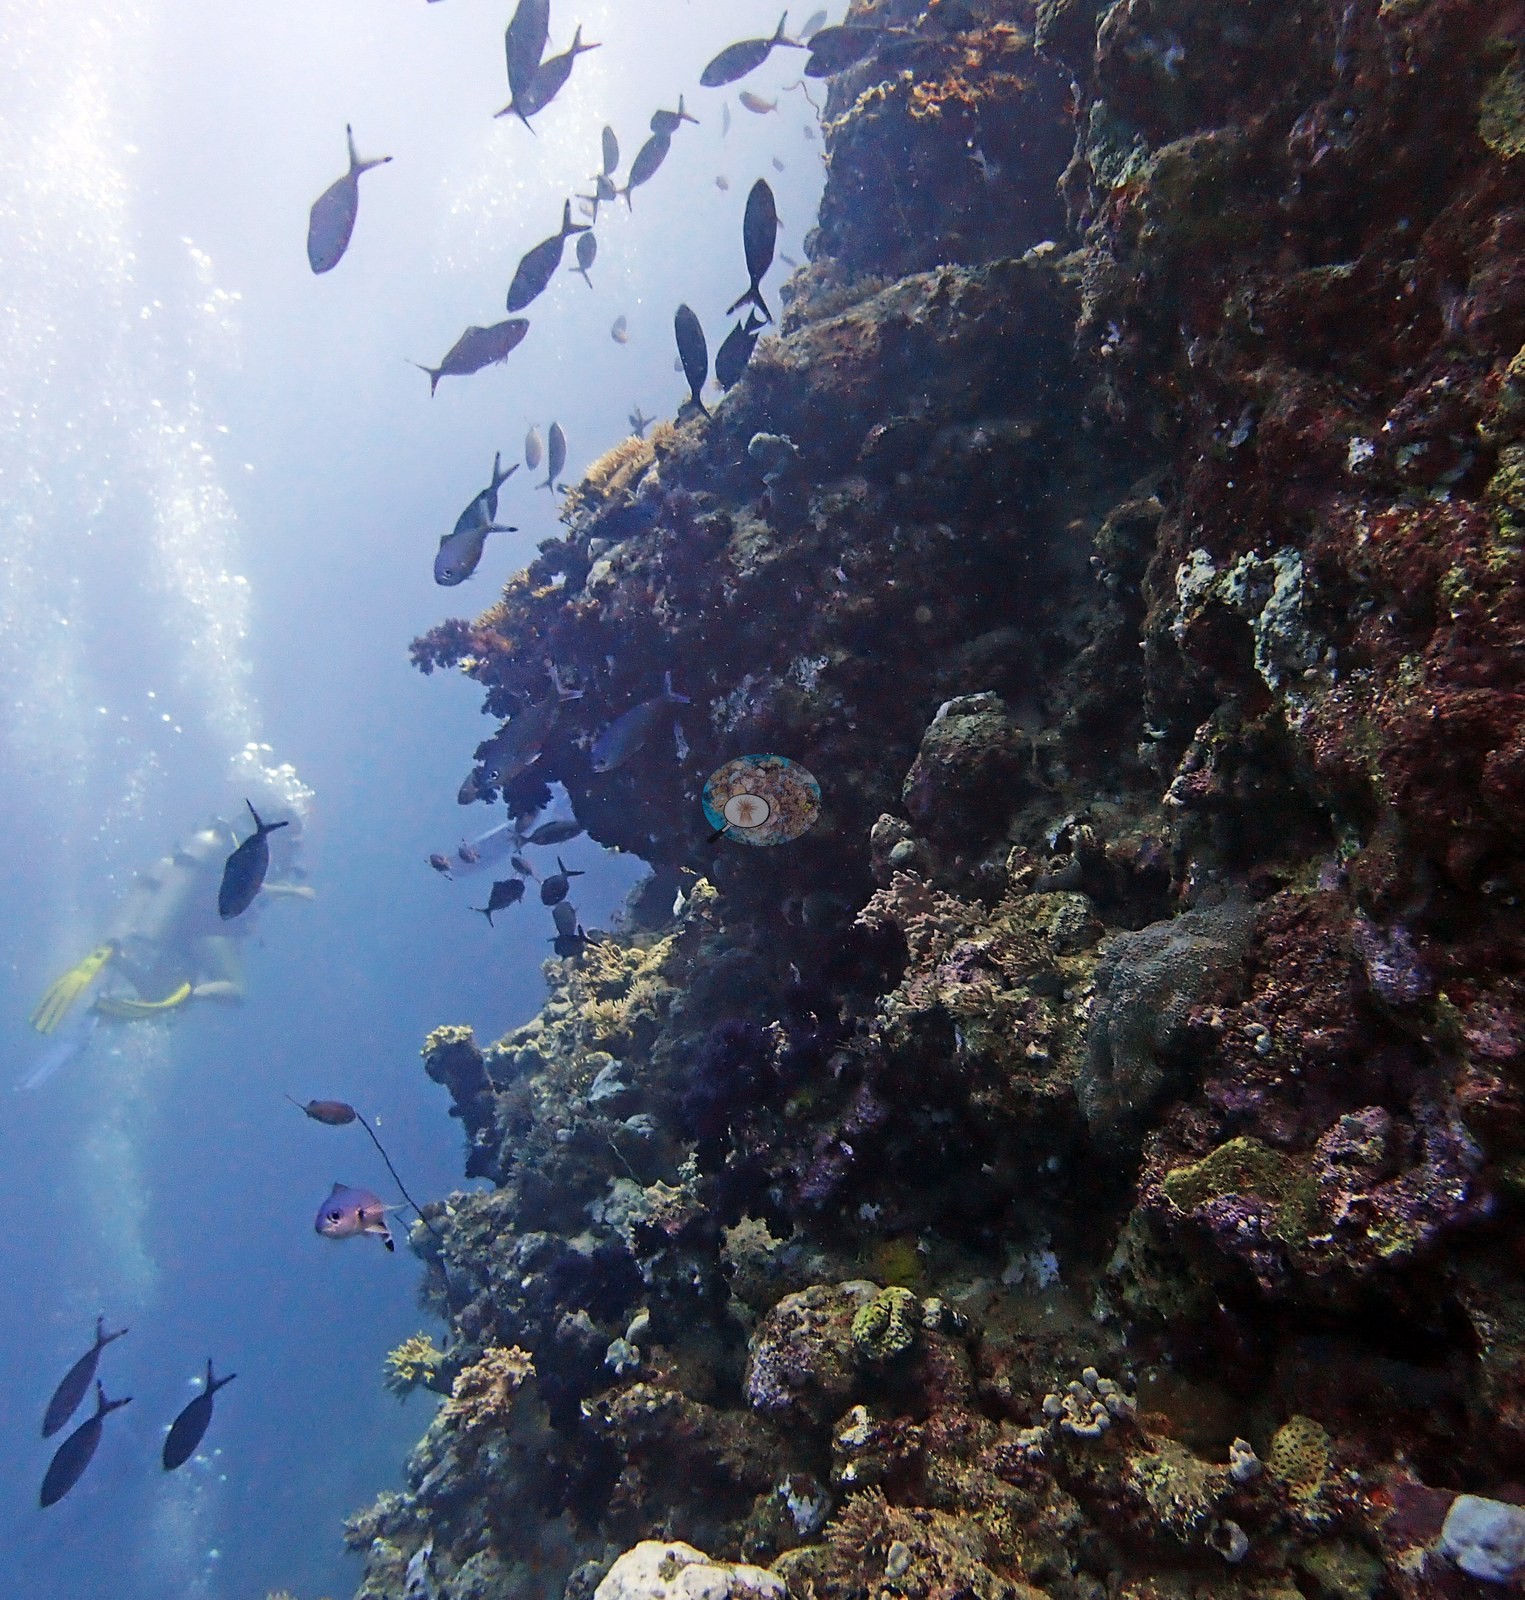
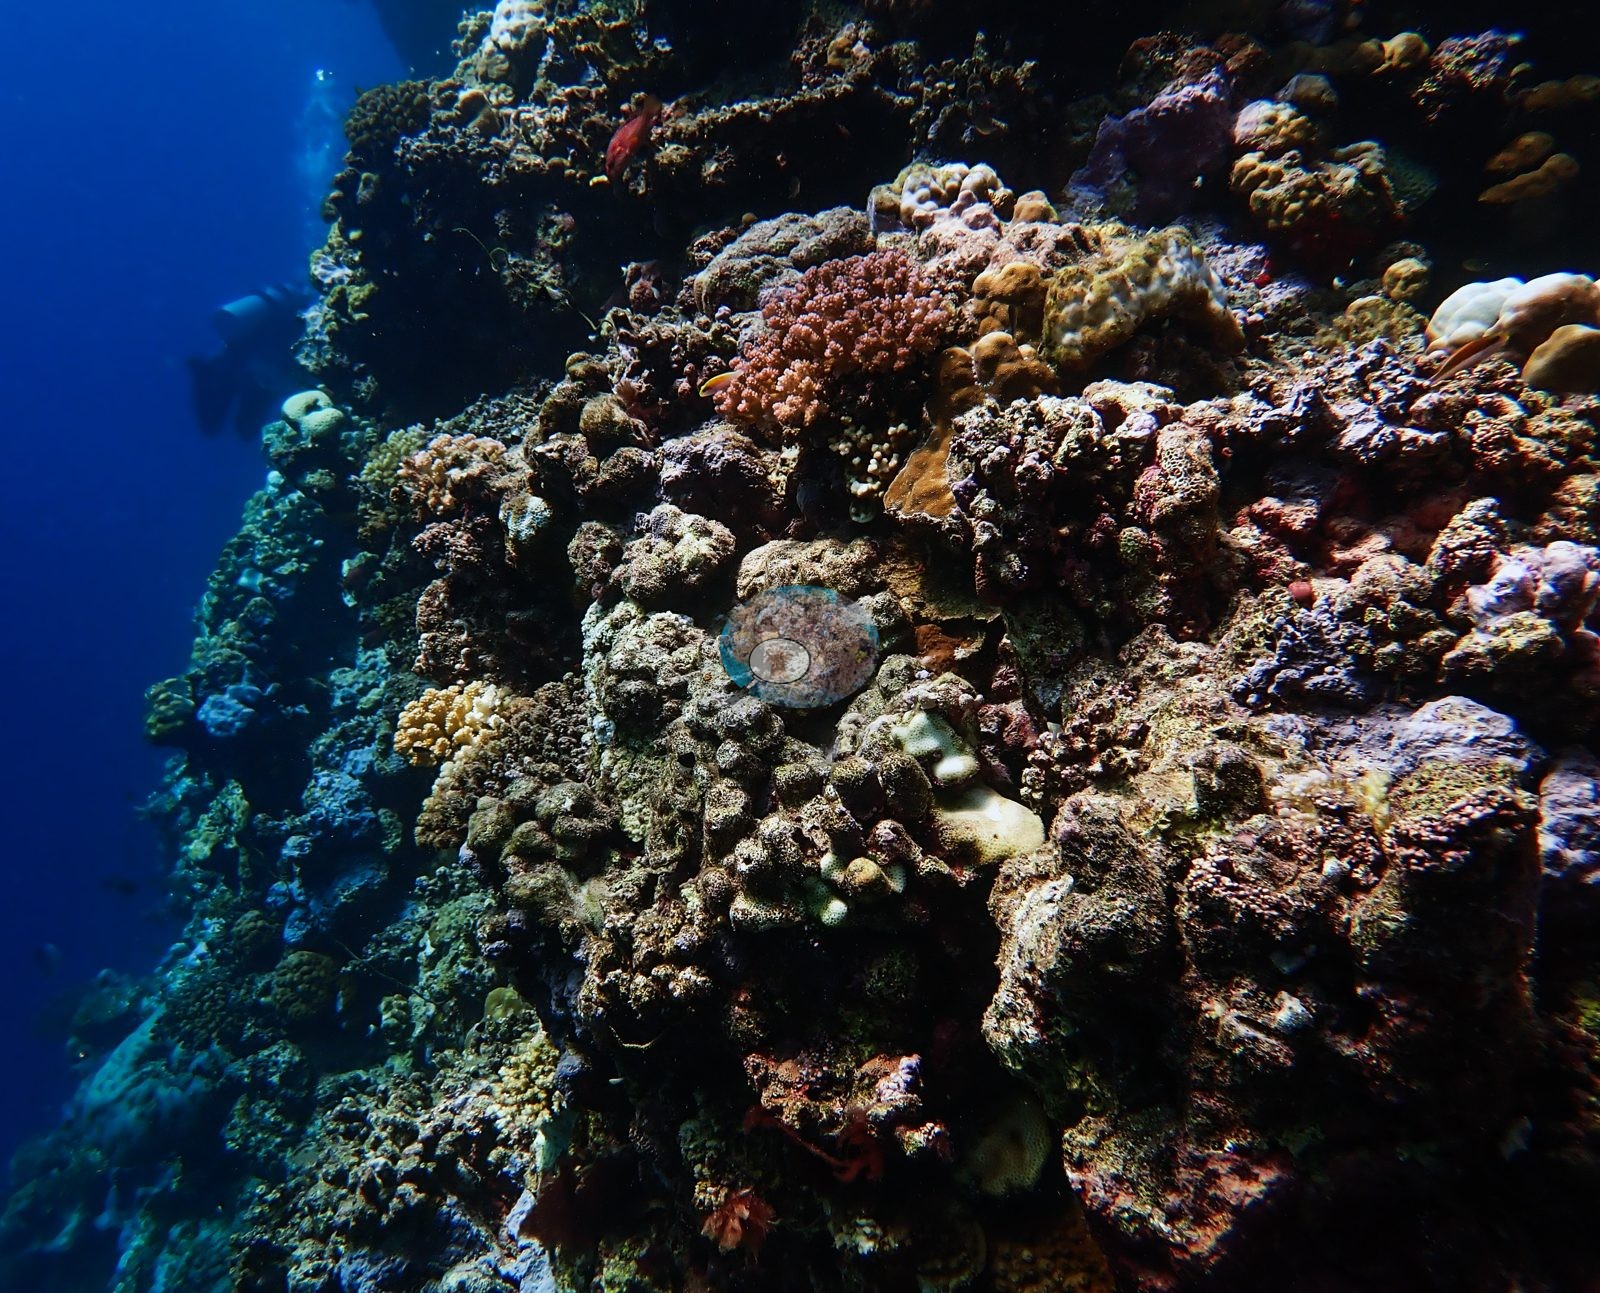
The site is a wall. Several dives ran to 32–36 m and the frames show why: a near-vertical limestone face plastered with small colonies from the surface down, dropping past a fish-swarmed mid-water zone onto a flat, low-relief rubble and sand floor (e.g., Image 2, Image 8).
General benthic features
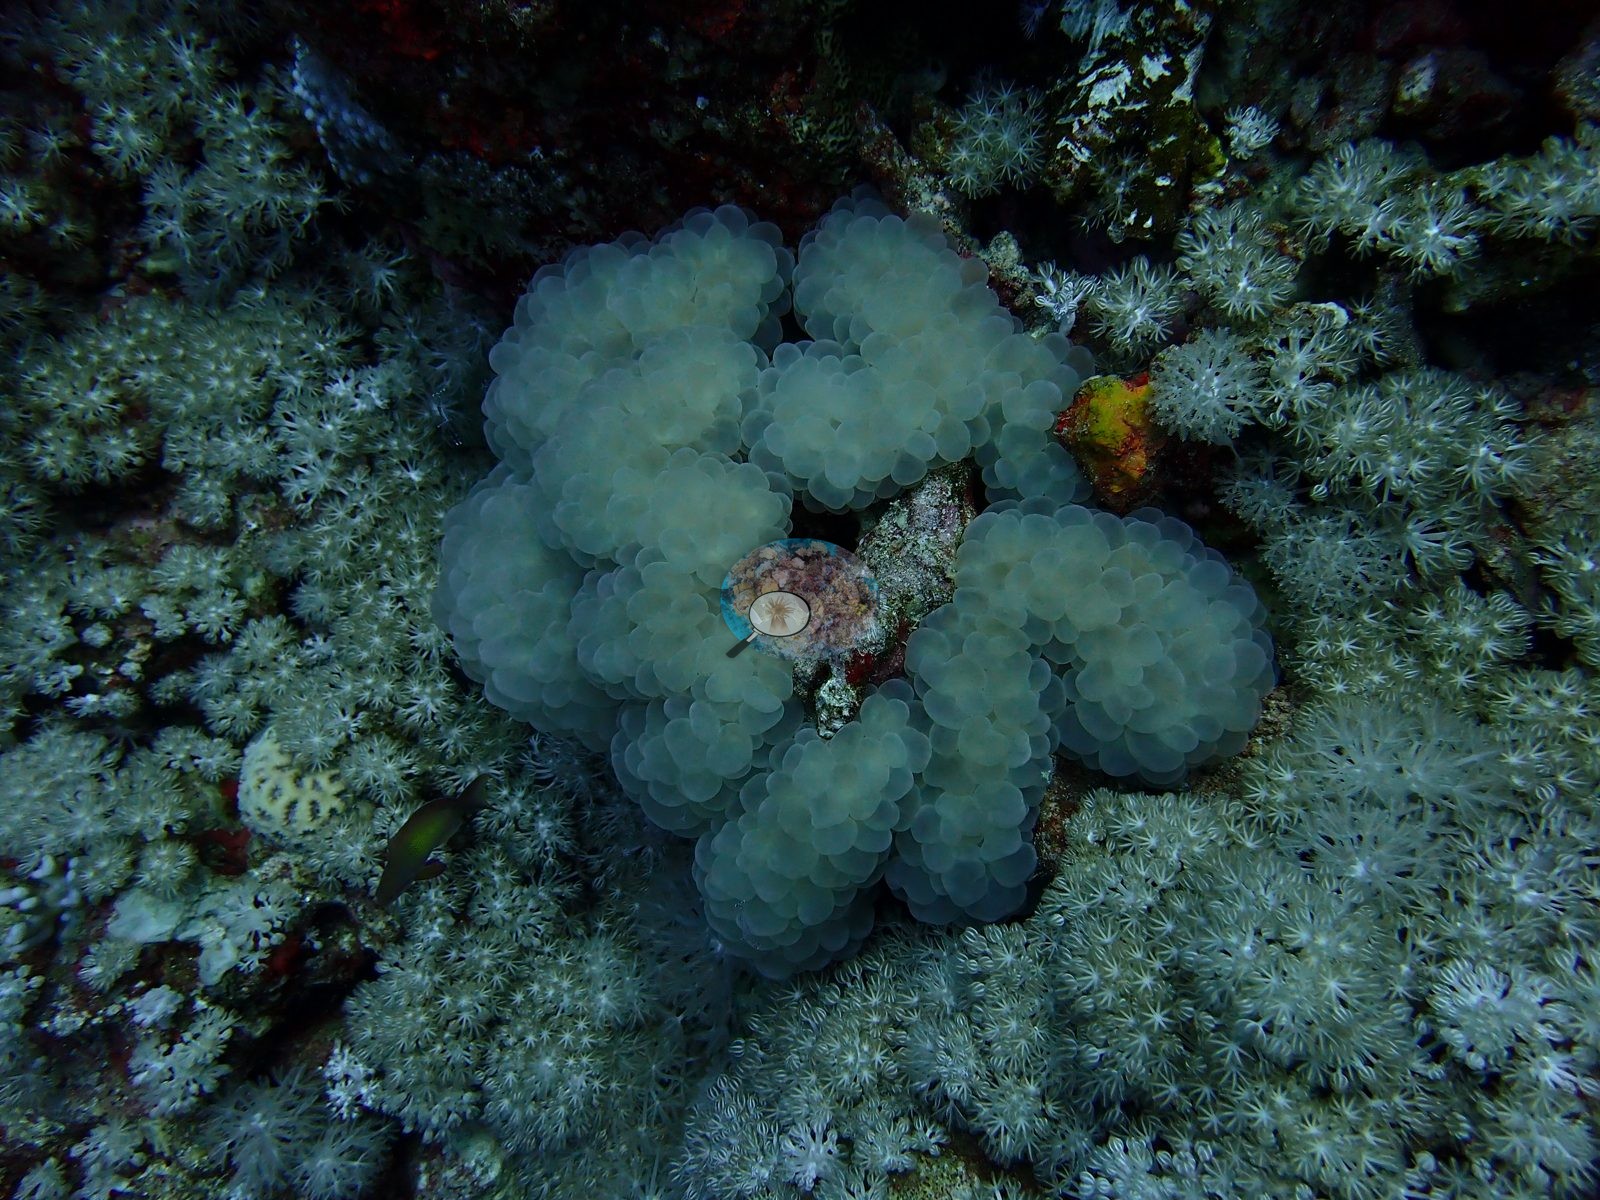
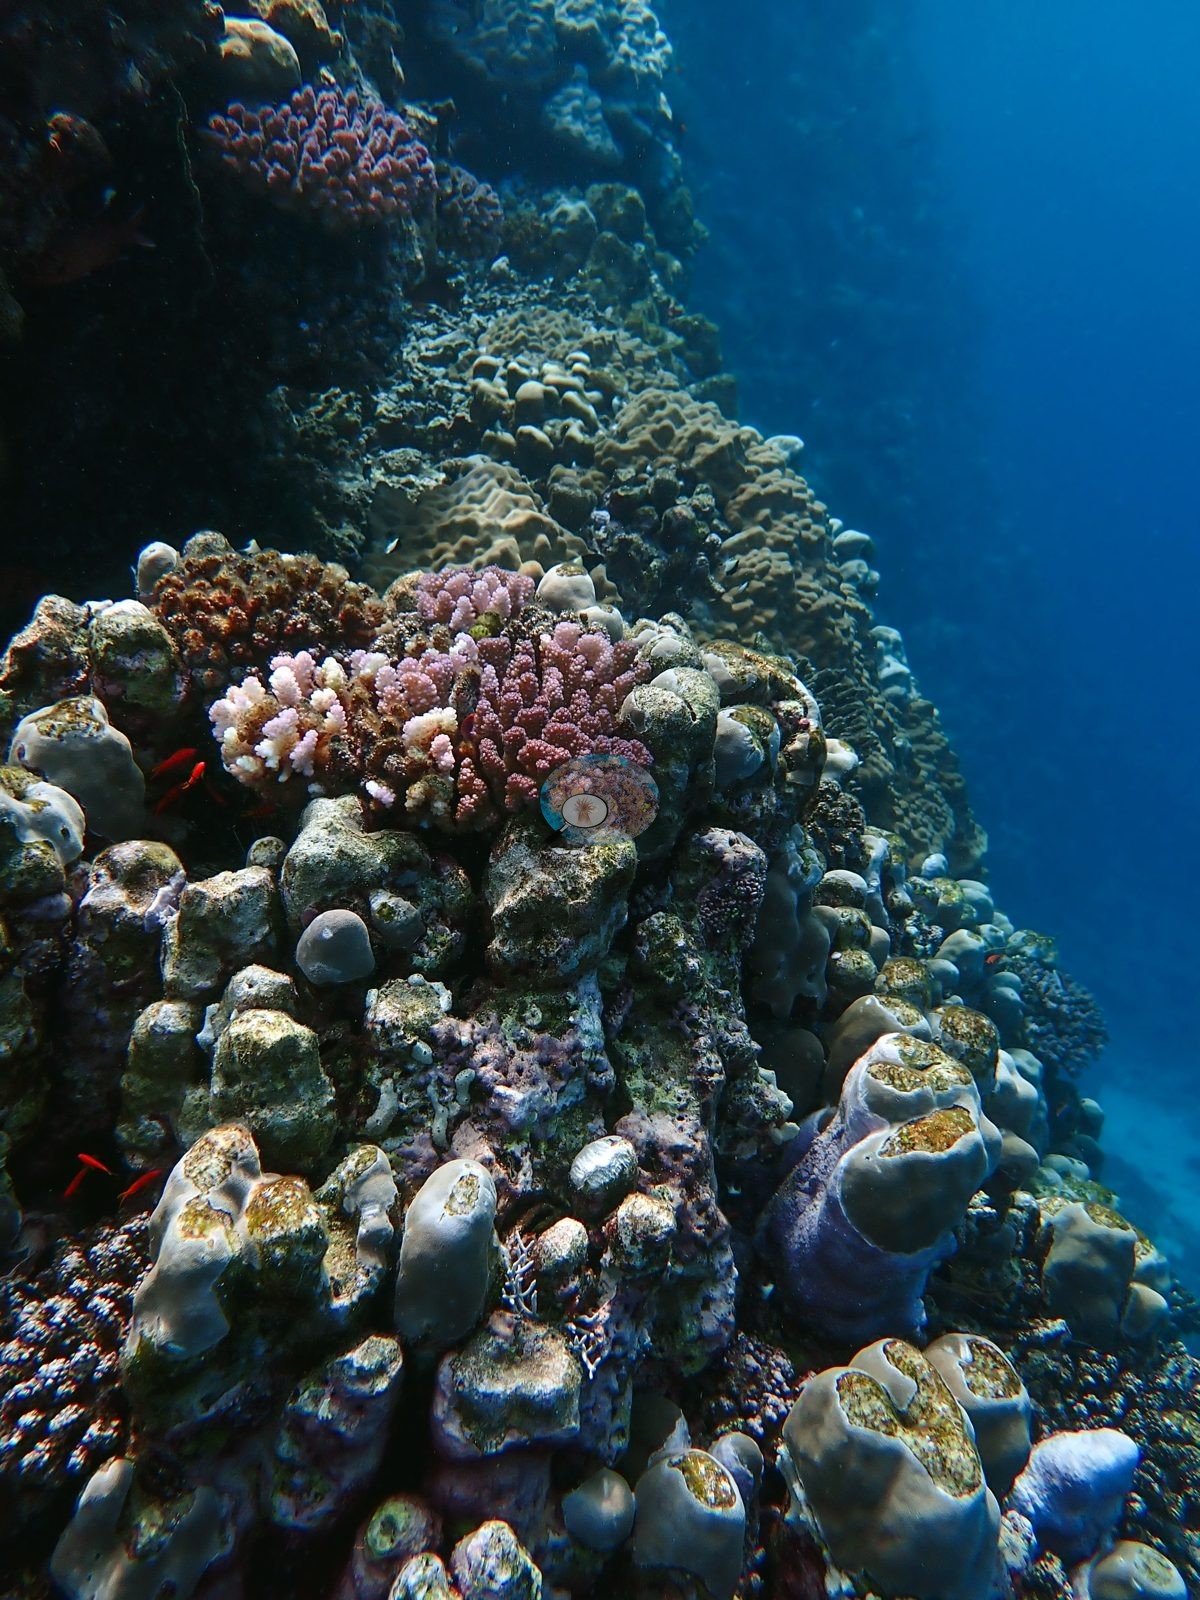
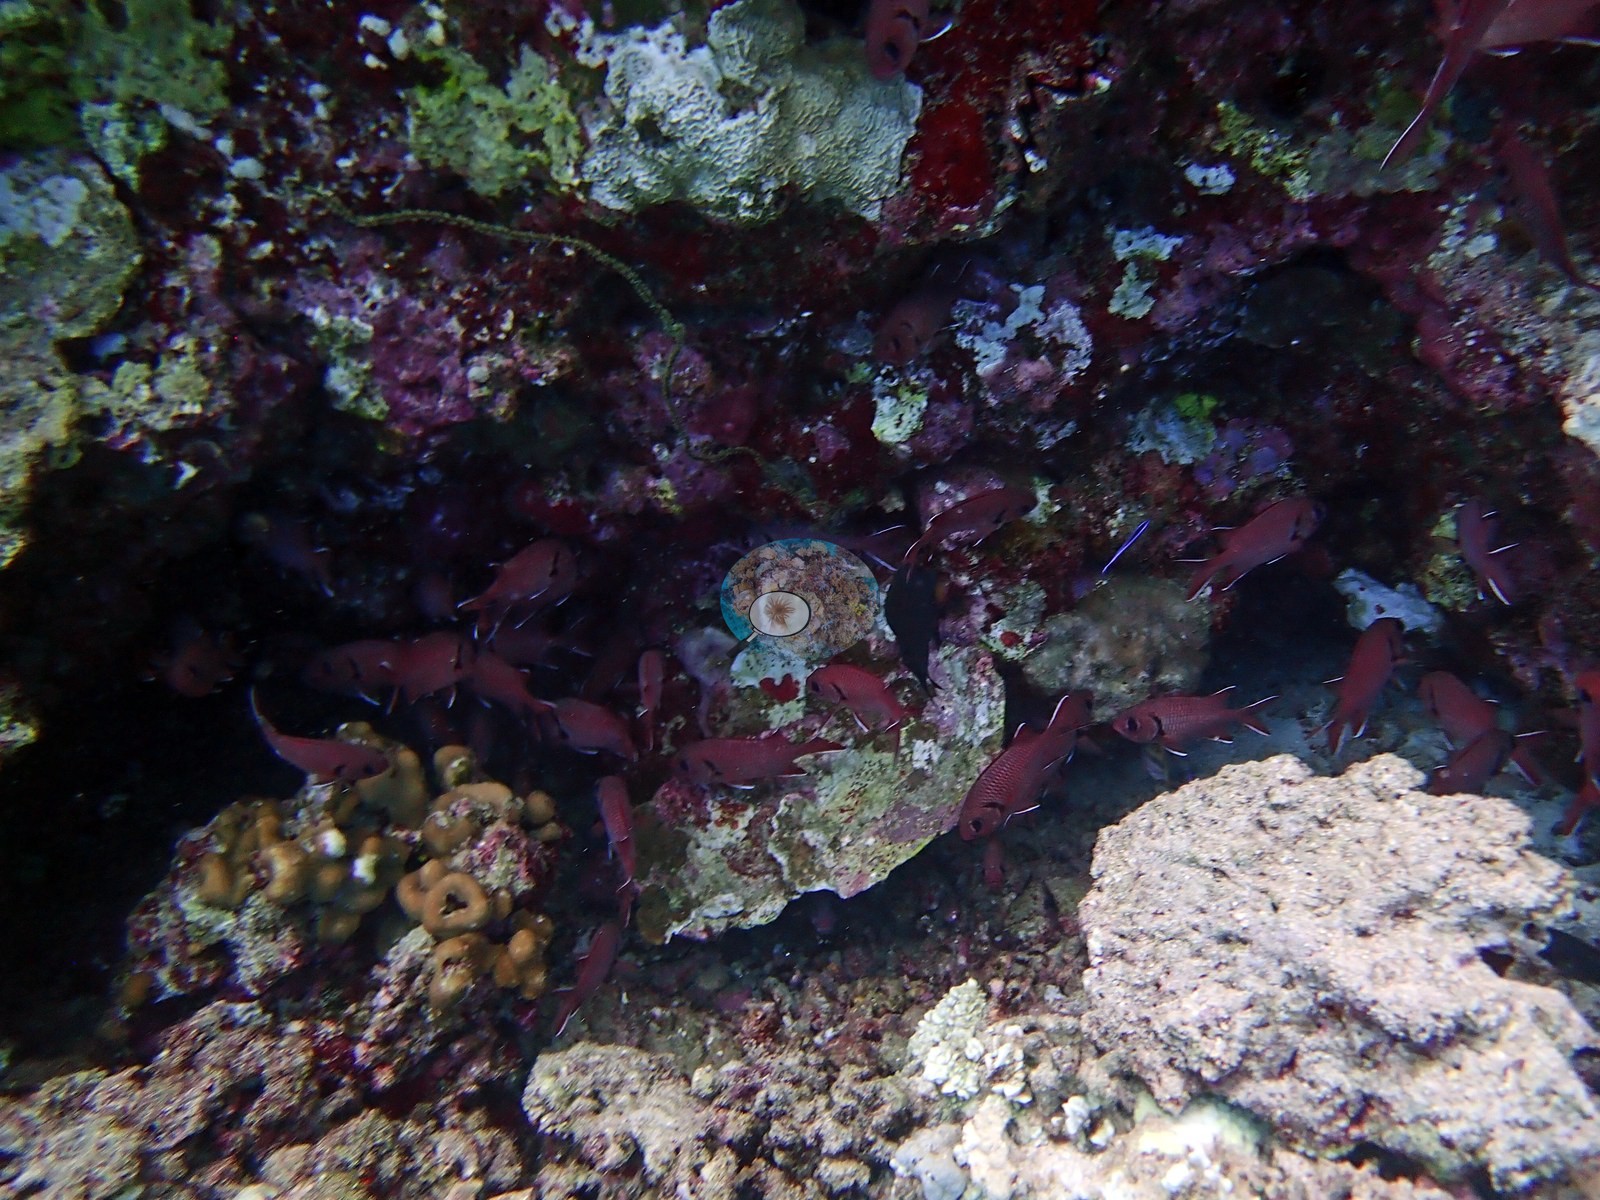
A frame Anderson captioned "view from 35 m" is that floor — gray-blue, low, almost entirely coralline-crusted rubble with scattered small massives and nothing upright. The wall itself carries a fine-grained mosaic: encrusting and submassive faviids, small pocilloporids, tan, and orange encrusting Montipora-type sheets, foliose Turbinaria/Echinopora-type plates with clean white growing margins, delicate gray and lilac soft corals with extended polyps, sponges and crustose coralline in pinks and reds, and black wire corals (Cirrhipathes-type) springing off the lip into open water (e.g., Image 5, Image 7, Image 9, Image 11).
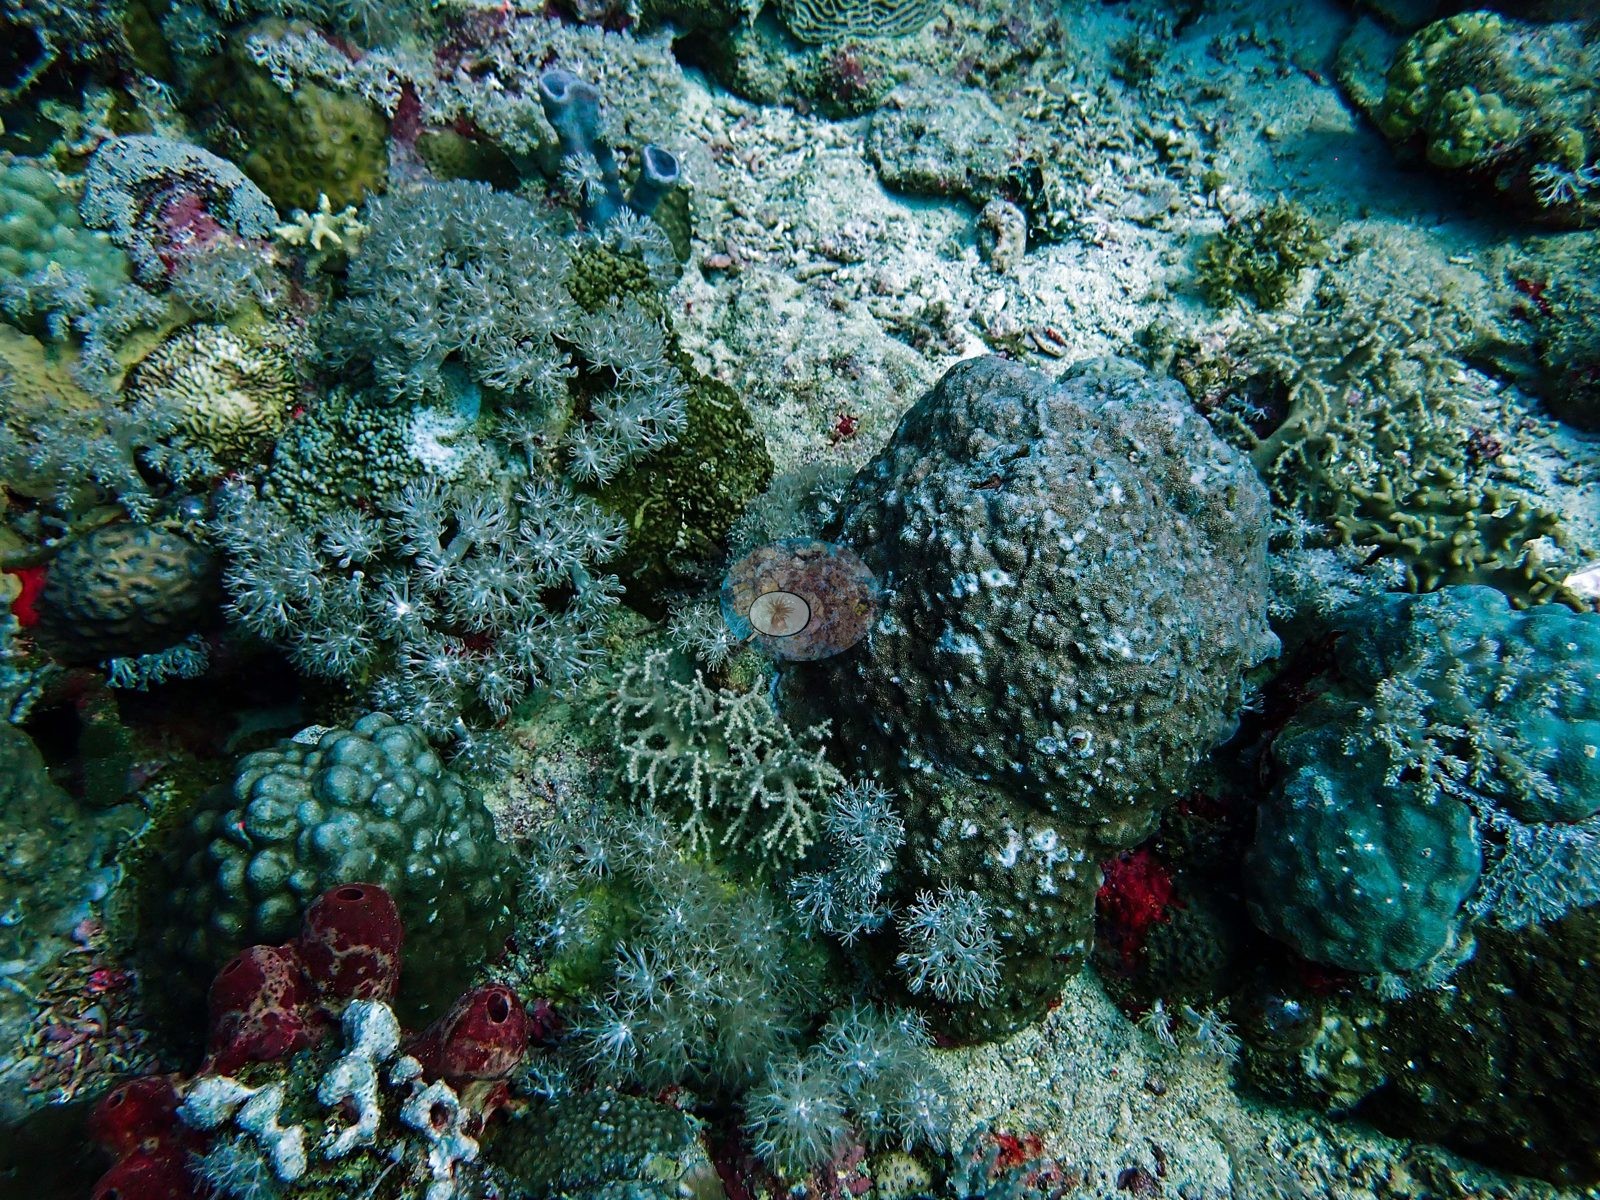
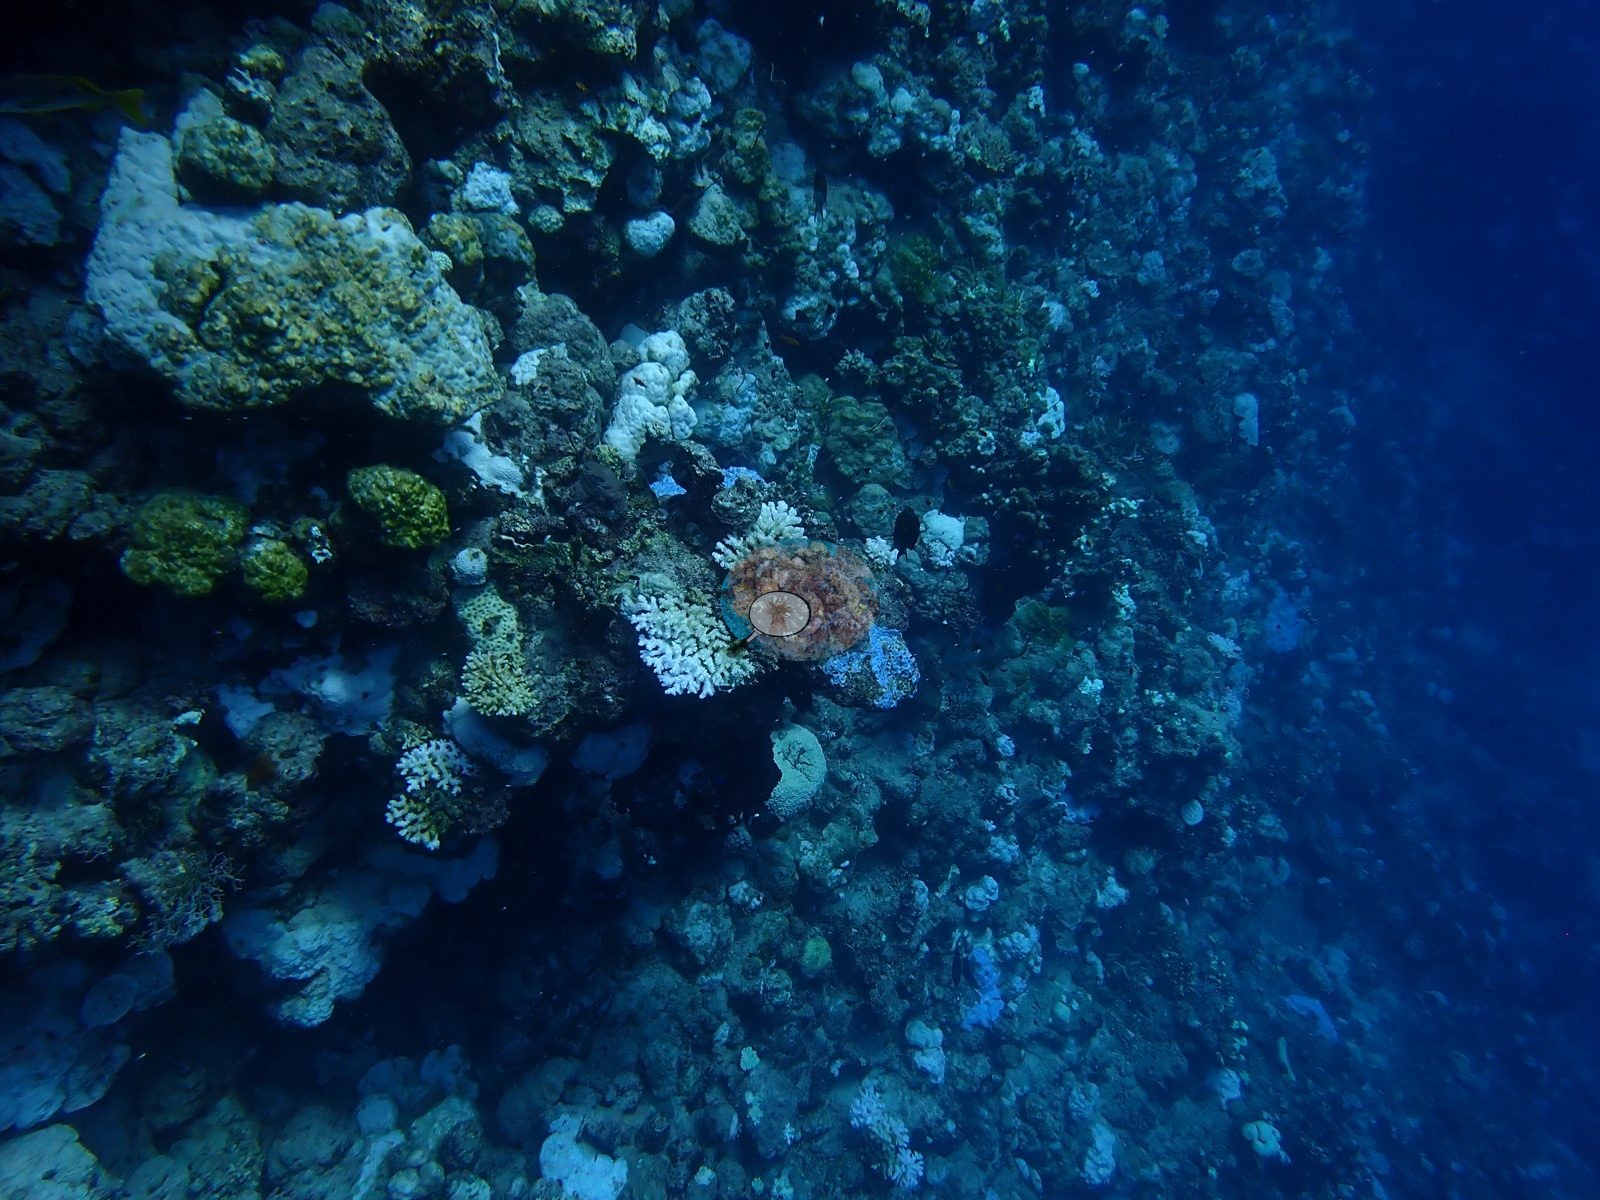
The shallows are a different reef — a wave-washed flat with tabulate and corymbose Acropora right under the surface, and it is there, in the November 2023 frames, that the bleaching in the published record is unmistakable in the photographs.
Coral cover
Coral cover is 14.5% ± 14.4, quoted verbatim from Mayfield, A.B. (2025) Environments 12:248 — Red Sea 2023-24 bleaching; CoralNet point annotation, Appendix A: a manual, diver-annotated CoralNet point count from Anderson's own published work, not a computer vision output and not recomputed here.
Fish and other fauna
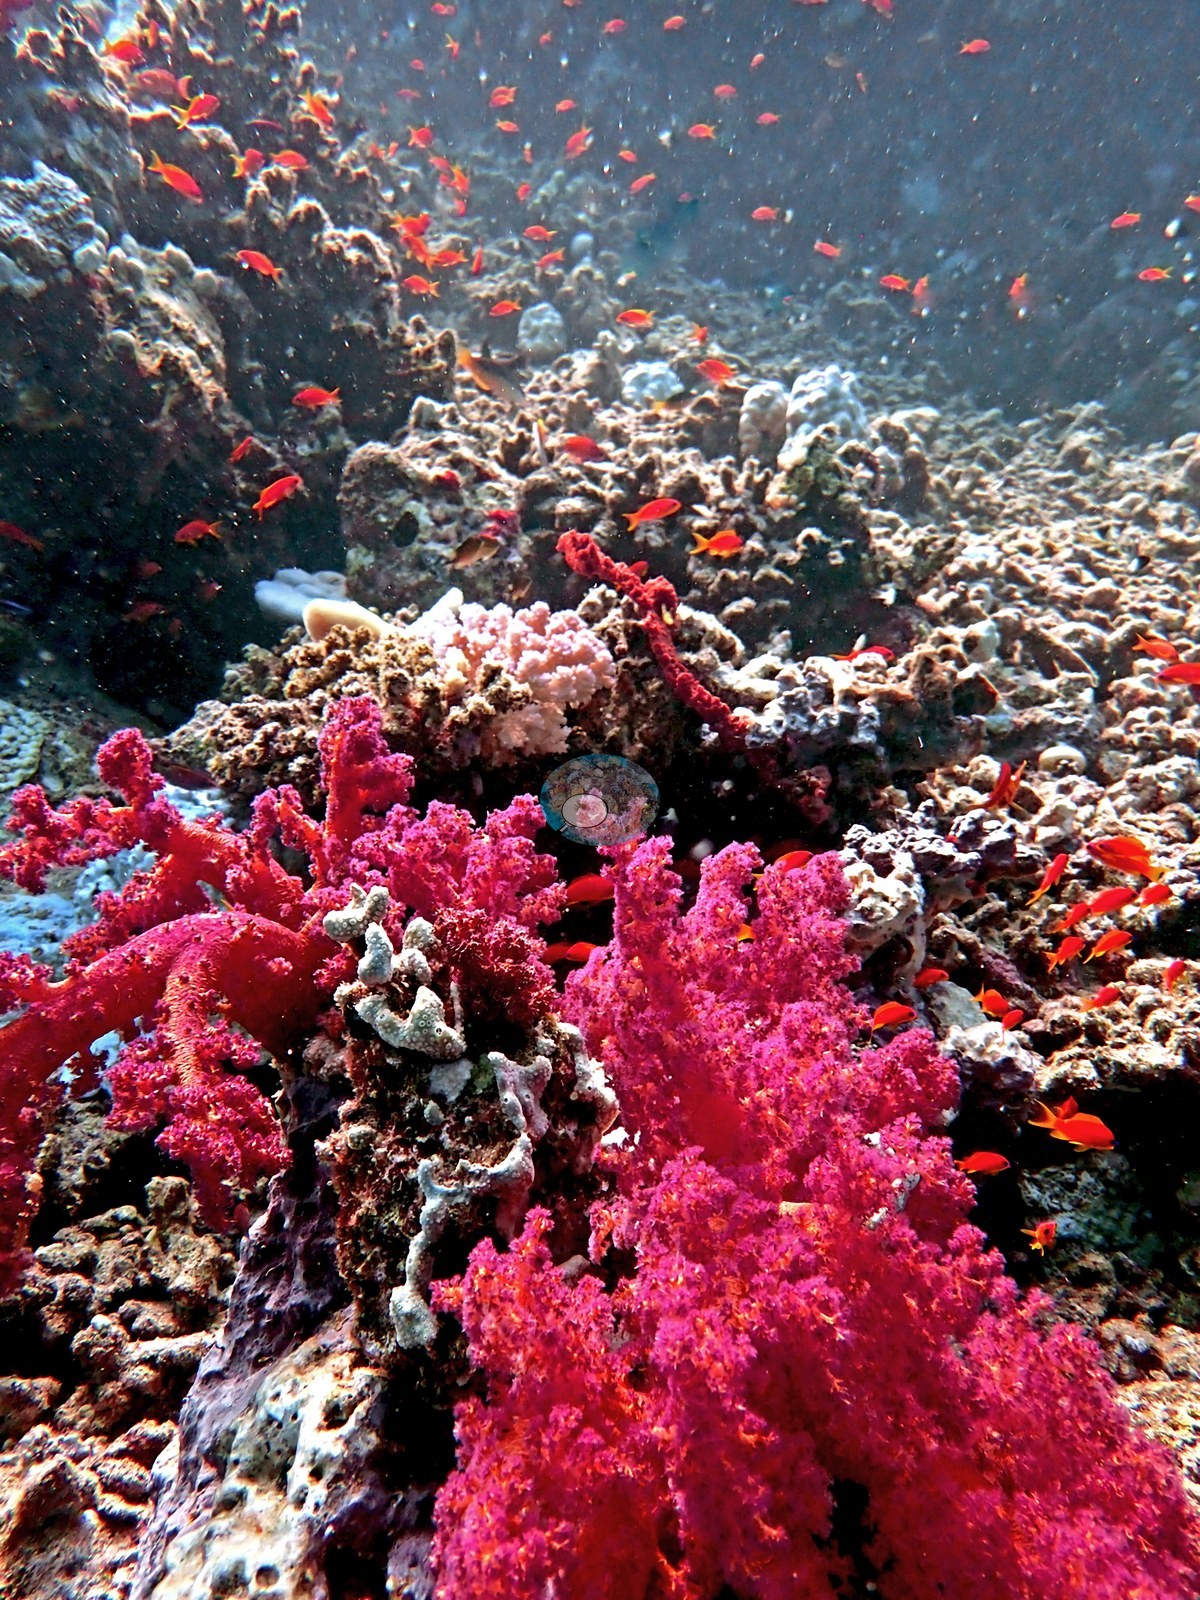
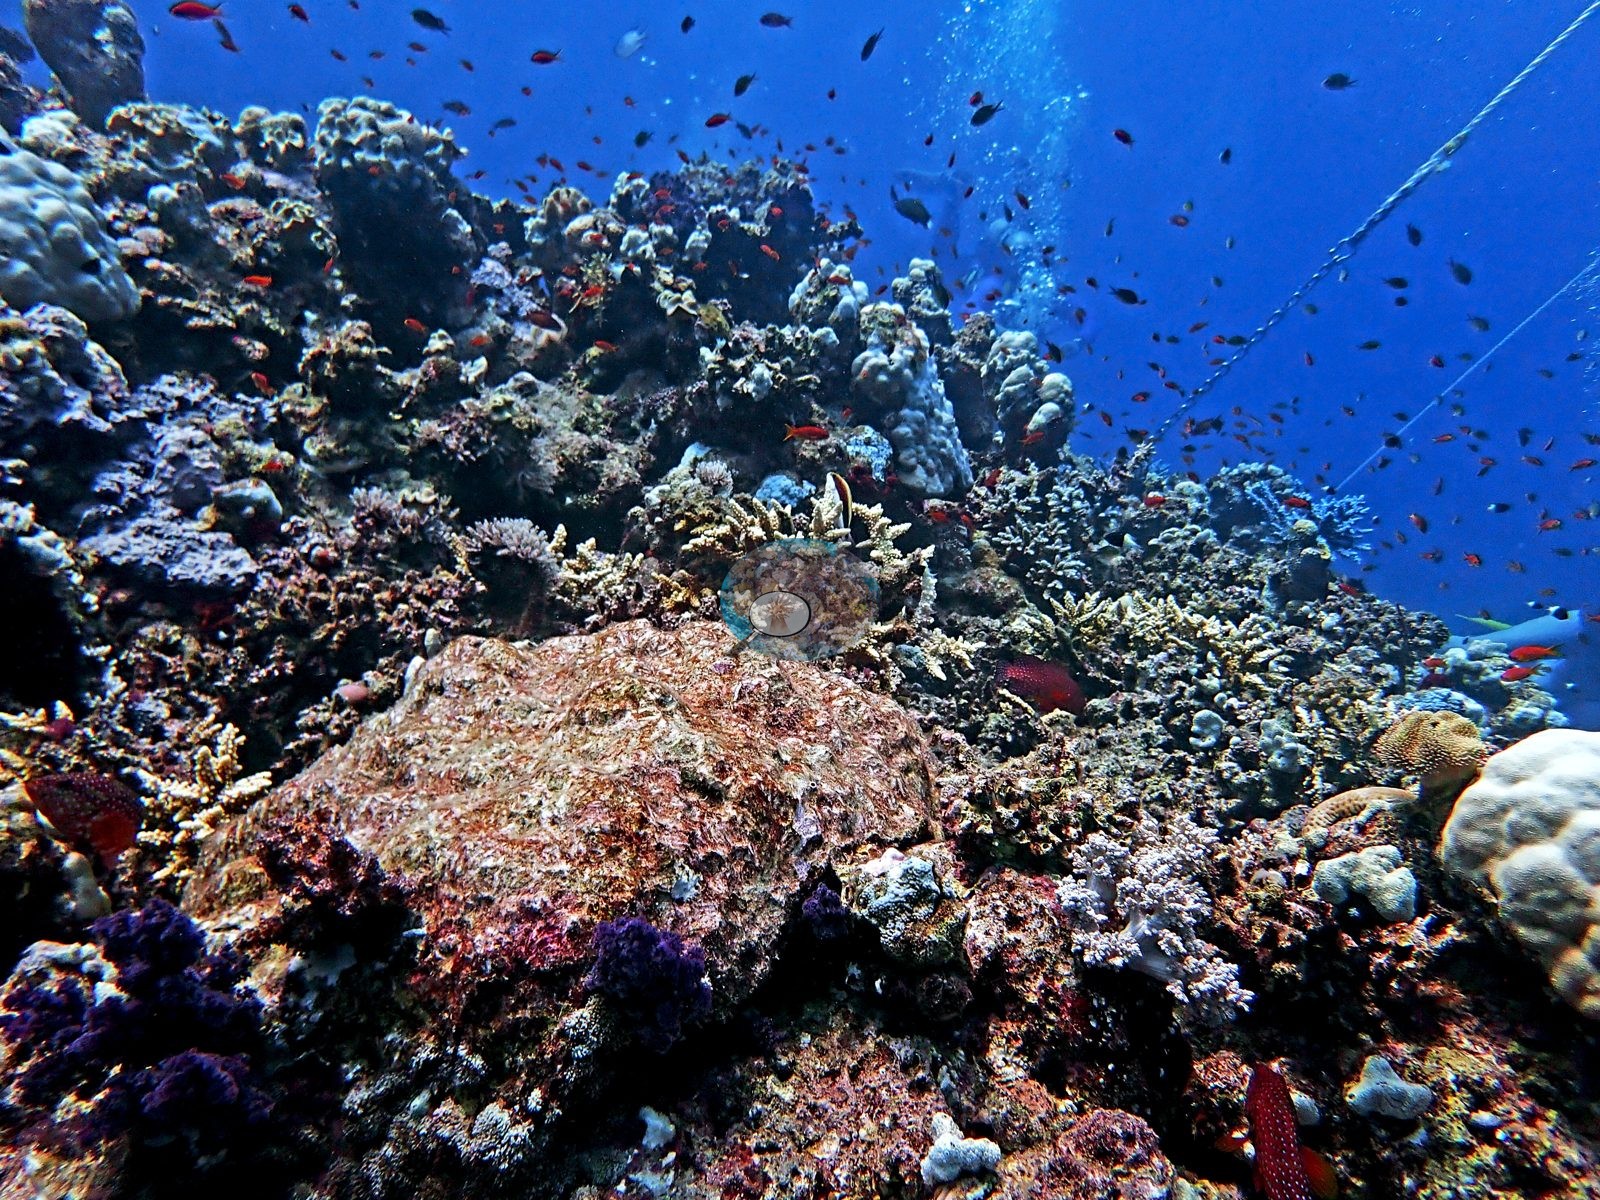
Anthias hang in red clouds against it, and dense chromis and fusilier schools work the blue (e.g., Image 3, Image 6).
Comparisons with other data
No independent survey was made at this exact site; the nearest ones are listed in the table below.
Dive record
The most heavily worked of the Thuwal sites — six visits between September 2023 and October 2024 with Coastline (KAUST), and 720 annotated photographs, more than any other site in this Red Sea set.
Other notes
See flags.
Survey summary
Rose Reef: surveyed 6 times, Sep 2023–Oct 2024; bleaching ranged from 24.3% to 61.8% of coral tissue across visits (CoralNet point counts; Mayfield 2025, Environments 12:248). Surveyed in partnership with Coastline (KAUST).
CV model comparison
More info
The reference row is this dive site's own published value (Mayfield 2025, Appendix A, 720 photos); the other rows are AREA-level (Thuwal) comparisons, not run on this site's frames. ⚠ The comparison rows are REGIONS, not dive sites: the paper's main tables report cover by region, and this site's own value comes from its Appendix A. ⚠ The manual column and the CV columns are on DIFFERENT FRAME SETS. The published cover spans the region's full photo set (173–2,567 frames, most of them CoralNet robot-labeled); the CV arms ran only on the hand-scored reference subset, which is 6 frames at Thuwal, 274 at Jeddah and 173 at Rabigh. Read Thuwal's model columns as indicative only. CoralNet is n/a by design: the reference set IS the hand-scored set, so those frames carry no independent robot label to compare against. DINOv3 is restricted to frames it never saw, and reads roughly double the published cover at every Red Sea region. ⚠ 'unassigned region' is not a place: 135 frames carry no region label in the CoralNet metadata and map to no published row. It has no manual value and is excluded from the pooled reference. CoralNet automated point classifier: n/a — the reference set IS the hand-scored set; these frames carry no independent CoralNet robot label to compare against CoralSCOP (SAM-based mask-sum), unedited photos: pending — CoralSCOP run: 370/747 images scored at build time CoralSCOP (SAM-based mask-sum), edited photos: pending — CoralSCOP run: 370/747 images scored at build time| Method | Hard-coral cover (%) |
|---|---|
| Manual (published) | 14.5 |
| In-house DINOv3 | 47.5 |
| Claude | 23.9 |
Dive history
| Date | Time in | Max depth (m) | Bottom time (min) |
|---|---|---|---|
| 2023-09-08 | 12:45 | 15.0 | 50 |
| 2023-11-11 | 10:45 | 36.0 | 50 |
| 2023-11-11 | 12:40 | 35.0 | 50 |
| 2023-11-17 | 10:30 | 36.0 | 55 |
| 2024-02-09 | 10:39 | 32.4 | 41 |
Independent surveys nearby
| Agency / program | Year(s) | Stations / distance | Link |
|---|---|---|---|
| Aeby et al. (2021) | 2015 | 1 station, 4.99 km | Records ↓ |
| Monroe et al. (2018) | 2015 | 1 station, 4.99 km | Records ↓ |
 Coral Reef Diagnostics survey
Within 5 km, 2 independent survey stations recorded hard coral cover in 2015. The most recent nearby survey is from 2015, so these values predate recent heat stress. This site's own pooled estimate (15%) sits 13.3 points below the range of these surveys (28–39%); the methods differ, so the comparison is context, not a like-for-like test.
Collected by other programs using different methods, so these are context for the figures above, not a like-for-like comparison. Where a station was surveyed more than once the range is shown. Station names are not dive-site names.
| Agency | Site / location | Date | Hard coral cover (%) | Distance | Link |
|---|---|---|---|---|---|
| Monroe et al. (2018) | Offshore reef 1 | 2015 | 28% | 4.99 km | HeatCRD database |
| Aeby et al. (2021) | Shi'b Nazar | 2015 | 39% | 4.99 km | HeatCRD database |
Data & links
- CoralNet image repository for this region ↗
- HeatCRD database ↗
- (reference) ↗
- Photo portfolio ↗
- Photo portfolio ↗
- Photo portfolio ↗
- Coral Reef Diagnostics country page ↗
All images from Coral Reef Diagnostics. Data are from Coral Reef Diagnostics and the organizations named in the data-sources table above.
© Coral Reef Diagnostics.
References
- Monroe AA, Ziegler M, Roik A, Röthig T, Hardenstine RS, Emms MA, et al. (2018). In situ observations of coral bleaching in the central Saudi Arabian Red Sea during the 2015/2016 global coral bleaching event. PLOS ONE 13:e0195814. PDF
- Aeby GS, Shore A, Jensen T, Ziegler M, Work T, Voolstra CR (2021). A comparative baseline of coral disease in three regions along the Saudi Arabian coast of the central Red Sea. PLOS ONE 16:e0246854. PDF
- Mayfield AB (2025). Using Tourist Diver Photos to Assess the Effects of Marine Heatwaves on Central Red Sea Coral Reefs. Environments 12:248. PDF