
Regional summary of 7 dive sites. Figures are averages across the sites that report them (n = sites with a value); each site's own page has its individual values. Part of the Saudi Arabia overview.
⬇ Download this region as a report card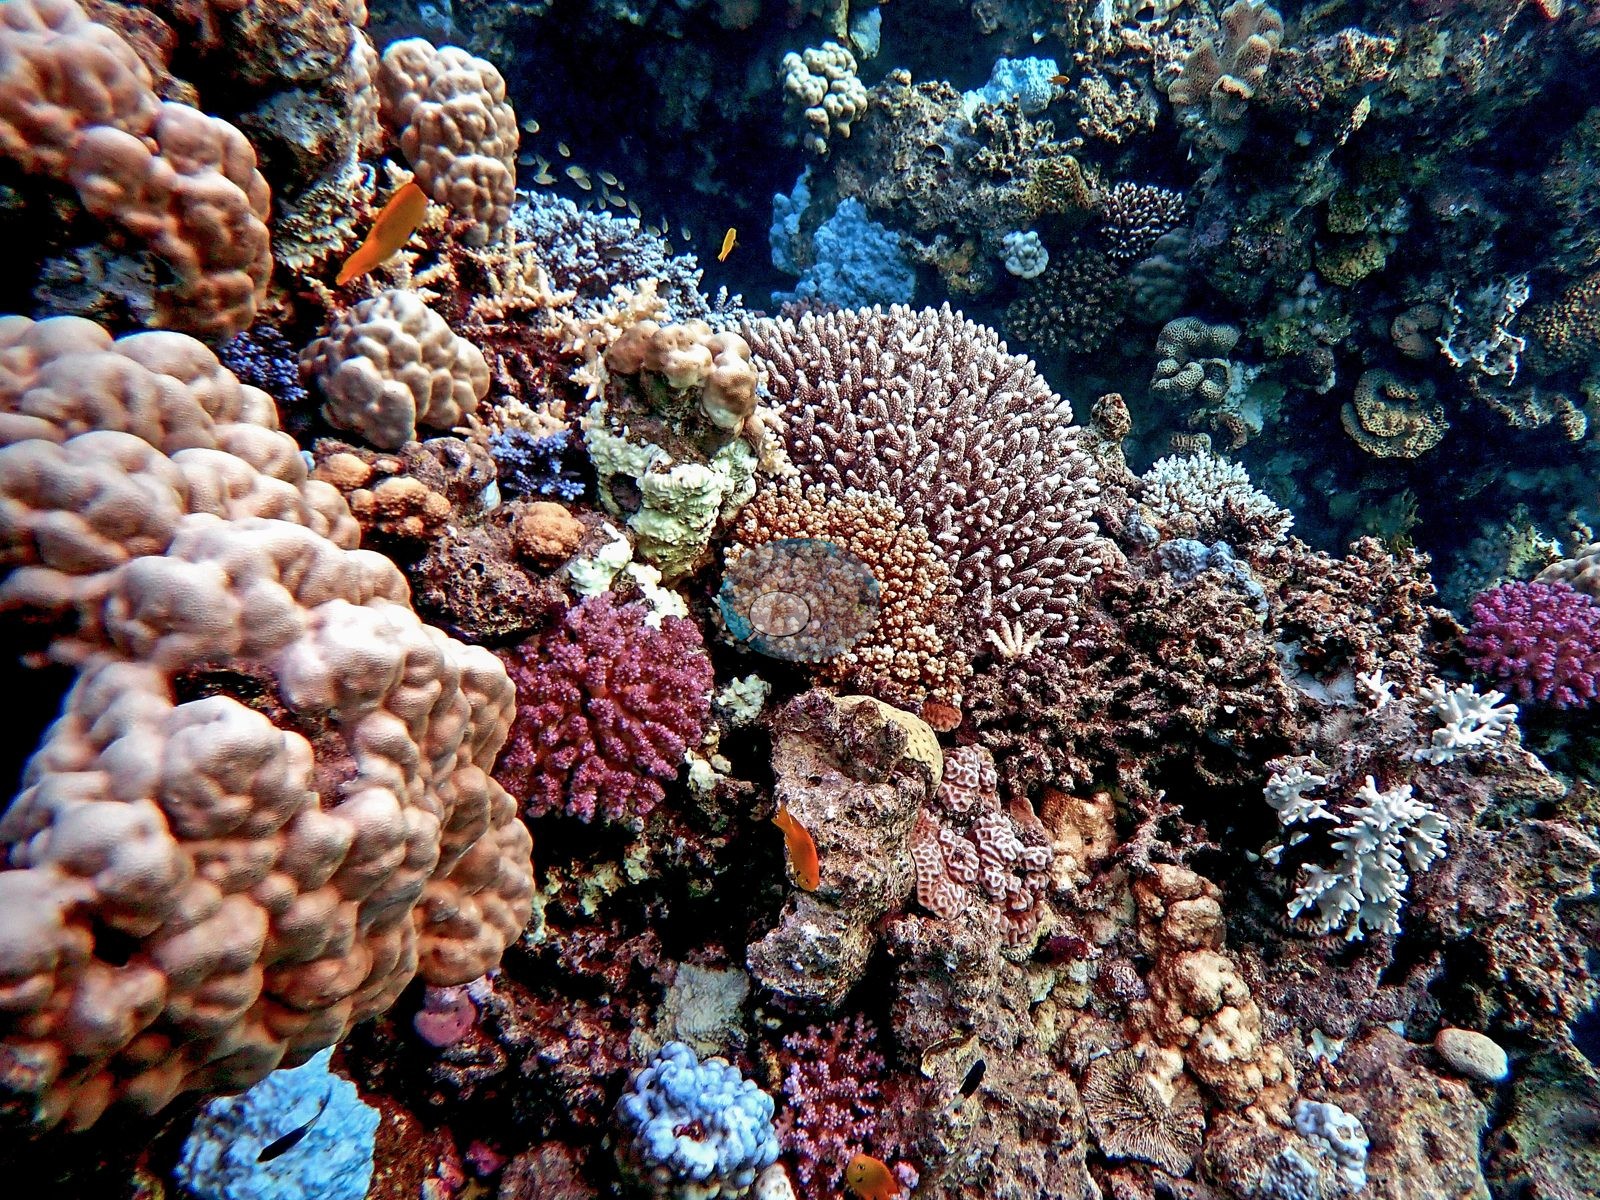

Offshore Red Sea reefs near Yanbu and Umluj, from a shallow reef flat to deep walls, were dived through the 2023-24 marine heatwaves. Porites, Acropora, and colorful pocilloporids dominate, and at Thetis cover more than halved between October 2023 and August 2024.
Heat stress
Long-term record: 10 years since 1985 reached 8 or more °C-weeks at NOAA’s Makkah-Madine Saudi Arabia station. Download the annual DHW data (CSV).
7 sites in this region — click a marker to open that site.
Regional setting
Saudi Arabia has more coral reef than any other country in the seas around Arabia, and its Red Sea coast runs from the Gulf of Aqaba to the Yemen border (Spalding et al. 2001). In the north the continental shelf is narrow or absent, reef flats are slim, and reef profiles are often steep to sheer; the shelf broadens southward. Fringing reefs form an almost continuous band along much of the northern coast. Farther south, the Al Wadj Bank holds a complex of fringing, patch, and barrier reefs with small islands, and from Al Wadj to Jeddah runs a broken barrier-type structure that has been called the Little Barrier Reef. The coast carries the full range of Red Sea species, including northern endemics, and surveys between 1997 and 1999 recorded about 260 hard coral species. In August and September 1998, reefs at some sites between Yanbu and Rabigh bleached heavily during a spell of high sea temperatures, and Souter et al. (2021) note that the 1998 impacts were most severe in the central-northern Saudi Red Sea. Spalding et al. (2001) estimate about 6,660 km² of coral reef for Saudi Arabia, a national figure that includes its Arabian Gulf coast; Souter et al. (2021) give 7,800 km² for the northern and central Red Sea subregion as a whole.
As of 2001, Spalding et al. described much of the Saudi Red Sea coast as undeveloped away from Jeddah and Yanbu, but listed sewage and land reclamation as concerns around the larger towns, including Yanbu, where the port, and refinery also posed a risk of oil pollution. About 18 desalination plants along the coast returned warm, salty water carrying chlorine and anti-scaling chemicals. Wilkinson (2006) reported large plans to reclaim reef areas along the Saudi Red Sea coast, and Souter et al. (2021) note that the kingdom's Vision 2030 plan singles out coastal tourism as a leading route to economic diversification. They name runoff, eutrophication, and overfishing as the main local drivers of reef decline in the central Red Sea, although most reefs bleached in 1998 recovered, and cover in the northern and central Red Sea reached 39.1% by 2019.
Overview
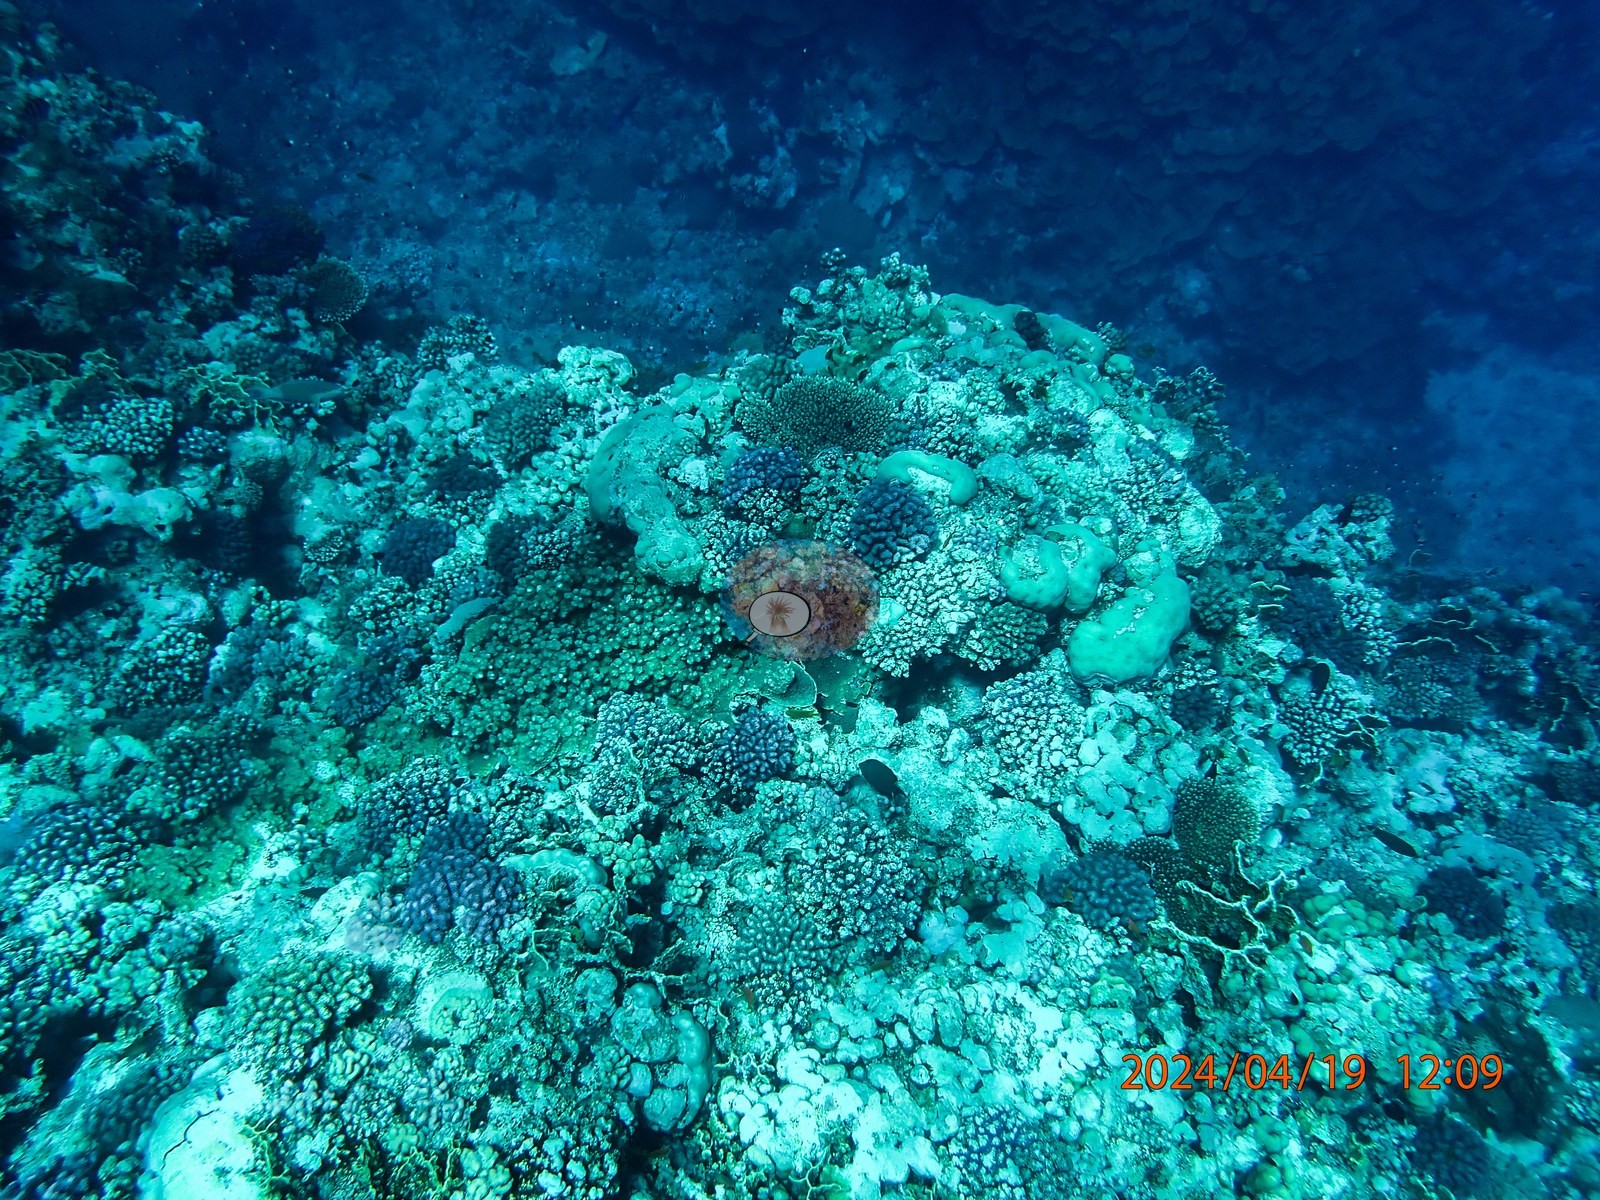
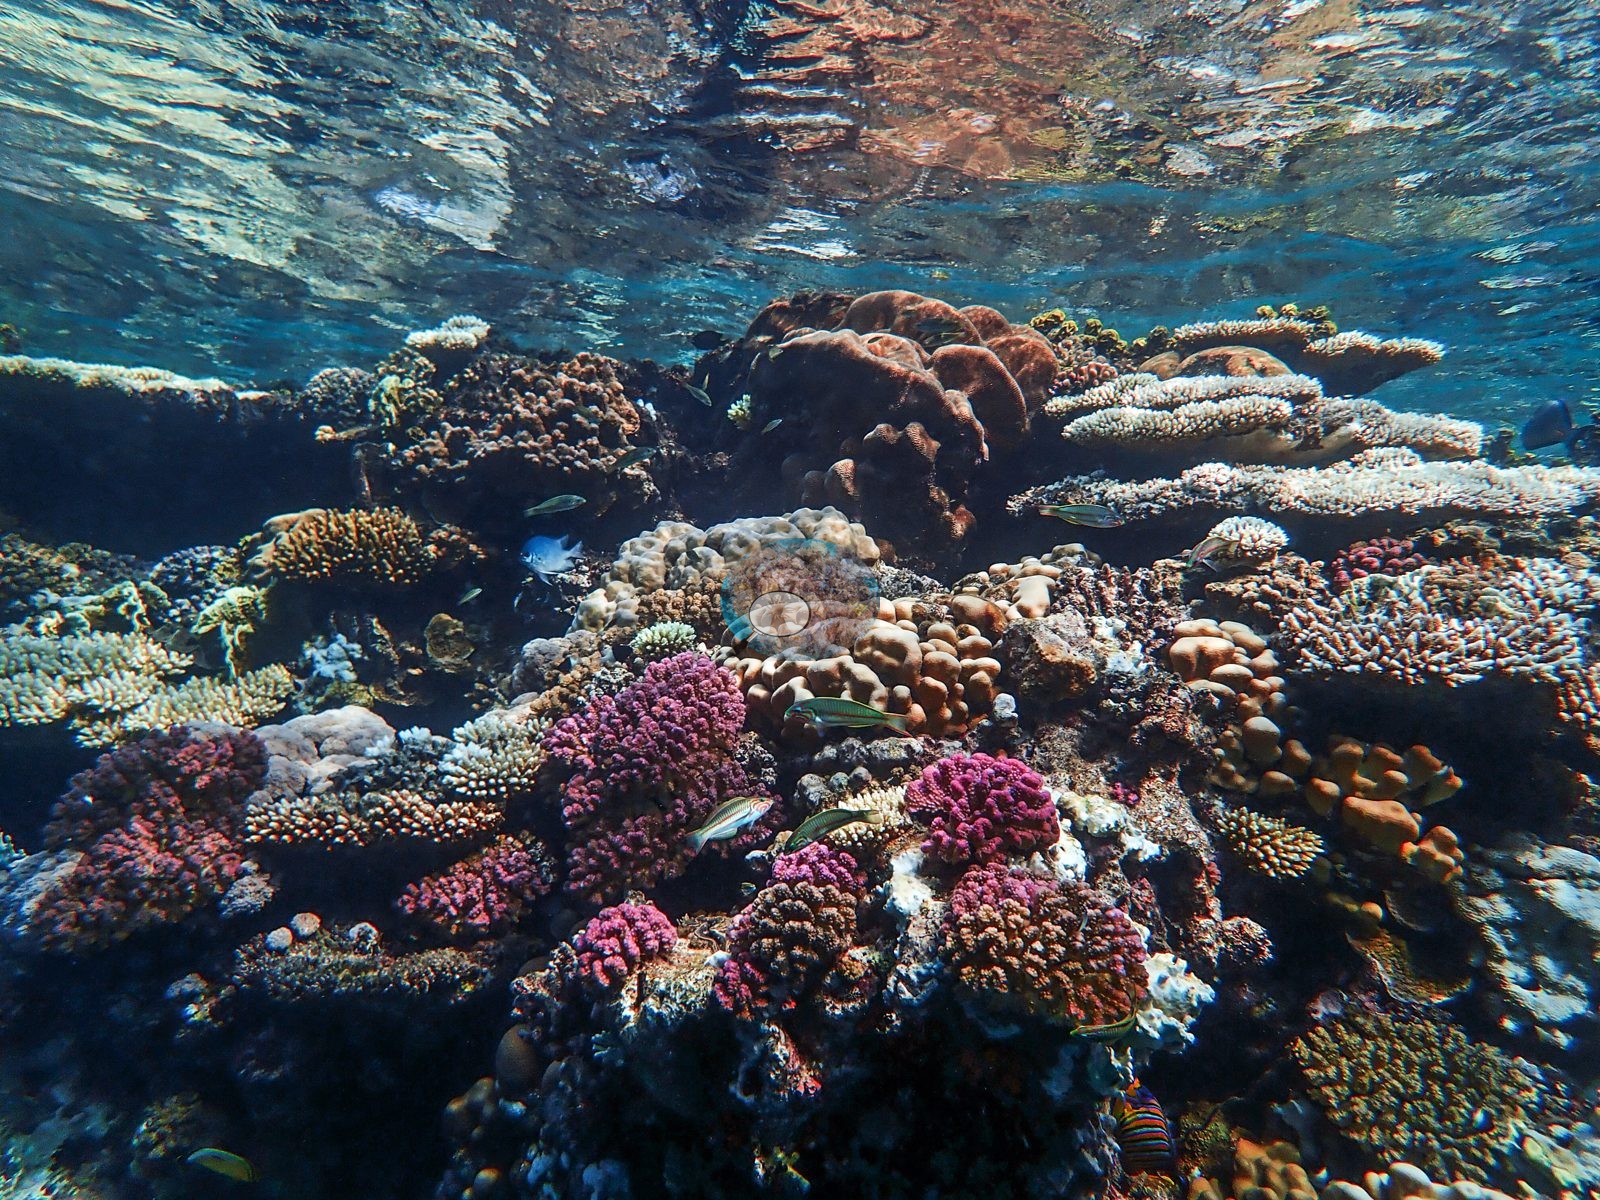
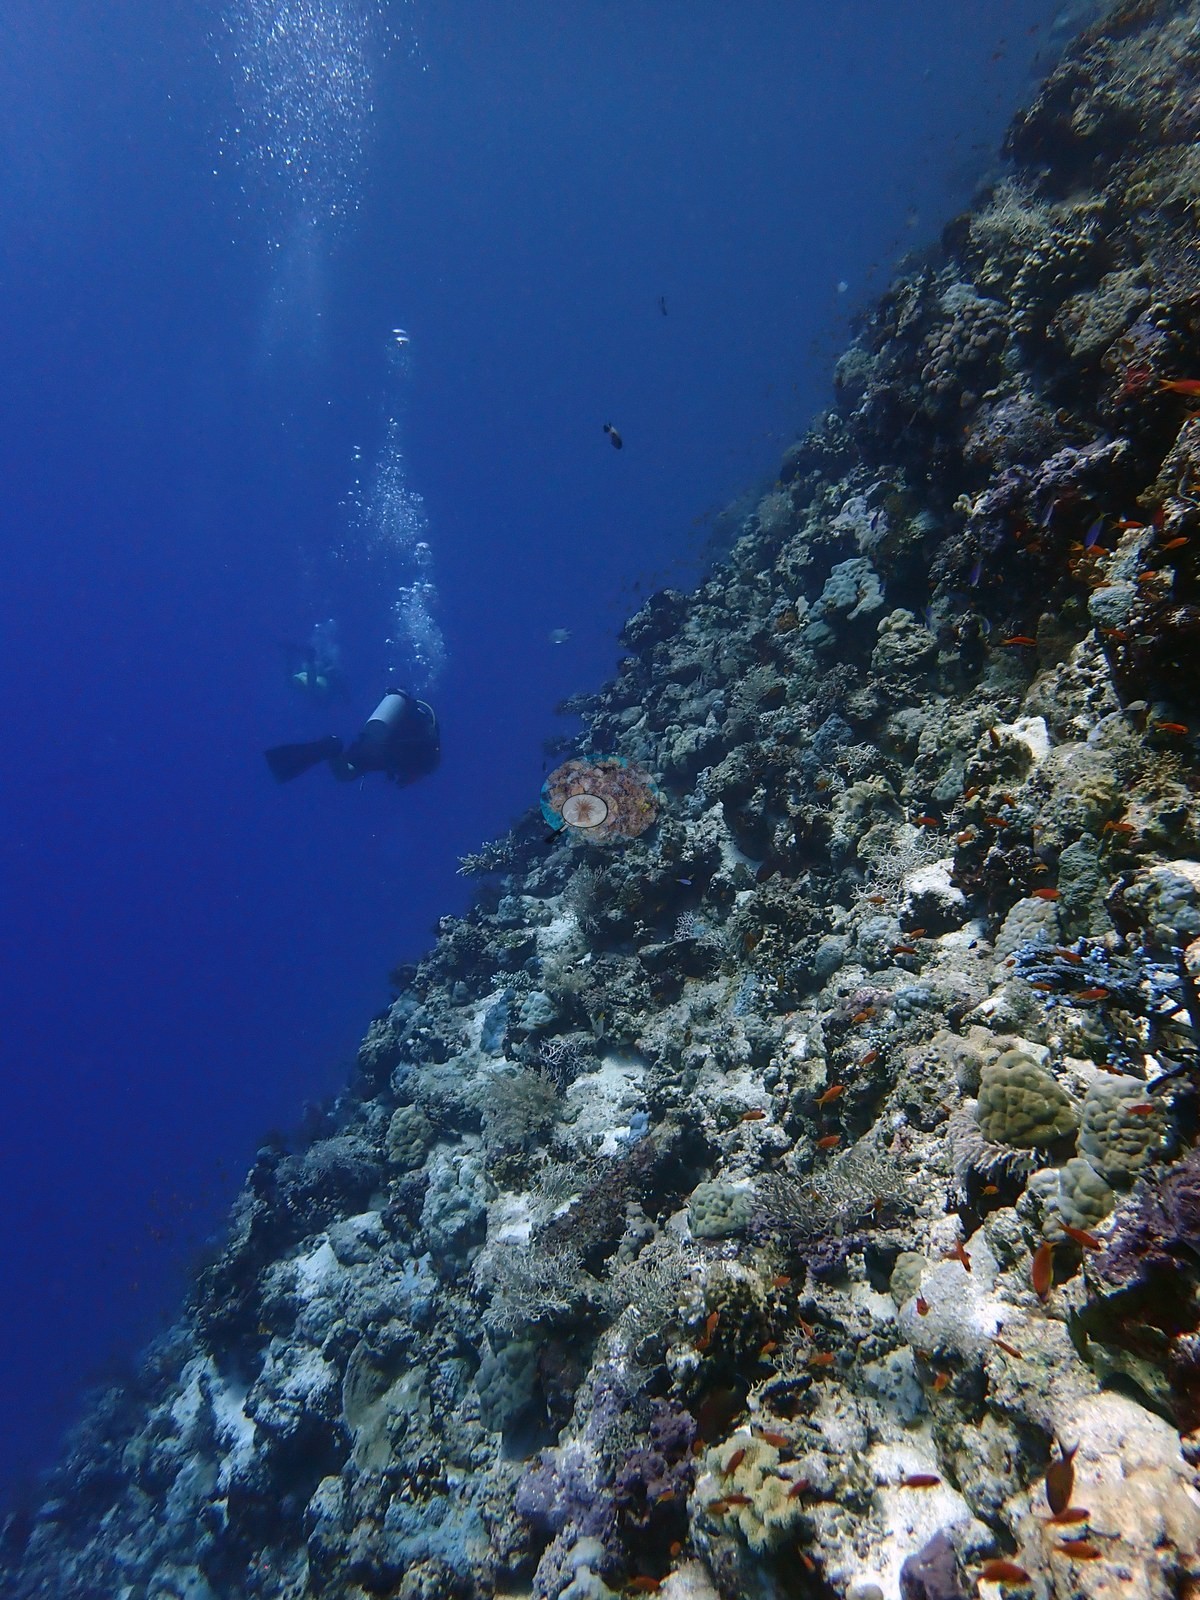
The Yanbu unit covers seven offshore Red Sea reefs in the Yanbu and Umluj area, dived with Umluj Dive Center between September 2023 and August 2024. The settings range from a wave-lit reef flat a meter or two under the surface at Alrass Alakhdar and a shallow gully-and-canyon complex at Al Fasmah (15 m), to a Porites-carpeted slope at Um Mankout (27 m) and deep walls and slopes at Mr. Umluj (33.7 m) and Thetis (34 m), a sheer face with overhangs and buttresses. Abu Galawa is a long fringing reef where a bare rubble-and-pavement shoulder gives way to a coral-covered ridge. The seventh pin, Al Shbareer reef, was dived once on 6 October 2023, but no photographs survive from that dive and it has no cover value.
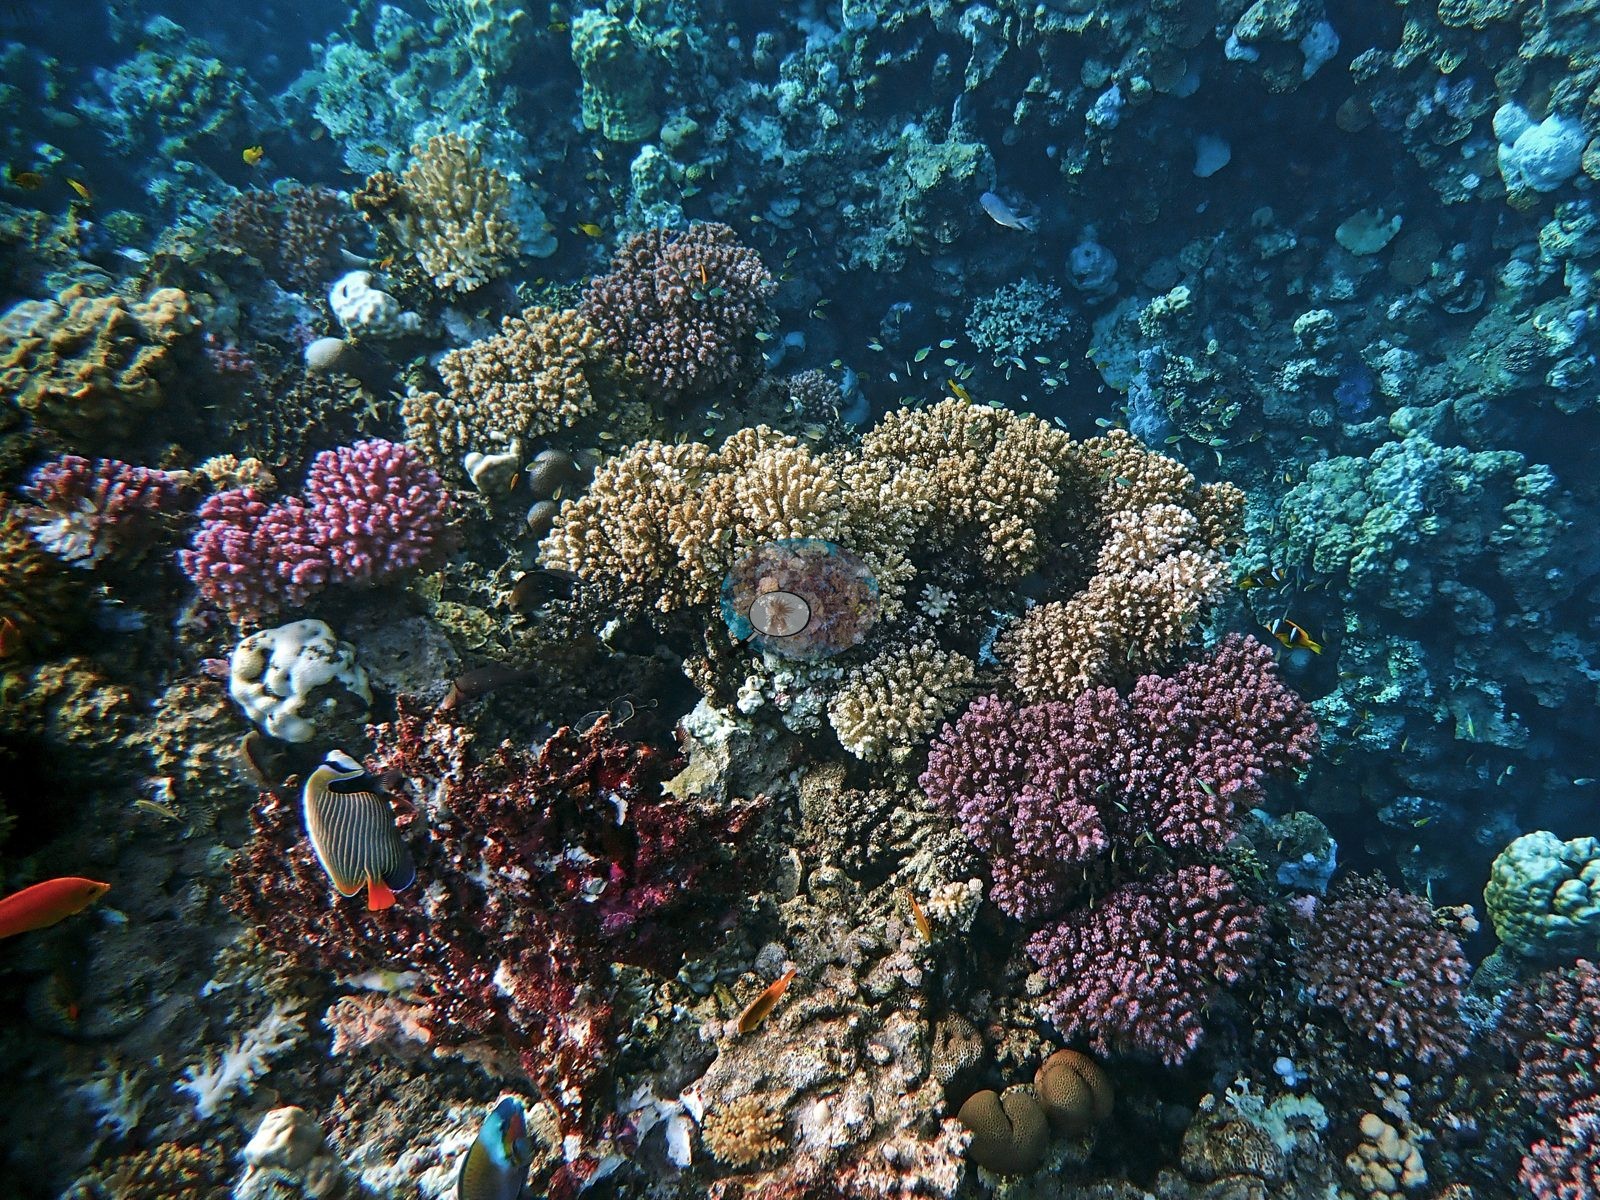
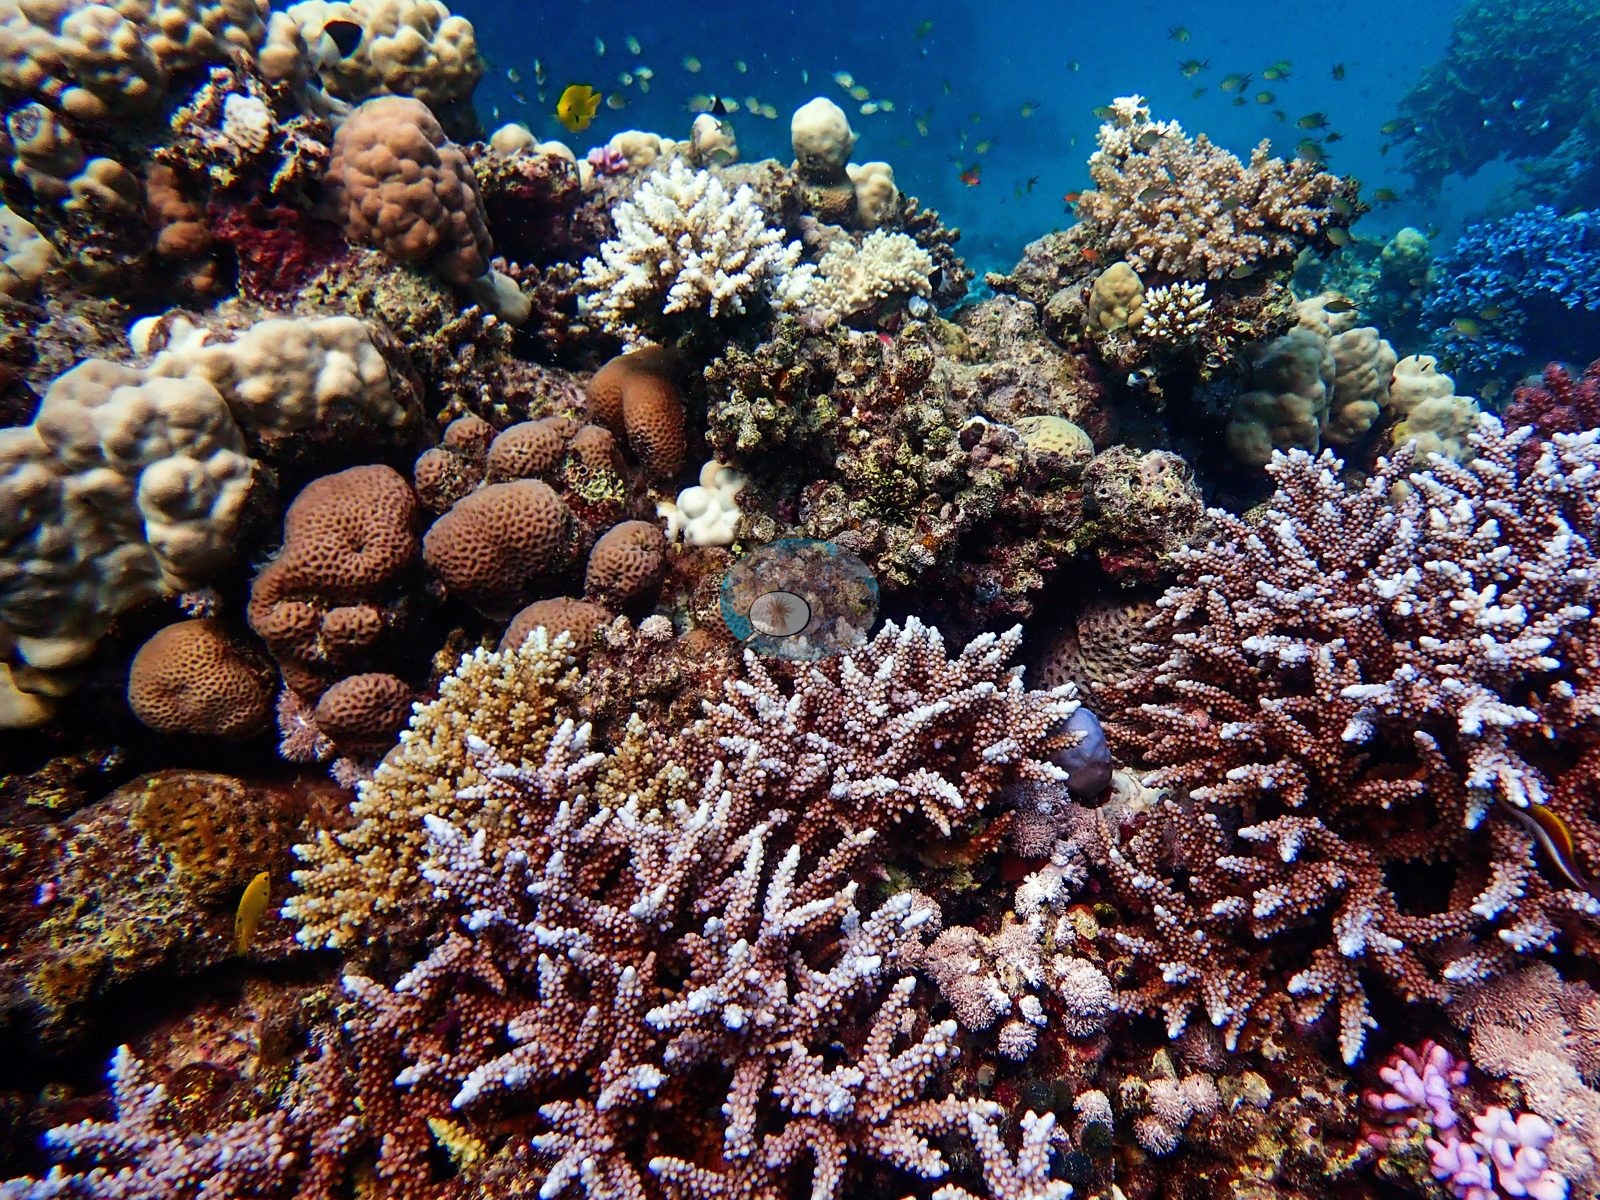
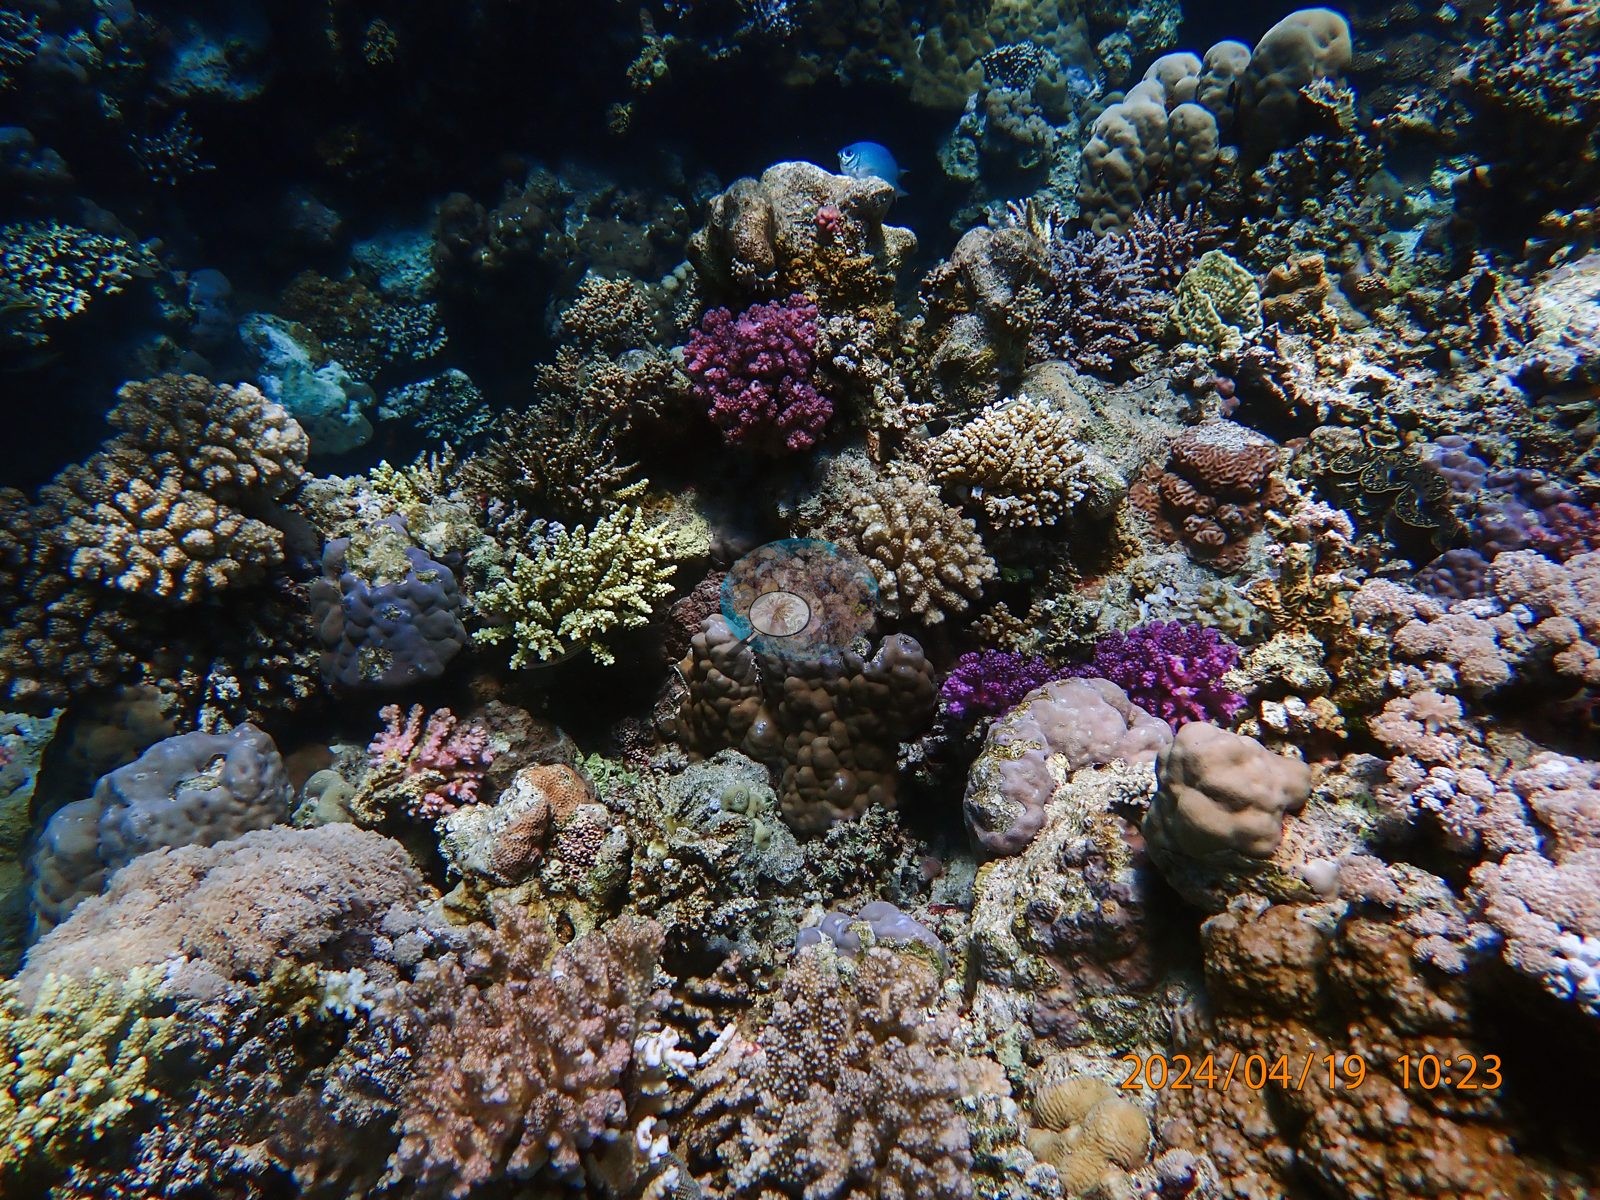
Published point-count cover ranged from 16.1% at Thetis to 29.6% at Alrass Alakhdar across the six sites with published cover, with algal cover low (6.0% to 11.1%). Knobby and columnar Porites, corymbose, digitate, and table Acropora, pocilloporids in magenta, lavender, and hot-pink color forms, faviids, and Millepora-type fire coral make up most of the community. Um Mankout carries a near-continuous Porites framework with almost no bare pavement, and Al Fasmah had the most uniform cover frame to frame. Mr. Umluj pairs a steep, densely built slope with a flat, algal-turfed pavement top, and at Abu Galawa, arborescent soft corals line the ridge crest.
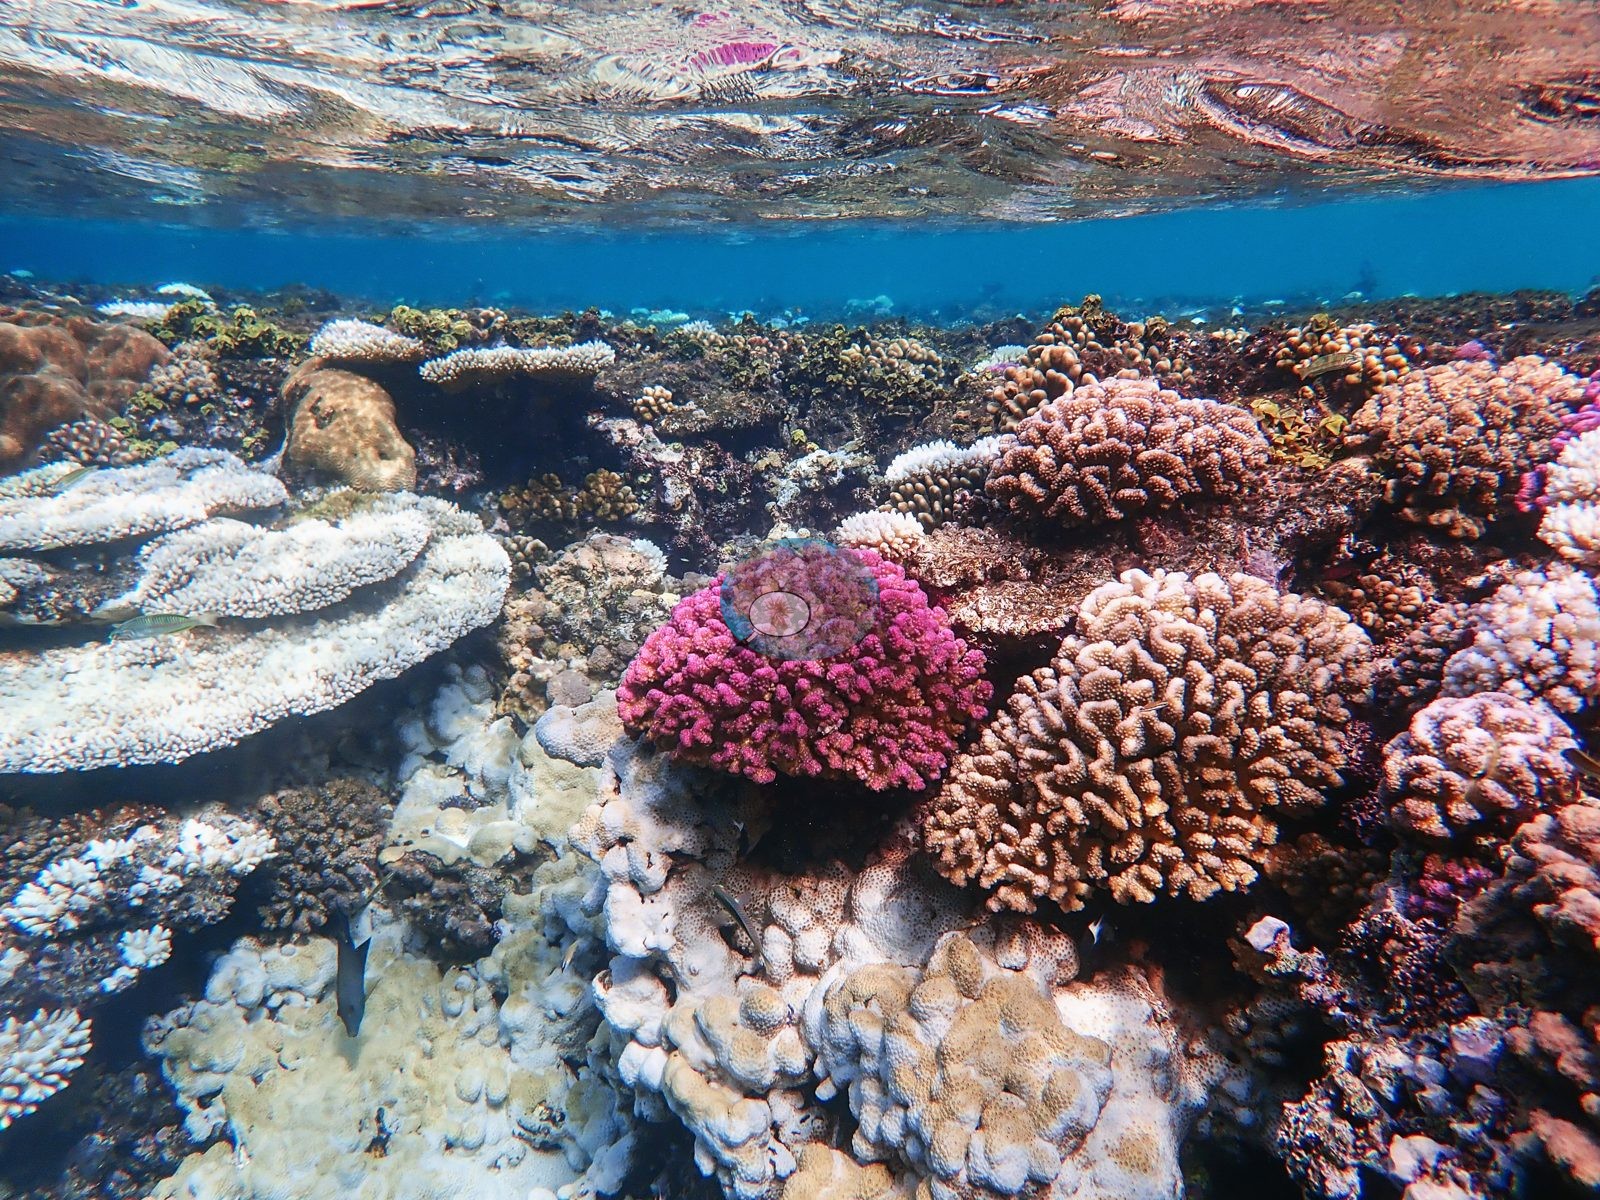
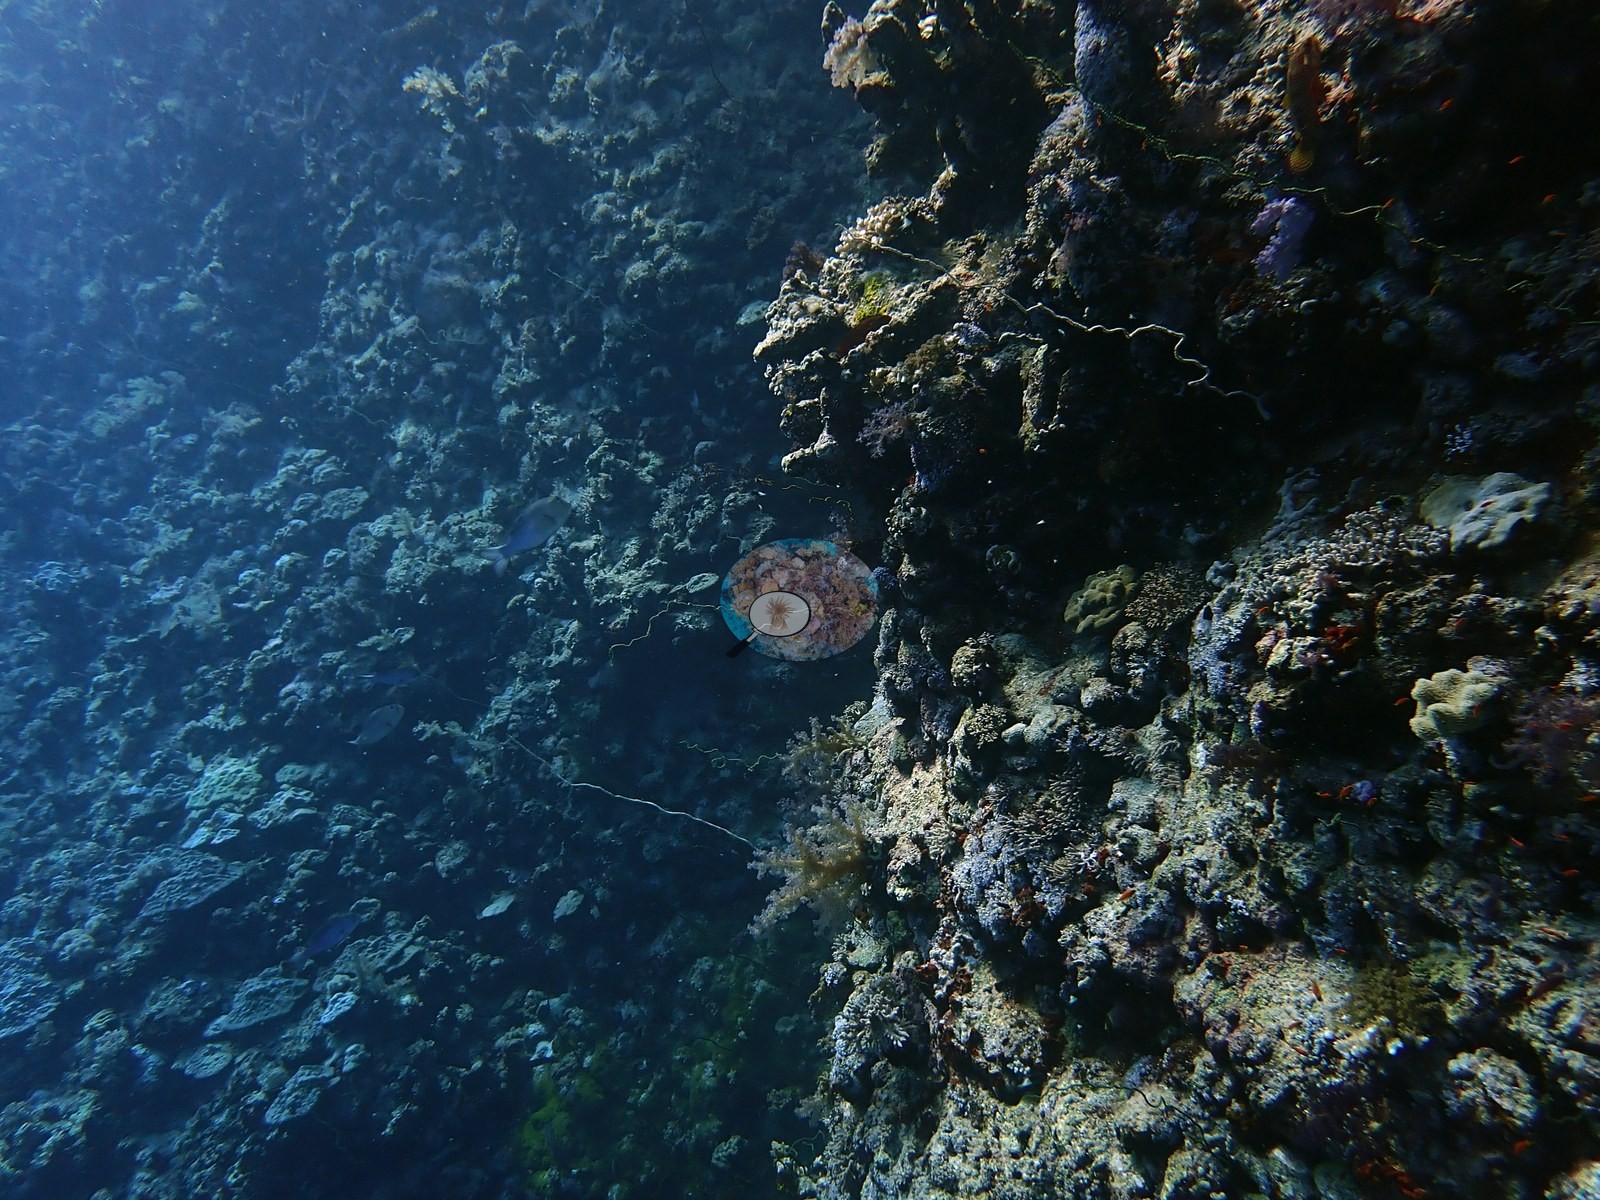
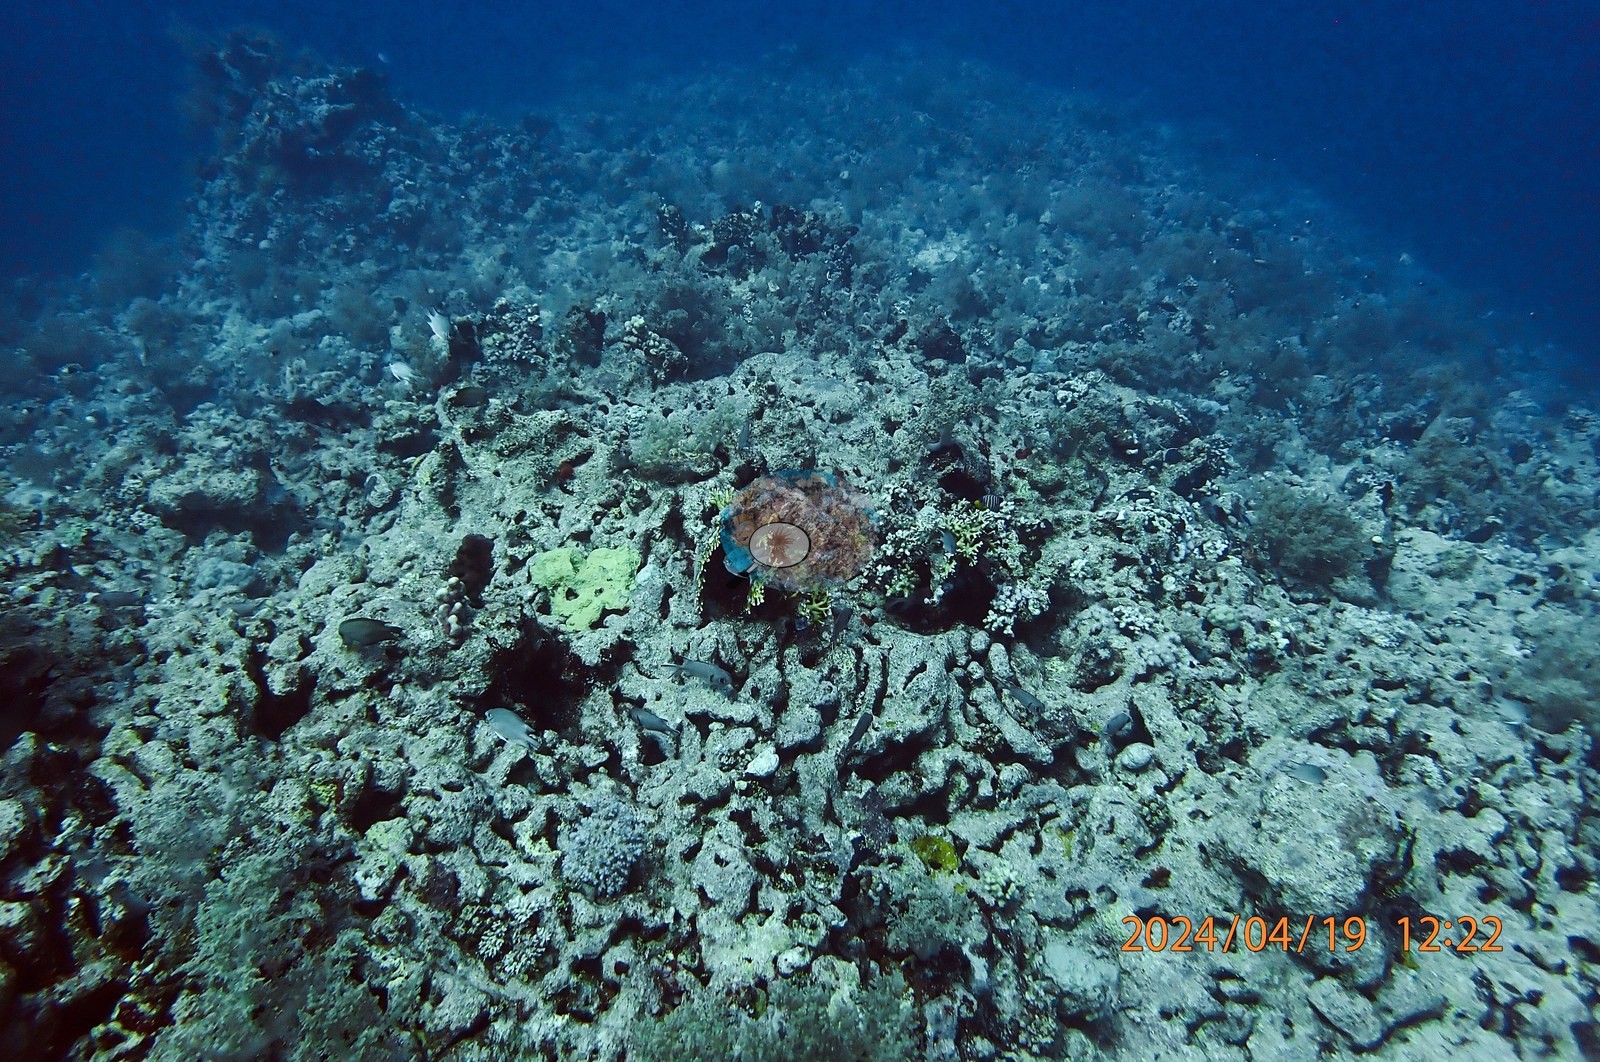
All of these reefs were recorded during the 2023-24 Red Sea marine heatwaves. Alrass Alakhdar had both the highest cover and the highest bleaching of the September 2023 visits (58.5% of coral tissue), with multi-meter stands of Porites bone-white beside fully pigmented pocilloporids. Al Fasmah, dived the same morning, was at 27.8%. At Thetis, cover fell from 32.5% in October 2023 (62.1% bleached) to 13.4% in August 2024, when the wall was darker and dominated by soft corals and sponges. Bleaching at Mr. Umluj barely changed between a cool April 2024 visit (27.7%) and August 2024 (26.6%), and Abu Galawa showed 25.3% bleaching in April 2024 with no accumulated heat stress.
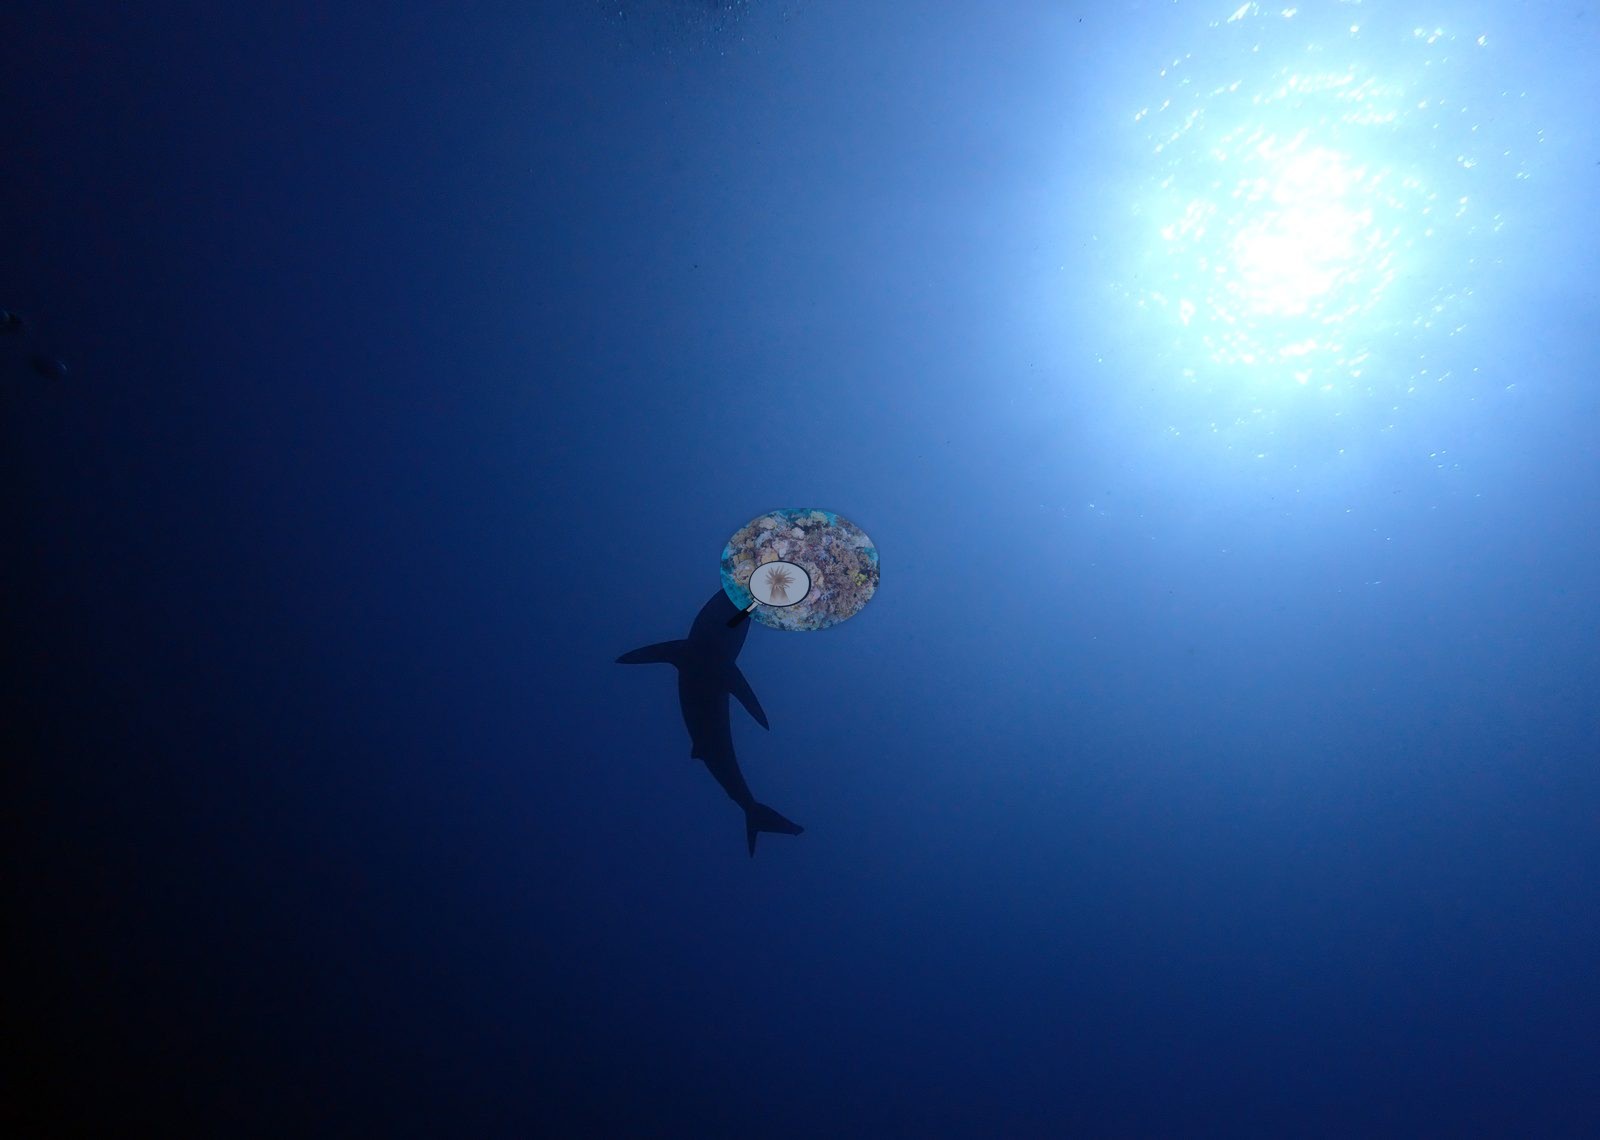
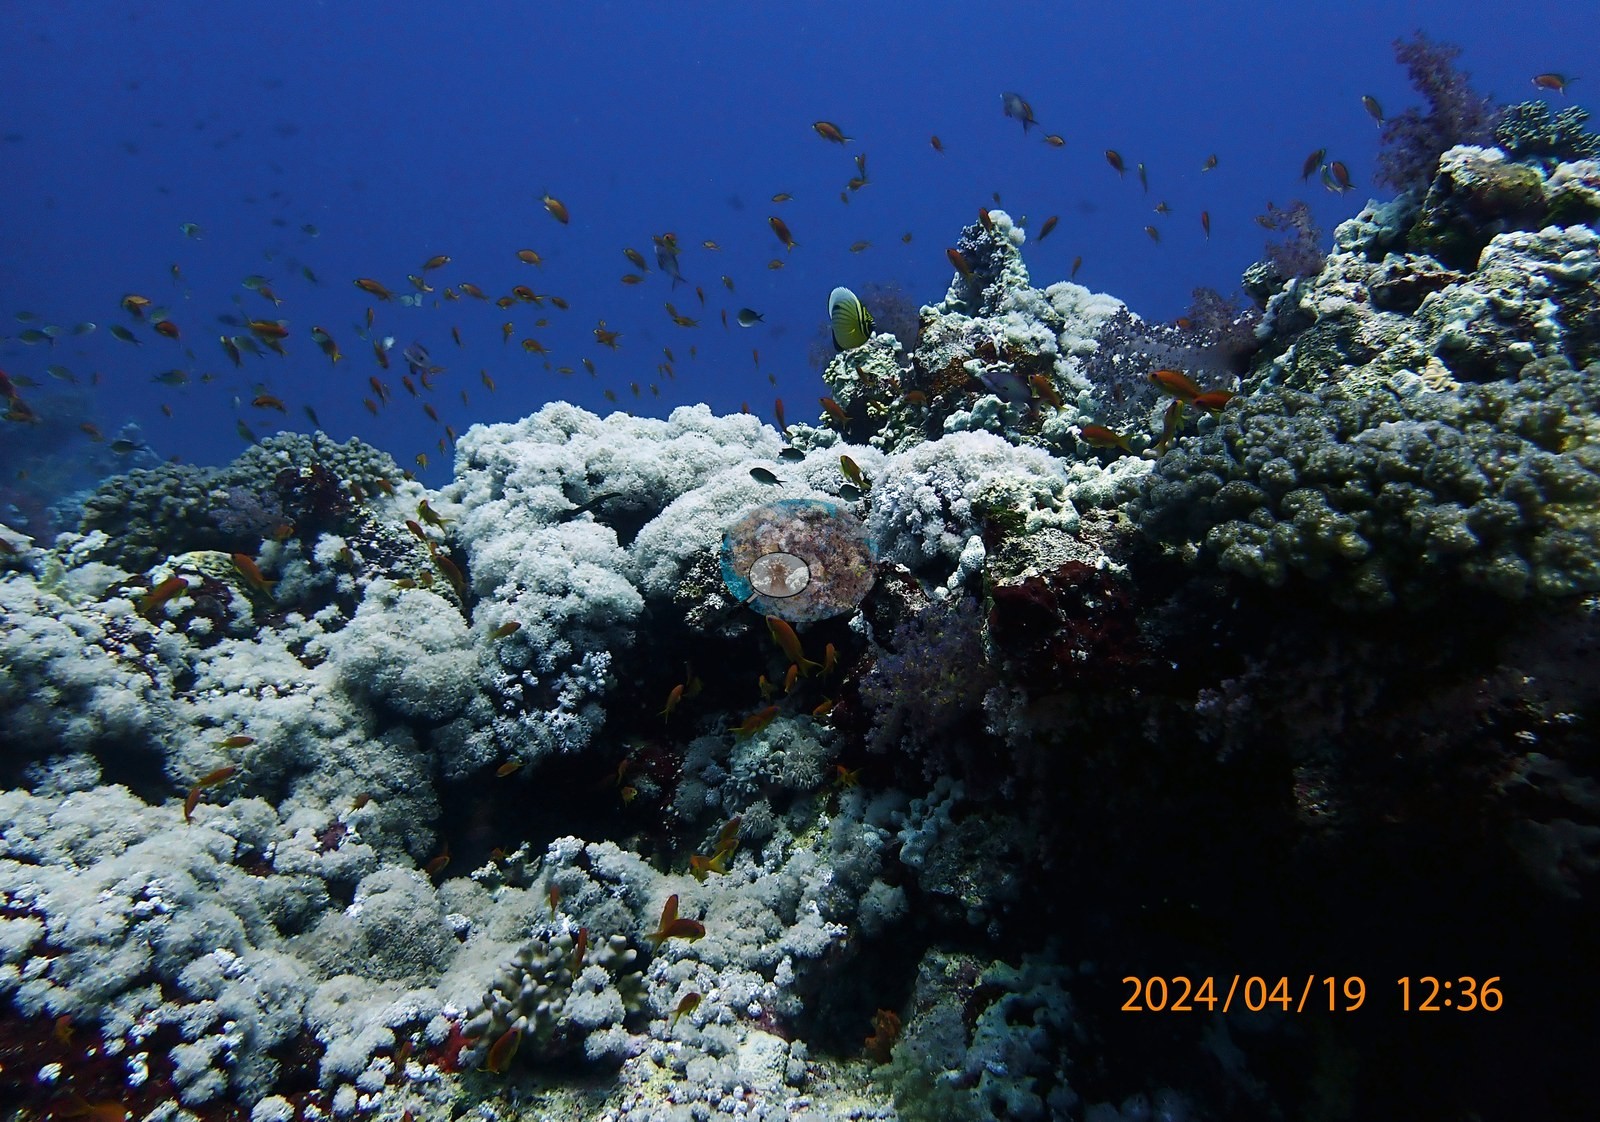
Notable fauna include a requiem shark and pairs of masked butterflyfish (Chaetodon semilarvatus), a Red Sea endemic, at Abu Galawa, and dolphins photographed on the October 2023 Thetis dive day.
Highlights
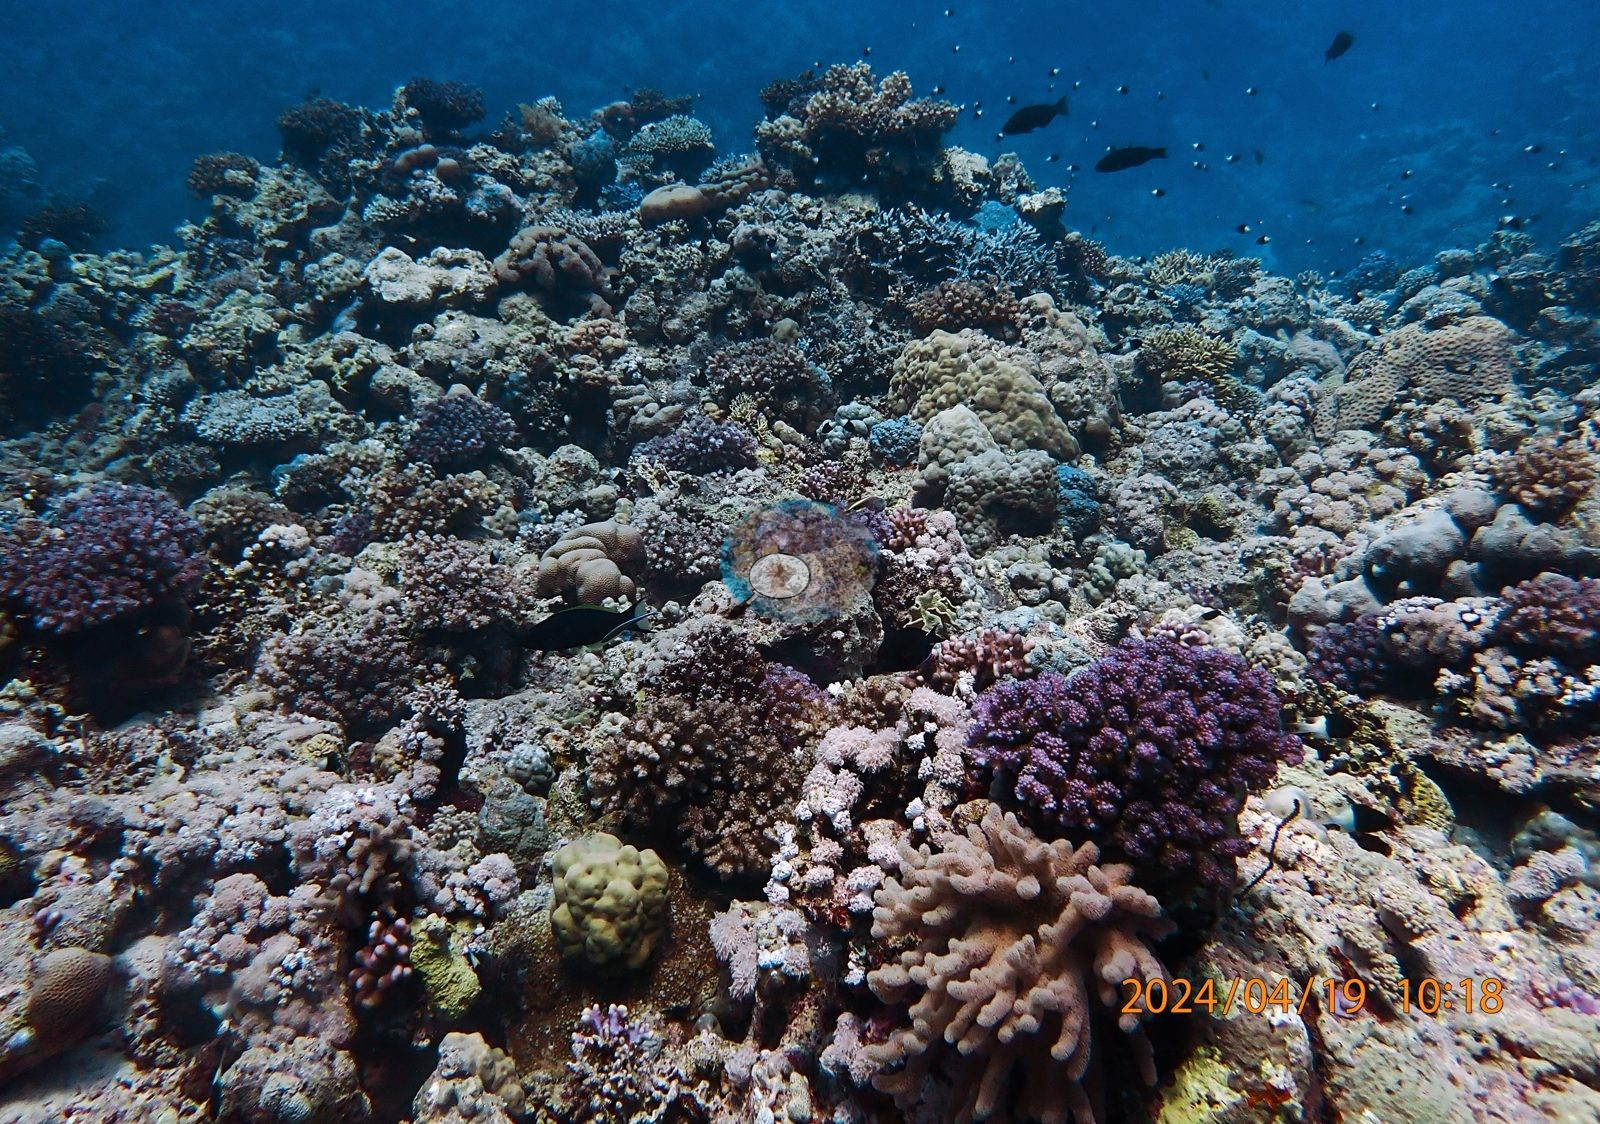
- Alrass Alakhdar held the highest published cover of the unit (29.6%) while 58.5% of its coral tissue was bleached in September 2023.
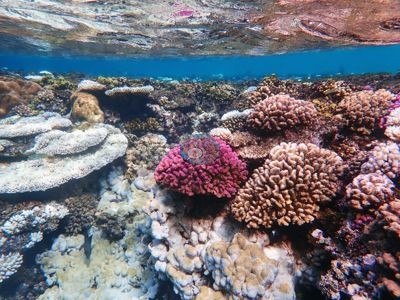 photo: Saudi Red Sea - Alrass Alakhdar (Yanbu)
 - Thetis cover more than halved between October 2023 (32.5%) and August 2024 (13.4%).
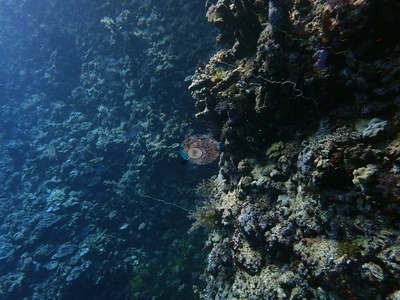 photo: Saudi Red Sea - Thetis (Yanbu)
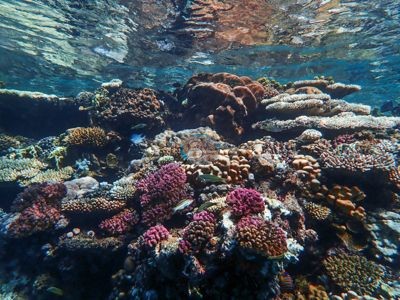
 - Um Mankout's slope is a near-continuous framework of knobby and columnar Porites.
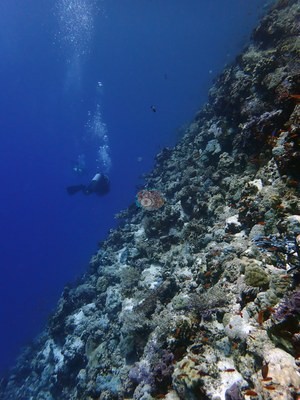
- Sites span a reef flat a meter or two deep to walls dived to 33.7 m (Mr. Umluj) and 34 m (Thetis).
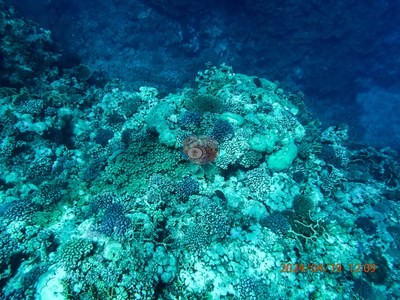 photo: Saudi Red Sea - Mr. Umluj (Yanbu)
 - Masked butterflyfish, a Red Sea endemic, and a requiem shark at Abu Galawa.
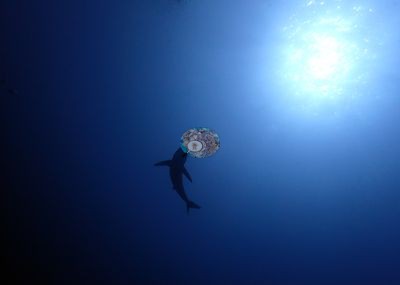 photo: Saudi Red Sea - Abu Galawa (Yanbu)
هذه ترجمة آلية للملخص الإنجليزي؛ والنص الإنجليزي هو النسخة المعتمدة. AI translation of this summary; the English is authoritative.
Regional setting
تمتلك المملكة العربية السعودية من الشعاب المرجانية أكثر مما تمتلكه أي دولة أخرى في البحار المحيطة بشبه الجزيرة العربية، ويمتد ساحلها على البحر الأحمر من خليج العقبة (Gulf of Aqaba) إلى الحدود اليمنية (Spalding et al. 2001). في الشمال يكون الجرف القاري ضيقًا أو غائبًا، وتكون المسطحات الشعابية نحيلة، وغالبًا ما تكون مقاطع الشعاب شديدة الانحدار أو عمودية؛ ويتسع الجرف باتجاه الجنوب. وتشكّل الشعاب الهدبية شريطًا شبه متصل على امتداد معظم الساحل الشمالي. وإلى الجنوب، تضم ضفة الوجه (Al Wadj Bank) مجمّعًا من الشعاب الهدبية والرقعية والحاجزية مع جزر صغيرة، ومن الوجه (Al Wadj) إلى جدة (Jeddah) يمتد تكوين متقطع من النوع الحاجزي أُطلق عليه اسم الحاجز المرجاني الصغير (Little Barrier Reef). ويضم الساحل الطيف الكامل من أنواع البحر الأحمر، بما فيها الأنواع المستوطنة الشمالية، وقد سجّلت مسوح أُجريت بين عامي 1997 و1999 نحو 260 نوعًا من المرجان الصلب. وفي أغسطس وسبتمبر 1998، ابيضّت الشعاب بشدة في بعض المواقع بين ينبع (Yanbu) ورابغ (Rabigh) خلال موجة من ارتفاع درجات حرارة البحر، ويشير Souter et al. (2021) إلى أن آثار عام 1998 كانت الأشد في وسط وشمال البحر الأحمر السعودي. ويقدّر Spalding et al. (2001) مساحة الشعاب المرجانية في المملكة العربية السعودية بنحو 6,660 km²، وهو رقم وطني يشمل ساحلها على الخليج العربي؛ في حين يعطي Souter et al. (2021) رقم 7,800 km² لمنطقة شمال ووسط البحر الأحمر الفرعية ككل.
وحتى عام 2001، وصف Spalding et al. جزءًا كبيرًا من ساحل البحر الأحمر السعودي بأنه غير مطوَّر بعيدًا عن جدة وينبع، لكنهم أدرجوا مياه الصرف الصحي واستصلاح الأراضي ضمن المخاوف حول المدن الكبرى، ومنها ينبع، حيث شكّل الميناء والمصفاة أيضًا خطرًا للتلوث النفطي. وكانت نحو 18 محطة لتحلية المياه على امتداد الساحل تعيد إلى البحر مياهًا دافئة ومالحة تحمل الكلور ومواد كيميائية مانعة للترسّبات. وأفاد Wilkinson (2006) بوجود خطط كبيرة لاستصلاح مناطق من الشعاب على امتداد ساحل البحر الأحمر السعودي، ويشير Souter et al. (2021) إلى أن خطة رؤية 2030 للمملكة تخصّ السياحة الساحلية بوصفها مسارًا رئيسيًا للتنويع الاقتصادي. ويذكرون الجريان السطحي والإثراء الغذائي والصيد الجائر بوصفها المحركات المحلية الرئيسية لتدهور الشعاب في وسط البحر الأحمر، مع أن معظم الشعاب التي ابيضّت عام 1998 قد تعافت، وبلغت التغطية في شمال ووسط البحر الأحمر 39.1% بحلول عام 2019.
Overview
تغطي وحدة ينبع سبع شعاب بعيدة عن الشاطئ في البحر الأحمر في منطقة ينبع وأملج (Umluj)، جرى الغوص فيها مع Umluj Dive Center بين سبتمبر 2023 وأغسطس 2024. وتتراوح البيئات بين مسطح شعابي تضيئه الأمواج على عمق متر أو مترين تحت السطح في Alrass Alakhdar، ومجمّع ضحل من الأخاديد والوديان في Al Fasmah (15 m)، ومنحدر مكسوّ بمرجان Porites في Um Mankout (27 m)، وجدران ومنحدرات عميقة في Mr. Umluj (33.7 m) وThetis (34 m)، وهي واجهة عمودية ذات سقوف صخرية بارزة ودعامات. أما Abu Galawa فهي شعاب هدبية طويلة يتحوّل فيها كتف عارٍ من الركام والرصيف الصخري إلى حافة مغطاة بالمرجان.
تراوحت التغطية المنشورة المستندة إلى عدّ النقاط بين 16.1% في Thetis و29.6% في Alrass Alakhdar عبر المواقع الستة التي جرى مسحها، مع تغطية طحلبية منخفضة (من 6.0% إلى 11.1%). ويتكوّن معظم المجتمع المرجاني من Porites العُقدية والعمودية، وAcropora العنقودية والإصبعية والطاولية، والبوسيلوبوريدات (pocilloporids) بأشكال لونية أرجوانية وخزامية ووردية فاقعة، والفافيدات (faviids)، والمرجان الناري من نوع Millepora. ويحمل Um Mankout هيكلًا شبه متصل من Porites لا يكاد يتخلّله رصيف صخري عارٍ، وكانت التغطية في Al Fasmah الأكثر تجانسًا من صورة إلى أخرى. ويجمع Mr. Umluj بين منحدر شديد الانحدار كثيف البناء وقمة مسطحة من الرصيف الصخري تكسوها الطحالب العشبية القصيرة، وفي Abu Galawa تصطف المرجانيات الرخوة الشجرية على امتداد قمة الحافة.
سُجّلت جميع هذه الشعاب خلال موجات الحر البحرية في البحر الأحمر في 2023-24. وسجّل Alrass Alakhdar أعلى تغطية وأعلى ابيضاض معًا بين زيارات سبتمبر 2023 (58.5% من النسيج المرجاني)، مع تجمّعات من Porites يمتد كلٌّ منها عدة أمتار وقد صارت بيضاء كالعظم بجوار بوسيلوبوريدات محتفظة بكامل صبغتها. أما Al Fasmah، الذي جرى الغوص فيه في الصباح نفسه، فبلغت نسبته 27.8%. وفي Thetis، انخفضت التغطية من 32.5% في أكتوبر 2023 (ابيضاض 62.1%) إلى 13.4% في أغسطس 2024، حين كان الجدار أكثر قتامة وتهيمن عليه المرجانيات الرخوة والإسفنجيات. وبالكاد تغيّر الابيضاض في Mr. Umluj بين زيارة باردة في أبريل 2024 (27.7%) وأغسطس 2024 (26.6%)، وأظهر Abu Galawa ابيضاضًا بنسبة 25.3% في أبريل 2024 دون أي إجهاد حراري متراكم.
ومن الحيوانات اللافتة قرش من فصيلة القروش الرمادية (requiem shark) وأزواج من سمك الفراشة المقنّع (Chaetodon semilarvatus)، وهو من الأنواع المستوطنة في البحر الأحمر، في Abu Galawa، ودلافين صُوّرت في يوم الغوص في Thetis في أكتوبر 2023.
Highlights
- سجّل Alrass Alakhdar أعلى تغطية منشورة في الوحدة (29.6%)، في حين كان 58.5% من نسيجه المرجاني مبيضًّا في سبتمبر 2023.
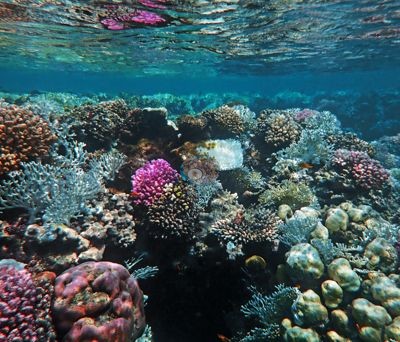 photo: Saudi Red Sea - Alrass Alakhdar (Yanbu)
 - انخفضت التغطية في Thetis إلى أقل من النصف بين أكتوبر 2023 (32.5%) وأغسطس 2024 (13.4%).
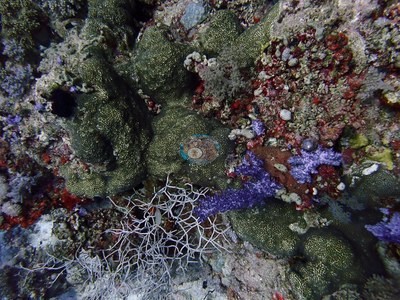 photo: Saudi Red Sea - Thetis (Yanbu)
 - منحدر Um Mankout هيكل شبه متصل من Porites العُقدية والعمودية.
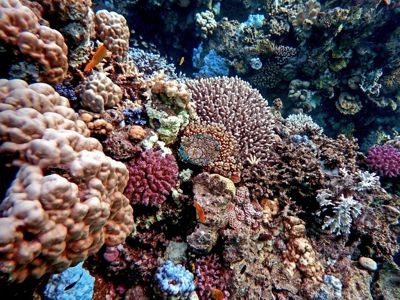 photo: Saudi Red Sea - Um Mankout (Yanbu)
 - تمتد المواقع من مسطح شعابي على عمق متر أو مترين إلى جدران جرى الغوص فيها حتى 33.7 m (Mr. Umluj) و34 m (Thetis).
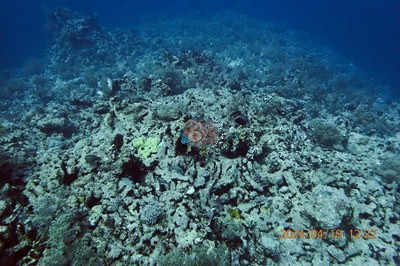 photo: Saudi Red Sea - Mr. Umluj (Yanbu)
 - سمك الفراشة المقنّع، وهو من الأنواع المستوطنة في البحر الأحمر، وقرش من فصيلة القروش الرمادية في Abu Galawa.
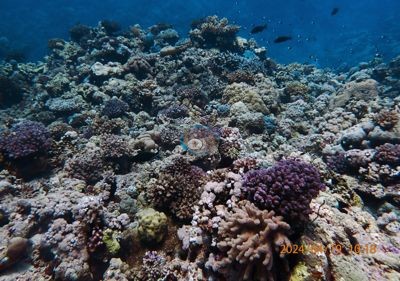 photo: Saudi Red Sea - Abu Galawa (Yanbu)
Notable observations
- Saudi Red Sea - Alrass Alakhdar (Yanbu): Bleaching: 58.5% of coral tissue bleached at about 14.9 degree-heating-weeks (16 Sep 2023); entire multi-meter stands of knobby Porites bone-white beside fully pigmented pocilloporids.
- Saudi Red Sea - Thetis (Yanbu): Bleaching: 62.1% of coral tissue bleached in October 2023 (19.9 DHW) and 25.0% in August 2024; cover fell from 32.5% to 13.4% between the two visits.
- Saudi Red Sea - Um Mankout (Yanbu): Bleaching: 28.0% of coral tissue bleached (15 Sep 2023); the columnar Porites carpet reads widely pale, with a few frankly white colonies. Marine debris: a corroded discarded metal object on the sand at the reef base.
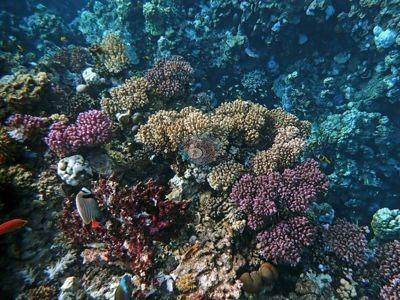
- Saudi Red Sea - Al Fasmah (Yanbu): Bleaching: 27.8% of coral tissue bleached (16 Sep 2023); stark-white encrusting and plating colonies recur through the frames.
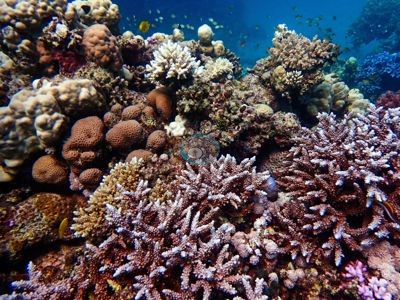
- Saudi Red Sea - Mr. Umluj (Yanbu): Bleaching: 27.7% of coral tissue bleached (April 2024, zero DHW) and 26.6% (August 2024, 14.2 DHW); scattered pale and white colonies in both years.
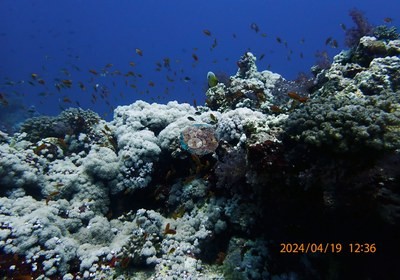
- Saudi Red Sea - Abu Galawa (Yanbu): Bleaching: 25.3% of coral tissue bleached (19 Apr 2024) with no accumulated heat stress; un-strobed frames too washed out to confirm visually.
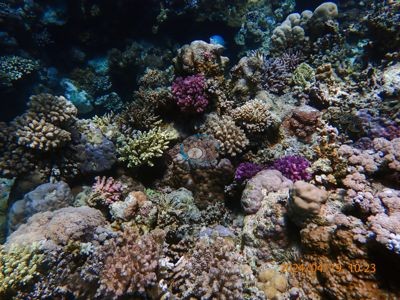
Coral cover over time (pooled)
Sites in this region
- Saudi Red Sea - Abu Galawa (Yanbu) — 18% coral cover
- Saudi Red Sea - Al Fasmah (Yanbu) — 22% coral cover
- Saudi Red Sea - Al Shbareer reef (Yanbu)
- Saudi Red Sea - Alrass Alakhdar (Yanbu) — 30% coral cover
- Saudi Red Sea - Mr. Umluj (Yanbu) — 17% coral cover
- Saudi Red Sea - Thetis (Yanbu) — 16% coral cover
- Saudi Red Sea - Um Mankout (Yanbu) — 26% coral cover
Nearby external survey stations
4 independent survey records within 5 km of a site in this region (deduplicated across sites).
- Aeby et al. (2021) — Yanbu 2 (2015): 42% hard coral cover, 3.78 km from Saudi Red Sea - Mr. Umluj (Yanbu)
- Aeby et al. (2021) — Yanbu 3 (2015): 50% hard coral cover, 4.22 km from Saudi Red Sea - Mr. Umluj (Yanbu)
- Aeby et al. (2021) — Yanbu 4 (2015): 83% hard coral cover, 1.48 km from Saudi Red Sea - Al Fasmah (Yanbu)
- Aeby et al. (2021) — Yanbu 6 (2015): 51% hard coral cover, 1.79 km from Saudi Red Sea - Al Fasmah (Yanbu)
All images from Coral Reef Diagnostics. Data are from Coral Reef Diagnostics.
 © Coral Reef Diagnostics.
References
- Souter D, et al. (eds) (2021) Status of Coral Reefs of the World: 2020. International Coral Reef Initiative / Global Coral Reef Monitoring Network. [PDF]
- Spalding MD, et al. (2001) World Atlas of Coral Reefs. University of California Press, Berkeley. [PDF]
- Wilkinson C (2006) Status of coral reefs of the world: summary of threats and remedial action. In: Côté IM, Reynolds JD (eds) Coral Reef Conservation. Cambridge University Press, Cambridge. [PDF]
- Aeby GS, Shore A, Jensen T, Ziegler M, Work T, Voolstra CR (2021). A comparative baseline of coral disease in three regions along the Saudi Arabian coast of the central Red Sea. PLOS ONE 16:e0246854. PDF