
Saudi Red Sea - Anderson's Reef-II (Jeddah)
Part of the regional summaries: Saudi Arabia - Jeddah / KAUST (Thuwal) / Rabigh, Saudi Arabia, and Red Sea
More info
Makkah-Madine Saudi Arabia (NOAA CRW virtual station) · Northern and Central Red Sea ecoregion mean=12.2°C-heating weeksA Jeddah reef whose set piece is a bommie the size of a small building upholstered in lilac, mauve, and gold soft corals, with anthias and glassfish swarming above it, unlike anything else in the Saudi set. The surrounding hard coral is dense and colorful, including a huge table coral Anderson captioned monster Acropora, though about 19% of coral tissue was bleached in August 2024.
شعبة قرب جدة قطعتها البارزة كتلة مرجانية بحجم مبنى صغير مكسوّة بمرجانيات رخوة بألوان الليلكي والبنفسجي والذهبي، تحوم فوقها أسماك الأنثياس والأسماك الزجاجية، ولا نظير لها في المجموعة السعودية.
ترجمة هذا الملخص بالذكاء الاصطناعي؛ النص الإنجليزي هو المعتمد. Translated from the site’s shorter map summary.
One independent survey station shown with the program’s logo — click one to see how far it is from this site.
One other CRD dive site within 5 km shown in orange — click a marker to open its page.
Site description
General benthic features
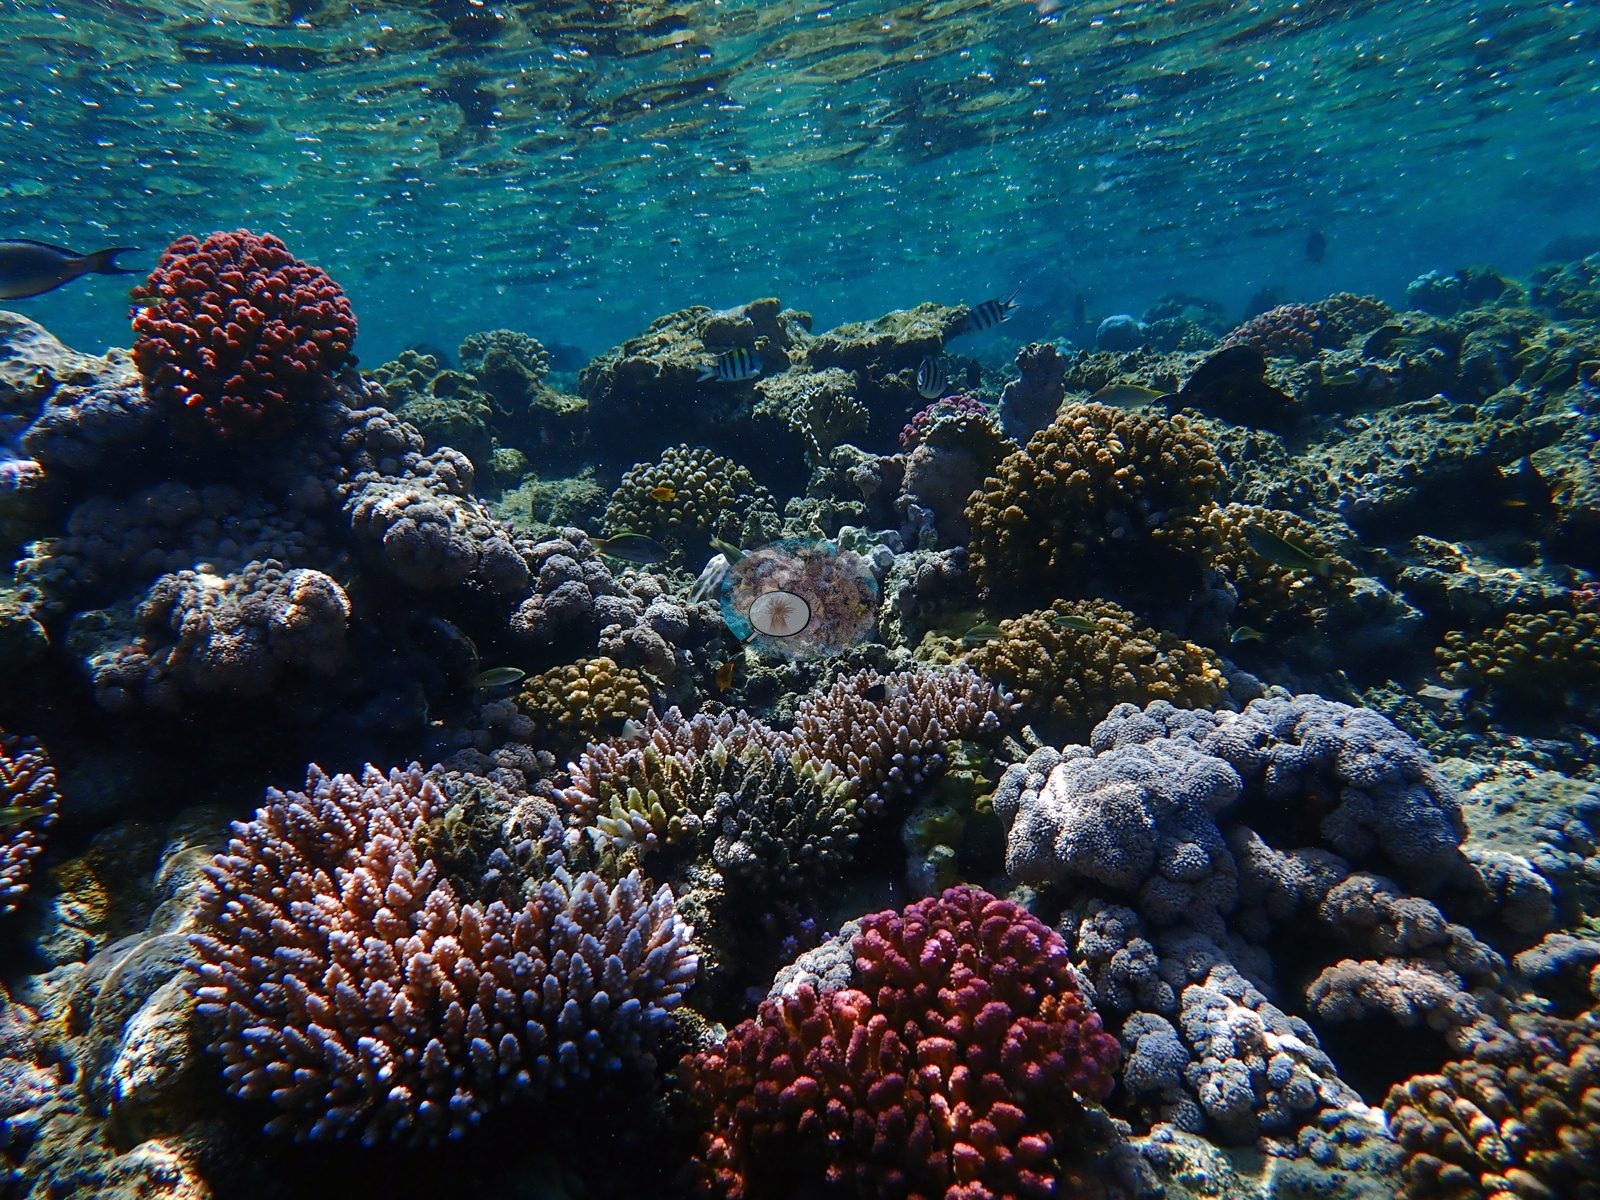
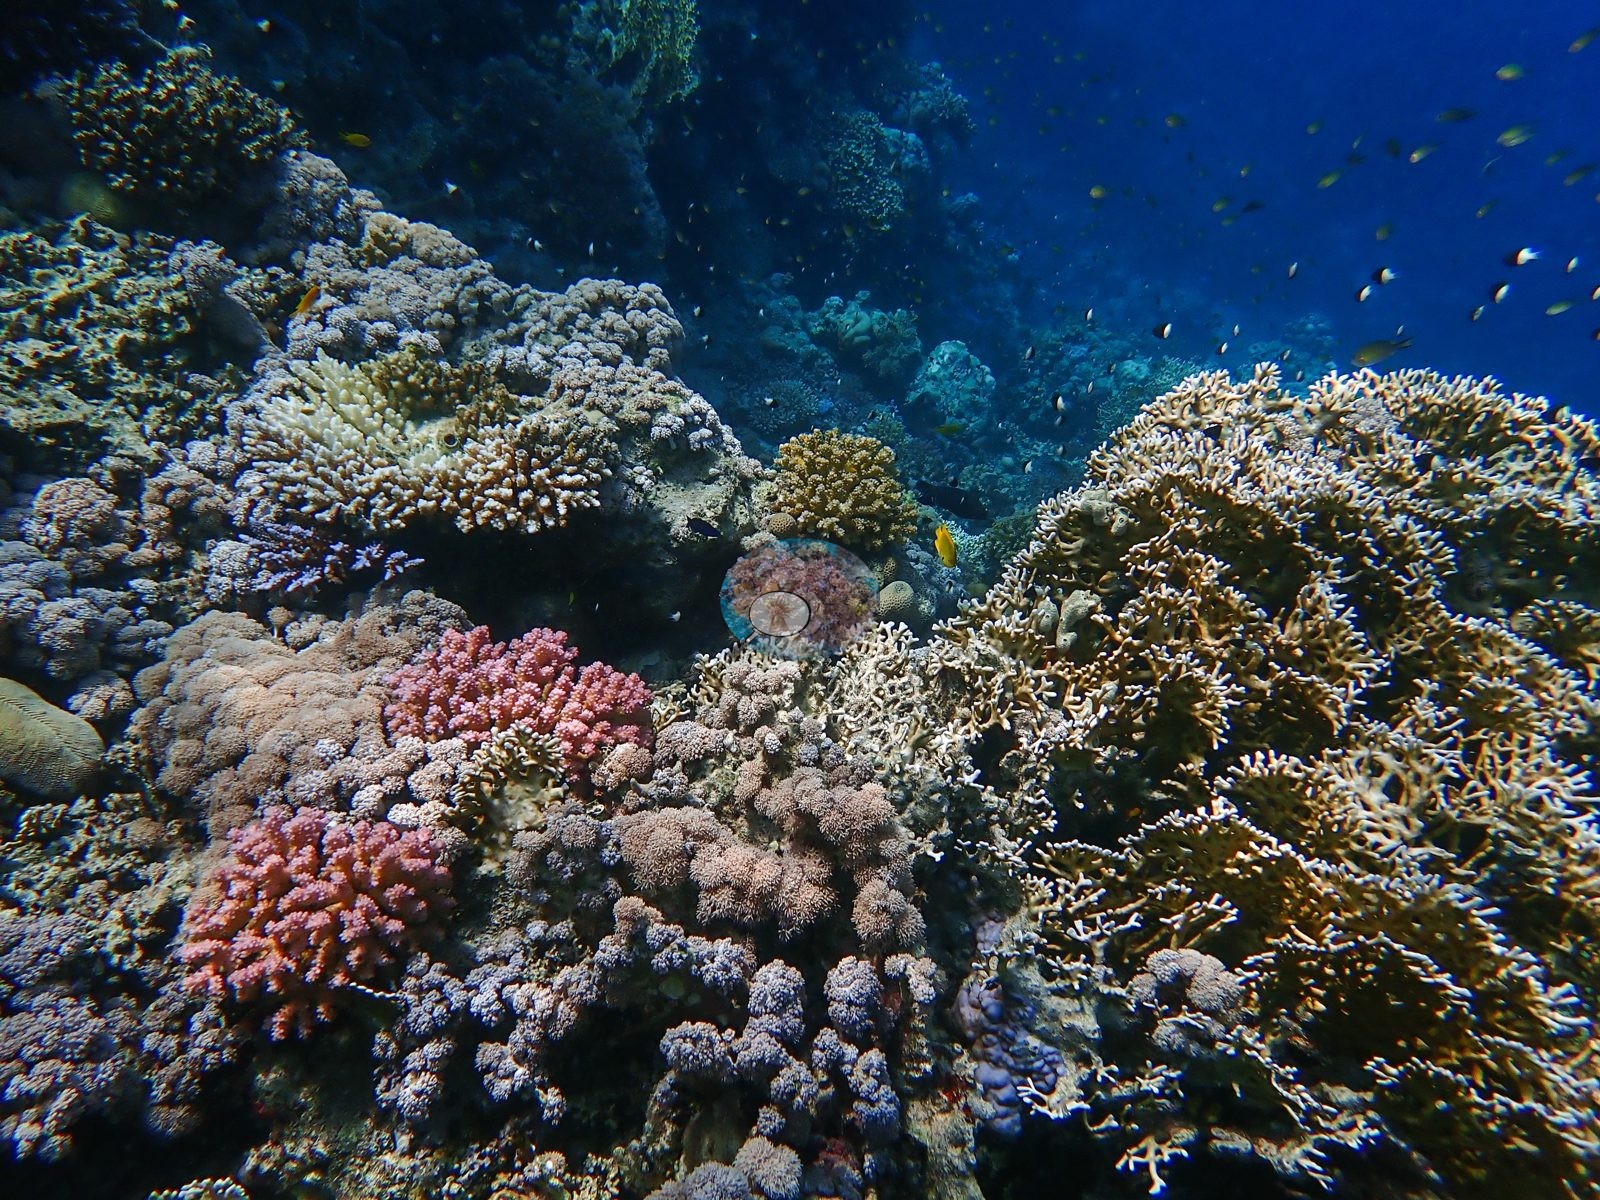
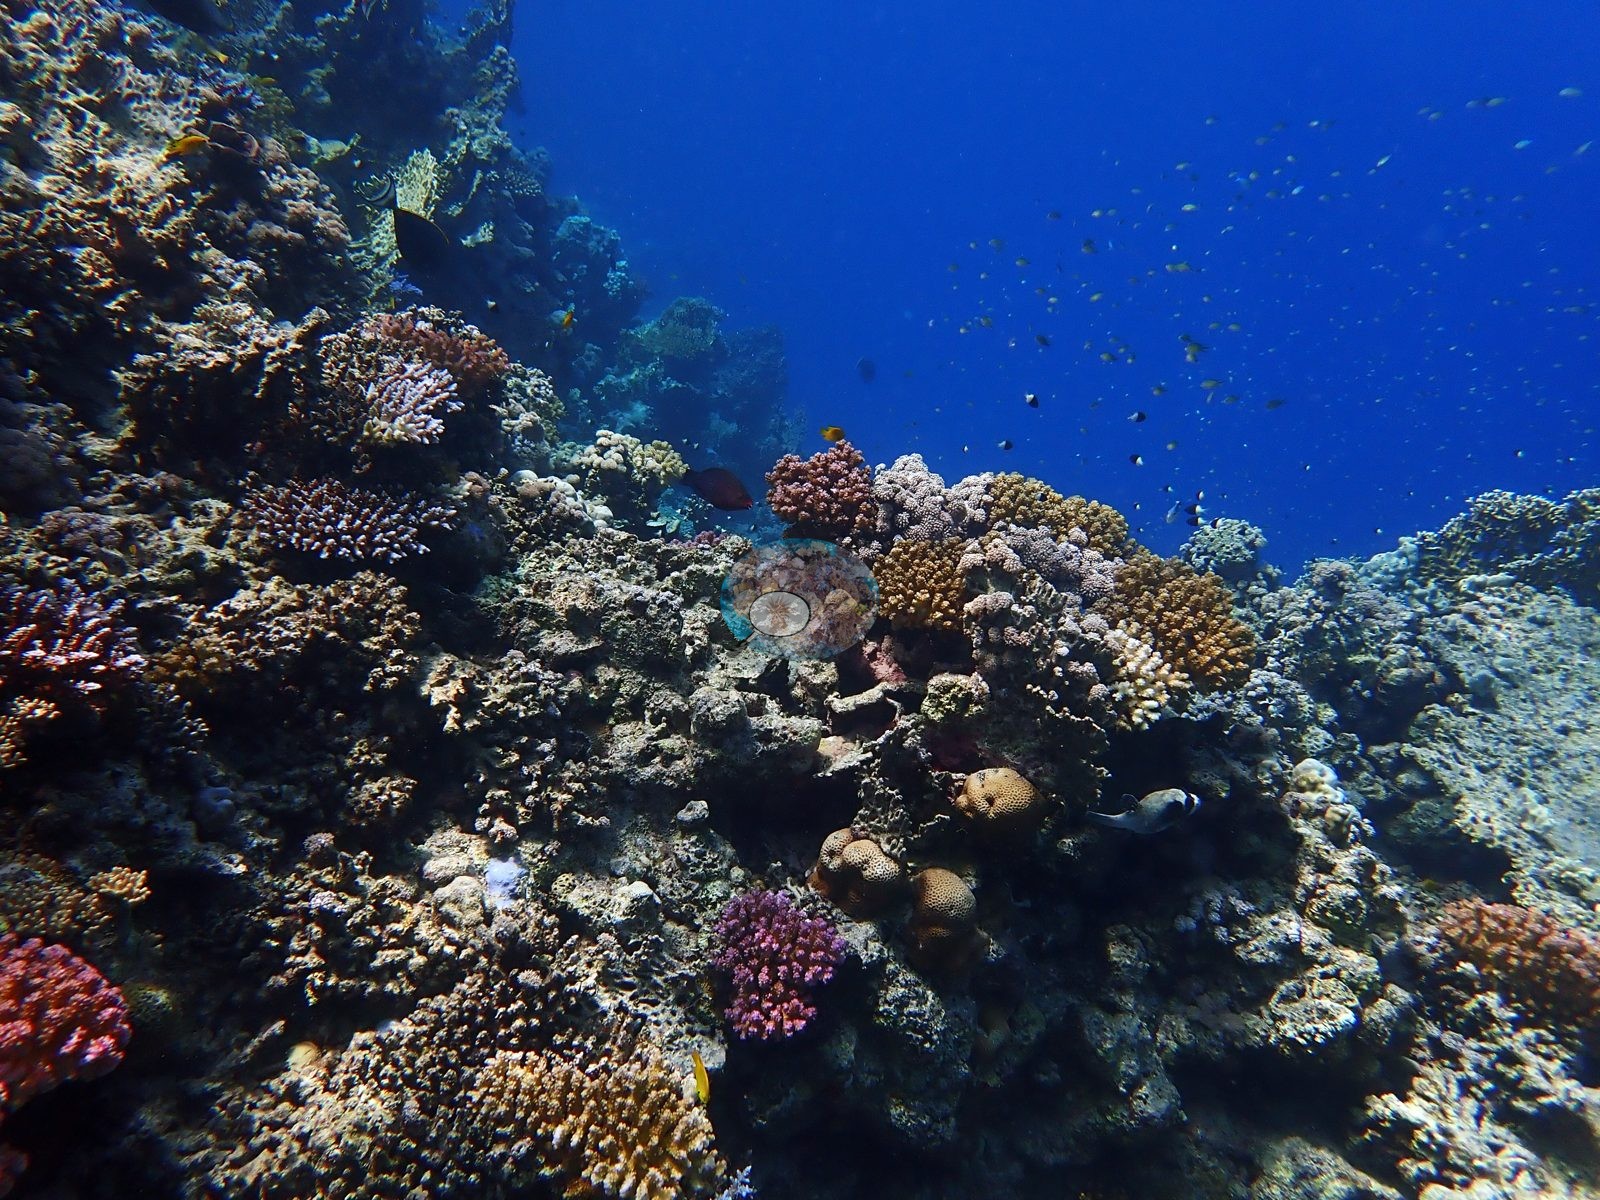
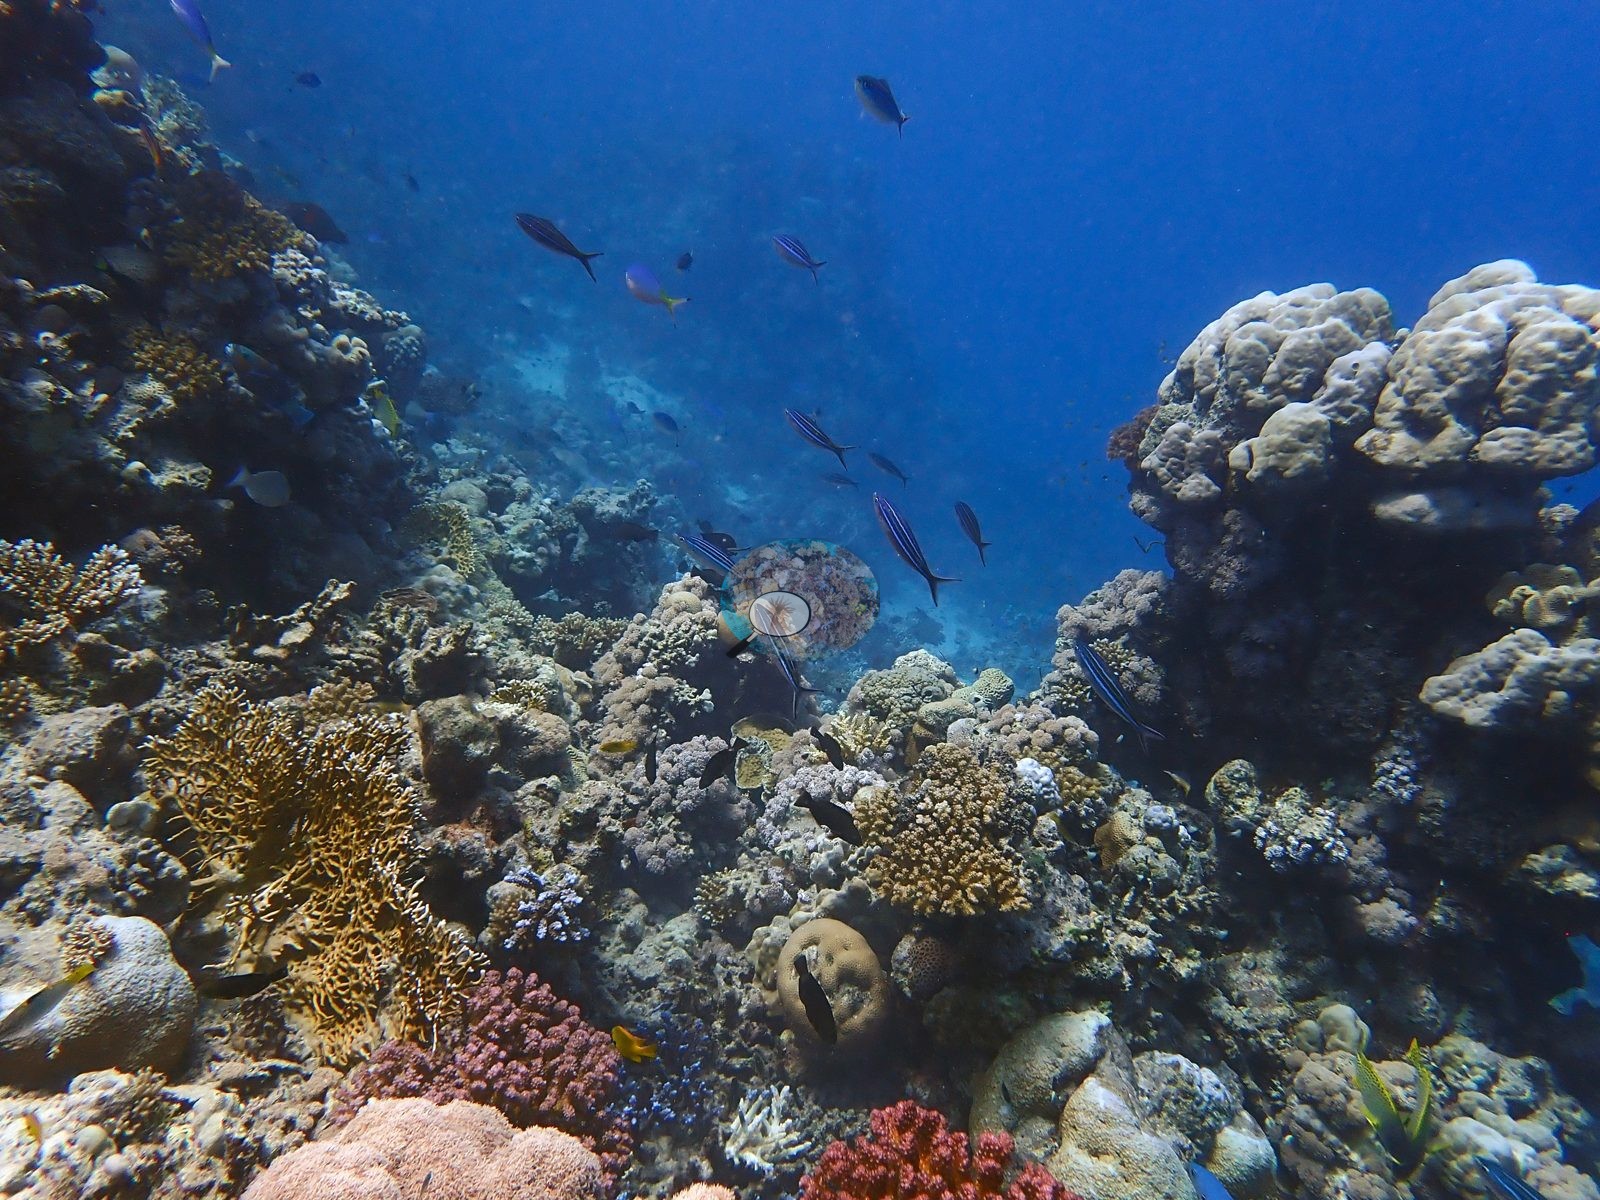
The set-piece here is soft coral. One frame shows a diver alongside a bommie the size of a small building, its entire crown upholstered in arborescent soft corals — lilac, mauve, cream, and pale gold Dendronephthya/Scleronephthya-type colonies with polyps fully extended in current — with a shimmering cloud of anthias and glassfish suspended over it. Nothing else in the Saudi set looks like it. The hard coral reef around it is dense and warm-toned: pocilloporids in salmon, rose, apricot, and lilac packed shoulder to shoulder down the slope, tan and gold corymbose Acropora, blue-gray and cream Porites lobes, faviid domes, and a very large table Acropora Anderson captioned "monster Acropora" (e.g., Image 1, Image 2, Image 3, Image 4).
A second table Acropora photographed from above shows a striking two-tone pattern — olive-gold in the center, clean white around the entire outer margin.
Coral cover
Coral cover is 21.0% ± 15.8 across 174 photographs, quoted verbatim from Mayfield, A.B. (2025) Environments 12:248 — Red Sea 2023-24 bleaching; CoralNet point annotation, Appendix A — a manual, diver-annotated CoralNet point count from Anderson's own published work, not a computer vision output and not recomputed here.
Stressors
The site record reports 18.9% of coral tissue bleached at about 11.9°C-weeks DHW — second-lowest in this Red Sea set behind Reef-I, and the two figures sit close enough to read as one reef system sampled twice.
Comparisons with other data
No independent survey was made at this exact site; the nearest ones are listed in the table below.
Dive record
The second of the two 3 August 2024 dives off Jeddah with Al-Haddad SCUBA, on the neighboring reef about 500 m north of Reef-I.
Other notes
See condition for how that reads.
CV model comparison
More info
The reference row is this dive site's own published value (Mayfield 2025, Appendix A, 174 photos); the other rows are AREA-level (Jeddah) comparisons, not run on this site's frames. ⚠ The comparison rows are REGIONS, not dive sites: the paper's main tables report cover by region, and this site's own value comes from its Appendix A. ⚠ The manual column and the CV columns are on DIFFERENT FRAME SETS. The published cover spans the region's full photo set (173–2,567 frames, most of them CoralNet robot-labeled); the CV arms ran only on the hand-scored reference subset, which is 6 frames at Thuwal, 274 at Jeddah and 173 at Rabigh. Read Thuwal's model columns as indicative only. CoralNet is n/a by design: the reference set IS the hand-scored set, so those frames carry no independent robot label to compare against. DINOv3 is restricted to frames it never saw, and reads roughly double the published cover at every Red Sea region. ⚠ 'unassigned region' is not a place: 135 frames carry no region label in the CoralNet metadata and map to no published row. It has no manual value and is excluded from the pooled reference. CoralNet automated point classifier: n/a — the reference set IS the hand-scored set; these frames carry no independent CoralNet robot label to compare against CoralSCOP (SAM-based mask-sum), unedited photos: pending — CoralSCOP run: 370/747 images scored at build time CoralSCOP (SAM-based mask-sum), edited photos: pending — CoralSCOP run: 370/747 images scored at build time| Method | Hard-coral cover (%) |
|---|---|
| Manual (published) | 21.0 |
| In-house DINOv3 | 34.9 |
| Claude | 27.3 |
Independent surveys nearby
Within 5 km, 1 independent survey station recorded hard coral cover in 2013. The most recent nearby survey is from 2013, so these values predate recent heat stress. This site's own estimate (21%) sits 9.7 points below the range of these surveys (31%); the methods differ, so the comparison is context, not a like-for-like test.
Collected by other programs using different methods, so these are context for the figures above, not a like-for-like comparison. Where a station was surveyed more than once the range is shown. Station names are not dive-site names.
| Agency | Site / location | Date | Hard coral cover (%) | Distance | Link |
|---|---|---|---|---|---|
| Khalil et al. (2017) | — | 2013 | 31% (2 surveys) | 3.81 km | HeatCRD database |
Data & links
- CoralNet image repository for this region ↗
- HeatCRD database ↗
- (reference) ↗
- Photo portfolio ↗
- Coral Reef Diagnostics country page ↗
All images from Coral Reef Diagnostics. Data are from Coral Reef Diagnostics and the organizations named in the data-sources table above.
© Coral Reef Diagnostics.
References
- Khalil MT, Bouwmeester J, Berumen ML (2017). Spatial variation in coral reef fish and benthic communities in the central Saudi Arabian Red Sea. PeerJ 5:e3410. DOI
- Mayfield AB (2025). Using Tourist Diver Photos to Assess the Effects of Marine Heatwaves on Central Red Sea Coral Reefs. Environments 12:248. PDF