
Saudi Red Sea - Mr. Umluj (Yanbu)
Part of the regional summaries: Saudi Arabia - Yanbu, Saudi Arabia, and Red Sea
2024-04-19
2024-08-09
More info
Makkah-Madine Saudi Arabia (NOAA CRW virtual station) · Northern and Central Red Sea ecoregion mean=12.2°C-heating weeksMr. Umluj has two very different faces - a steep, densely built slope of pocilloporids, Acropora, and Porites in one set of frames, and a flatter, barer stretch of algal-turfed pavement and rubble in another, with a fish-filled channel between two reef walls. Remarkably, bleaching barely moved between a cool April 2024 visit (27.7% of coral tissue, zero heat stress) and an August 2024 visit taken inside the marine heatwave (26.6%, 14.2 DHW) - a different pattern from most other Red Sea sites here, where bleaching tracked the heat.
لموقع مستر أملج وجهان مختلفان جداً: منحدر شديد مبني بكثافة من مرجانيات شوكية وAcropora وPorites في مجموعة من الصور، وامتداد أكثر انبساطاً وعرياً من الرصيف الصخري المكسو بالطحالب الخيطية والحطام في مجموعة أخرى، مع ممر مليء بالأسماك بين جدارين من الشعبة.
ترجمة هذا الملخص بالذكاء الاصطناعي؛ النص الإنجليزي هو المعتمد. Translated from the site’s shorter map summary.
Two independent survey stations shown with the program’s logo — click one to see how far it is from this site.
8 of these 9 photographs are shown beside the text that discusses them under "Site description" below.
Site description
Setting
An offshore reef in the Umluj area worked with Umluj Dive Center, logged three times and photographed twice, and one of the sites carrying a per-visit series in the site record.
General benthic features
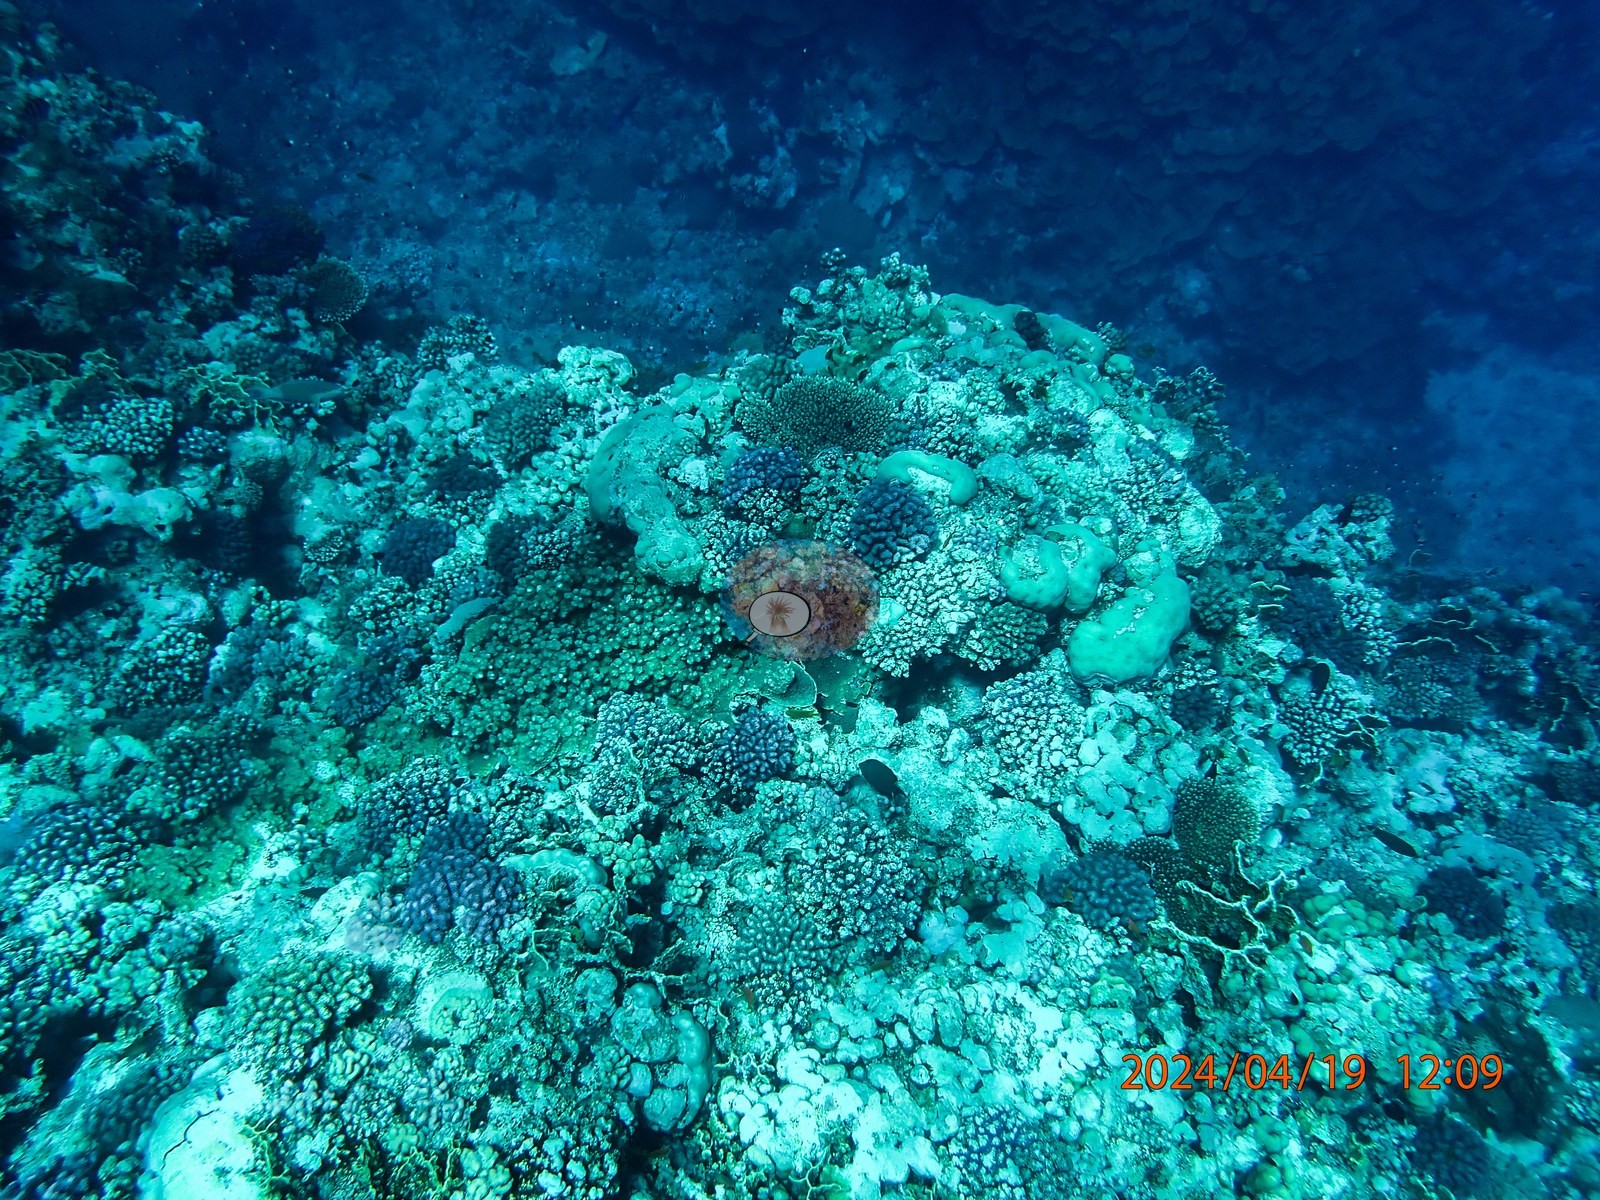
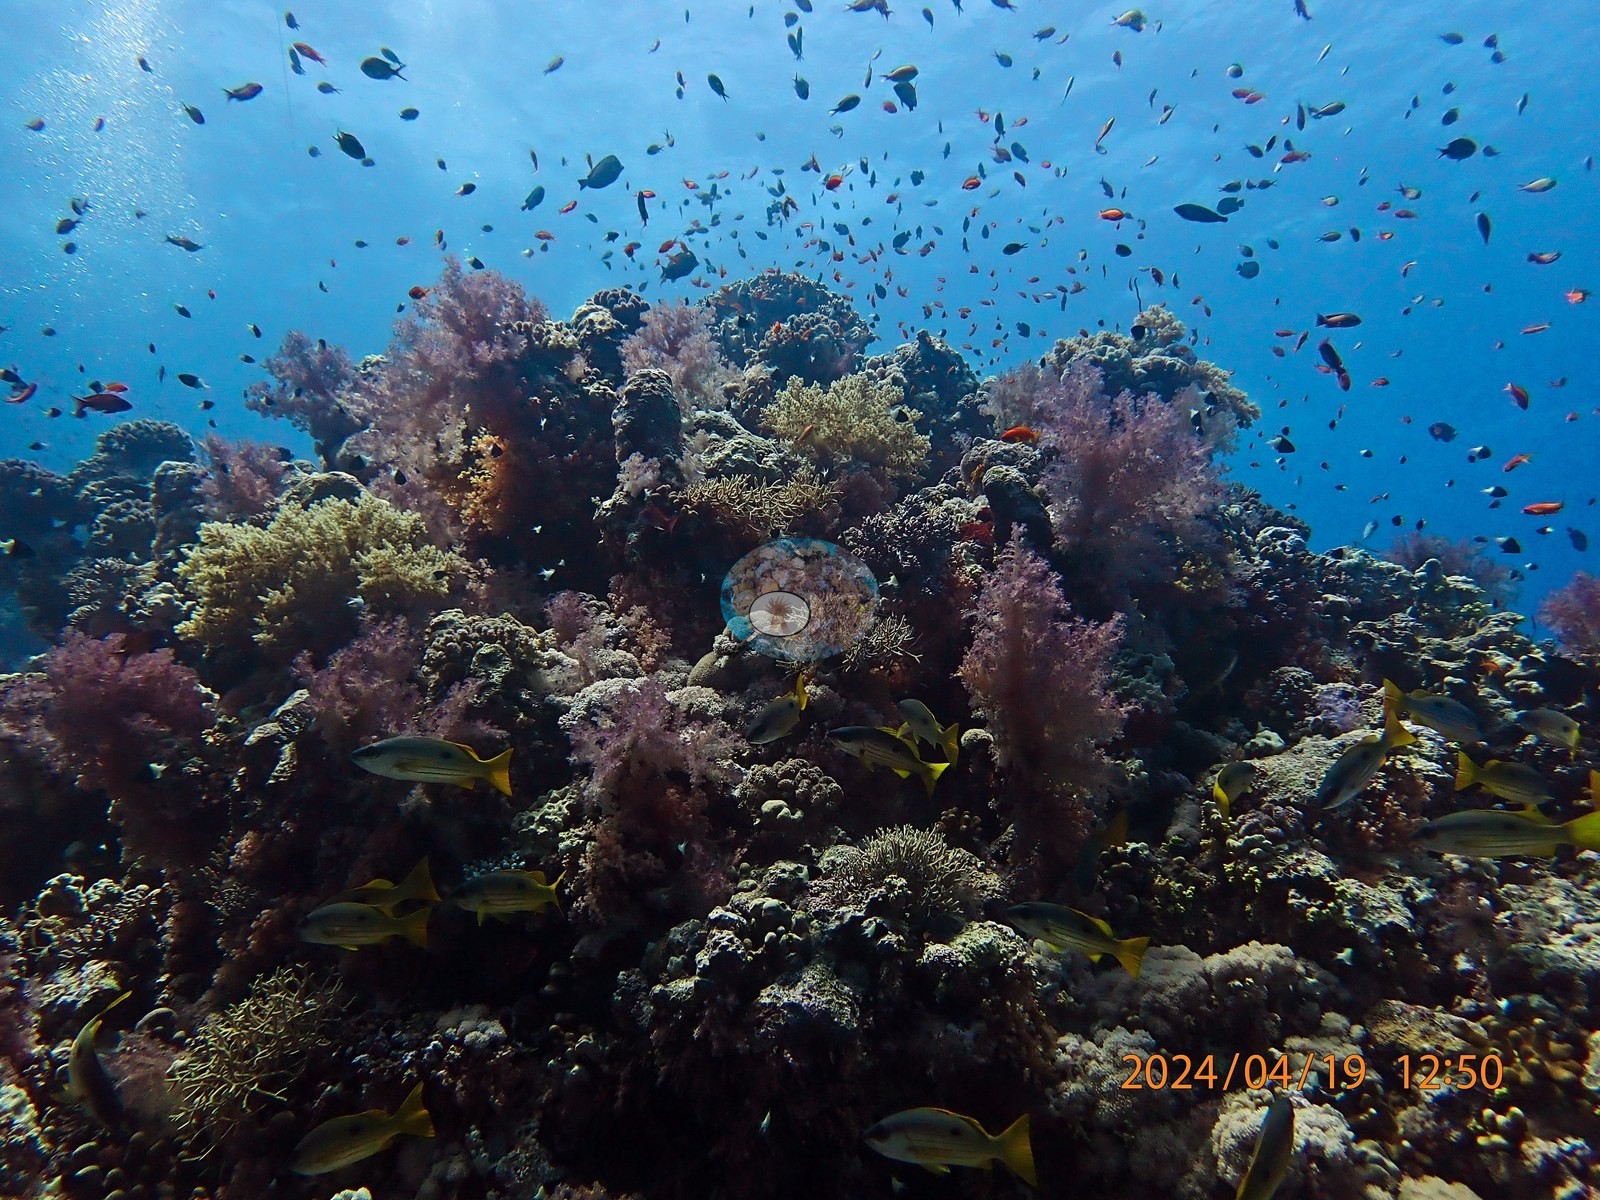
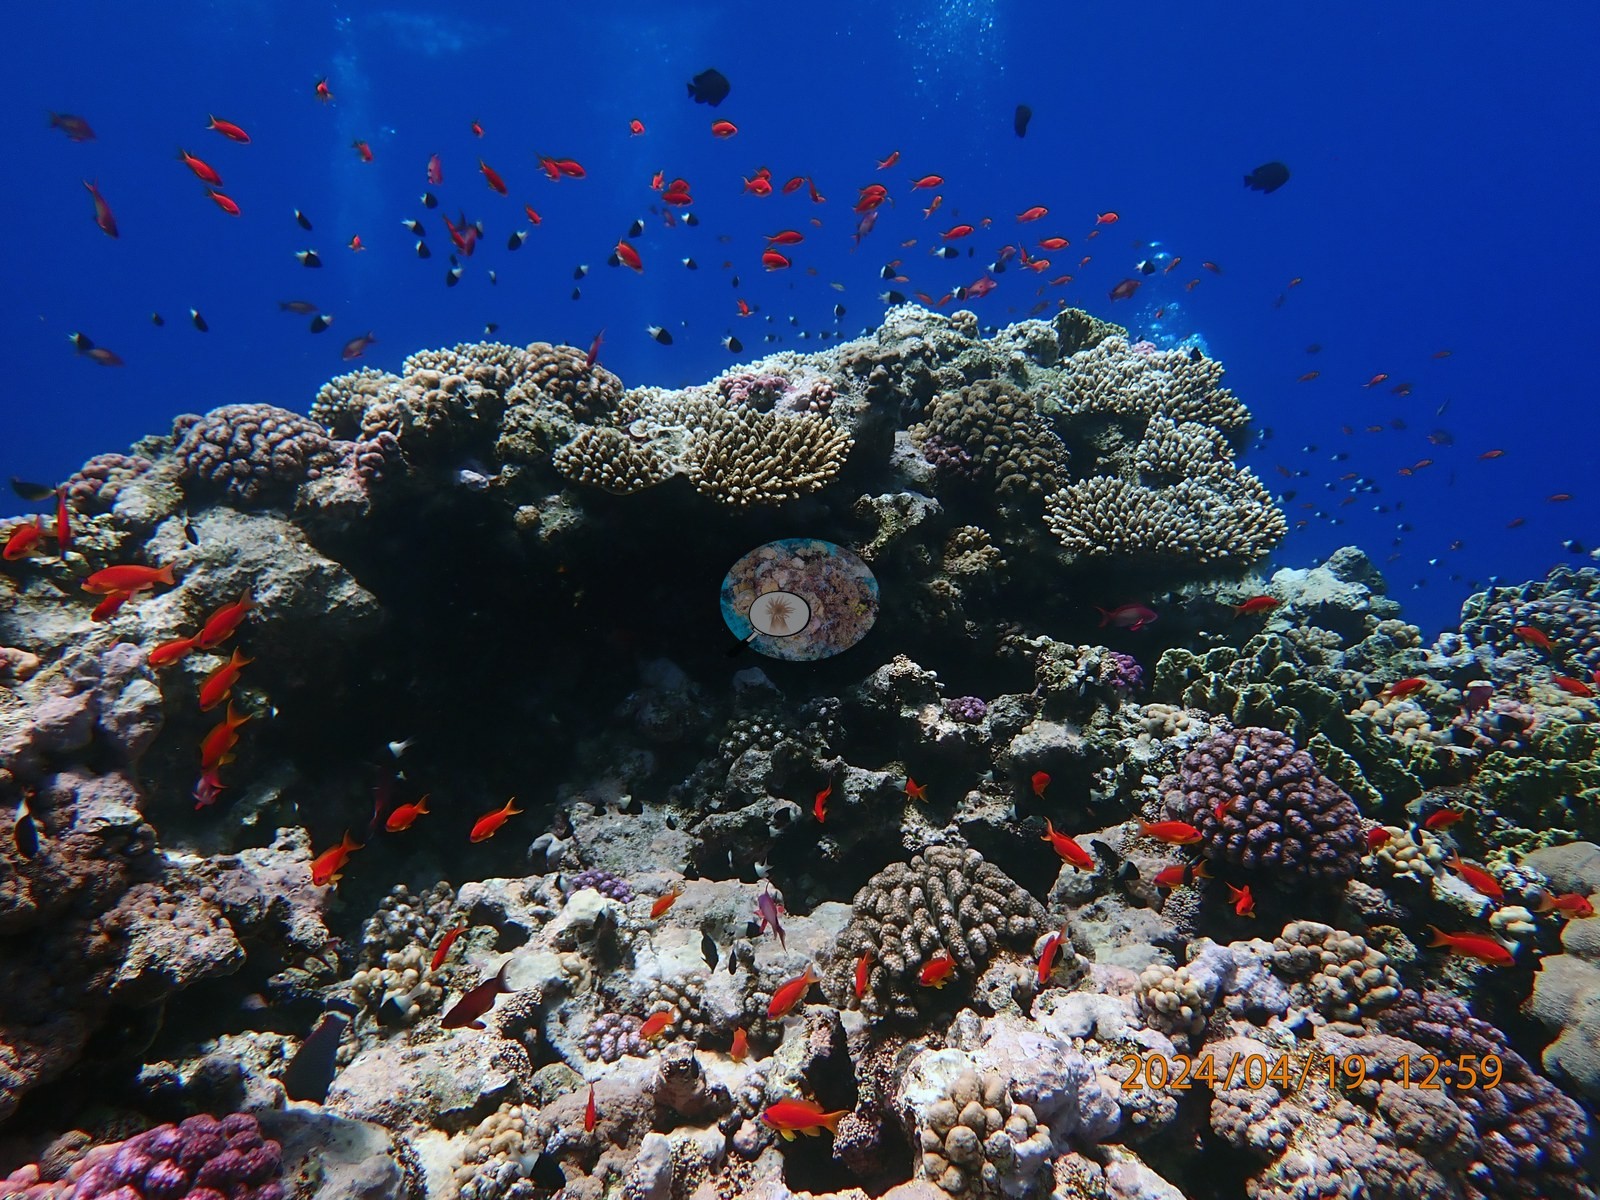
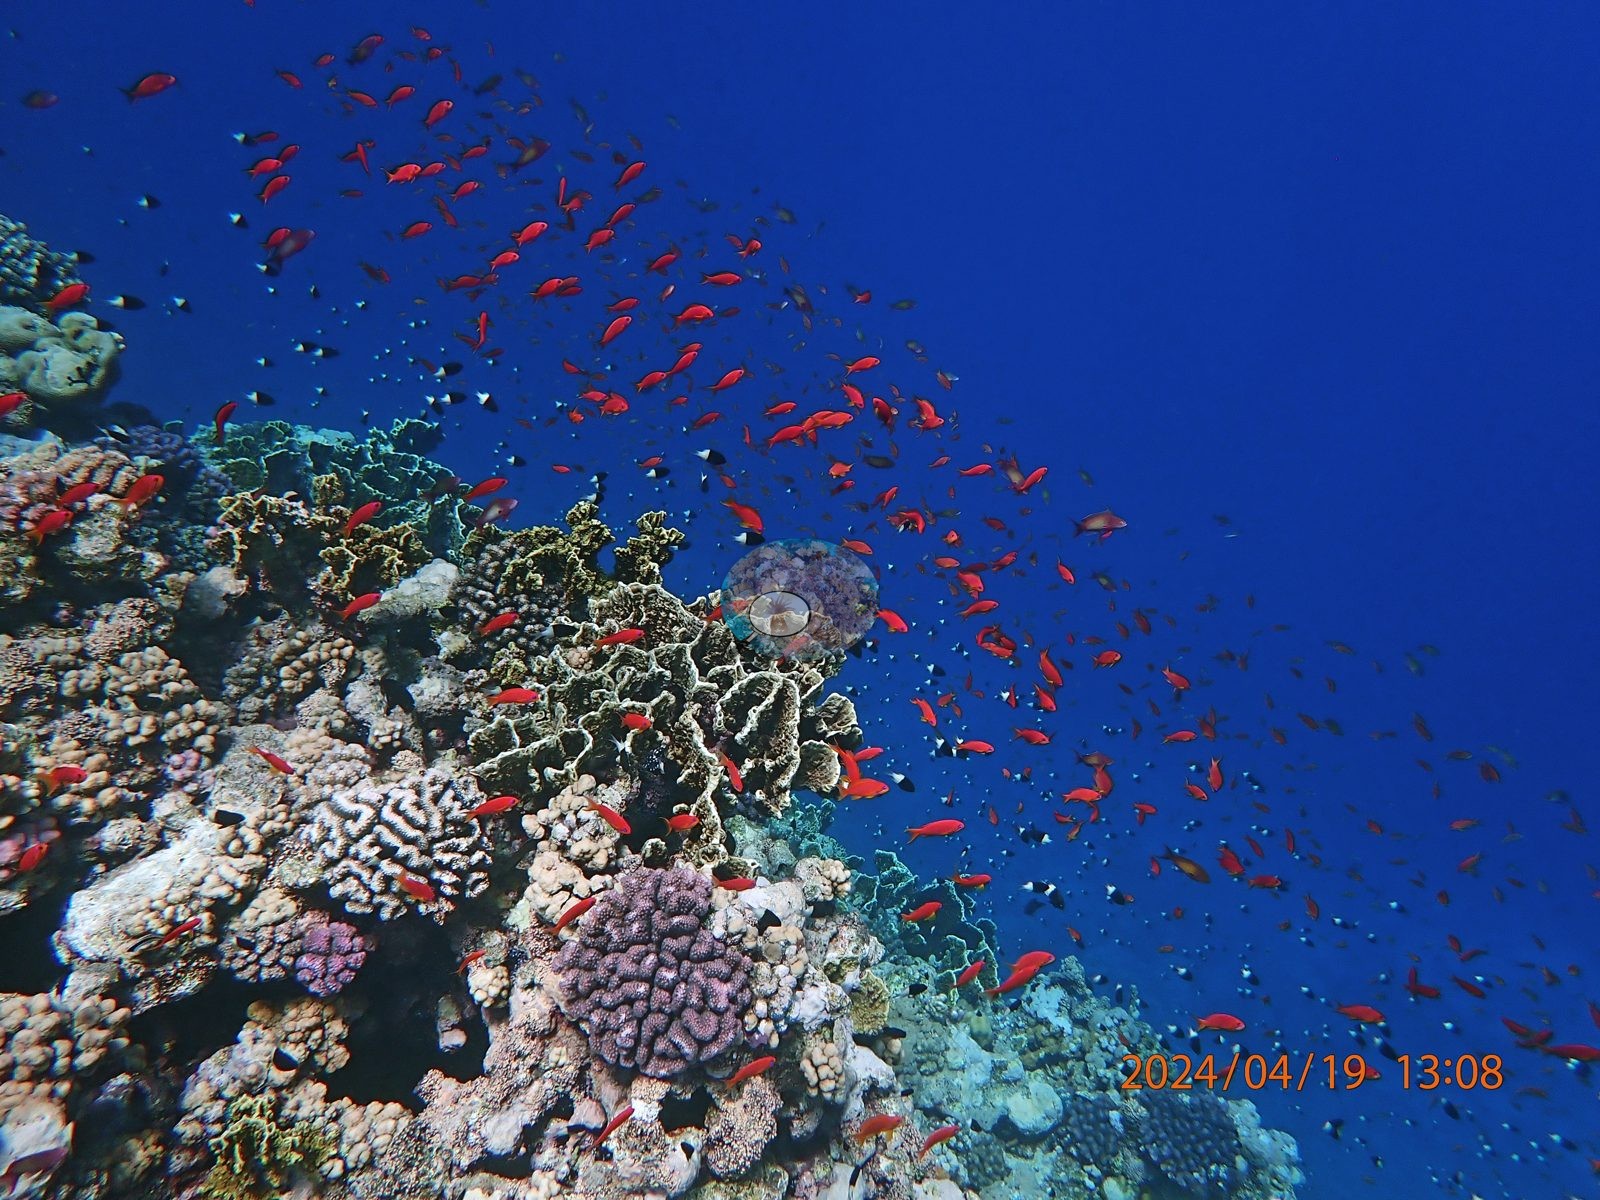
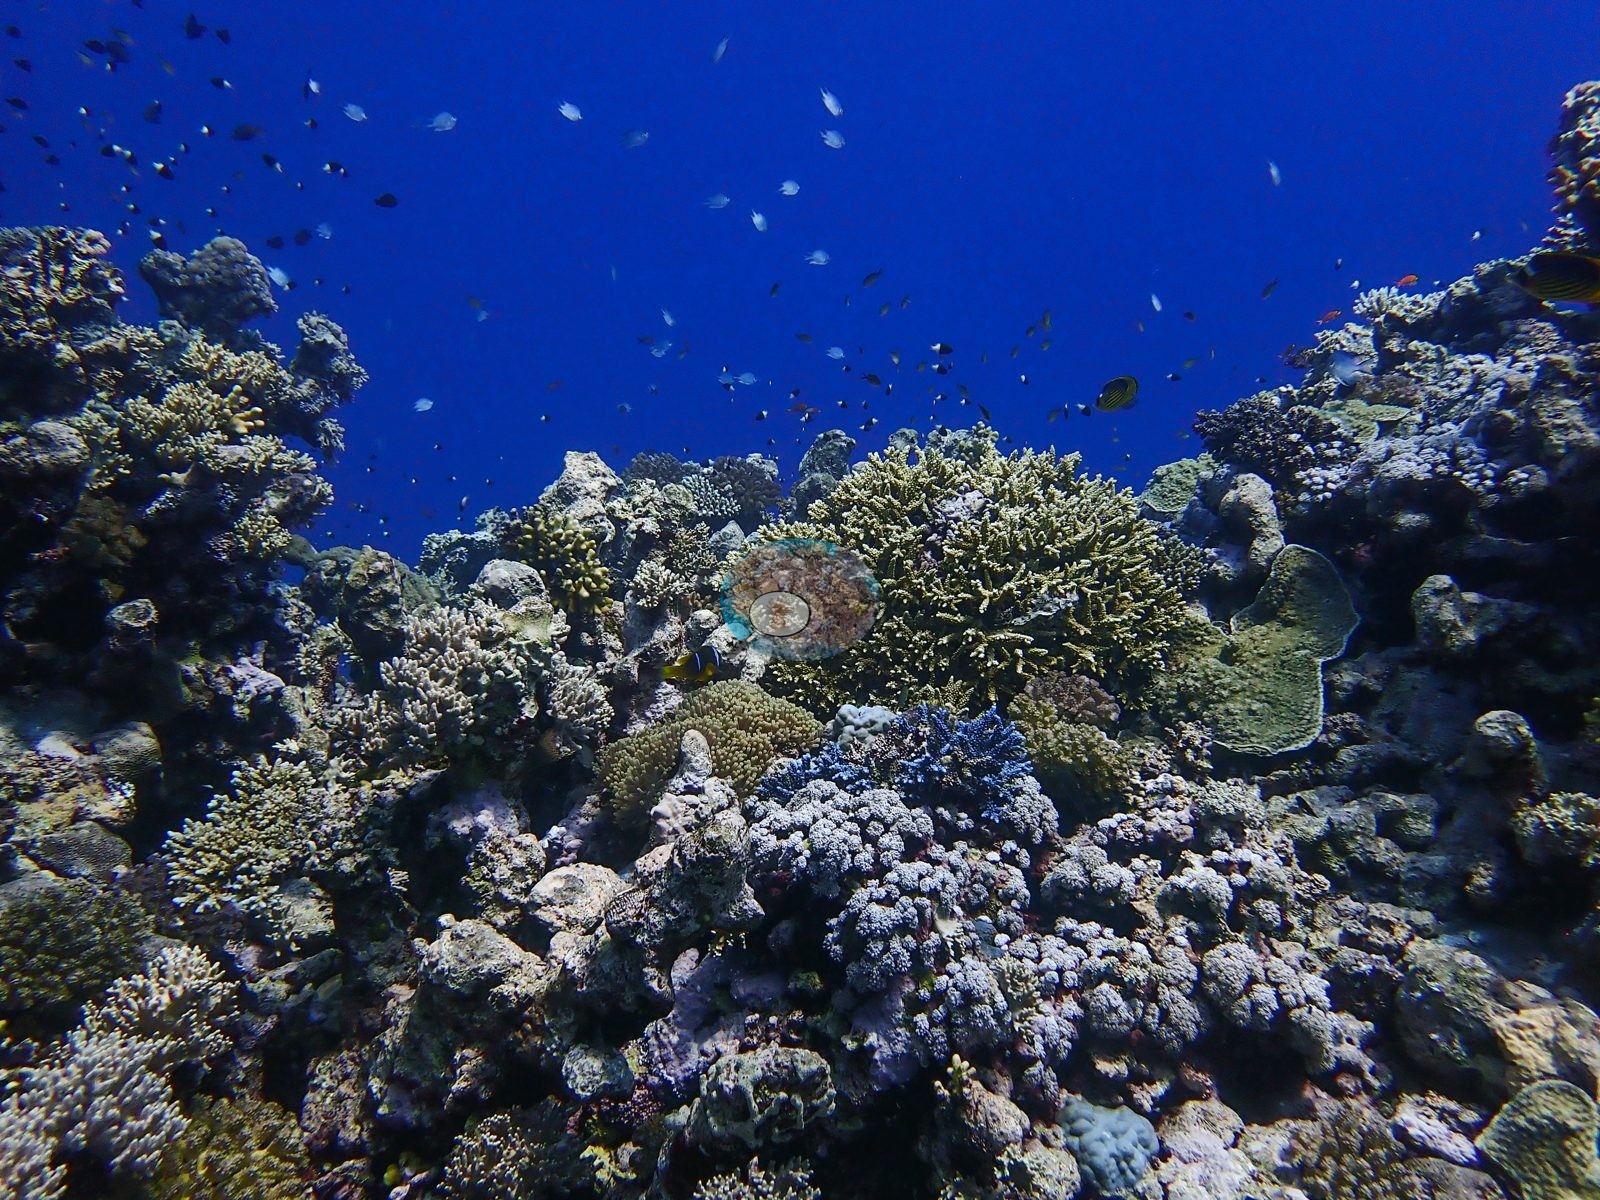
The reef has two faces. The April frames show a steep, densely built slope: lavender and purple pocilloporids, corymbose and table Acropora, knobby Porites, small faviids, and encrusting growth packed close, with red anthias in clouds over it and black wire corals springing off the edge into blue water (e.g., Image 1, Image 3, Image 4, Image 5, Image 6, Image 7, Image 8, Image 9).
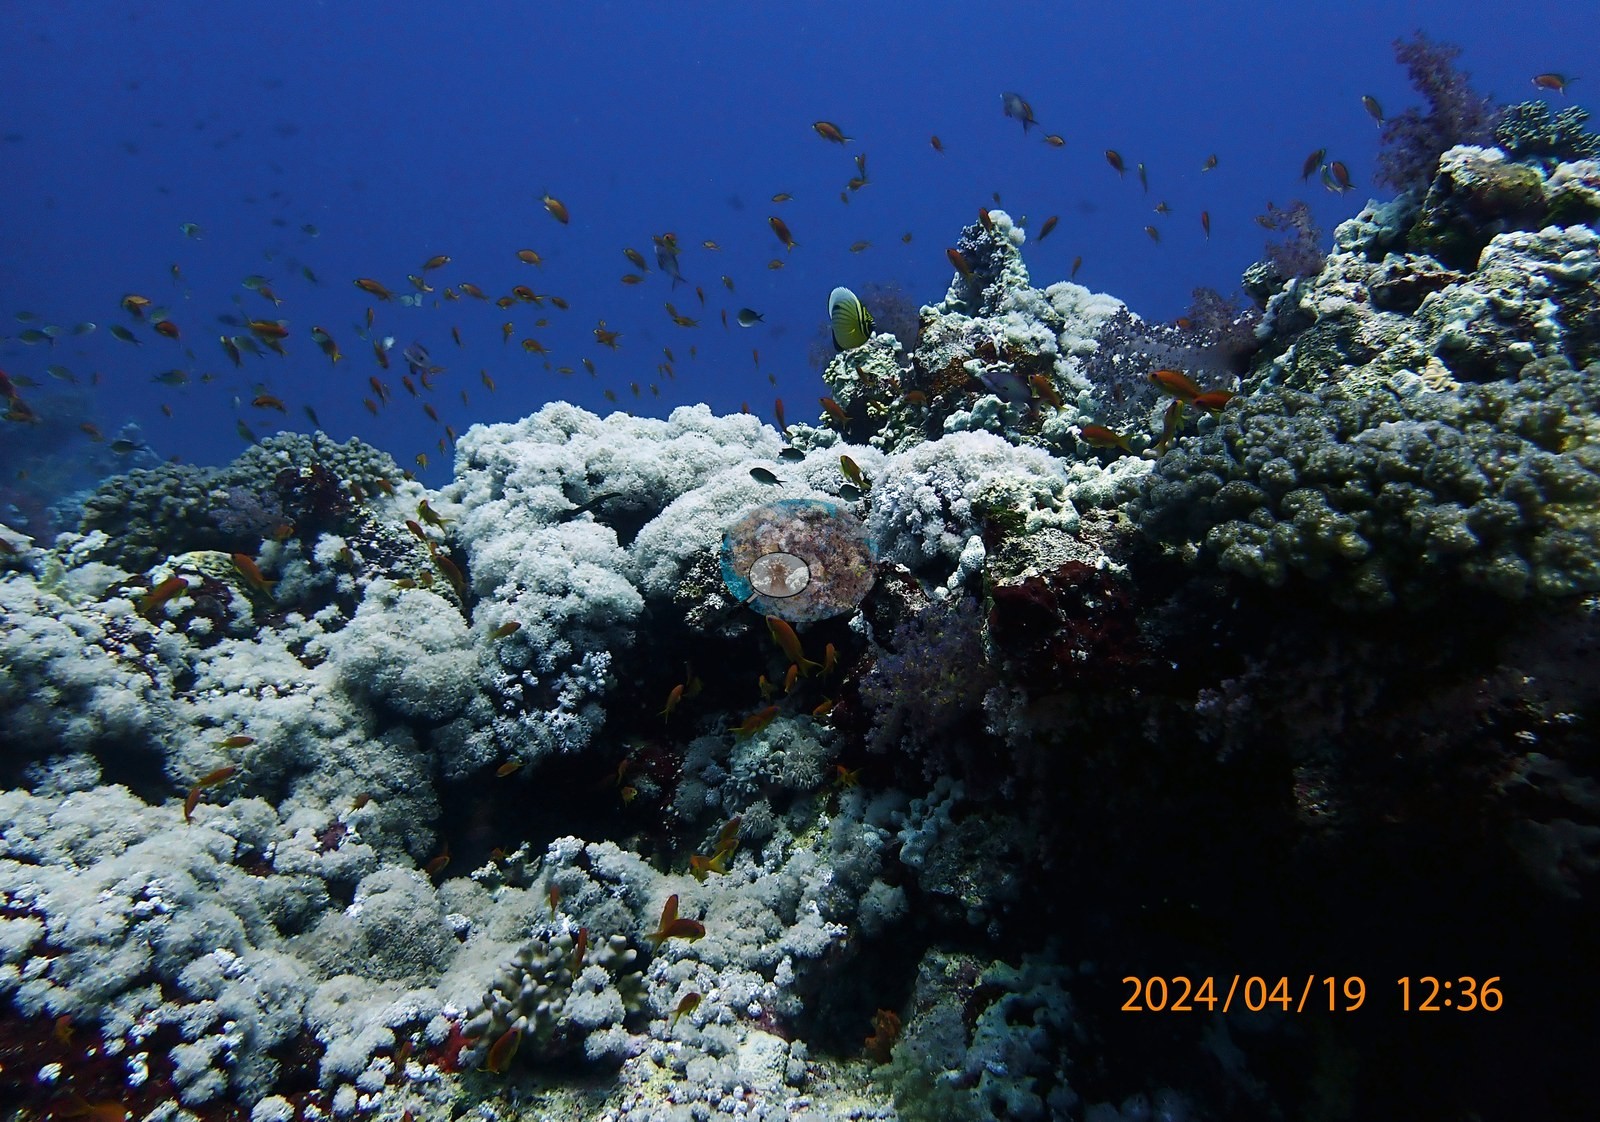
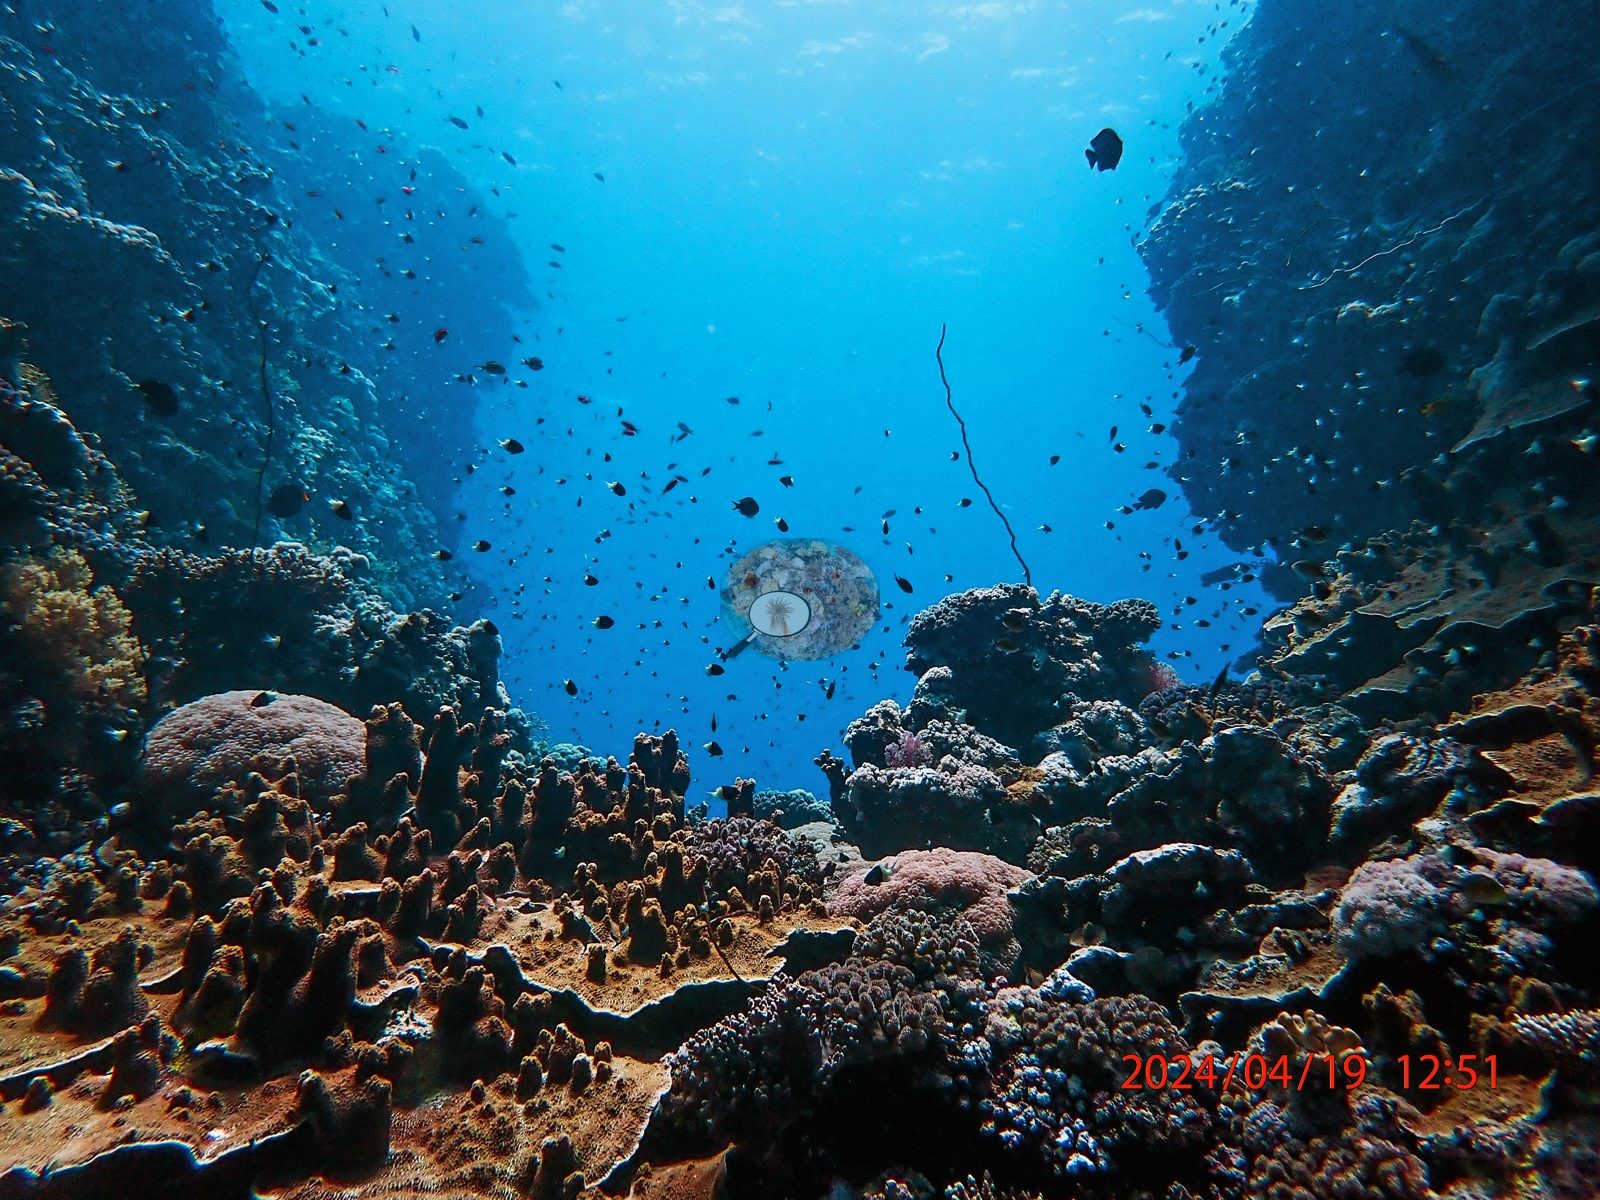
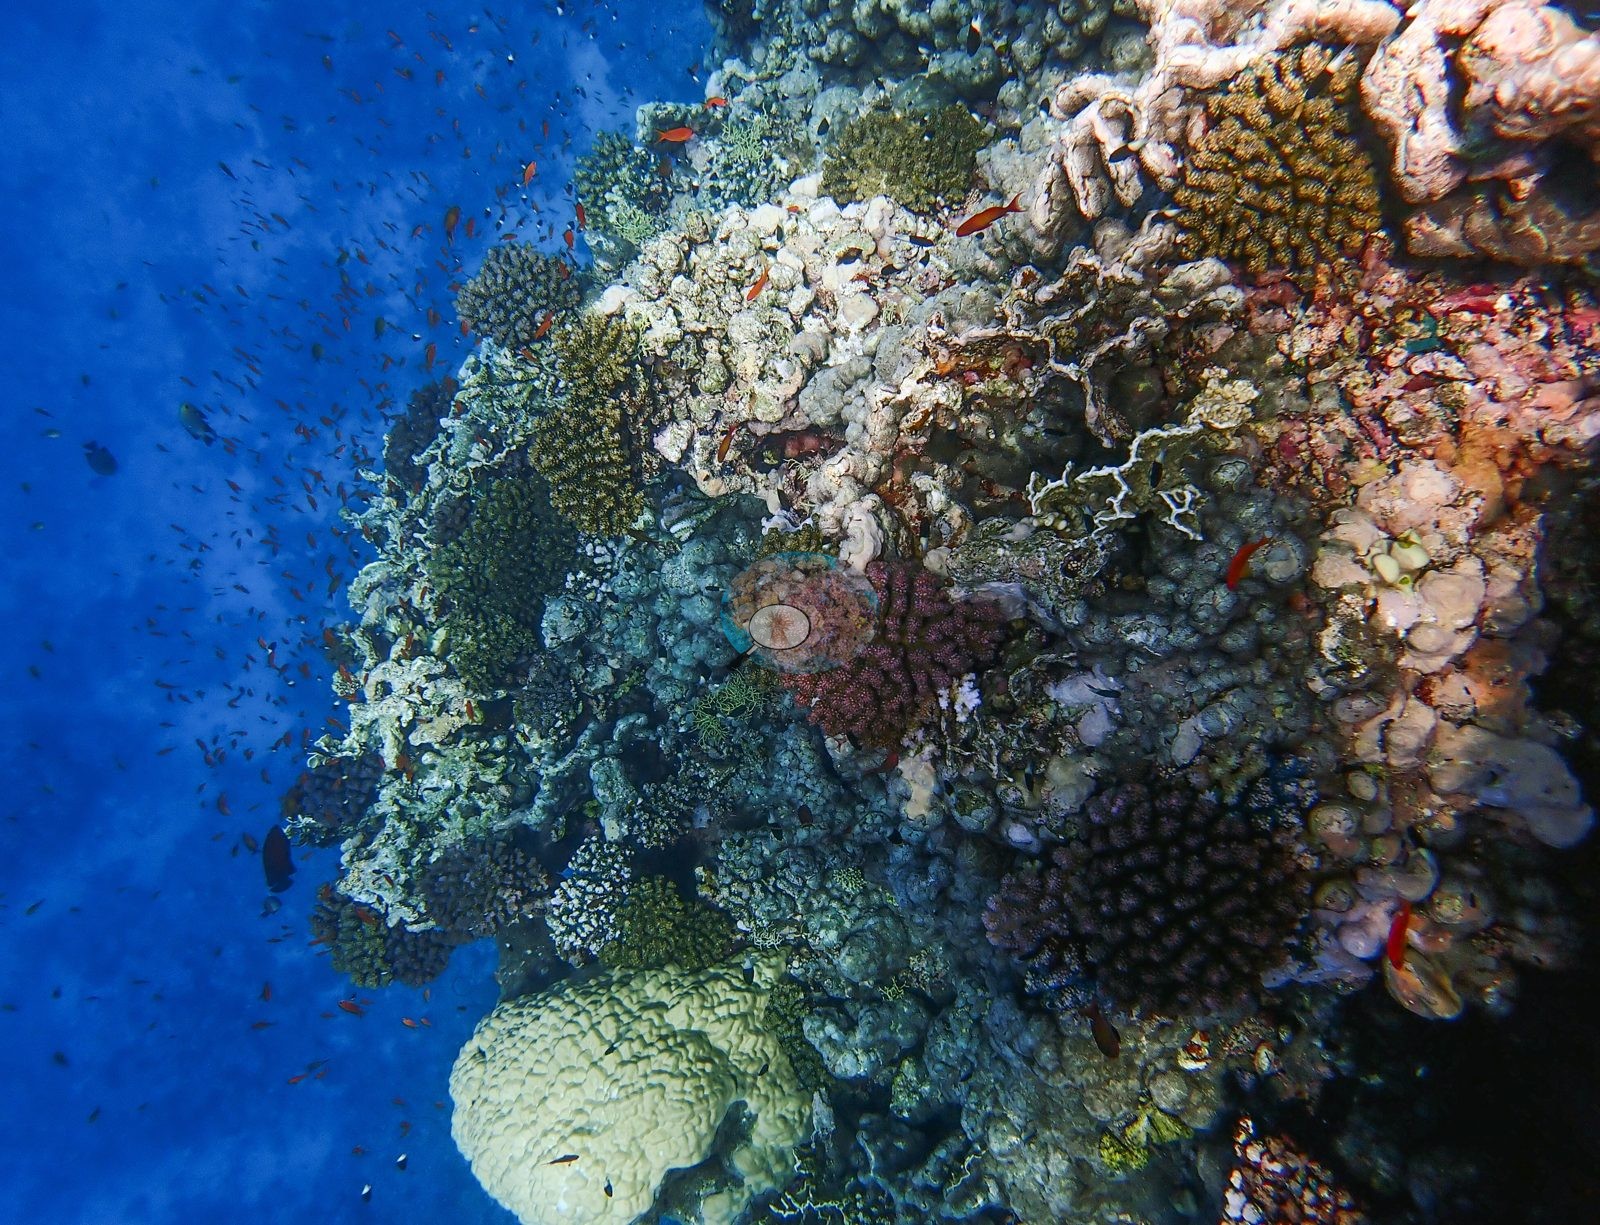
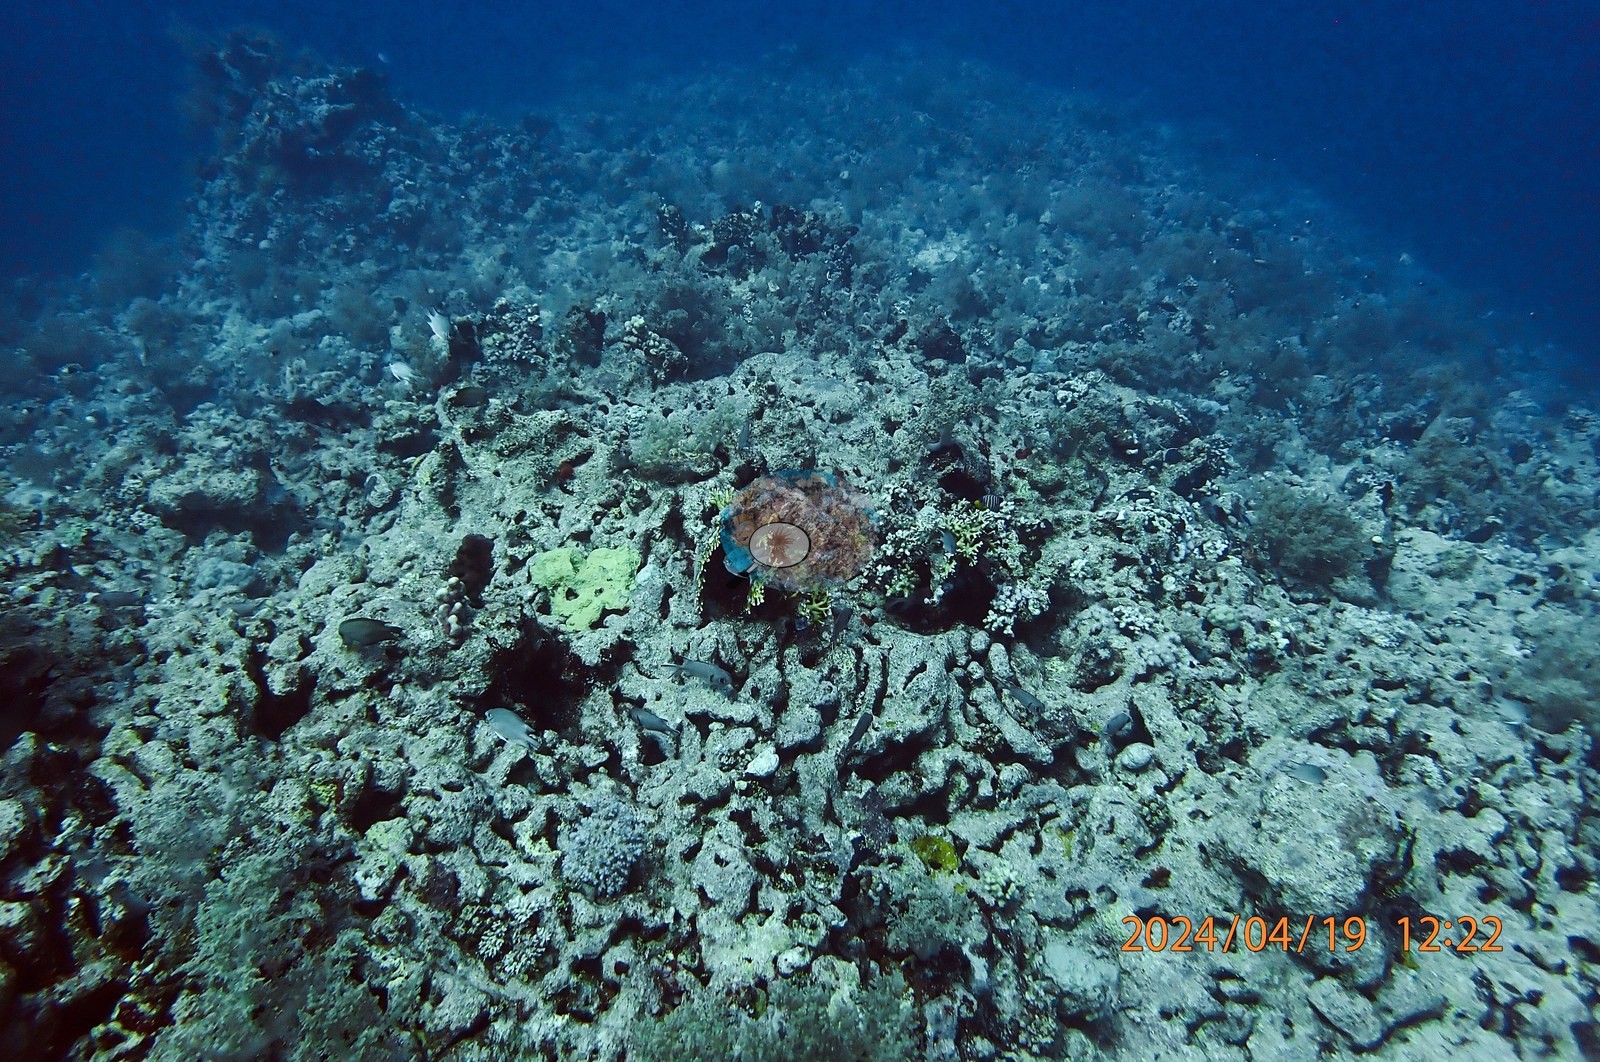
The August frames show something flatter and barer — a broad, low reef top of algal-turfed pavement and rubble with only scattered small colonies, a diver hanging above it, and a loose group of larger fish drifting past — and a deeper channel running between two reef walls, wire corals along both sides, fish stacked in the gap.
Coral cover
Site-level coral cover is 16.6% ± 13.8 across 326 photographs, quoted verbatim from Mayfield, A.B. (2025) Environments 12:248 — Red Sea 2023-24 bleaching; CoralNet point annotation, Appendix A — a manual, diver-annotated CoralNet point count from Anderson's own published work, not a computer vision output and not recomputed here. The site record carries the two photographed visits separately: 17% cover with 27.7% of coral tissue bleached in April 2024 at zero DHW and 26.5°C, and 16% cover with 26.6% bleached in August 2024 at 14.2°C-weeks and 33.5°C.
Stressors
Remarkably little moved between a cool spring dive and one taken inside the 2024 marine heatwave.
Comparisons with other data
No independent survey was made at this exact site; the nearest ones are listed in the table below.
Survey summary
Mr. Umluj: surveyed 2 times in the published dataset, Apr 2024–Aug 2024 (an earlier dive on 7 Oct 2023 is in the dive record but was not among the analyzed surveys) (CoralNet point counts; Mayfield 2025, Environments 12:248). Surveyed in partnership with Umluj Dive Center.
Dive history
Coral bleached: computer-vision (CoralNet) estimate from the survey images, per dive, as published in Mayfield (2025, Environments 12:248), Supplementary File S1.
| Date | Time in | Max depth (m) | Bottom time (min) | Coral bleached (%) |
|---|---|---|---|---|
| 2024-04-19 | — | — | — | 27.7 |
| 2024-08-09 | — | — | — | 26.6 |
Independent surveys nearby
 Coral Reef Diagnostics survey
Within 5 km, 2 independent survey stations recorded hard coral cover in 2015. The most recent nearby survey is from 2015, so these values predate recent heat stress. This site's own pooled estimate (17%) sits 25.4 points below the range of these surveys (42–50%); the methods differ, so the comparison is context, not a like-for-like test.
Collected by other programs using different methods, so these are context for the figures above, not a like-for-like comparison. Where a station was surveyed more than once the range is shown. Station names are not dive-site names.
| Agency | Site / location | Date | Hard coral cover (%) | Distance | Link |
|---|---|---|---|---|---|
| Aeby et al. (2021) | Yanbu 2 | 2015 | 42% | 3.78 km | HeatCRD database |
| Aeby et al. (2021) | Yanbu 3 | 2015 | 50% | 4.22 km | HeatCRD database |
Data & links
- CoralNet image repository for this region ↗
- HeatCRD database ↗
- (reference) ↗
- Photo portfolio ↗
- Coral Reef Diagnostics country page ↗
All images from Coral Reef Diagnostics. Data are from Coral Reef Diagnostics and the organizations named in the data-sources table above.
© Coral Reef Diagnostics.
References
- Aeby GS, Shore A, Jensen T, Ziegler M, Work T, Voolstra CR (2021). A comparative baseline of coral disease in three regions along the Saudi Arabian coast of the central Red Sea. PLOS ONE 16:e0246854. PDF
- Mayfield AB (2025). Using Tourist Diver Photos to Assess the Effects of Marine Heatwaves on Central Red Sea Coral Reefs. Environments 12:248. PDF