
Saudi Red Sea - Cement Wreck (Thuwal)
Part of the regional summaries: Saudi Arabia - Jeddah / KAUST (Thuwal) / Rabigh, Saudi Arabia, and Red Sea
2024-04-27
2024-07-26
More info
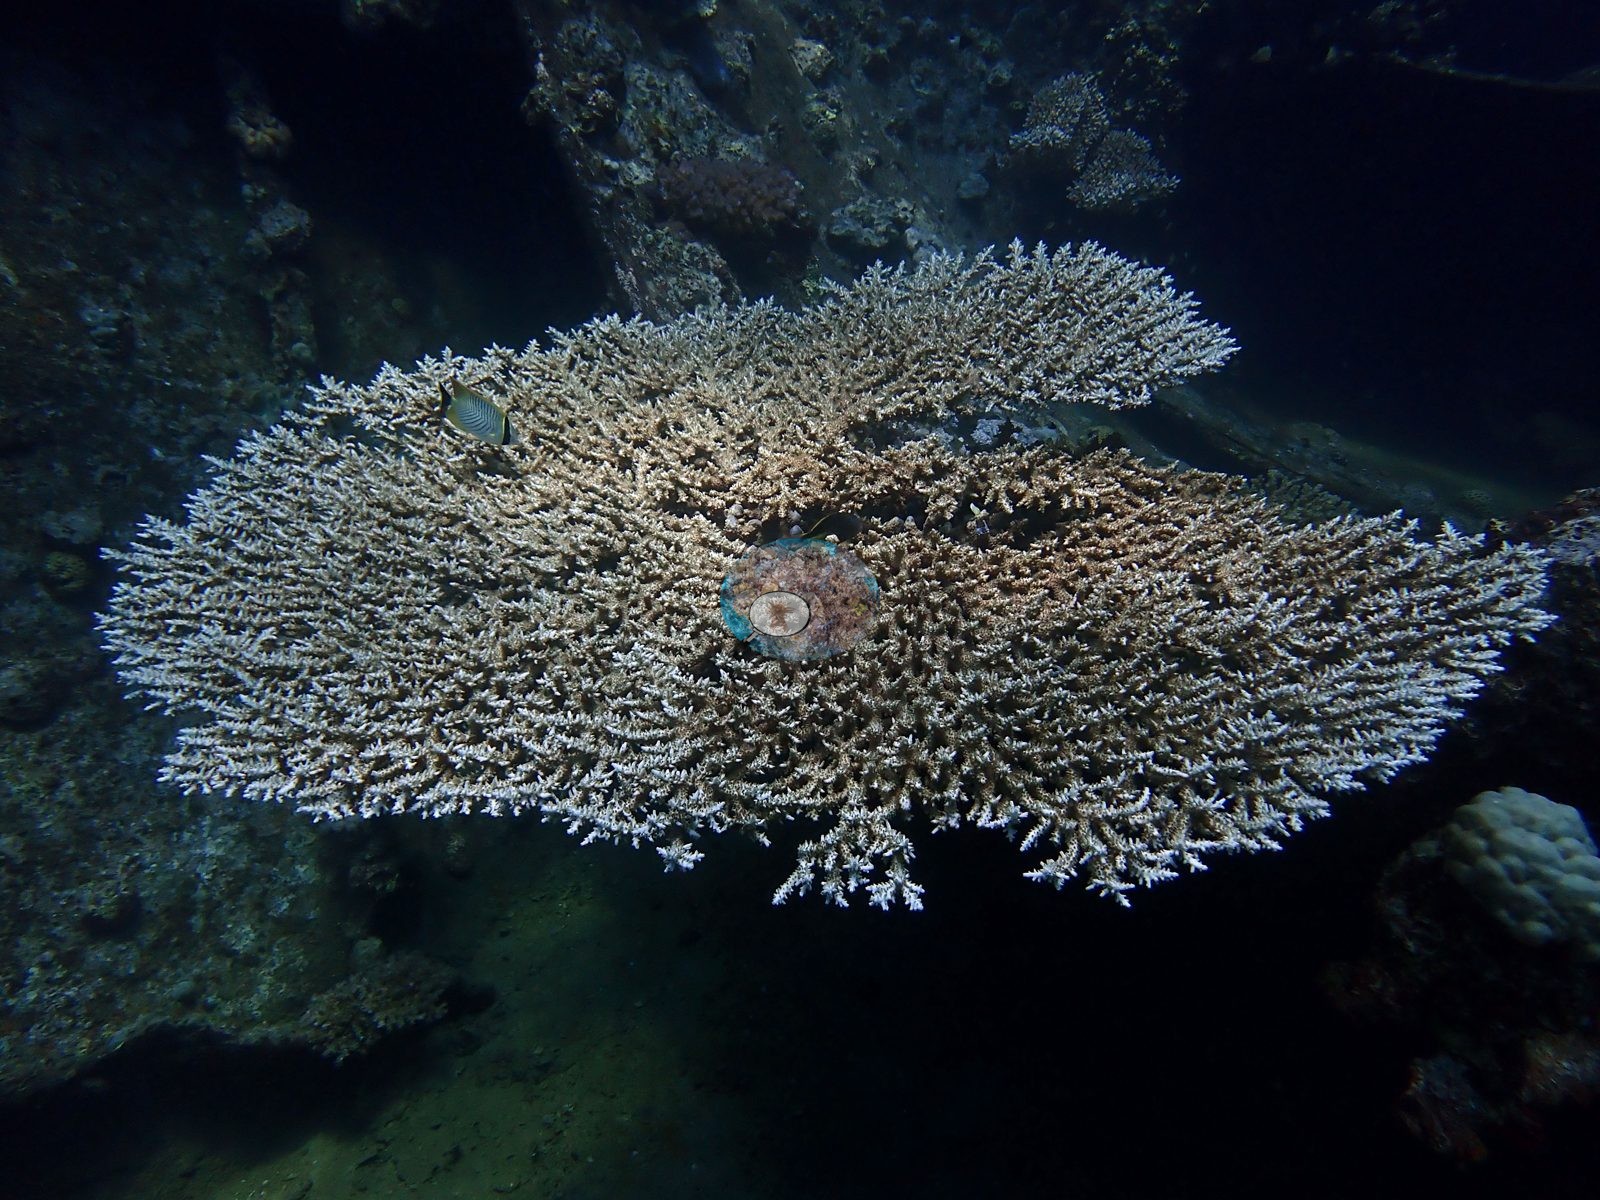
Makkah-Madine Saudi Arabia (NOAA CRW virtual station) · Northern and Central Red Sea ecoregion mean=12.2°C-heating weeksCement Wreck pairs a low-cover steel shipwreck - its hull colonized only patchily by coralline algae, sponges, and scattered small corals - with a steeper natural reef slope beside it carrying Porites boulders, a large Diploastrea heliopora colony (a third of its surface long dead and recolonized, not fresh damage), and tabulate Acropora. Across three visits (Sept 2023, April 2024, July 2024) cover ran 10-16% with bleaching from 18.7% to 32.0% of coral tissue, tracking the site's exposure to Red Sea thermal-stress events; a blue-spotted ribbontail ray sheltering under the hull was a fauna highlight.
يجمع موقع حطام الأسمنت بين حطام سفينة فولاذية منخفض الغطاء — لم تستوطن هيكله سوى الطحالب المرجانية والإسفنجيات ومرجانيات صغيرة متفرقة — ومنحدر شعبة طبيعية أشد انحداراً بجانبه يحمل كتلاً من Porites، ومستعمرة كبيرة من Diploastrea heliopora (ثلث سطحها ميت منذ زمن وأُعيد استيطانه، وليس ضرراً حديثاً)، ومرجان Acropora الطاولي.
ترجمة هذا الملخص بالذكاء الاصطناعي؛ النص الإنجليزي هو المعتمد. Translated from the site’s shorter map summary.
8 of these 9 photographs are shown beside the text that discusses them under "Site description" below.
Site description
Setting
A steel shipwreck lying on sand alongside the Thuwal reef line, dived three times between September 2023 and July 2024 with Coastline (KAUST) and one of the few sites on this map with a per-visit cover series attached to it.
General benthic features
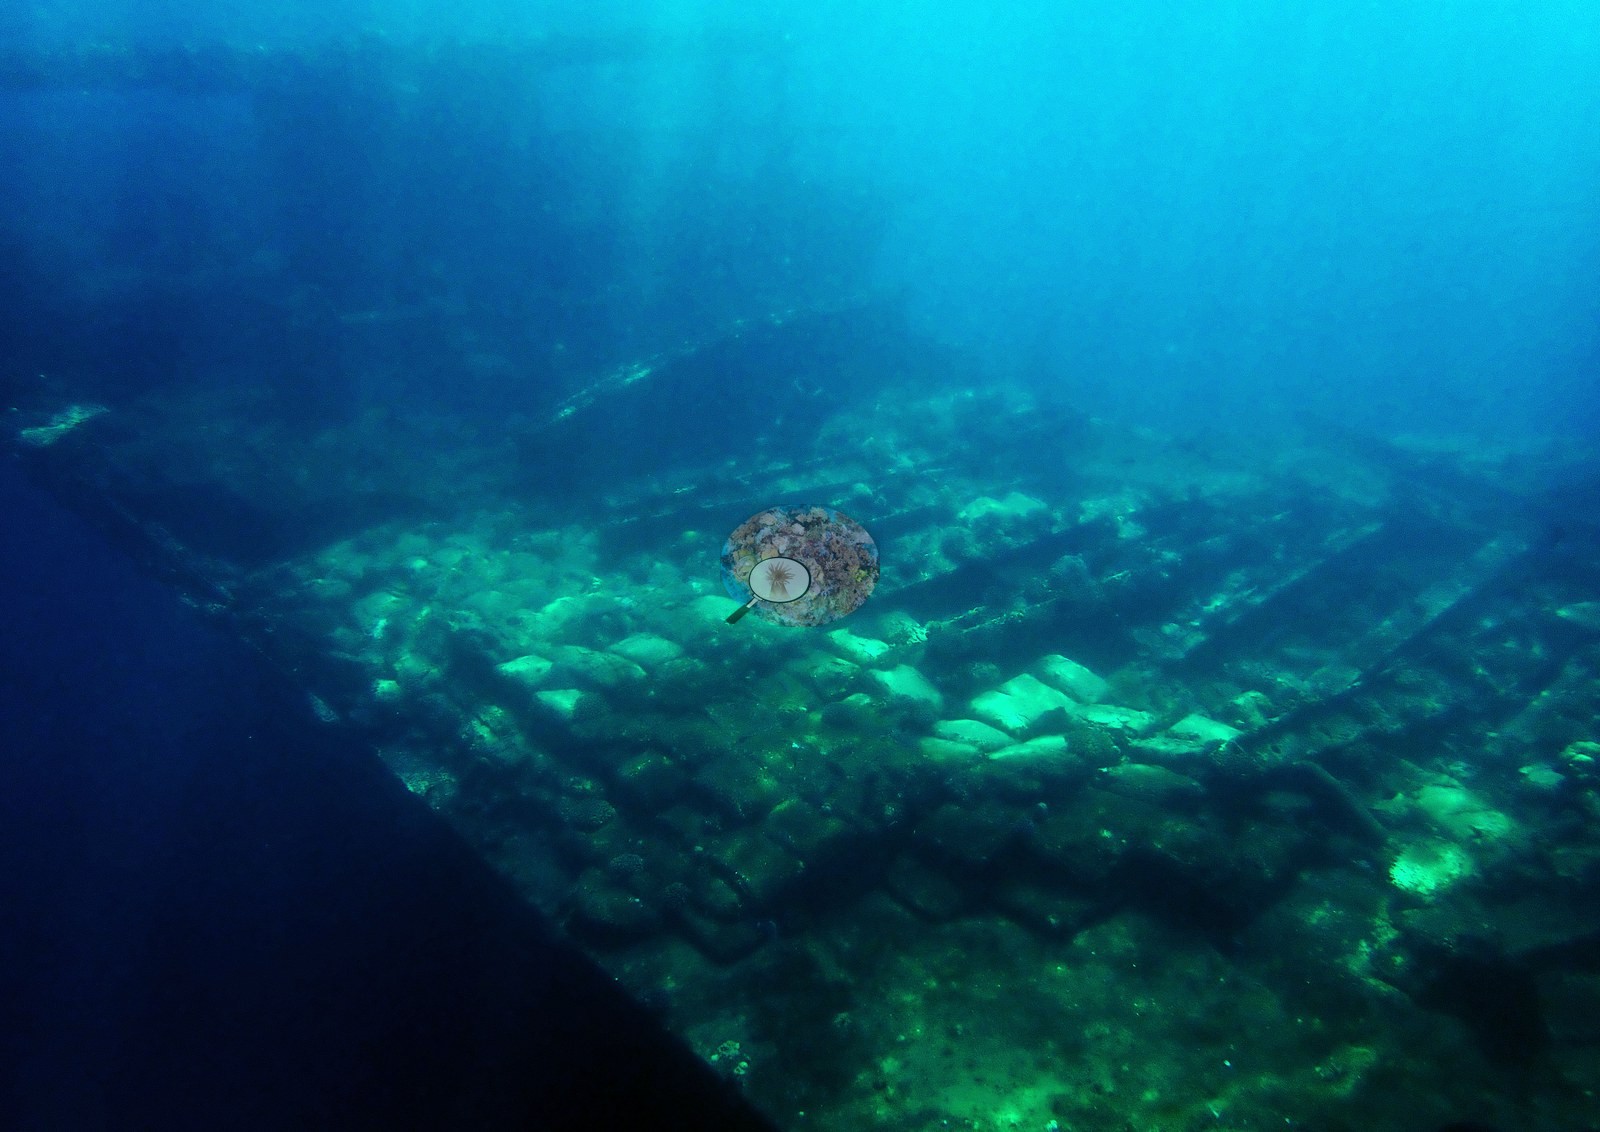
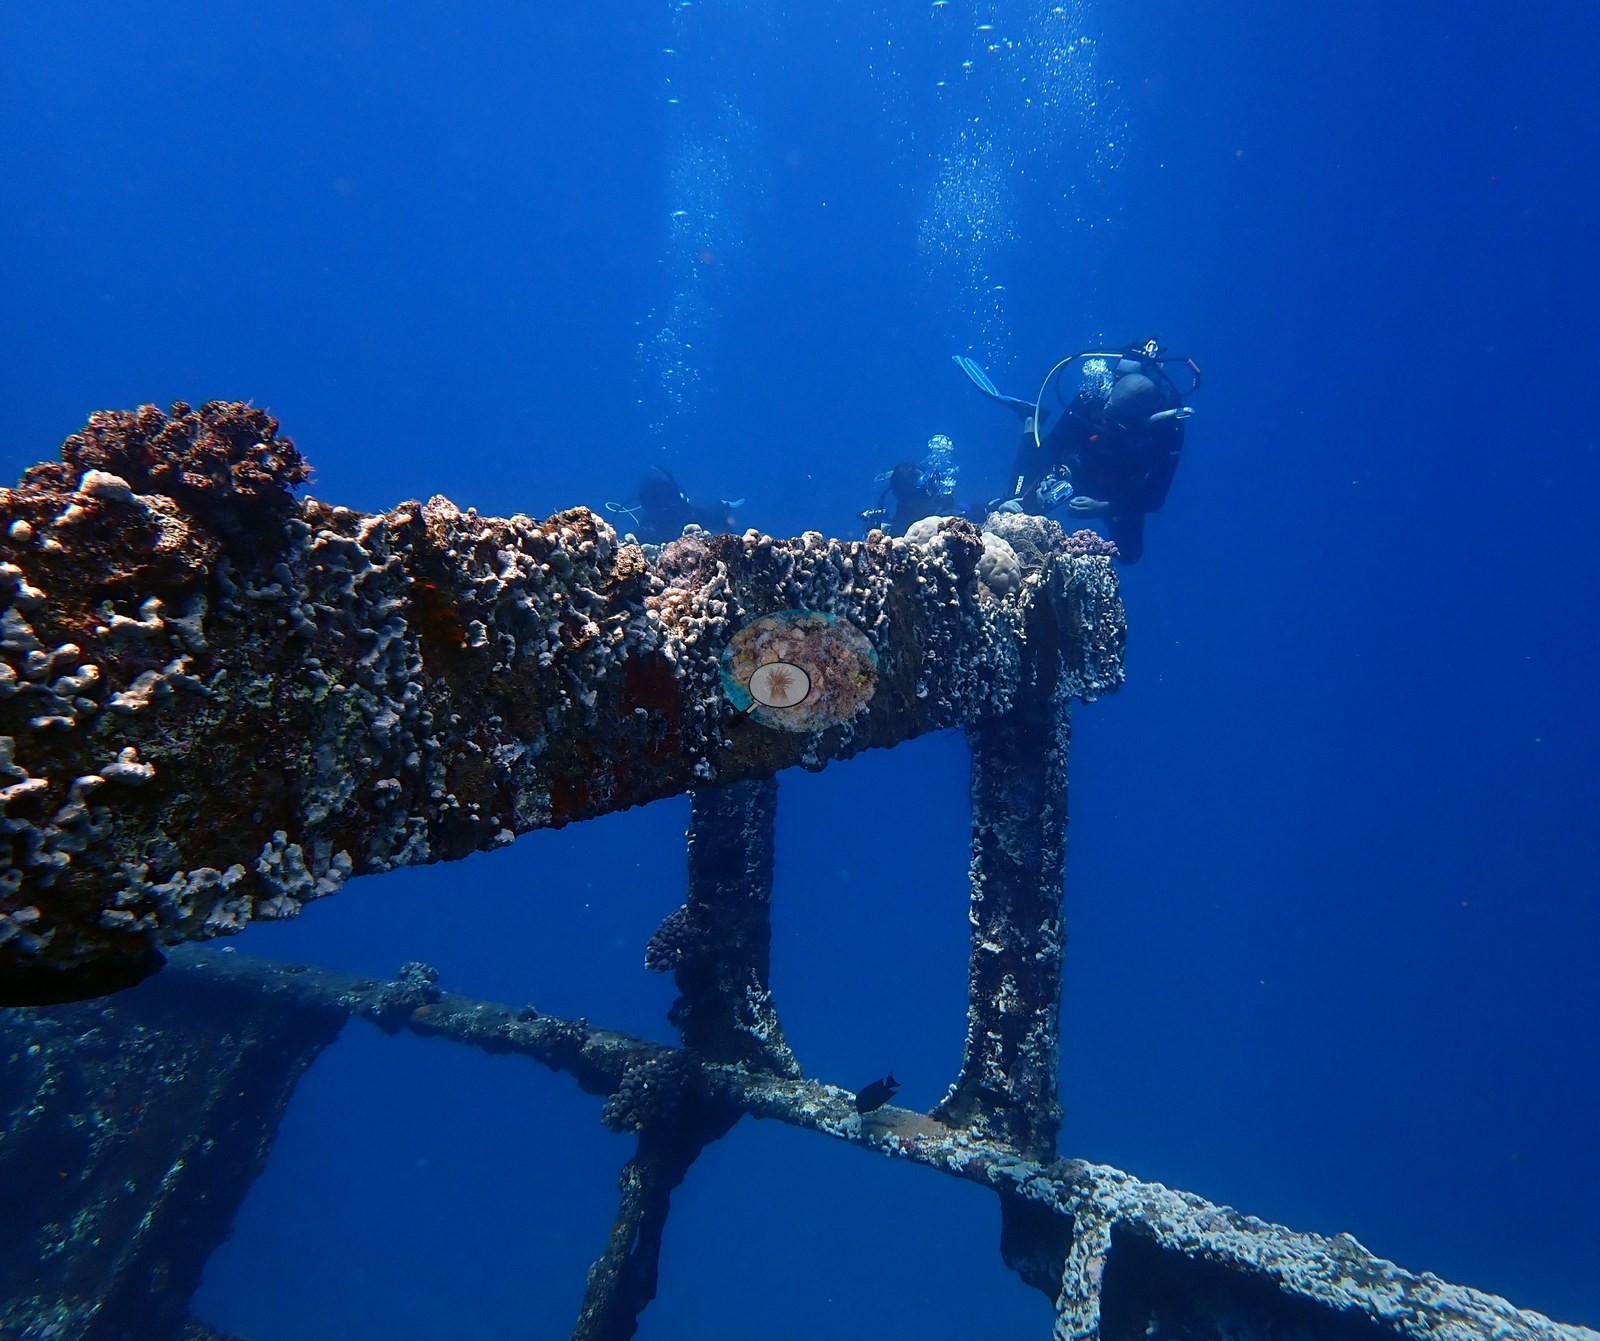
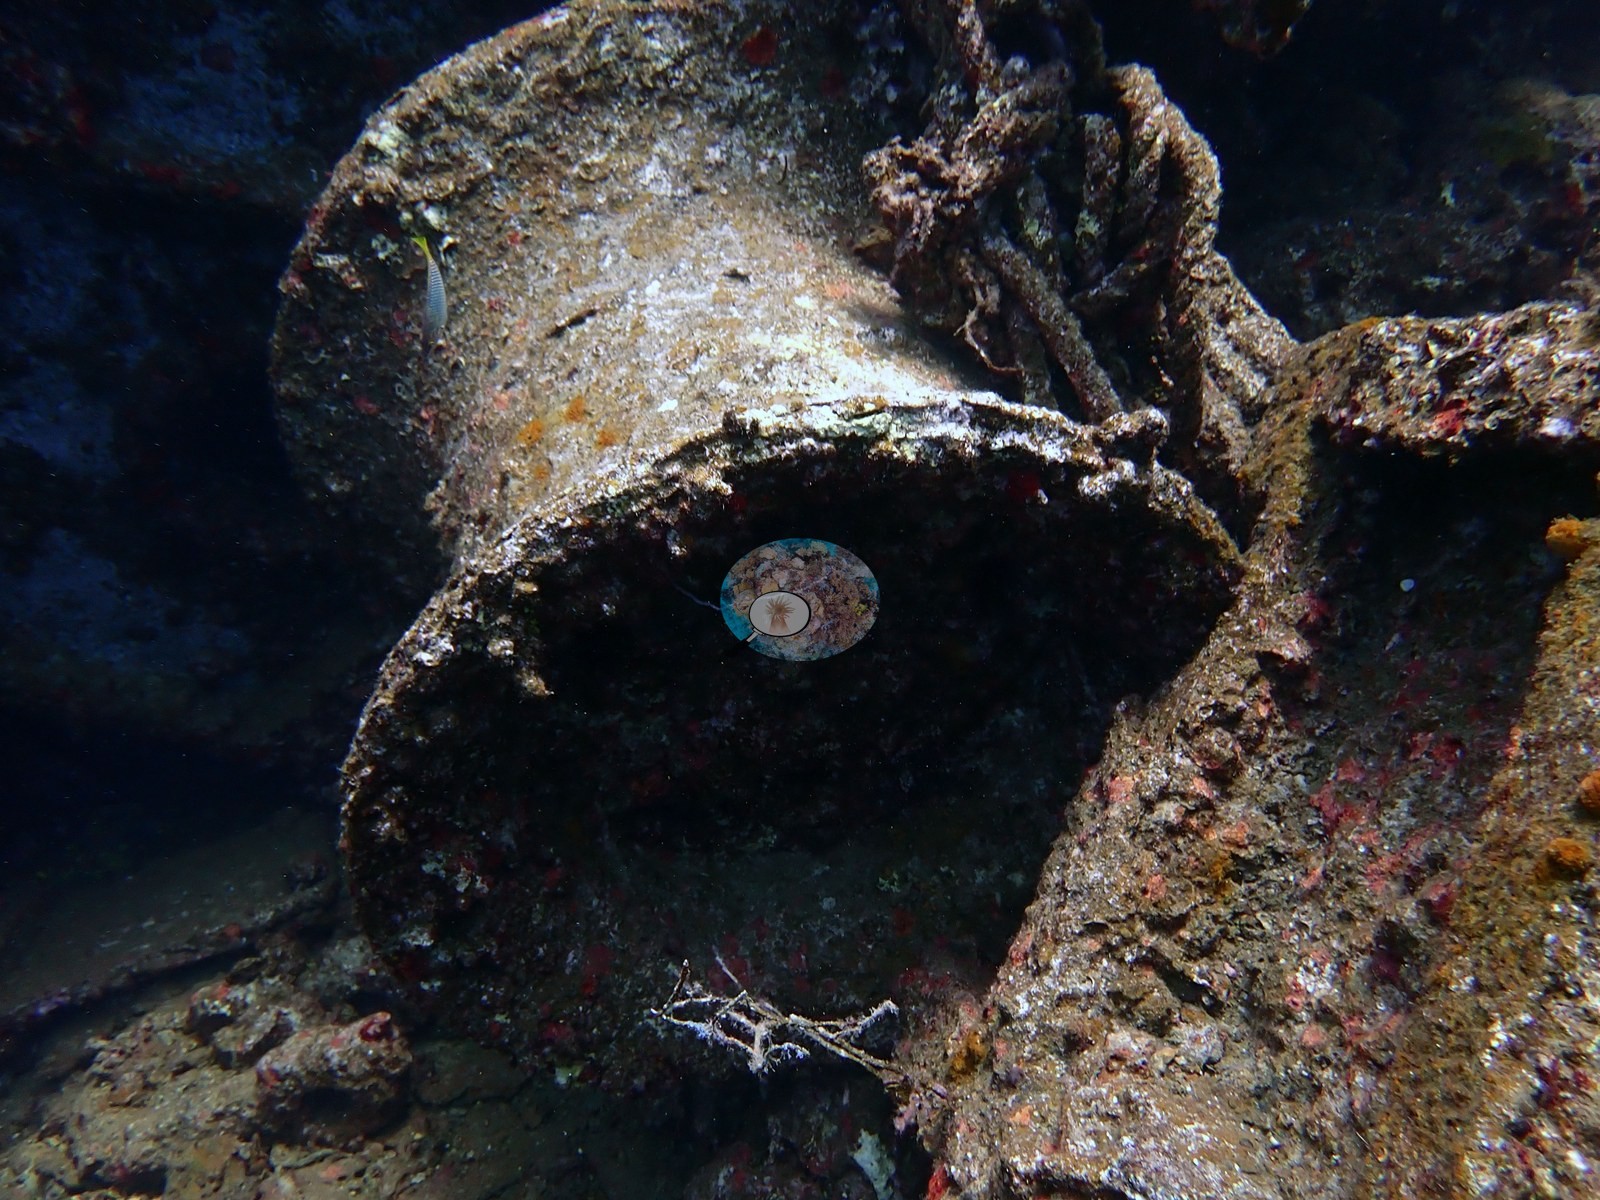
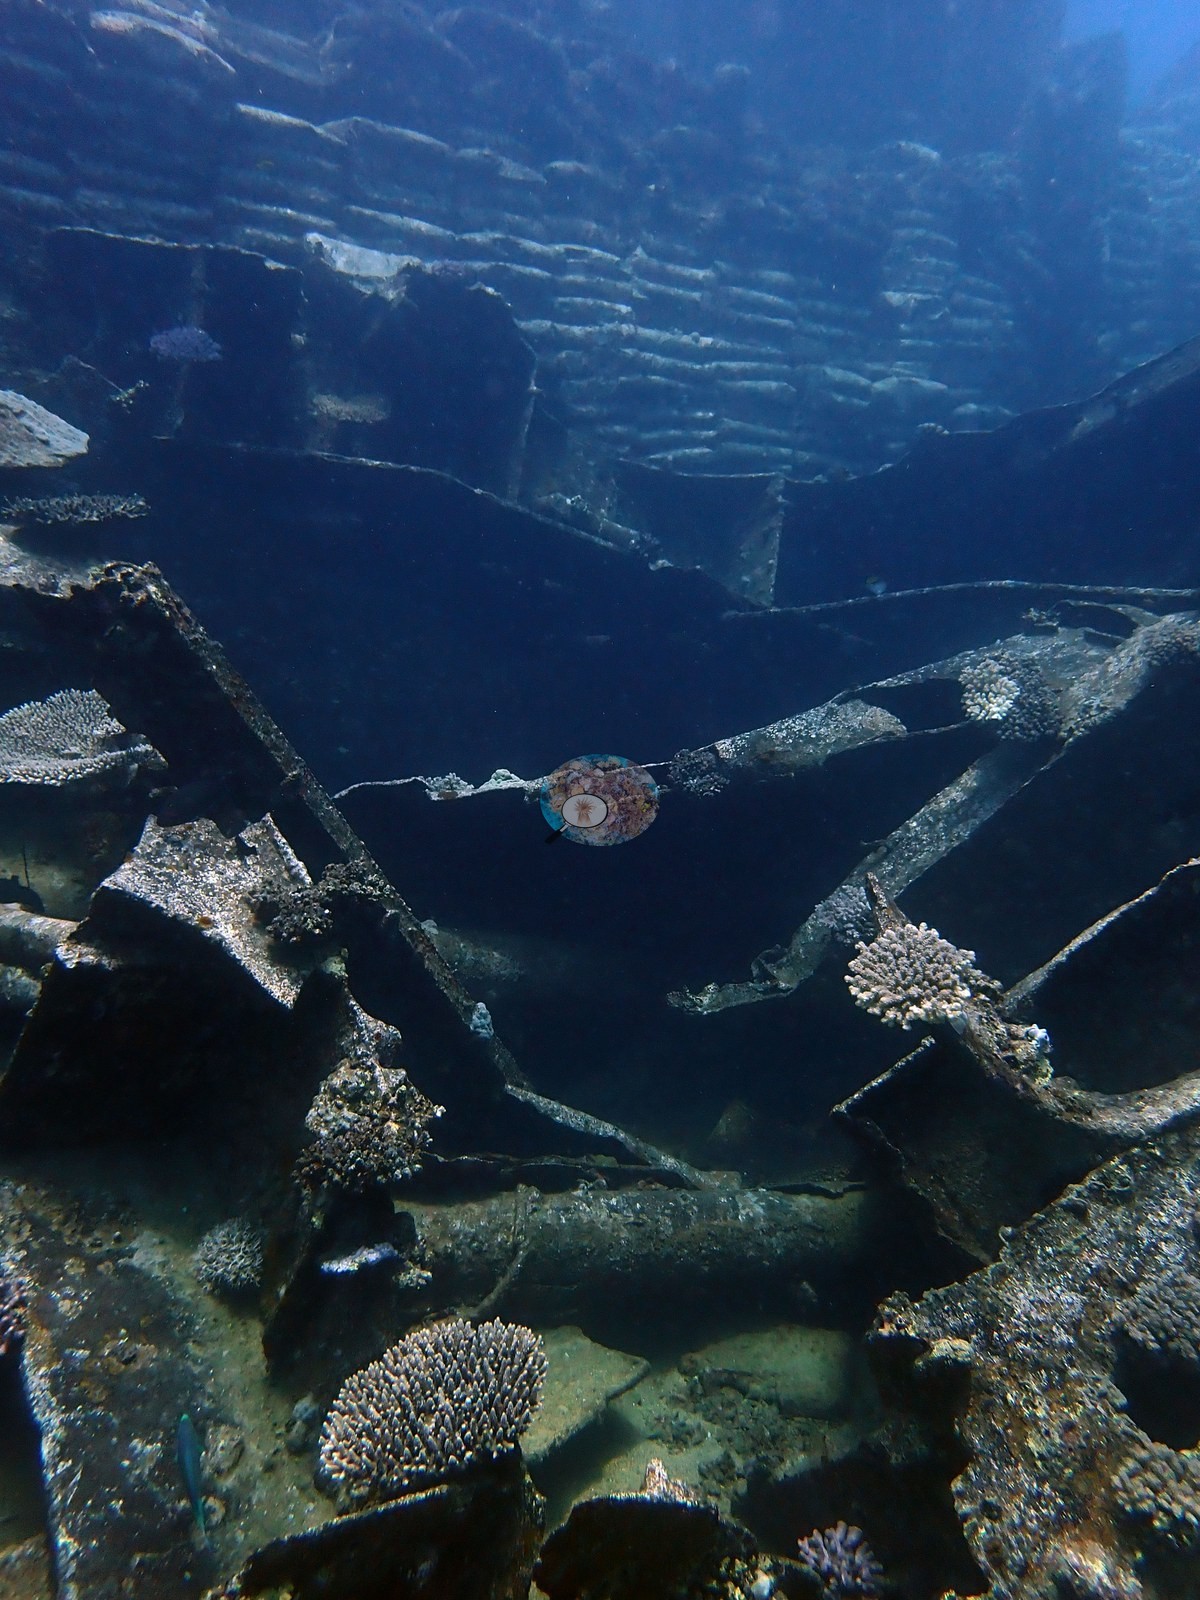
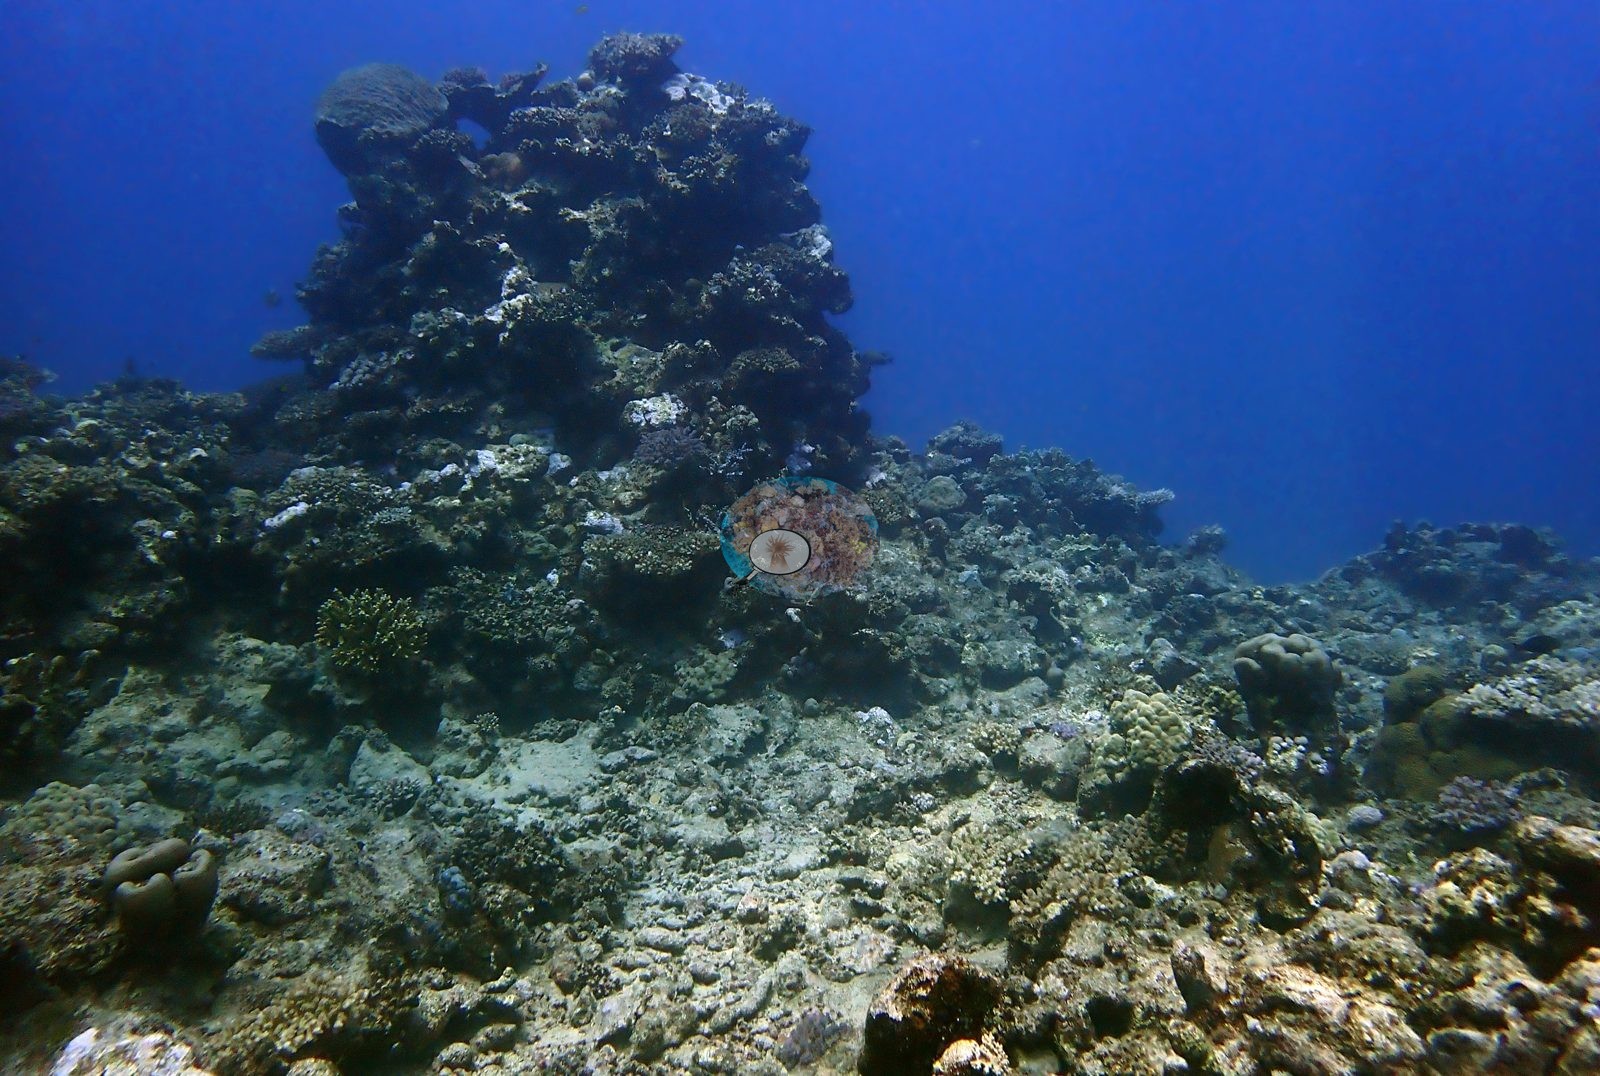
The wreck itself dominates the dive: a substantial iron hull broken along its length, deck beams and bulkheads standing proud of a pale sand bottom, plating rusted to deep red-brown and colonized in patches rather than uniformly — encrusting coralline algae, small sponges, turf, barnacle scars, and scattered small hard corals rather than the dense soft-coral cladding that older Red Sea wrecks often carry (e.g., Image 1, Image 3, Image 4).
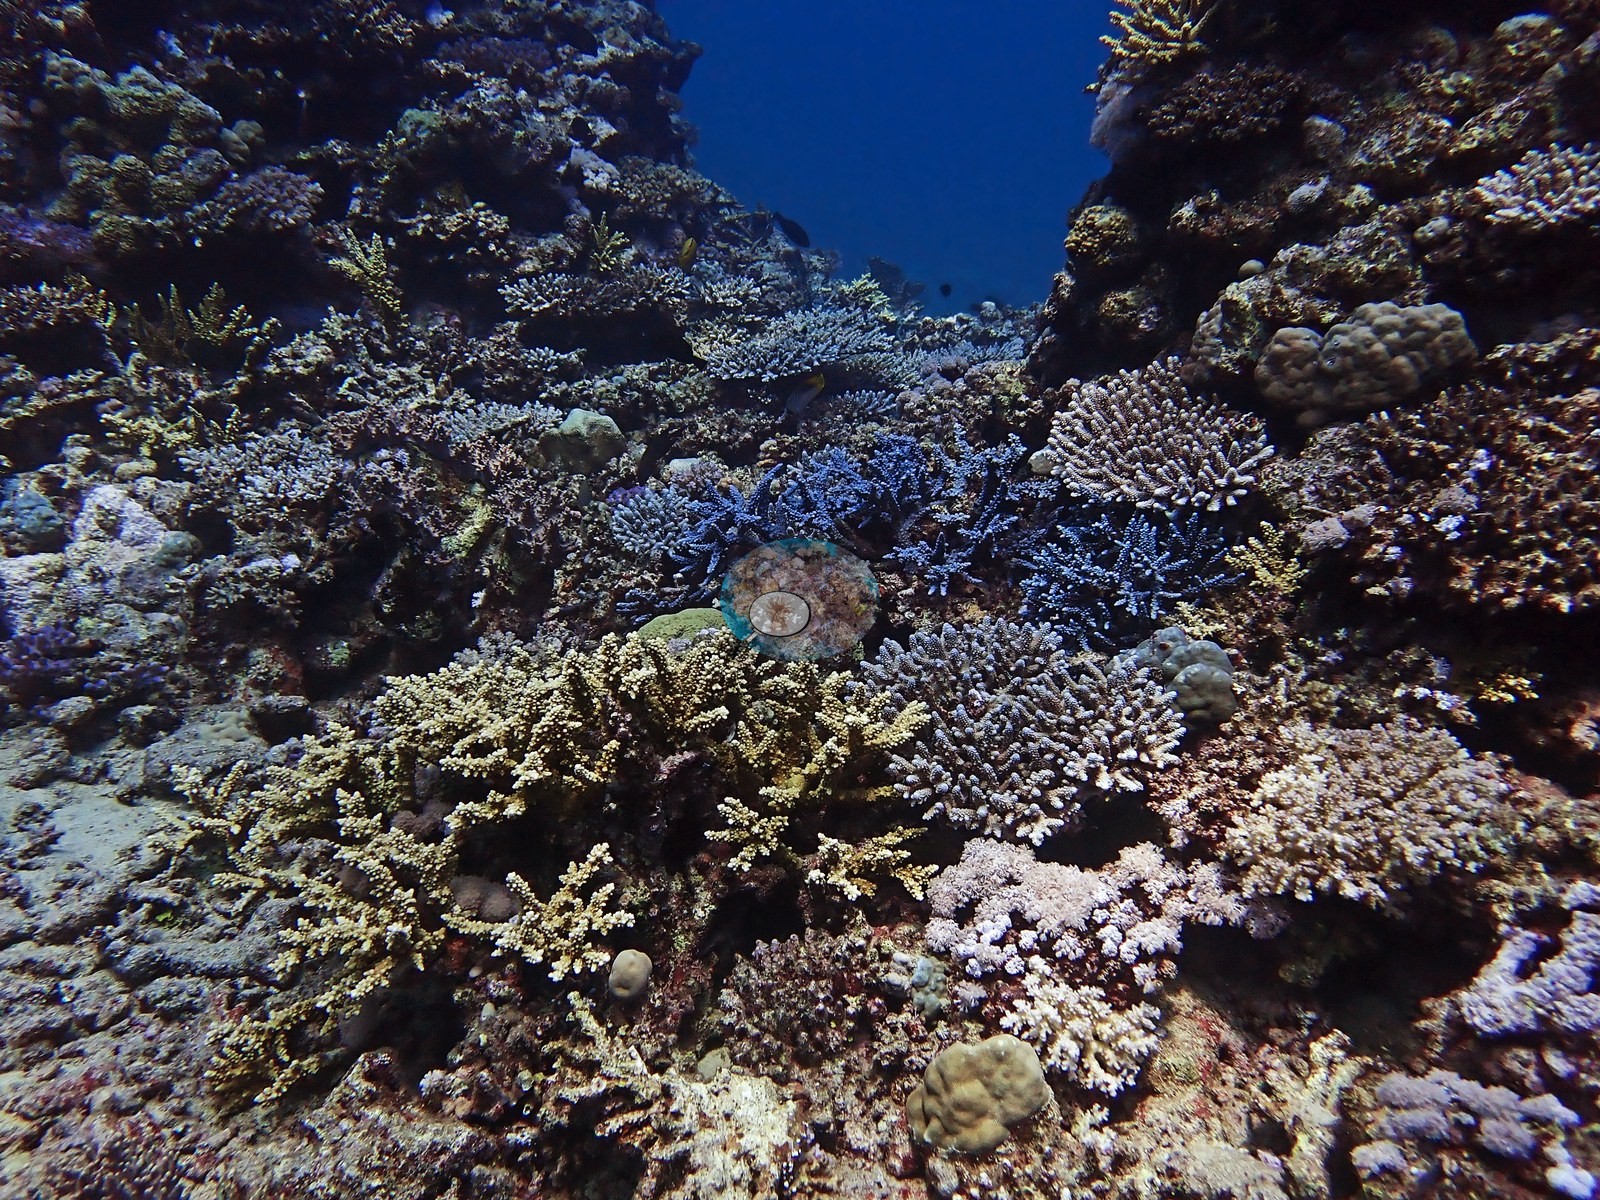
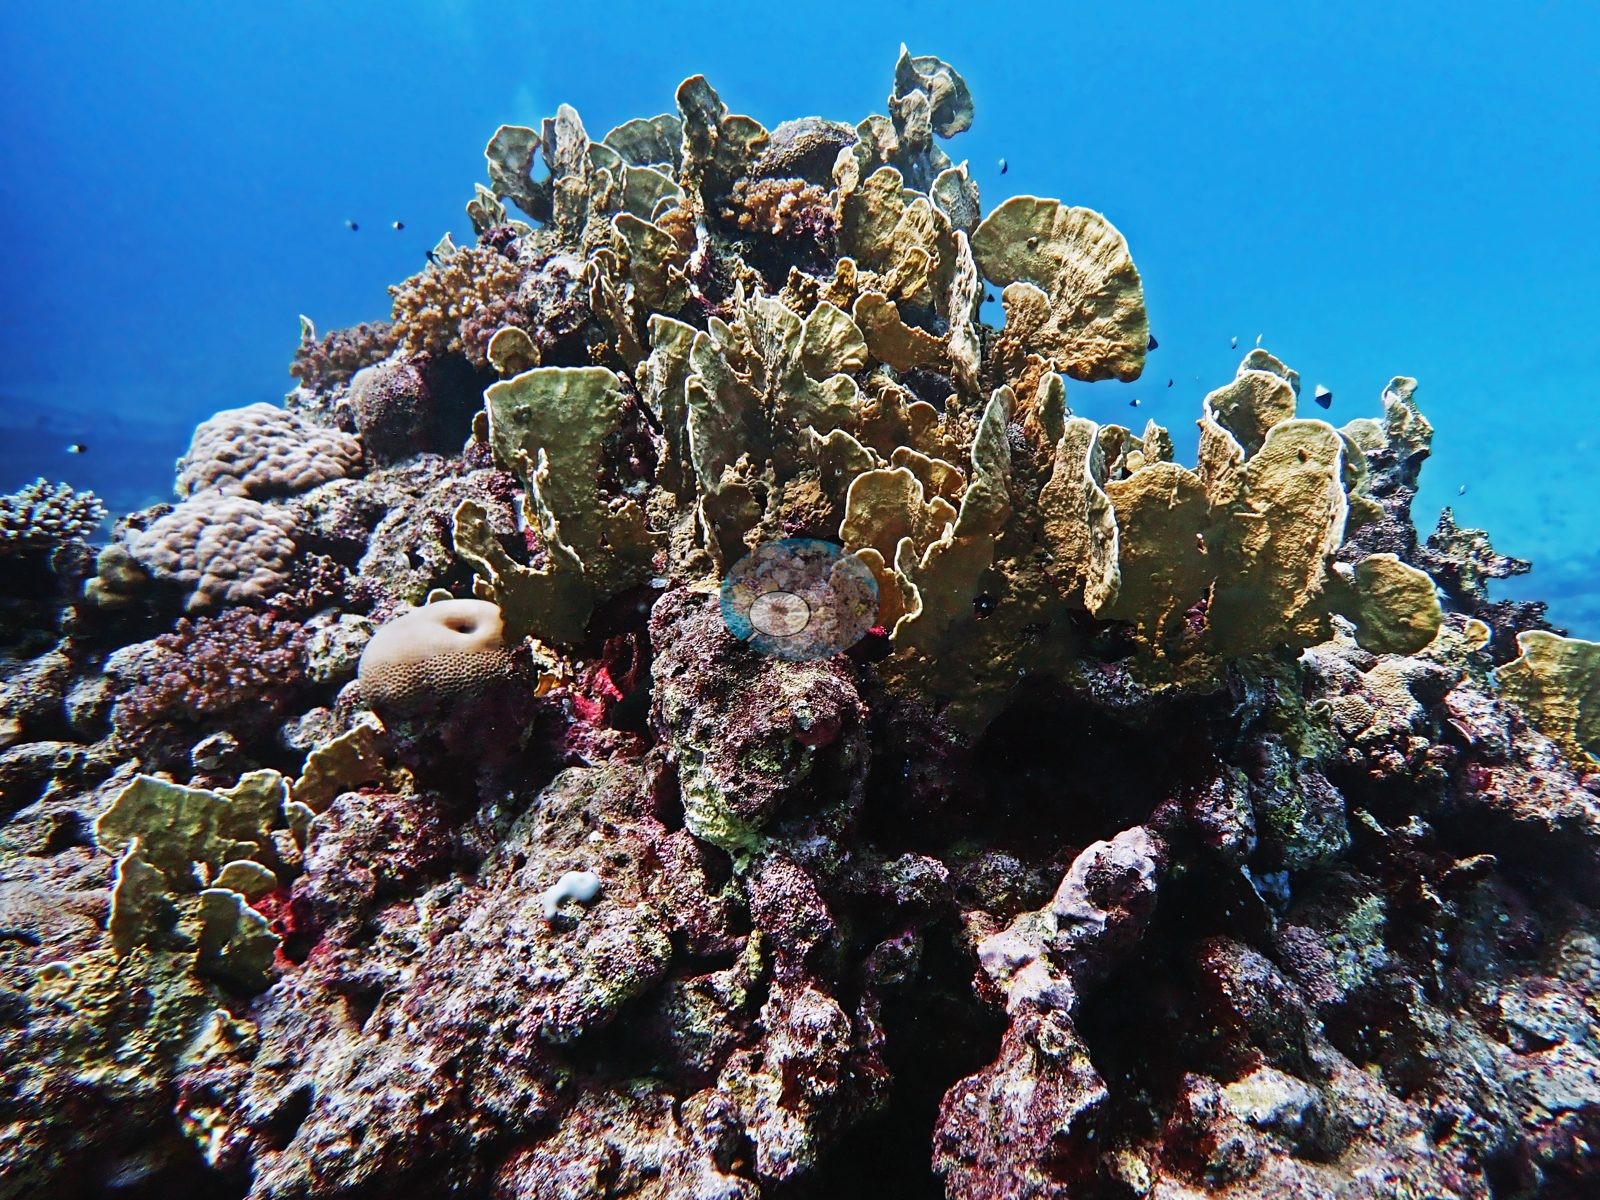
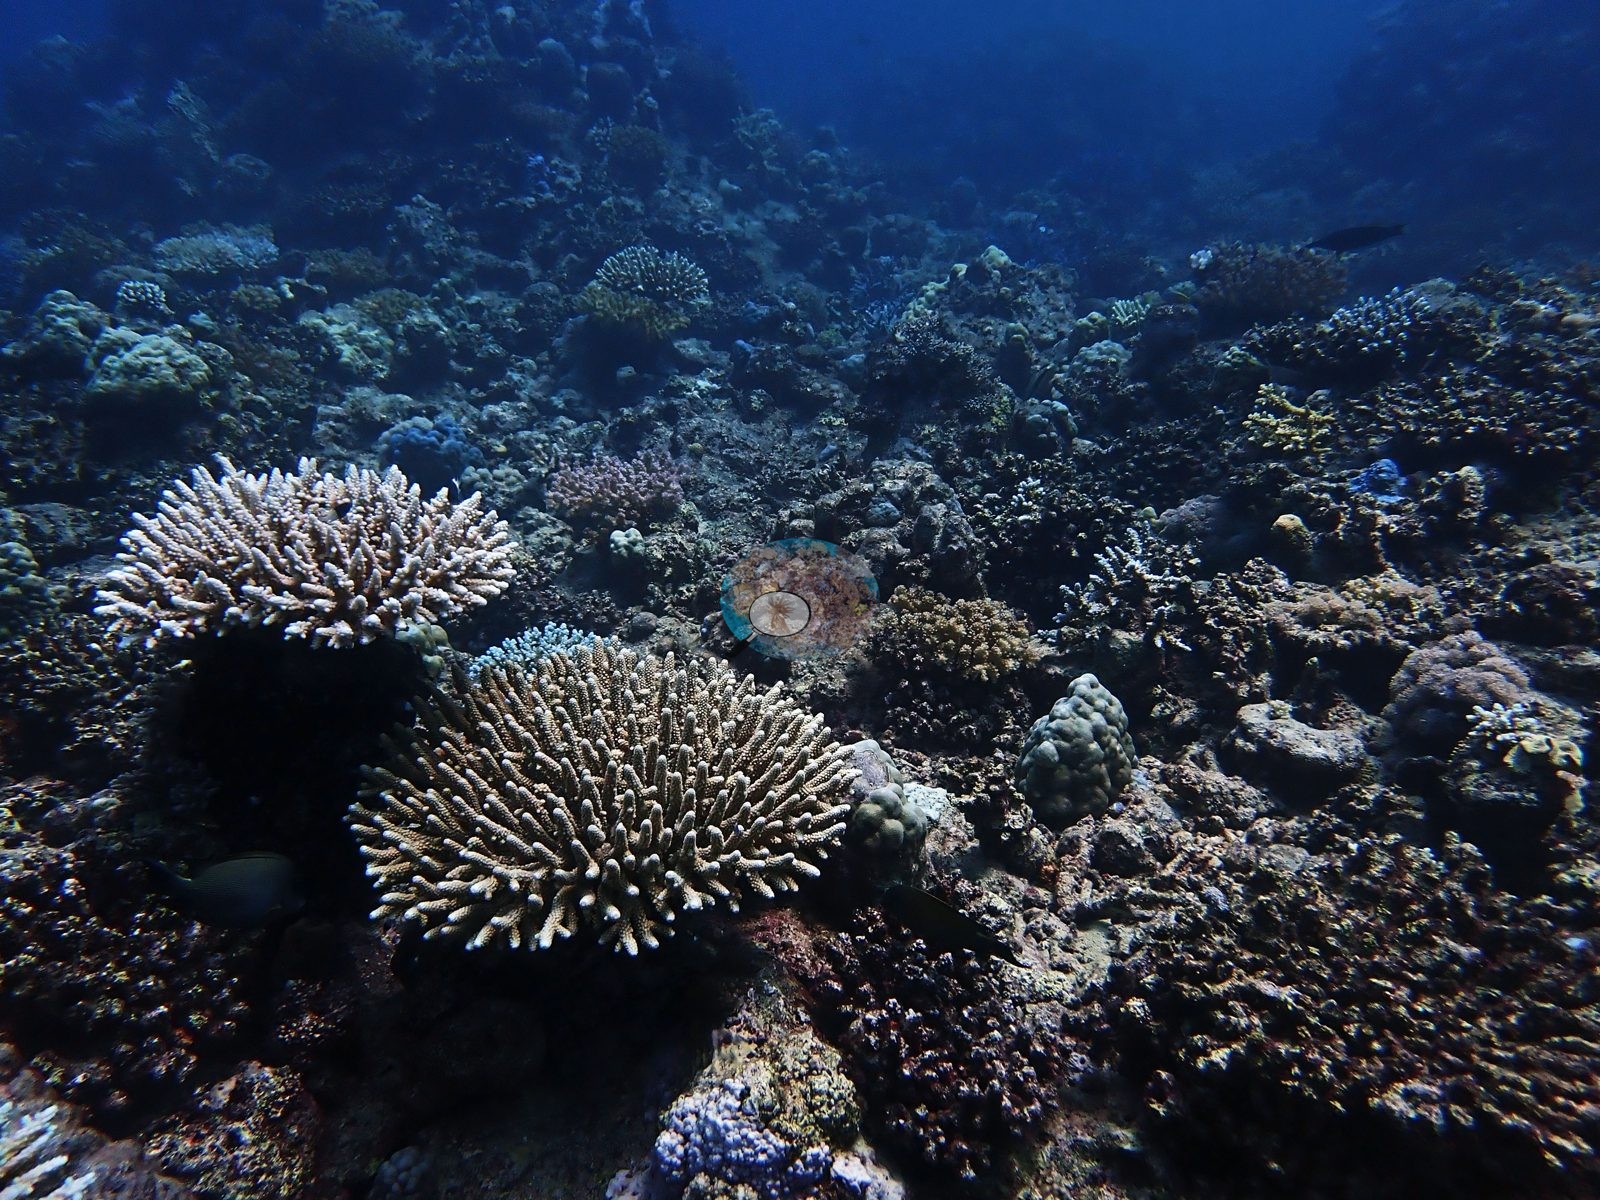
It is a low-cover artificial substrate, which is a reasonable part of why this site sits at the bottom of the Thuwal range. The natural reef beside it is a steeper mixed slope: cream and tan Porites boulders, a very large Diploastrea heliopora colony, tabulate Acropora, encrusting Montipora-type plates, lavender pocilloporids, cream-white xeniid pulse corals, and encrusting sponges, over pavement, and rubble that carry considerably more coralline algae than live coral (e.g., Image 2, Image 6, Image 7, Image 8, Image 9).
Coral cover
Site-level coral cover is 12.8% ± 13.0 across 383 photographs, quoted verbatim from Mayfield, A.B. (2025) Environments 12:248 — Red Sea 2023-24 bleaching; CoralNet point annotation, Appendix A — a manual CoralNet point count from Anderson's own published work, not a computer vision output, and not recomputed here. The site record carries the three visits separately: 12% cover / 32.0% bleaching in September 2023 during the late-summer thermal-stress event, 10.0% / 26.1% in April 2024 with thermal stress absent, and 16.4% / 18.7% in July 2024 during the 2024 marine heatwave.
Fish and other fauna
Fauna is wreck-typical — a blue-spotted ribbontail ray tucked under a hull plate on the sand, a black-and-white polyclad flatworm on a Porites nodule, anthias and small reef fish over the reef edge.
Comparisons with other data
No prior survey data from this site. If you would like to share yours, please email us.
Survey summary
Cement Wreck: surveyed 3 times, Sep 2023–Jul 2024 (CoralNet point counts; Mayfield 2025, Environments 12:248). Surveyed in partnership with Coastline (KAUST).
CV model comparison
More info
The reference row is this dive site's own published value (Mayfield 2025, Appendix A, 383 photos); the other rows are AREA-level (Thuwal) comparisons, not run on this site's frames. ⚠ The comparison rows are REGIONS, not dive sites: the paper's main tables report cover by region, and this site's own value comes from its Appendix A. ⚠ The manual column and the CV columns are on DIFFERENT FRAME SETS. The published cover spans the region's full photo set (173–2,567 frames, most of them CoralNet robot-labeled); the CV arms ran only on the hand-scored reference subset, which is 6 frames at Thuwal, 274 at Jeddah and 173 at Rabigh. Read Thuwal's model columns as indicative only. CoralNet is n/a by design: the reference set IS the hand-scored set, so those frames carry no independent robot label to compare against. DINOv3 is restricted to frames it never saw, and reads roughly double the published cover at every Red Sea region. ⚠ 'unassigned region' is not a place: 135 frames carry no region label in the CoralNet metadata and map to no published row. It has no manual value and is excluded from the pooled reference. CoralNet automated point classifier: n/a — the reference set IS the hand-scored set; these frames carry no independent CoralNet robot label to compare against CoralSCOP (SAM-based mask-sum), unedited photos: pending — CoralSCOP run: 370/747 images scored at build time CoralSCOP (SAM-based mask-sum), edited photos: pending — CoralSCOP run: 370/747 images scored at build time| Method | Hard-coral cover (%) |
|---|---|
| Manual (published) | 12.8 |
| In-house DINOv3 | 47.5 |
| Claude | 23.9 |
Dive history
Coral bleached: computer-vision (CoralNet) estimate from the survey images, per dive, as published in Mayfield (2025, Environments 12:248), Supplementary File S1.
| Date | Time in | Max depth (m) | Bottom time (min) | Coral bleached (%) |
|---|---|---|---|---|
| 2023-09-08 | 10:55 | 14.0 | 50 | 32.0 |
| 2024-04-27 | — | — | — | 26.1 |
| 2024-07-26 | — | — | — | 18.7 |
Data & links
All images from Coral Reef Diagnostics. Data are from Coral Reef Diagnostics.
© Coral Reef Diagnostics.