
Saudi Red Sea - Cave Reef (Thuwal)
Part of the regional summaries: Saudi Arabia - Jeddah / KAUST (Thuwal) / Rabigh, Saudi Arabia, and Red Sea
More info
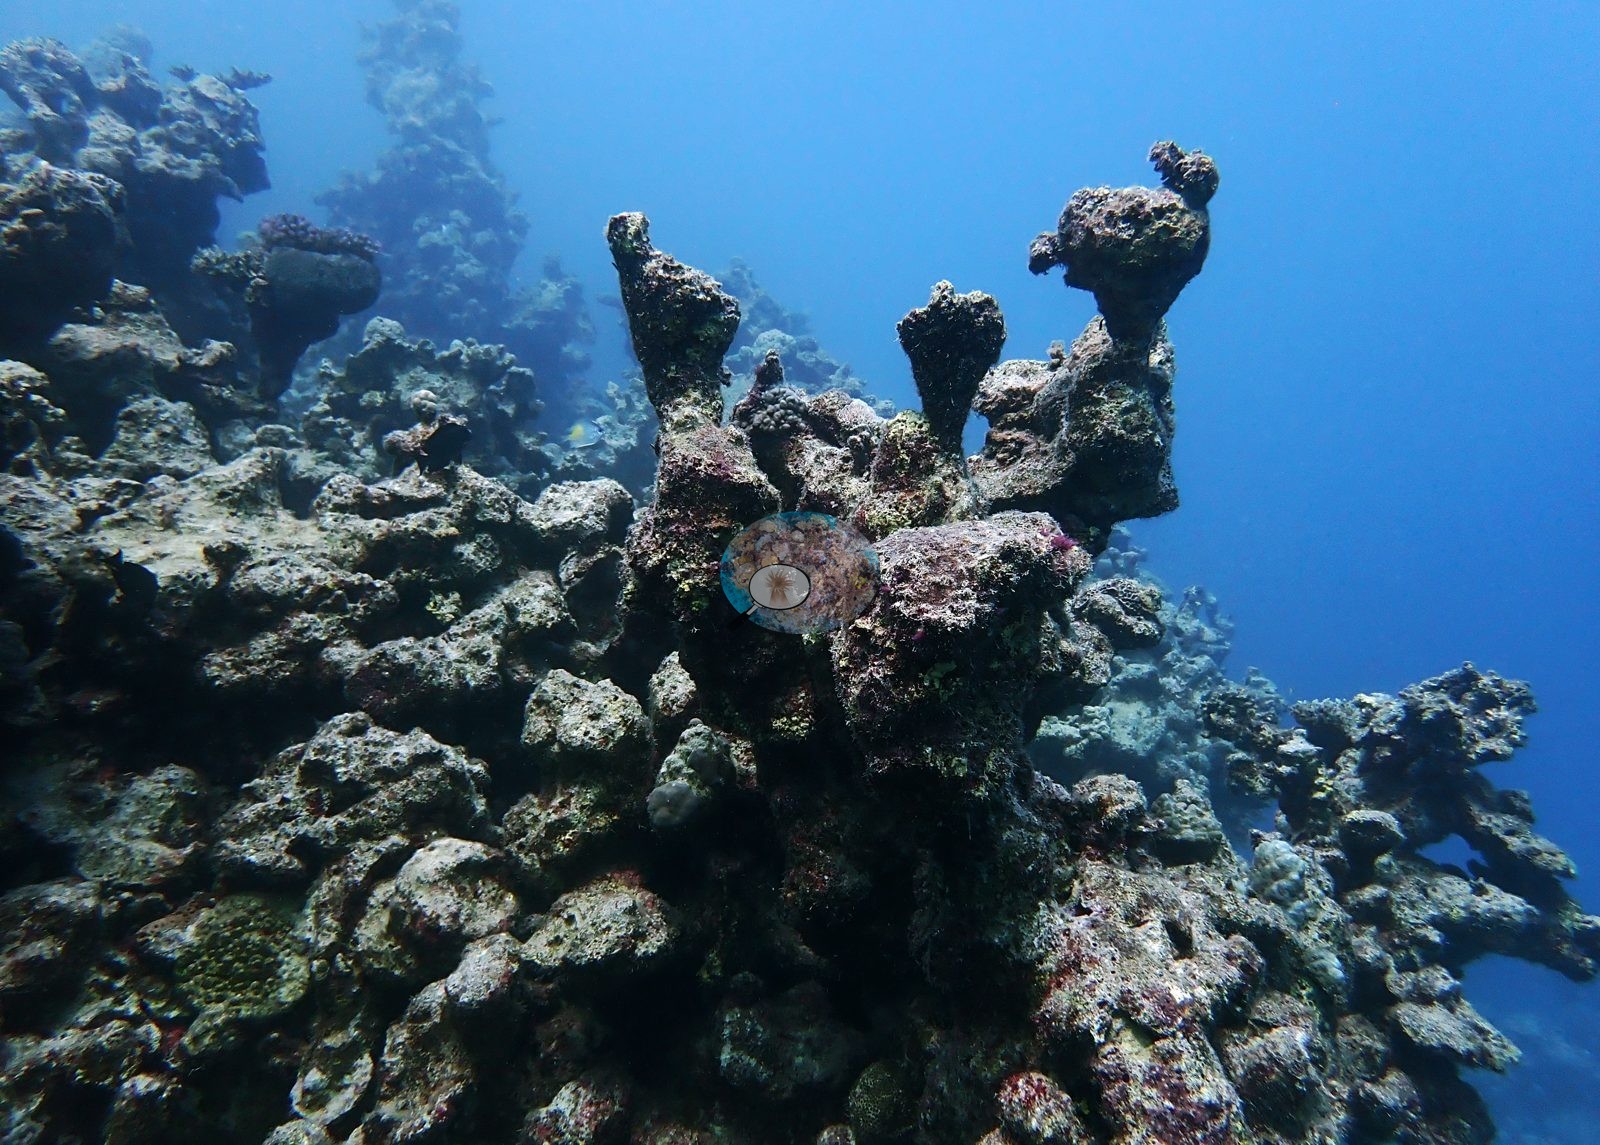
Makkah-Madine Saudi Arabia (NOAA CRW virtual station) · Northern and Central Red Sea ecoregion mean=12.2°C-heating weeksCave Reef, named for its caverns and overhangs, is a field of eroded, heavily bioeroded limestone pinnacles rising from sand, with coral patchy and mostly small - massive Lobophyllia, faviid domes, and giant clams rather than a continuous framework. A single February 2024 visit found 17% cover with 26.8% of coral tissue bleached despite zero accumulated heat stress at the time, and fresh parrotfish grazing scars ('fish bites,' in Anderson's own caption) were visible on several faviid colonies.
شعبة الكهف، المسماة على كهوفها ونتوءاتها المتدلية، حقل من أبراج جيرية متآكلة ومتآكلة حيوياً بشدة ترتفع من الرمل، والمرجان فيها متفرق وصغير في معظمه: Lobophyllia كتلي، وقباب من فصيلة Faviidae، ومحار عملاق، بدلاً من بنية متصلة.
ترجمة هذا الملخص بالذكاء الاصطناعي؛ النص الإنجليزي هو المعتمد. Translated from the site’s shorter map summary.
One independent survey station shown with the program’s logo — click one to see how far it is from this site.
Two other CRD dive sites within 5 km shown in orange — click a marker to open its page.
4 of these 50 photographs are shown beside the text that discusses them under "Site description" below.
Site description
Setting
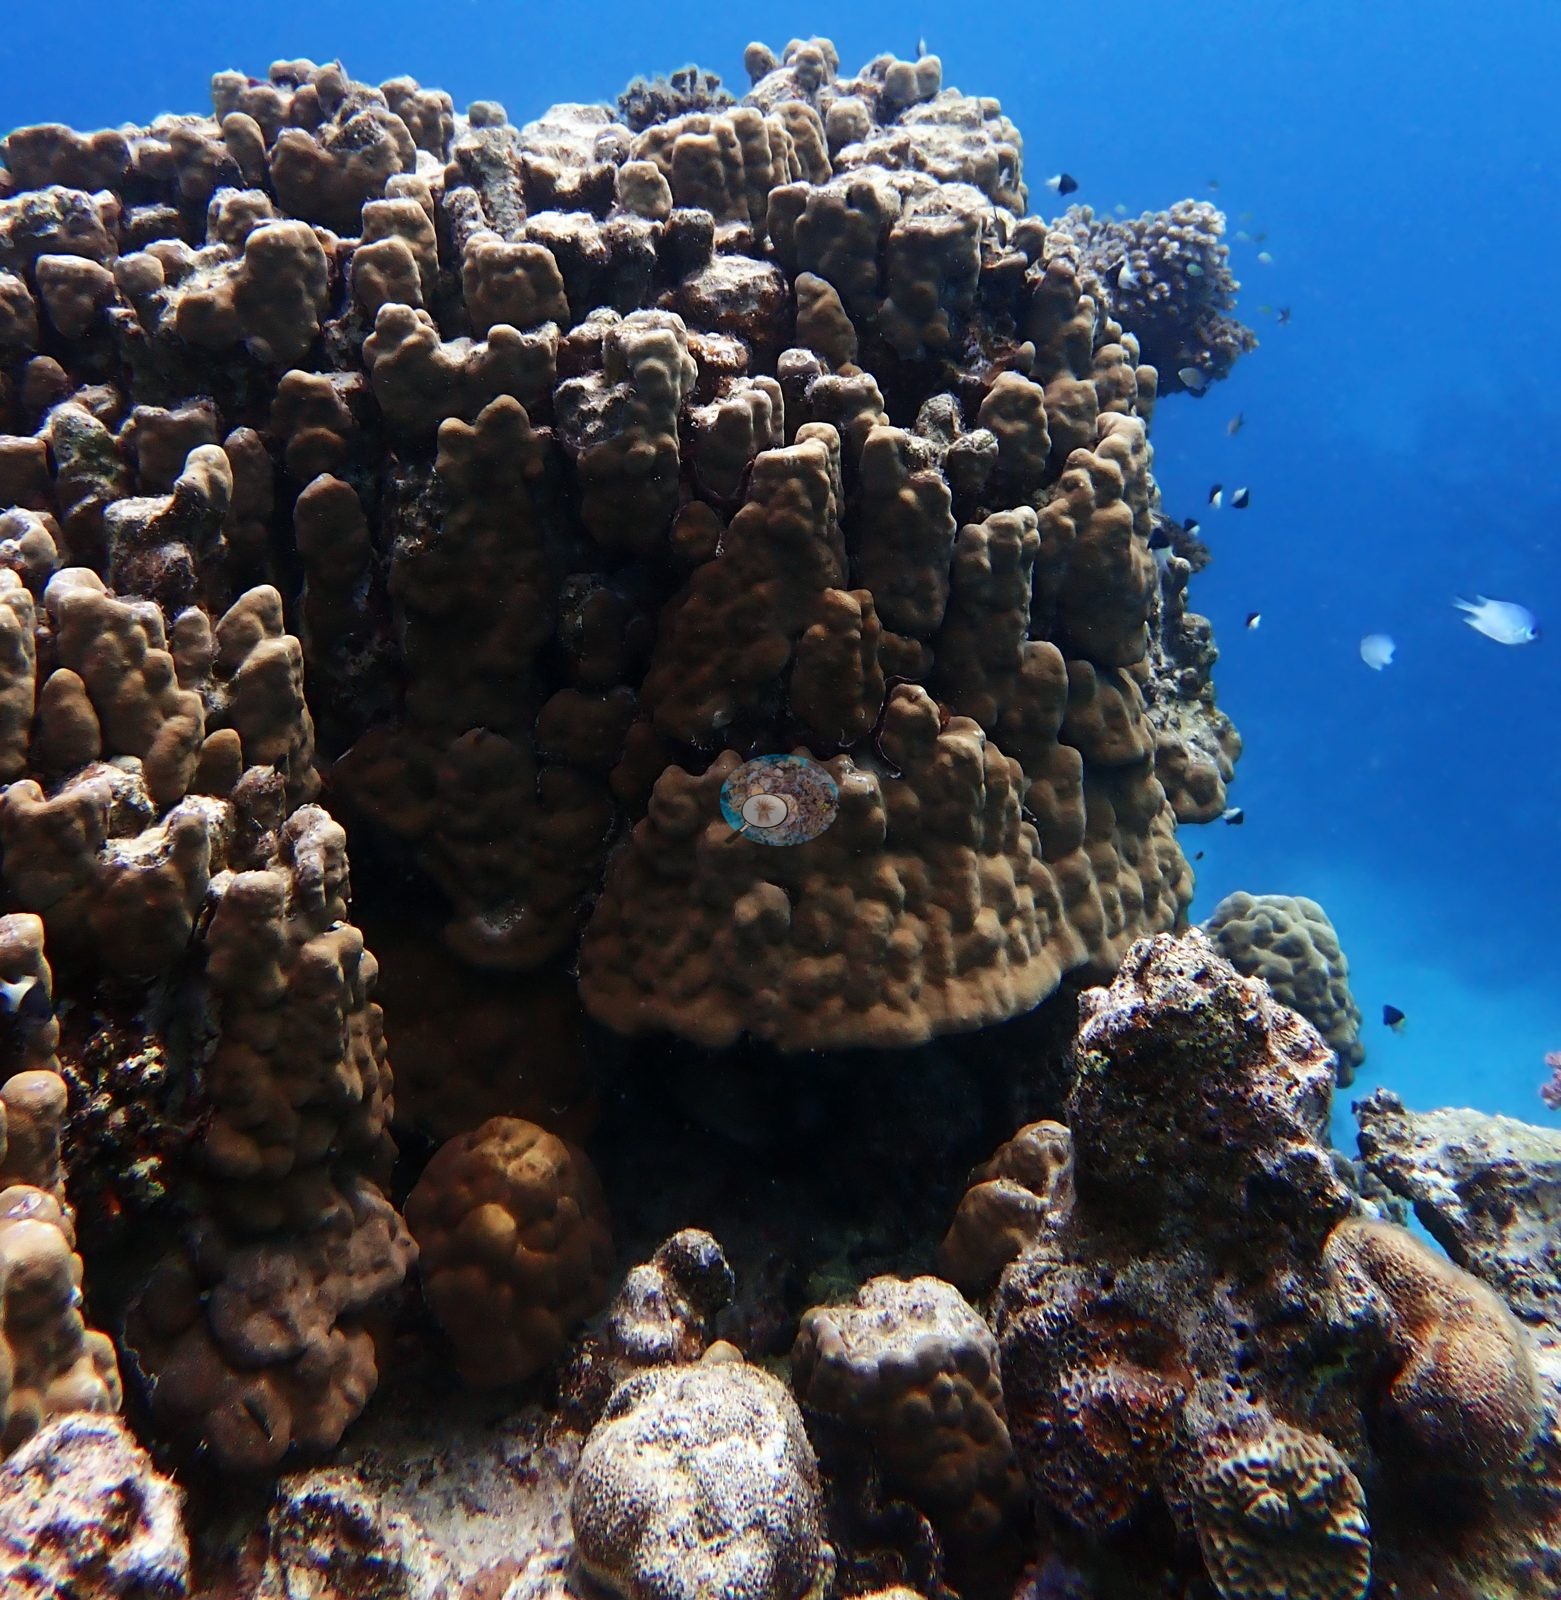
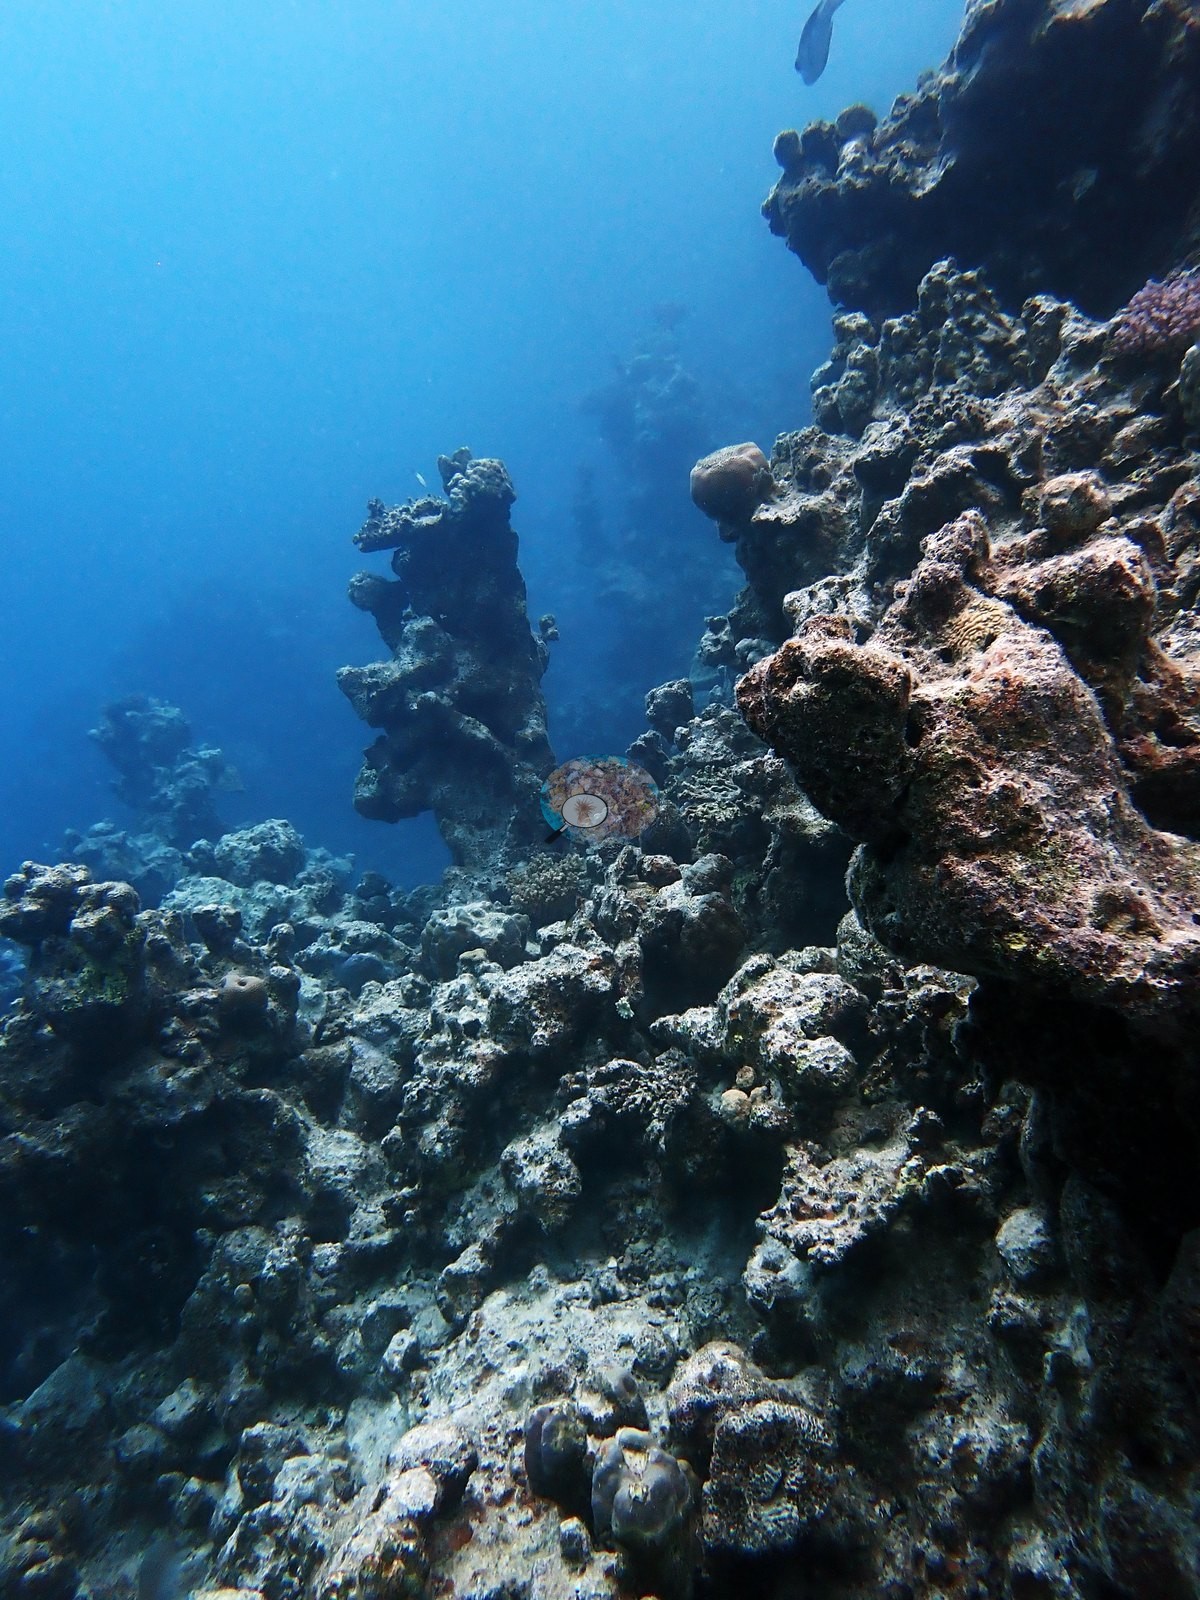
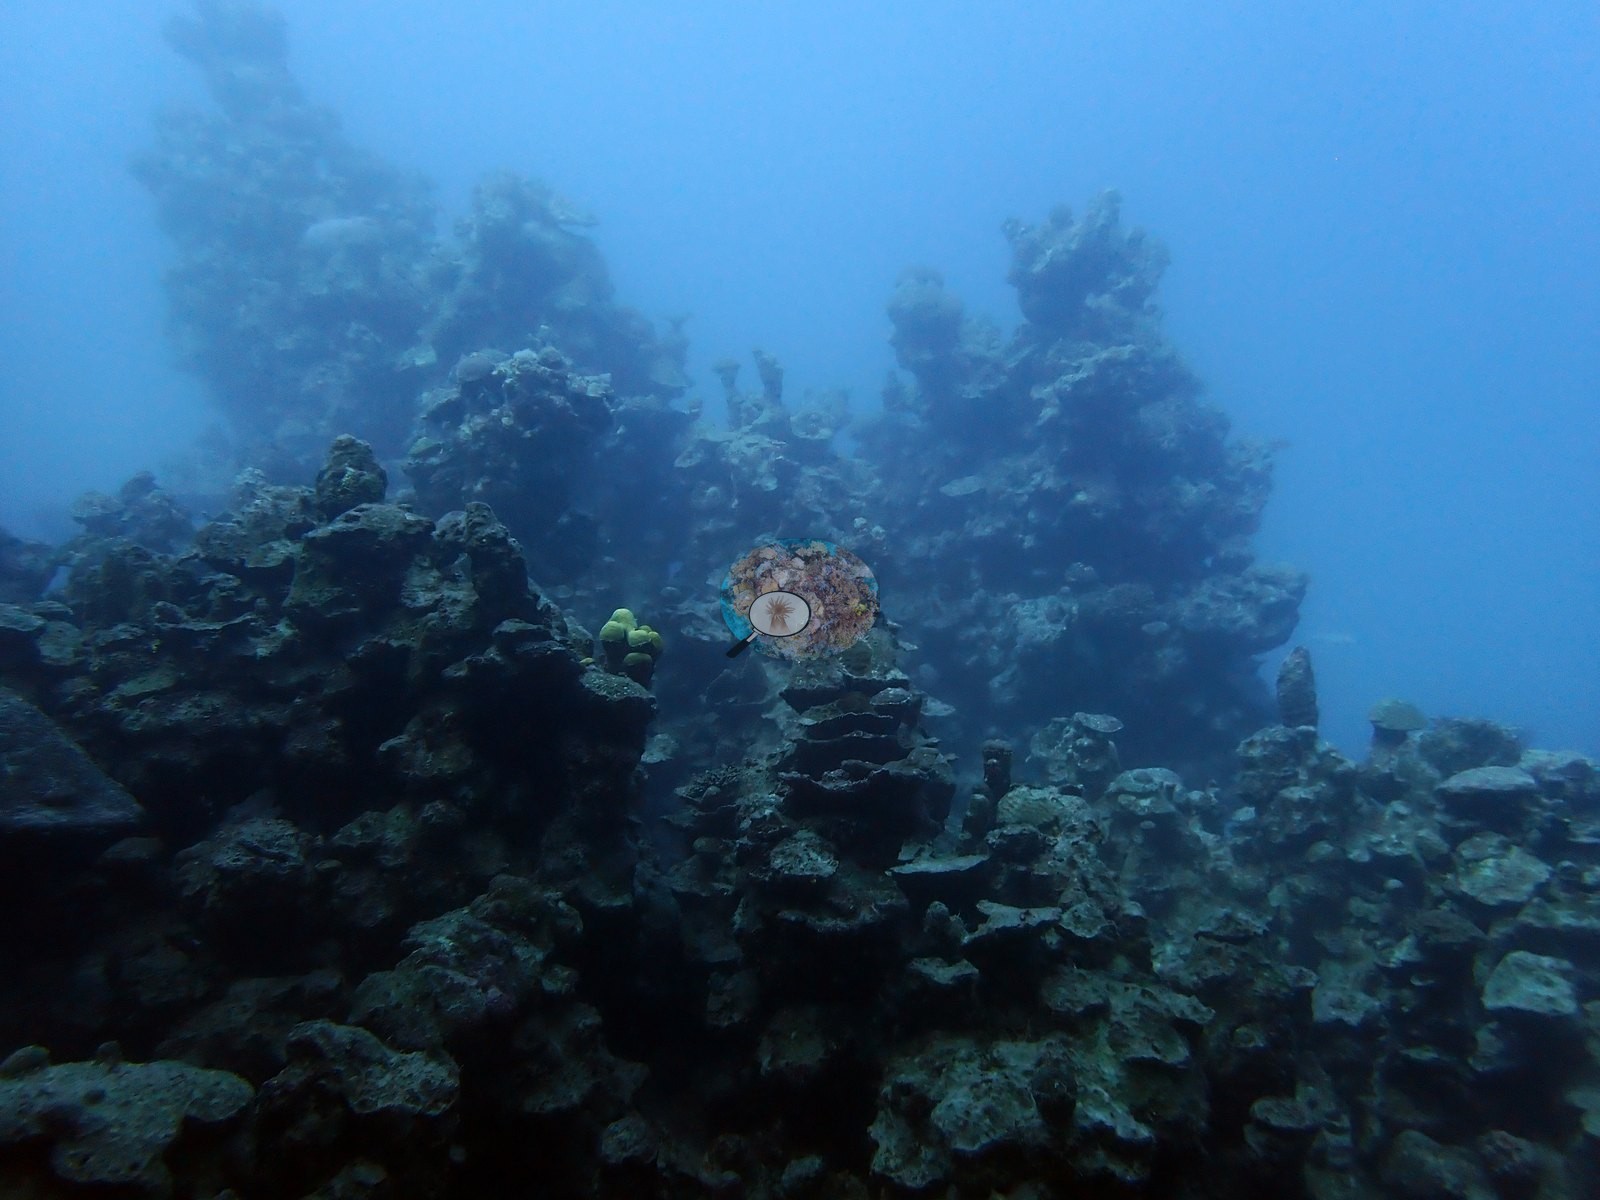
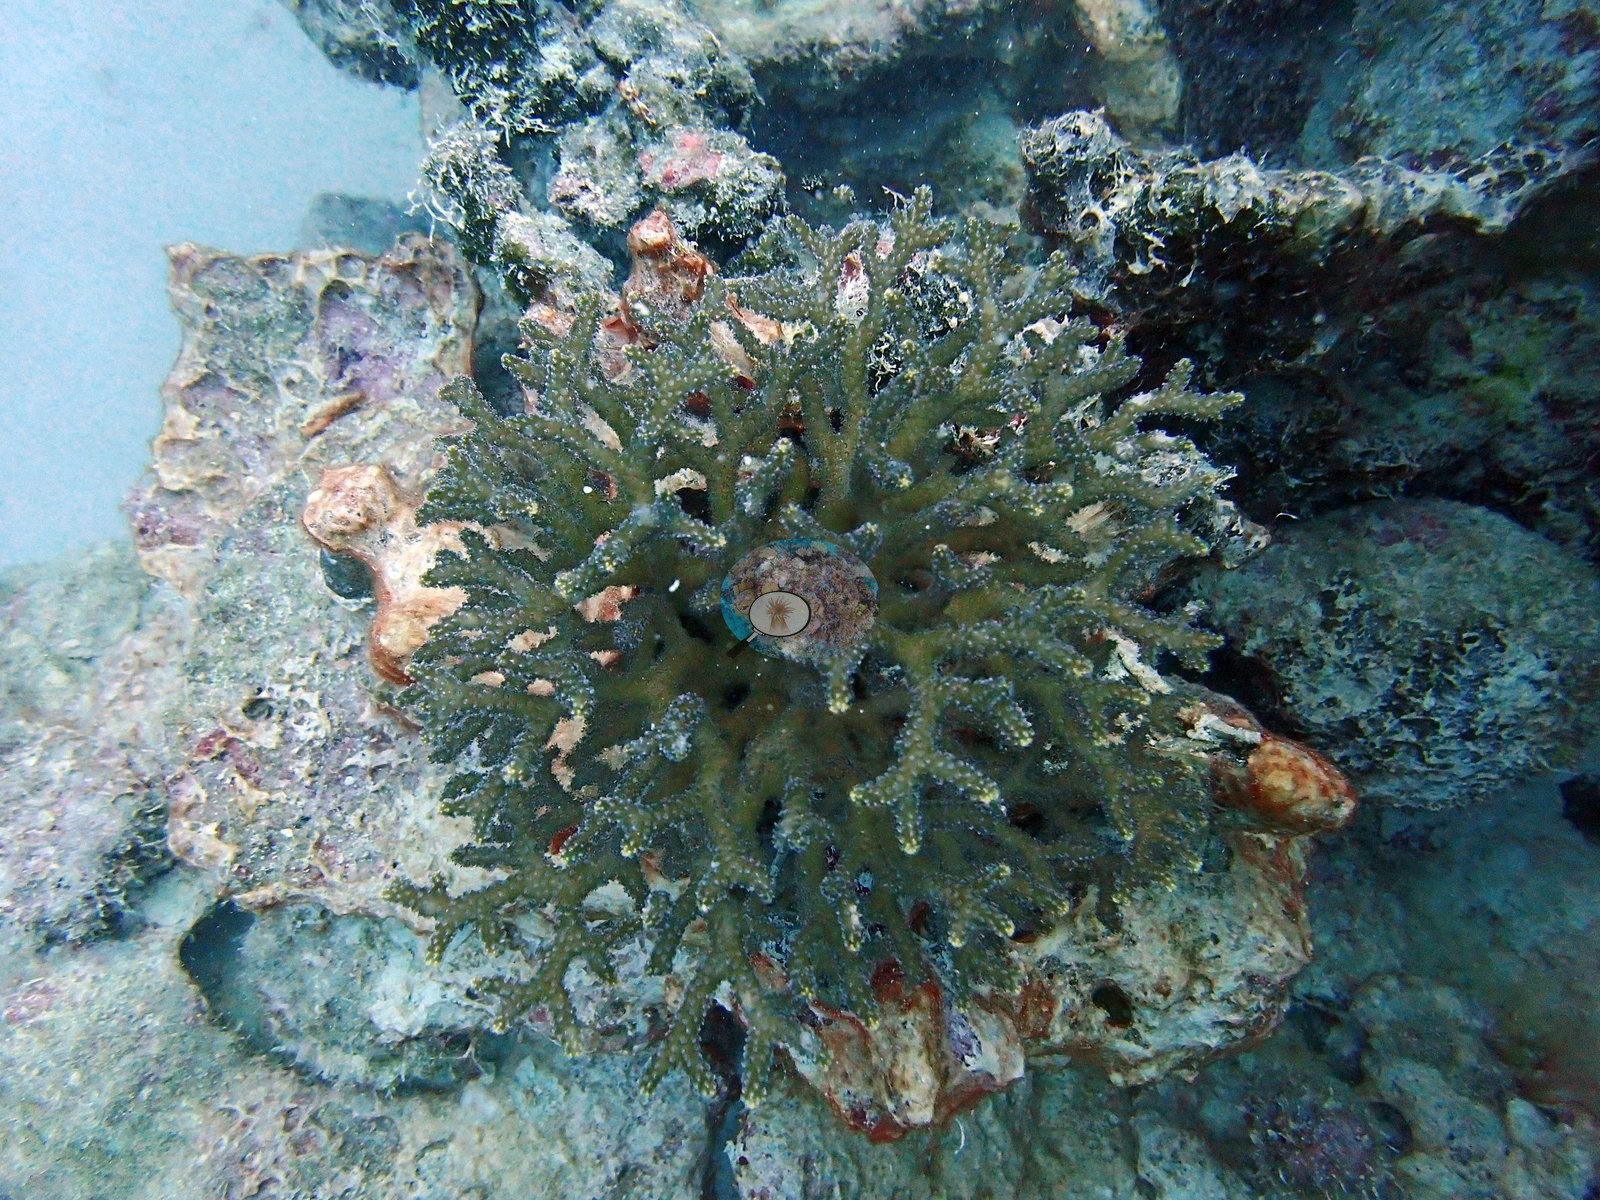
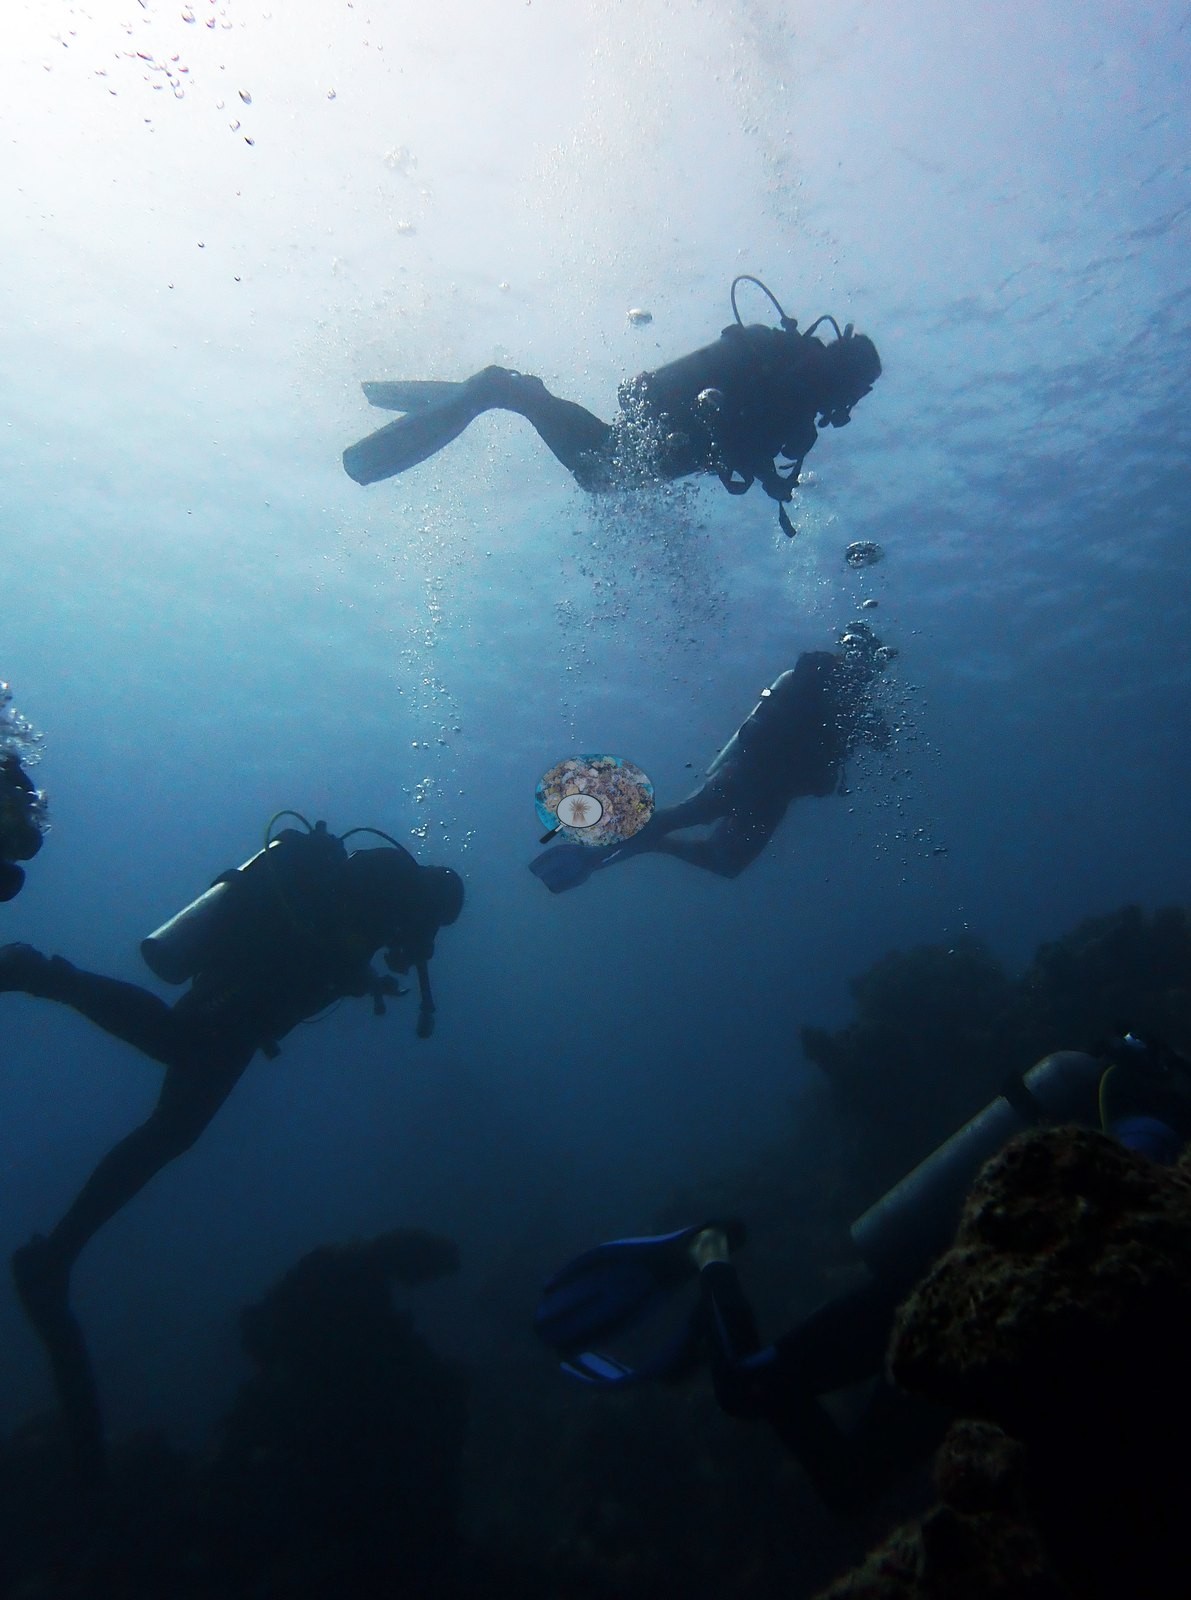
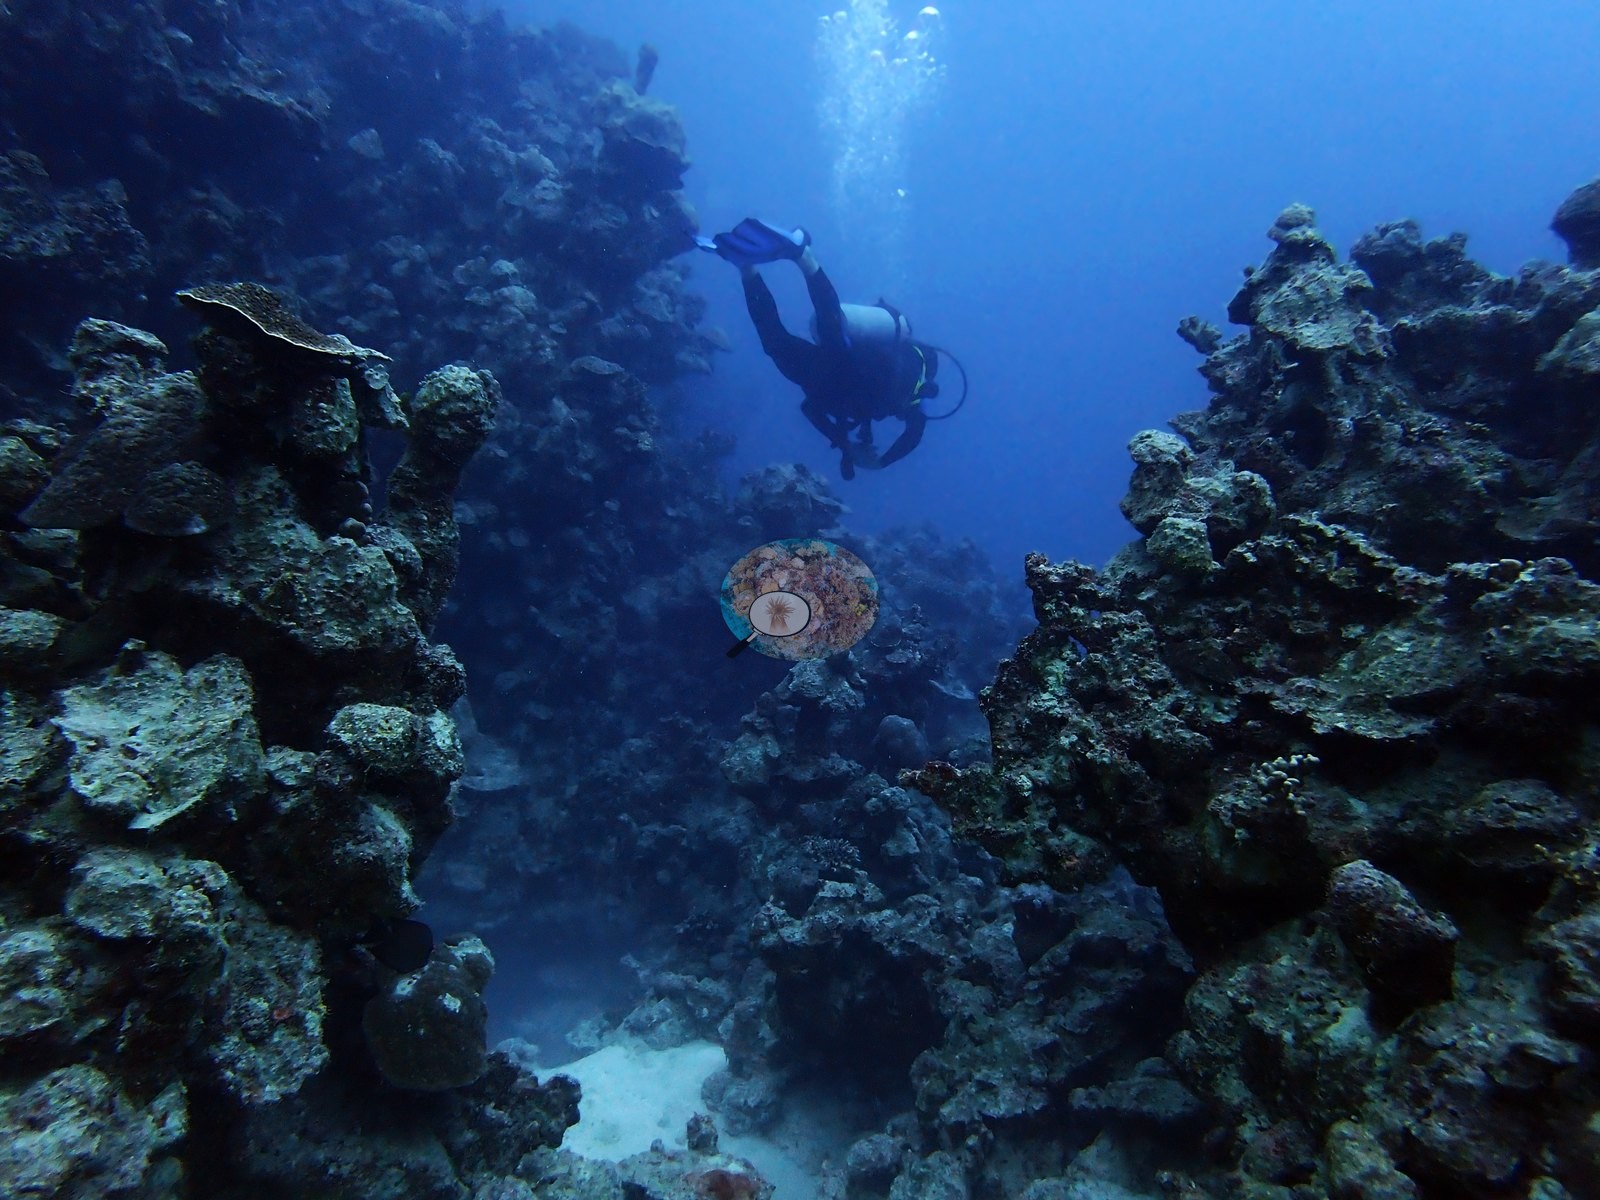
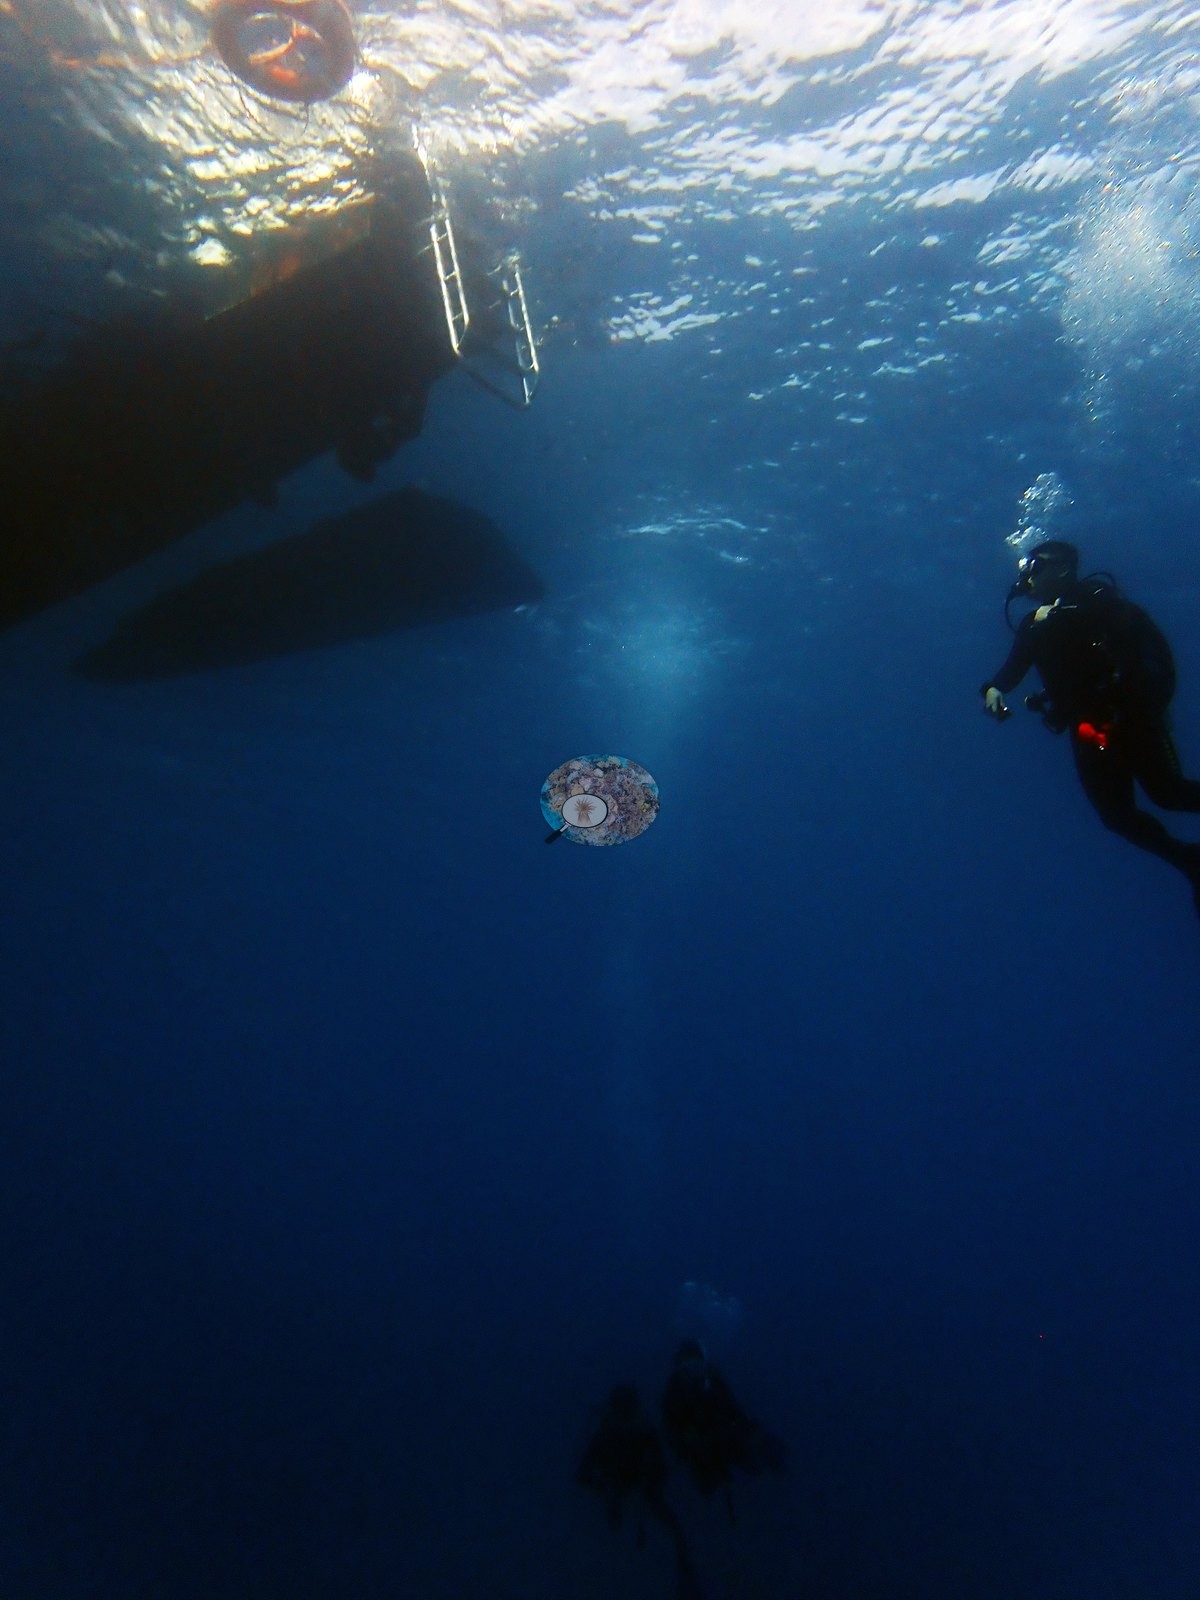
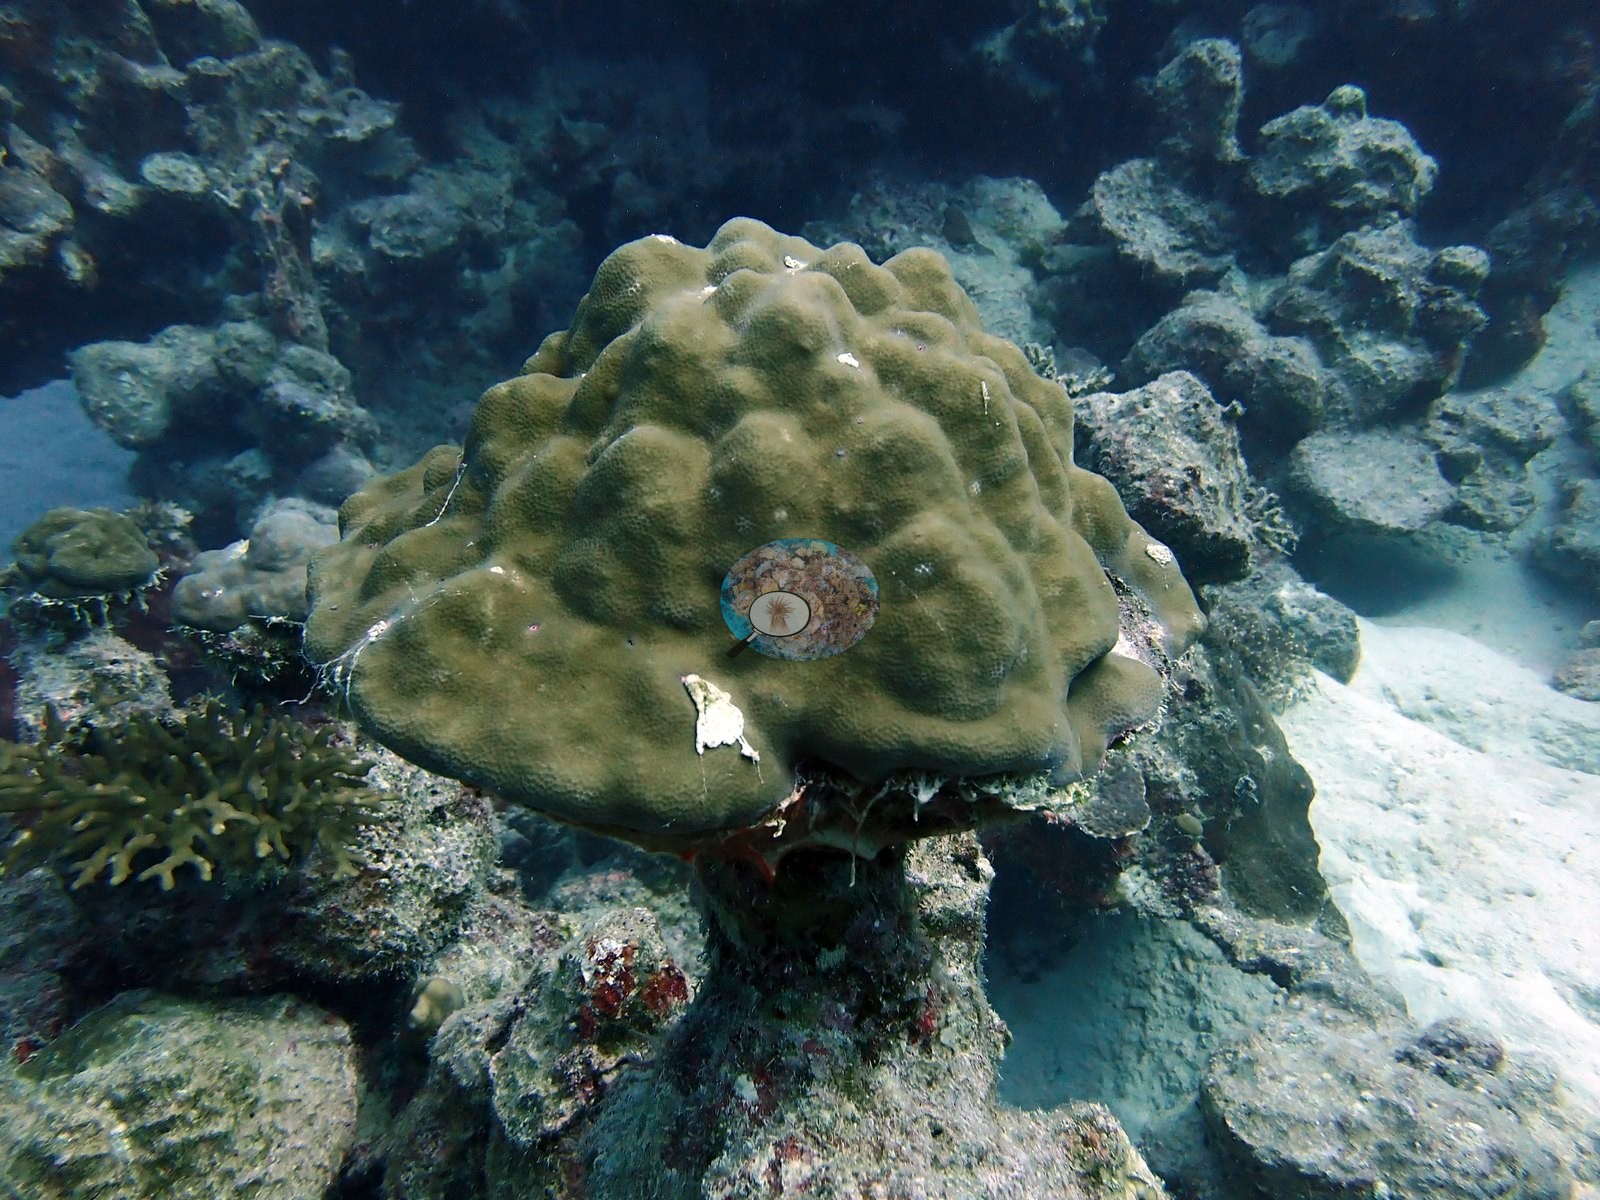
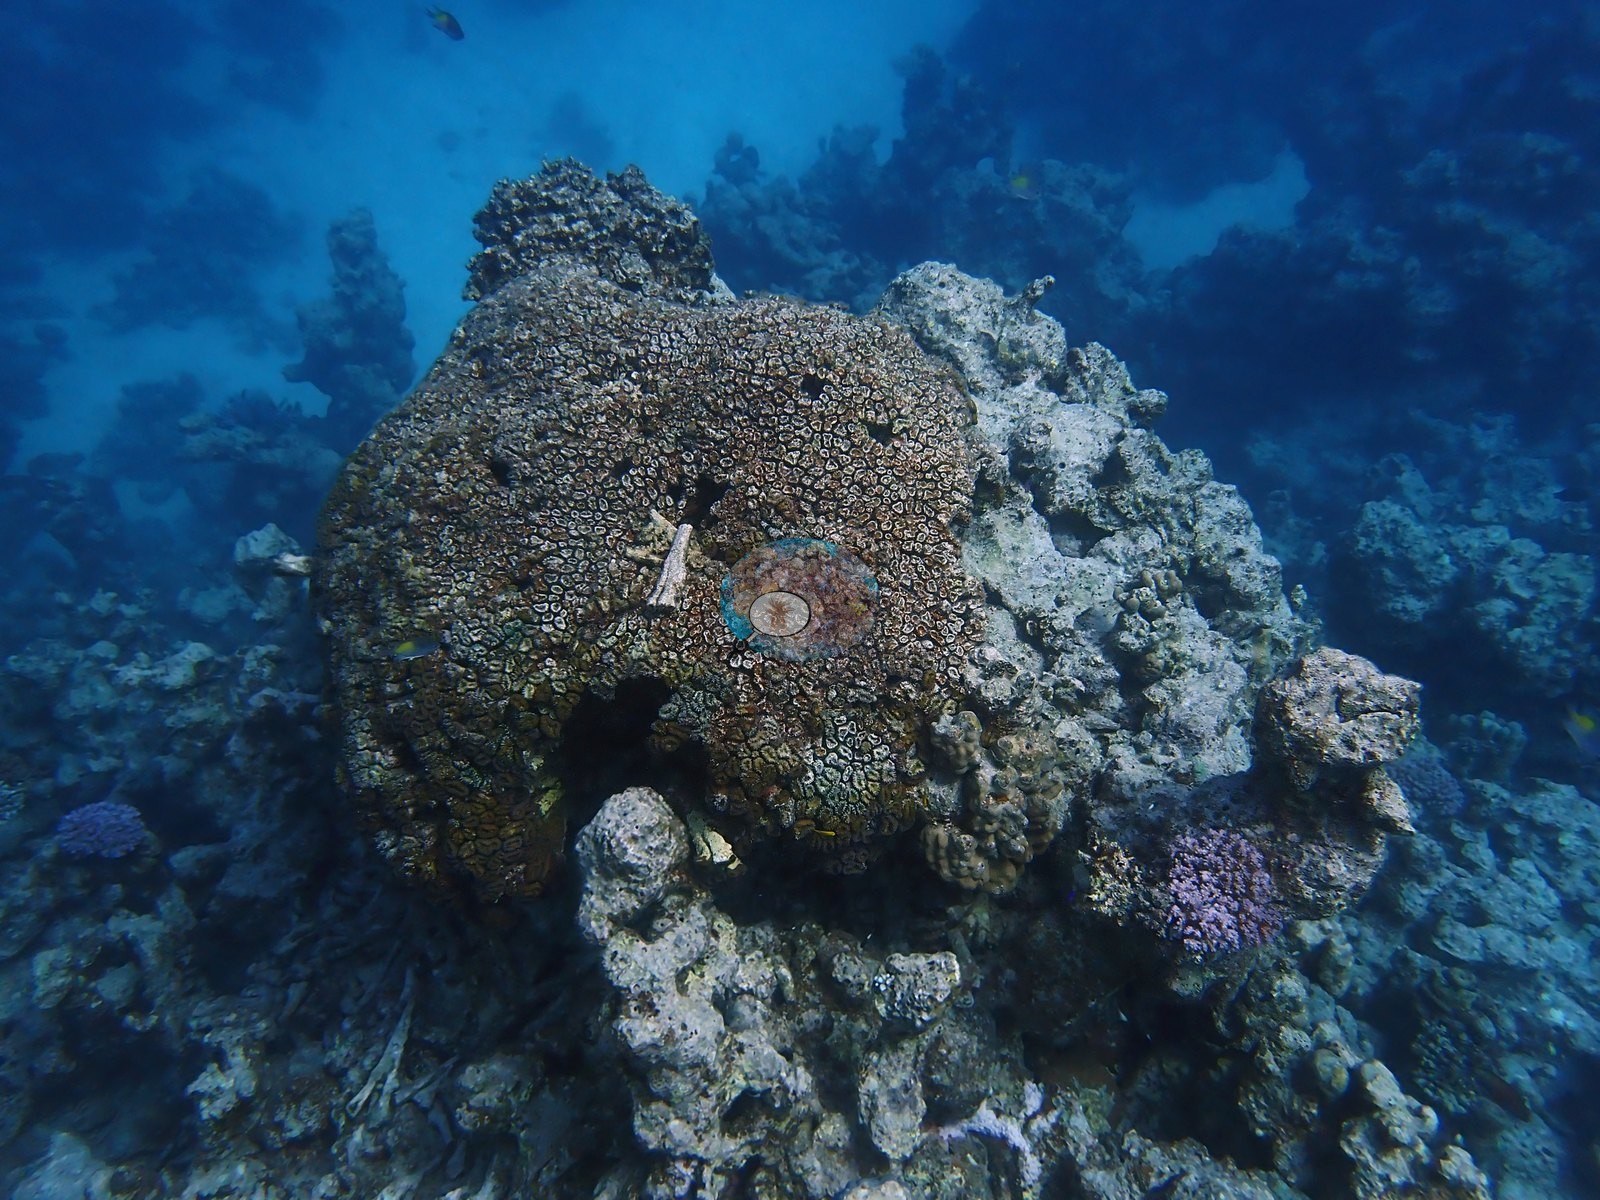
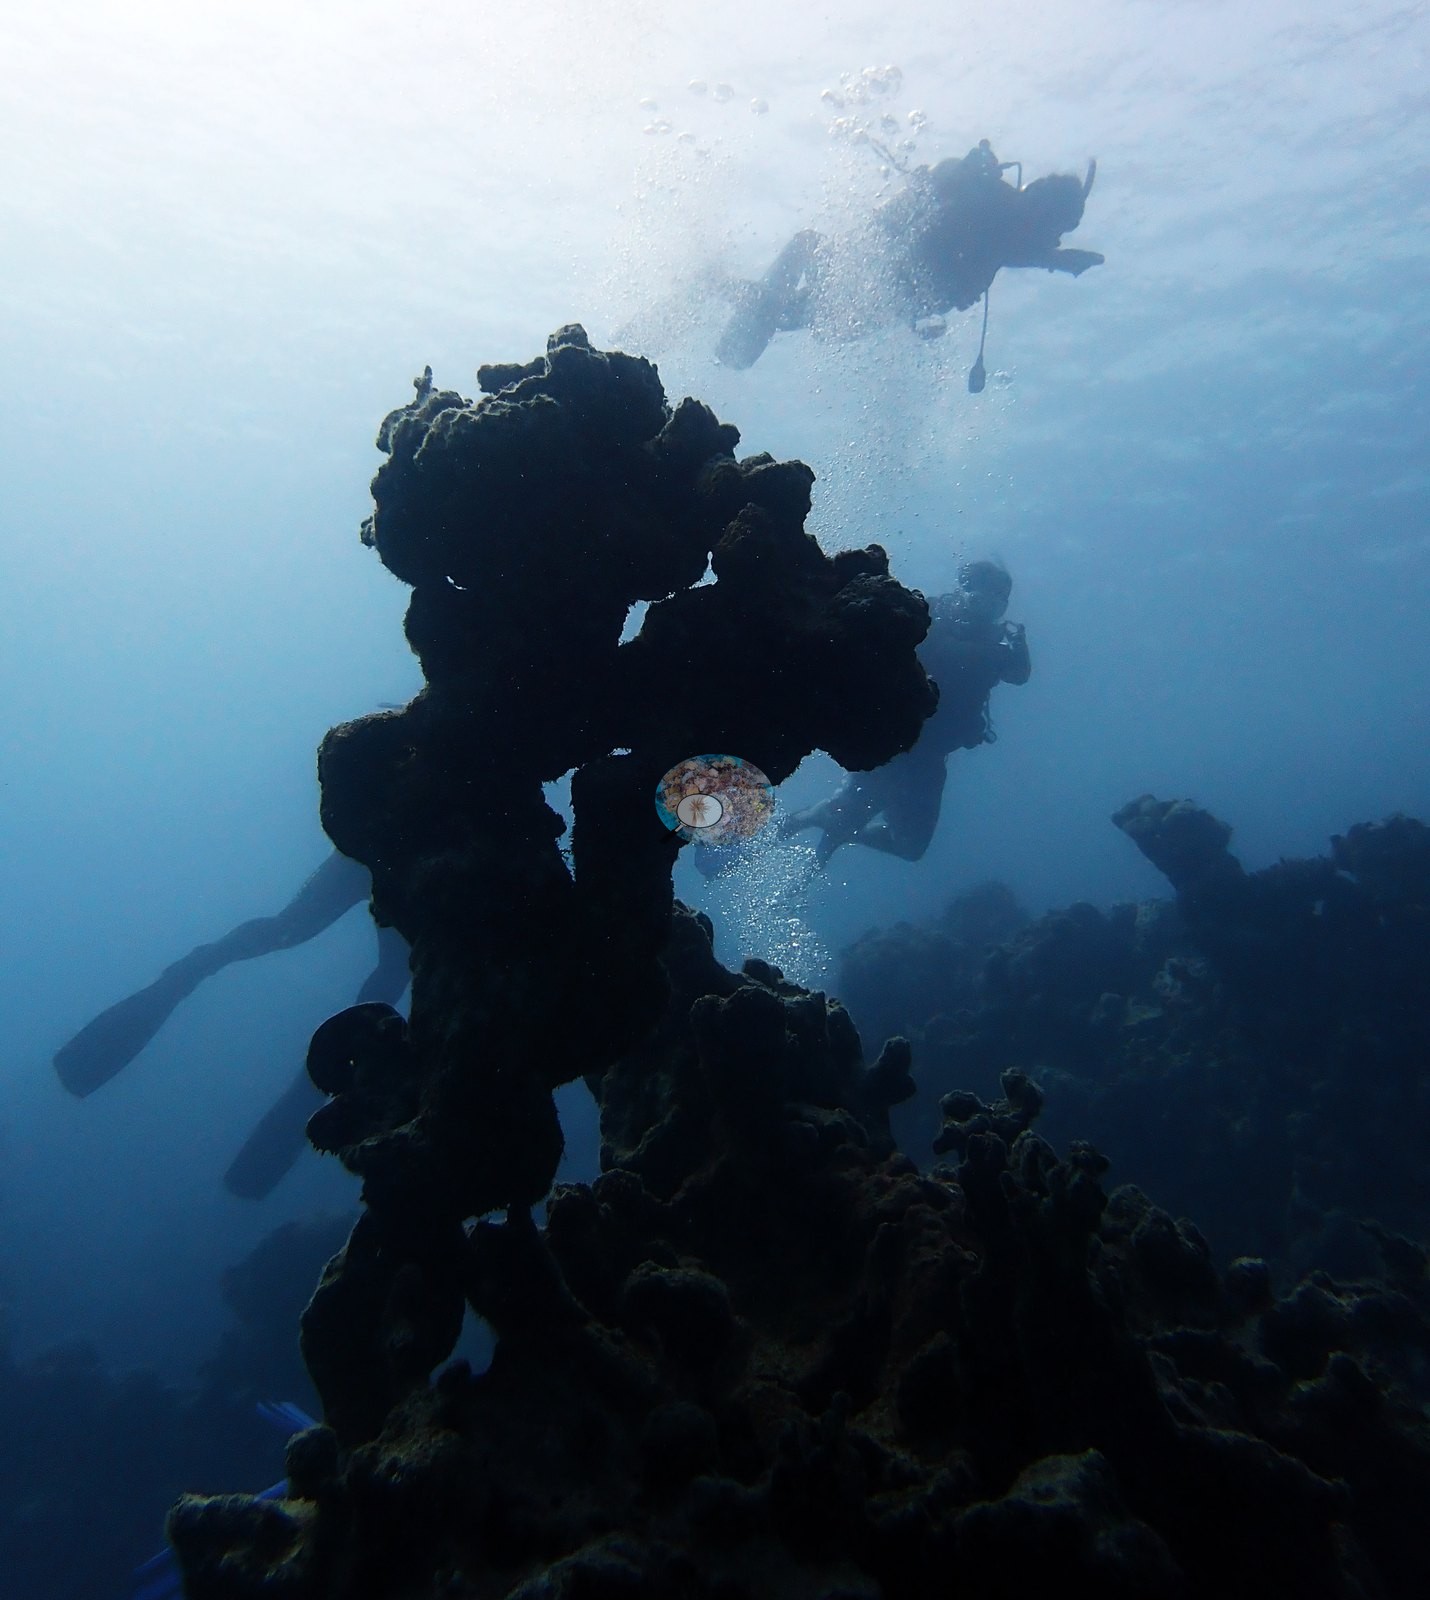
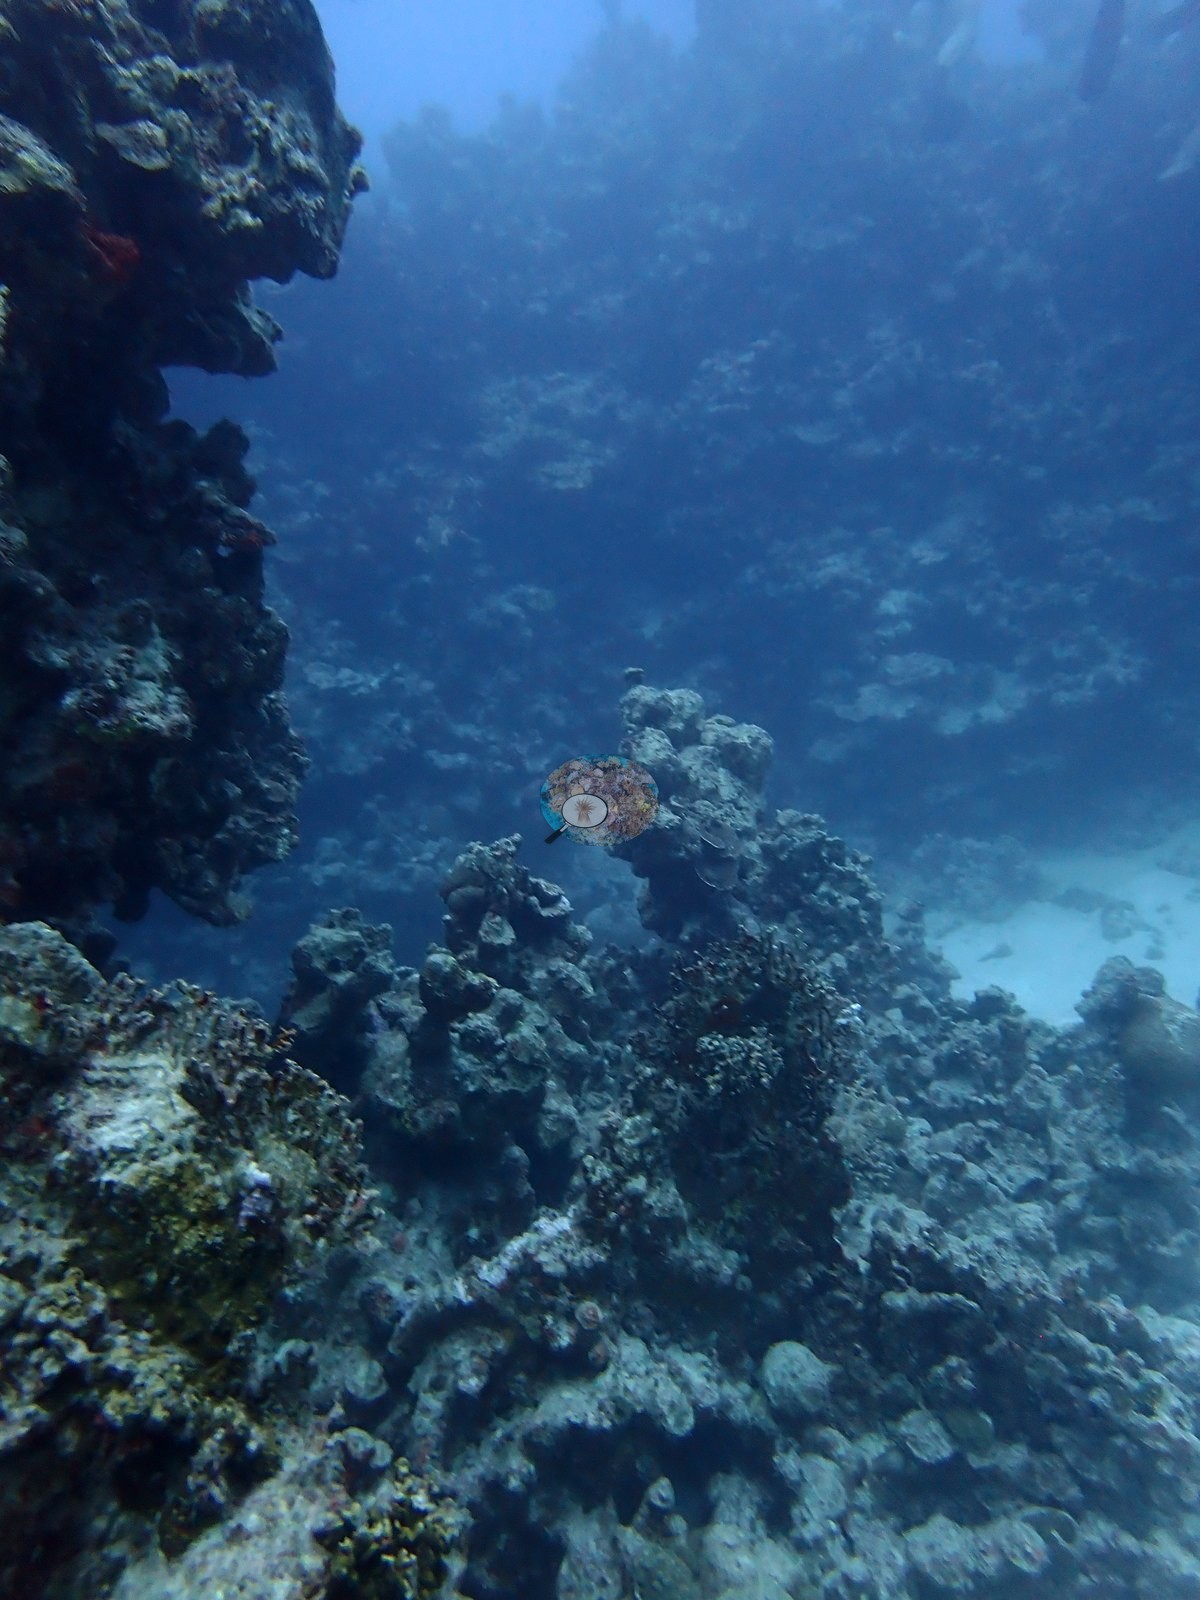
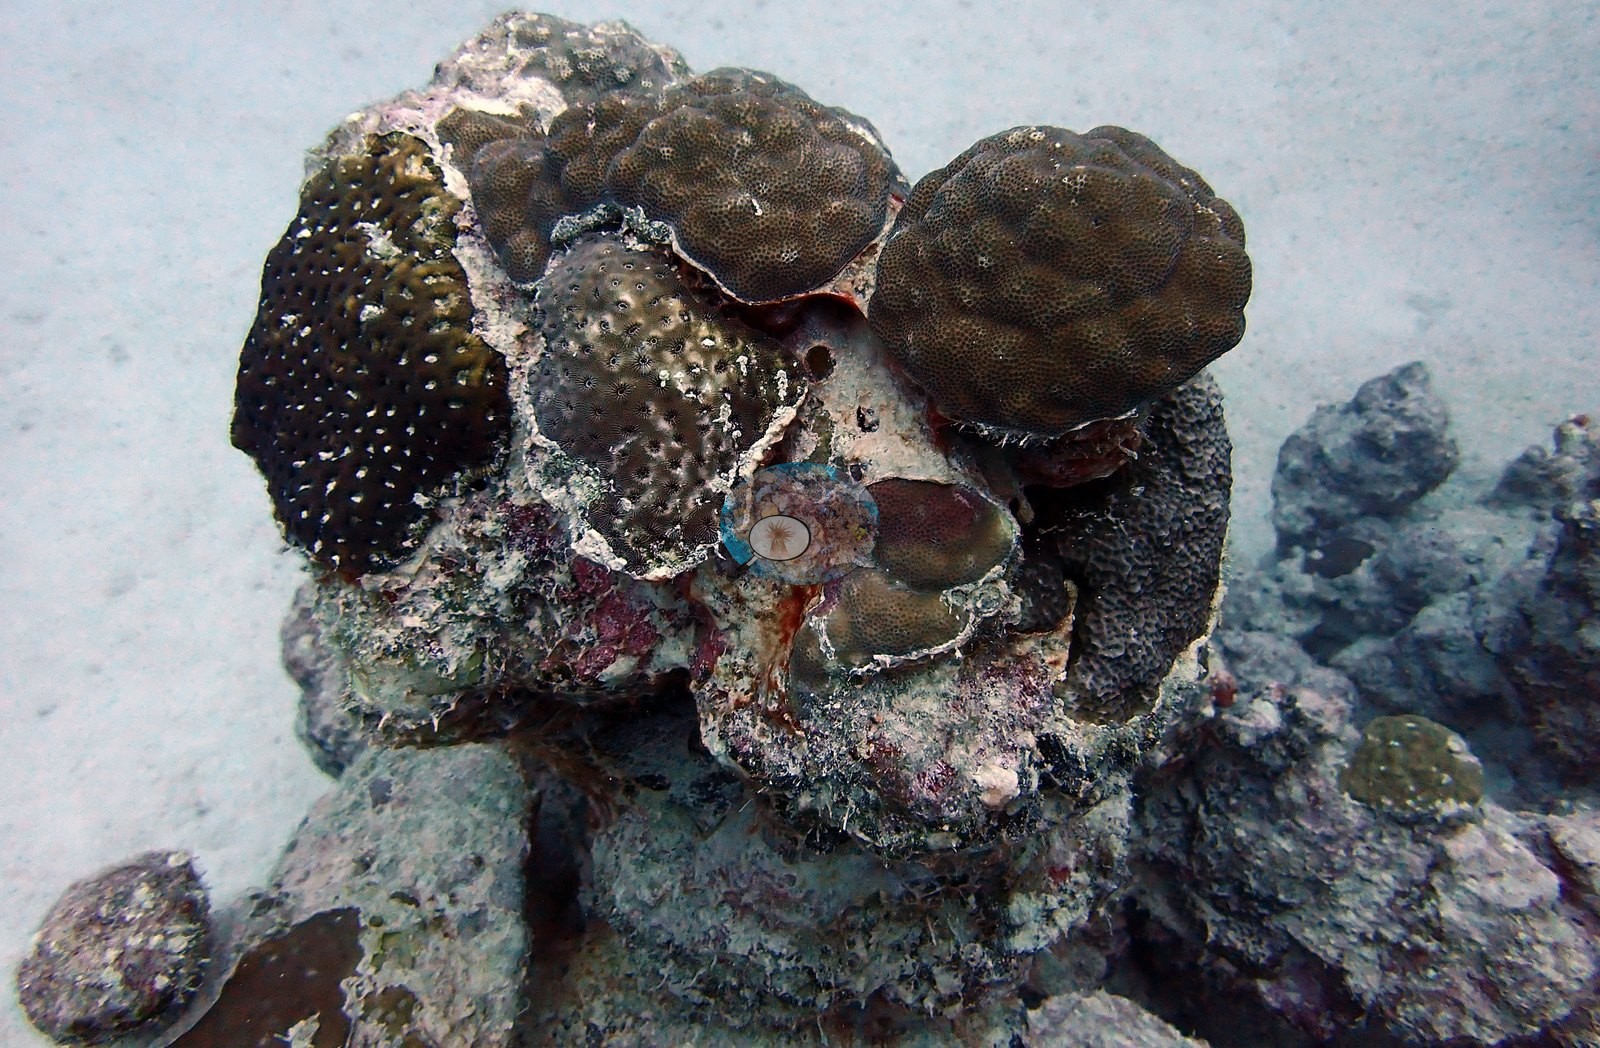
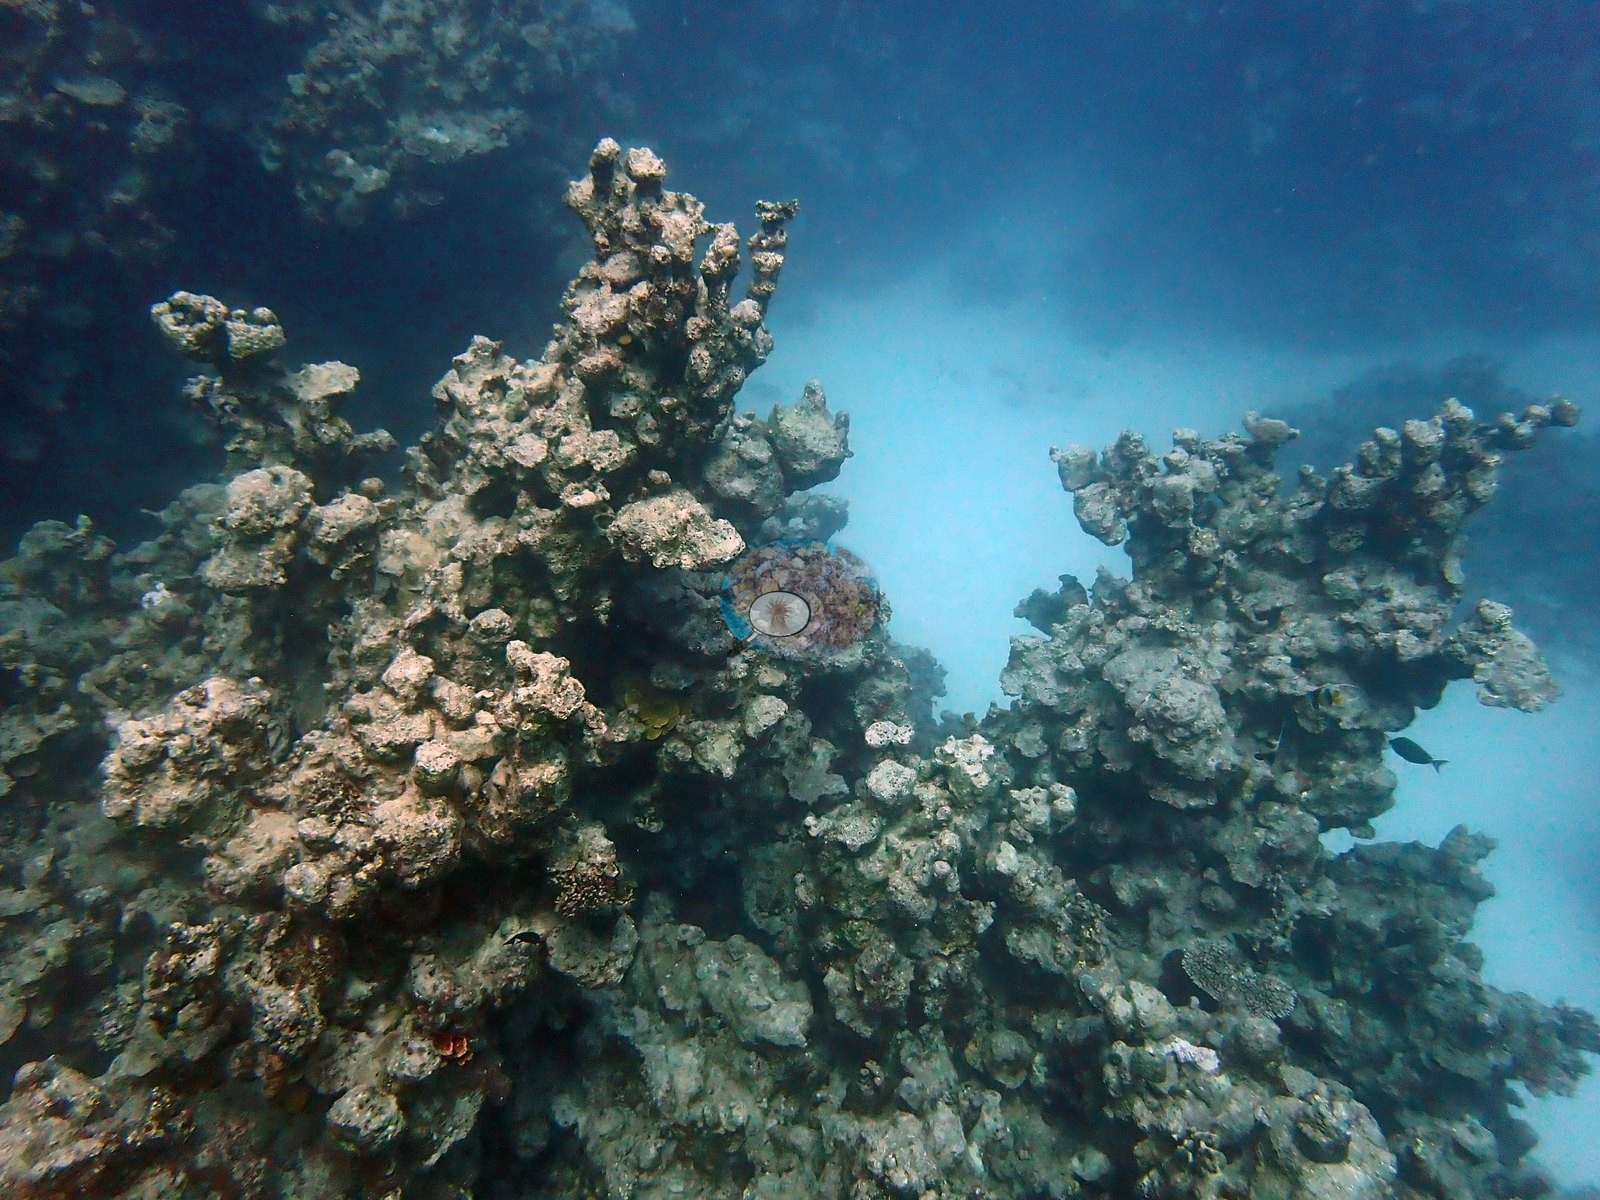
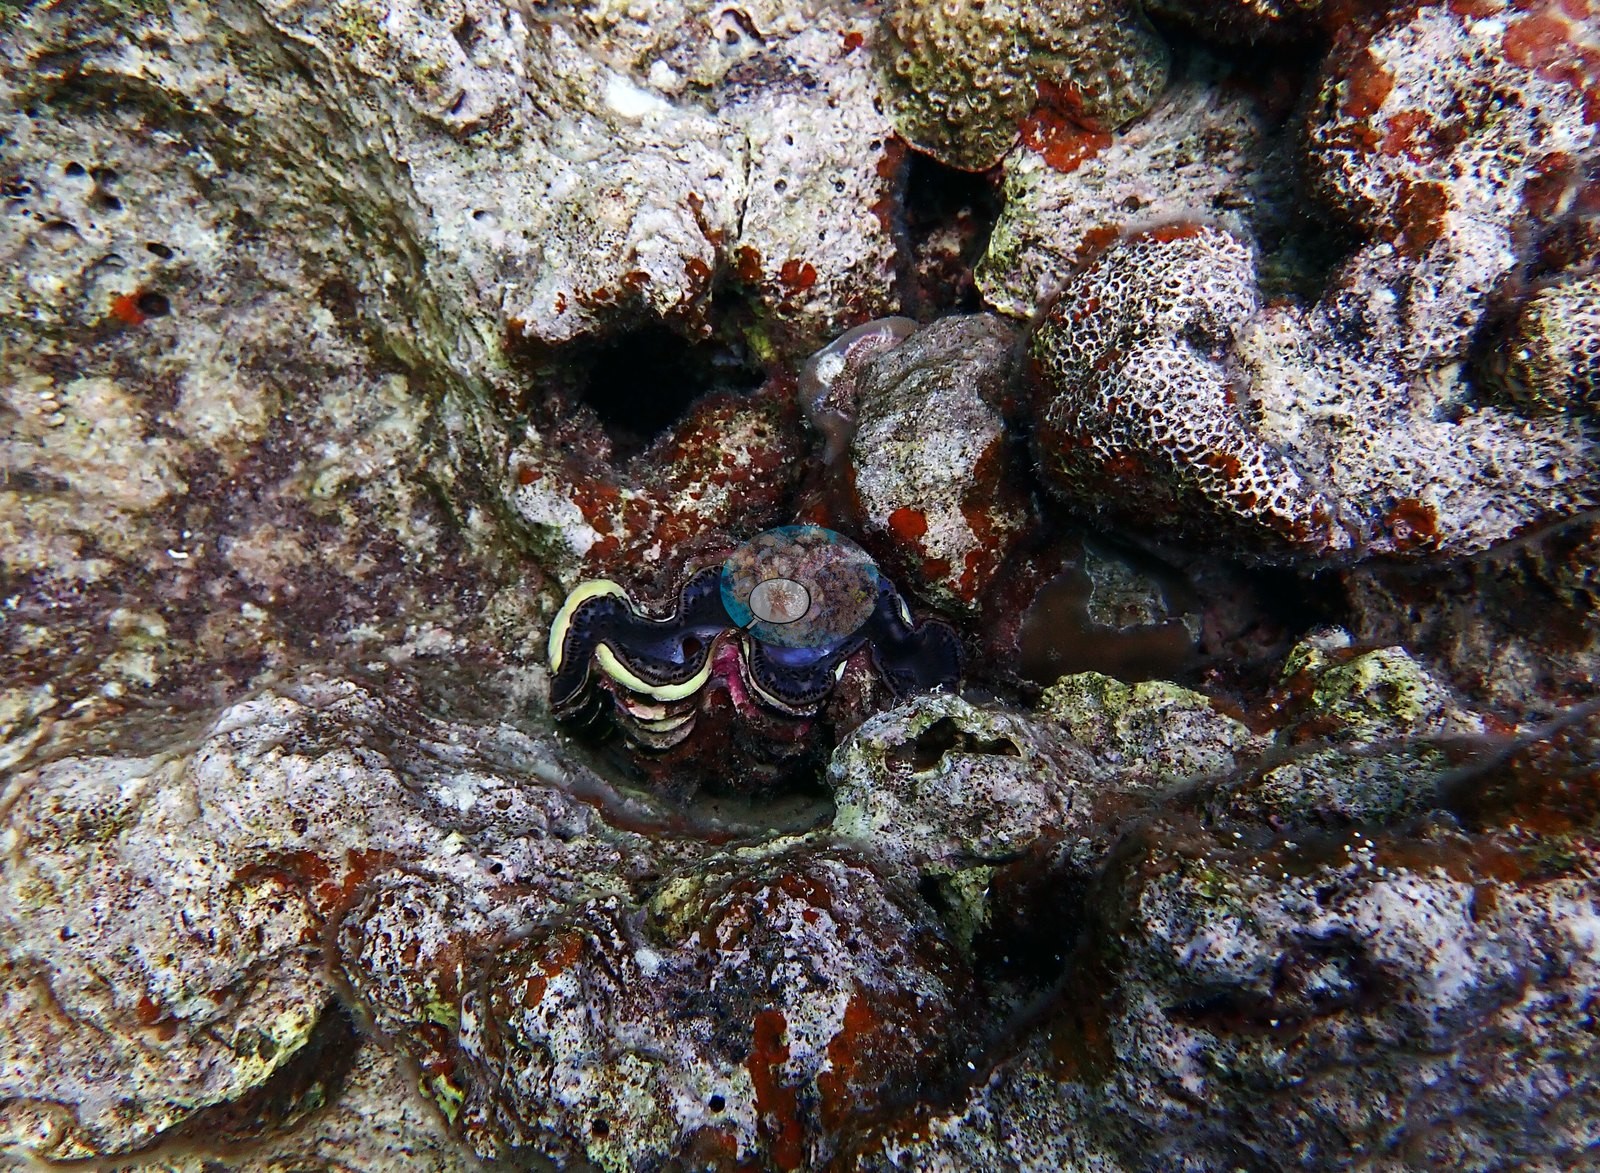
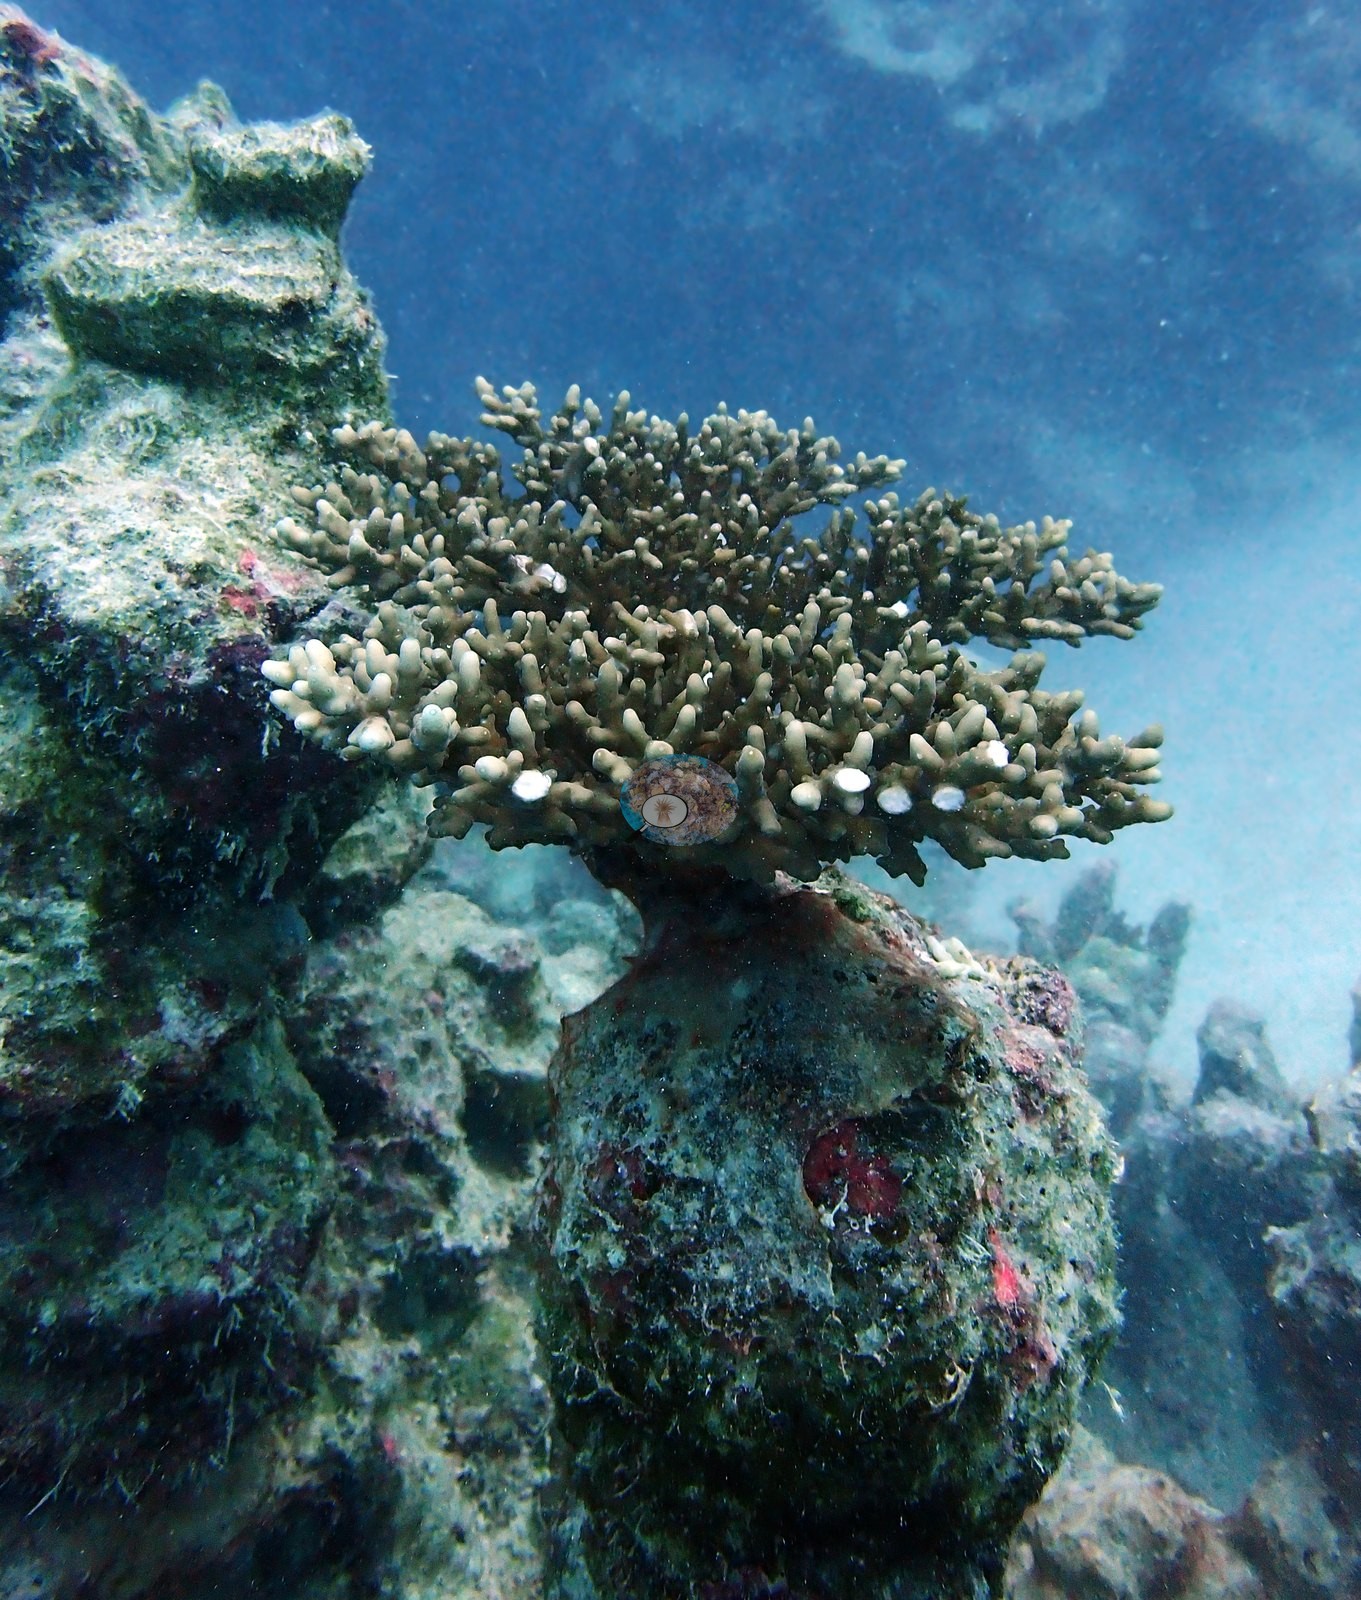
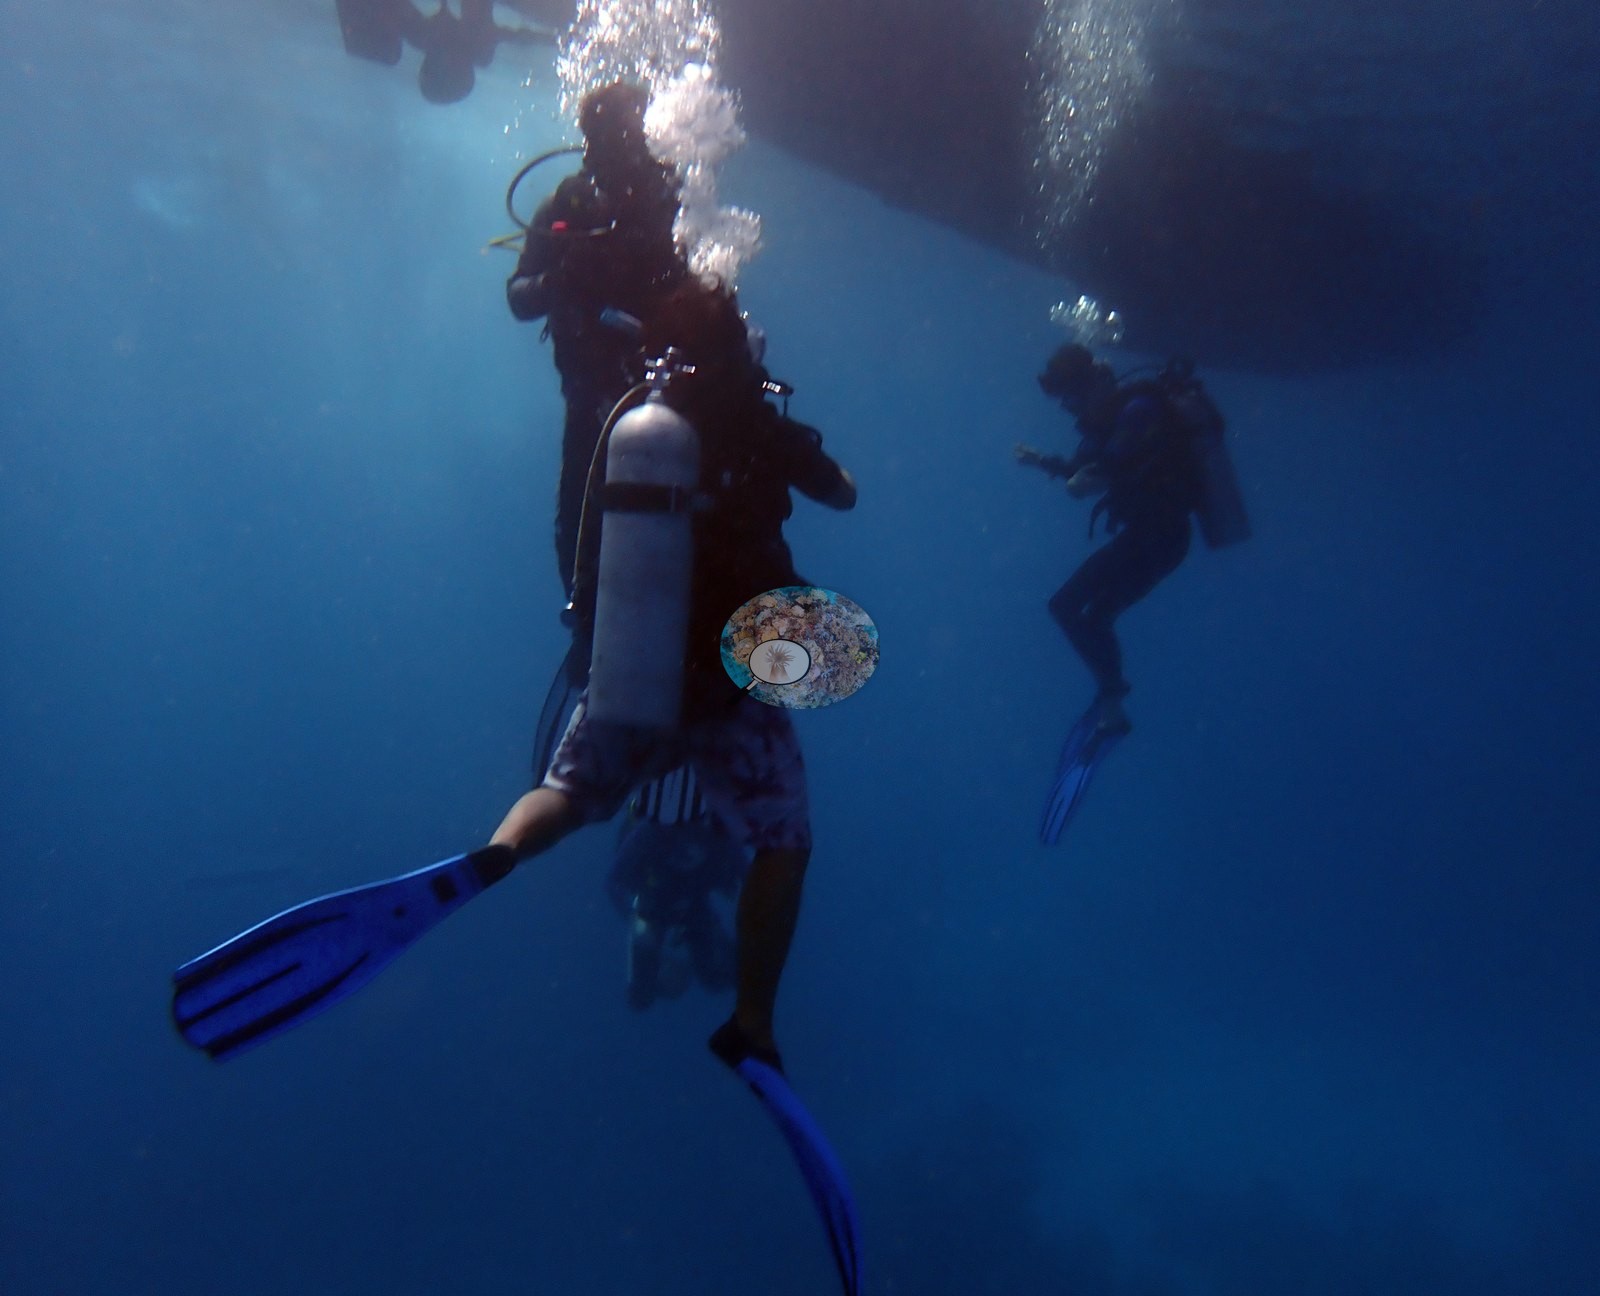
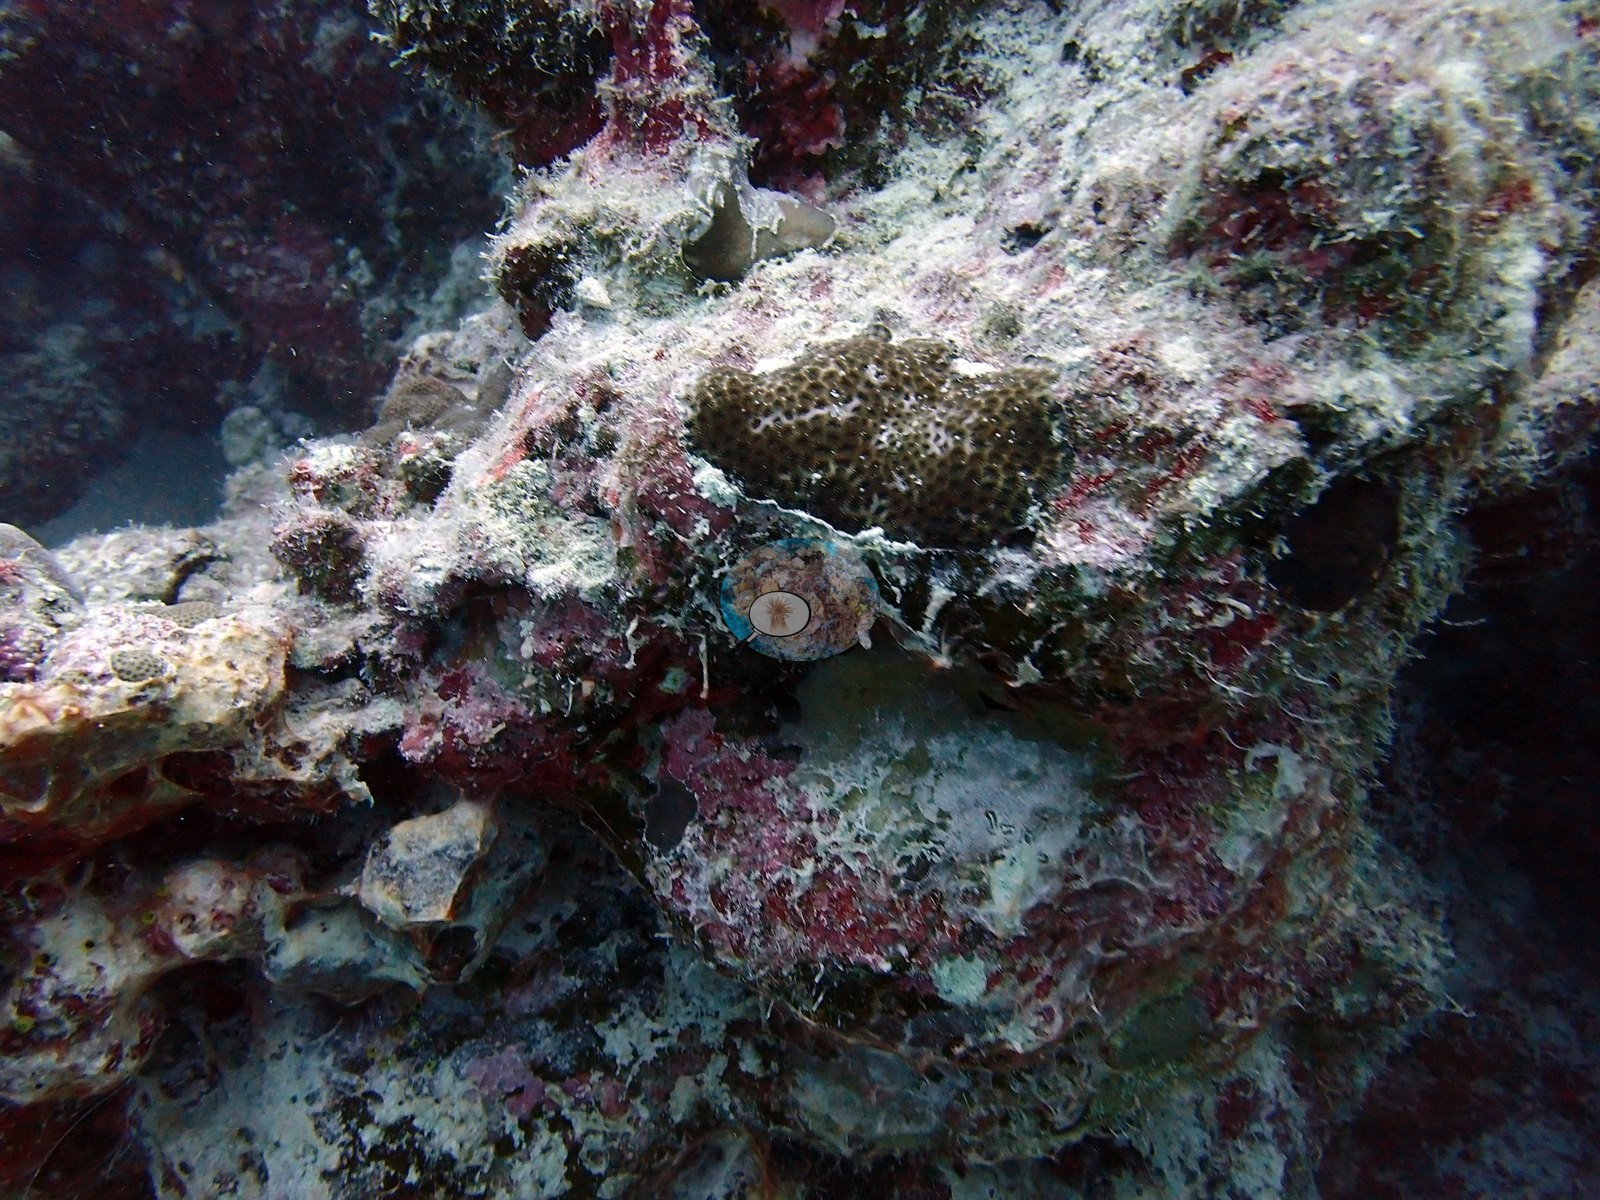
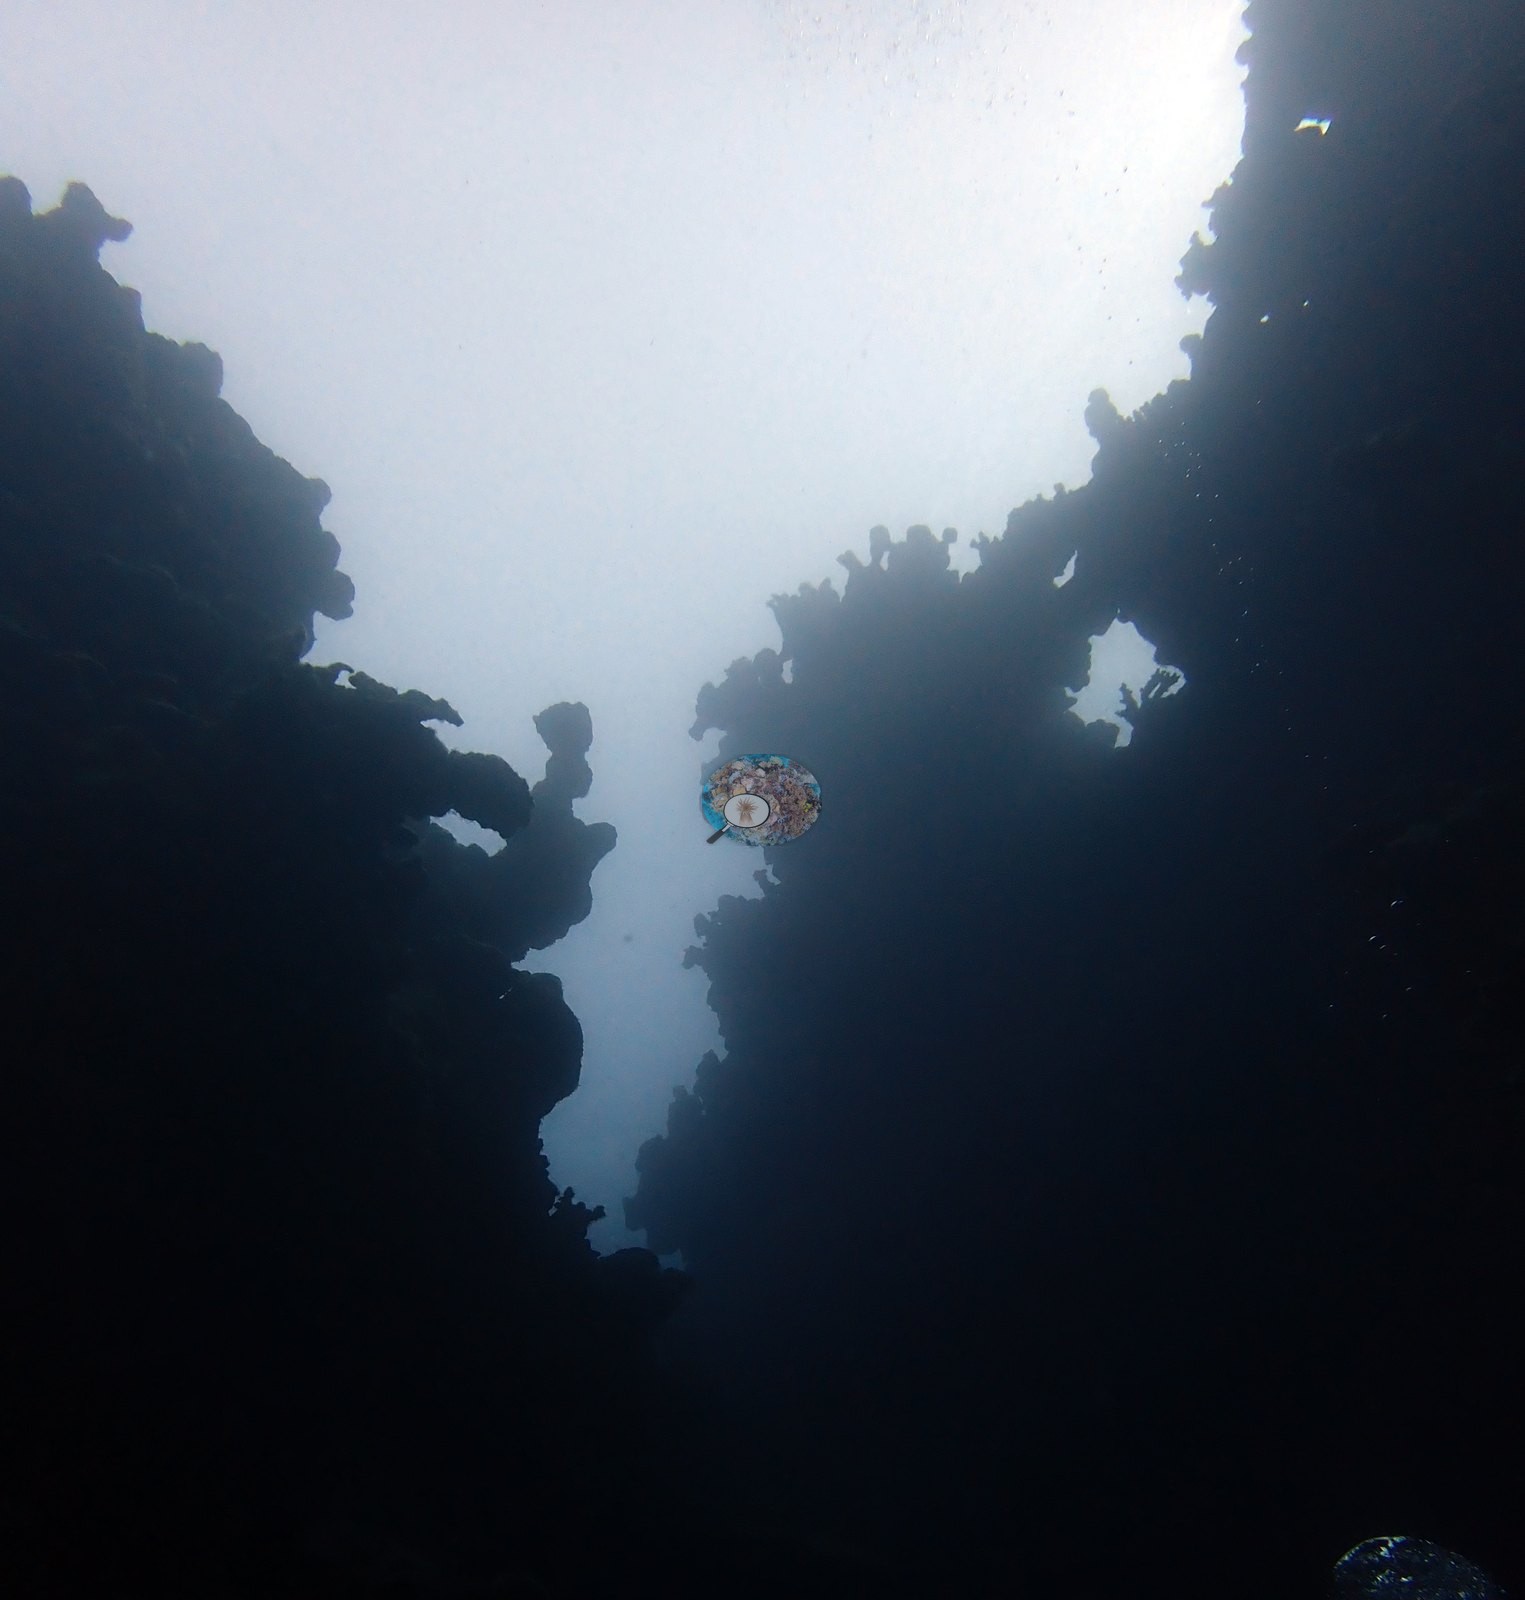
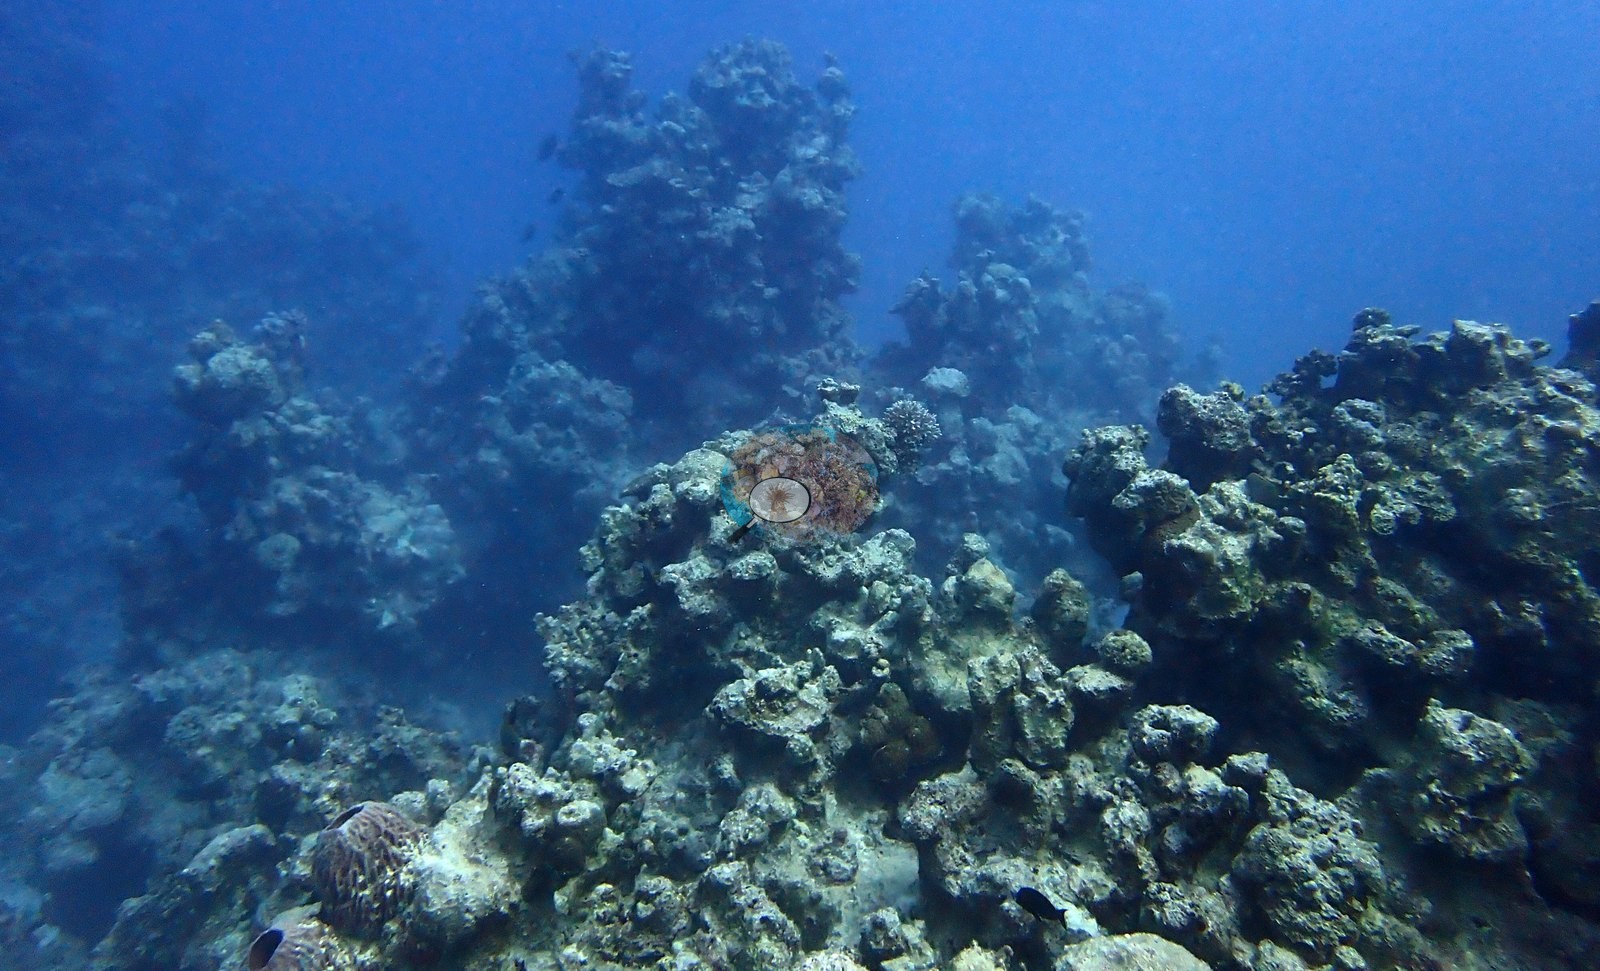
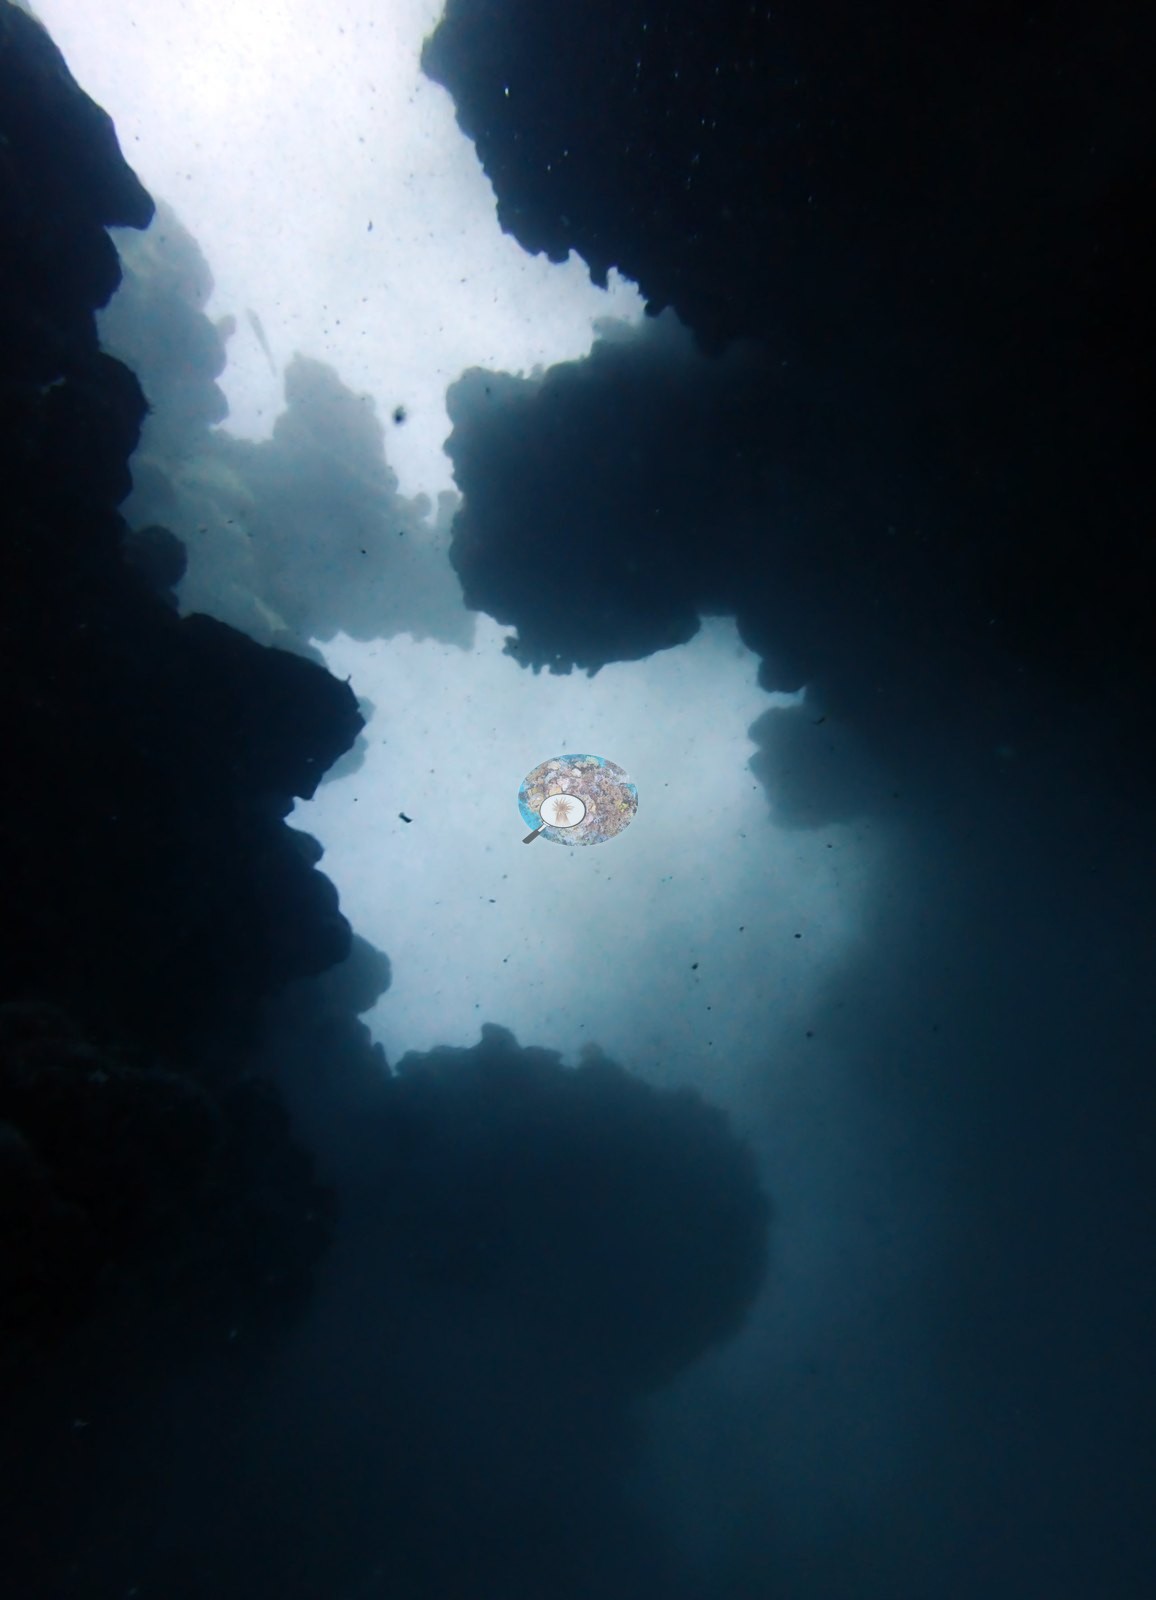
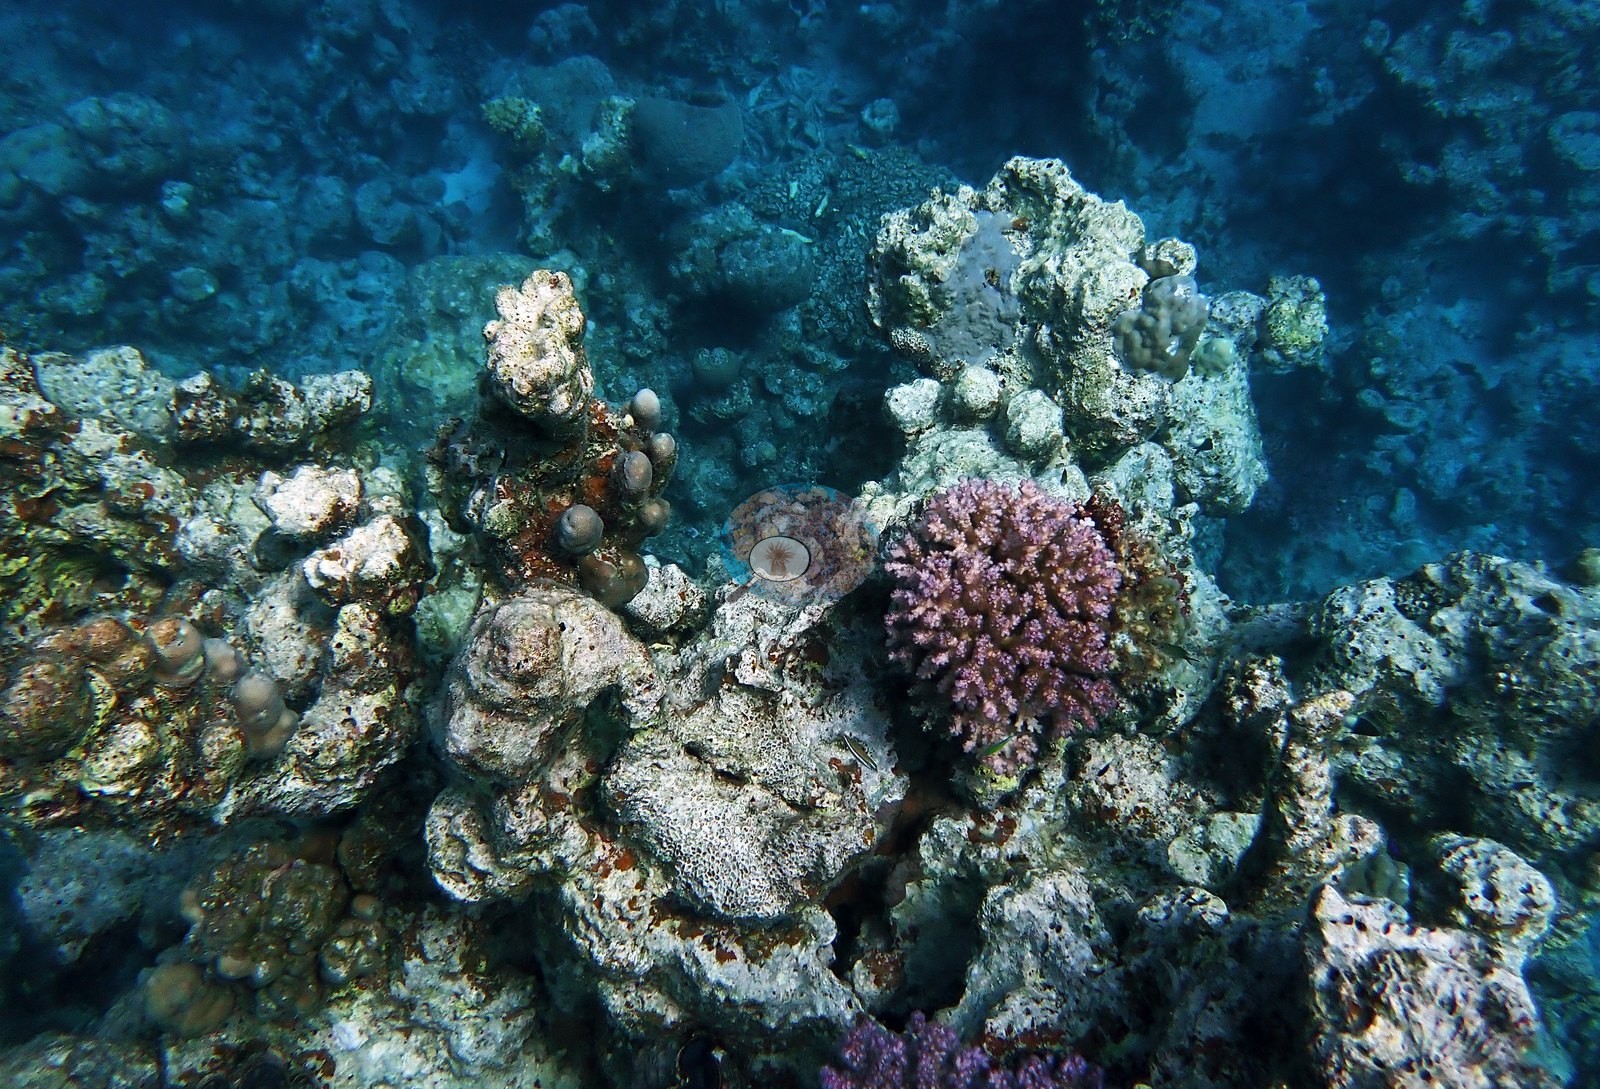
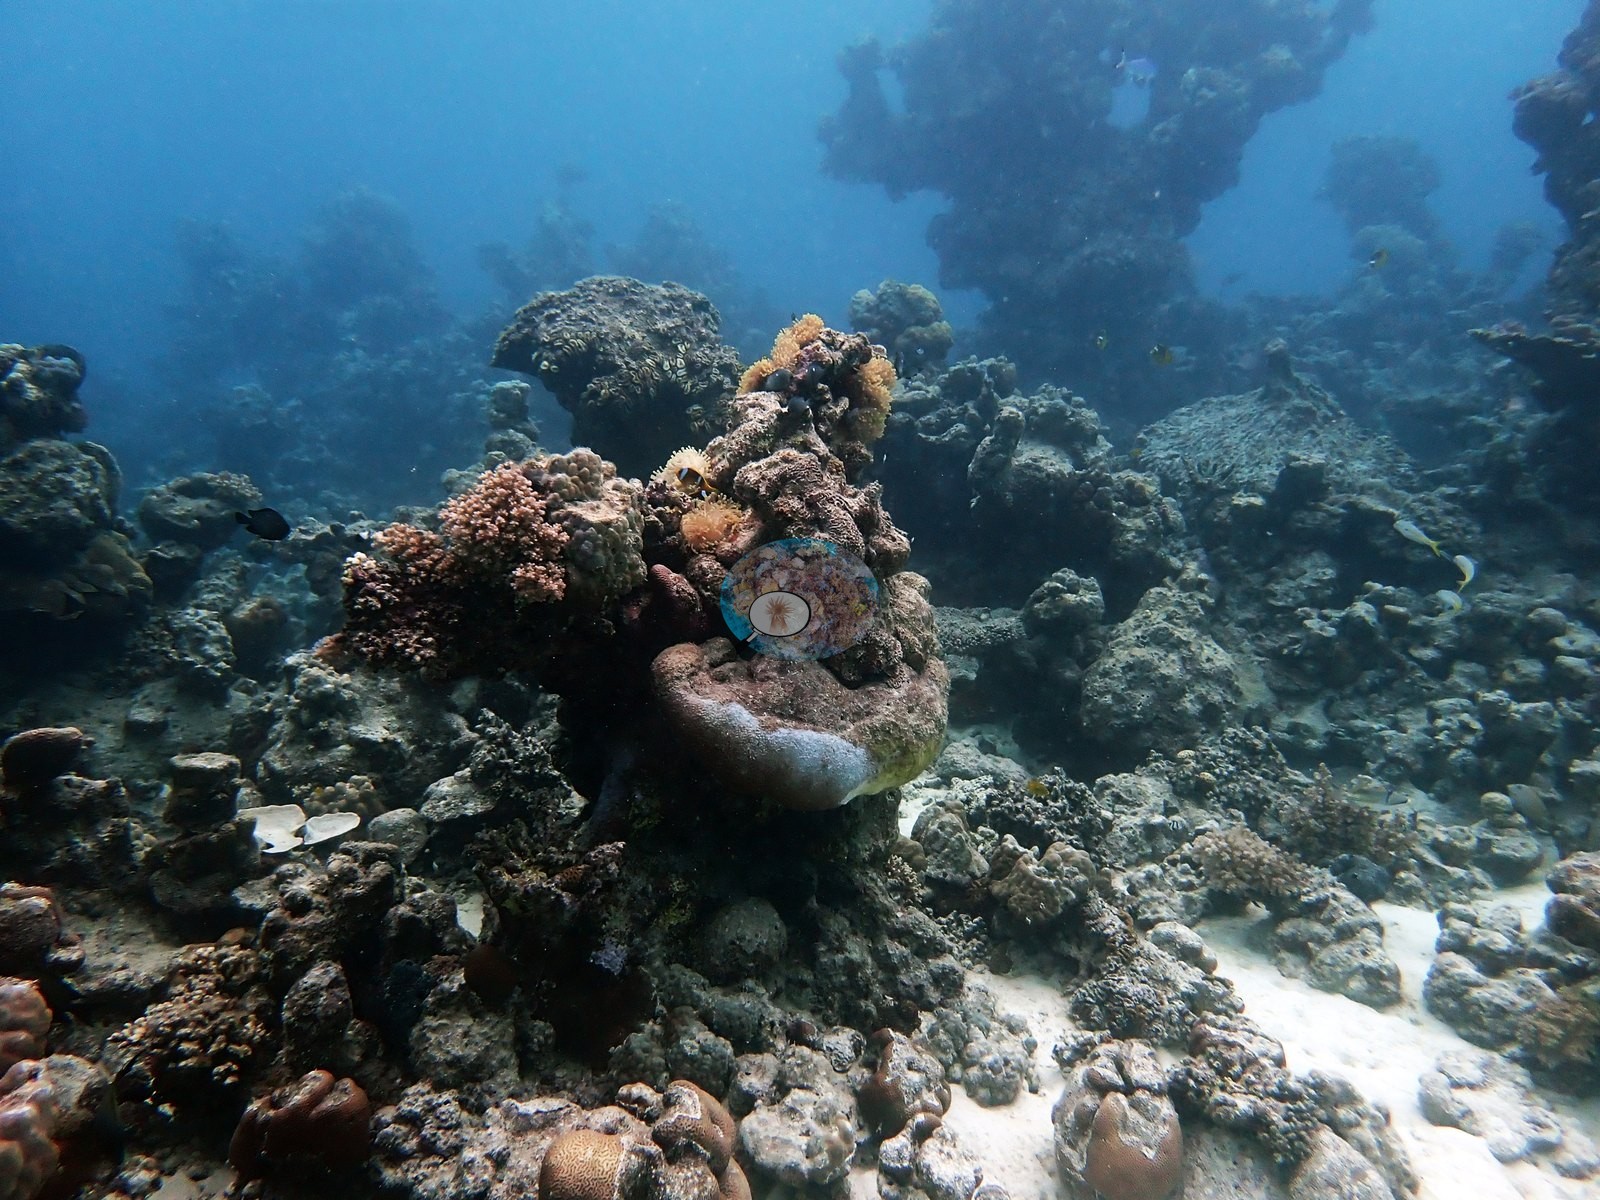
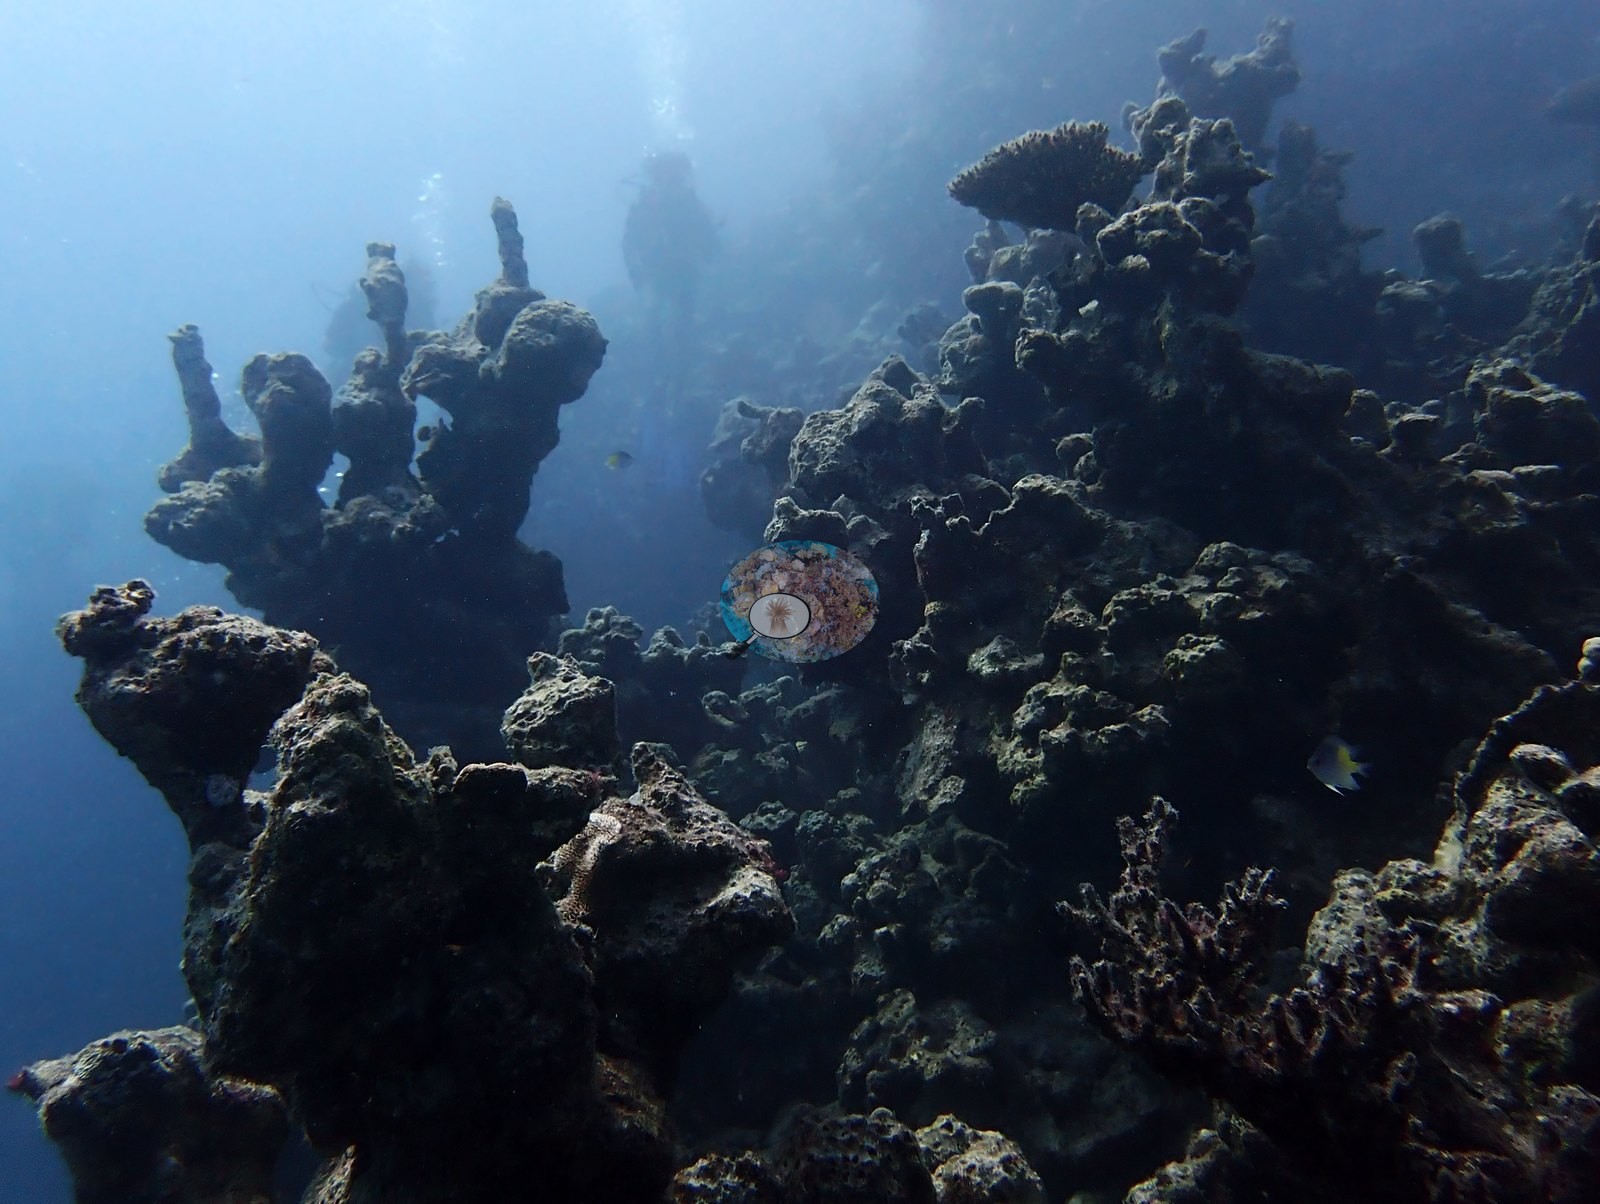
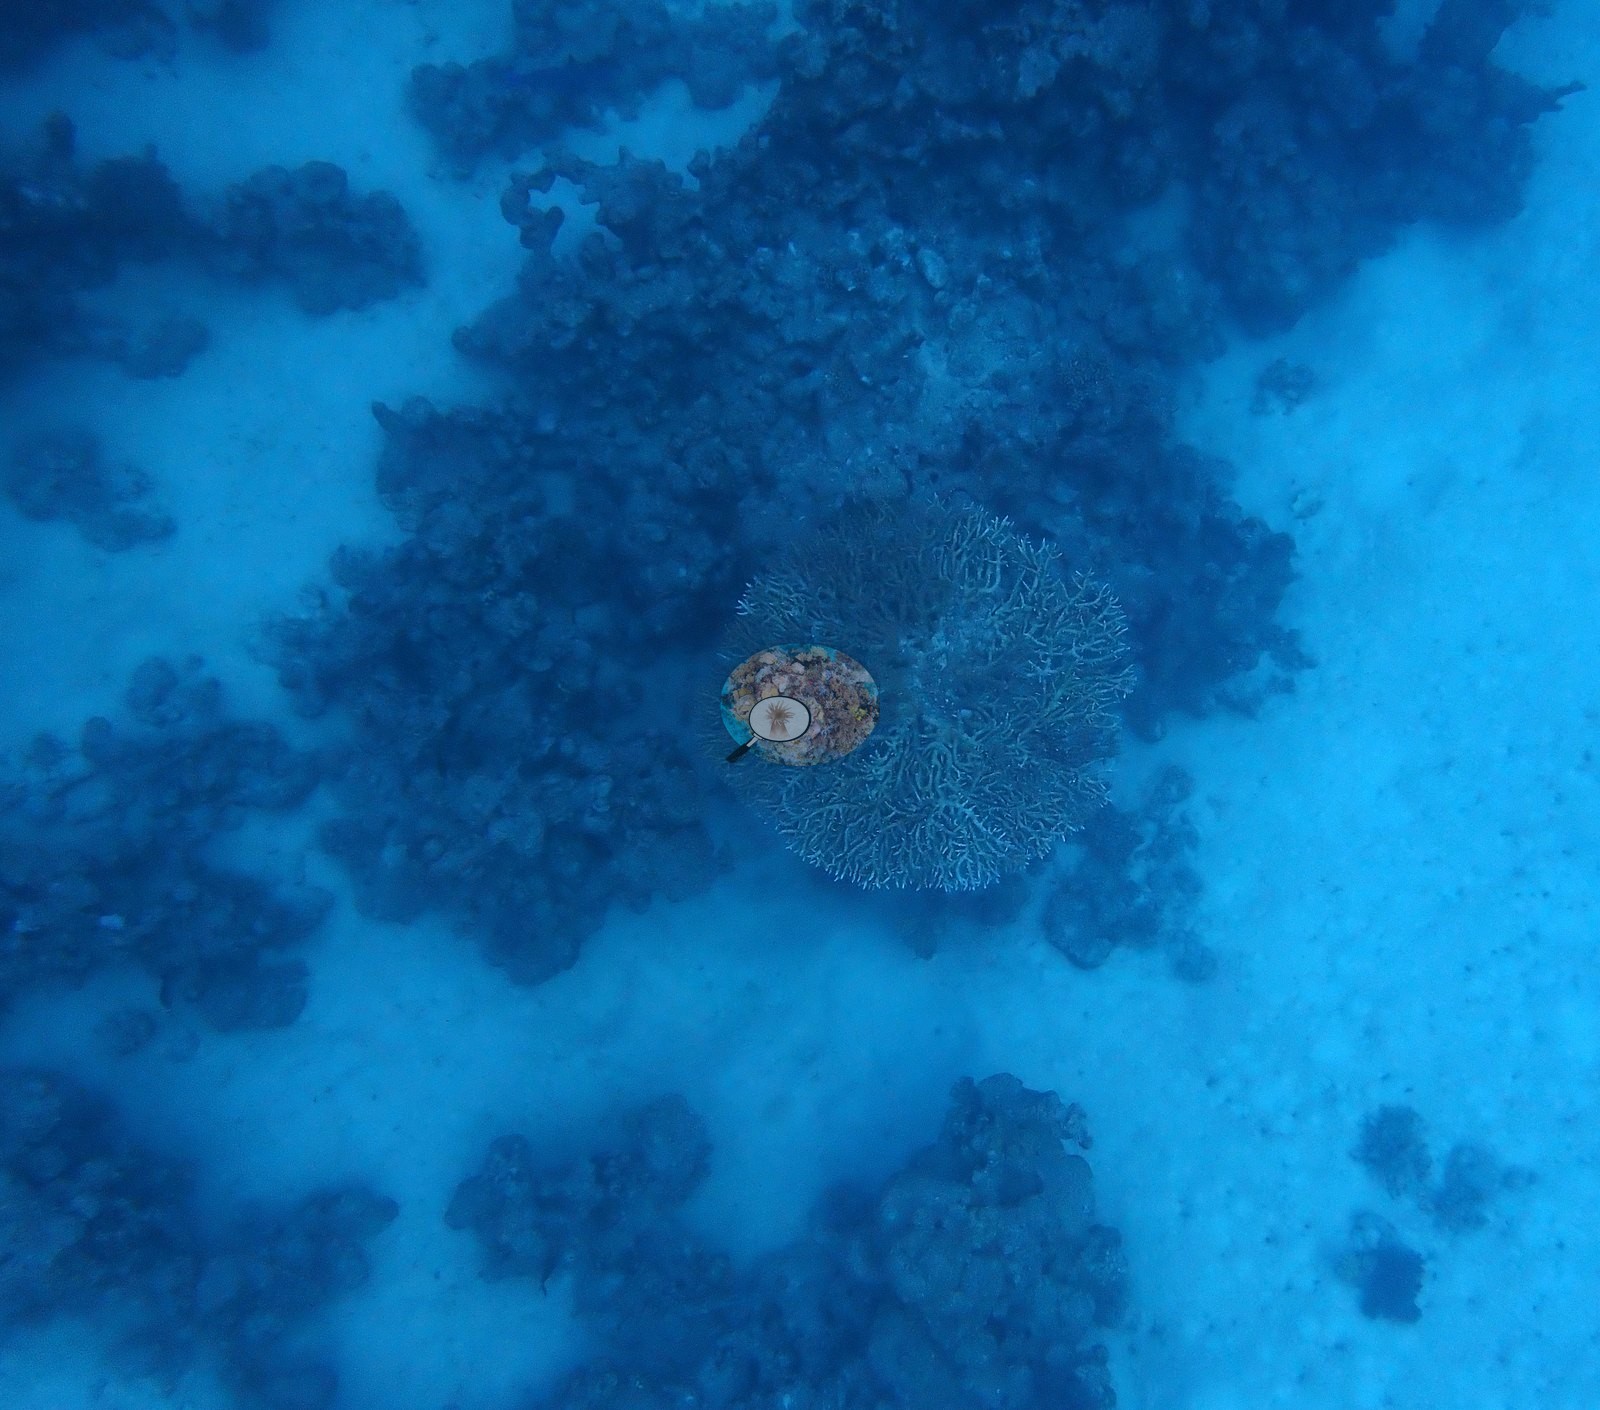
The site is named for its caverns, and one frame is shot from inside one — looking up through a ragged gap in the reef roof at bright surface light, the walls in silhouette. Outside the caves the structure is a field of eroded limestone pinnacles and buttresses rising from white sand, tall, undercut, and heavily bioeroded, standing in hazy blue water (e.g., Image 1, Image 2).
General benthic features
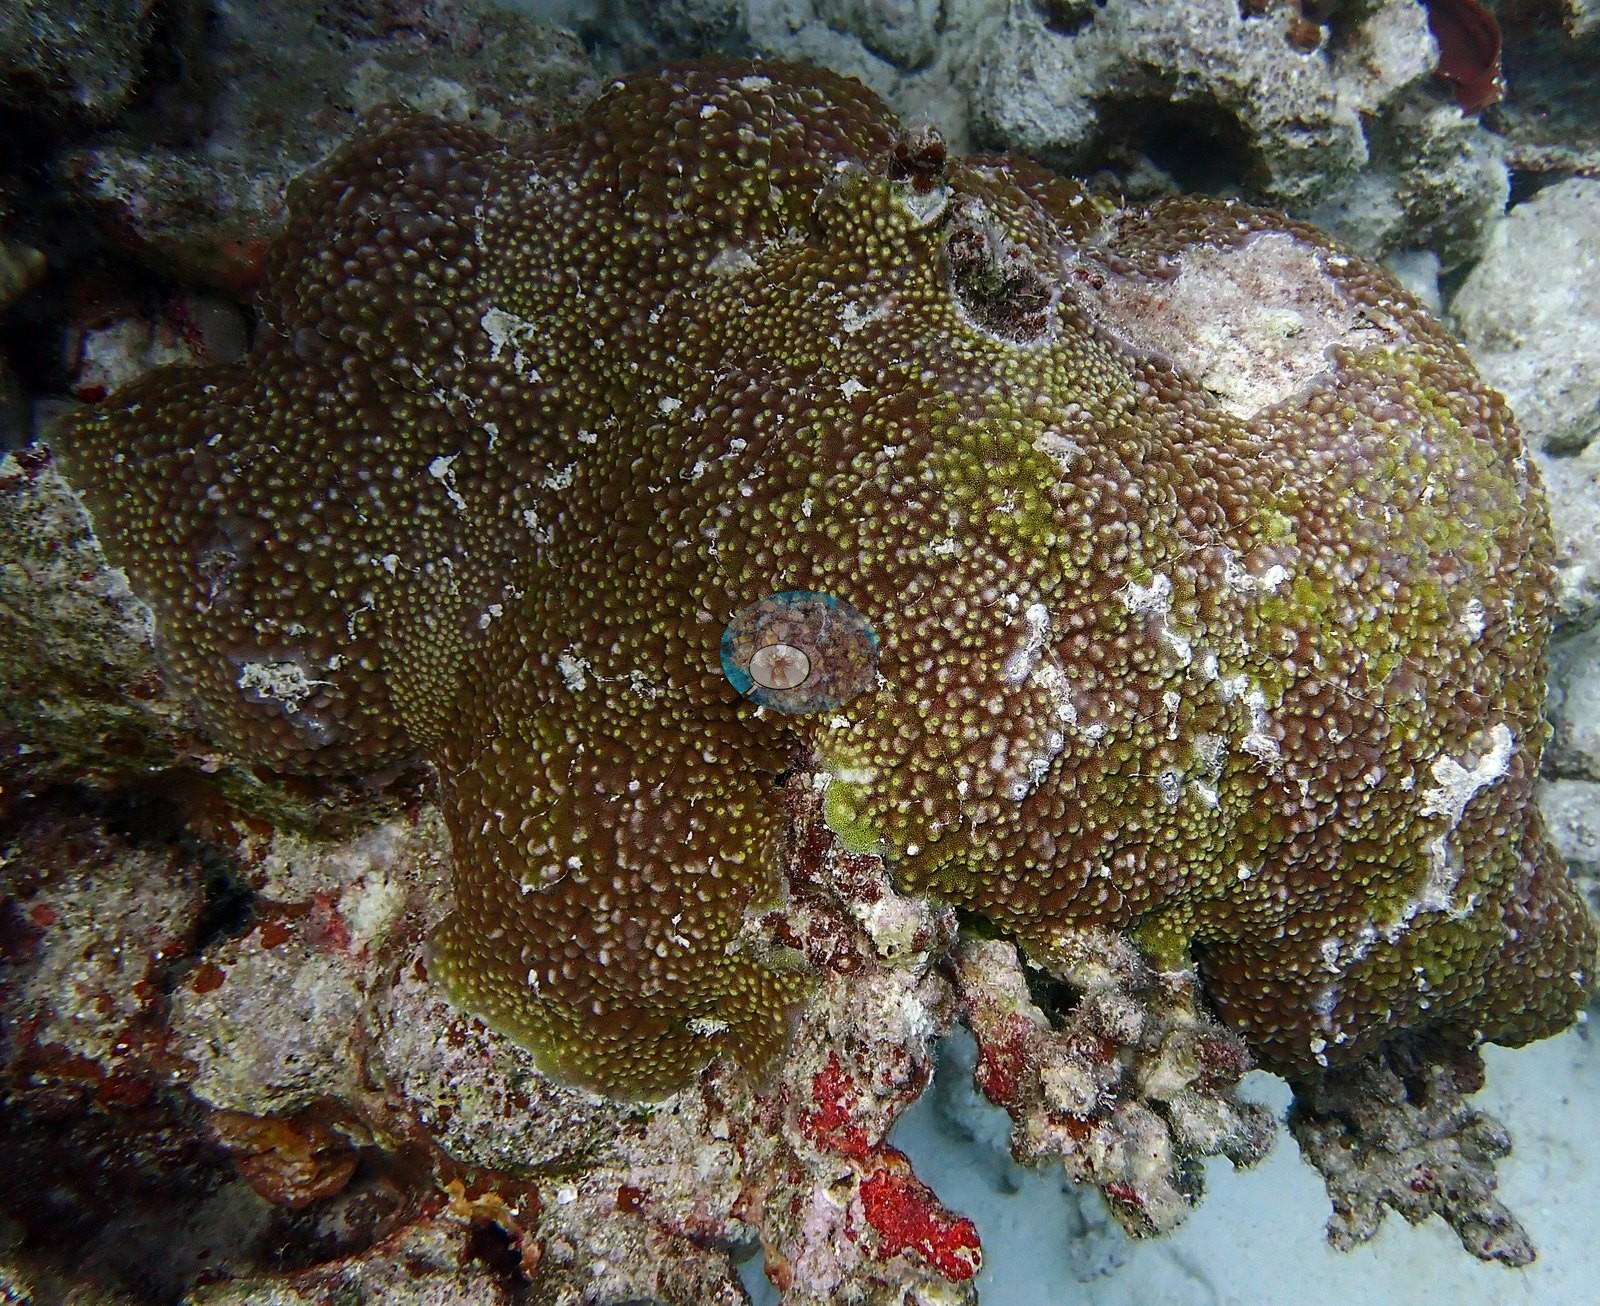
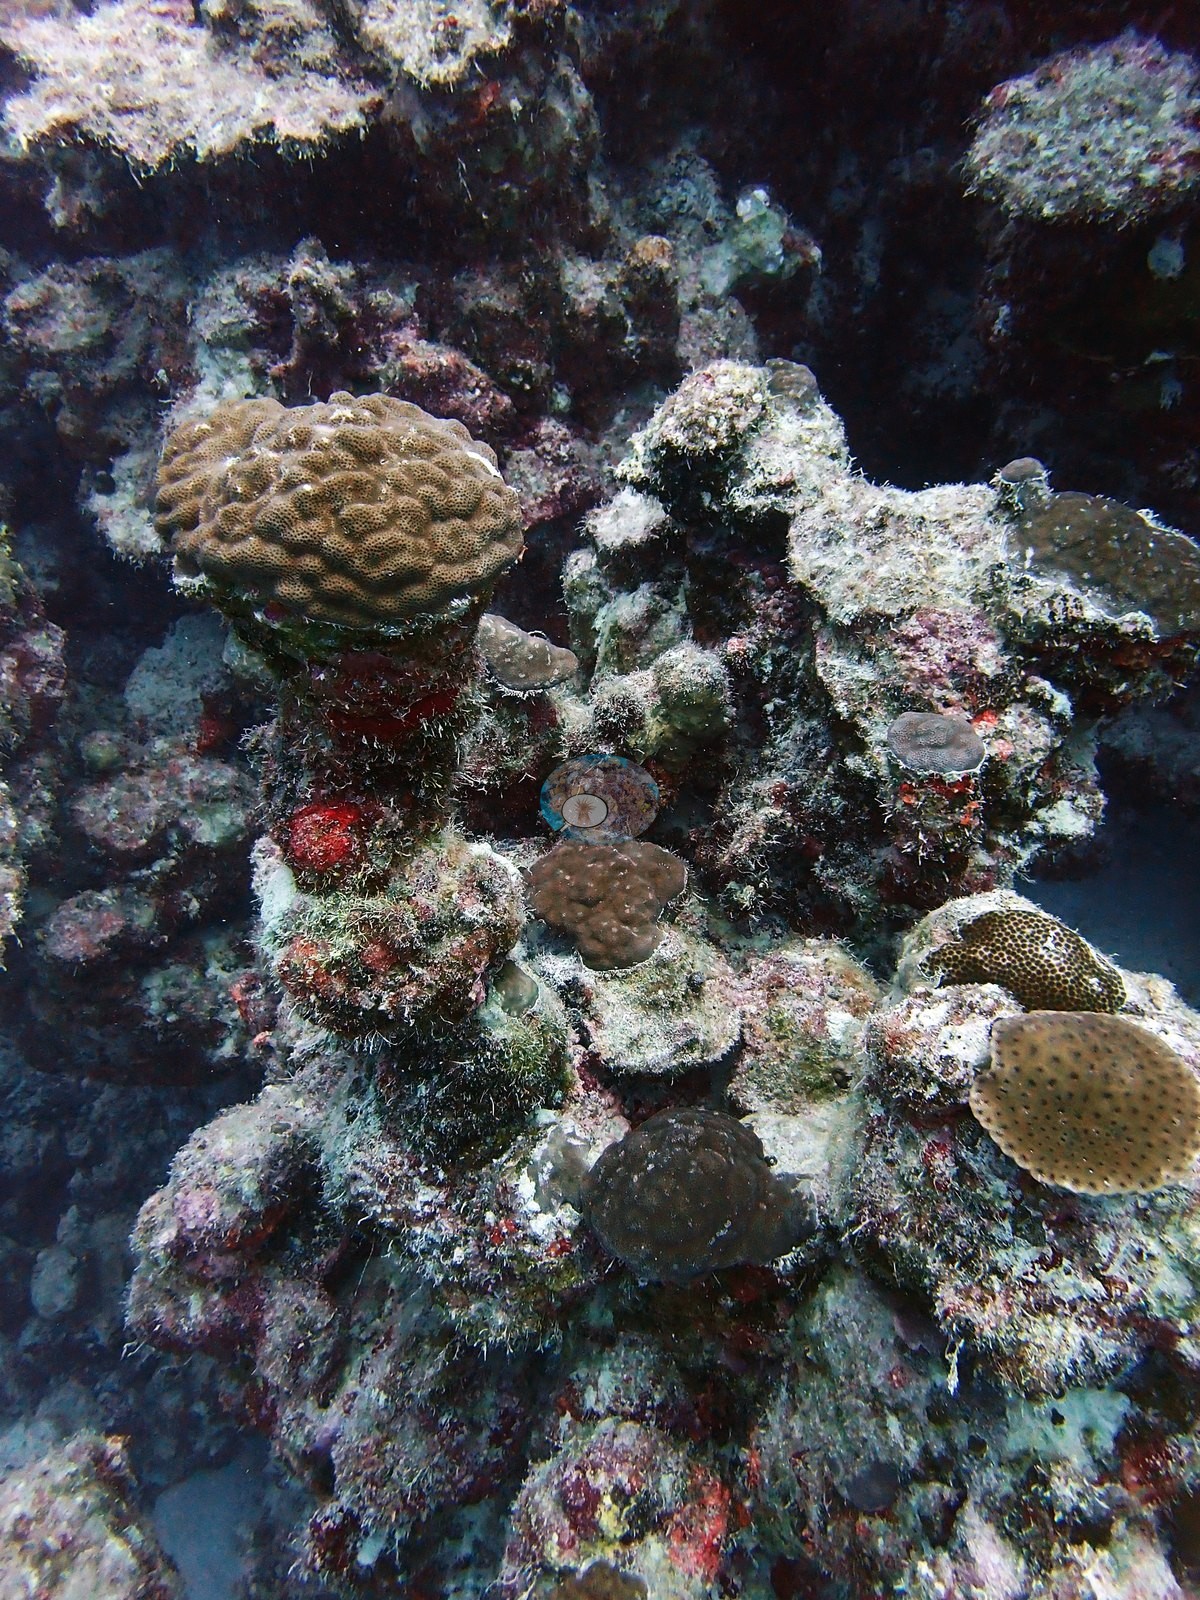
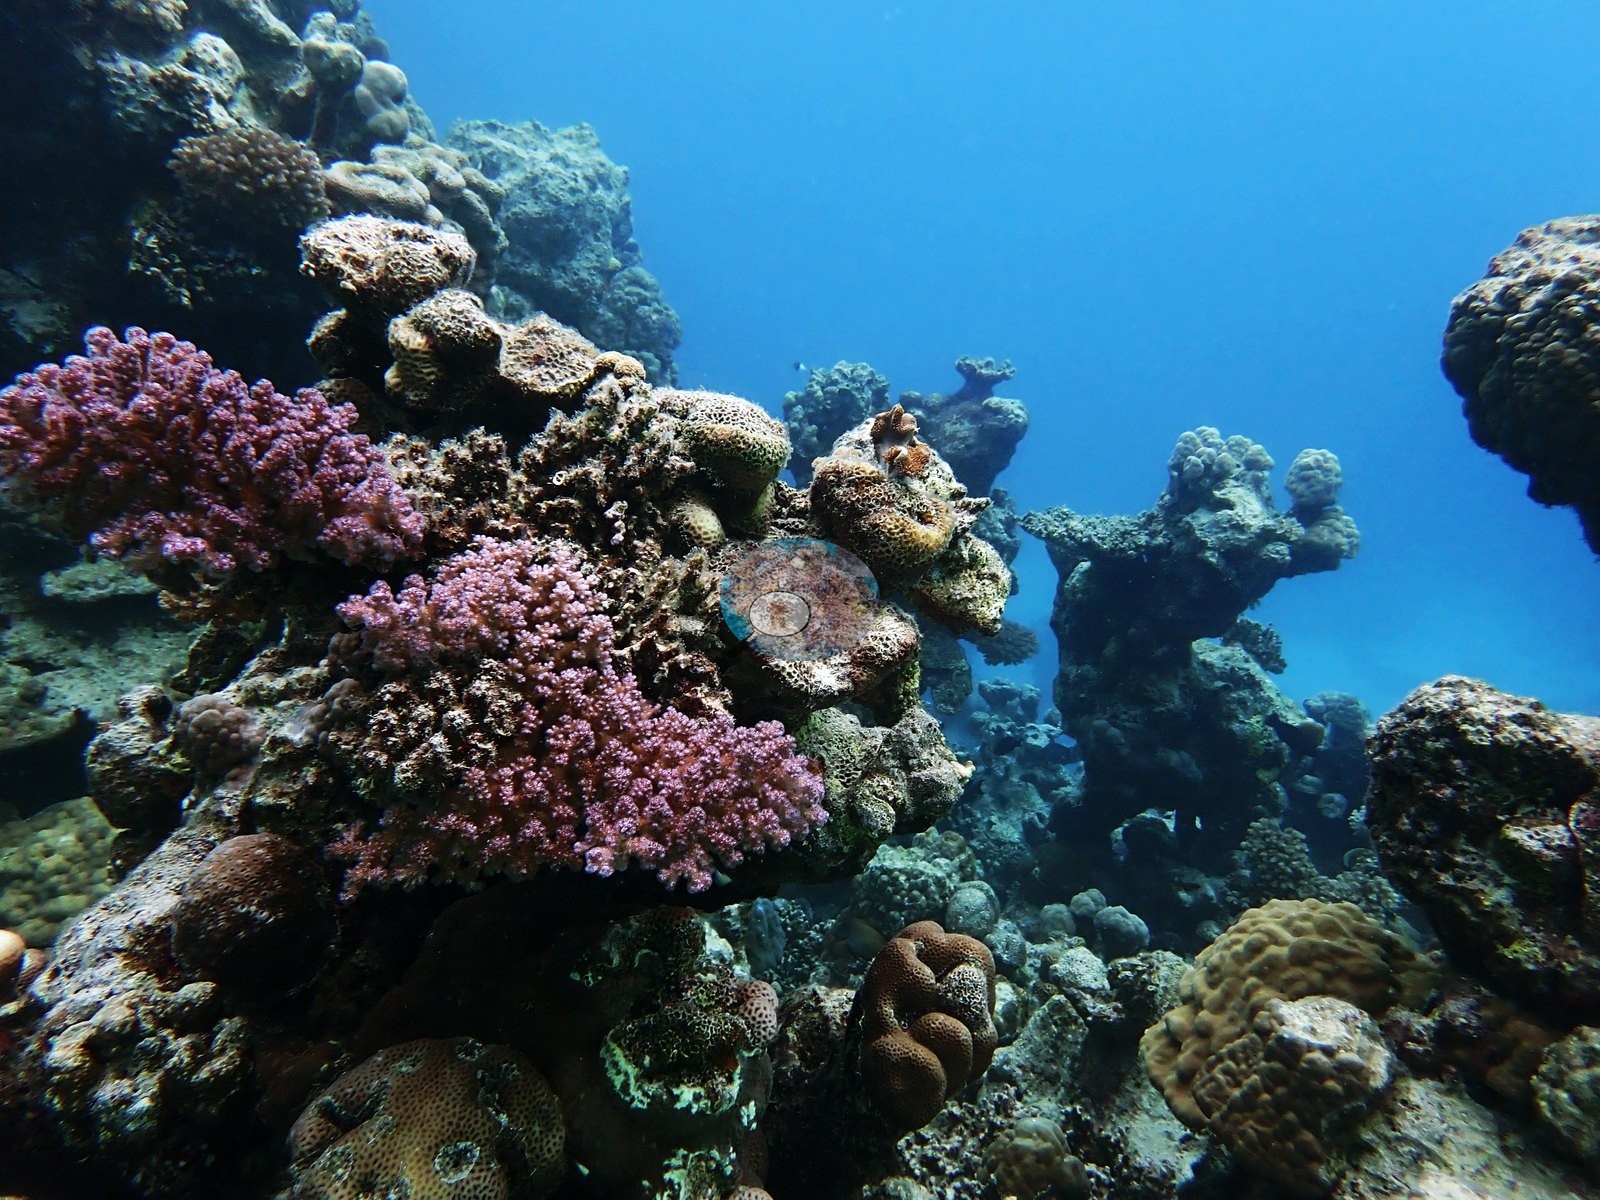
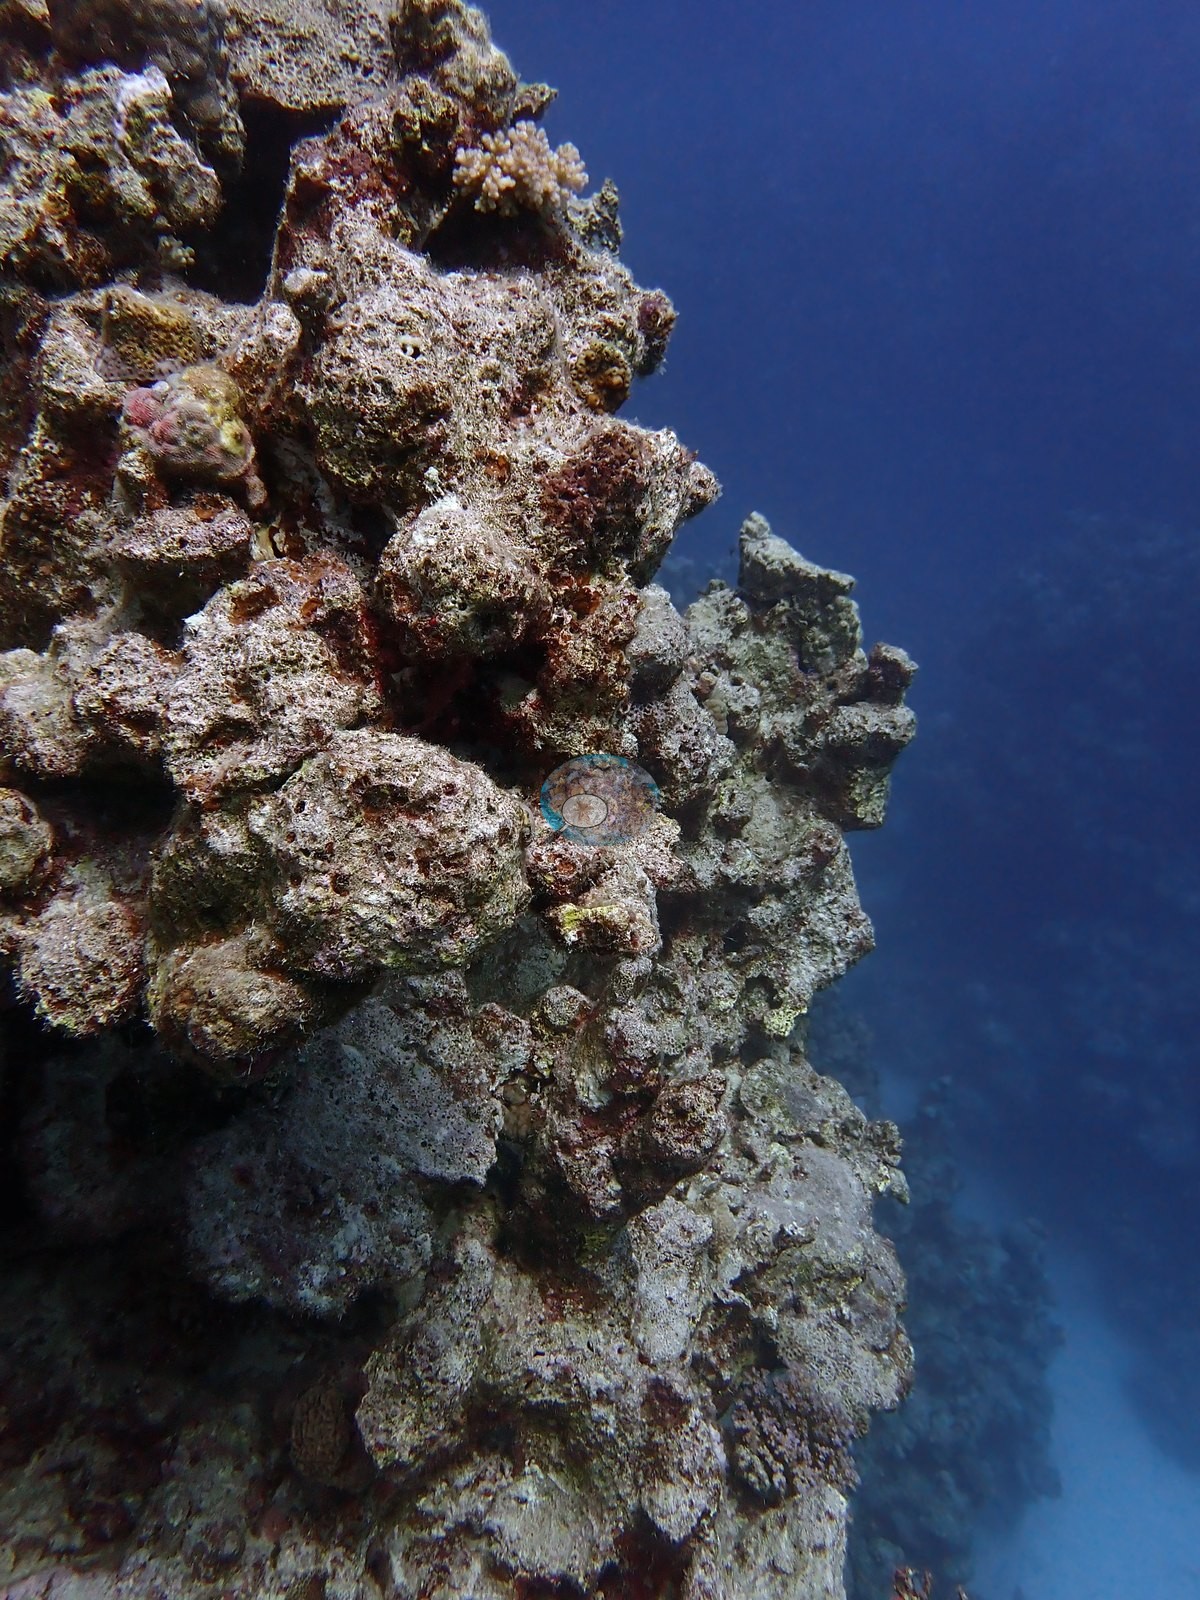
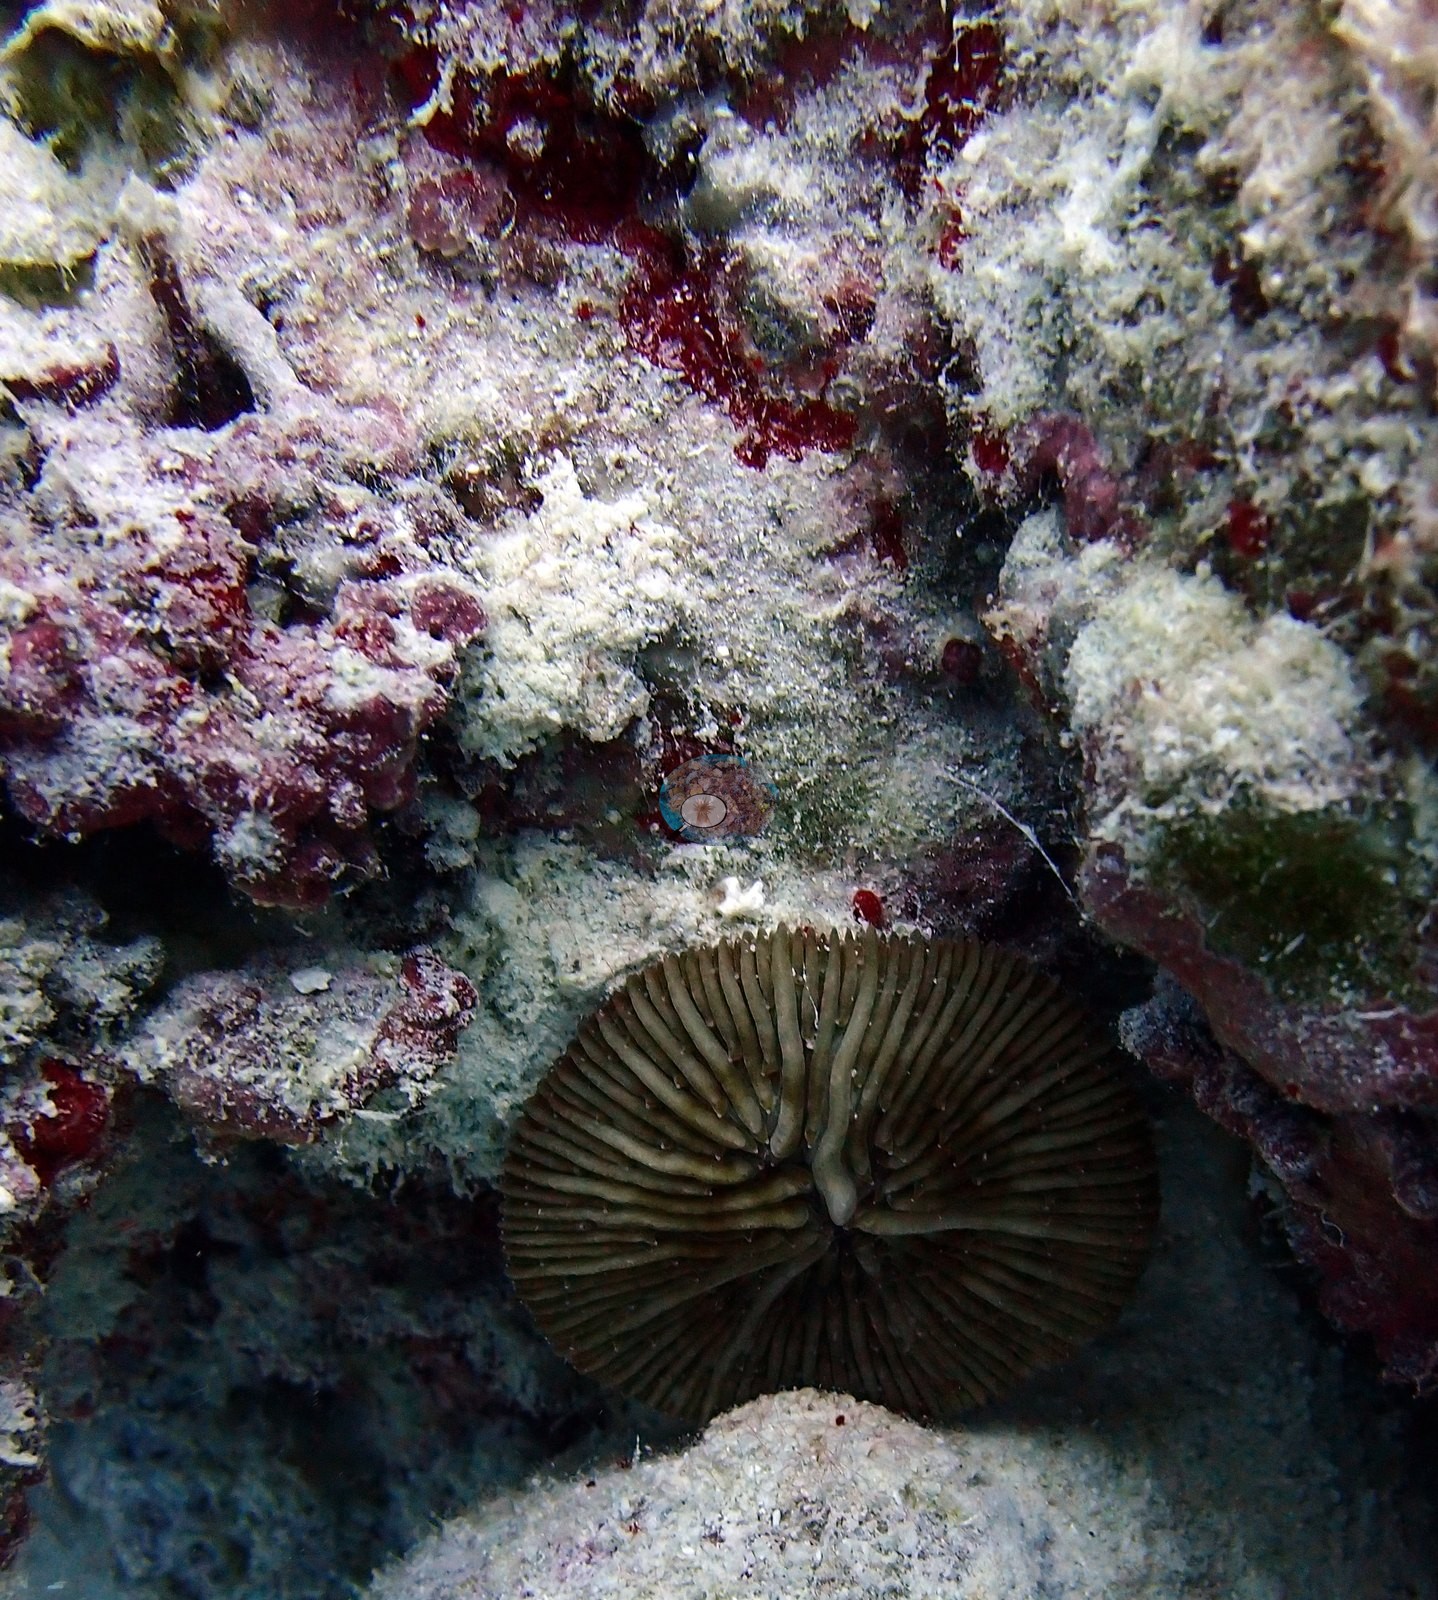
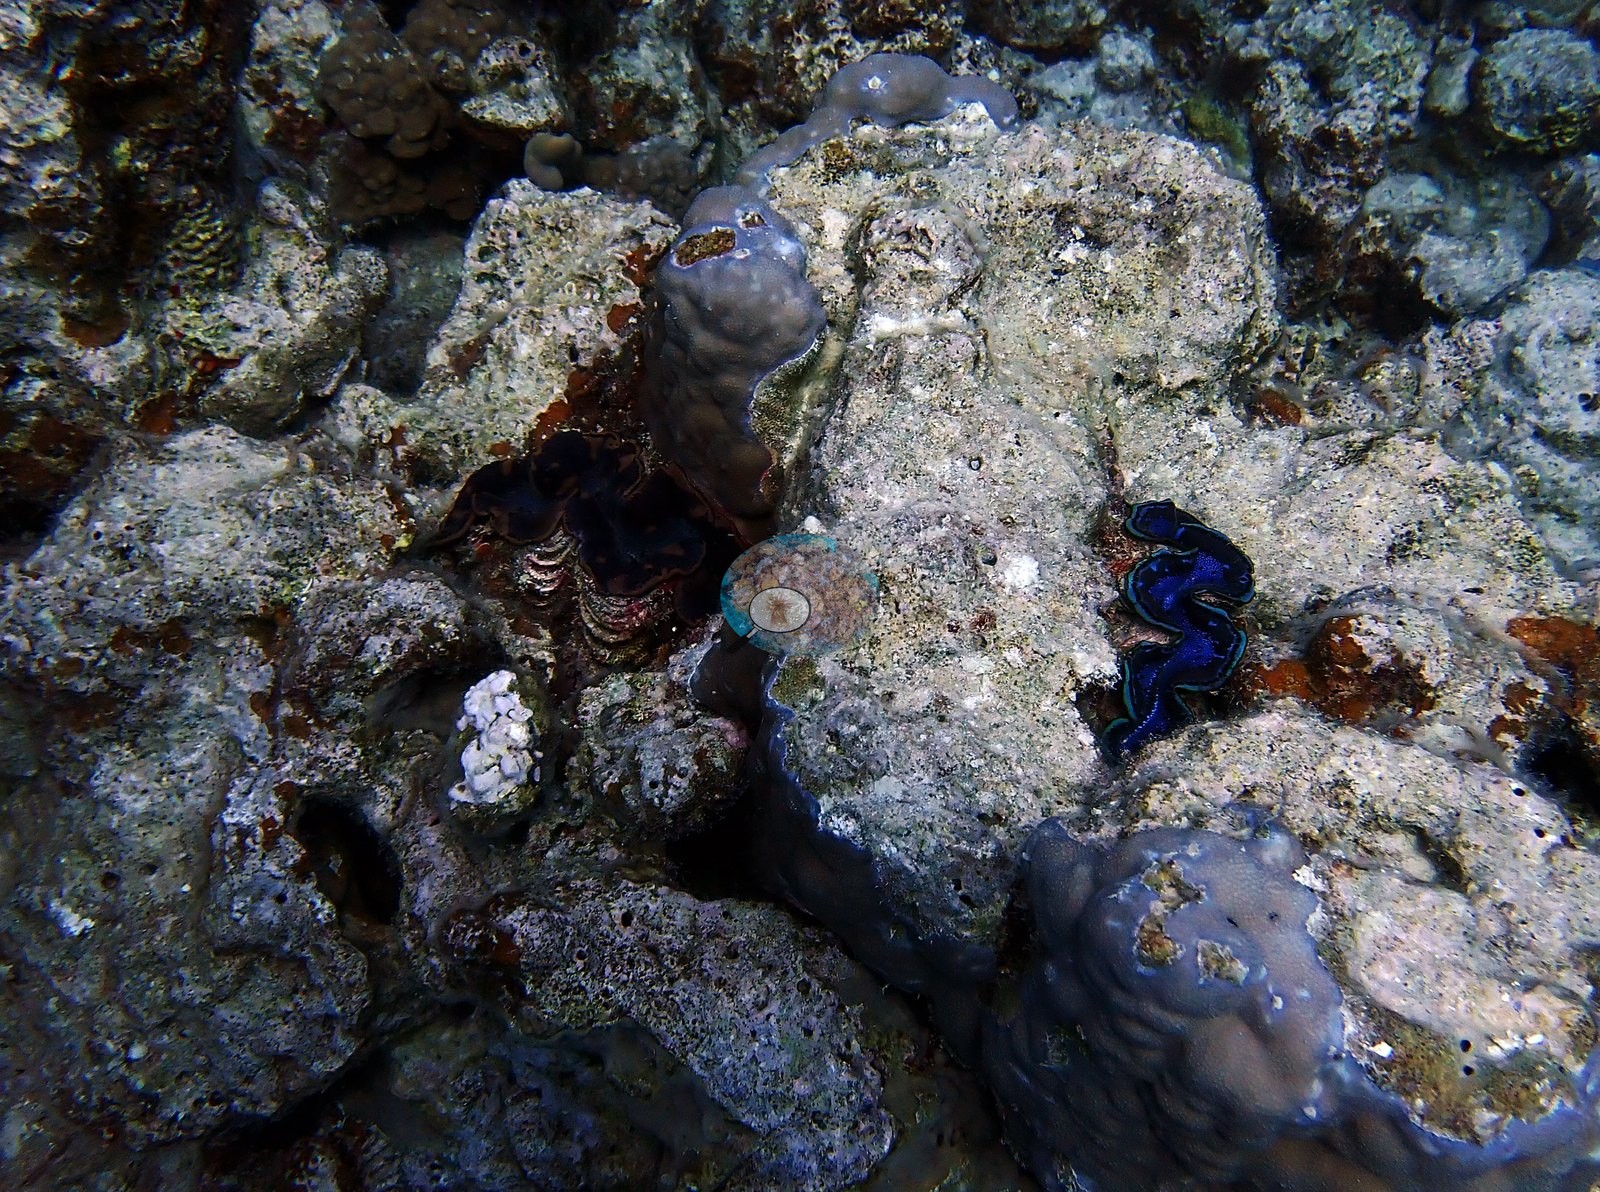
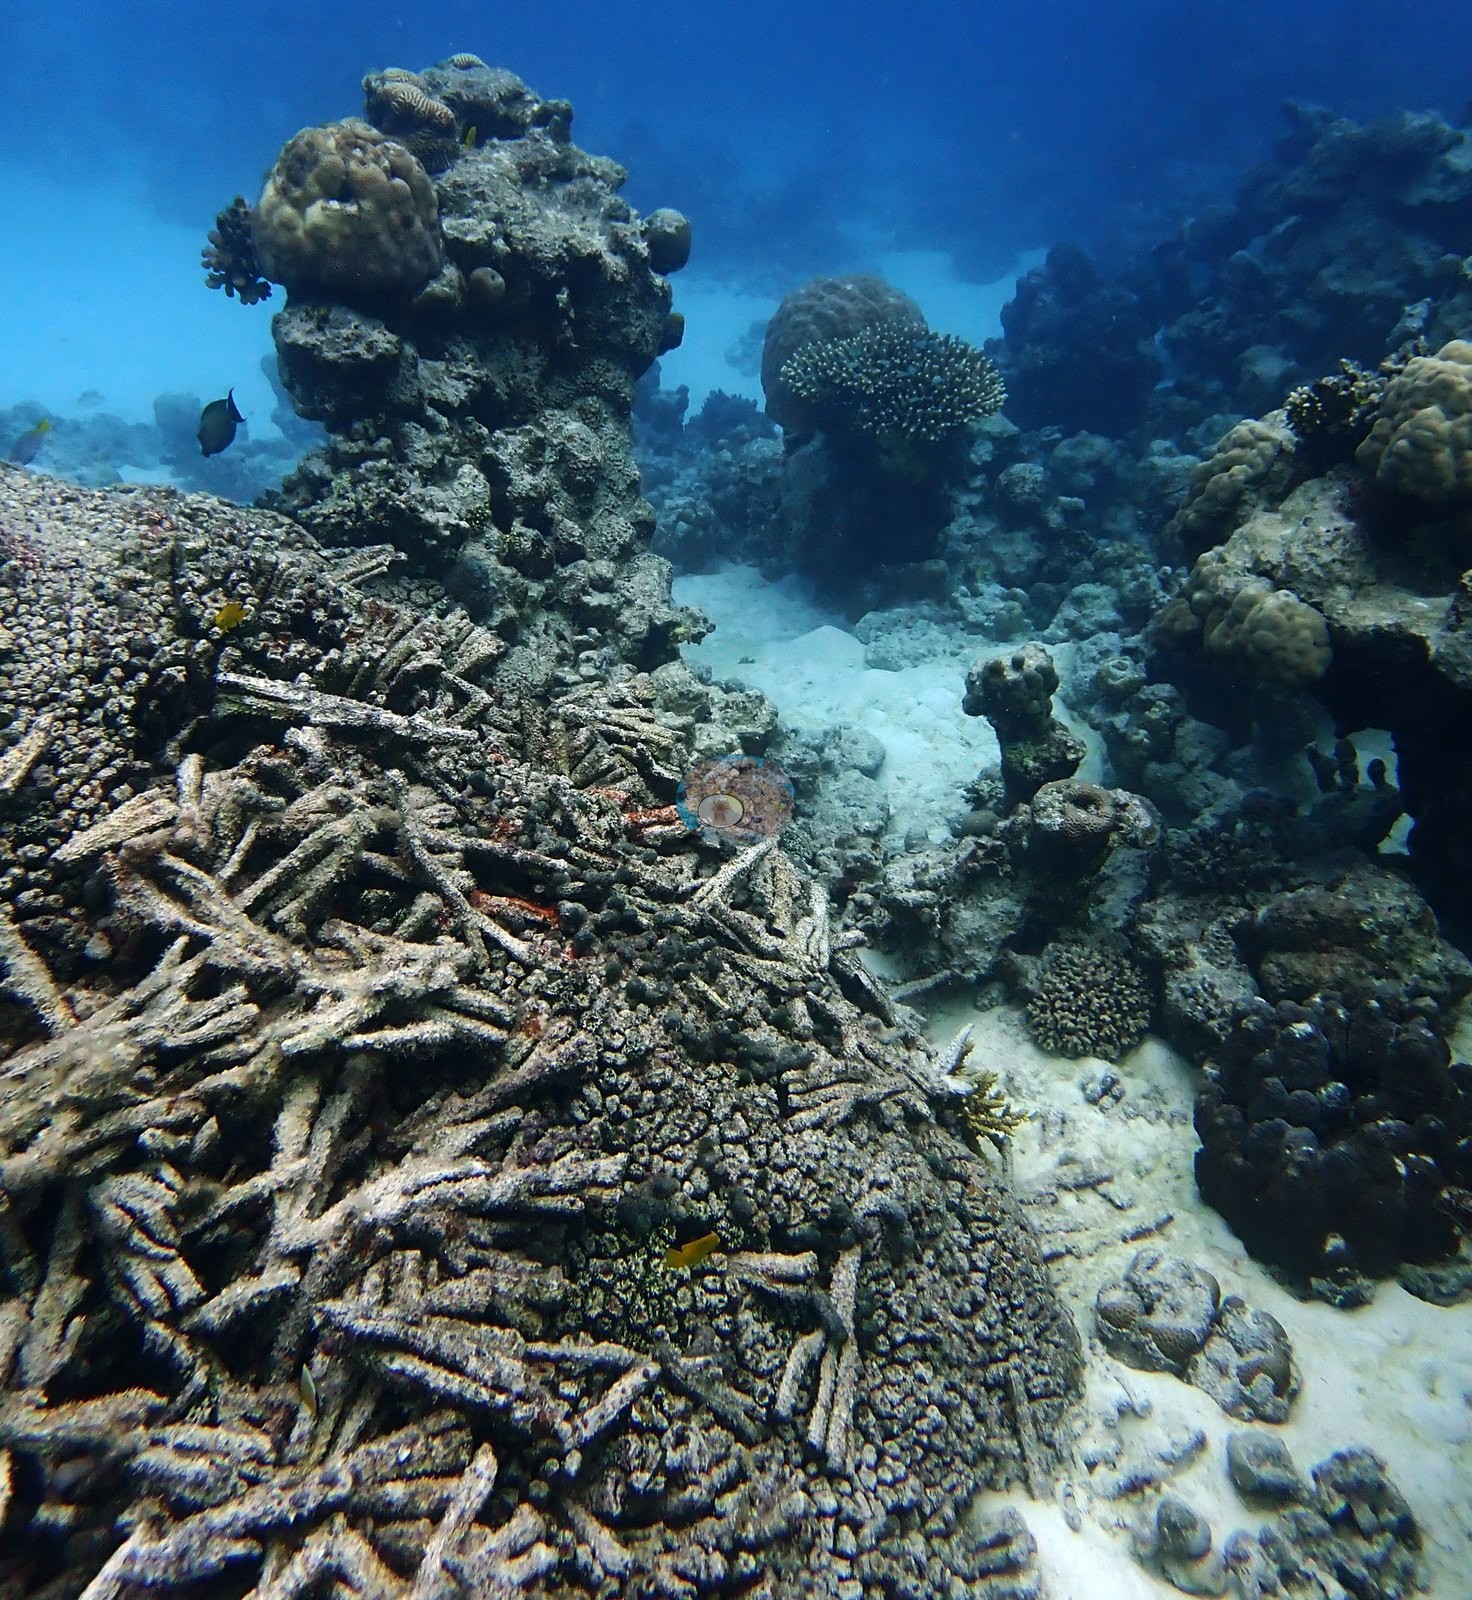
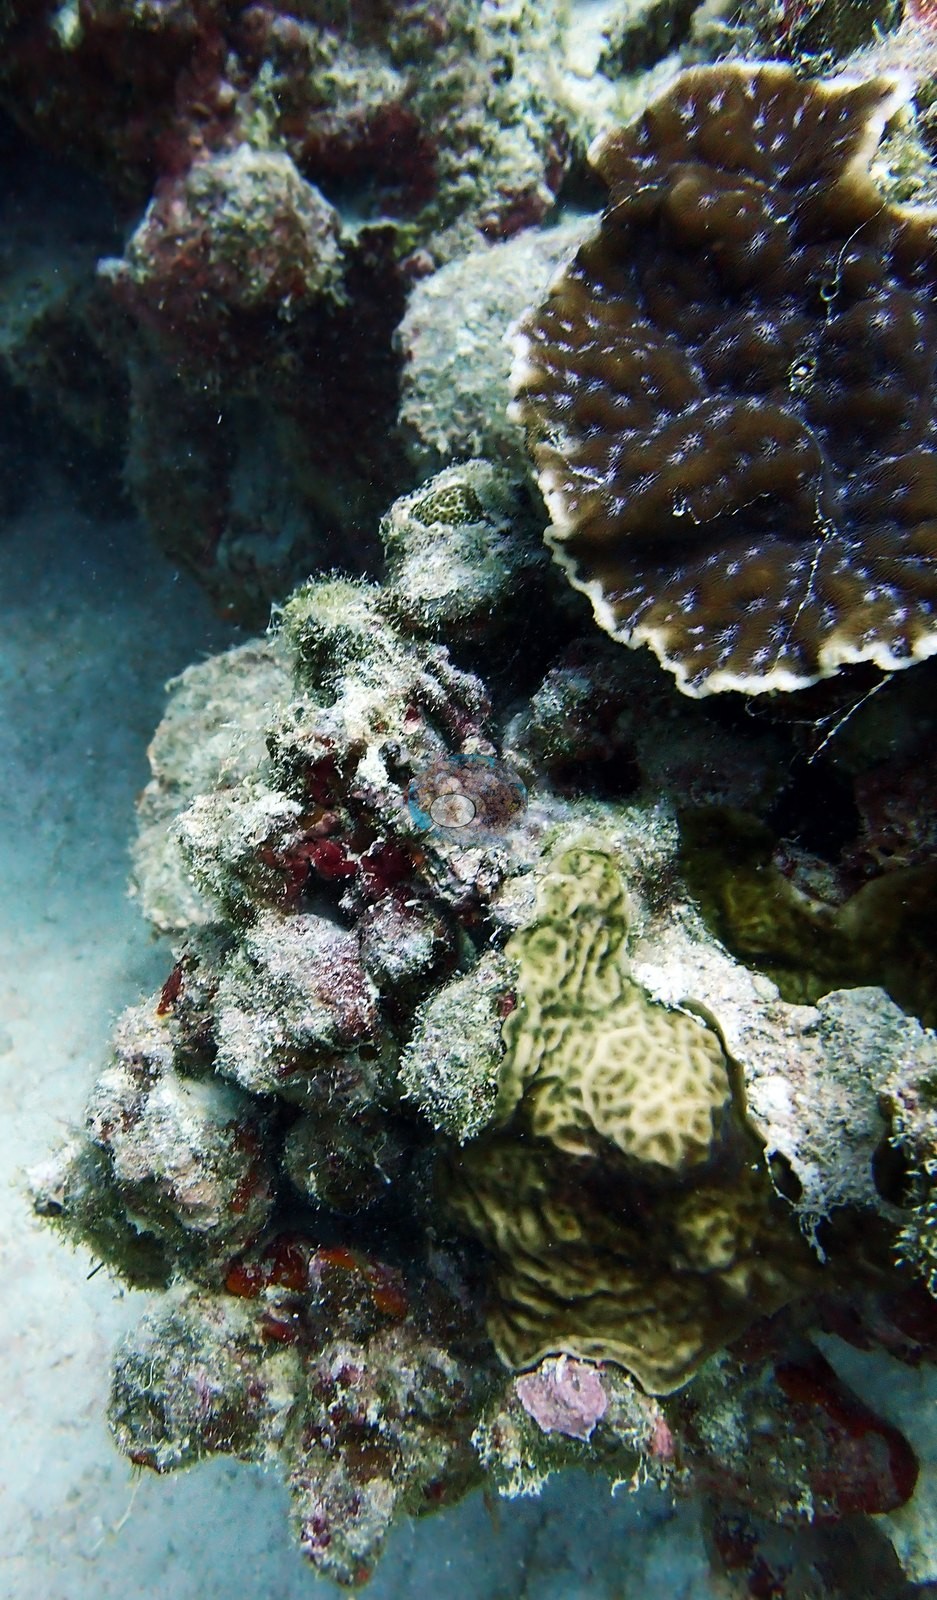
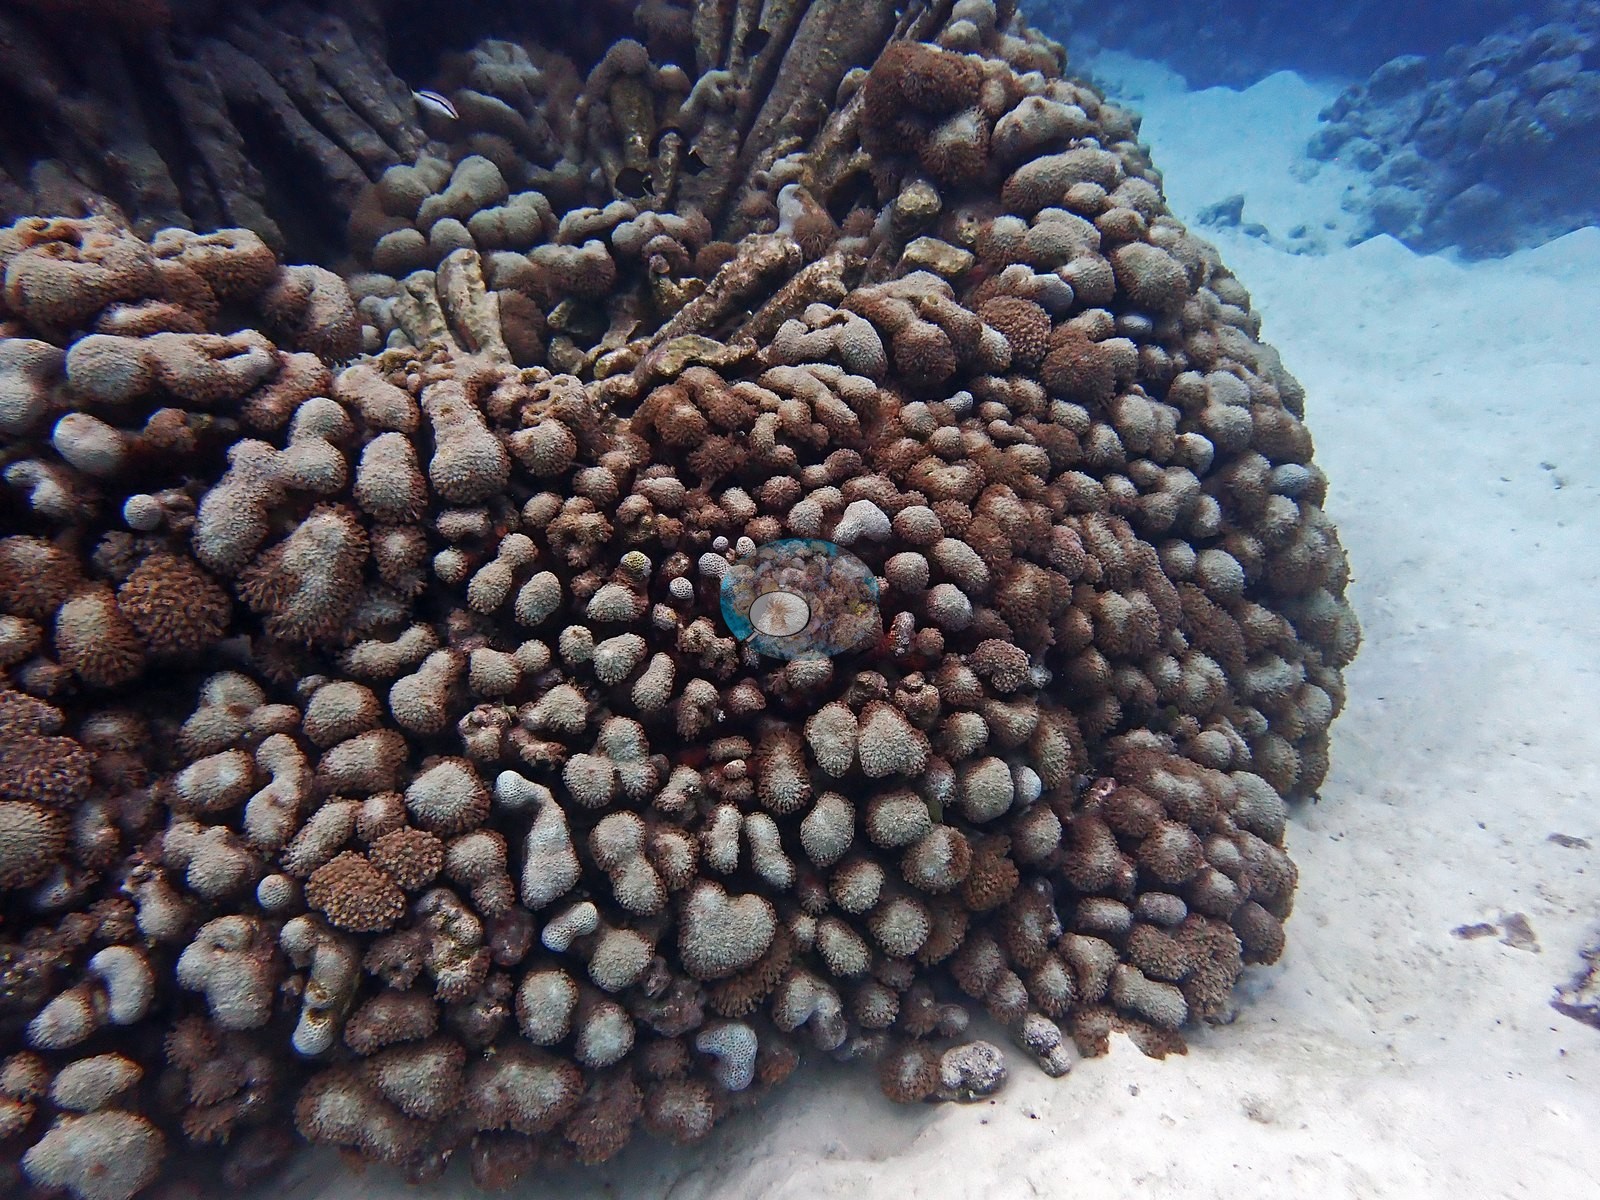
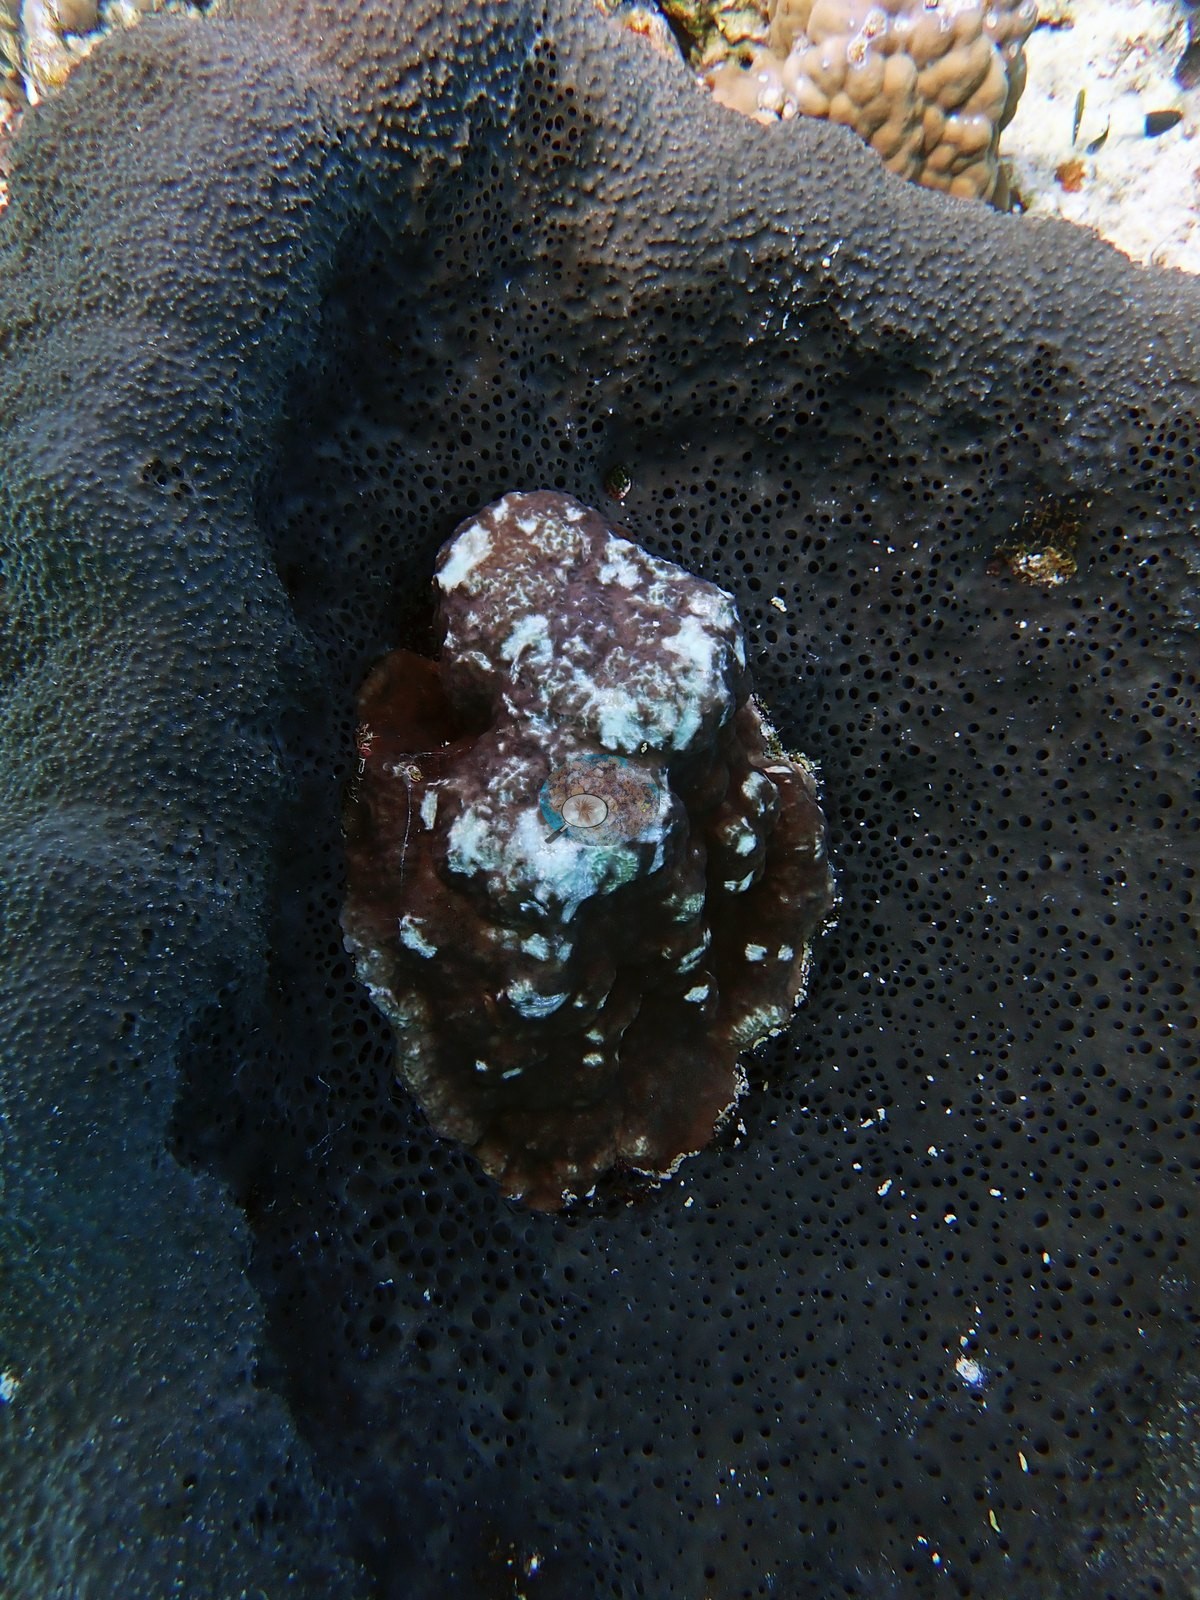
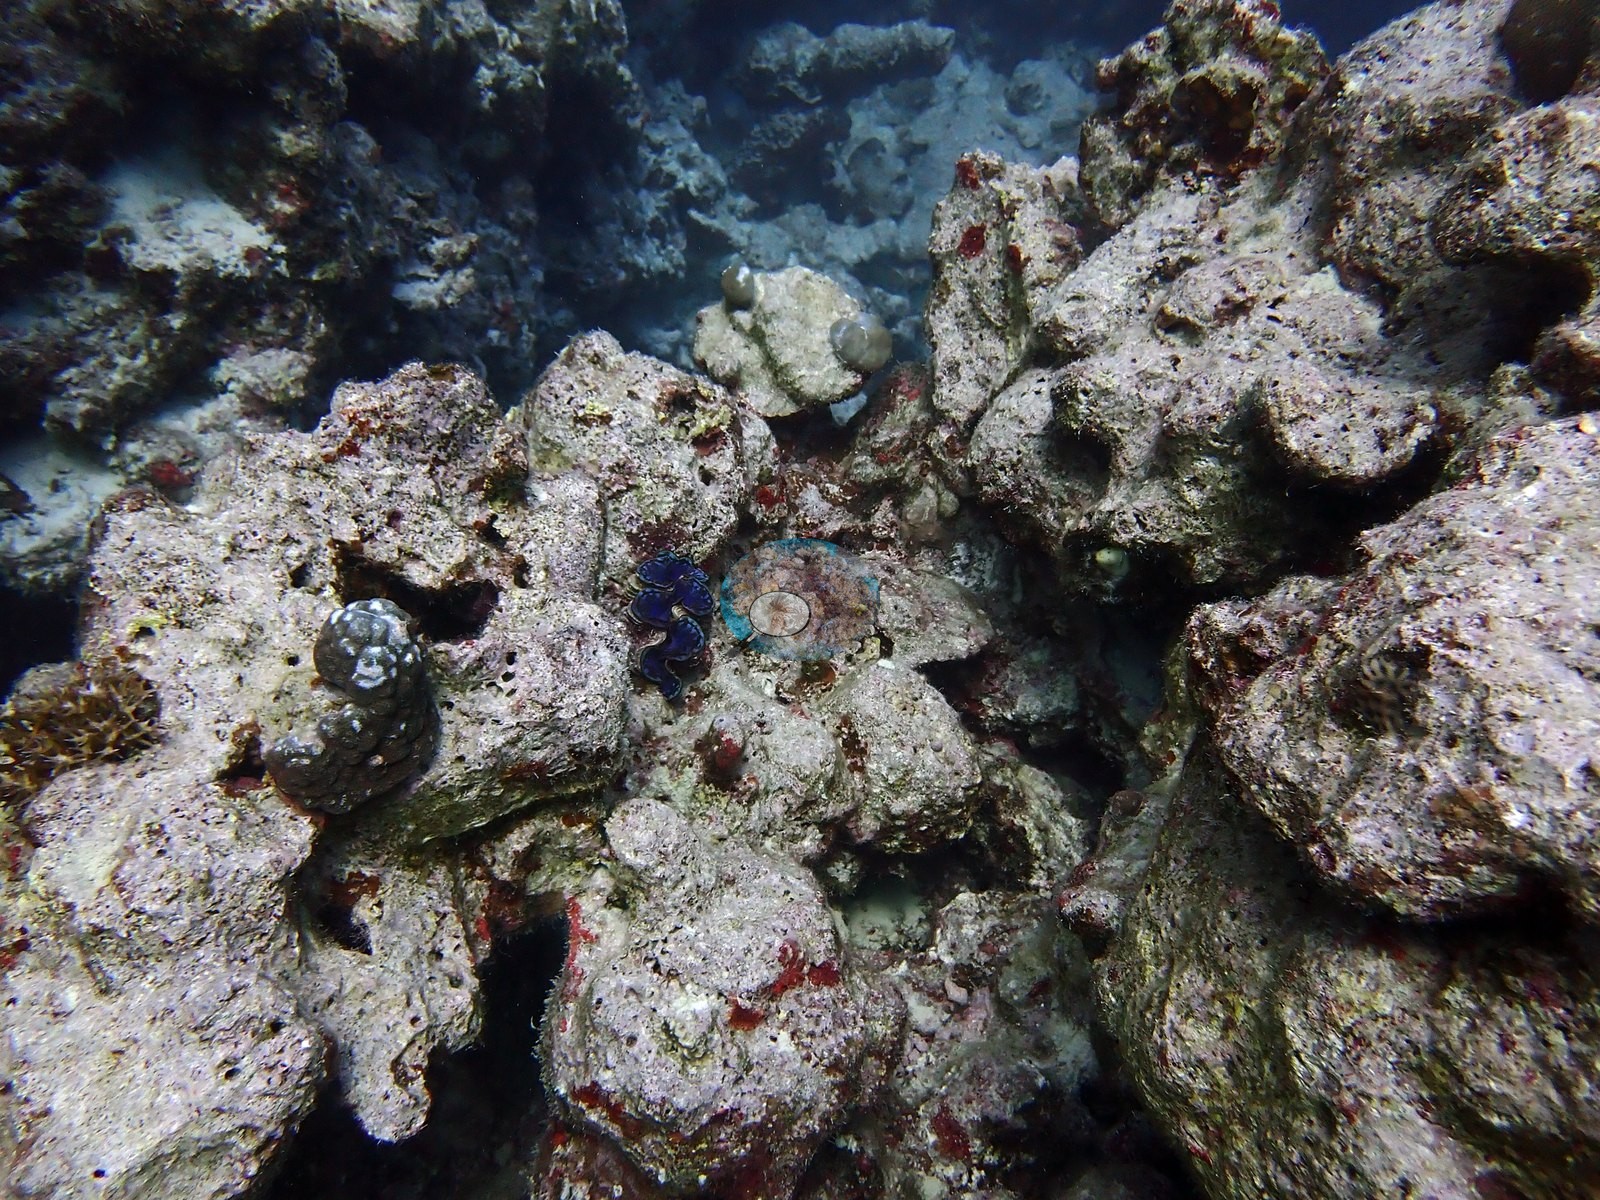
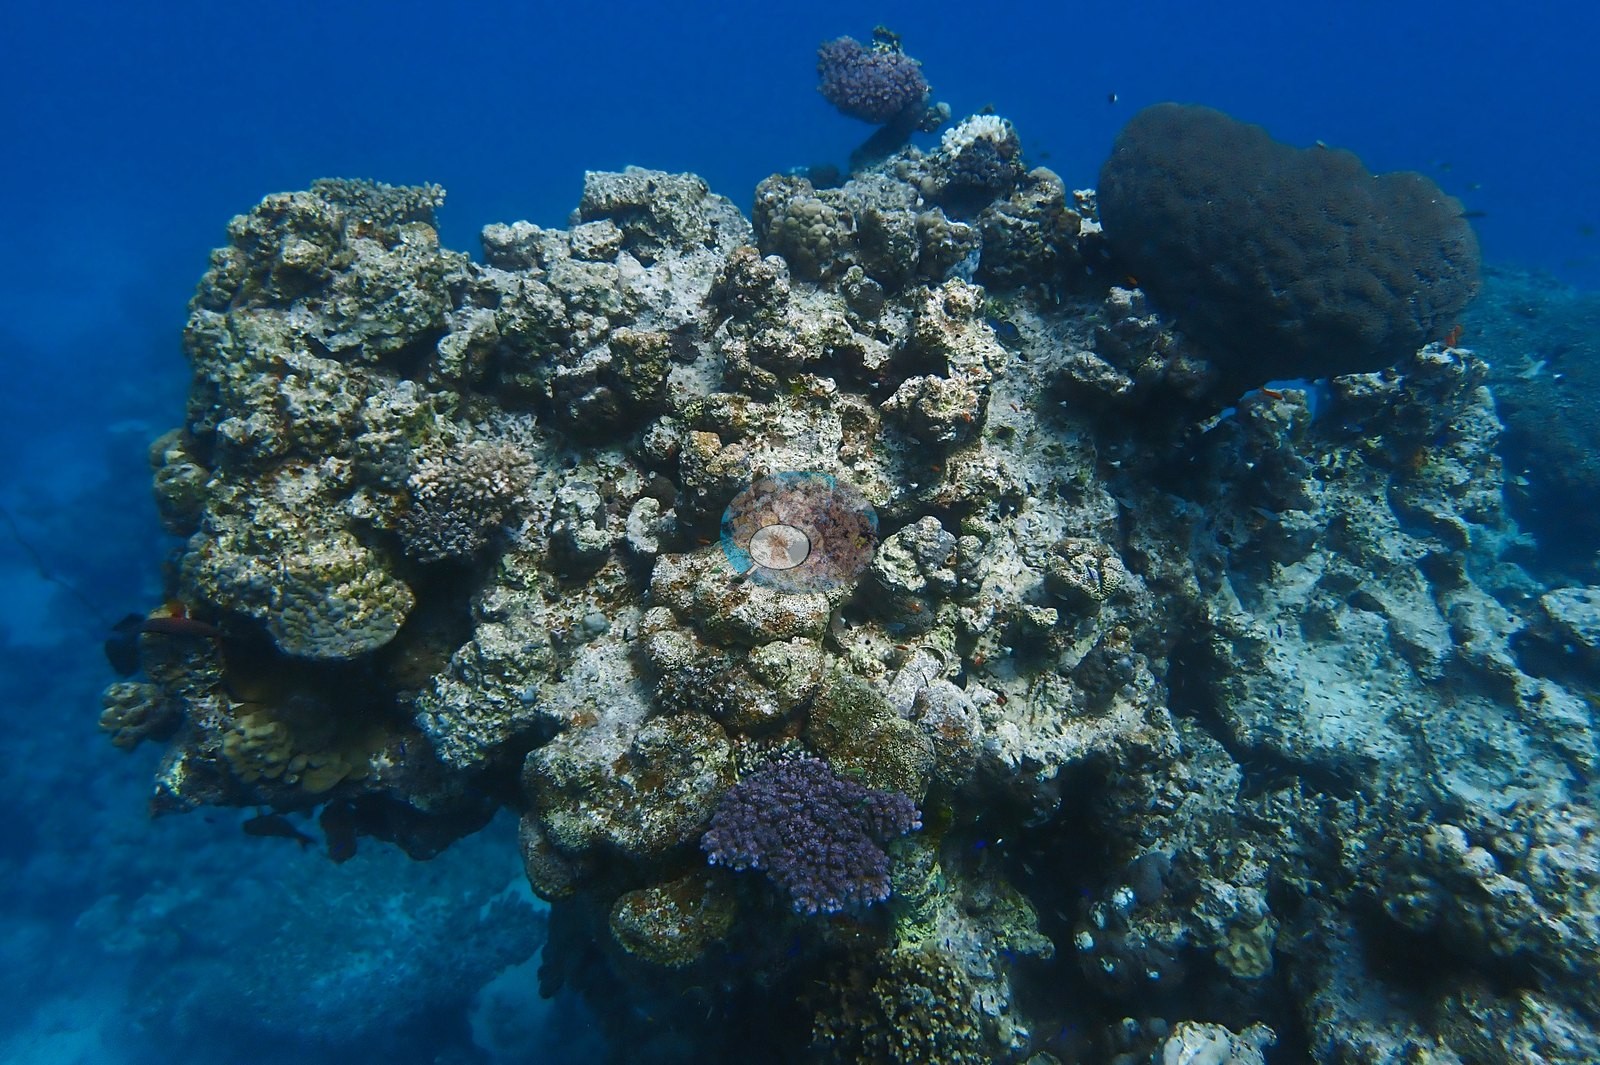
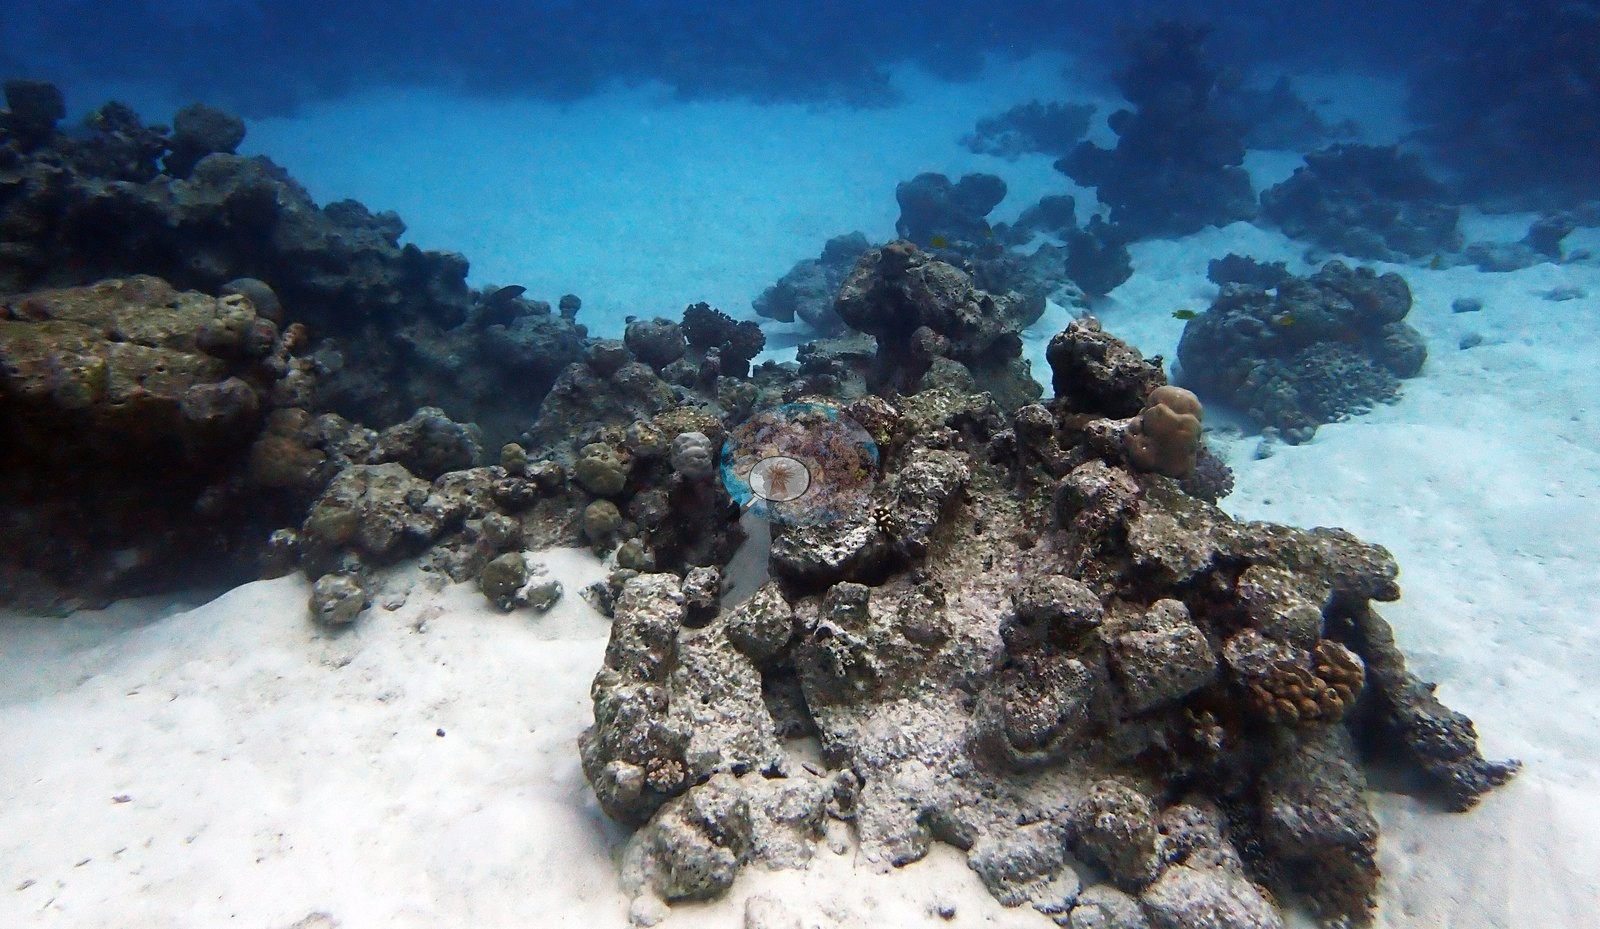
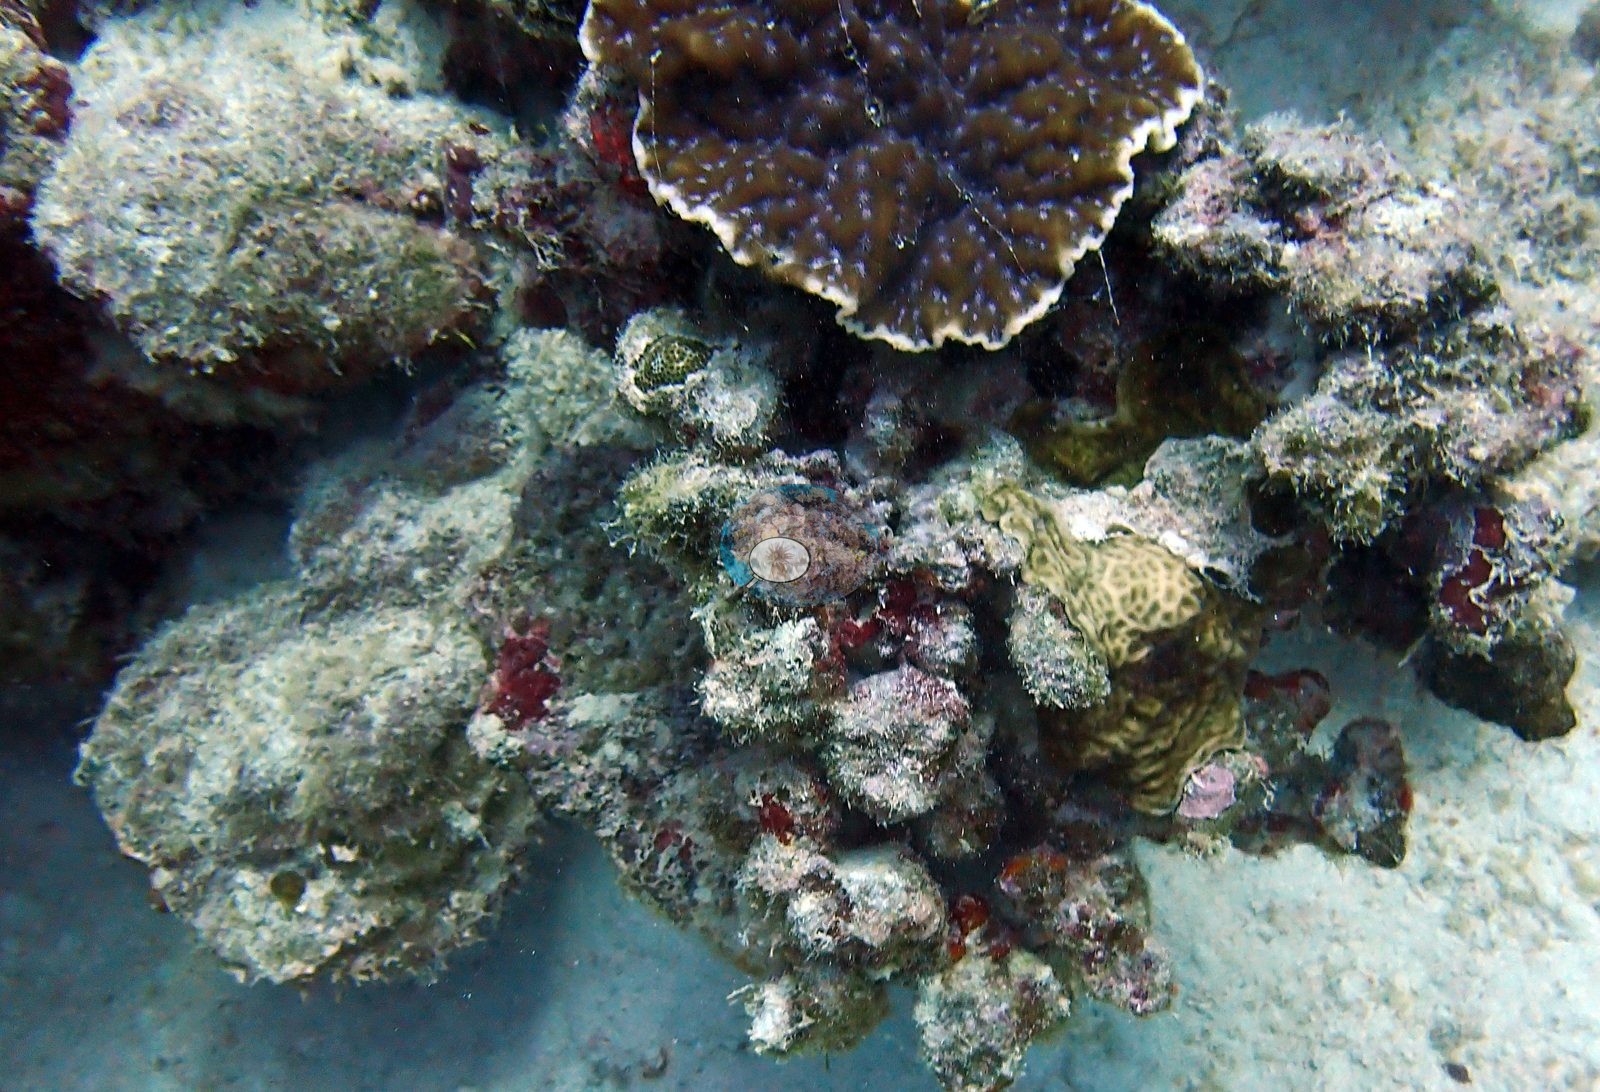
Coral is patchy and mostly small. The living component is dominated by massive and encrusting forms rather than branching ones: red-brown meandroid Lobophyllia/Symphyllia-type colonies sitting free on sand, olive and khaki Goniastrea, Favites, and Astreopora domes on pinnacle shoulders, purple and lavender pocilloporids, encrusting Montipora-type sheets, and giant clams (Tridacna) with electric-blue and green mantles set into the pavement (e.g., Image 3).
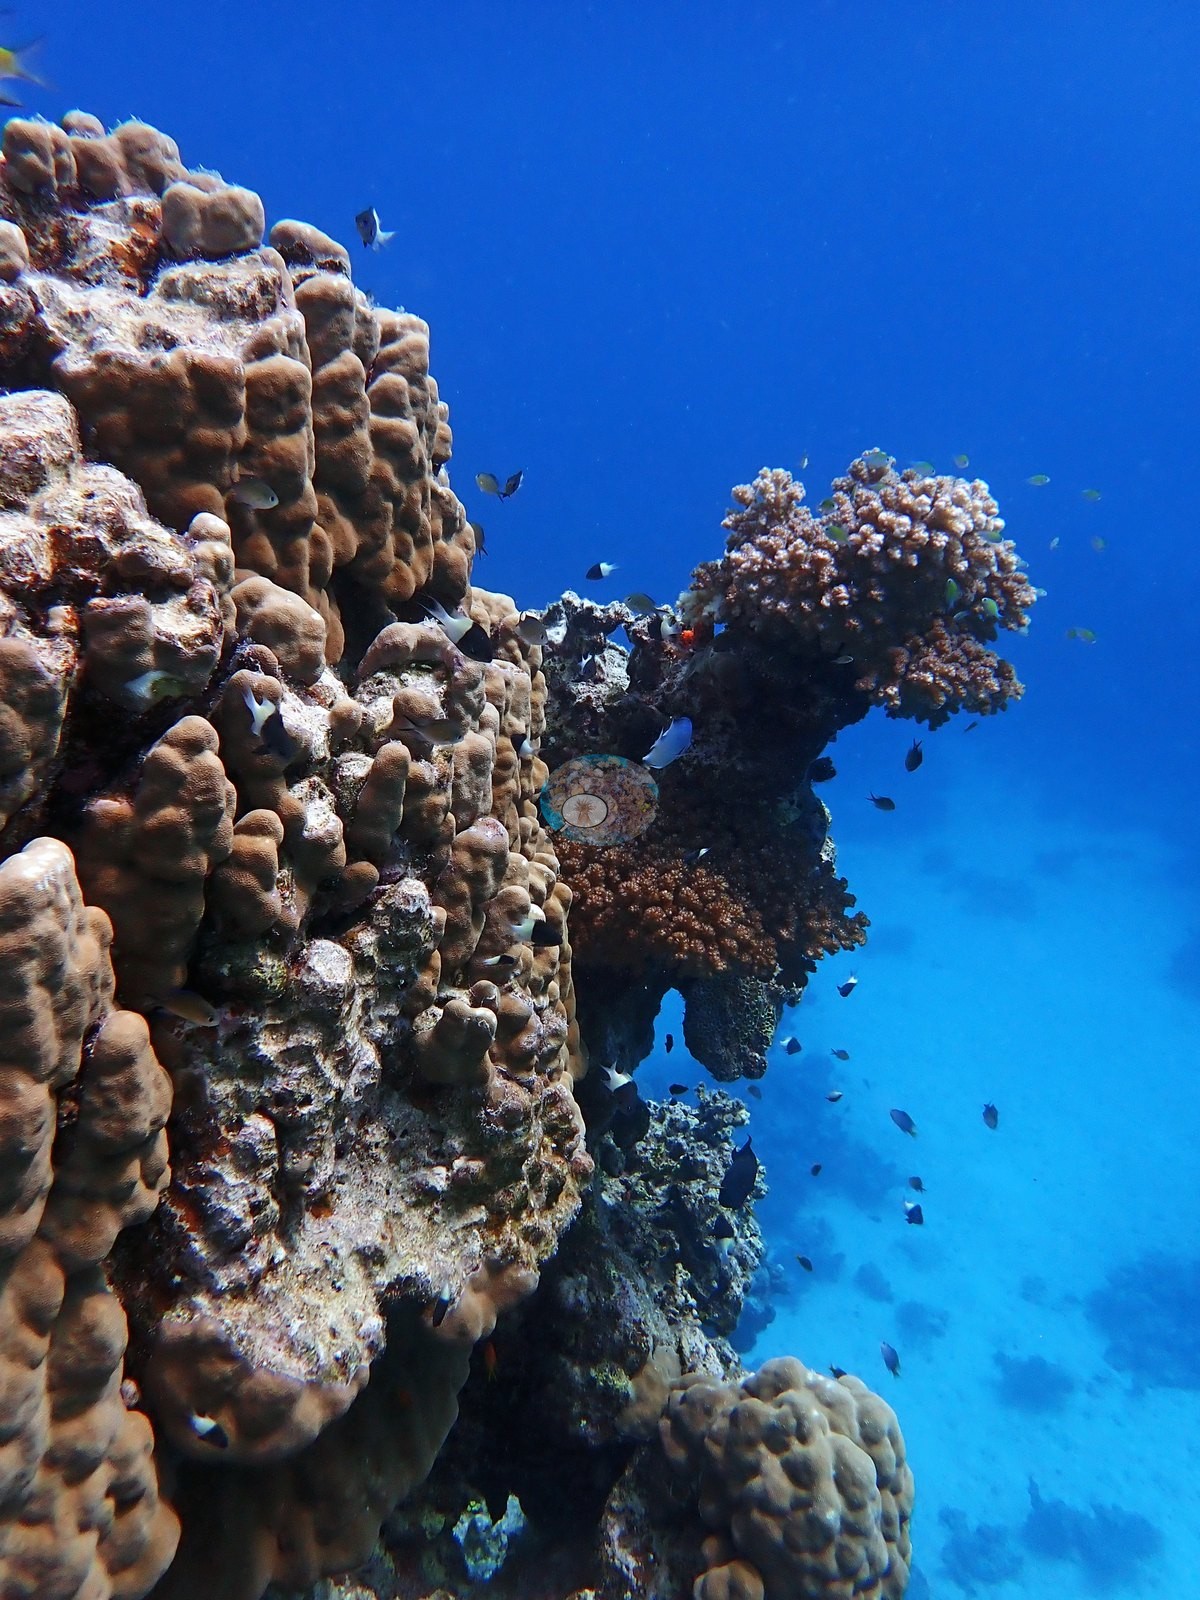
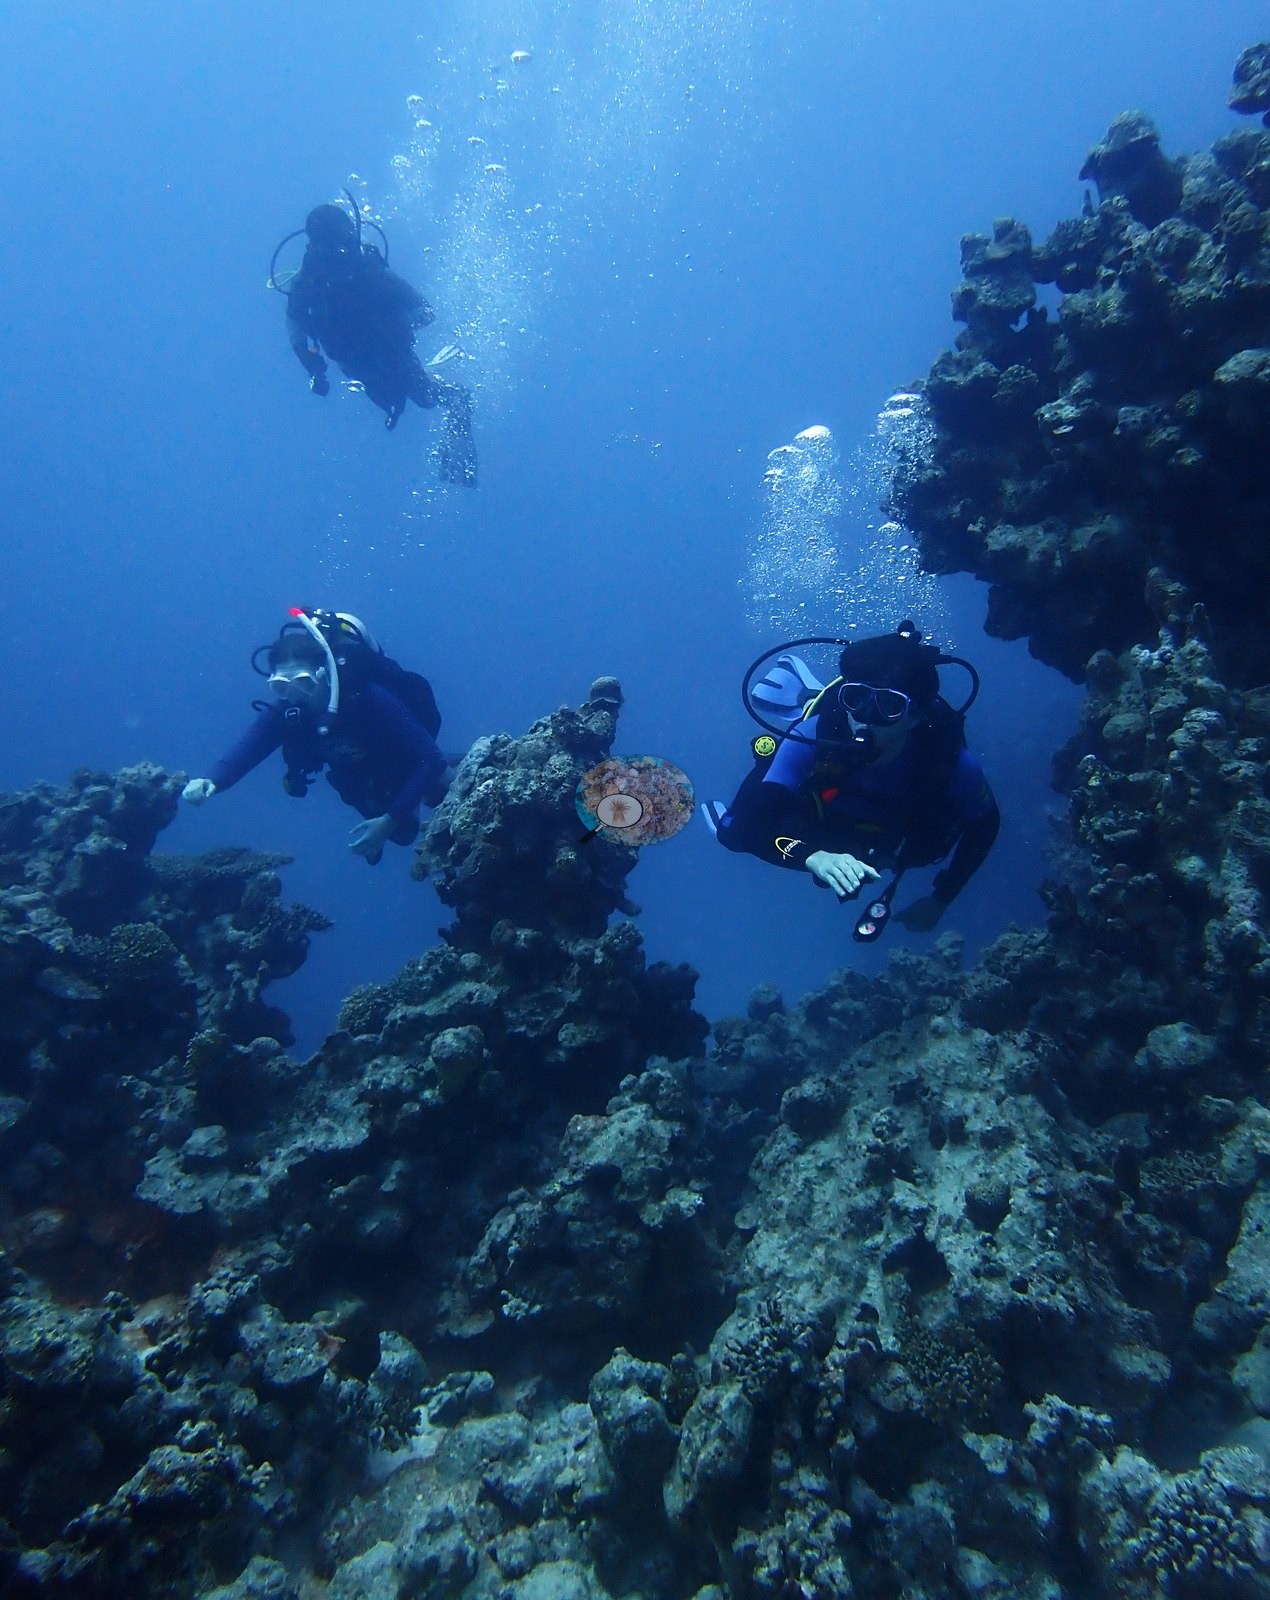
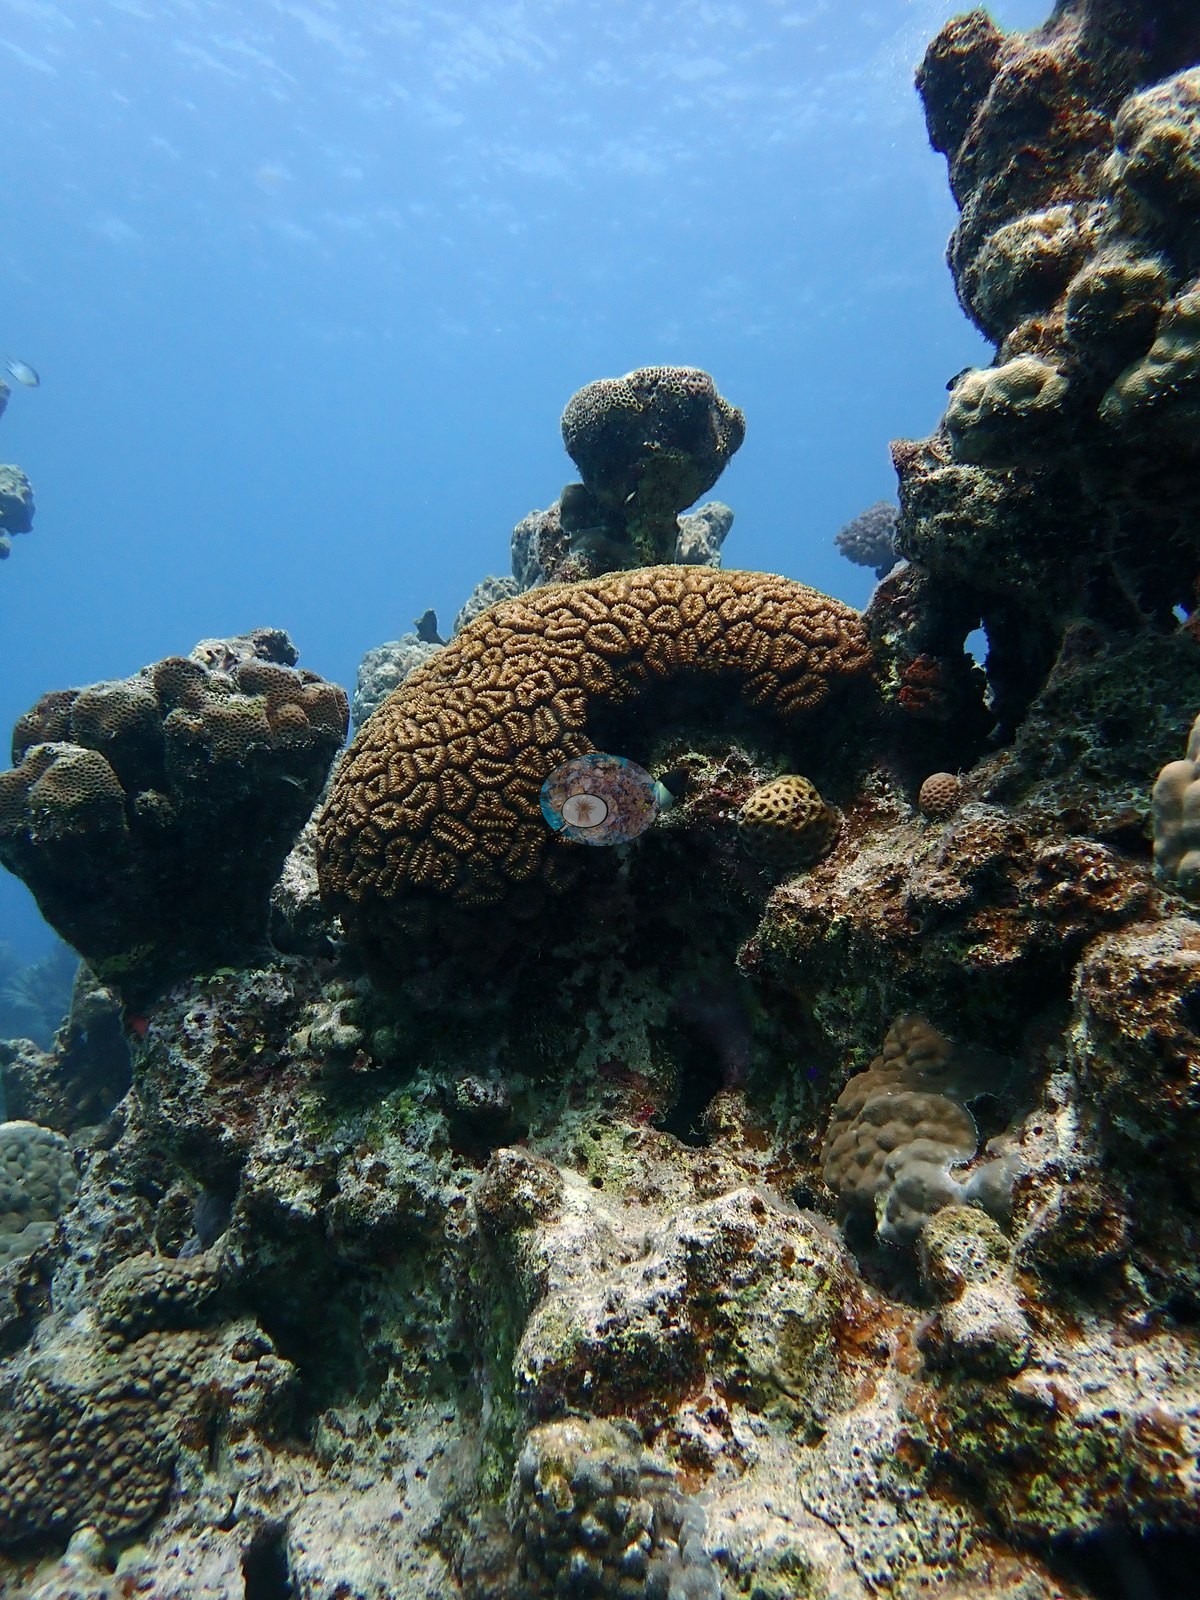
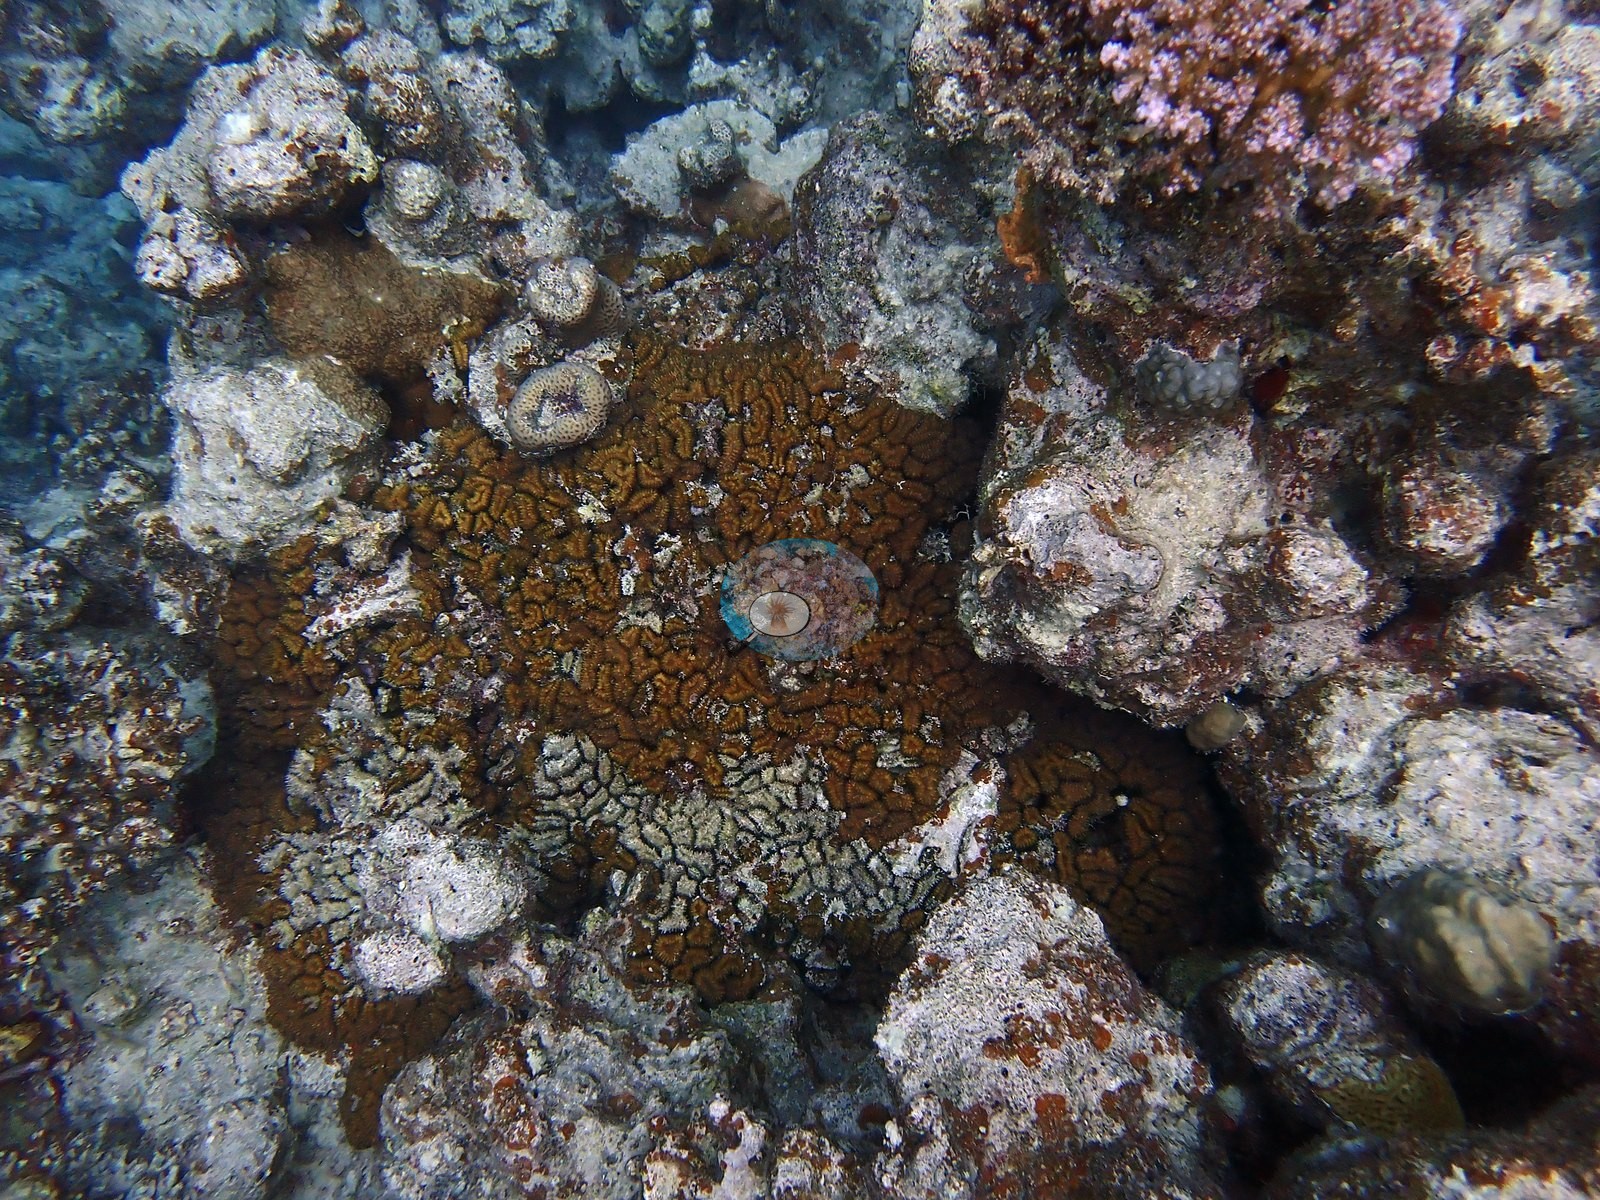
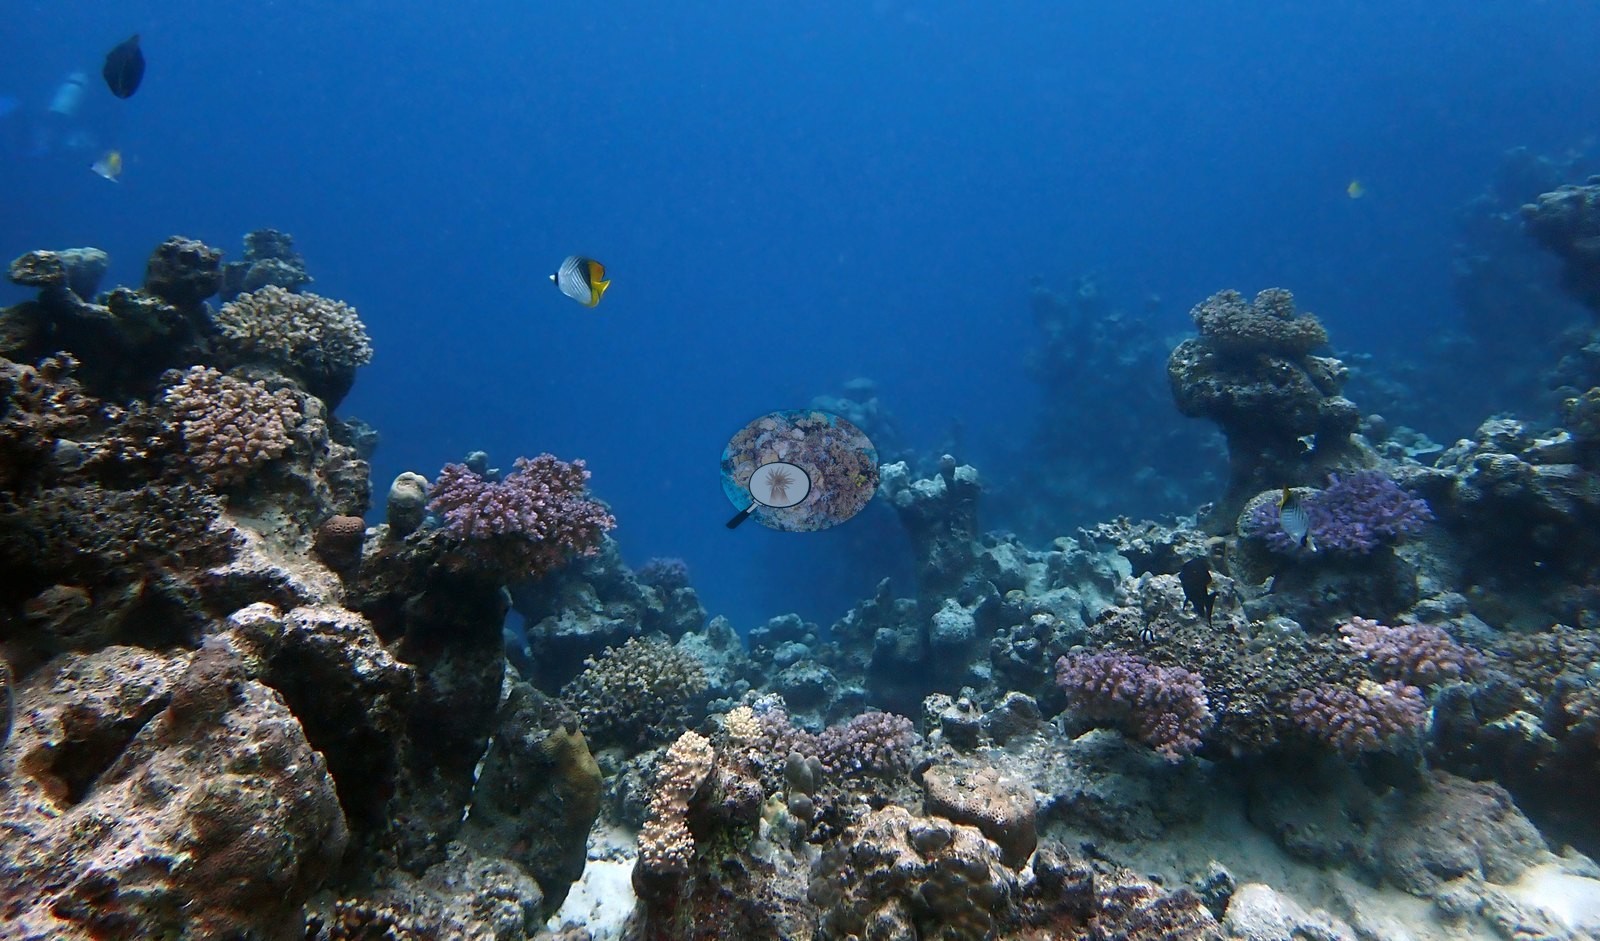
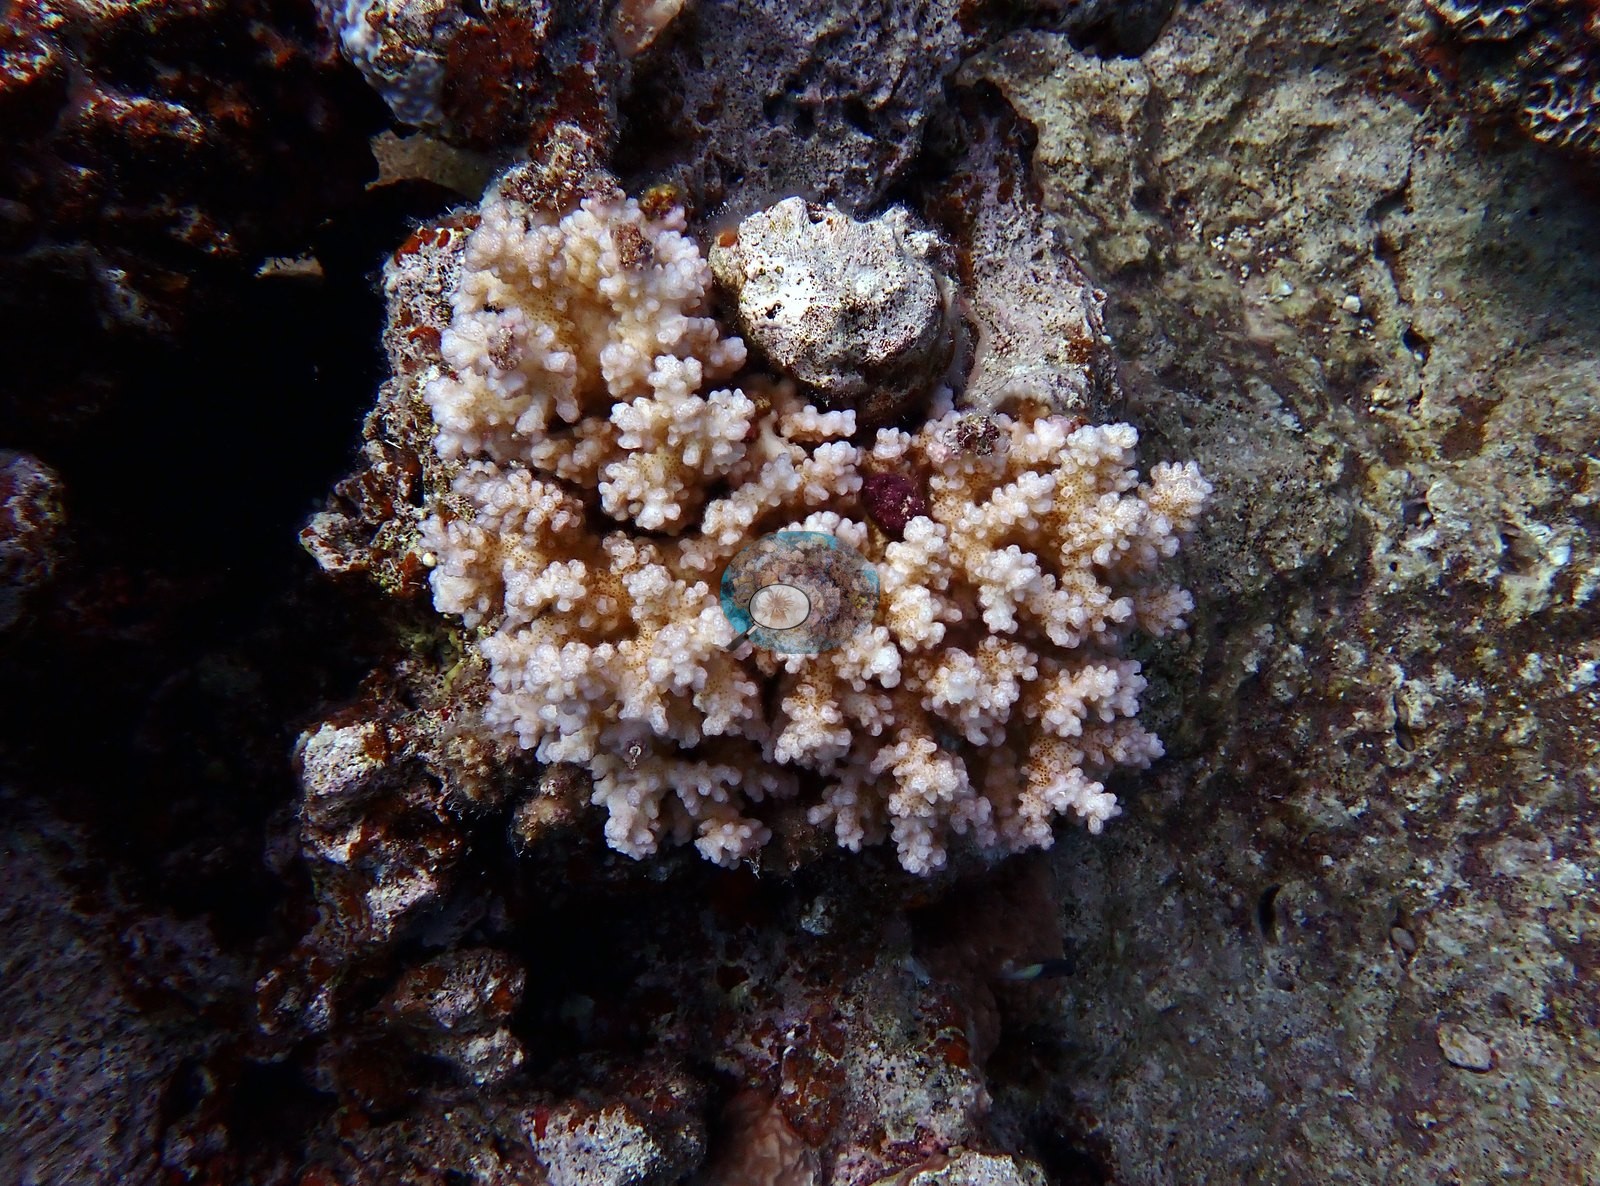
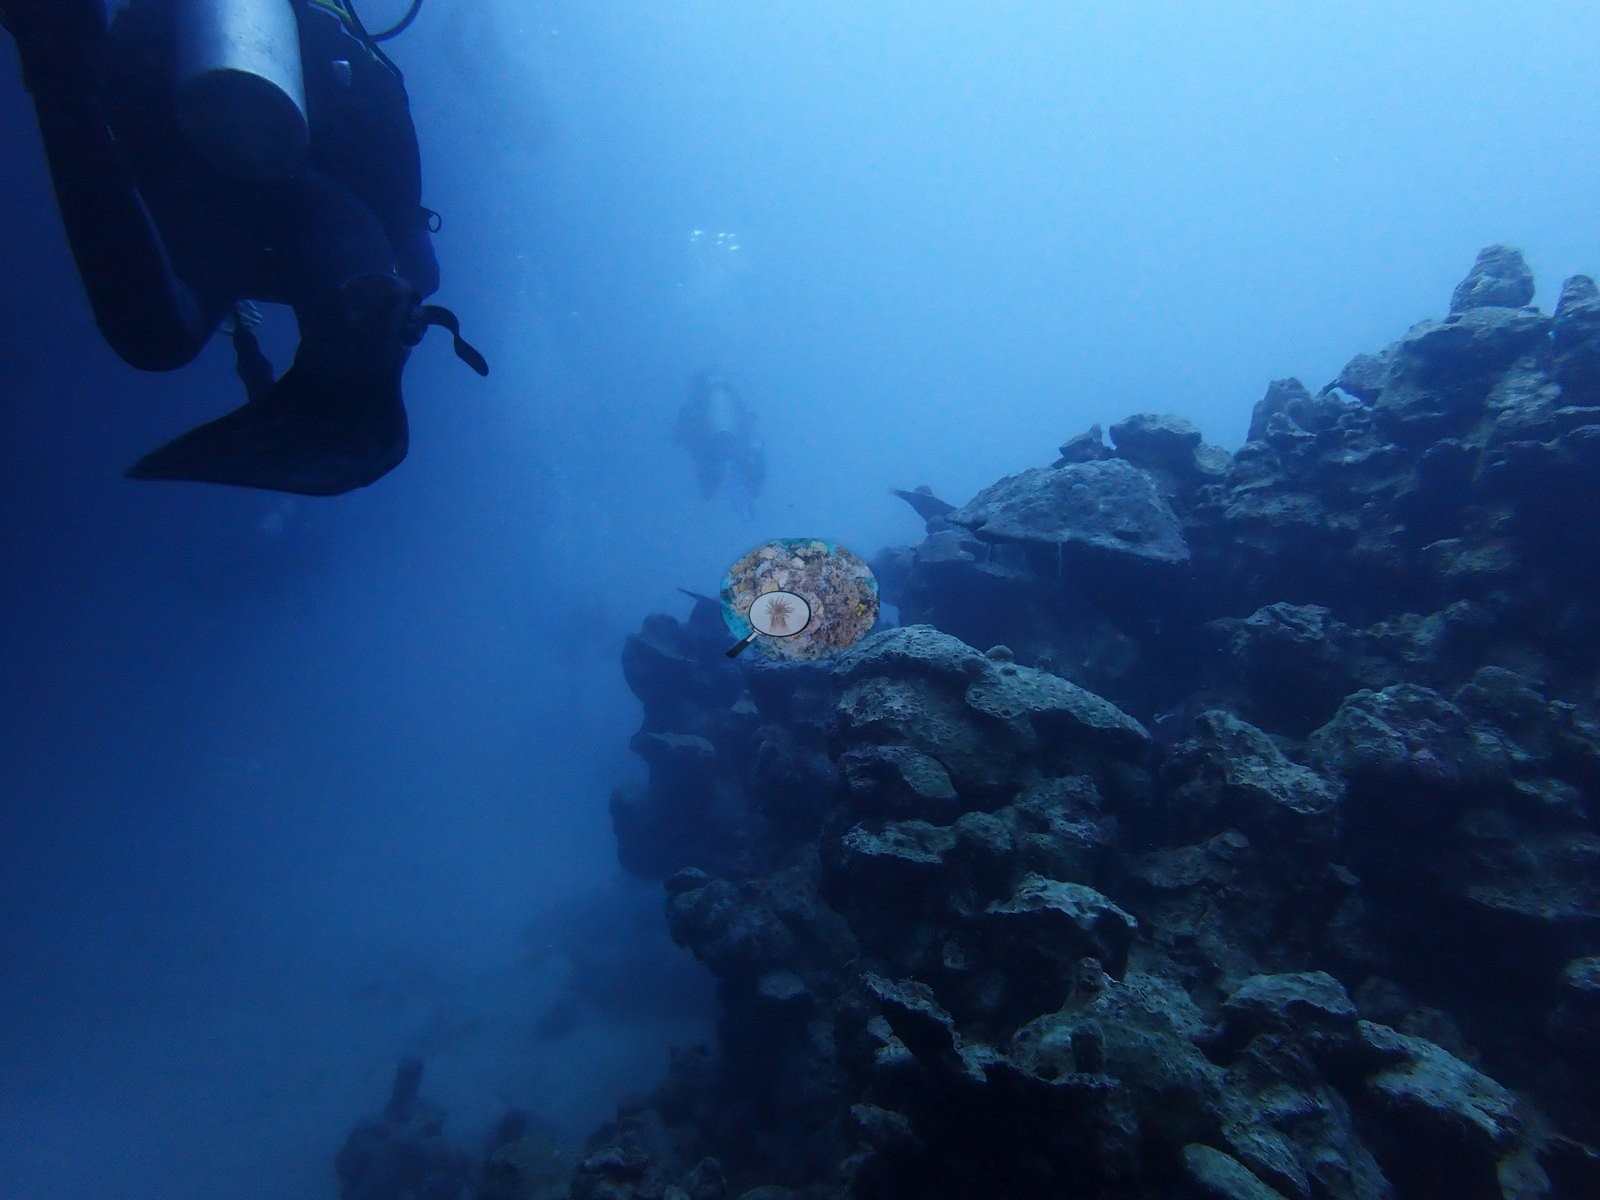
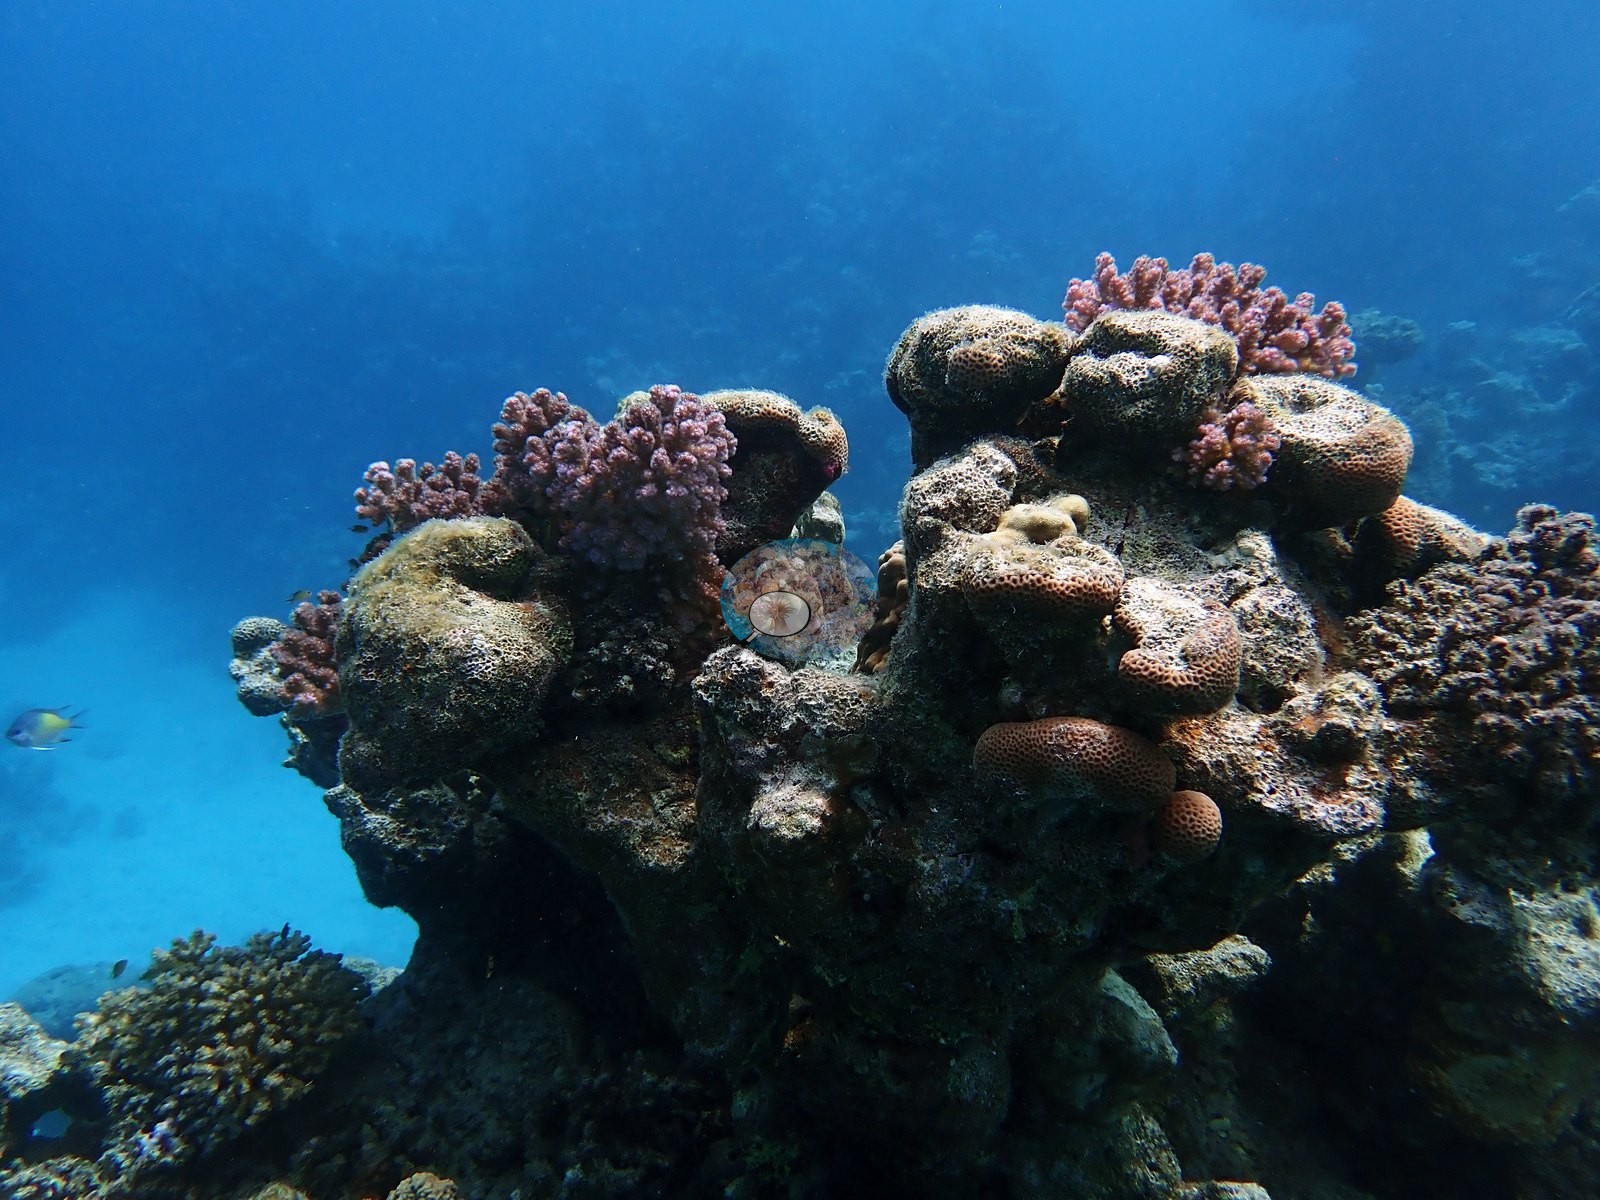
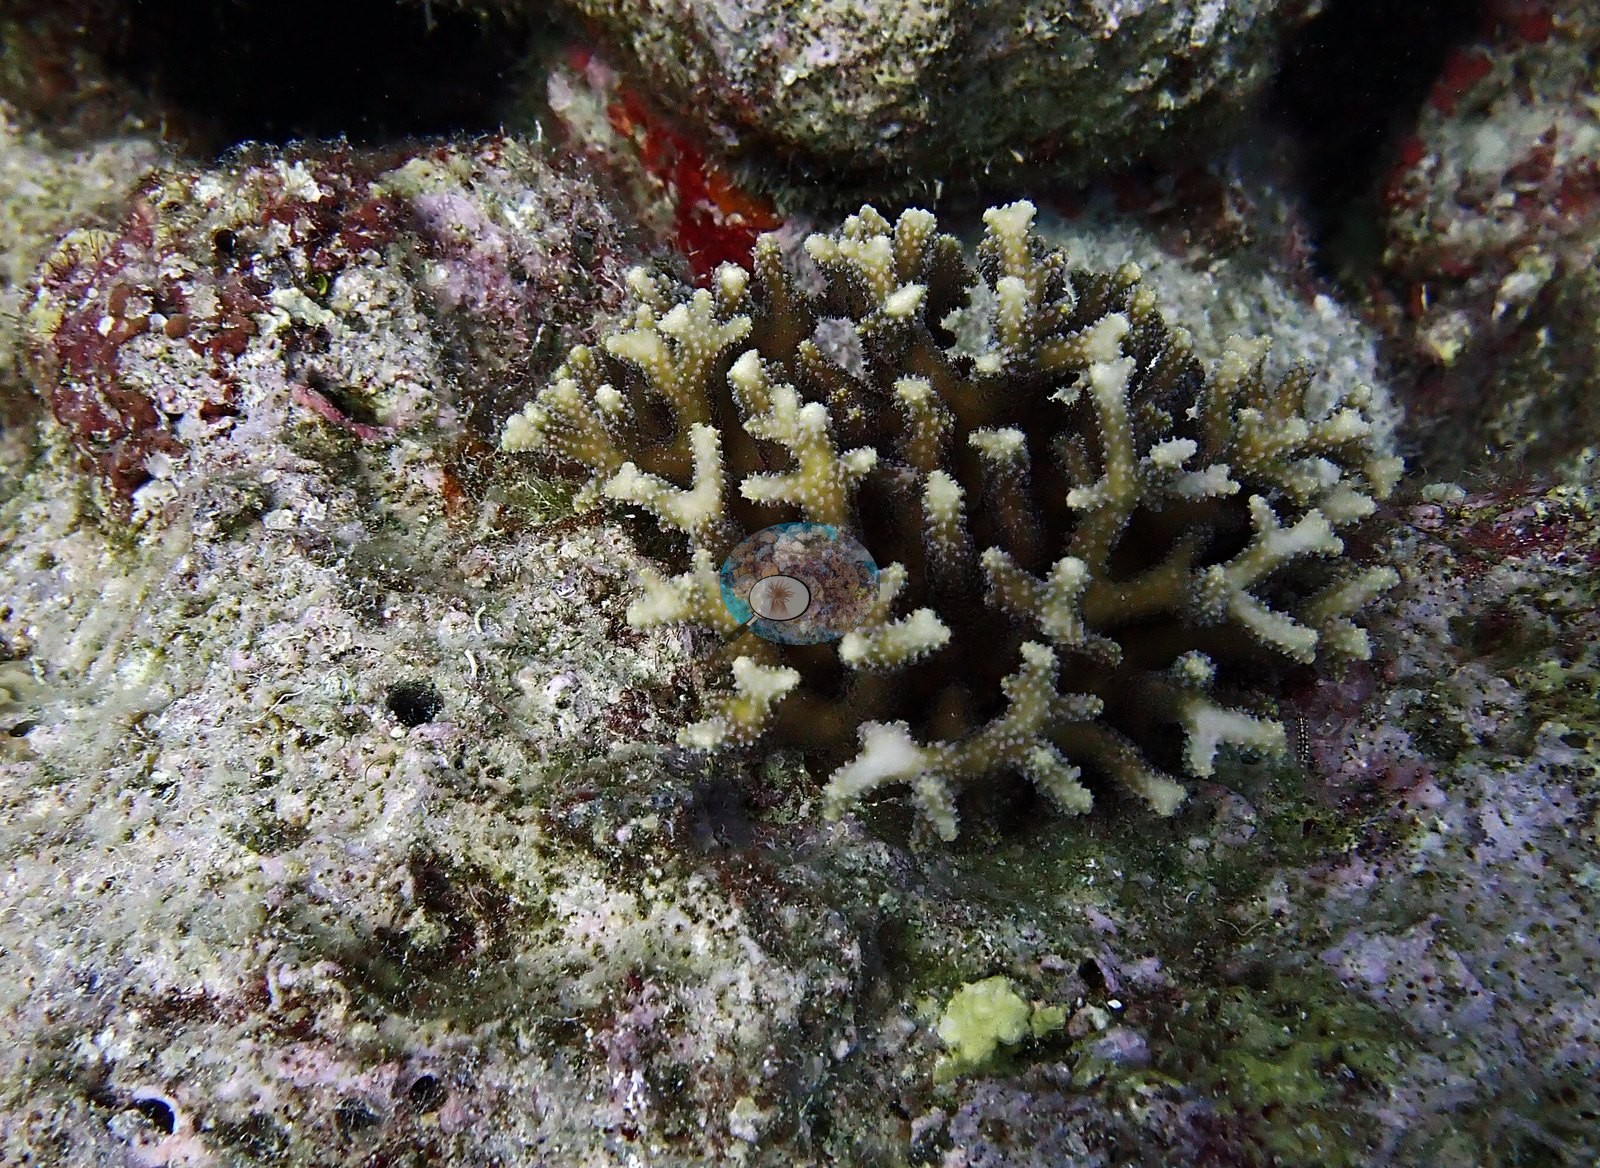
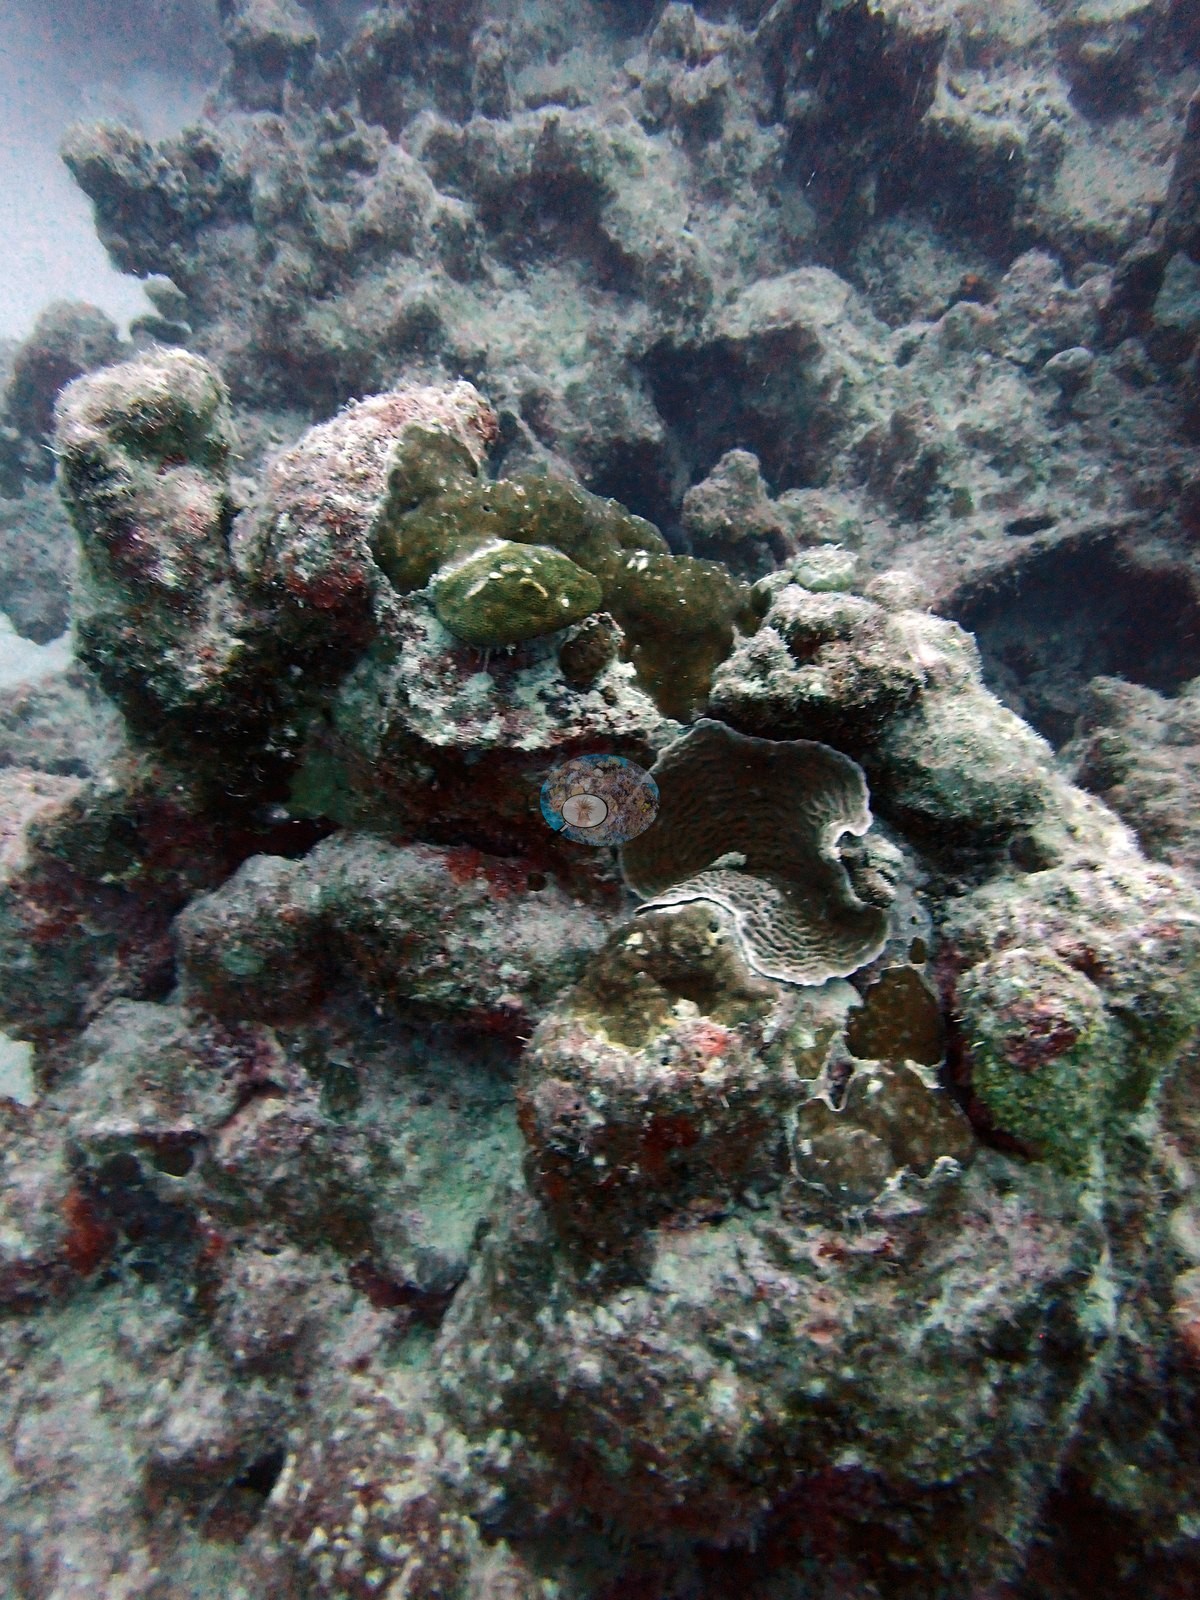
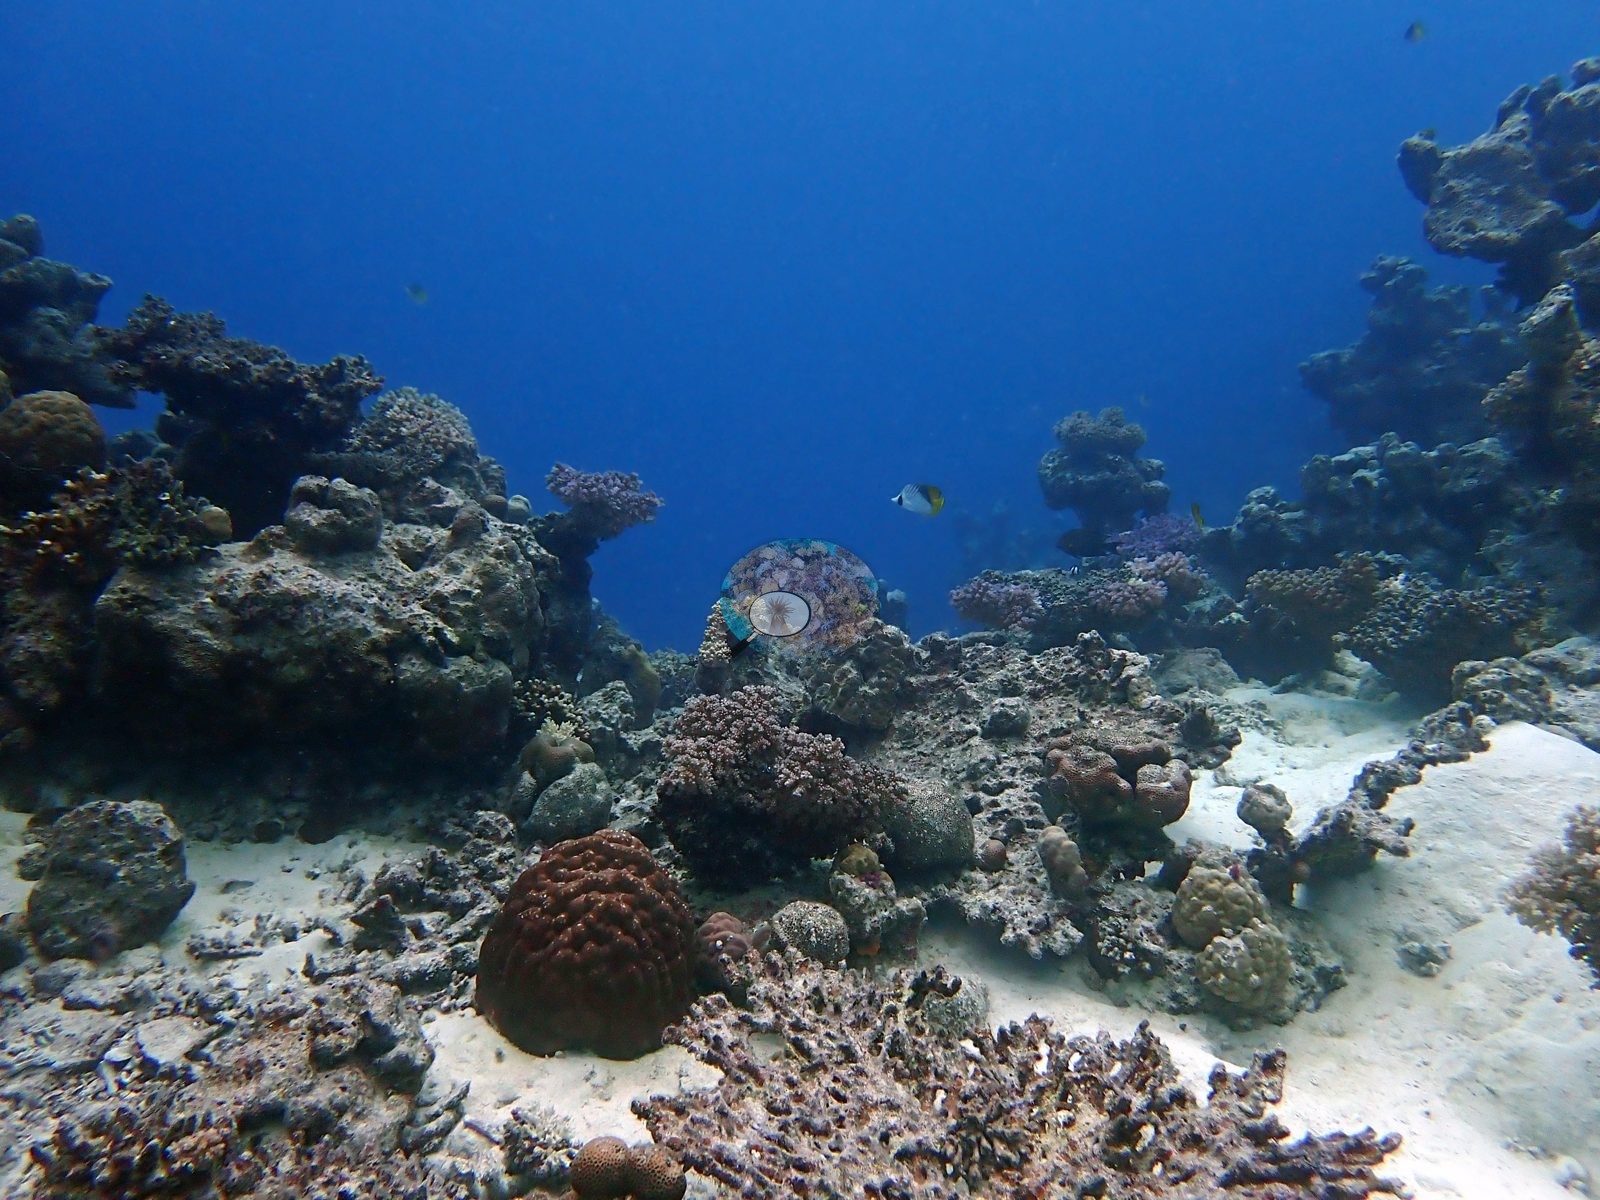
Between them, a great deal of the surface is old, algal-filmed, coralline-crusted dead framework (e.g., Image 4).
Coral cover
Coral cover is 16.5% ± 19.7 across 68 photographs, quoted verbatim from Mayfield, A.B. (2025) Environments 12:248 — Red Sea 2023-24 bleaching; CoralNet point annotation, Appendix A — a manual, diver-annotated CoralNet point count from Anderson's own published work, not a computer vision output and not recomputed here. The standard deviation of 20 is larger than the mean itself, which is the honest signature of a site where individual frames swing between bare pavement and dense colony clusters. The site record's prose gives the 9 February visit as 16% cover with 26.8% of coral tissue bleached, with no accumulated heat stress at the time.
Stressors
Grazing pressure is visible: Anderson captioned one frame "fish bites" for the scatter of small fresh white parrotfish scars across the faviid colonies in it.
Comparisons with other data
No independent survey was made at this exact site; the nearest ones are listed in the table below.
Dive record
A single winter dive to 27.2 m on 9 February 2024 at 24°C, the second dive of a day that started at Rose Reef, worked with Coastline (KAUST).
CV model comparison
More info
The reference row is this dive site's own published value (Mayfield 2025, Appendix A, 68 photos); the other rows are AREA-level (Thuwal) comparisons, not run on this site's frames. ⚠ The comparison rows are REGIONS, not dive sites: the paper's main tables report cover by region, and this site's own value comes from its Appendix A. ⚠ The manual column and the CV columns are on DIFFERENT FRAME SETS. The published cover spans the region's full photo set (173–2,567 frames, most of them CoralNet robot-labeled); the CV arms ran only on the hand-scored reference subset, which is 6 frames at Thuwal, 274 at Jeddah and 173 at Rabigh. Read Thuwal's model columns as indicative only. CoralNet is n/a by design: the reference set IS the hand-scored set, so those frames carry no independent robot label to compare against. DINOv3 is restricted to frames it never saw, and reads roughly double the published cover at every Red Sea region. ⚠ 'unassigned region' is not a place: 135 frames carry no region label in the CoralNet metadata and map to no published row. It has no manual value and is excluded from the pooled reference. CoralNet automated point classifier: n/a — the reference set IS the hand-scored set; these frames carry no independent CoralNet robot label to compare against CoralSCOP (SAM-based mask-sum), unedited photos: pending — CoralSCOP run: 370/747 images scored at build time CoralSCOP (SAM-based mask-sum), edited photos: pending — CoralSCOP run: 370/747 images scored at build time| Method | Hard-coral cover (%) |
|---|---|
| Manual (published) | 16.5 |
| In-house DINOv3 | 47.5 |
| Claude | 23.9 |
Independent surveys nearby
Within 5 km, 1 independent survey station recorded hard coral cover in 2010. The most recent nearby survey is from 2010, so these values predate recent heat stress. This site's own estimate (17%) sits 14.5 points below the range of these surveys (31%); the methods differ, so the comparison is context, not a like-for-like test.
Collected by other programs using different methods, so these are context for the figures above, not a like-for-like comparison. Where a station was surveyed more than once the range is shown. Station names are not dive-site names.
| Agency | Site / location | Date | Hard coral cover (%) | Distance | Link |
|---|---|---|---|---|---|
| Furby et al. (2013) | Offshore reef 1 | 2010 | 31% (3 surveys) | 1.07 km | HeatCRD database |
Data & links
- CoralNet image repository for this region ↗
- HeatCRD database ↗
- (reference) ↗
- Photo portfolio ↗
- Coral Reef Diagnostics country page ↗
All images from Coral Reef Diagnostics. Data are from Coral Reef Diagnostics and the organizations named in the data-sources table above.
© Coral Reef Diagnostics.