
Regional summary of 15 dive sites. Figures are averages across the sites that report them (n = sites with a value); each site's own page has its individual values. Part of the Saudi Arabia overview.
⬇ Download this region as a report card

Heat stress
Long-term record: 10 years since 1985 reached 8 or more °C-weeks at NOAA’s Makkah-Madine Saudi Arabia station. Download the annual DHW data (CSV).
15 sites in this region — click a marker to open that site.
Regional setting
Along Saudi Arabia's central Red Sea coast, the shore shelves steeply in the north before a fairly rapid shift, south of about 20°N, to a broad and gently sloping continental shelf, and fringing reefs with narrow reef flats line much of the coast (Spalding et al. 2001). Offshore, a discontinuous barrier-type structure known as the Little Barrier Reef runs between Al Wadj and Jeddah, and similar barrier-like reefs have been described on the Sudanese side opposite. Saudi Arabia's Red Sea coast supports the full range of Red Sea species, and surveys in 1997–1999 recorded about 260 hard coral species. Jeddah is the largest port on the Red Sea, and by 2001 decades of expansion, including reclamation and construction directly on the fringing reef flats and industrial and urban growth along more than 100 km of coast, had severely degraded or destroyed many nearshore reefs, seagrasses, and mangroves. The atlas also notes that important fringing and patch reefs survived to the north and south of the city. In August and September 1998, reefs at some sites from Yanbu to Rabigh bleached heavily. Spalding et al. (2001) estimate about 6,660 km² of coral reef for Saudi Arabia, a national figure that includes its Arabian Gulf coast; Souter et al. (2021) give 7,800 km² for the northern and central Red Sea subregion.
Souter et al. (2021) report that the 1998 bleaching hit hardest in the central-northern Saudi Red Sea, especially near Rabigh, although most bleached reefs across the region recovered. In the central Red Sea they attribute local reef degradation and algal growth mainly to land runoff, eutrophication, and overfishing. Coral cover in the northern and central Red Sea fell from 35.2% (1997) to 29.7% (2002) and then rose slowly to 39.1% by 2019, while algal cover across the whole region roughly doubled after 2012. Coastal development adds further pressure: Wilkinson (2006) reported large plans to reclaim Saudi Red Sea reef areas, and Souter et al. (2021) note that the kingdom's Vision 2030 plan treats coastal tourism as a leading route to economic diversification. As of 2001, Spalding et al. observed that recreational diving, though limited, was centered on Jeddah's reefs.
Overview
This unit covers 15 central Red Sea sites dived between September 2023 and October 2024. Eight lie off Thuwal and were worked with Coastline (KAUST), six are off Jeddah, and one is a shore-entry reef north of Rabigh. The settings are varied: a steep fringing slope at Abu Ejeiah, a high-relief spur-and-groove reef honeycombed with swim-throughs at Cement Reef, a near-vertical wall at Rose Reef dived to 32 to 36 m, and eroded, heavily bioeroded pinnacles and caverns rising from sand at Cave Reef (27.2 m). Tall coral pinnacles make up Anderson's Reef-I, giant Porites mounds several meters across define Coral Gardens, and Drogon Corals is mostly a sand plain with isolated bommies. Two steel shipwrecks, Cement Wreck and Chicken Wreck, carry only thin coral scatters. Middle Reef off Thuwal was dived once in April 2024, but no photographs survive from that dive and it has no cover value.
Published point-count cover ranged from 12.8% at Cement Wreck to 27.6% at Coral Gardens across the 14 sites with published cover. Algal cover stayed low throughout, from 5.5% at Coral Gardens to 11.8% at Long Reef. Pocilloporids in lavender, magenta, and rose color forms, corymbose, staghorn, and table Acropora, knobby Porites, faviids, and Millepora-type fire coral make up most of the community. Anderson's Reef-II is set apart by a bommie the size of a small building, its crown covered in lilac and gold arborescent soft corals. At Cave Reef, Drogon Corals, and Chicken Wreck, bare pavement, sand, or steel alternates with dense coral clusters.
These reefs were recorded through the 2023-24 Red Sea marine heatwaves, and bleaching varied sharply between nearby sites. Shark Reef was the worst hit (71.7% of coral tissue bleached), with whole slopes white, and two crown-of-thorns starfish were photographed there. North Rabigh (64.8%) and Bhadur Reef (62.0%, at about 22.3 degree-heating-weeks) followed, and at Bhadur soft corals, fungiids, and anemones bleached along with the hard corals. In the same August 2024 window, Anderson's Reef-I and Reef-II were the least affected (17.2% and 18.9%), while Coral Gardens rose from 41.4% to 45.4% in a week. Rose Reef ranged from 24.3% to 61.8% over six visits, and Cave Reef showed 26.8% bleaching in February 2024 with no accumulated heat stress.
Highlights
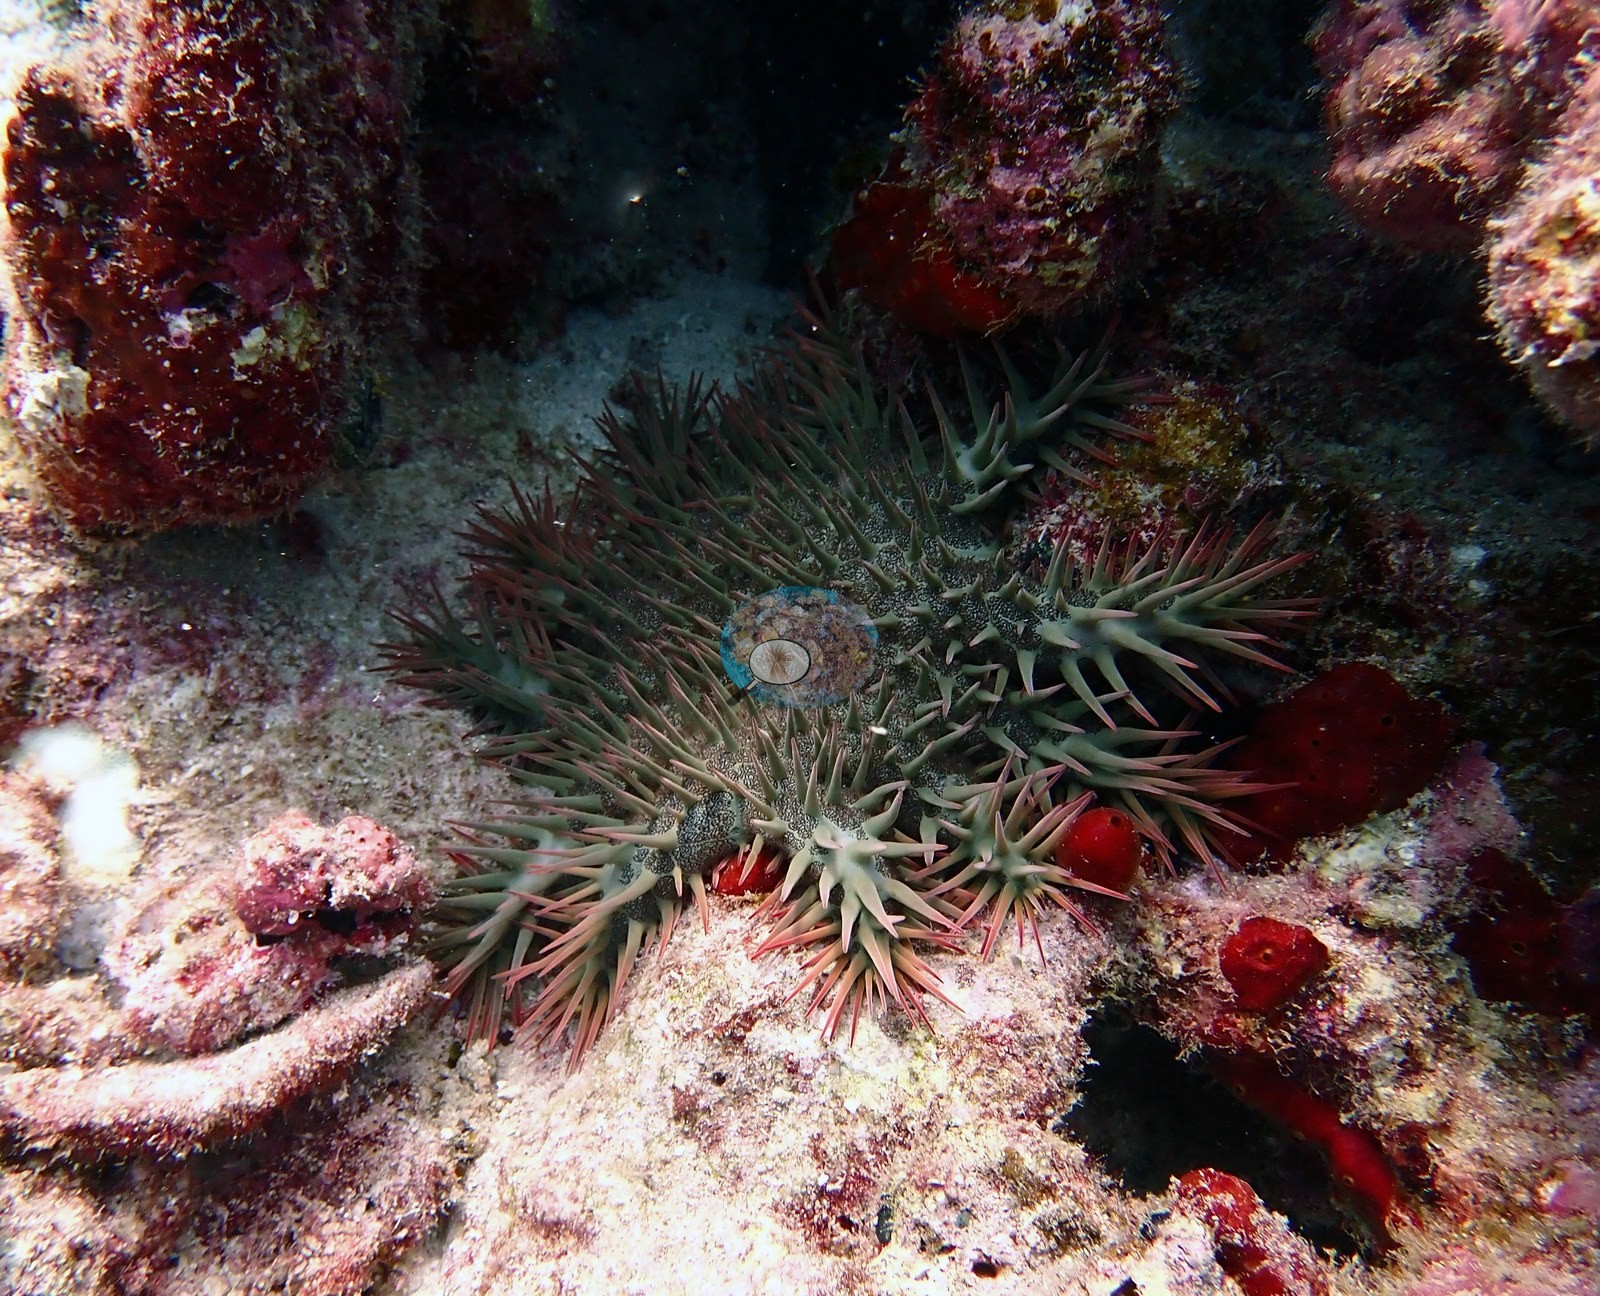
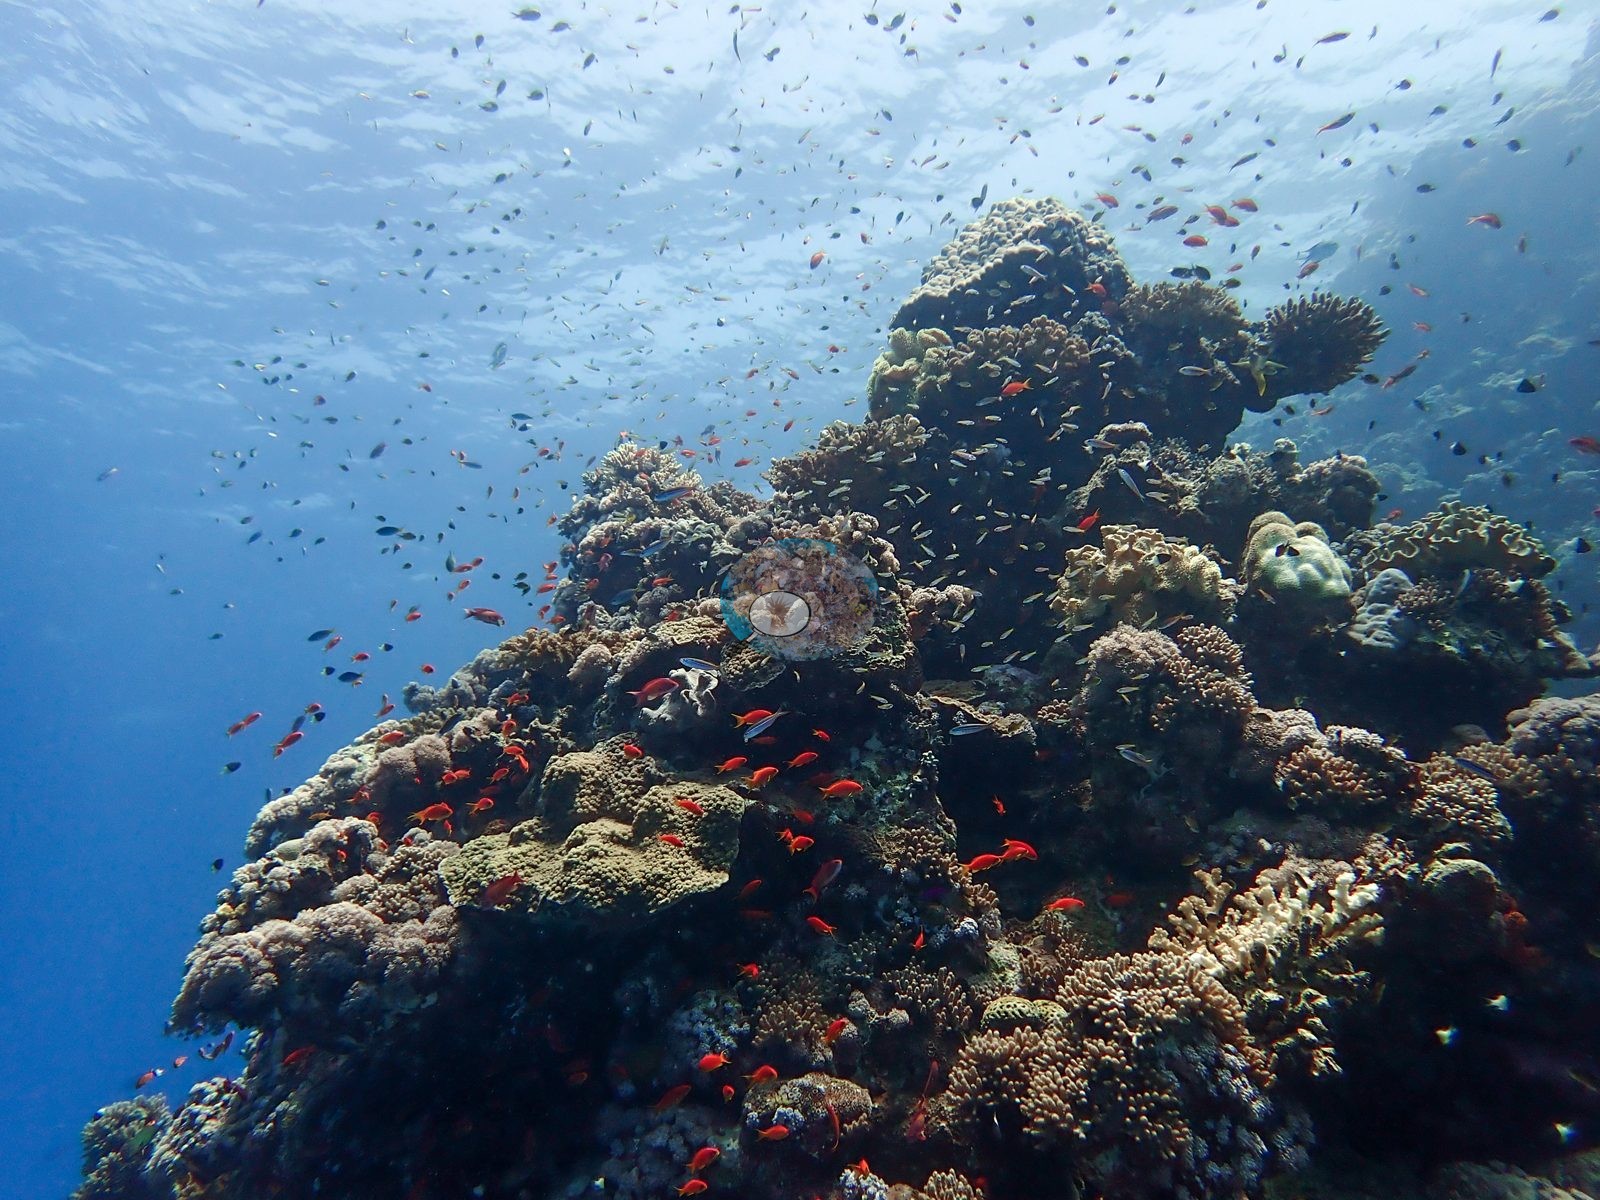
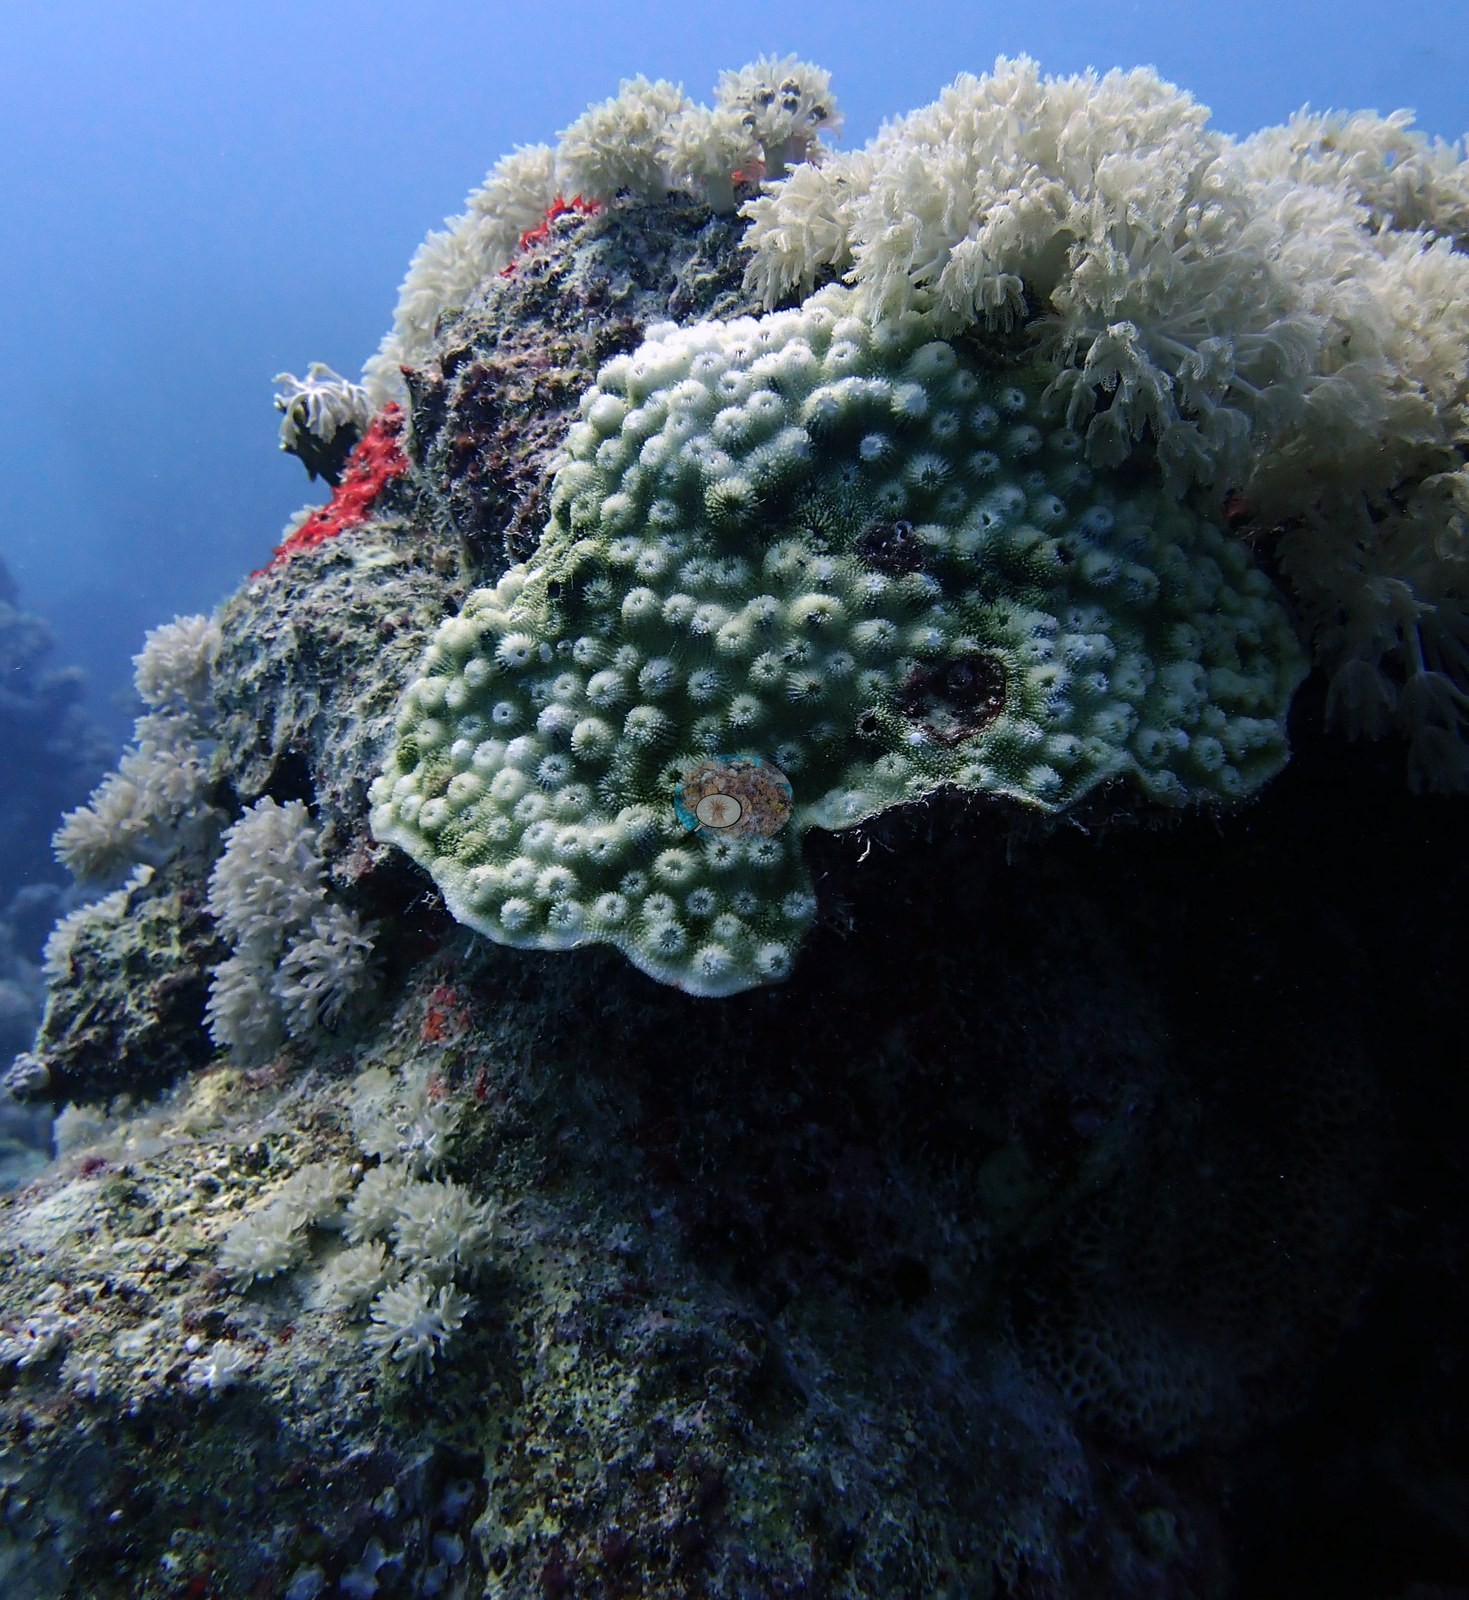
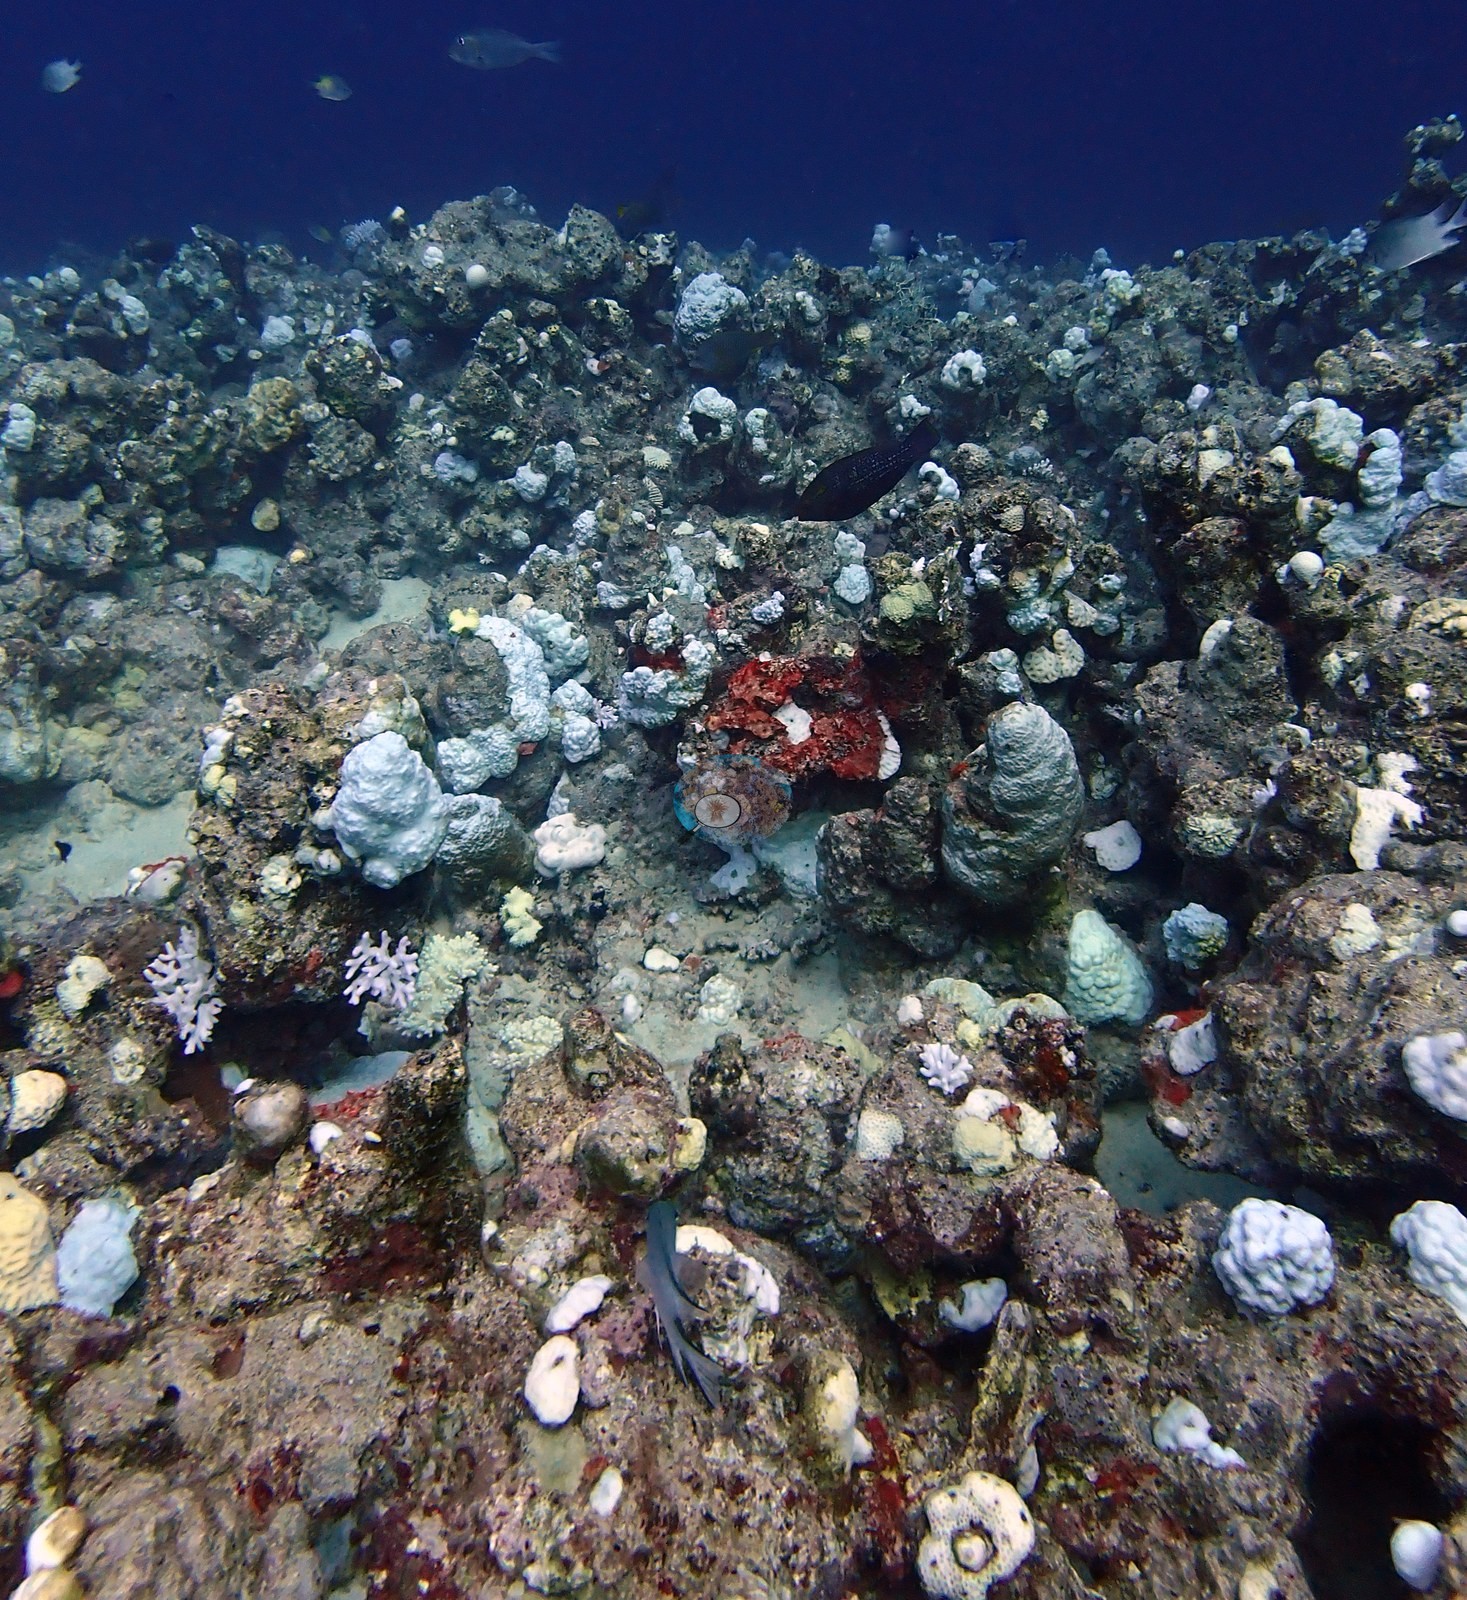
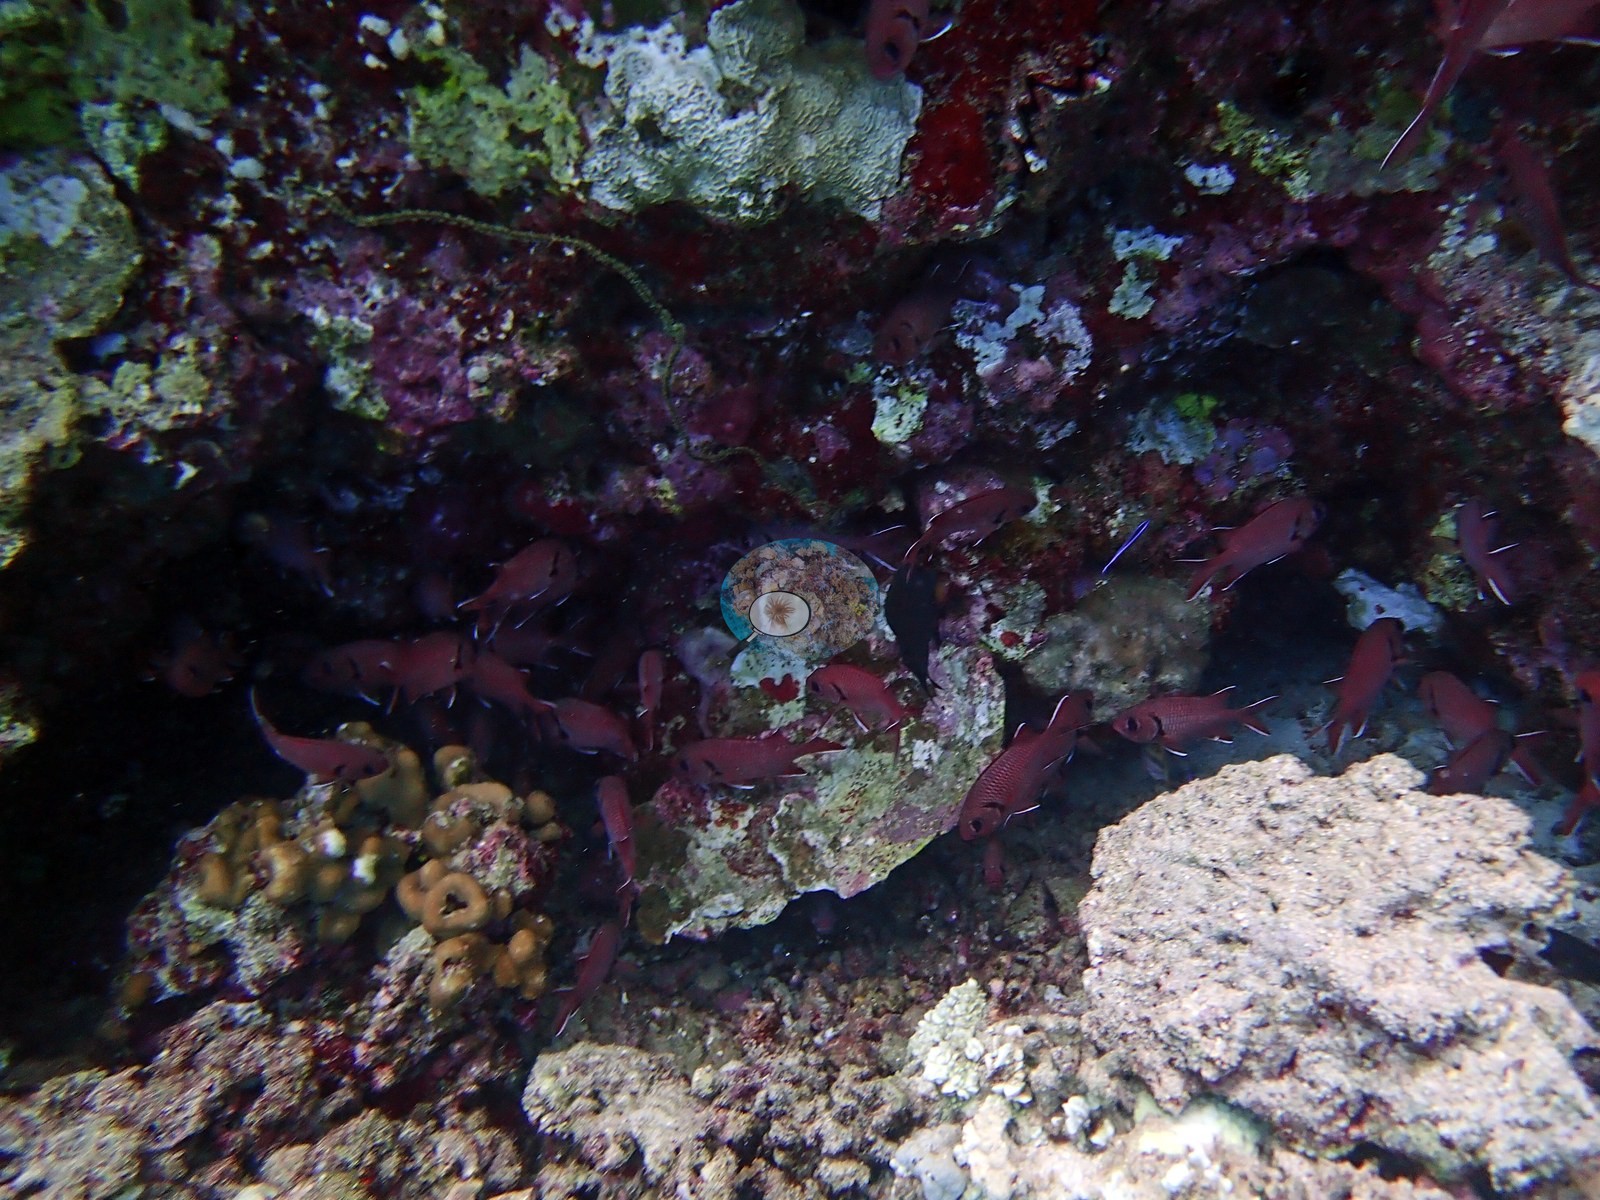
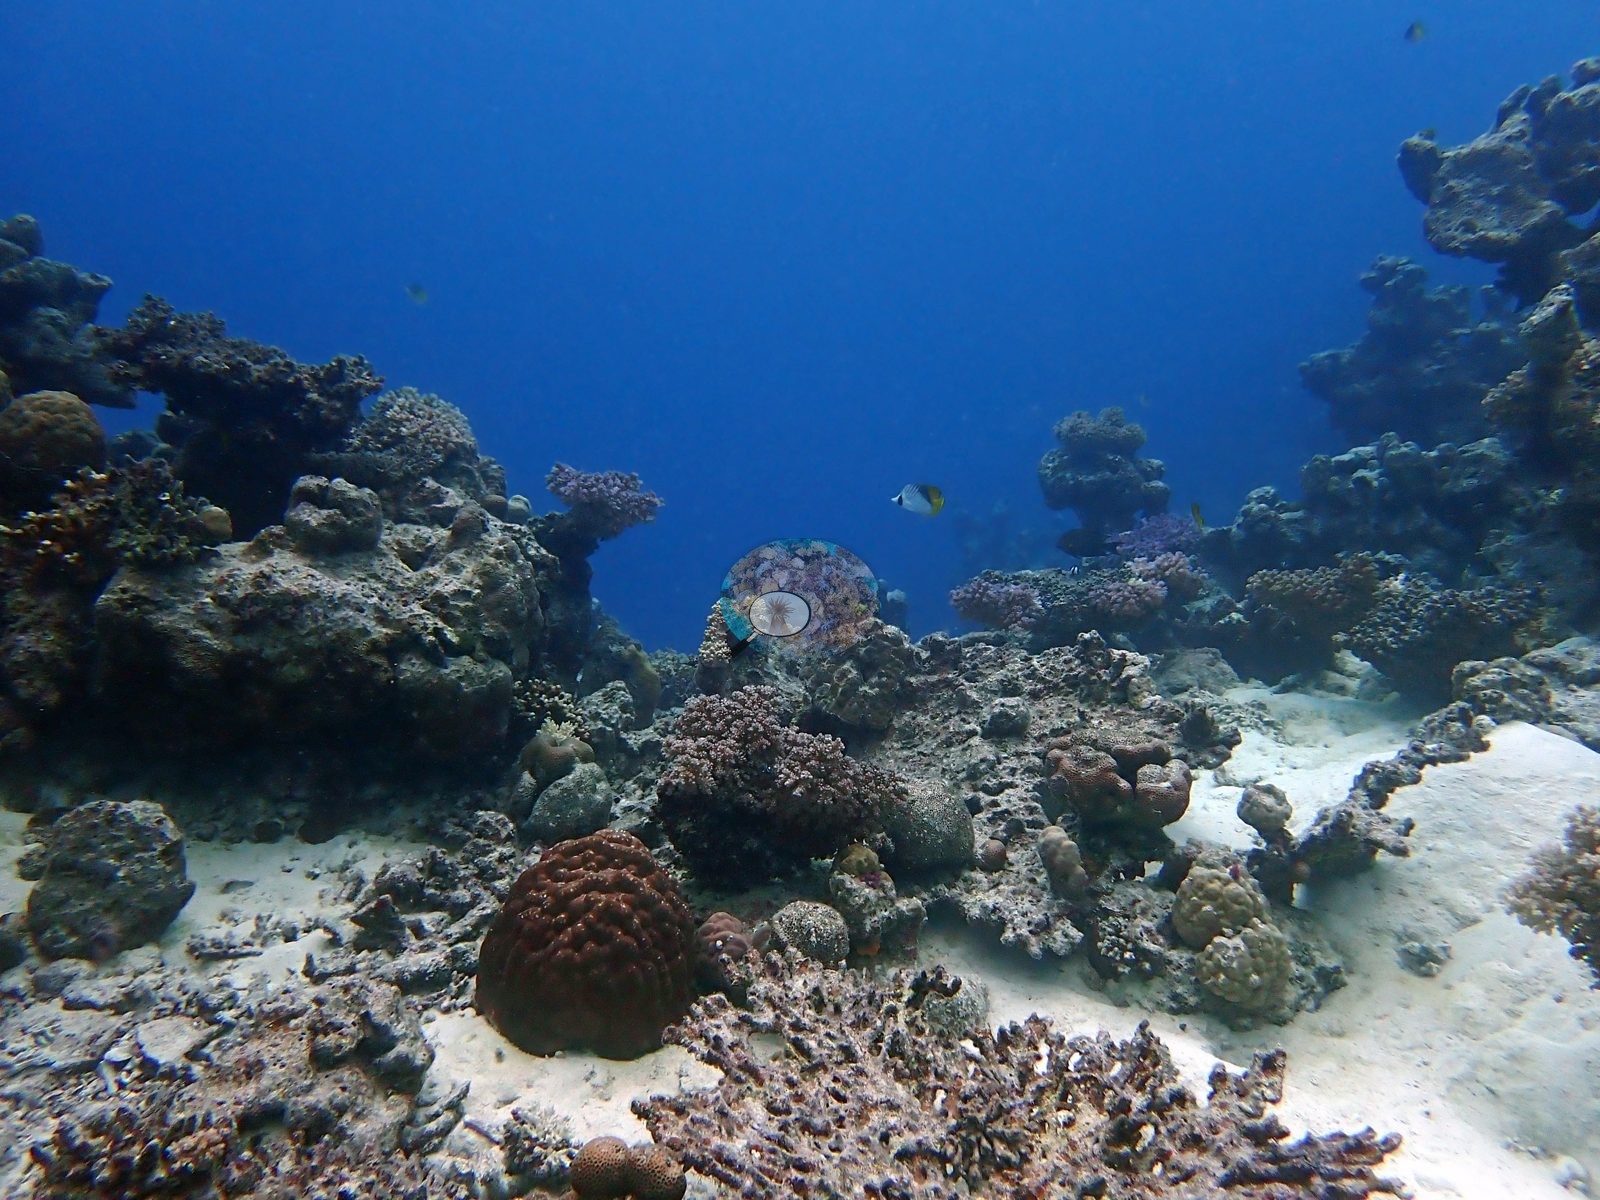
- Shark Reef (Thuwal) was the worst-hit site, with 72.7% and 70.9% of coral tissue bleached on two visits in 2024 and two crown-of-thorns starfish photographed amid the bleaching.
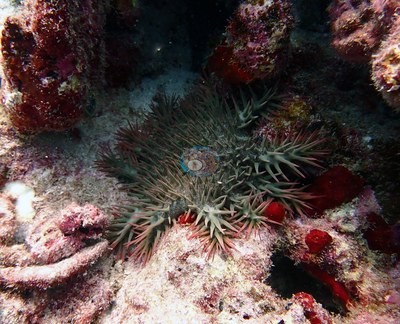 photo: Saudi Red Sea - Shark Reef (Thuwal)
 - Anderson's Reef-I and Reef-II off Jeddah had the lowest bleaching in this unit (17.2% and 18.9%) in August 2024.
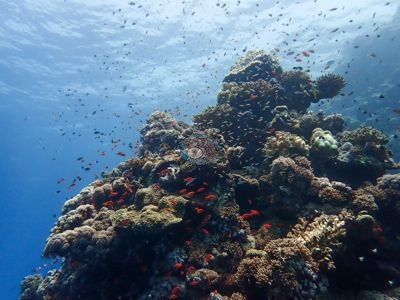 photo: Saudi Red Sea - Anderson's Reef-I (Jeddah)
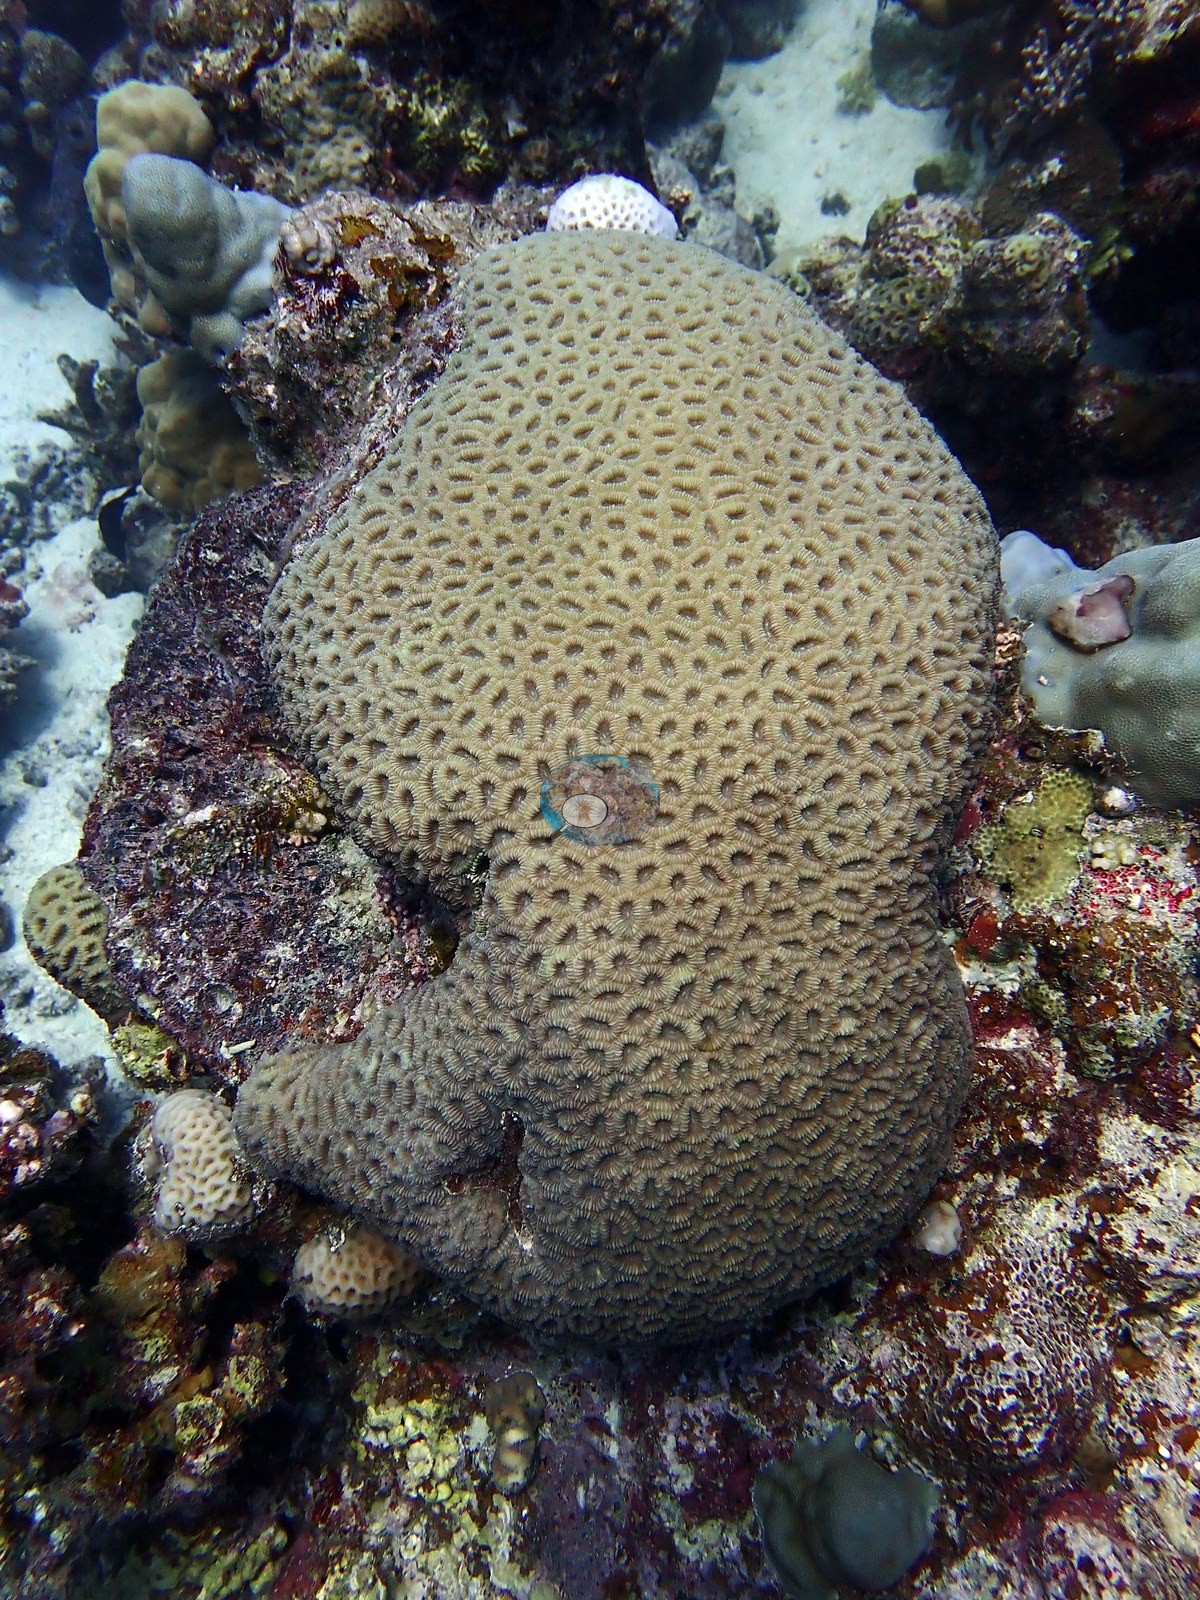
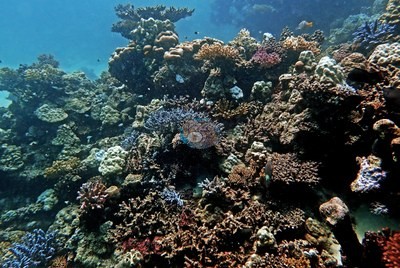
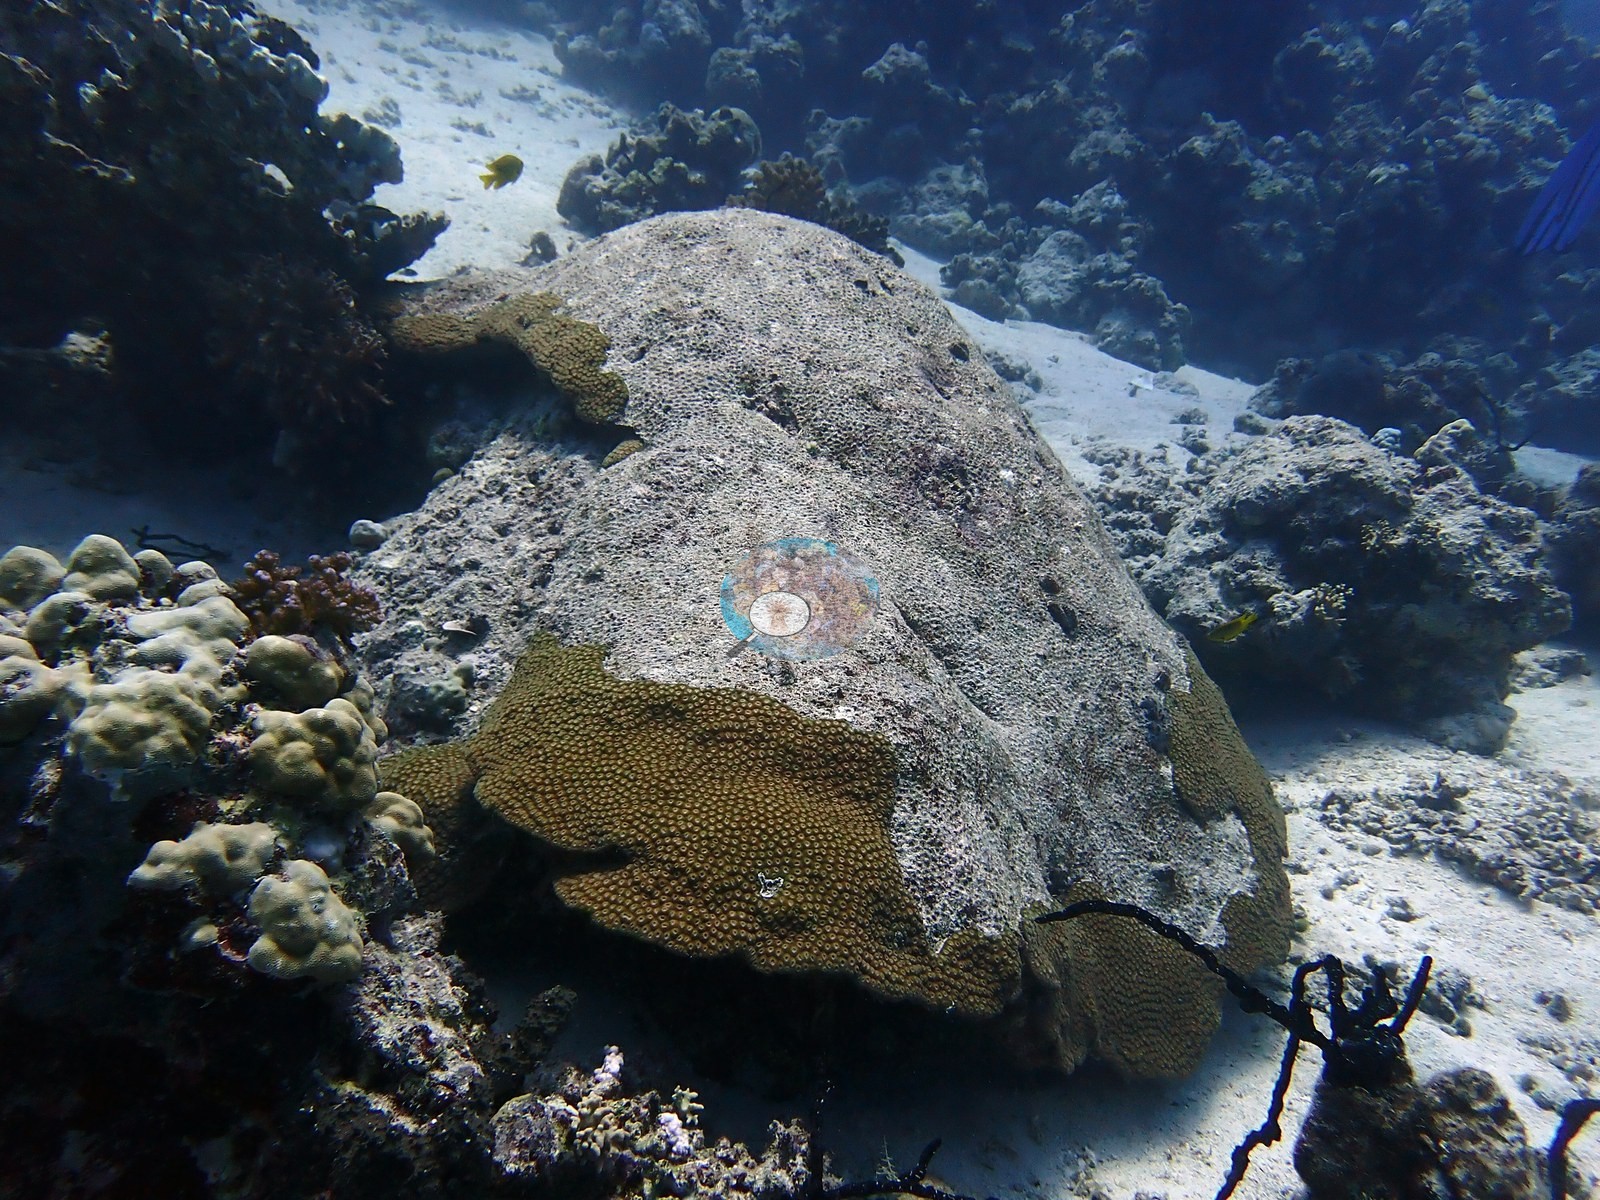
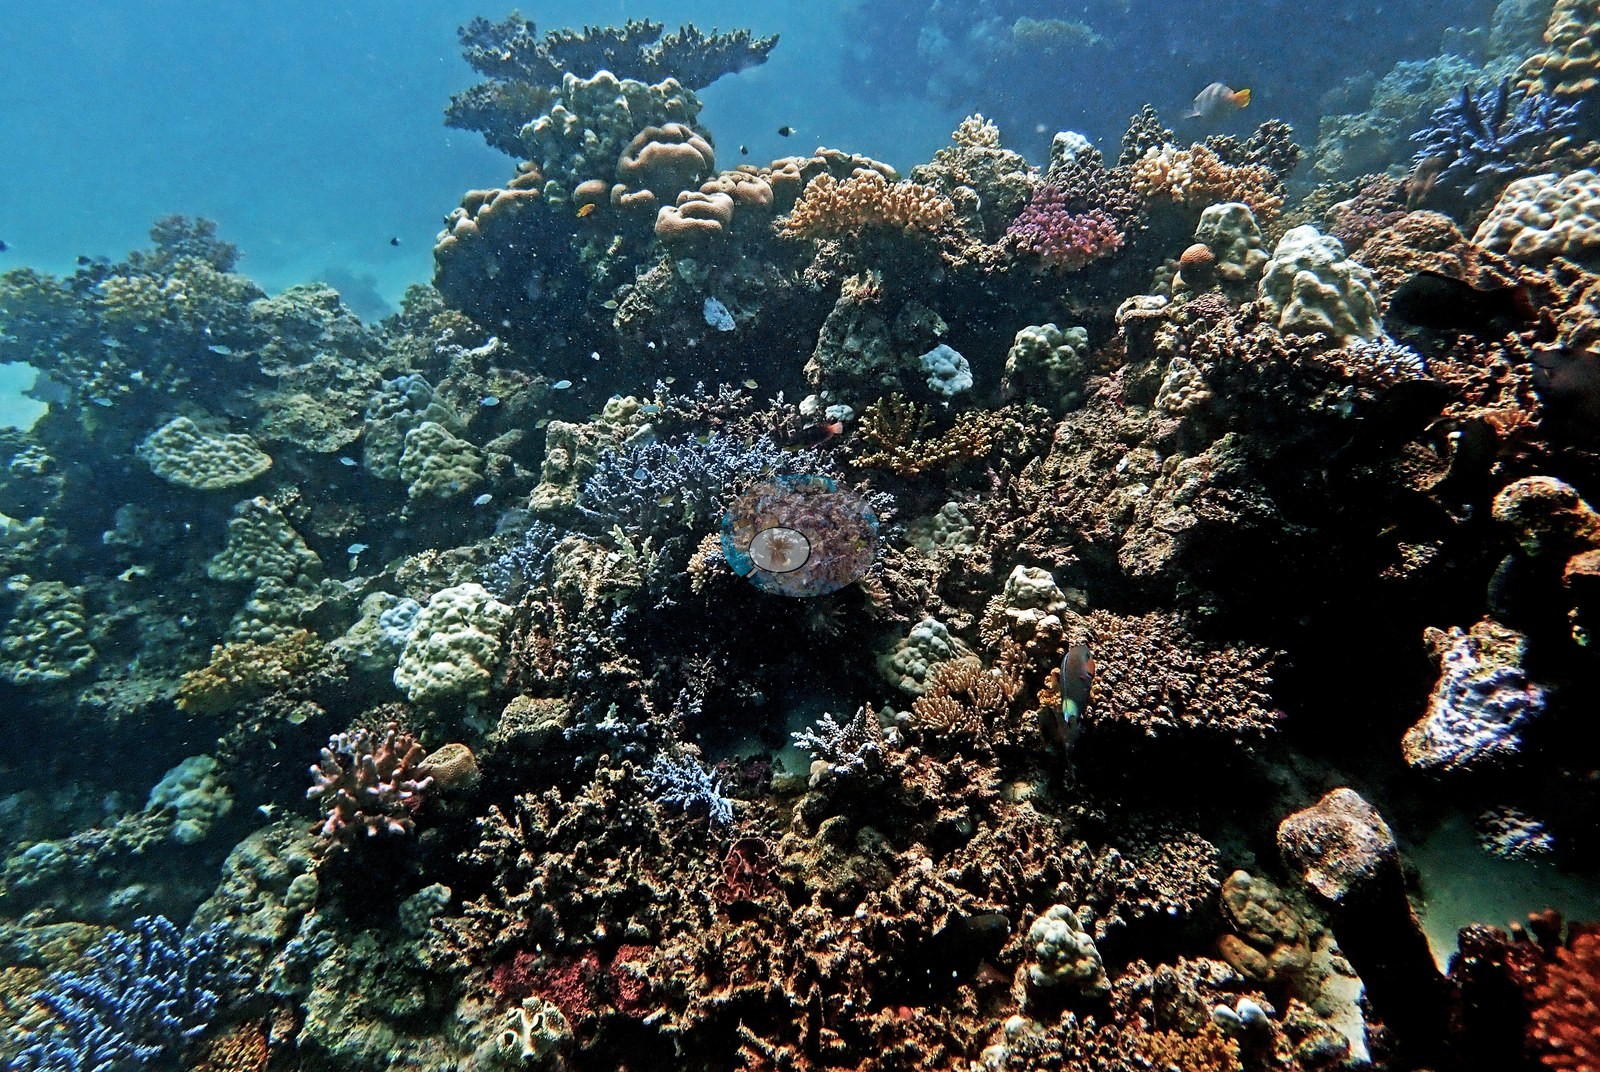
 - Coral Gardens (Jeddah) is built on giant Porites mounds and held the unit's highest cover, 27.6%.
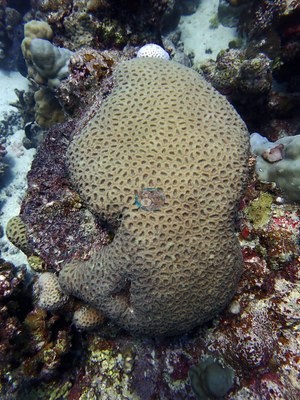 photo: Saudi Red Sea - Coral Gardens (Jeddah)
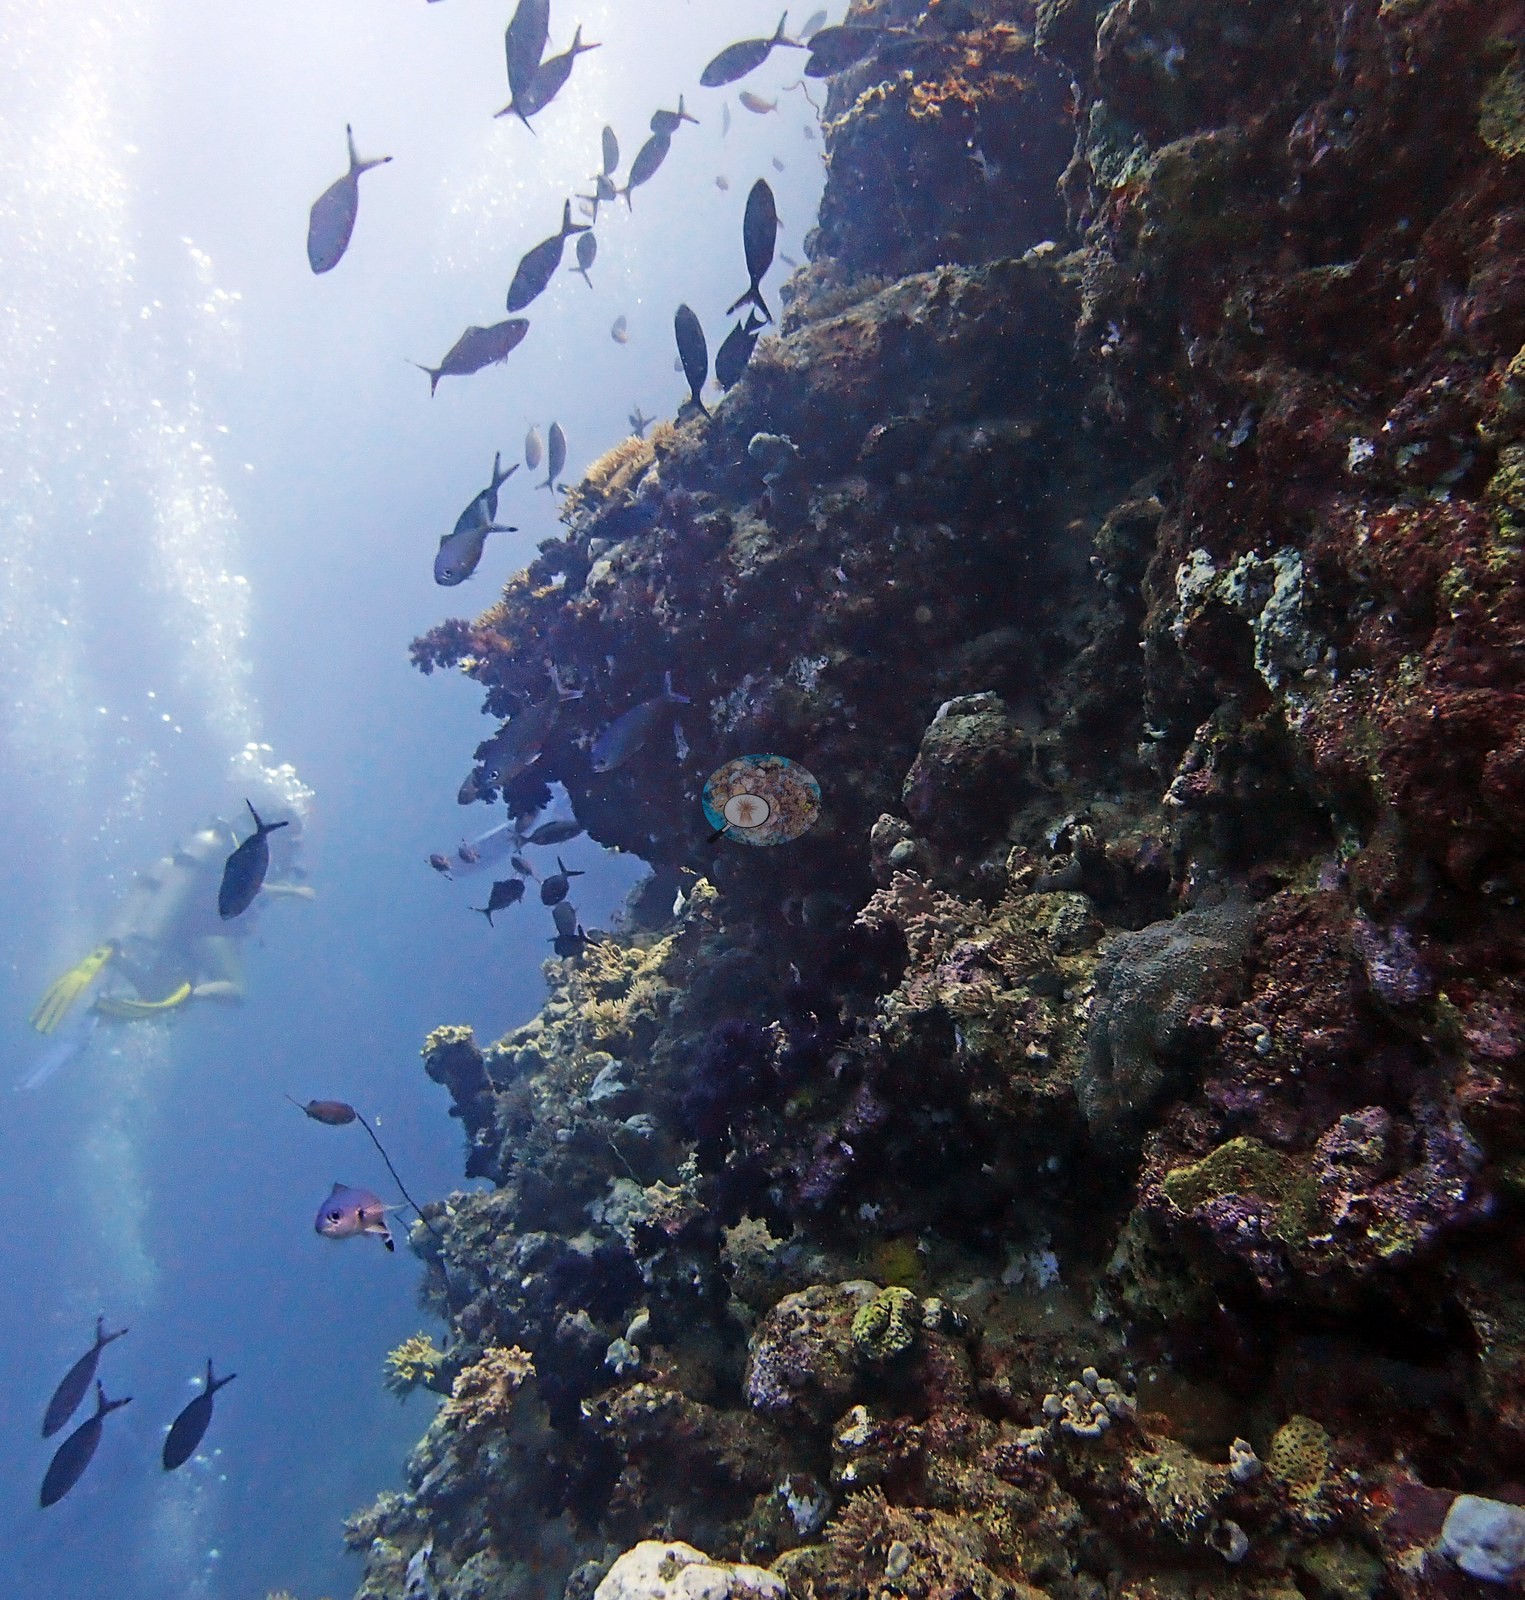
 - Rose Reef, a near-vertical wall, is the most heavily sampled site, with 720 photographs over six visits and bleaching from 24.3% to 61.8%.
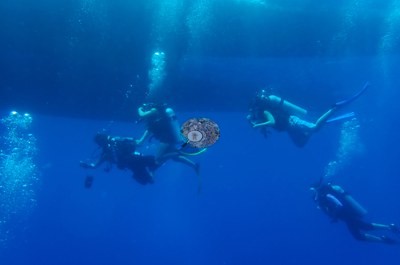 photo: Saudi Red Sea - Rose Reef (Thuwal)
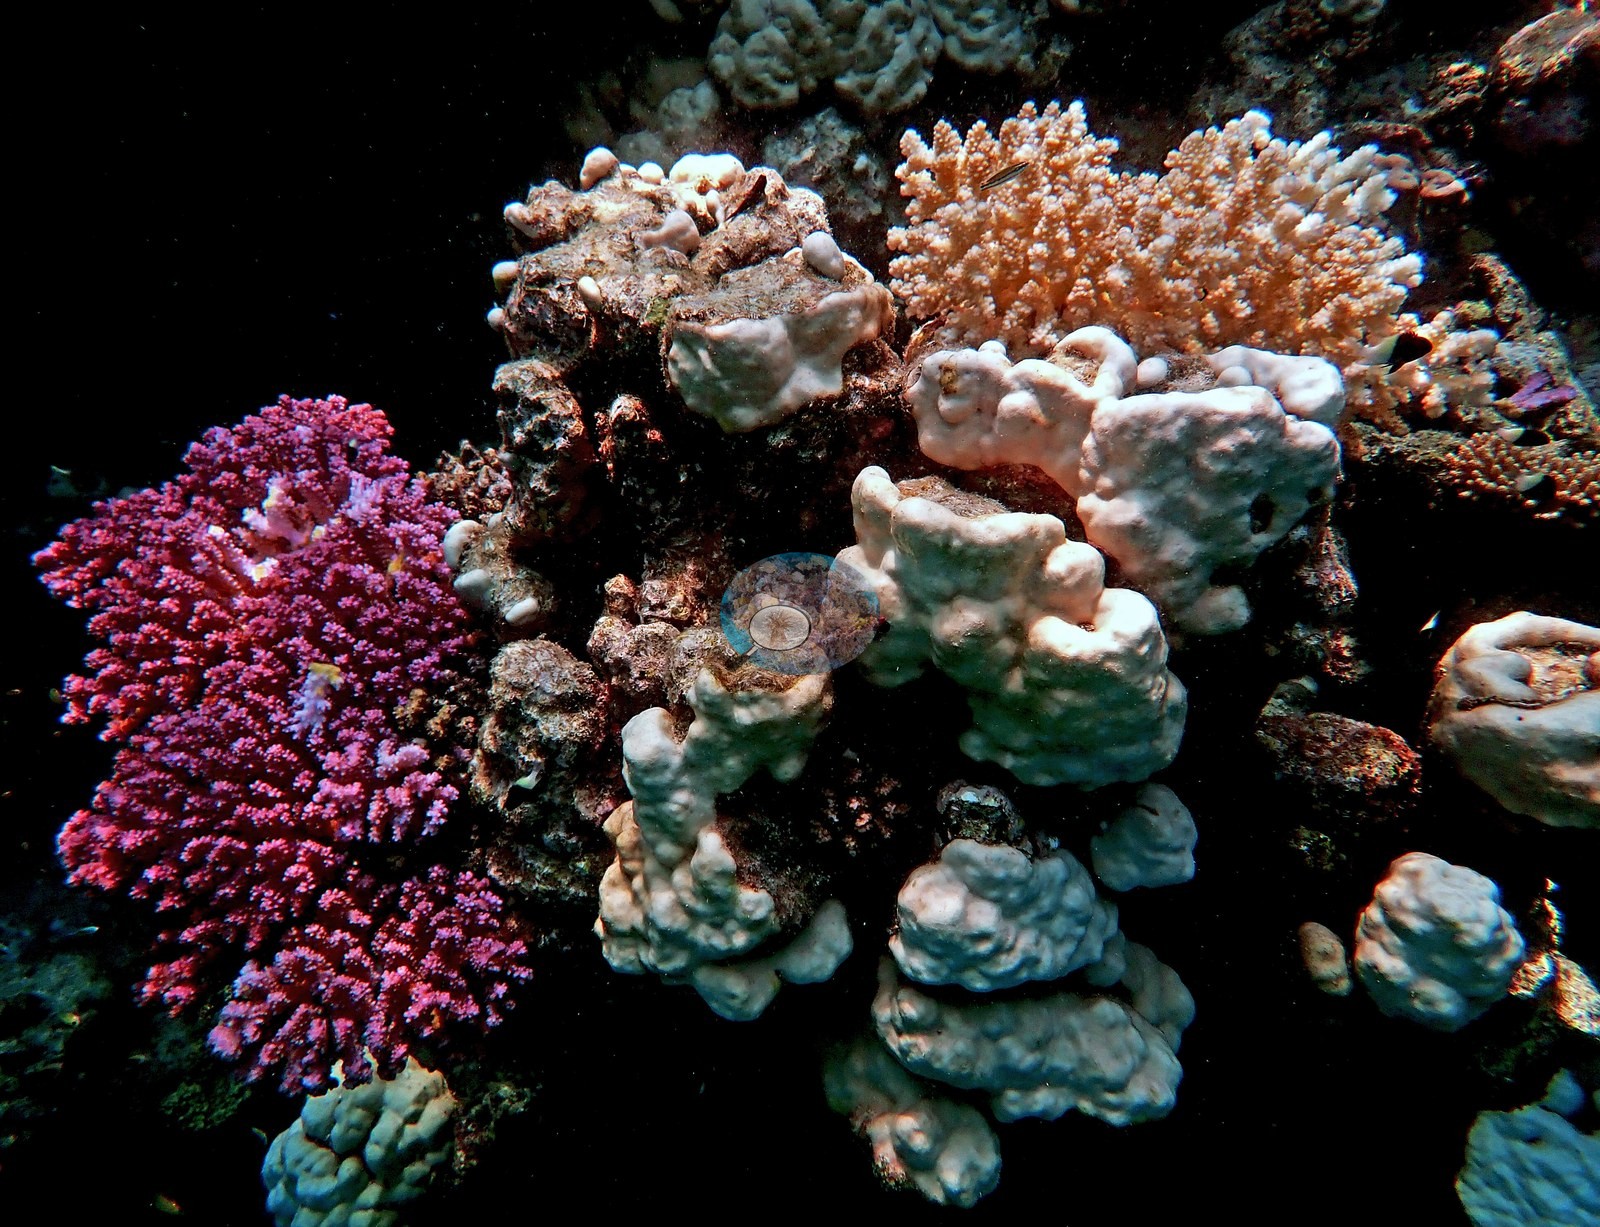
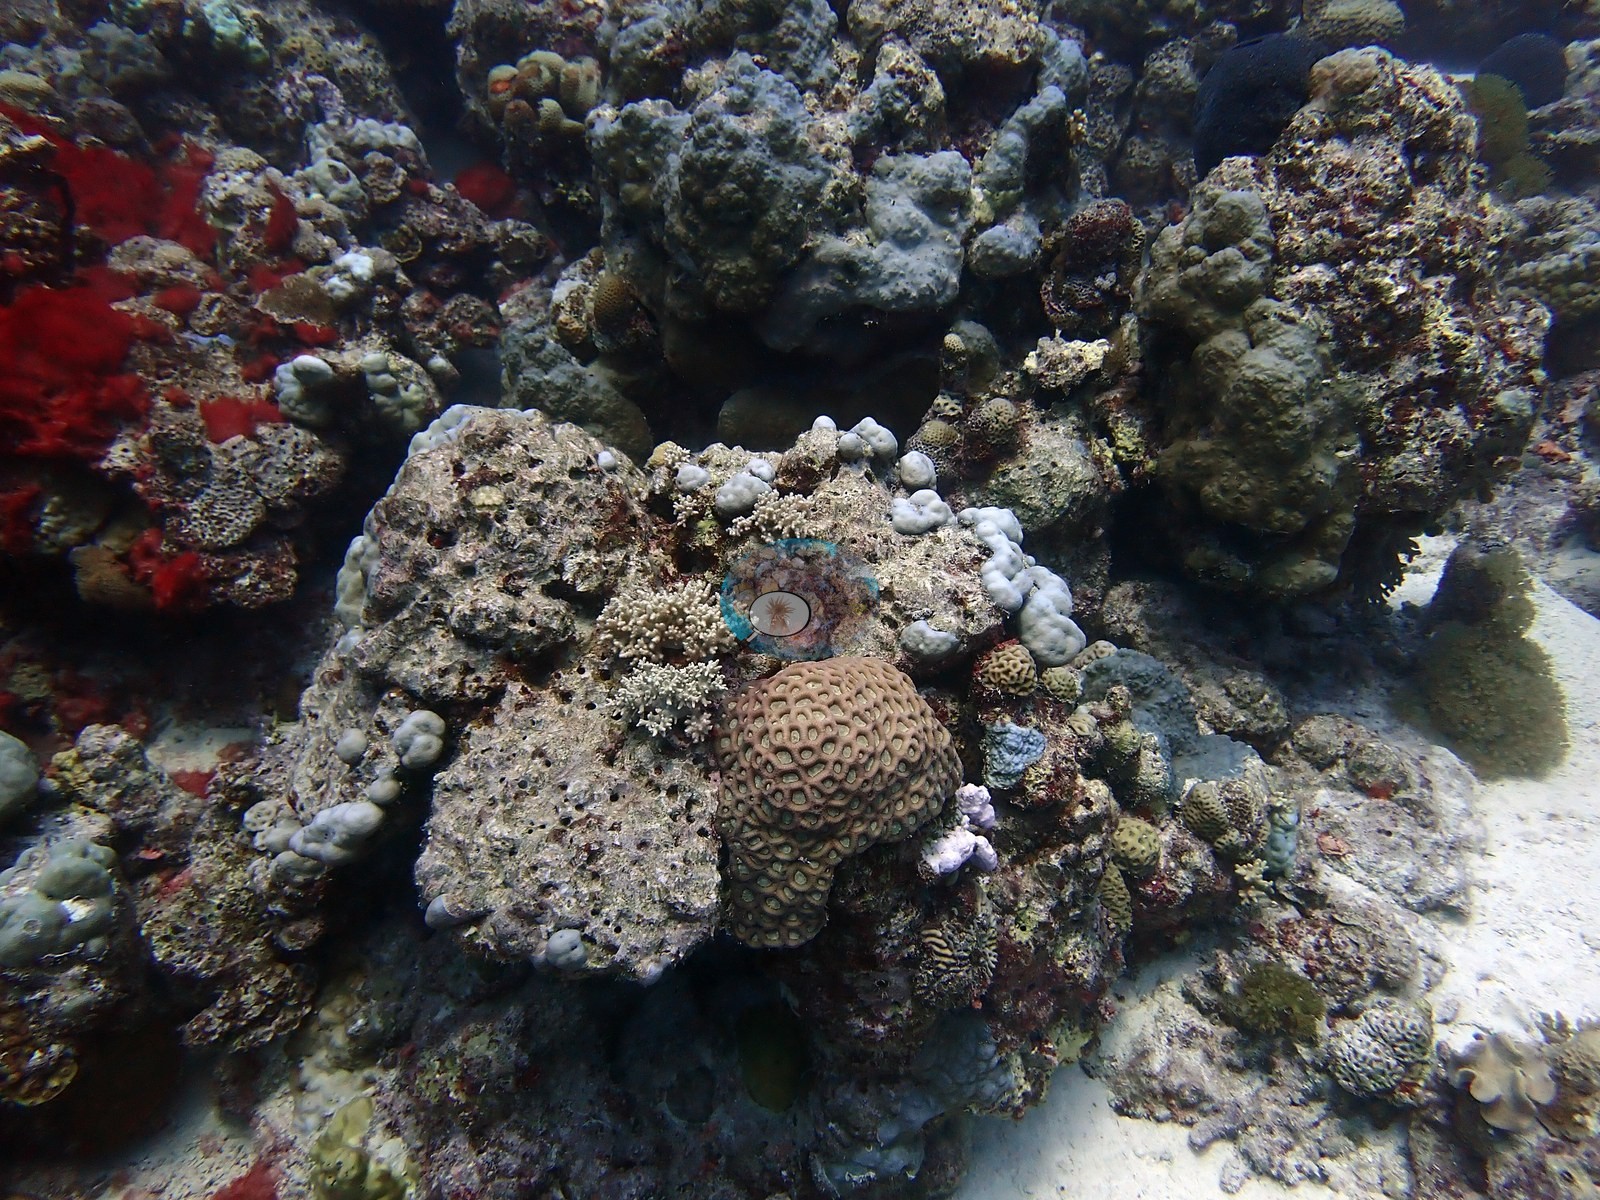
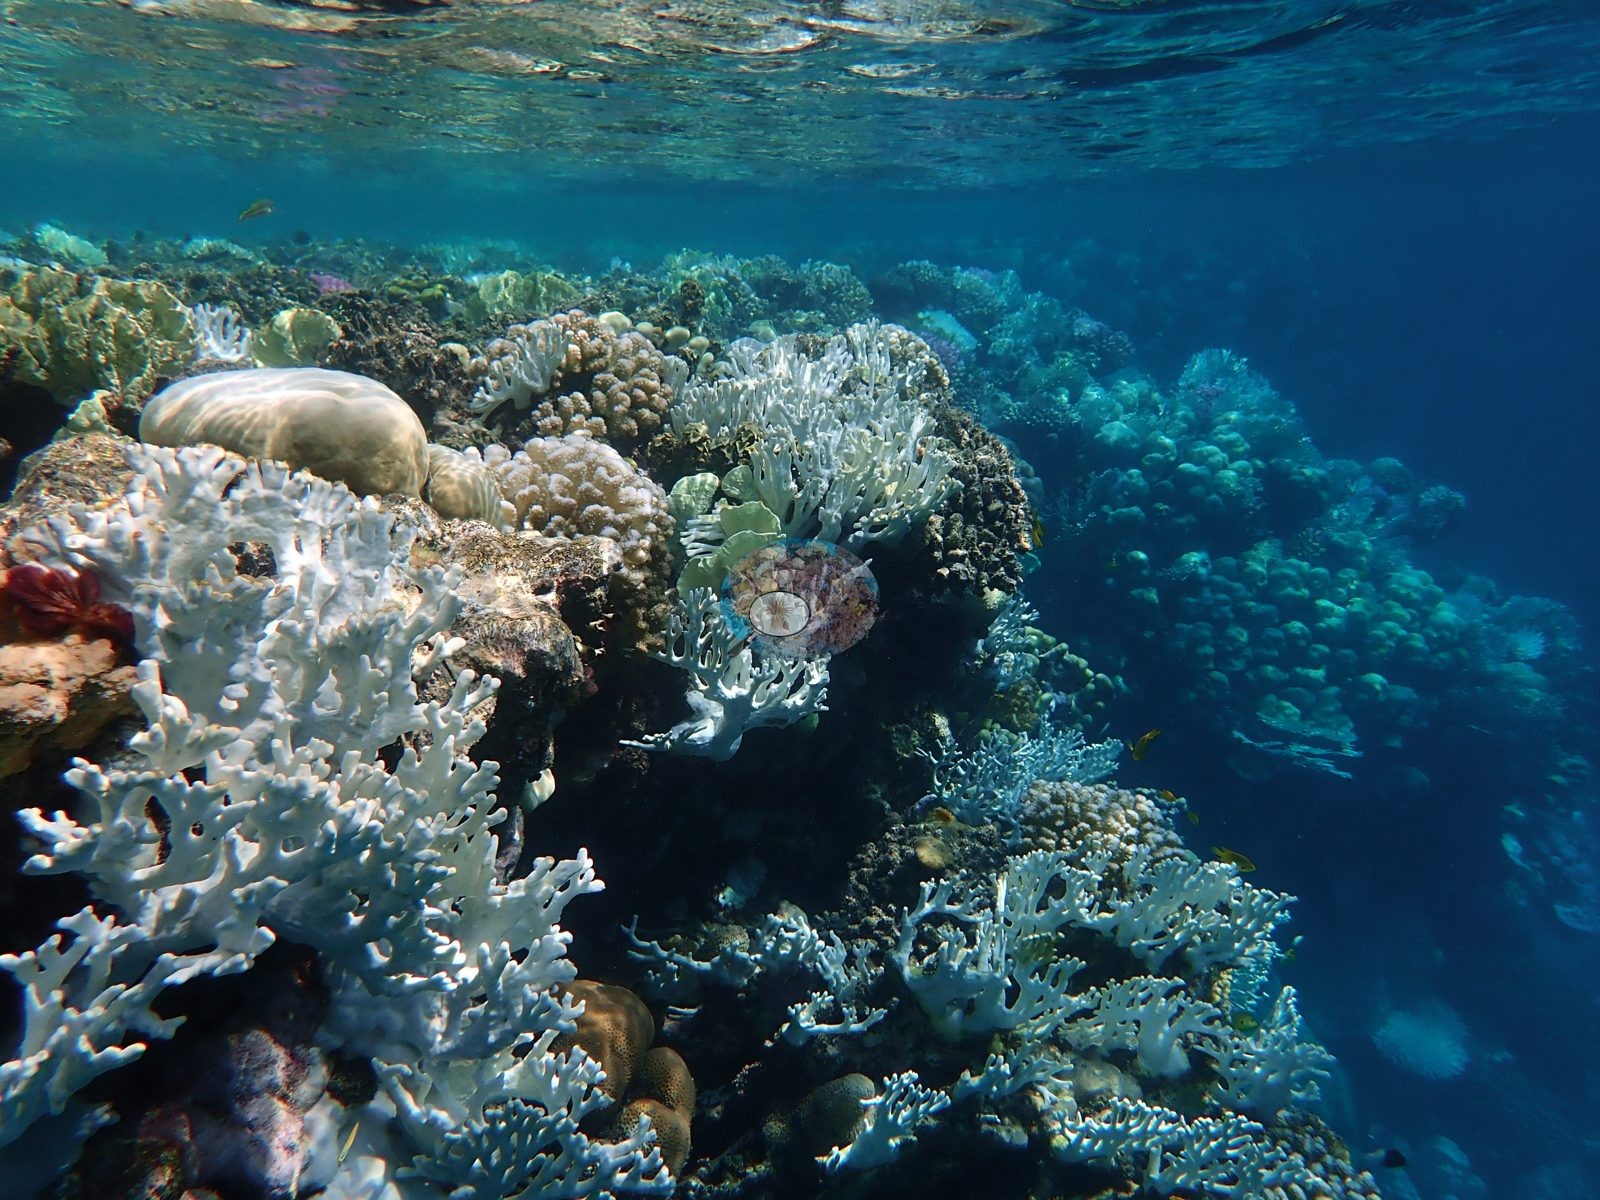
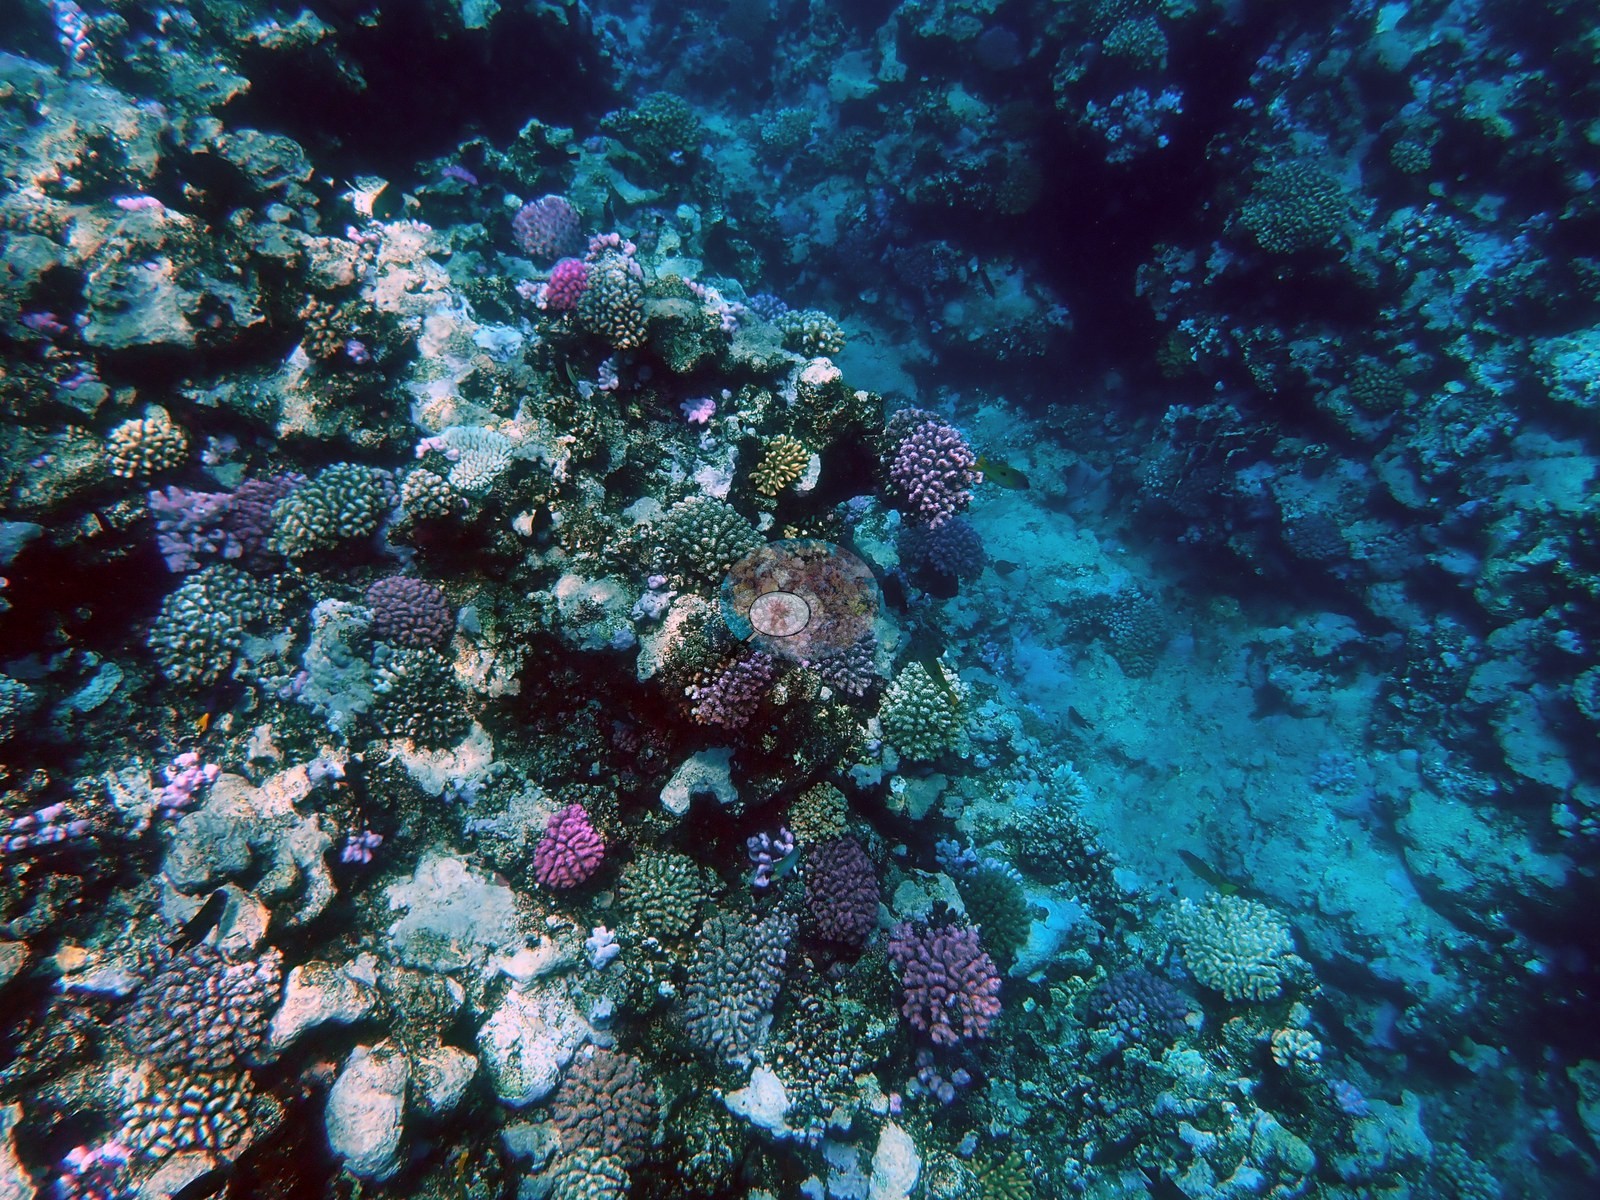
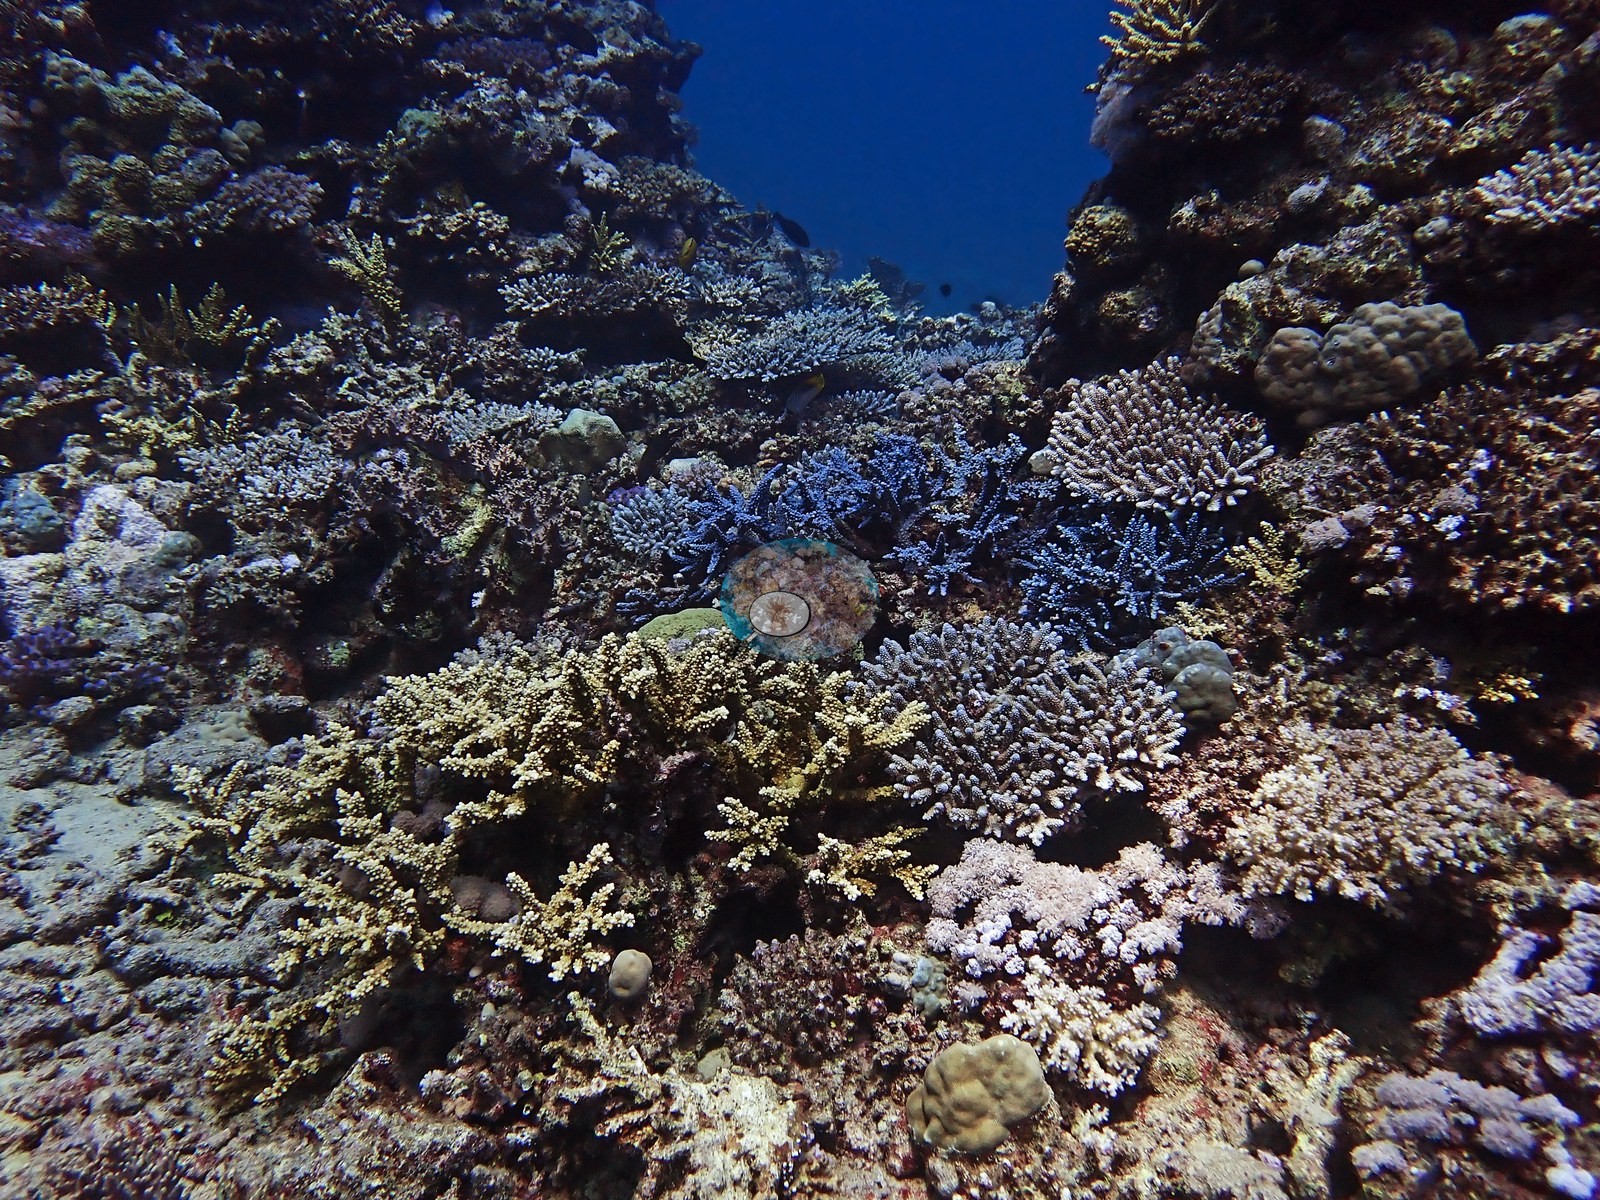
 - Cement Reef (Thuwal): a high-relief spur-and-groove reef honeycombed with swim-throughs, with dense pocilloporid thickets and cobalt Acropora on the upper slope.
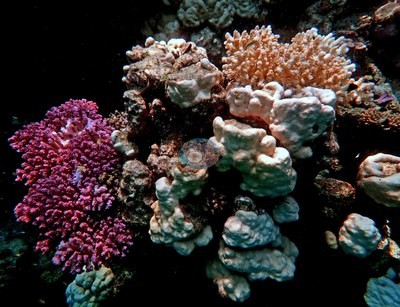 photo: Saudi Red Sea - Cement Reef (Thuwal)
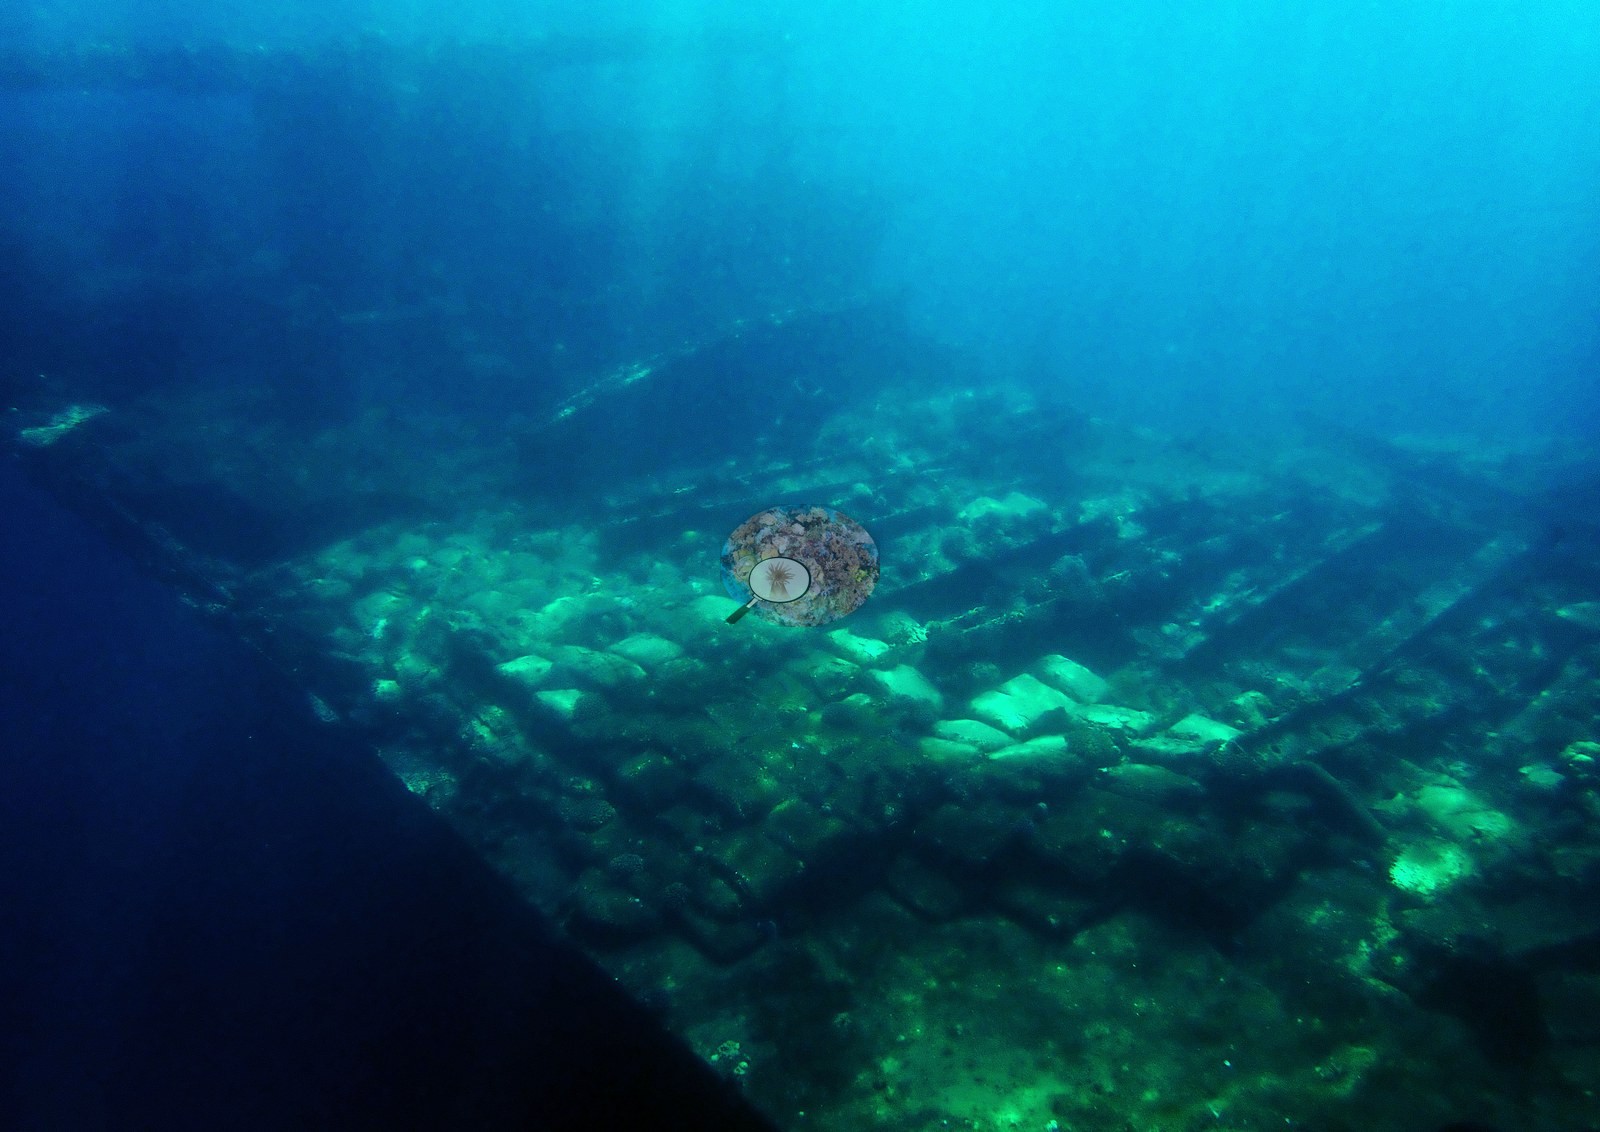
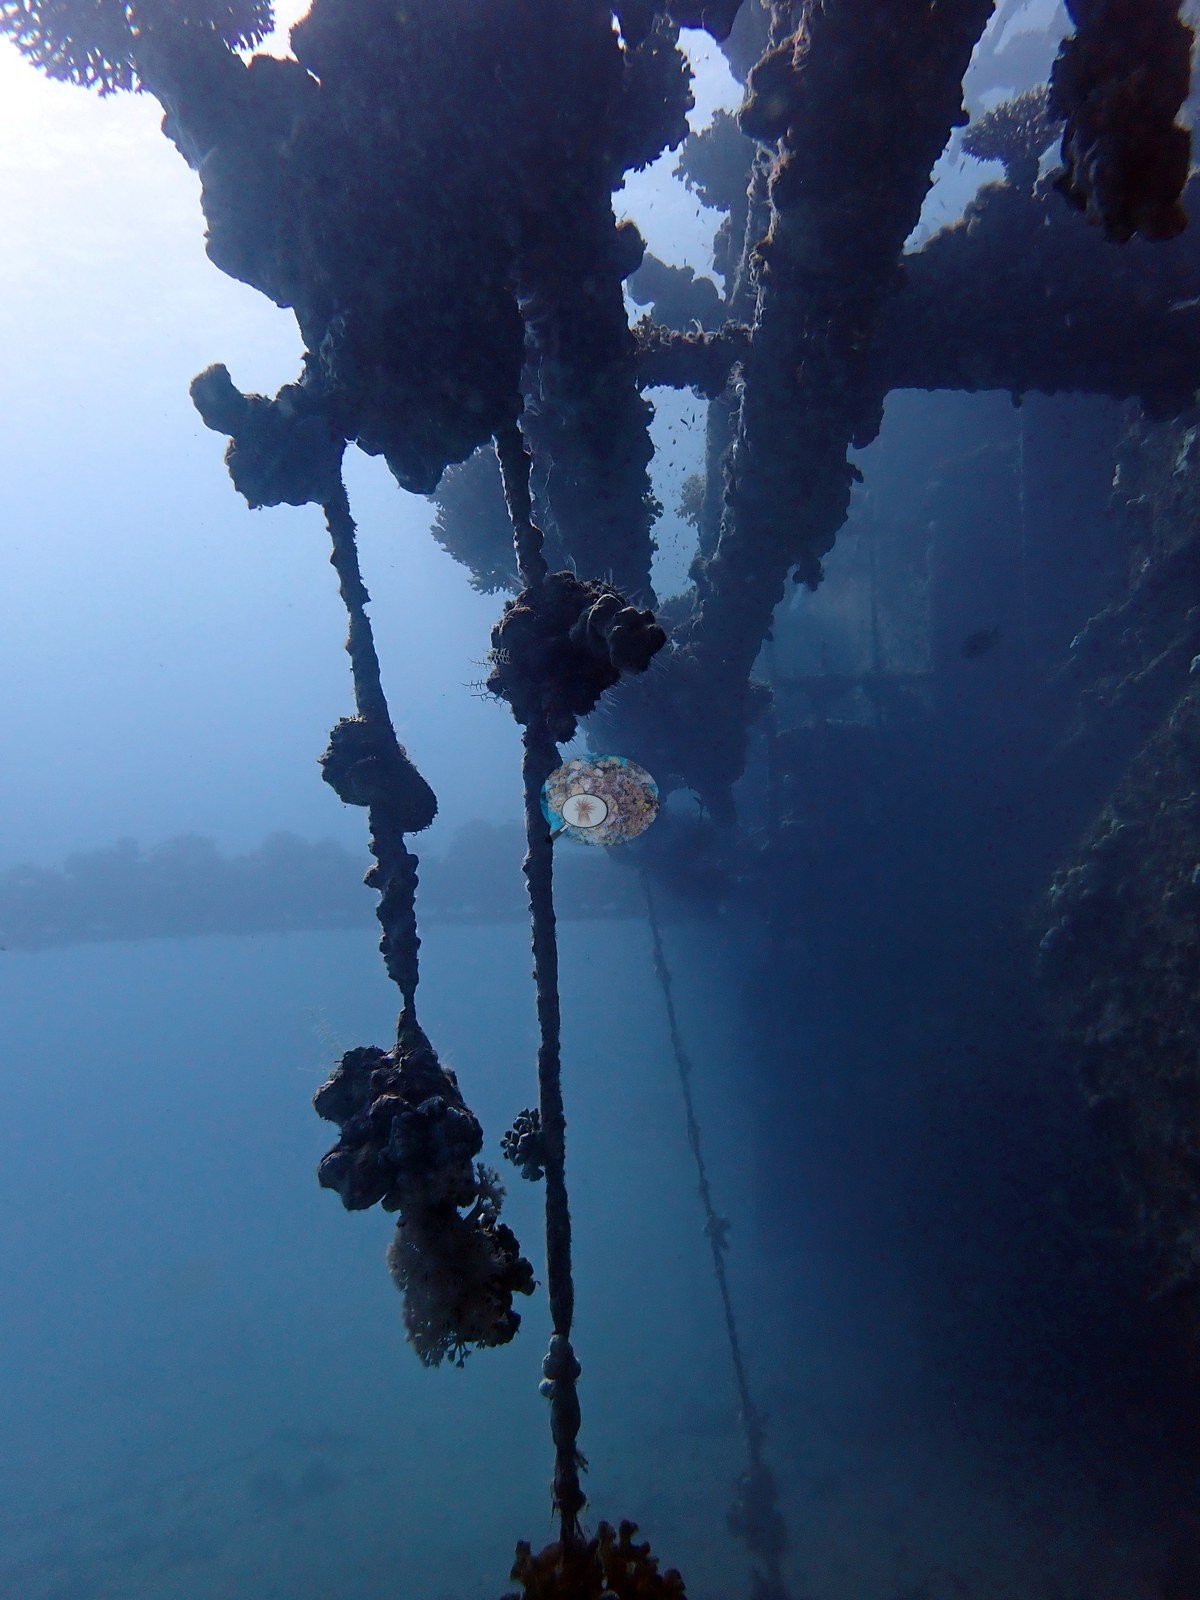
 - Two steel shipwrecks, Cement Wreck and Chicken Wreck, carry only thin coral on artificial substrate.
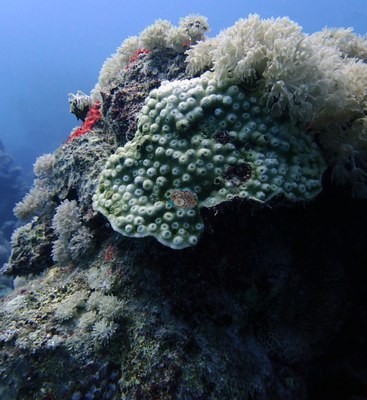 photo: Saudi Red Sea - Chicken Wreck (Jeddah)
هذه ترجمة آلية للملخص الإنجليزي؛ والنص الإنجليزي هو النسخة المعتمدة. AI translation of this summary; the English is authoritative.
Regional setting
على امتداد ساحل البحر الأحمر الأوسط في المملكة العربية السعودية، ينحدر الشاطئ بشدة في الشمال قبل أن يتحوّل بسرعة نسبية، جنوب خط العرض 20°N تقريبًا، إلى جرف قاري عريض ذي انحدار لطيف، وتصطف الشعاب الهدبية ذات المسطحات الشعابية الضيقة على امتداد معظم الساحل (Spalding et al. 2001). وبعيدًا عن الشاطئ، يمتد تكوين متقطع من النوع الحاجزي يُعرف باسم الحاجز المرجاني الصغير (Little Barrier Reef) بين الوجه (Al Wadj) وجدة (Jeddah)، ووُصفت شعاب مماثلة شبيهة بالحواجز على الجانب السوداني المقابل. ويدعم ساحل المملكة العربية السعودية على البحر الأحمر الطيف الكامل من أنواع البحر الأحمر، وقد سجّلت مسوح أُجريت في 1997–1999 نحو 260 نوعًا من المرجان الصلب. وجدة هي أكبر ميناء على البحر الأحمر، وبحلول عام 2001 كانت عقود من التوسع، بما في ذلك الاستصلاح والبناء مباشرة على المسطحات الشعابية الهدبية والنمو الصناعي والحضري على امتداد أكثر من 100 km من الساحل، قد أدّت إلى تدهور شديد أو تدمير كثير من الشعاب والأعشاب البحرية وأشجار القرم (المانغروف) القريبة من الشاطئ. ويشير الأطلس أيضًا إلى أن شعابًا هدبية ورقعية مهمة بقيت إلى الشمال والجنوب من المدينة. وفي أغسطس وسبتمبر 1998، ابيضّت الشعاب بشدة في بعض المواقع من ينبع (Yanbu) إلى رابغ (Rabigh). ويقدّر Spalding et al. (2001) مساحة الشعاب المرجانية في المملكة العربية السعودية بنحو 6,660 km²، وهو رقم وطني يشمل ساحلها على الخليج العربي؛ في حين يعطي Souter et al. (2021) رقم 7,800 km² لمنطقة شمال ووسط البحر الأحمر الفرعية.
ويفيد Souter et al. (2021) بأن ابيضاض عام 1998 كان الأشد وطأة في وسط وشمال البحر الأحمر السعودي، ولا سيما قرب رابغ، مع أن معظم الشعاب المبيضّة في أنحاء المنطقة تعافت. وفي وسط البحر الأحمر يعزون التدهور المحلي للشعاب ونمو الطحالب أساسًا إلى الجريان السطحي من اليابسة والإثراء الغذائي والصيد الجائر. وانخفضت التغطية المرجانية في شمال ووسط البحر الأحمر من 35.2% (1997) إلى 29.7% (2002)، ثم ارتفعت ببطء إلى 39.1% بحلول عام 2019، بينما تضاعفت التغطية الطحلبية في المنطقة بأكملها تقريبًا بعد عام 2012. ويضيف التطوير الساحلي ضغطًا آخر: فقد أفاد Wilkinson (2006) بوجود خطط كبيرة لاستصلاح مناطق من الشعاب في البحر الأحمر السعودي، ويشير Souter et al. (2021) إلى أن خطة رؤية 2030 للمملكة تتعامل مع السياحة الساحلية بوصفها مسارًا رئيسيًا للتنويع الاقتصادي. وحتى عام 2001، لاحظ Spalding et al. أن الغوص الترفيهي، رغم محدوديته، كان يتركّز على شعاب جدة.
Overview
تغطي هذه الوحدة 15 موقعًا في وسط البحر الأحمر جرى الغوص فيها بين سبتمبر 2023 وأكتوبر 2024. تقع ثمانية منها قبالة ثول (Thuwal) وجرى العمل فيها مع Coastline (KAUST)، وستة قبالة جدة، وواحد شعاب يُنزَل إليها من الشاطئ شمال رابغ. والبيئات متنوعة: منحدر هدبي شديد الانحدار في Abu Ejeiah، وشعاب عالية التضاريس من النتوءات والأخاديد تتخللها ممرات السباحة كخلايا النحل في Cement Reef، وجدار شبه عمودي في Rose Reef جرى الغوص فيه على عمق 32 إلى 36 m، وقمم وكهوف متآكلة شديدة التآكل الحيوي ترتفع من الرمل في Cave Reef (27.2 m). وتتألف Anderson's Reef-I من قمم مرجانية شاهقة، وتحدّد ملامحَ Coral Gardens تلالٌ عملاقة من Porites يبلغ عرض كل منها عدة أمتار، أما Drogon Corals فهي في معظمها سهل رملي تتناثر فيه كتل مرجانية منعزلة. ولا يحمل حطاما السفينتين الفولاذيتين، Cement Wreck وChicken Wreck، سوى تناثر رقيق من المرجان.
تراوحت التغطية المنشورة المستندة إلى عدّ النقاط بين 12.8% في Cement Wreck و27.6% في Coral Gardens عبر 14 موقعًا جرى مسحها. وظلت التغطية الطحلبية منخفضة في كل المواقع، من 5.5% في Coral Gardens إلى 11.8% في Long Reef. ويتكوّن معظم المجتمع المرجاني من البوسيلوبوريدات (pocilloporids) بأشكال لونية خزامية وأرجوانية ووردية، وAcropora العنقودية وقرن الأيل والطاولية، وPorites العُقدية، والفافيدات (faviids)، والمرجان الناري من نوع Millepora. وتتميّز Anderson's Reef-II بكتلة مرجانية منعزلة بحجم مبنى صغير، يكسو تاجها مرجان رخو شجري بلونَي الليلكي والذهبي. وفي Cave Reef وDrogon Corals وChicken Wreck، يتناوب الرصيف الصخري العاري أو الرمل أو الفولاذ مع تجمّعات كثيفة من المرجان.
سُجّلت هذه الشعاب طوال موجات الحر البحرية في البحر الأحمر في 2023-24، وتفاوت الابيضاض تفاوتًا حادًا بين مواقع متجاورة. وكانت Shark Reef الأشد تضررًا (ابيضاض 71.7% من النسيج المرجاني)، إذ ابيضّت منحدرات بأكملها، وصُوّر فيها نجمان من نجوم البحر ذات التاج الشوكي. وتلتها North Rabigh (64.8%) وBhadur Reef (62.0%، عند نحو 22.3 من أسابيع درجات التسخين)، وفي Bhadur ابيضّت المرجانيات الرخوة ومرجانيات الفطر (fungiids) وشقائق النعمان البحرية إلى جانب المرجان الصلب. وفي نافذة أغسطس 2024 نفسها، كانت Anderson's Reef-I وReef-II الأقل تأثرًا (17.2% و18.9%)، بينما ارتفعت النسبة في Coral Gardens من 41.4% إلى 45.4% خلال أسبوع. وتراوحت النسبة في Rose Reef بين 24.3% و61.8% على مدى ست زيارات، وأظهرت Cave Reef ابيضاضًا بنسبة 26.8% في فبراير 2024 دون أي إجهاد حراري متراكم.
Highlights
- كانت Shark Reef (ثول) الموقع الأشد تضررًا، إذ ابيضّ 72.7% و70.9% من النسيج المرجاني في زيارتين خلال عام 2024.
 photo: Saudi Red Sea - Shark Reef (Thuwal)
 - سجّلت Anderson's Reef-I وReef-II قبالة جدة أدنى ابيضاض في المجموعة (17.2% و18.9%) في أغسطس 2024.
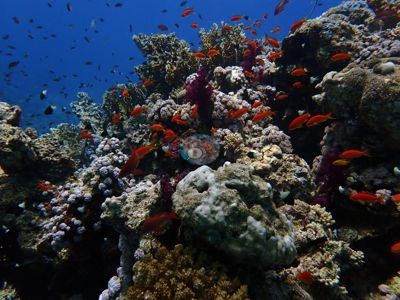 photo: Saudi Red Sea - Anderson's Reef-I (Jeddah)
 - تقوم Coral Gardens (جدة) على تلال عملاقة من Porites، وسجّلت أعلى تغطية في الوحدة، 27.6%.
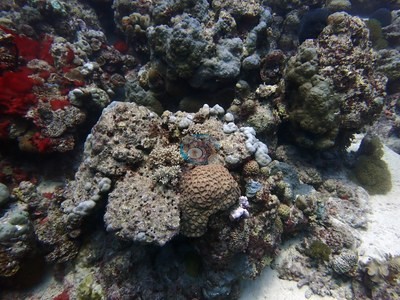 photo: Saudi Red Sea - Coral Gardens (Jeddah)
 - Rose Reef، وهي جدار جرى الغوص فيه على عمق 32 إلى 36 m، هي الموقع الأكثر أخذًا للعينات، إذ التُقطت فيها 720 صورة على مدى ست زيارات.
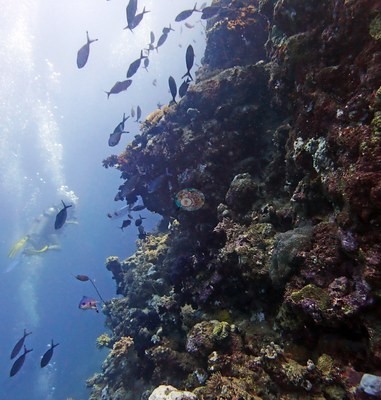 photo: Saudi Red Sea - Rose Reef (Thuwal)
 - لا يحمل حطاما السفينتين الفولاذيتين، Cement Wreck وChicken Wreck، سوى مرجان رقيق على ركيزة اصطناعية.
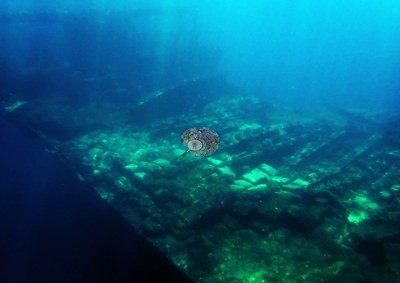 photo: Saudi Red Sea - Cement Wreck (Thuwal)
Notable observations
- Saudi Red Sea - Shark Reef (Thuwal): Bleaching and crown-of-thorns starfish (COTS): 72.7% of coral tissue bleached (31 Aug 2024) and 70.9% (14 Sep 2024); whole slopes where most visible colonies are stark white. Two crown-of-thorns starfish (Acanthaster), one on each survey day, photographed amid bleached and dying coral. Anderson's captions include 'severe bleaching', 'dead corals', 'dying reef'.
- Saudi Red Sea - north Rabigh (shore) (Rabigh): Bleaching: 64.8% of coral tissue bleached at about 16.9 degree-heating-weeks (16 Aug 2024); much of the branching framework stark bone-white; a massive dome with freshly exposed skeleton already fouling brown.
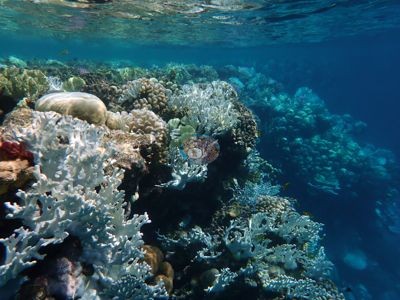
- Saudi Red Sea - Bhadur Reef (Jeddah): Bleaching and mortality: 61.8% of coral tissue bleached at about 22.3 degree-heating-weeks (7 Sep 2024); soft corals, fungiids, and anemones bleached with the hard corals; Anderson's captions include '100% bleaching', 'dead acroporid', 'dead pocilloporid', 'dying pocilloporid'.
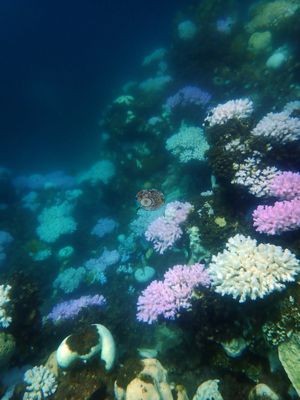
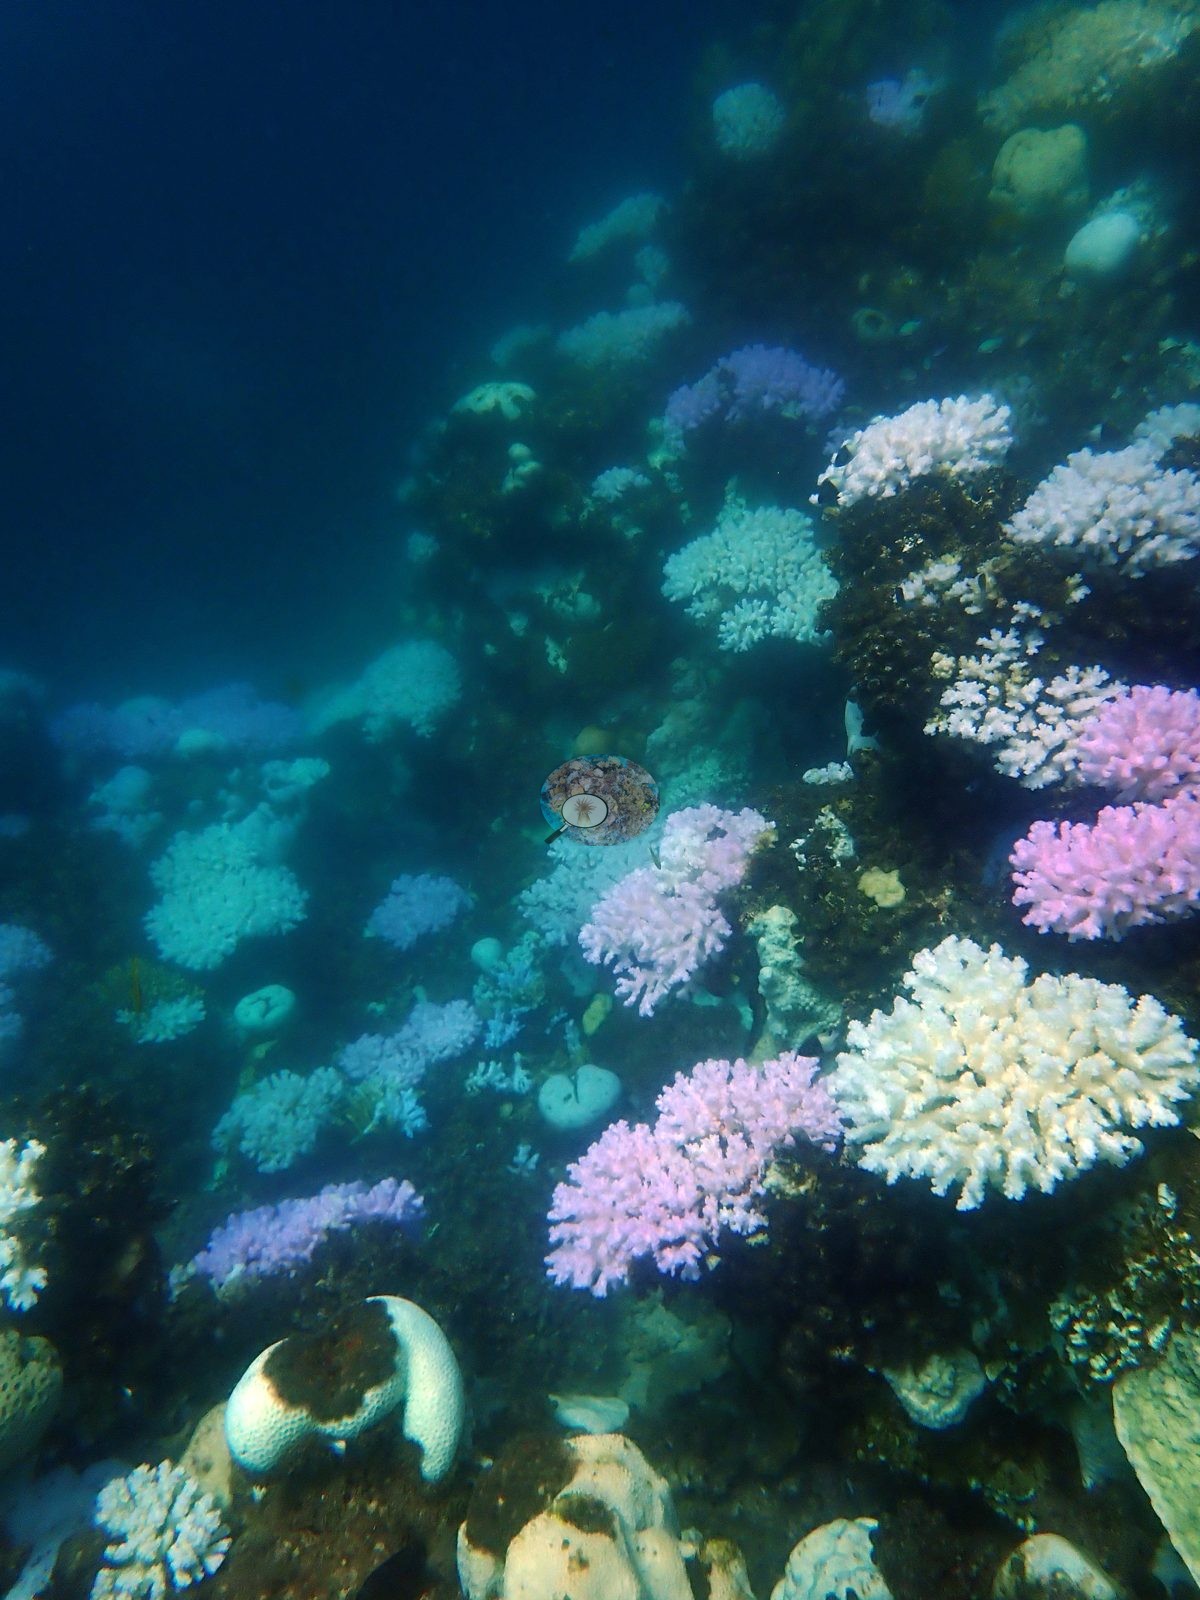
- Saudi Red Sea - Rose Reef (Thuwal): Bleaching: site-level 43.0% of coral tissue, range 24.3% to 61.8% across six visits; mass bleaching of tabulate and corymbose Acropora on the shallow flat in November 2023, with host anemones bleached white.
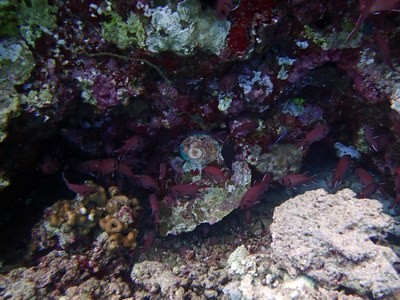
- Saudi Red Sea - Coral Gardens (Jeddah): Bleaching: 41.4% (10 Aug 2024) rising to 45.4% (17 Aug 2024) of coral tissue bleached; near-universal paling of the large Porites mounds; a stark-white Pocillopora verrucosa captioned 'bleached Pocillopora verrucosa'.
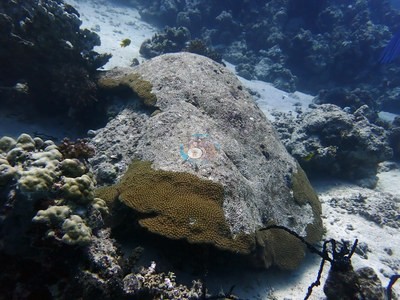
- Saudi Red Sea - Chicken Wreck (Jeddah): Disease and bleaching: a large encrusting/plating colony with an annular white-band lesion (captioned 'disease') and a Favites colony bleached and dying from the crown down (captioned 'dying Favites'); 20.3% to 28.3% of coral tissue bleached across three August 2024 visits.
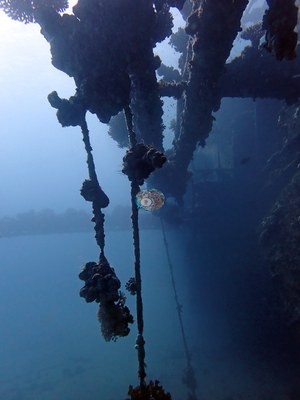
- Saudi Red Sea - Abu Ejeiah (Thuwal): Bleaching: 29.5% of coral tissue site-level, range 12.7% to 69.5% across four visits; a frame captioned 'paling poritids'; July 2024 frames show a near-bare rubble plain (old, algal-filmed framework).
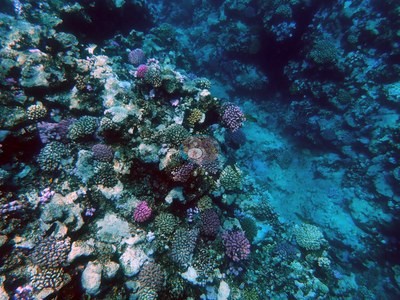
- Saudi Red Sea - Cave Reef (Thuwal): Bleaching and partial mortality: 26.8% of coral tissue bleached (9 Feb 2024) with no accumulated heat stress; faviids with white dead-skeleton patches; fresh parrotfish grazing scars captioned 'fish bites' (not disease).
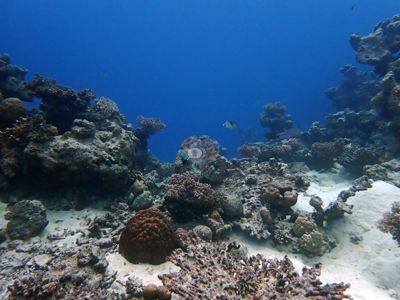
- Saudi Red Sea - Cement Wreck (Thuwal): Bleaching: 32.0% (Sep 2023), 26.1% (Apr 2024), and 18.7% (Jul 2024) of coral tissue bleached; a small faviid with a dark depressed lesion where tissue is missing; old partial mortality on a large Diploastrea heliopora.
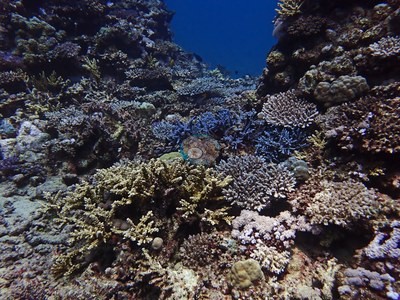
- Saudi Red Sea - Cement Reef (Thuwal): Bleaching: 19.9% of coral tissue (site-level manuscript summary); one large massive Porites uniformly stark white, and an Acropora captioned 'bleached acroporid'.
Coral cover over time (pooled)
Sites in this region (15)
- Saudi Red Sea - Abu Ejeiah (Thuwal) — 15% coral cover
- Saudi Red Sea - Anderson's Reef-I (Jeddah) — 23% coral cover
- Saudi Red Sea - Anderson's Reef-II (Jeddah) — 21% coral cover
- Saudi Red Sea - Bhadur Reef (Jeddah) — 21% coral cover
- Saudi Red Sea - Cave Reef (Thuwal) — 17% coral cover
- Saudi Red Sea - Cement Reef (Thuwal) — 22% coral cover
- Saudi Red Sea - Cement Wreck (Thuwal) — 13% coral cover
- Saudi Red Sea - Chicken Wreck (Jeddah) — 17% coral cover
- Saudi Red Sea - Coral Gardens (Jeddah) — 28% coral cover
- Saudi Red Sea - Drogon Corals (Jeddah) — 14% coral cover
- Saudi Red Sea - Long Reef (Thuwal) — 14% coral cover
- Saudi Red Sea - Middle Reef (Thuwal)
- Saudi Red Sea - north Rabigh (shore) (Rabigh) — 24% coral cover
- Saudi Red Sea - Rose Reef (Thuwal) — 15% coral cover
- Saudi Red Sea - Shark Reef (Thuwal) — 16% coral cover
% coral cover by method
Pooled across 4 published areas
| Method | Mean % coral cover | Std. dev. between published areas | n published areas | Note |
|---|---|---|---|---|
| Manual point count (author) | 20.4% | ±3.9 | 3 | frame-weighted 18.1% over 3,900 frames |
| Claude (Anthropic), blind point count | 27.2% | ±2.9 | 4 | frame-weighted 28.2% over 588 frames |
| In-house DINOv3 point classifier | 39.5% | ±10 | 4 | frame-weighted 39.4% over 211 frames |
The mean is an UNWEIGHTED mean of the published area values — each published area counts once, whatever its photo count — which is the convention of the published tables and of every other figure on this page. The frame-weighted alternative is given per method in the Note column; where the two differ, the difference is a photo-count imbalance, not a coral-cover finding.
Closest to the reference
Over the published areas where an independent reference exists, Claude (Anthropic), blind point count sits closest to it — a mean absolute deviation of 6.5 pp across 2 published areas, then In-house DINOv3 point classifier 18.9 pp (n=2). A mean absolute deviation is not an accuracy score: a model with a consistent offset is correctable, while one with the same deviation scattered in both directions is not.
By published area
| Published area | Manual point count | Claude | DINOv3 |
|---|---|---|---|
| Thuwal | 16.1% n=2,567 | 23.9% n=6 | 47.5% n=4 |
| Jeddah | 21.6% n=1,160 | 27.3% n=274 | 34.9% n=93 |
| Rabigh | 23.6% n=173 | 31.0% n=173 | 48.1% n=84 |
| unassigned region | — | 26.6% n=135 | 27.7% n=30 |
n under each value is the number of photographs that method scored at that published area. ⚠ marks a cell that is not an independent check.
Reference: point-count on the photographs (a human scoring the same pixels the models see). Denominator: coral points / (30 − WATER − FISH); `Unk` is IN the denominator (Mayfield 2025 convention); divers (`DVR`) are excluded as well, per the Red Sea paper. Source: published verbatim (Mayfield 2025, Environments 12:248, Table 4) ⚠ These rows are REGIONS, not dive sites. The published paper reports cover by region only — no individual dive-site name appears in it — so no CRD dive site has its own manual value here. ⚠ The manual column and the computer vision (CV) columns are on DIFFERENT FRAME SETS. The published cover spans the region's full photo set (173–2,567 frames, most of them CoralNet robot-labeled); the CV arms ran only on the hand-scored reference subset, which is 6 frames at Thuwal, 274 at Jeddah and 173 at Rabigh. Read Thuwal's model columns as indicative only. CoralNet is n/a by design: the reference set IS the hand-scored set, so those frames carry no independent robot label to compare against. DINOv3 is restricted to frames it never saw, and reads roughly double the published cover at every Red Sea region. ⚠ 'unassigned region' is not a place: 135 frames carry no region label in the CoralNet metadata and map to no published row. It has no manual value and is excluded from the pooled reference.
Nearby external survey stations
11 independent survey records within 5 km of a site in this region (deduplicated across sites).
- Aeby et al. (2021) — Qita al Kirsh (2015): 60% hard coral cover, 0.36 km from Saudi Red Sea - Shark Reef (Thuwal)
- Aeby et al. (2021) — Shi'b Nazar (2015): 39% hard coral cover, 1.31 km from Saudi Red Sea - Long Reef (Thuwal)
- Coral Vita — Coral Vita 1 (2025): 23% hard coral cover, 3.21 km from Saudi Red Sea - Coral Gardens (Jeddah)
- Furby et al. (2013) — Midshelf reef 2 (2010): 23% hard coral cover, 0.36 km from Saudi Red Sea - Shark Reef (Thuwal)
- Furby et al. (2013) — Offshore reef 1 (2010): 31% hard coral cover, 1.07 km from Saudi Red Sea - Cave Reef (Thuwal)
- Khalil et al. (2017) — — (2013): 26% hard coral cover, 1.05 km from Saudi Red Sea - Abu Ejeiah (Thuwal)
- Khalil et al. (2017) — — (2013): 31% hard coral cover, 3.81 km from Saudi Red Sea - Anderson's Reef-II (Jeddah)
- Monroe et al. (2018) — Midshelf reef 2 (2015): 37% hard coral cover, 0.36 km from Saudi Red Sea - Shark Reef (Thuwal)
- Monroe et al. (2018) — Offshore reef 1 (2015): 28% hard coral cover, 1.31 km from Saudi Red Sea - Long Reef (Thuwal)
- Reef Check — Sheraton, KSA (2024): 12% hard coral cover, 3.16 km from Saudi Red Sea - Bhadur Reef (Jeddah)
- Reef Check — Sheraton, KSA (2025): 11% hard coral cover, 3.16 km from Saudi Red Sea - Bhadur Reef (Jeddah)
All images from Coral Reef Diagnostics. Data are from Coral Reef Diagnostics and Reef Check Foundation.
 © Coral Reef Diagnostics.
References
- Souter D, et al. (eds) (2021) Status of Coral Reefs of the World: 2020. International Coral Reef Initiative / Global Coral Reef Monitoring Network. [PDF]
- Spalding MD, et al. (2001) World Atlas of Coral Reefs. University of California Press, Berkeley. [PDF]
- Wilkinson C (2006) Status of coral reefs of the world: summary of threats and remedial action. In: Côté IM, Reynolds JD (eds) Coral Reef Conservation. Cambridge University Press, Cambridge. [PDF]
- Mayfield AB (2025). Using Tourist Diver Photos to Assess the Effects of Marine Heatwaves on Central Red Sea Coral Reefs. Environments 12:248. PDF
- Aeby GS, Shore A, Jensen T, Ziegler M, Work T, Voolstra CR (2021). A comparative baseline of coral disease in three regions along the Saudi Arabian coast of the central Red Sea. PLOS ONE 16:e0246854. PDF
- Furby KA, Bouwmeester J, Berumen ML (2013). Susceptibility of central Red Sea corals during a major bleaching event. Coral Reefs 32:505-513. DOI
- Khalil MT, Bouwmeester J, Berumen ML (2017). Spatial variation in coral reef fish and benthic communities in the central Saudi Arabian Red Sea. PeerJ 5:e3410. DOI
- Monroe AA, Ziegler M, Roik A, Röthig T, Hardenstine RS, Emms MA, et al. (2018). In situ observations of coral bleaching in the central Saudi Arabian Red Sea during the 2015/2016 global coral bleaching event. PLOS ONE 13:e0195814. PDF