
Saudi Red Sea - Bhadur Reef (Jeddah)

Part of the regional summaries: Saudi Arabia - Jeddah / KAUST (Thuwal) / Rabigh, Saudi Arabia, and Red Sea
More info
Makkah-Madine Saudi Arabia (NOAA CRW virtual station) · Northern and Central Red Sea ecoregion mean=12.2°C-heating weeksBhadur Reef sits directly off the Jeddah waterfront - Anderson captioned one frame 'diving downtown Jeddah' - and was surveyed at the highest accumulated heat stress of any site in this set (22.3 DHW). The bleaching here hit the whole community at once, not just hard corals: massive Porites, soft corals, and anemones were all found bleached together, with roughly six in ten corals affected (61.8% of tissue), even as the reef kept functioning as habitat for nudibranchs, a blue-spotted ray, and anemonefish.
تقع شعبة بحدر مباشرة قبالة واجهة جدة البحرية — وقد علّق أندرسون على إحدى الصور بعبارة "الغوص في وسط جدة" — وقد مُسحت عند أعلى إجهاد حراري متراكم بين مواقع هذه المجموعة (22.3 DHW).
ترجمة هذا الملخص بالذكاء الاصطناعي؛ النص الإنجليزي هو المعتمد. Translated from the site’s shorter map summary.
One independent survey station shown with the program’s logo — click one to see how far it is from this site.
Site description
General benthic features
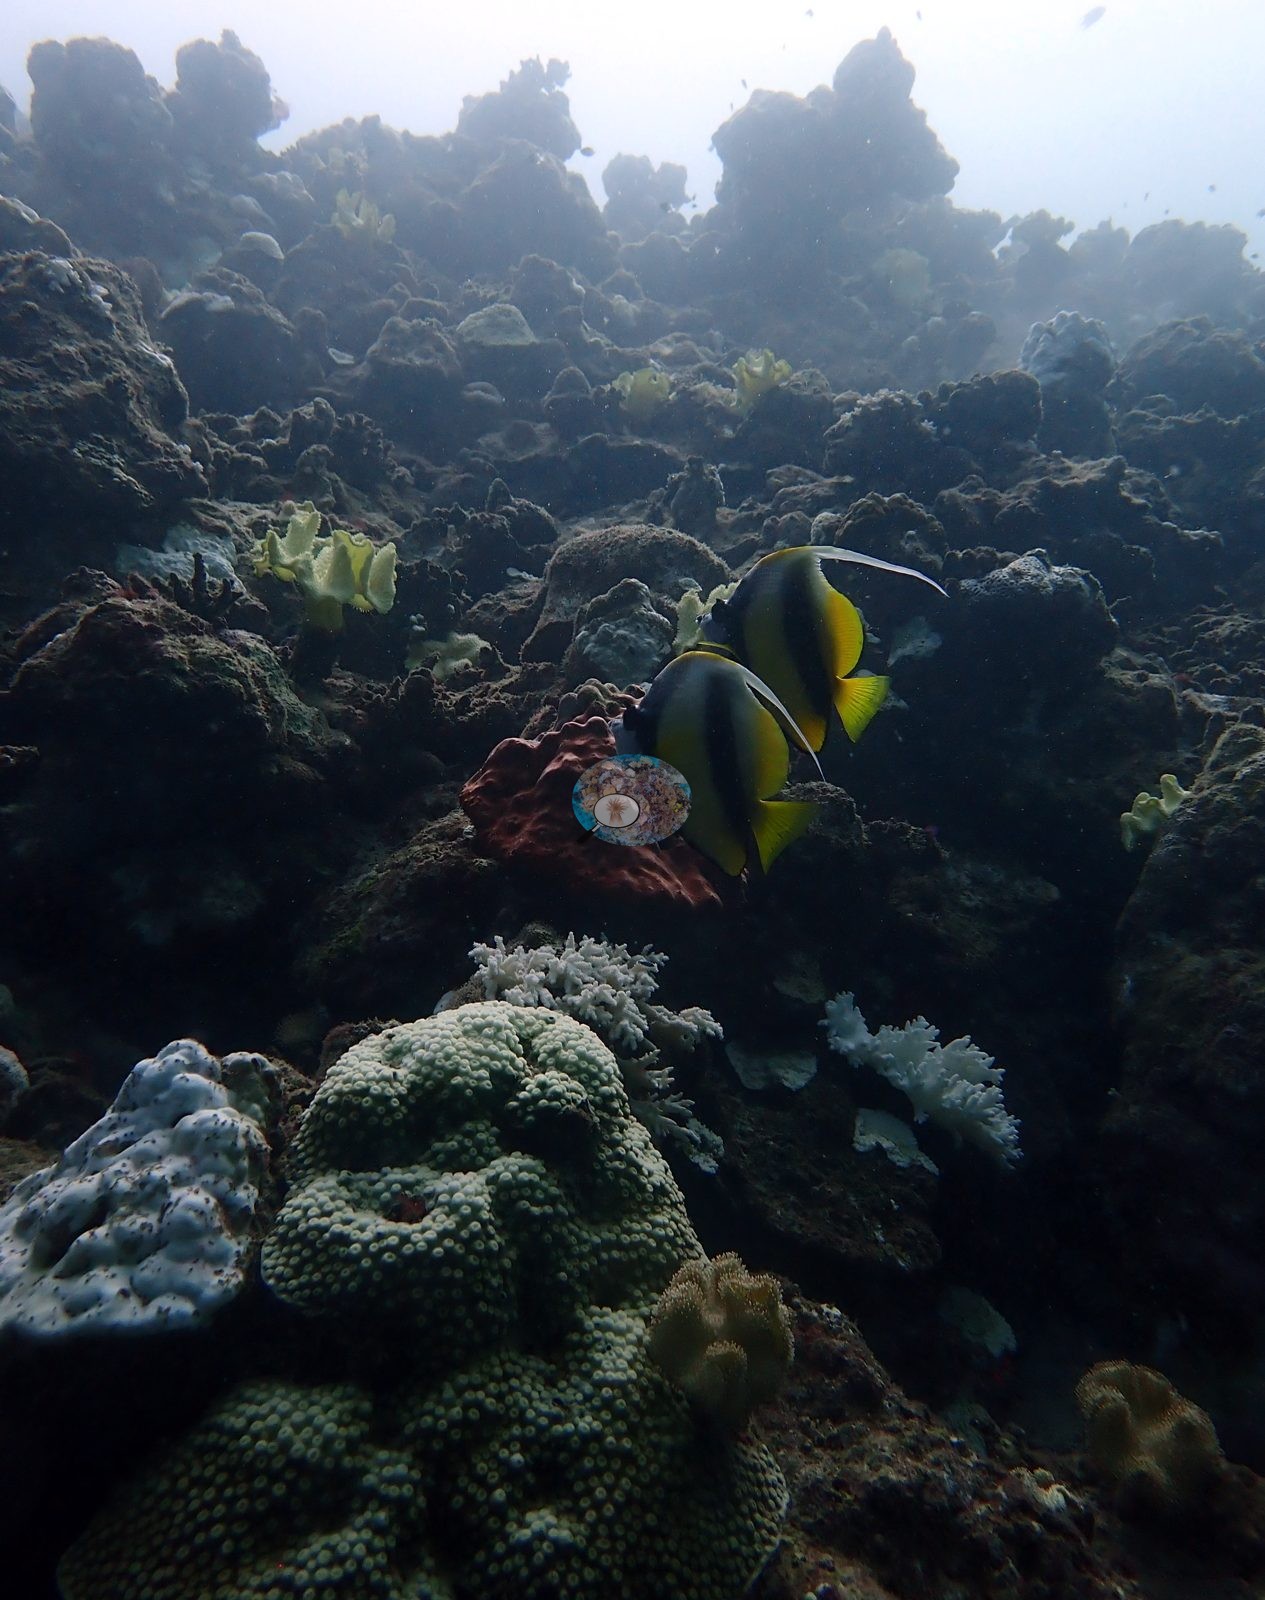
Structurally the reef is a moderate-relief slope of large massive Porites bommies over rubble and coralline pavement, with pocilloporids, corymbose, and staghorn Acropora, faviids, soft corals, and free-living fungiids scattered across it, dropping into hazy inshore blue (e.g., Image 2).
Coral cover
Coral cover is 21.3% ± 17.0 across 222 photographs, quoted verbatim from Mayfield, A.B. (2025) Environments 12:248 — Red Sea 2023-24 bleaching; CoralNet point annotation, Appendix A — a manual, diver-annotated CoralNet point count from Anderson's own published work, not a computer vision output and not recomputed here. The site record's prose gives the visit as 21% cover with 61.8% of coral tissue bleached at about 22.3°C-weeks DHW — the highest accumulated heat stress recorded at any site in this Red Sea set.
Stressors
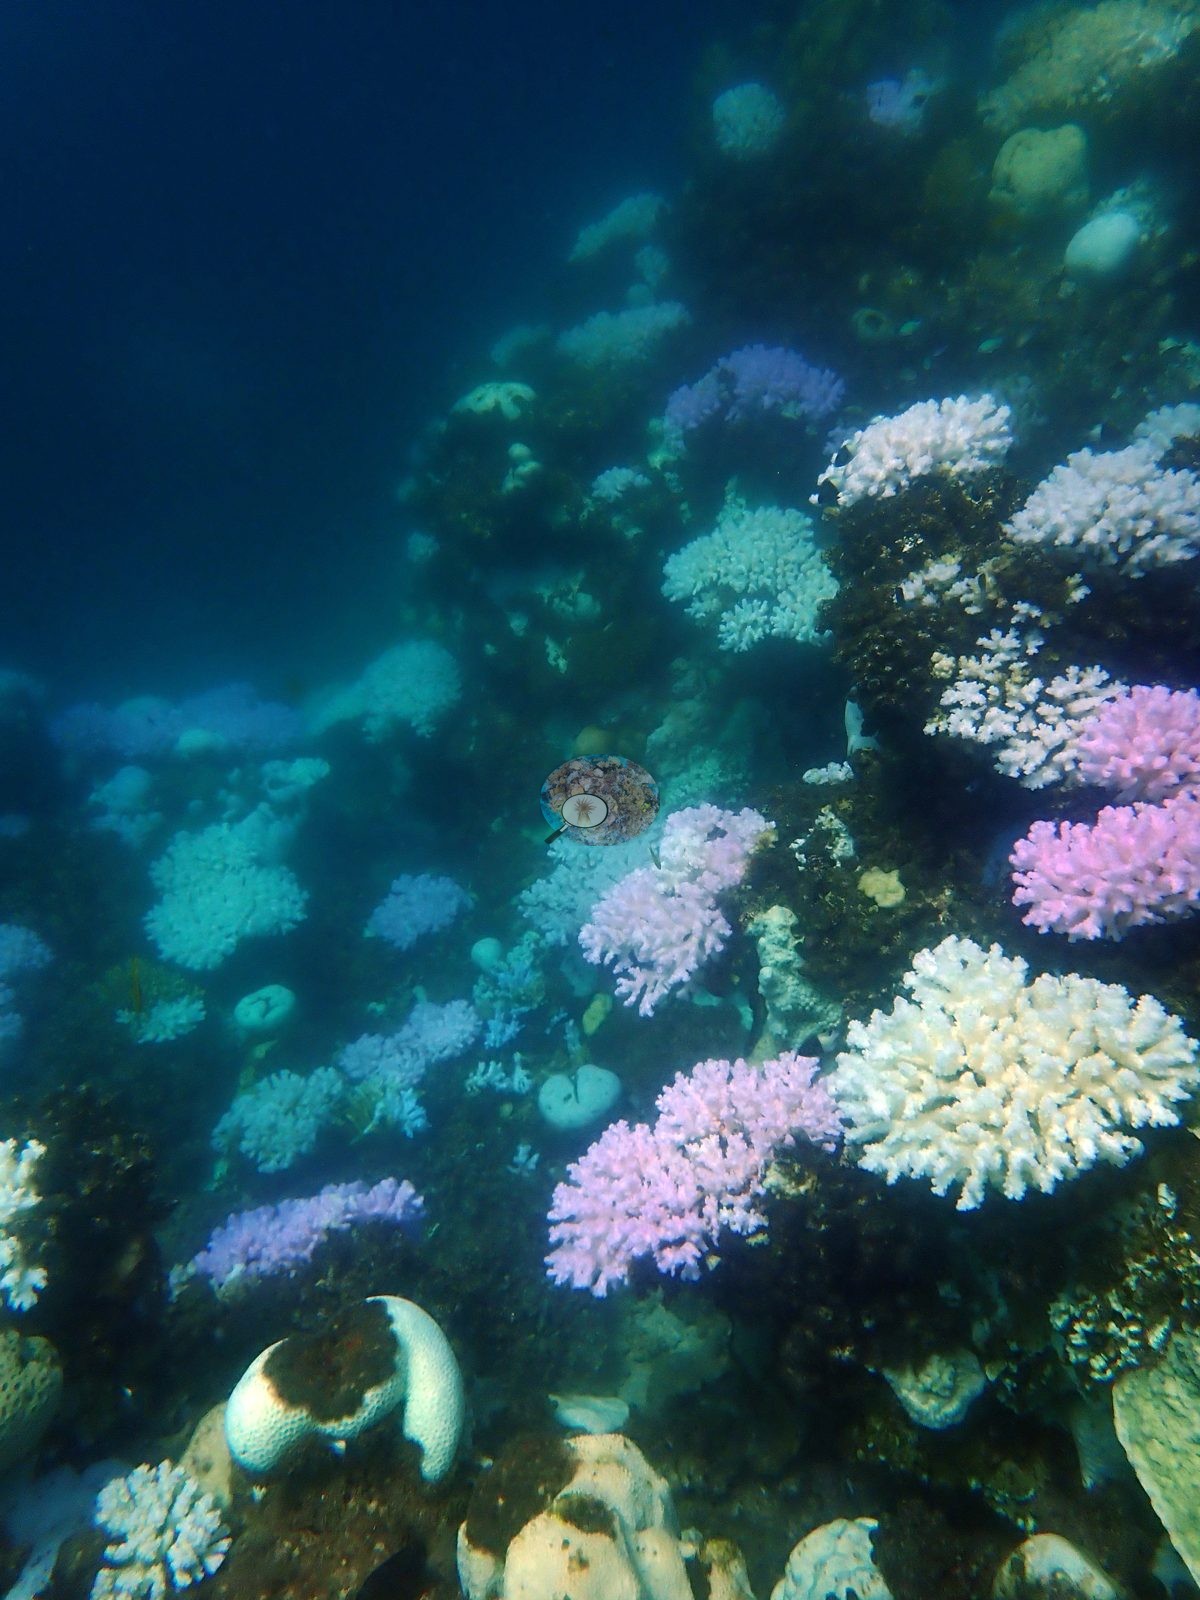
The photographs are among the most severe in the entire Saudi archive, and Anderson's own captions read like an inventory of the damage: "100% bleaching", "devastating Red Sea bleaching", "fully bleached Porites", "blinding white pocilloporid", "bleaching fungids", "dead acroporid", "dead acroporids", "dead pocilloporid", "dying pocilloporid", "dead aquarium", "dead" (e.g., Image 3, Image 4).
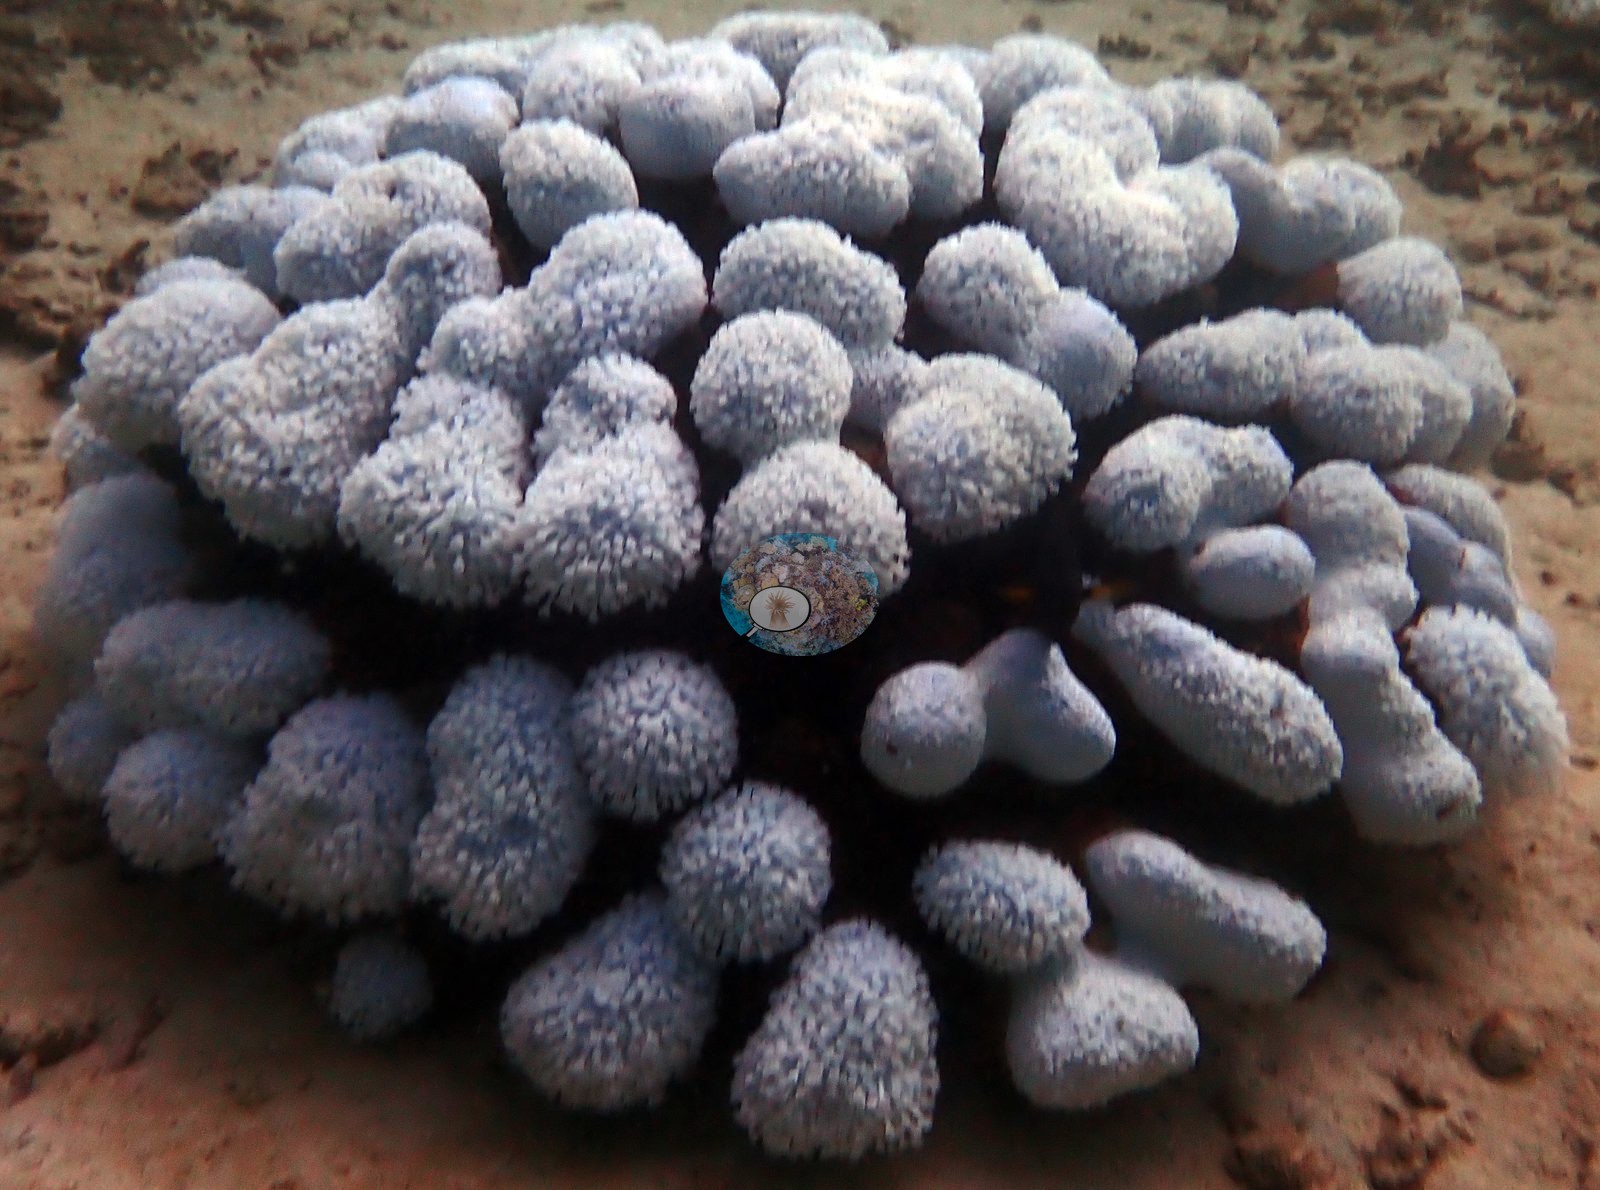
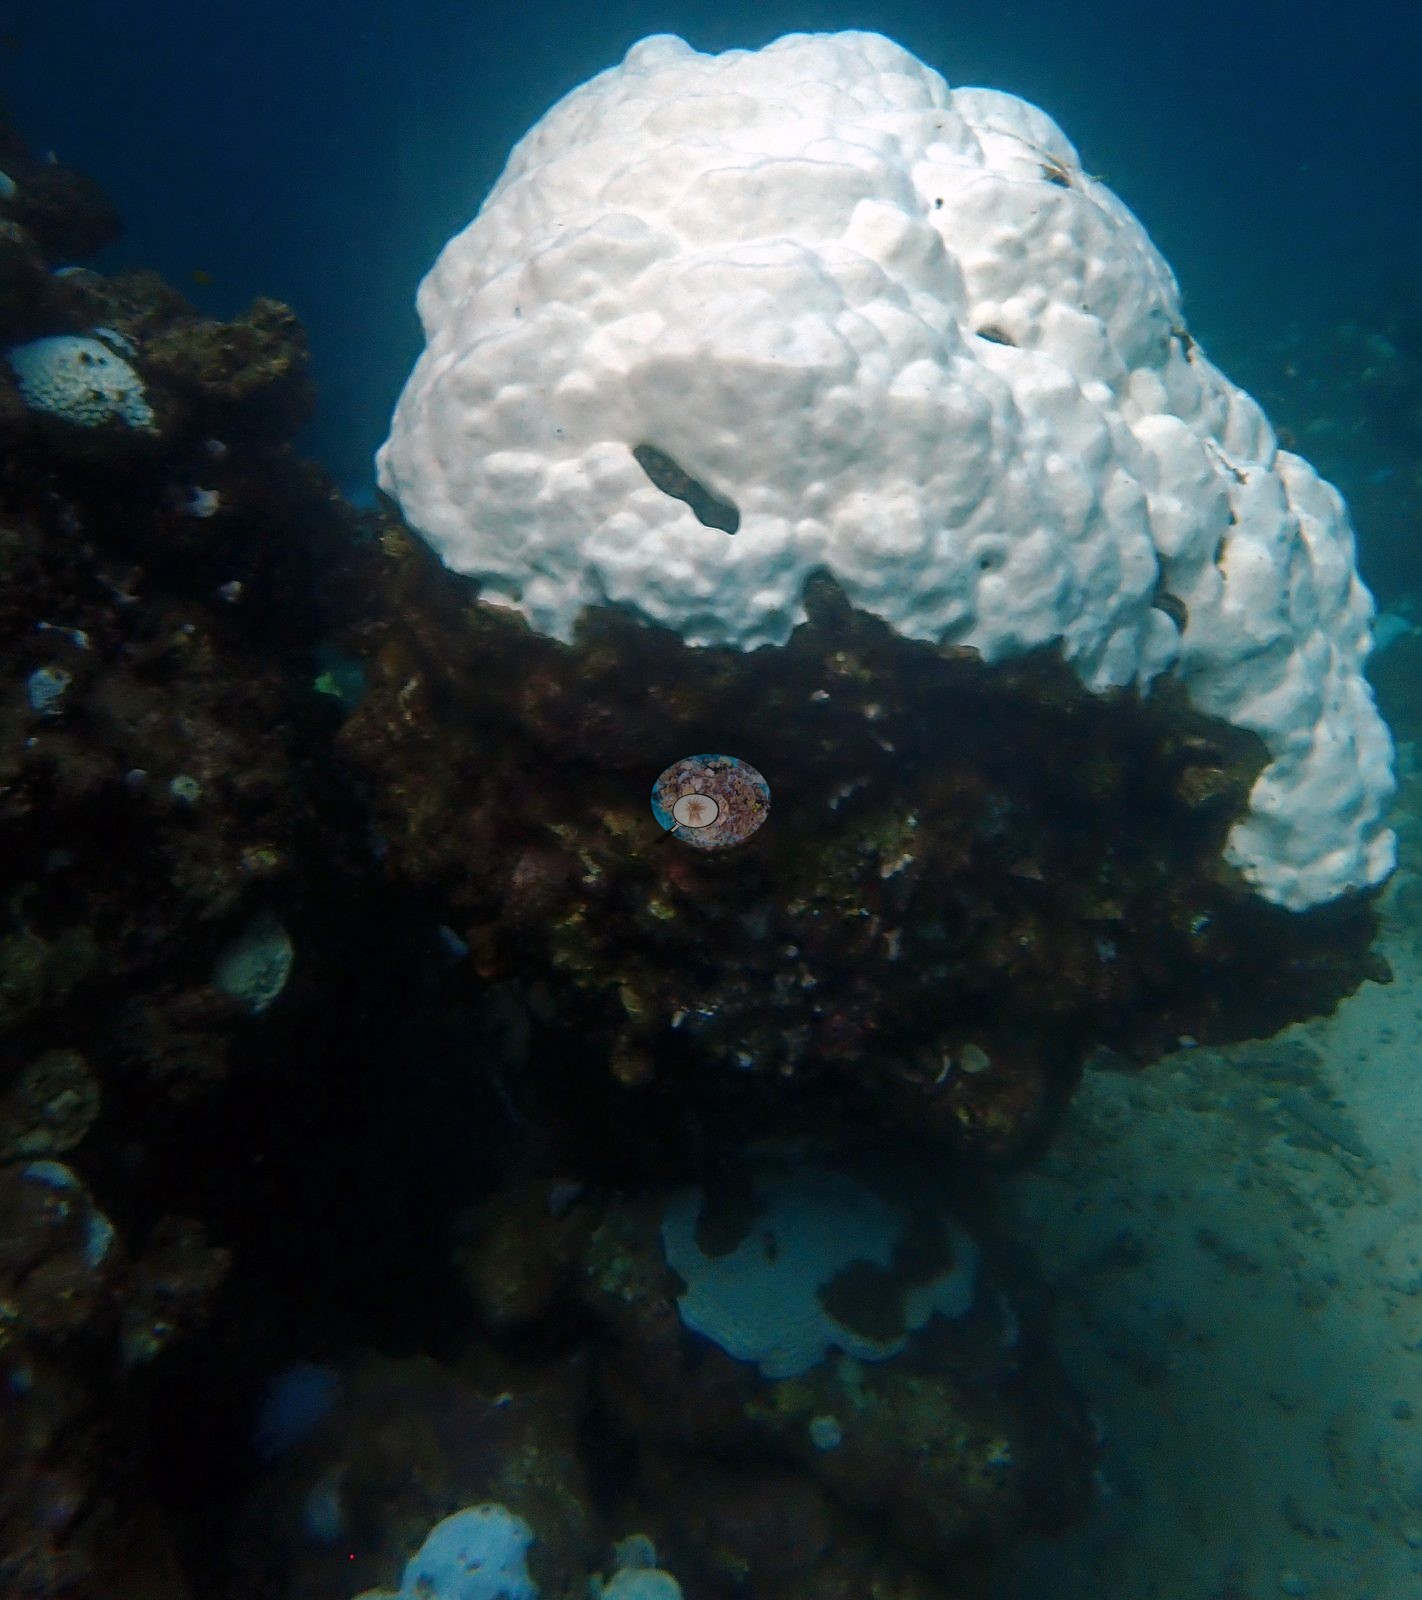
What the frames record is a whole community bleaching at once, hard corals and soft corals and anemones together (e.g., Image 1).
Fish and other fauna
Two beautifully pigmented Chromodoris quadricolor nudibranchs and a blue-spotted ray were photographed on the same dives — the reef was still functioning as habitat while its corals were white.
Comparisons with other data
No independent survey was made at this exact site; the nearest ones are listed in the table below.
Dive record
Two dives on 7 September 2024 with Saudia SCUBA on a reef in front of the Jeddah waterfront — Anderson captioned one frame "diving downtown Jeddah" — at the peak of the 2024 Red Sea bleaching event.
Other notes
See flags.
CV model comparison
More info
The reference row is this dive site's own published value (Mayfield 2025, Appendix A, 222 photos); the other rows are AREA-level (Jeddah) comparisons, not run on this site's frames. ⚠ The comparison rows are REGIONS, not dive sites: the paper's main tables report cover by region, and this site's own value comes from its Appendix A. ⚠ The manual column and the CV columns are on DIFFERENT FRAME SETS. The published cover spans the region's full photo set (173–2,567 frames, most of them CoralNet robot-labeled); the CV arms ran only on the hand-scored reference subset, which is 6 frames at Thuwal, 274 at Jeddah and 173 at Rabigh. Read Thuwal's model columns as indicative only. CoralNet is n/a by design: the reference set IS the hand-scored set, so those frames carry no independent robot label to compare against. DINOv3 is restricted to frames it never saw, and reads roughly double the published cover at every Red Sea region. ⚠ 'unassigned region' is not a place: 135 frames carry no region label in the CoralNet metadata and map to no published row. It has no manual value and is excluded from the pooled reference. CoralNet automated point classifier: n/a — the reference set IS the hand-scored set; these frames carry no independent CoralNet robot label to compare against CoralSCOP (SAM-based mask-sum), unedited photos: pending — CoralSCOP run: 370/747 images scored at build time CoralSCOP (SAM-based mask-sum), edited photos: pending — CoralSCOP run: 370/747 images scored at build time| Method | Hard-coral cover (%) |
|---|---|
| Manual (published) | 21.3 |
| In-house DINOv3 | 34.9 |
| Claude | 27.3 |
Independent surveys nearby
Within 5 km, 1 independent survey station recorded hard coral cover in 4 surveys between 2024 and 2025. Of the 1 station surveyed in more than one year, 1 changed by less than 5 percentage points between their first and latest surveys. The longest record, Sheraton, KSA (Reef Check, 3.16 km away), went from 12% in 2024 to 11% in 2025. Surveys since 2021 average 12% (range 11–12%, n=2). This site's own estimate (21%) sits 9.4 points above the recent range (11–12%); the methods differ, so the comparison is context, not a like-for-like test.
Collected by other programs using different methods (Reef Check uses point-intercept transects), so these are context for the figures above, not a like-for-like comparison. Where a station was surveyed more than once the range is shown. Station names are not dive-site names.
| Agency | Site / location | Date | Hard coral cover (%) | Distance | Link |
|---|---|---|---|---|---|
| Reef Check | Sheraton, KSA | 2024–2025 | 11–12% (4 surveys) | 3.16 km | — |
Data & links
All images from Coral Reef Diagnostics. Data are from Coral Reef Diagnostics and the organizations named in the data-sources table above.
© Coral Reef Diagnostics.