
Saudi Red Sea - Shark Reef (Thuwal)
Part of the regional summaries: Saudi Arabia - Jeddah / KAUST (Thuwal) / Rabigh, Saudi Arabia, and Red Sea
2024-09-14
More info
Makkah-Madine Saudi Arabia (NOAA CRW virtual station) · Northern and Central Red Sea ecoregion mean=12.2°C-heating weeksShark Reef is the worst-hit site in this entire Red Sea set: two visits at the peak of the 2024 bleaching event found roughly seven in ten corals bleached (72.7% and 70.9% of tissue), with whole slope faces of massive Porites, faviids, and Acropora glowing uniform white in frame after frame, plus two crown-of-thorns starfish photographed amid the dying reef. Anderson's own captions from the dives - 'severe bleaching,' 'dead corals,' 'dying reef' - match what the images show; cover itself held around 16%, since bleached-but-alive coral still counts as cover.
شعبة القرش هي الأشد تضرراً في مجموعة البحر الأحمر بأكملها: وجدت زيارتان في ذروة حدث الابيضاض لعام 2024 أن نحو سبعة من كل عشرة مرجانيات مُبيَّضة (72.7% و70.9% من الأنسجة)، مع واجهات منحدر كاملة من Porites الكتلي ومرجانيات فصيلة Faviidae وAcropora تتوهج ببياض موحد في صورة تلو الأخرى، إضافة إلى تصوير نجمَي بحر من نوع تاج الشوك وسط الشعبة المحتضرة.
ترجمة هذا الملخص بالذكاء الاصطناعي؛ النص الإنجليزي هو المعتمد. Translated from the site’s shorter map summary.
Three independent survey stations shown with the program’s logo — click one to see how far it is from this site.
6 of these 9 photographs are shown beside the text that discusses them under "Site description" below.
Site description
General benthic features
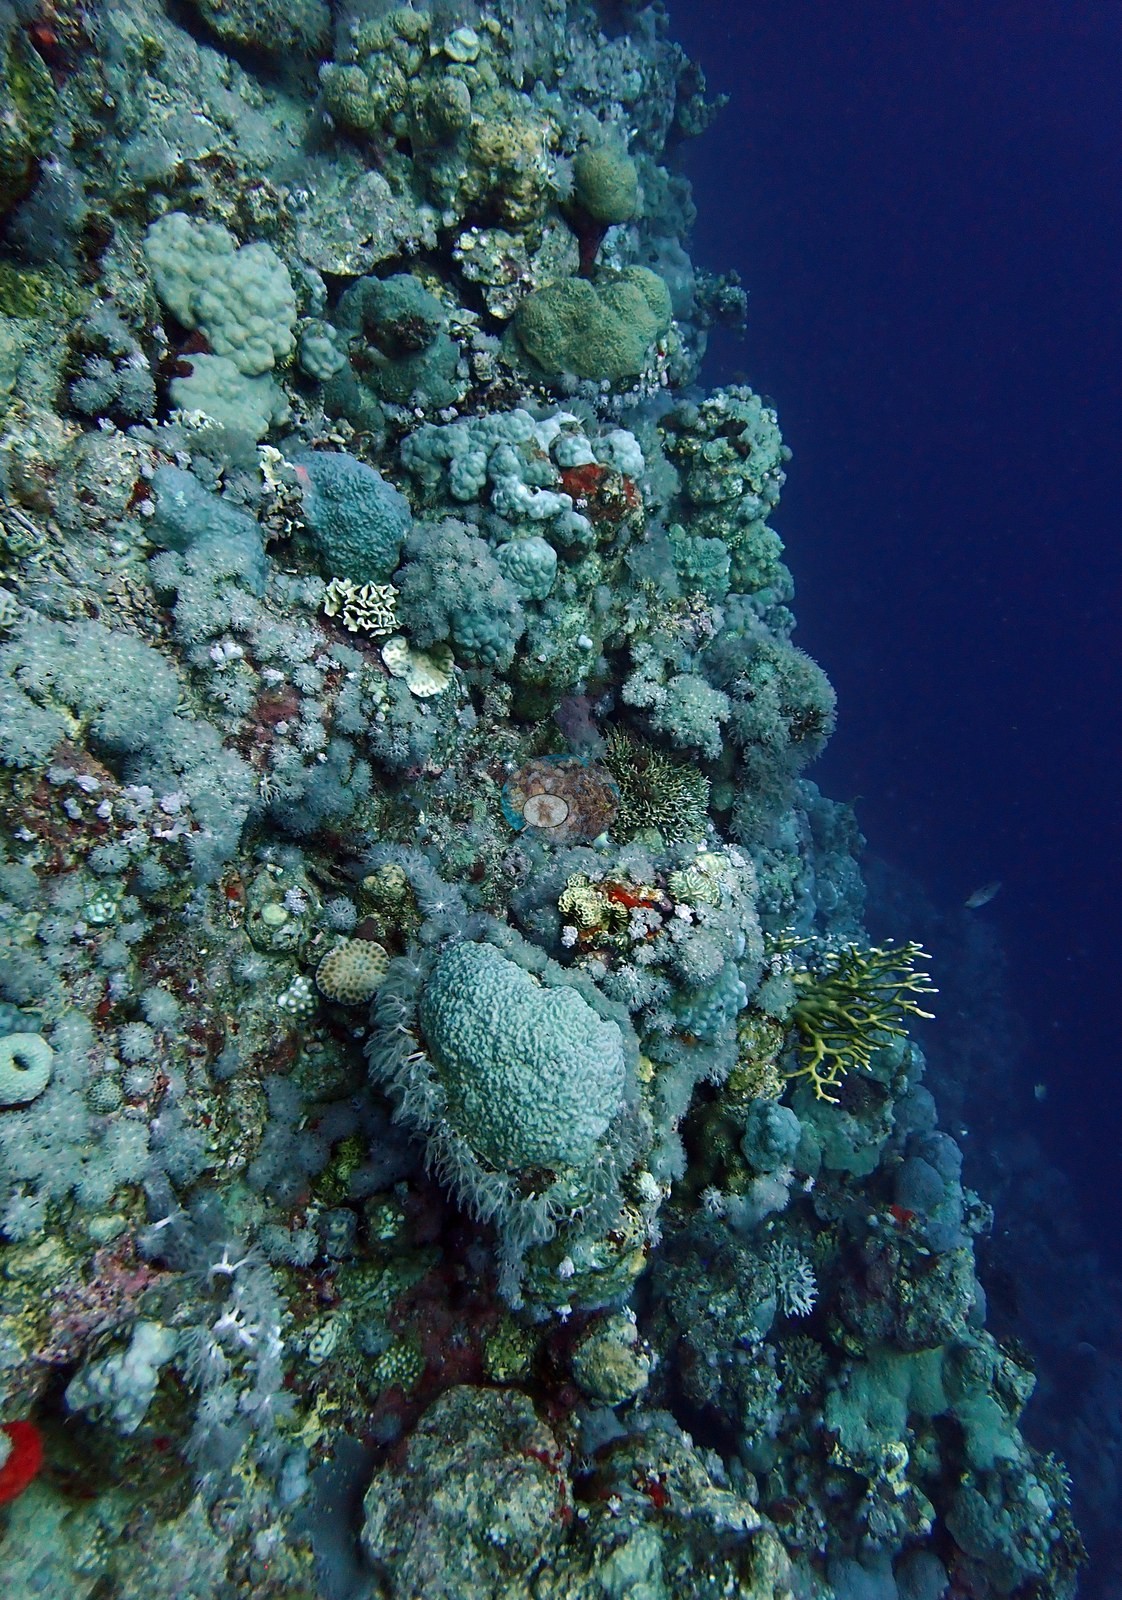
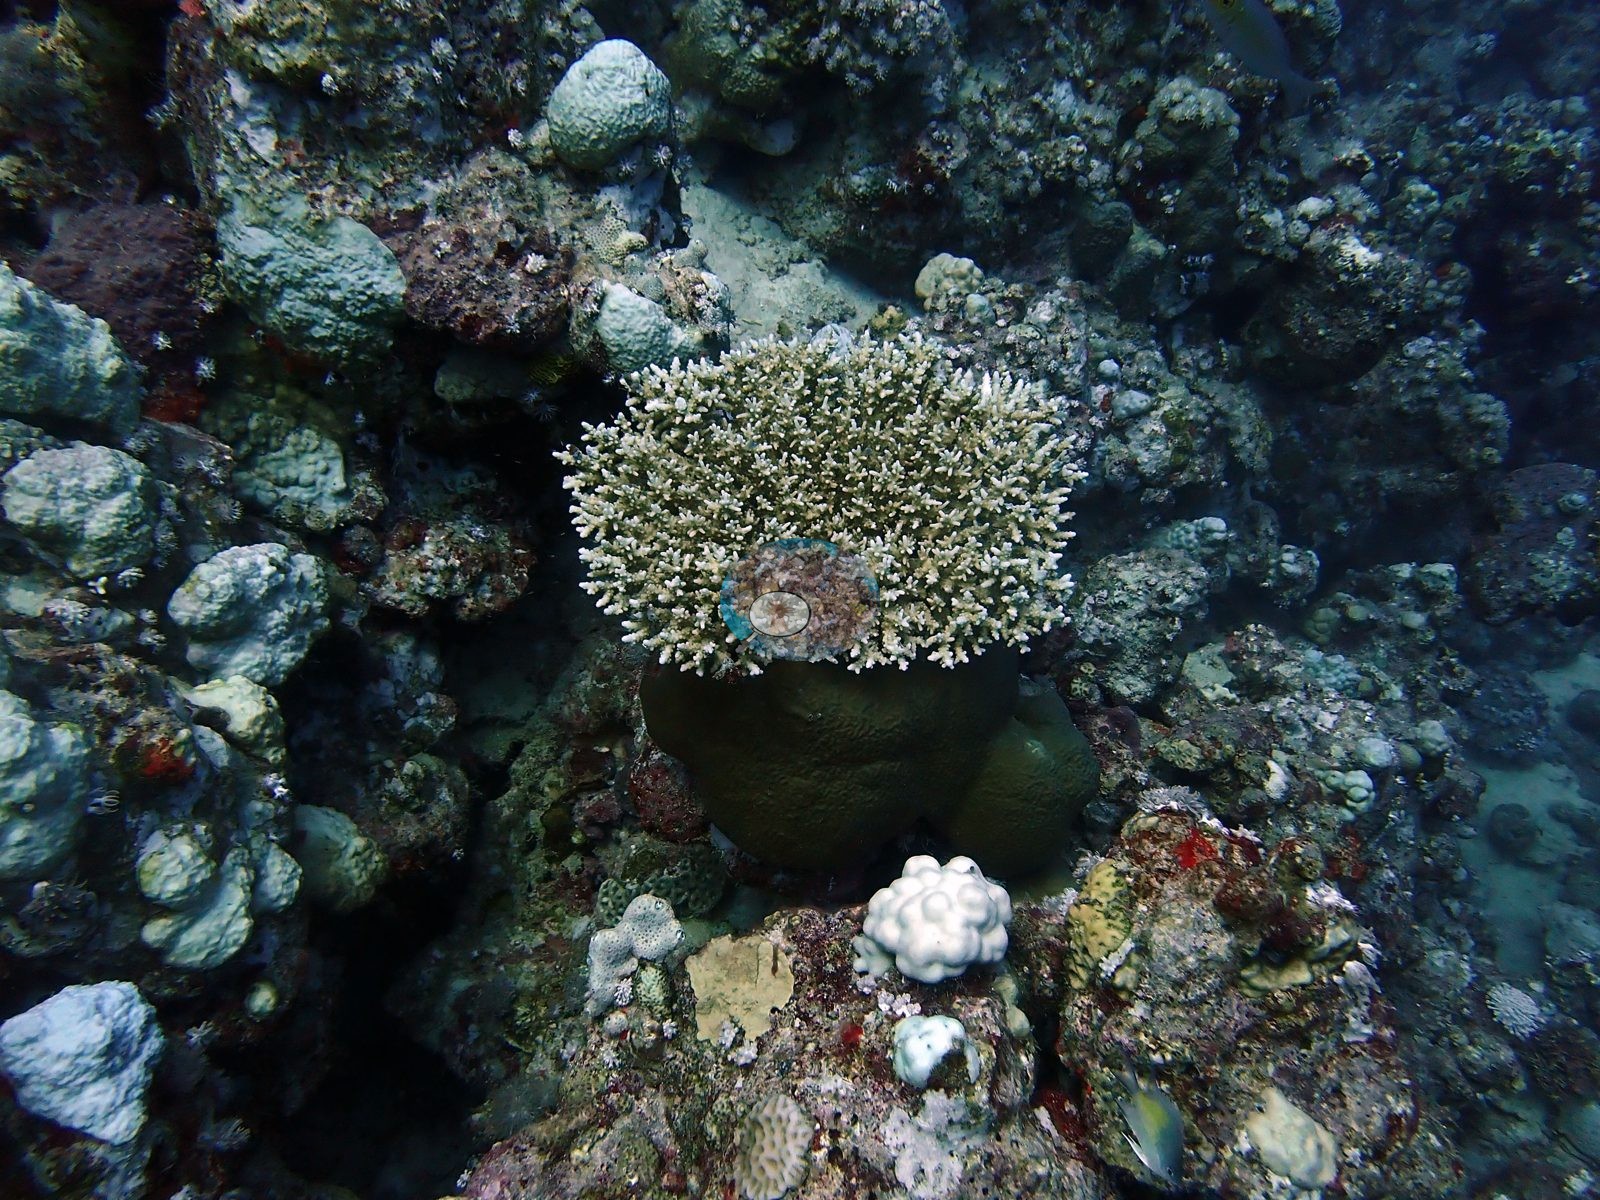
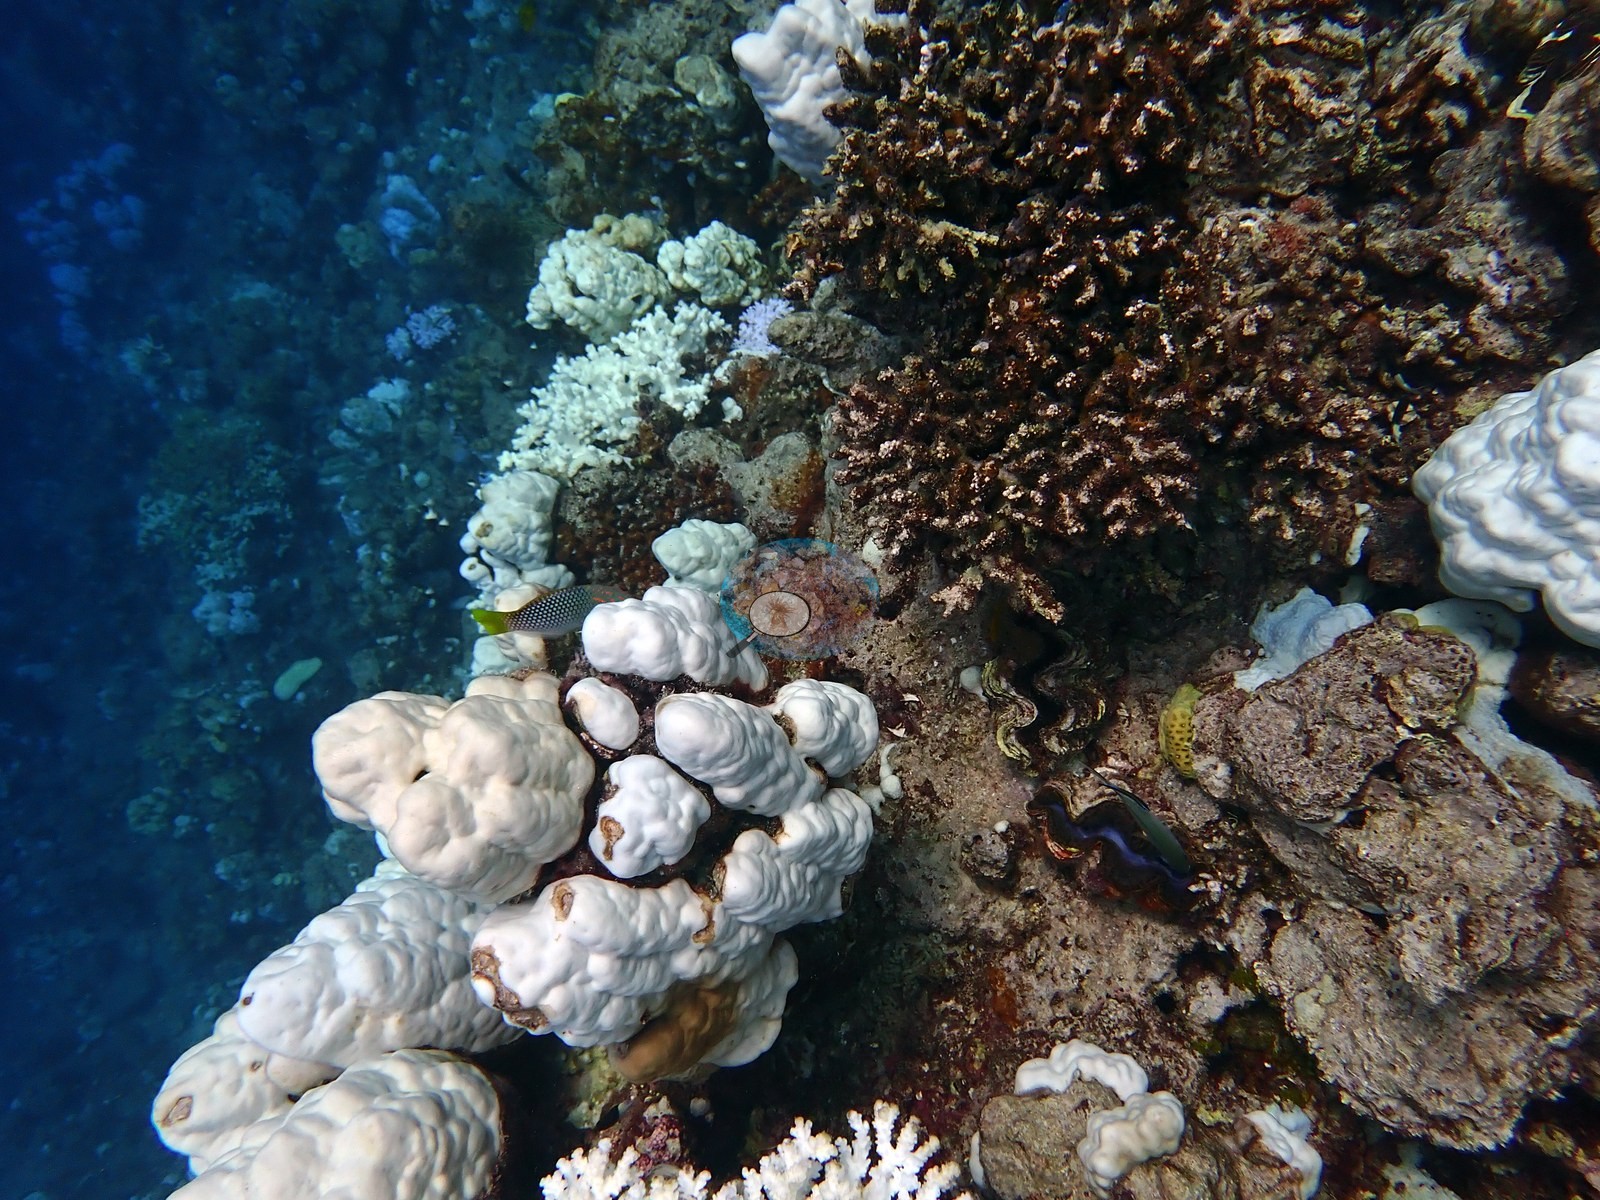
The reef is a steep buttressed slope of large massive corals — knobby and columnar Porites, faviids, Astreopora — over consolidated pavement, with pocilloporids and branching Acropora in the shallows and undercuts holding bluestripe snapper and moray eels (e.g., Image 2, Image 5).
Coral cover
Coral cover is 15.9% ± 15.6 across 421 photographs, quoted verbatim from Mayfield, A.B. (2025) Environments 12:248 — Red Sea 2023-24 bleaching; CoralNet point annotation, Appendix A — a manual, diver-annotated CoralNet point count from Anderson's own published work, not a computer vision output and not recomputed here. The site record carries the two visits separately: 16% cover with 72.7% of coral tissue bleached on 31 August 2024 at 20.6°C-weeks DHW and 33°C, and 16% cover with 70.9% bleached on 14 September 2024 at 21.8°C-weeks and 31°C. Cover barely moved between visits; the tissue underneath it was in crisis on both.
Stressors
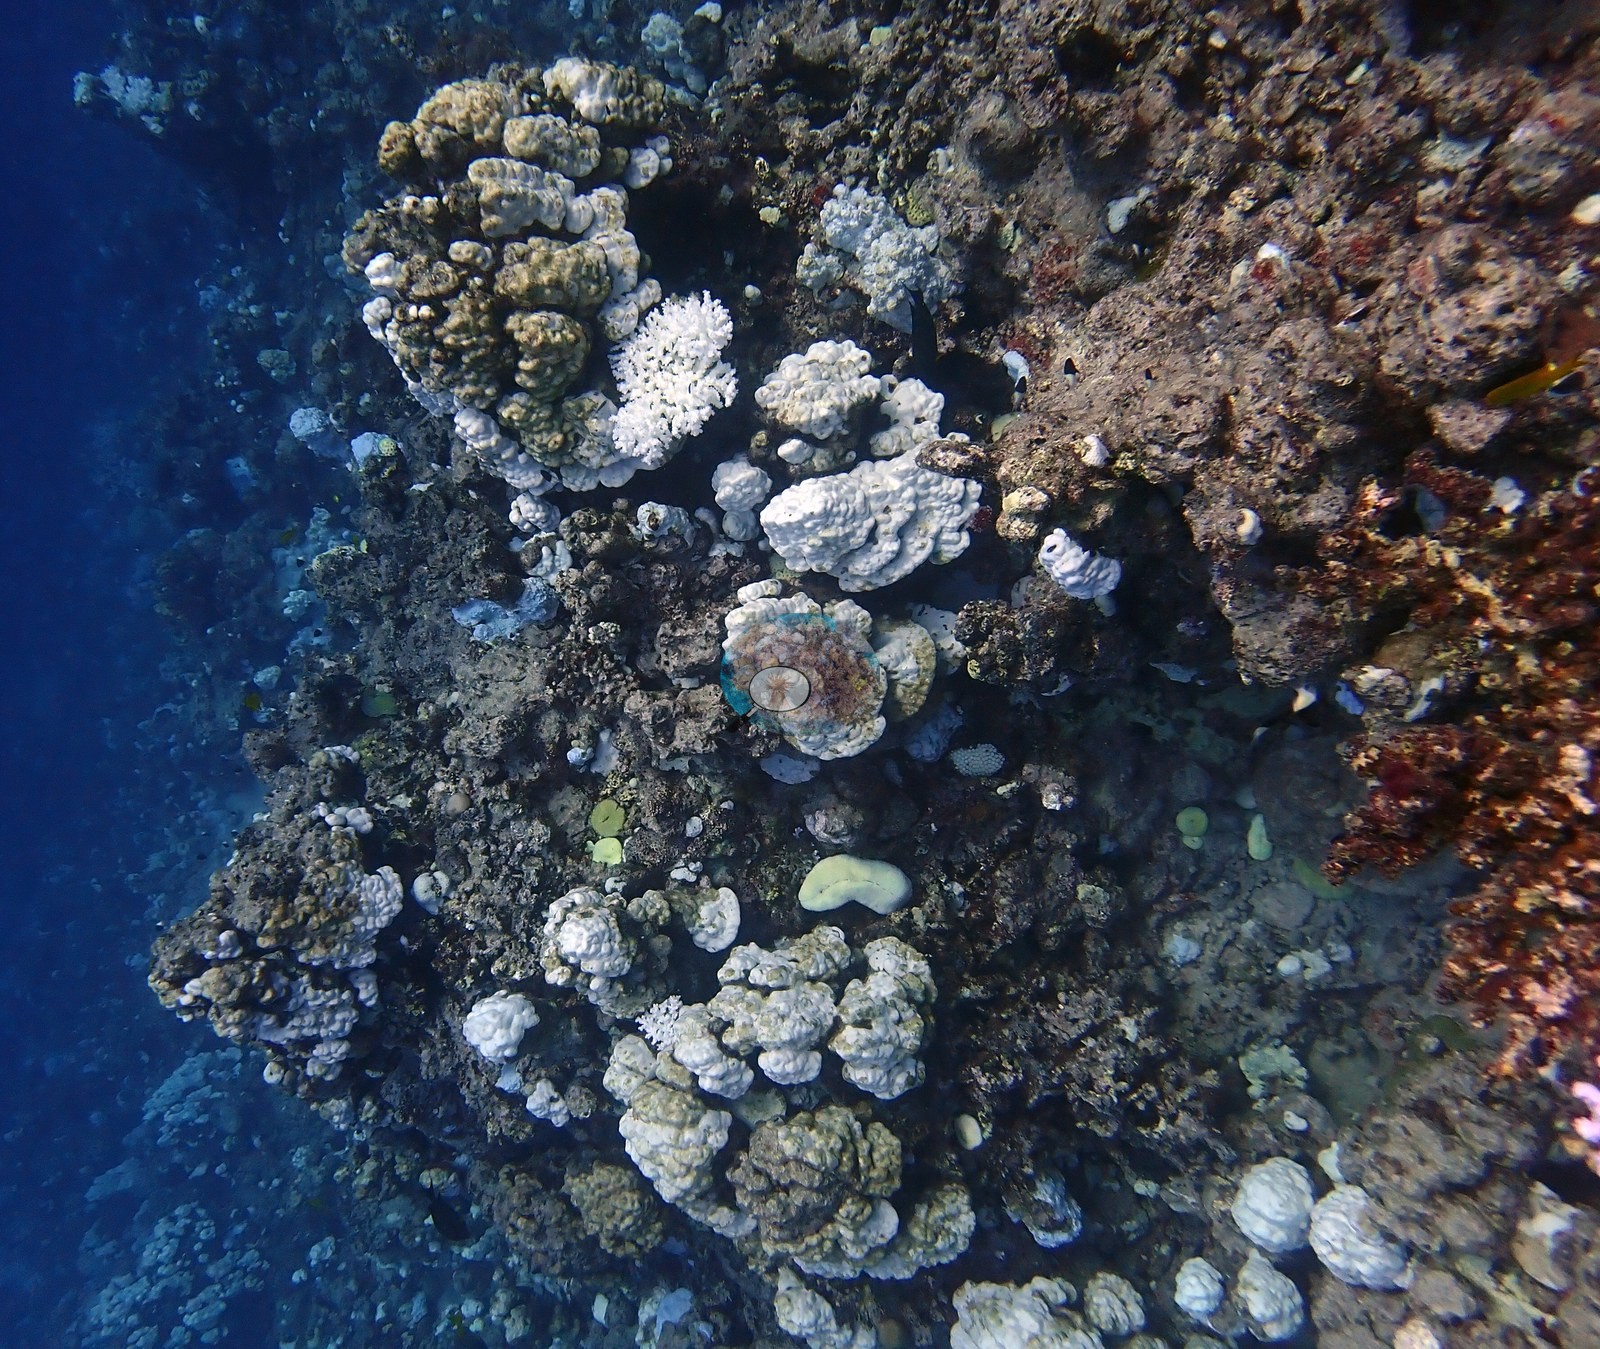
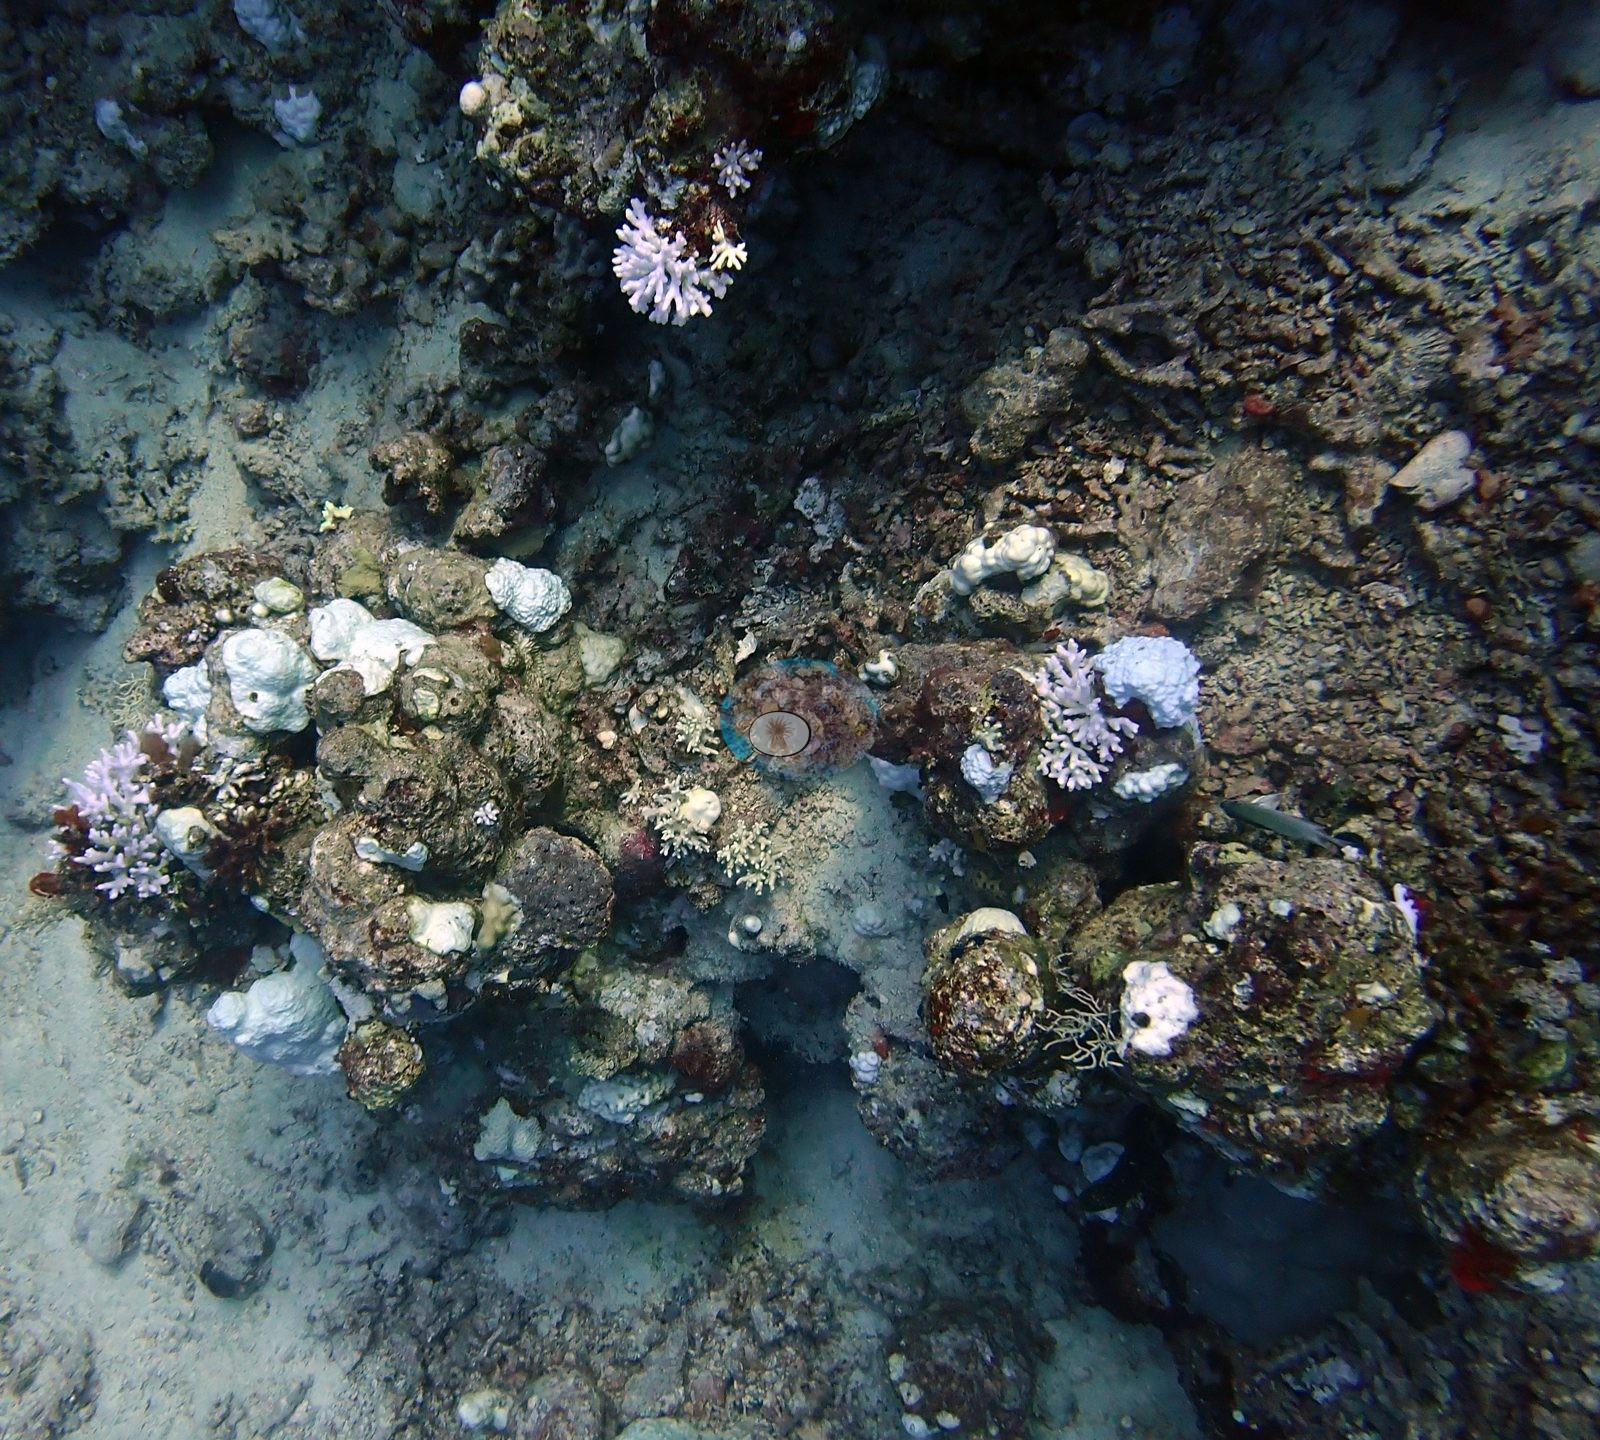
The worst-hit site in this Red Sea set, and the photographs leave no room for interpretation. But in wide-angle frame after wide-angle frame the dominant color is white: whole slopes where the majority of visible colonies are stark, uniform, glowing white from top to bottom, running out of the frame in both directions (e.g., Image 3, Image 8, Image 9).
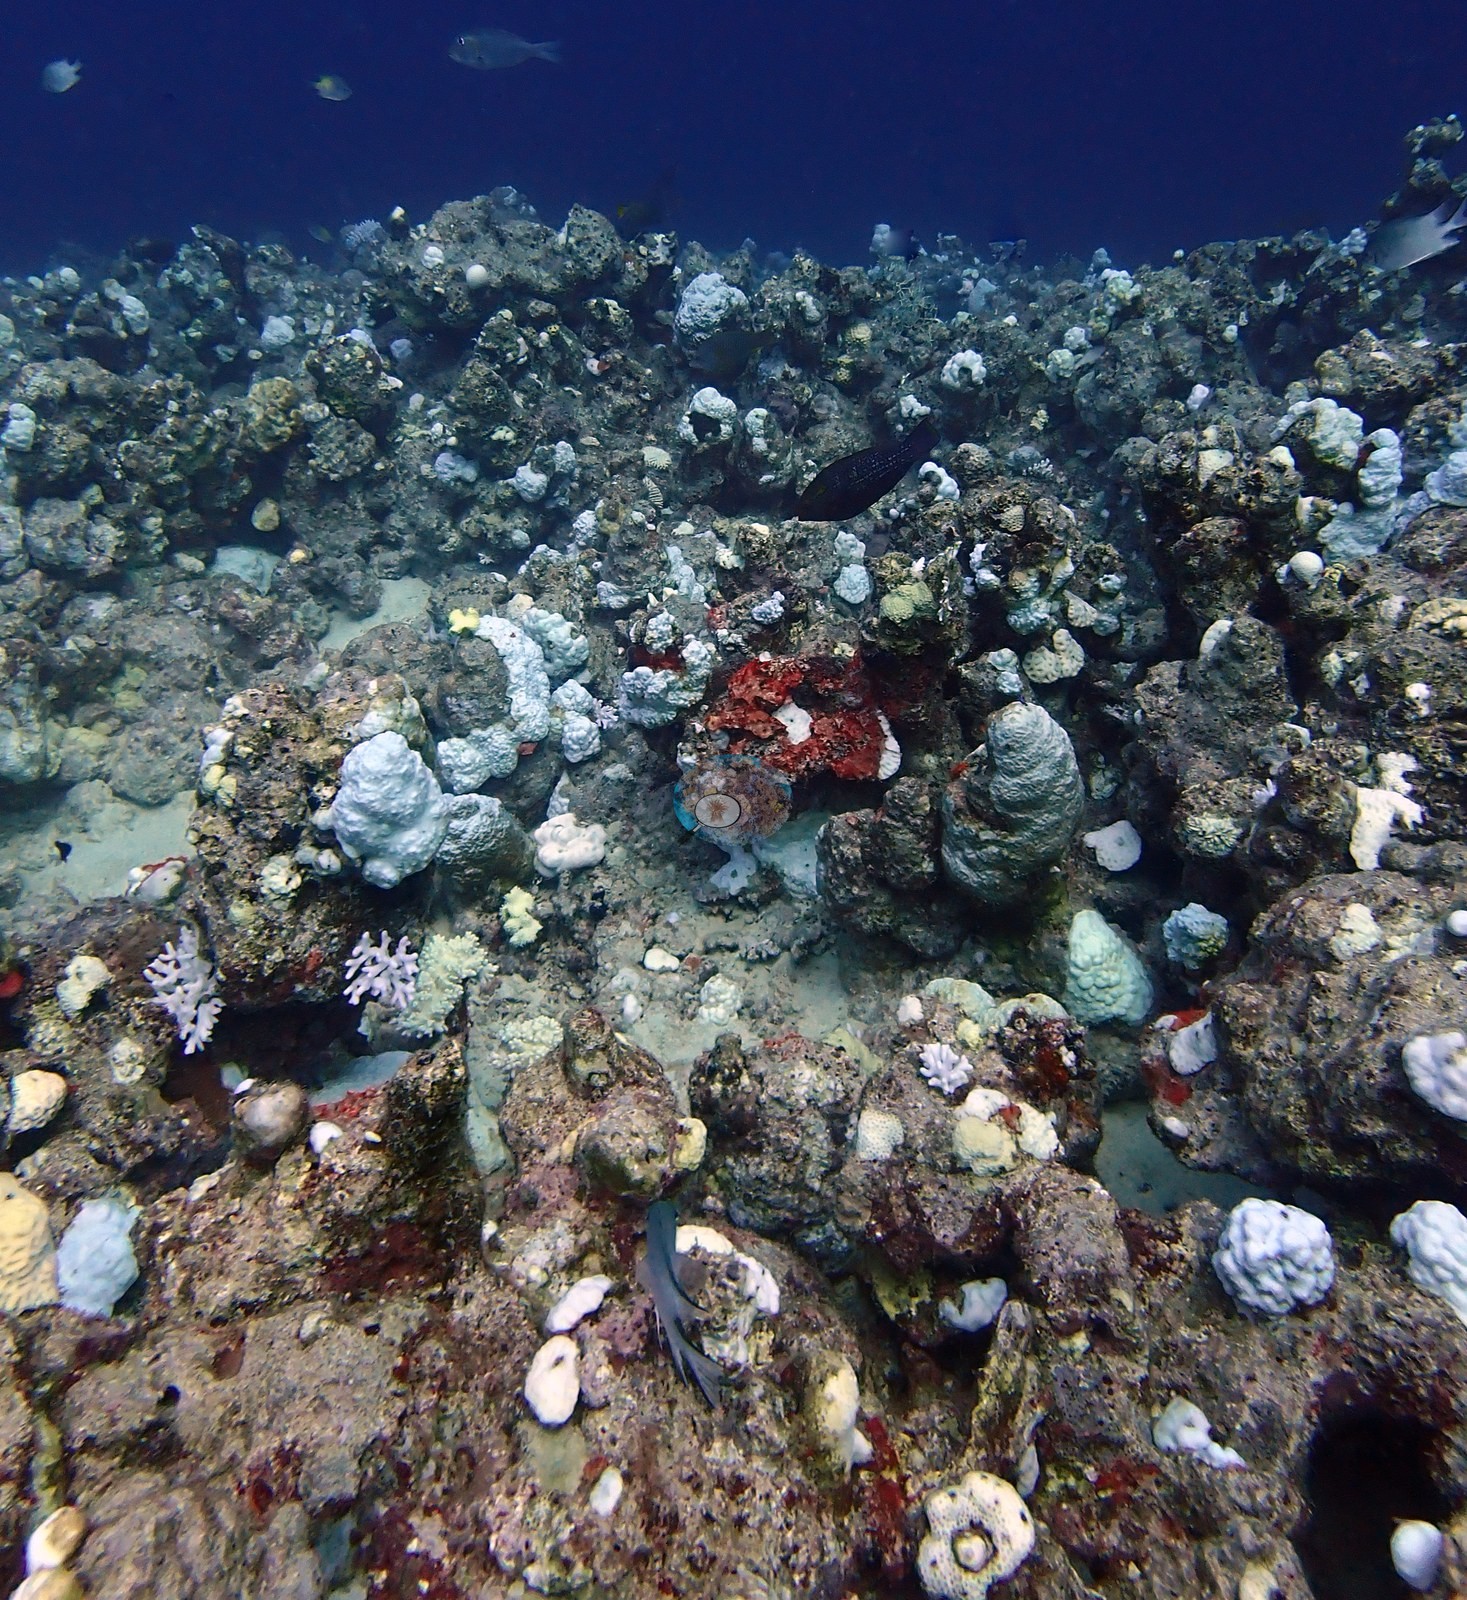
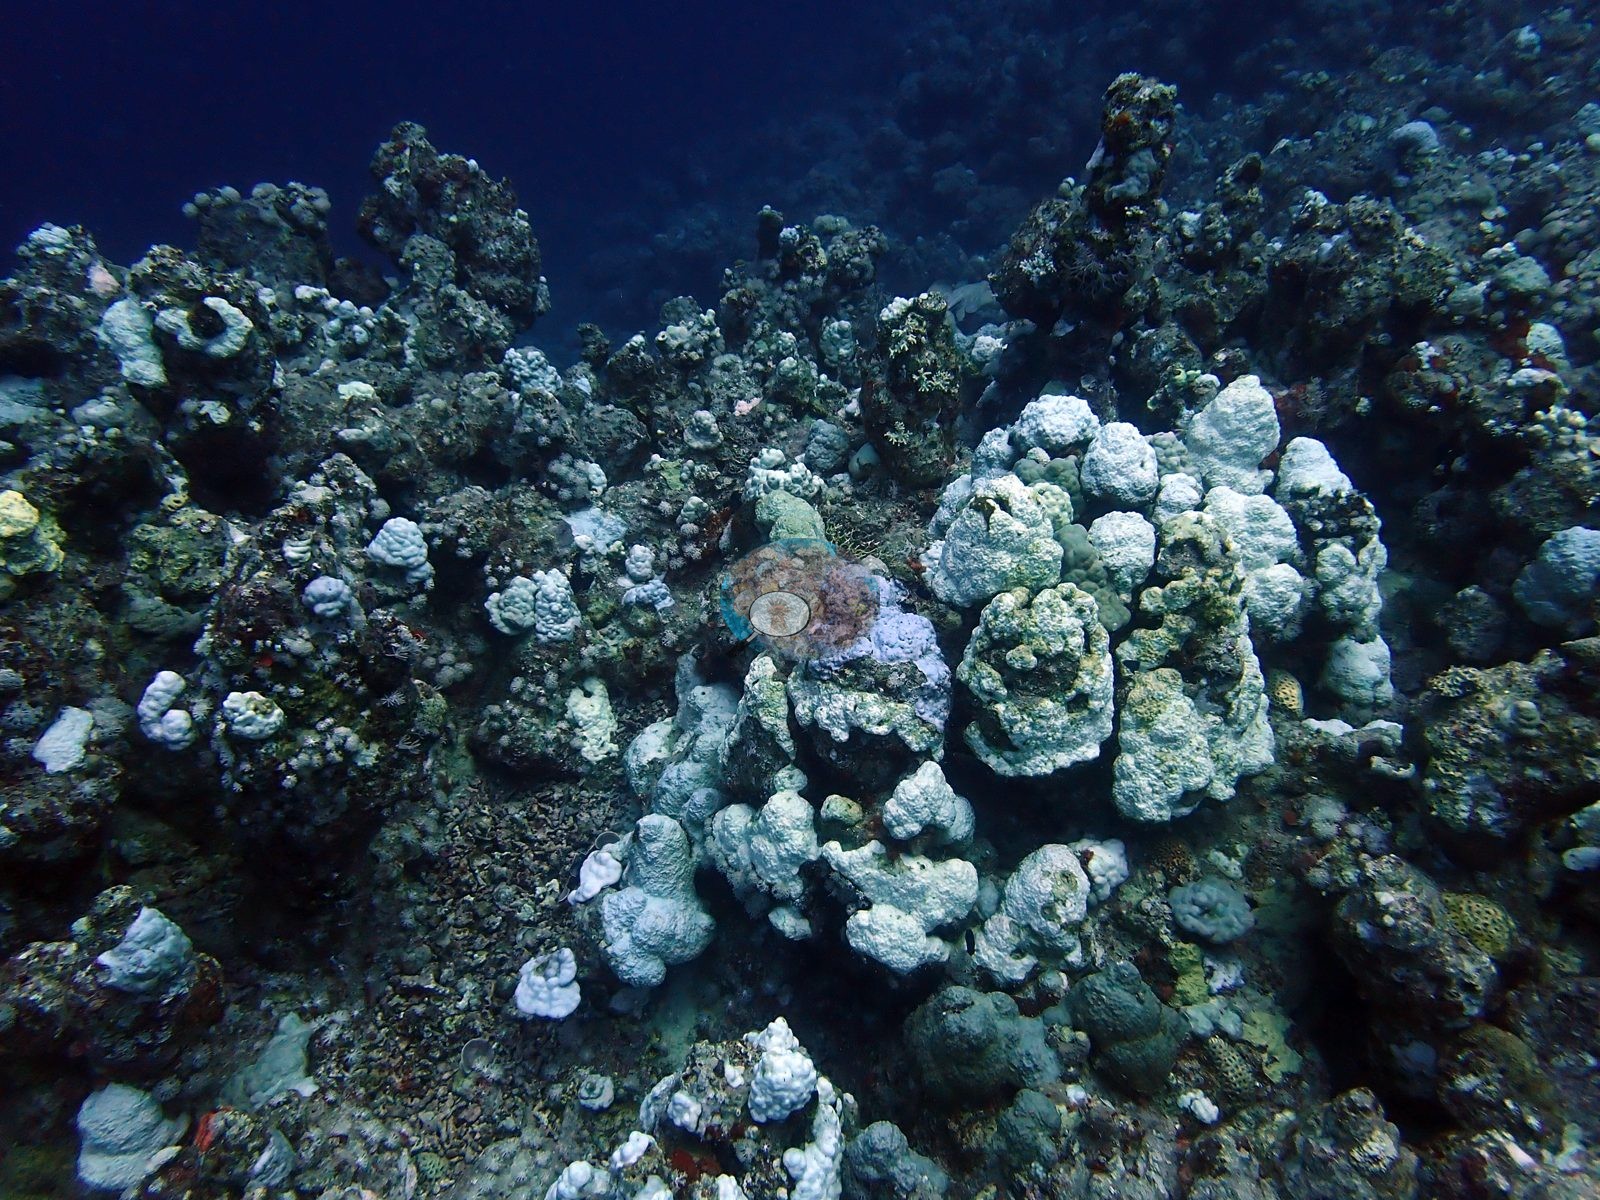
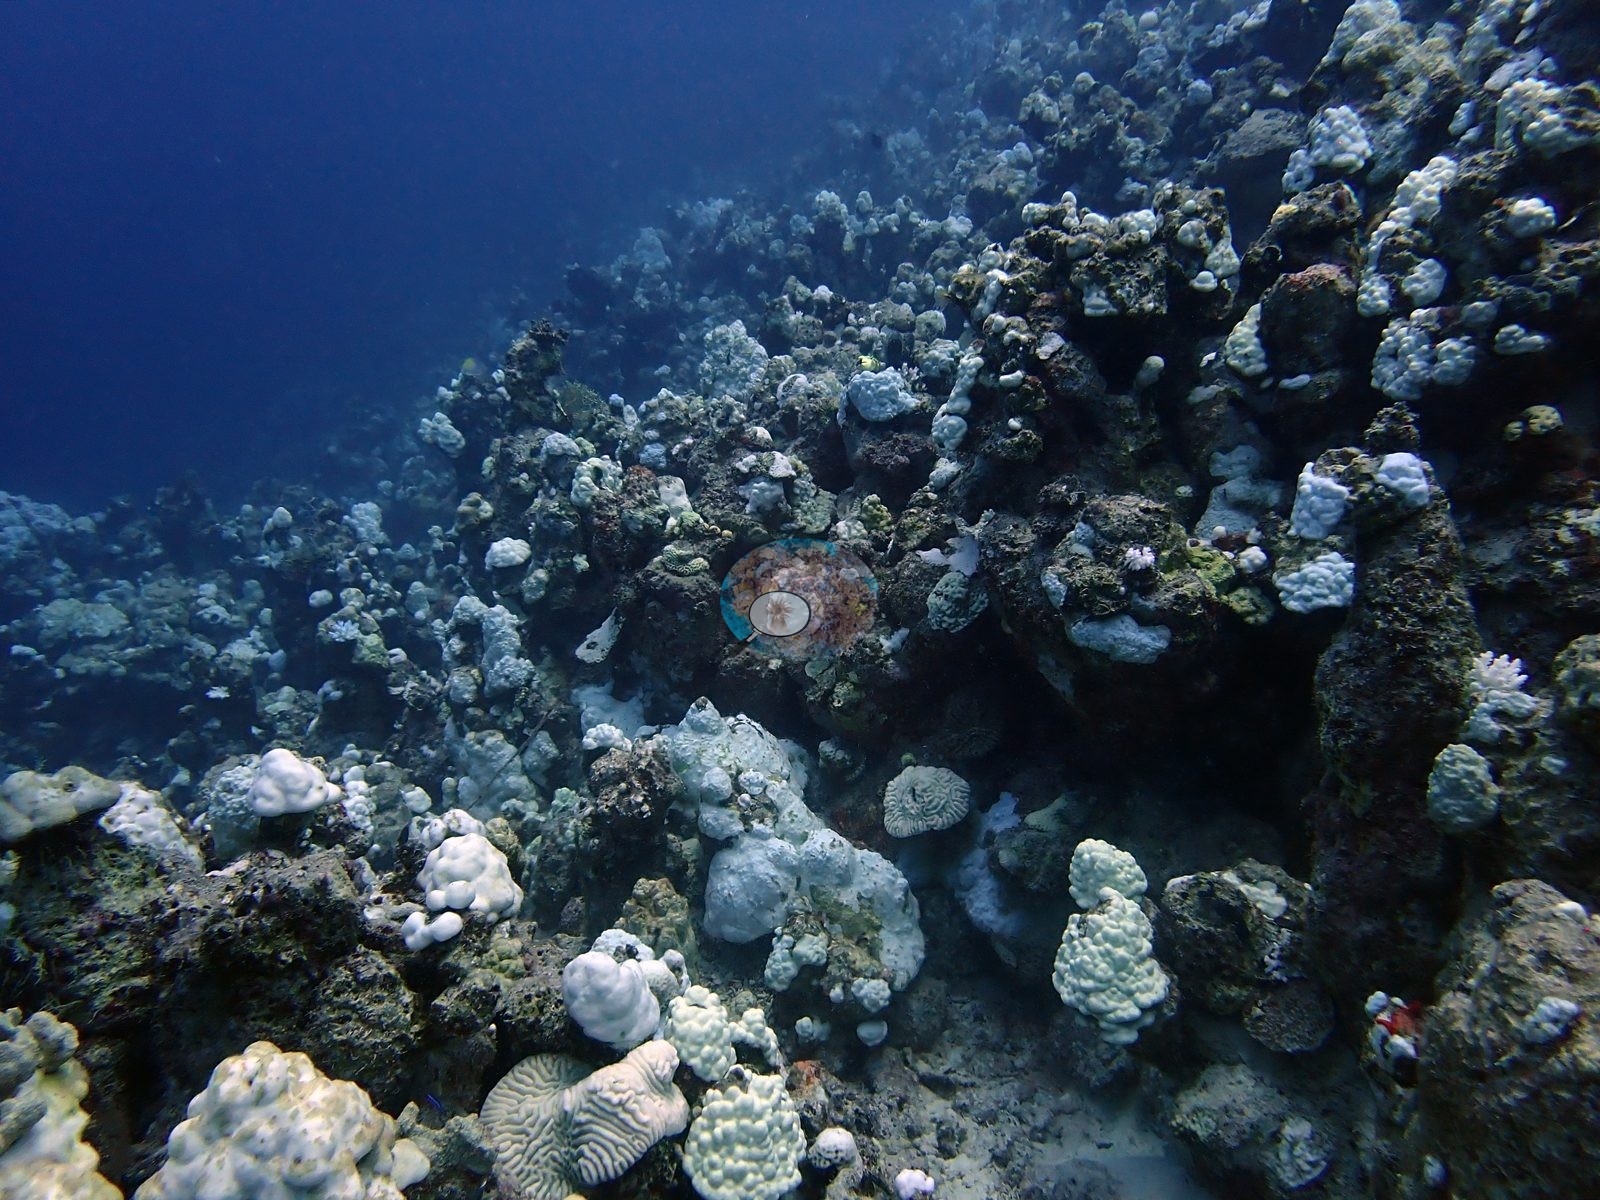
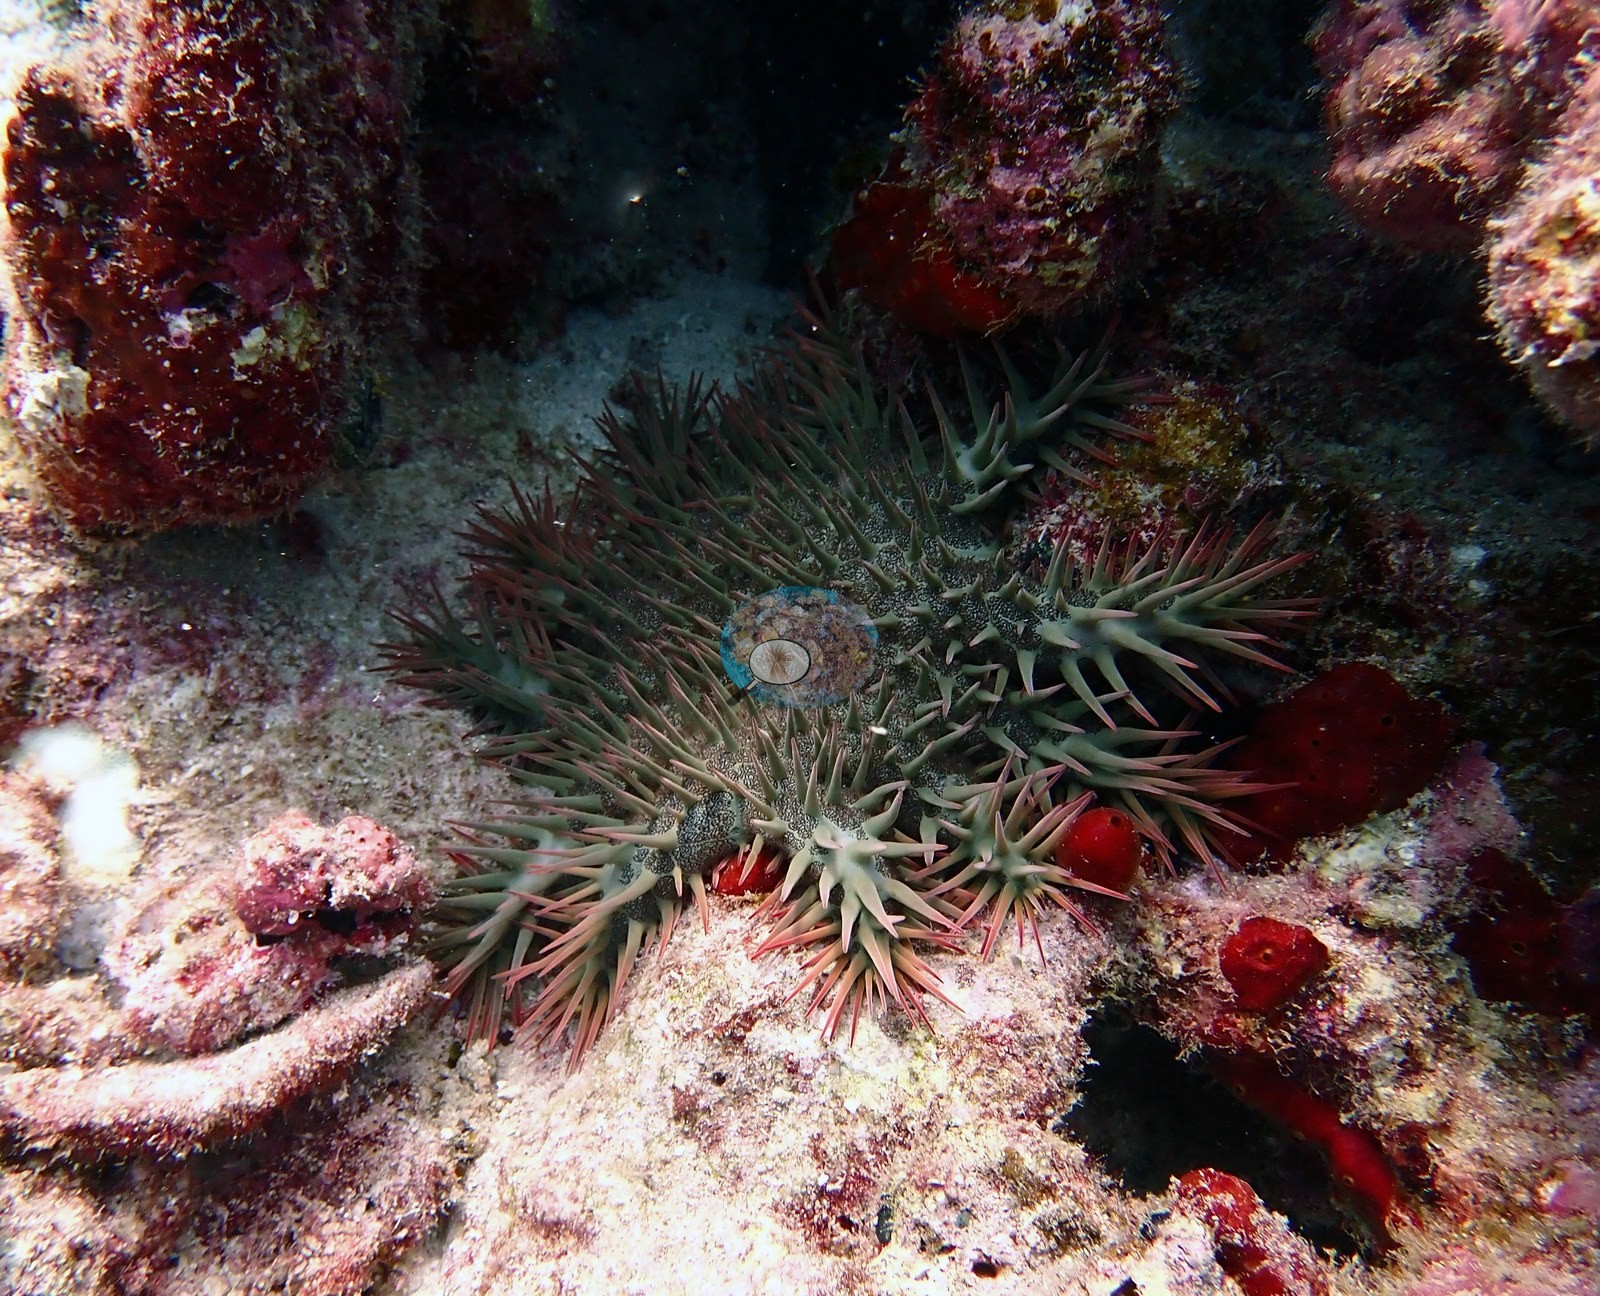
Anderson's own captions for this dive read like a list — "severe bleaching", "severe Red Sea bleaching", "bleached pocilloporids", "bleached corals and anemones", "diver on dying reef", "dead corals", "dead Acropora", "dead coral covered in algae", "mostly dead acroporid", "nearly dead pocilloporid", "dead pocilloporid", "bleaching Porites". And there are crown-of-thorns here — two separate Acanthaster individuals, one on each survey day, both photographed on the reef amid bleached and dying coral (e.g., Image 1).
Comparisons with other data
No independent survey was made at this exact site; the nearest ones are listed in the table below.
Dive record
Four dives across two days at the peak of the 2024 Red Sea bleaching event, worked with Coastline (KAUST).
Other notes
See flags.
Survey summary
Shark Reef: surveyed 2 times, Aug 2024–Sep 2024 (CoralNet point counts; Mayfield 2025, Environments 12:248). Surveyed in partnership with Coastline (KAUST).
CV model comparison
More info
The reference row is this dive site's own published value (Mayfield 2025, Appendix A, 421 photos); the other rows are AREA-level (Thuwal) comparisons, not run on this site's frames. ⚠ The comparison rows are REGIONS, not dive sites: the paper's main tables report cover by region, and this site's own value comes from its Appendix A. ⚠ The manual column and the CV columns are on DIFFERENT FRAME SETS. The published cover spans the region's full photo set (173–2,567 frames, most of them CoralNet robot-labeled); the CV arms ran only on the hand-scored reference subset, which is 6 frames at Thuwal, 274 at Jeddah and 173 at Rabigh. Read Thuwal's model columns as indicative only. CoralNet is n/a by design: the reference set IS the hand-scored set, so those frames carry no independent robot label to compare against. DINOv3 is restricted to frames it never saw, and reads roughly double the published cover at every Red Sea region. ⚠ 'unassigned region' is not a place: 135 frames carry no region label in the CoralNet metadata and map to no published row. It has no manual value and is excluded from the pooled reference. CoralNet automated point classifier: n/a — the reference set IS the hand-scored set; these frames carry no independent CoralNet robot label to compare against CoralSCOP (SAM-based mask-sum), unedited photos: pending — CoralSCOP run: 370/747 images scored at build time CoralSCOP (SAM-based mask-sum), edited photos: pending — CoralSCOP run: 370/747 images scored at build time| Method | Hard-coral cover (%) |
|---|---|
| Manual (published) | 15.9 |
| In-house DINOv3 | 47.5 |
| Claude | 23.9 |
Dive history
Coral bleached: computer-vision (CoralNet) estimate from the survey images, per dive, as published in Mayfield (2025, Environments 12:248), Supplementary File S1.
| Date | Time in | Max depth (m) | Bottom time (min) | Coral bleached (%) |
|---|---|---|---|---|
| 2024-08-31 | — | — | — | 72.7 |
| 2024-09-14 | — | — | — | 70.9 |
Independent surveys nearby
| Agency / program | Year(s) | Stations / distance | Link |
|---|---|---|---|
| Aeby et al. (2021) | 2015 | 1 station, 0.36 km | Records ↓ |
| Furby et al. (2013) | 2010 | 1 station, 0.36 km | Records ↓ |
| Monroe et al. (2018) | 2015 | 1 station, 0.36 km | Records ↓ |
 Dr. Coral (CRD)Year-average (no detectable trend)
Within 5 km, 3 independent survey stations recorded hard coral cover in 5 surveys between 2010 and 2015. The most recent nearby survey is from 2015, so these values predate recent heat stress. This site's own estimate (16%) sits 7.1 points below the range of these surveys (23–60%); the methods differ, so the comparison is context, not a like-for-like test.
Collected by other programs using different methods, so these are context for the figures above, not a like-for-like comparison. Where a station was surveyed more than once the range is shown. Station names are not dive-site names.
| Agency | Site / location | Date | Hard coral cover (%) | Distance | Link |
|---|---|---|---|---|---|
| Furby et al. (2013) | Midshelf reef 2 | 2010 | 23% (3 surveys) | 0.36 km | HeatCRD database |
| Monroe et al. (2018) | Midshelf reef 2 | 2015 | 37% | 0.36 km | HeatCRD database |
| Aeby et al. (2021) | Qita al Kirsh | 2015 | 60% | 0.36 km | HeatCRD database |
Data & links
- CoralNet image repository for this region ↗
- HeatCRD database ↗
- (reference) ↗
- Photo portfolio ↗
- Photo portfolio ↗
- Coral Reef Diagnostics country page ↗
All images from Coral Reef Diagnostics. Data are from Coral Reef Diagnostics and the organizations named in the data-sources table above.
© Coral Reef Diagnostics.
References
- Furby KA, Bouwmeester J, Berumen ML (2013). Susceptibility of central Red Sea corals during a major bleaching event. Coral Reefs 32:505-513. DOI
- Monroe AA, Ziegler M, Roik A, Röthig T, Hardenstine RS, Emms MA, et al. (2018). In situ observations of coral bleaching in the central Saudi Arabian Red Sea during the 2015/2016 global coral bleaching event. PLOS ONE 13:e0195814. PDF
- Aeby GS, Shore A, Jensen T, Ziegler M, Work T, Voolstra CR (2021). A comparative baseline of coral disease in three regions along the Saudi Arabian coast of the central Red Sea. PLOS ONE 16:e0246854. PDF
- Mayfield AB (2025). Using Tourist Diver Photos to Assess the Effects of Marine Heatwaves on Central Red Sea Coral Reefs. Environments 12:248. PDF