
Philippines

Overview of 26 dive sites. Figures are averages across the sites that report them (n = sites with a value); each site's own page has its individual values. Regional summaries: Luzon, Palawan, Visayas.
⬇ Download this overview as a report card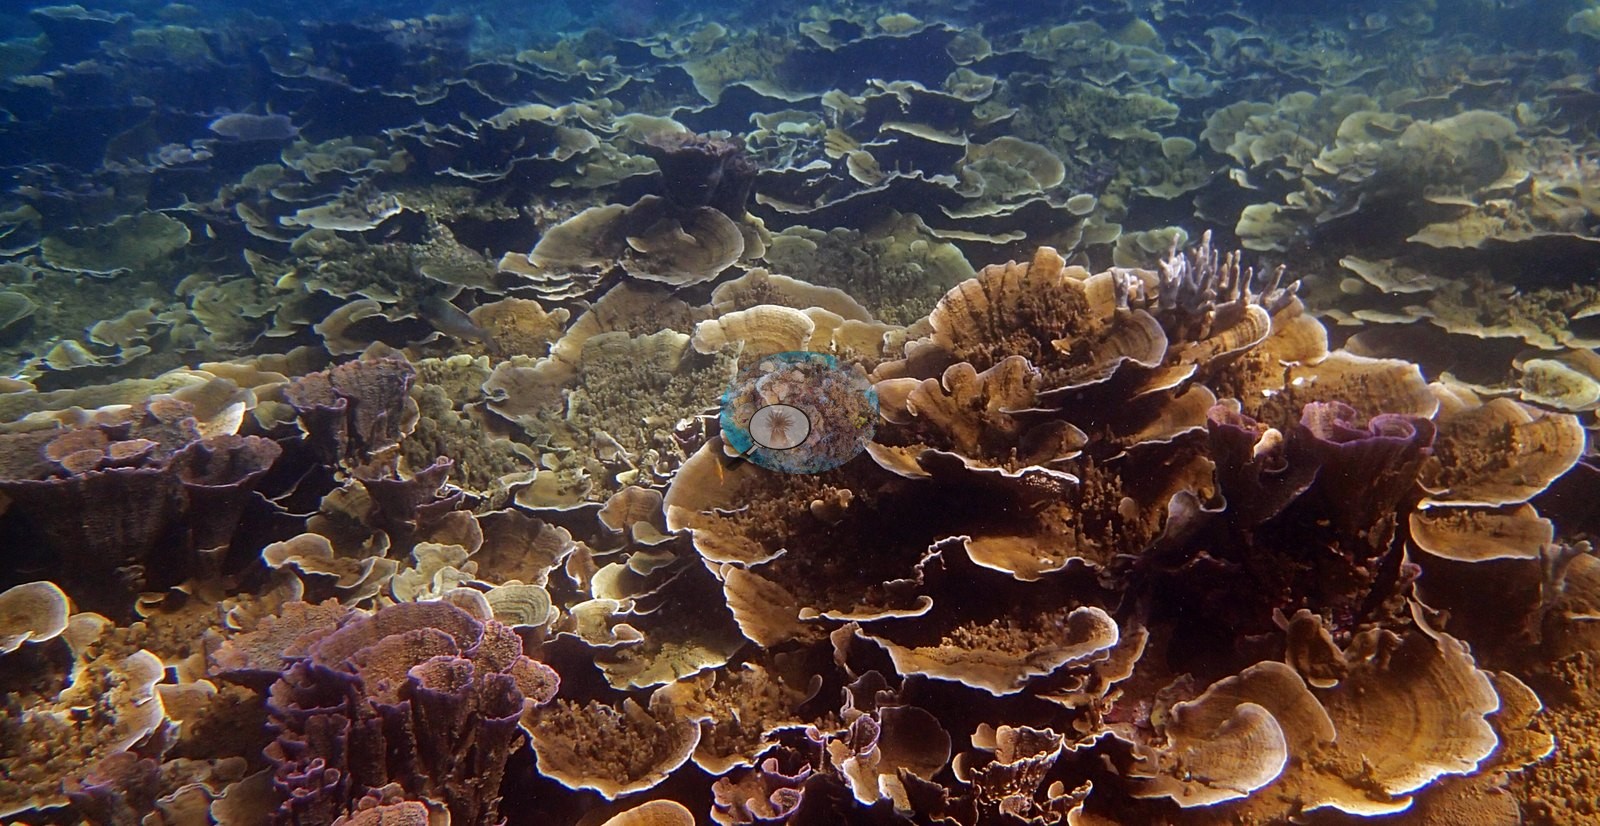

Heat stress, 1985–2025
26 sites in this region — click a marker to open that site.
Overview
Spalding et al. (2001) place the Philippines, with Indonesia, at the center of global coral reef biodiversity, and estimate the country's reef area at 25,060 km², with 421 coral species recorded and 577 estimated for its biogeographic region. The three areas on this page are very different parts of it. Around Luzon they found reefs far from continuous, with none in the far northwest, the first fringing reefs at the Hundred Islands in the Lingayen Gulf, and discontinuous fringing reefs in the south, notably at Puerto Galera on Mindoro; ash and mudflows from the Mount Pinatubo eruption cut live coral cover on the nearest fringing reefs from 60-70% to 10-20%. Palawan's reefs they rank among the most fully developed in the country, with fringing and patch reefs along most of its coast, live cover reported at 50-90% in places, offshore banks thought to belong to a long submerged barrier reef, and the two atoll systems of the Cagayan Islands and Tubbataha in the Sulu Sea. The Visayas are a close-set group of islands around the Visayan Sea, fringed along much of their coast and broken by soft sediment near river mouths, and home to the small reserves at Apo Island and Sumilon, cited as globally recognized models of community-based management. The same account rated 97% of the country's reefs as at risk from human activity.
This page gathers 26 pins in three units, from three separate trips. The Visayas unit holds seven pins from recreational dives in February 2013 around Moalboal and Pescador Island off western Cebu, Mactan Island beside Cebu City, Alona Beach on Panglao and Balicasag Island off Bohol, Apo Island off Negros, Punta Ballo at Sipalay, and Boracay. Luzon holds seven dived on 30 September and 1 October 2016, four around Anilao and three in the Verde Island Passage. Palawan holds twelve visited between 20 and 28 January 2017 in three areas: Port Barton, the Bacuit Archipelago off El Nido, and Busuanga and Coron Island. Logged maximum depths, where they exist, ran from 12.8 m on the Anilao night dive to 34.4 m on the Akikushima wreck at Coron. The record is unevenly built: the Visayas pins rest on Anderson's dive logs alone, because every surviving frame from that trip is topside, while the Luzon and Palawan pins have photographs and photo-derived cover.
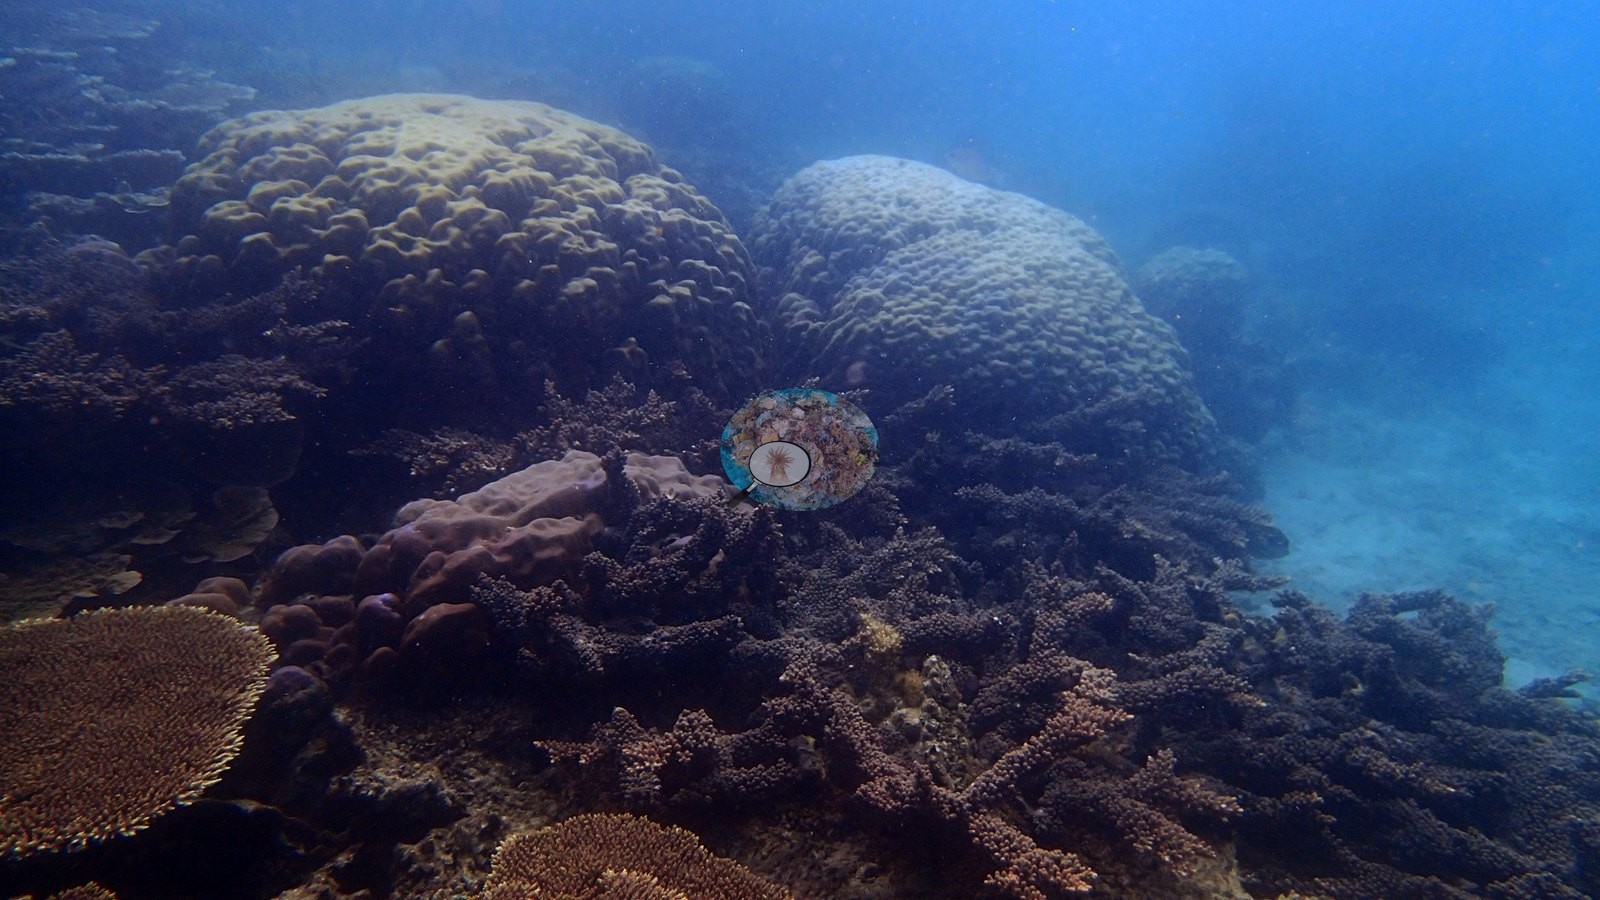
Photo-derived cover exists for 18 of the 26 pins and averaged 27.0%, from 14.7% on the Taiei Maru oil tanker wreck at Coron to 43.4% at the second Port Barton island-hopping stop. Palawan read slightly higher (28.0%, n = 12) than Luzon (24.9%, n = 6), and the Visayas have no value at all. Acropora and plating corals define the best reefs. The first Port Barton island-hopping stop had vast monospecific staghorn and tabulate Acropora thickets beside an unbroken pavement of violet-edged foliose plating coral, with massive Porites bommies between them; Abdens at El Nido had broad fields of tabular plates, one several meters across; Sombrero Island in the Verde Island Passage had enormous tabular Acropora plates meters across with columnar Porites. Elsewhere the community is soft. Ligpo Island off Anilao carries dense Dendronephthya, Sarcophyton and pulsing Xenia fields among barrel sponges, and Beatriz Island is defined by very large barrel sponges, black coral bushes and gorgonian fans. Three of the 26 pins are wrecks, where the cover figure indexes hull colonization rather than reef.
No site in the set showed a reef-wide bleaching signal, but localized flags recur across both photographed units. At Anilao a stand of stark-white branching Acropora at Dive and Trek, a stark-white colony and a partly bleached host anemone at Ligpo Island, and a partially bleached colony at Monte Carlo; in Palawan a partially bleached colony at the second Port Barton stop, scattered white patches or recent-mortality spots at Paglugaban Rocks and Coral Gardens, a small white patch at Abdens, several conspicuously pale colonies on the Alberguin wreck, and a Seriatopora photographed and labeled dying at Nat Nat. The clearest damage in the set is older. Reef 1 near Port Barton town is extensive standing dead branching Acropora, algal-colonized and breaking to rubble, with small live recruits growing on the dead branches, and one frame captioned 'pollution damaged reef'. In the Visayas logs the pressures are specific rather than photographed: tabular acroporids overturned at Arco Point by a strong typhoon about two months before the February 2013 dives, and a Sipalay fish assemblage that appeared severely overfished despite good coral structure.
The Visayas logs are also where the strongest coral in the set is described, without a number attached to any of it. Talisay at Moalboal was the dive Anderson rated best of the trip for coral, close to continuous and genus-rich; the Sambaguita shallows at 3-4 m were near-continuous branching Porites; the Balicasag Sanctuary wall carried the most coral he had then seen on one dive; and at Marigondon Cave on Mactan the log calls the hard coral cover and diversity striking given how close the site is to Cebu City. Set against that, Wilkinson (2006) reported Philippine reefs in continuing decline as of 2004, under overfishing and destructive fishing, land-based pollution, sediment from coastal development and reclamation, with only 10-20% of Southeast Asia's more than 630 marine protected areas effectively managed. Souter et al. (2021) estimate that hard coral cover across the East Asian Seas dropped to 35% by 2012 after the 2010 mass bleaching and to 33.9% in 2017 after the 2016 event, before recovering to about 36.8% in 2019.
Highlights
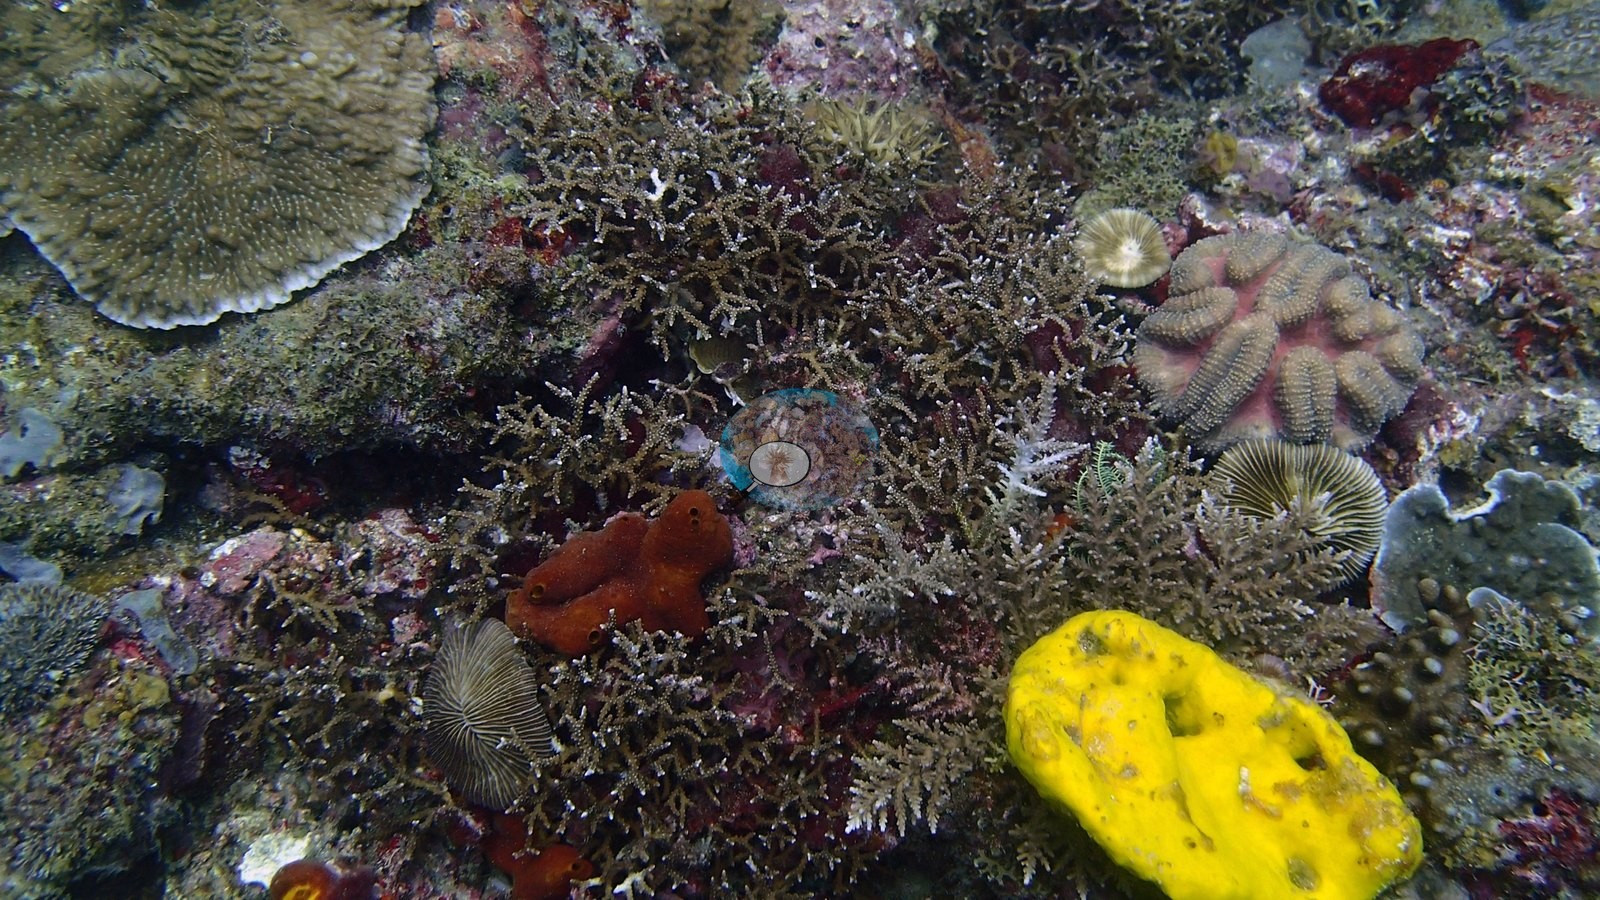
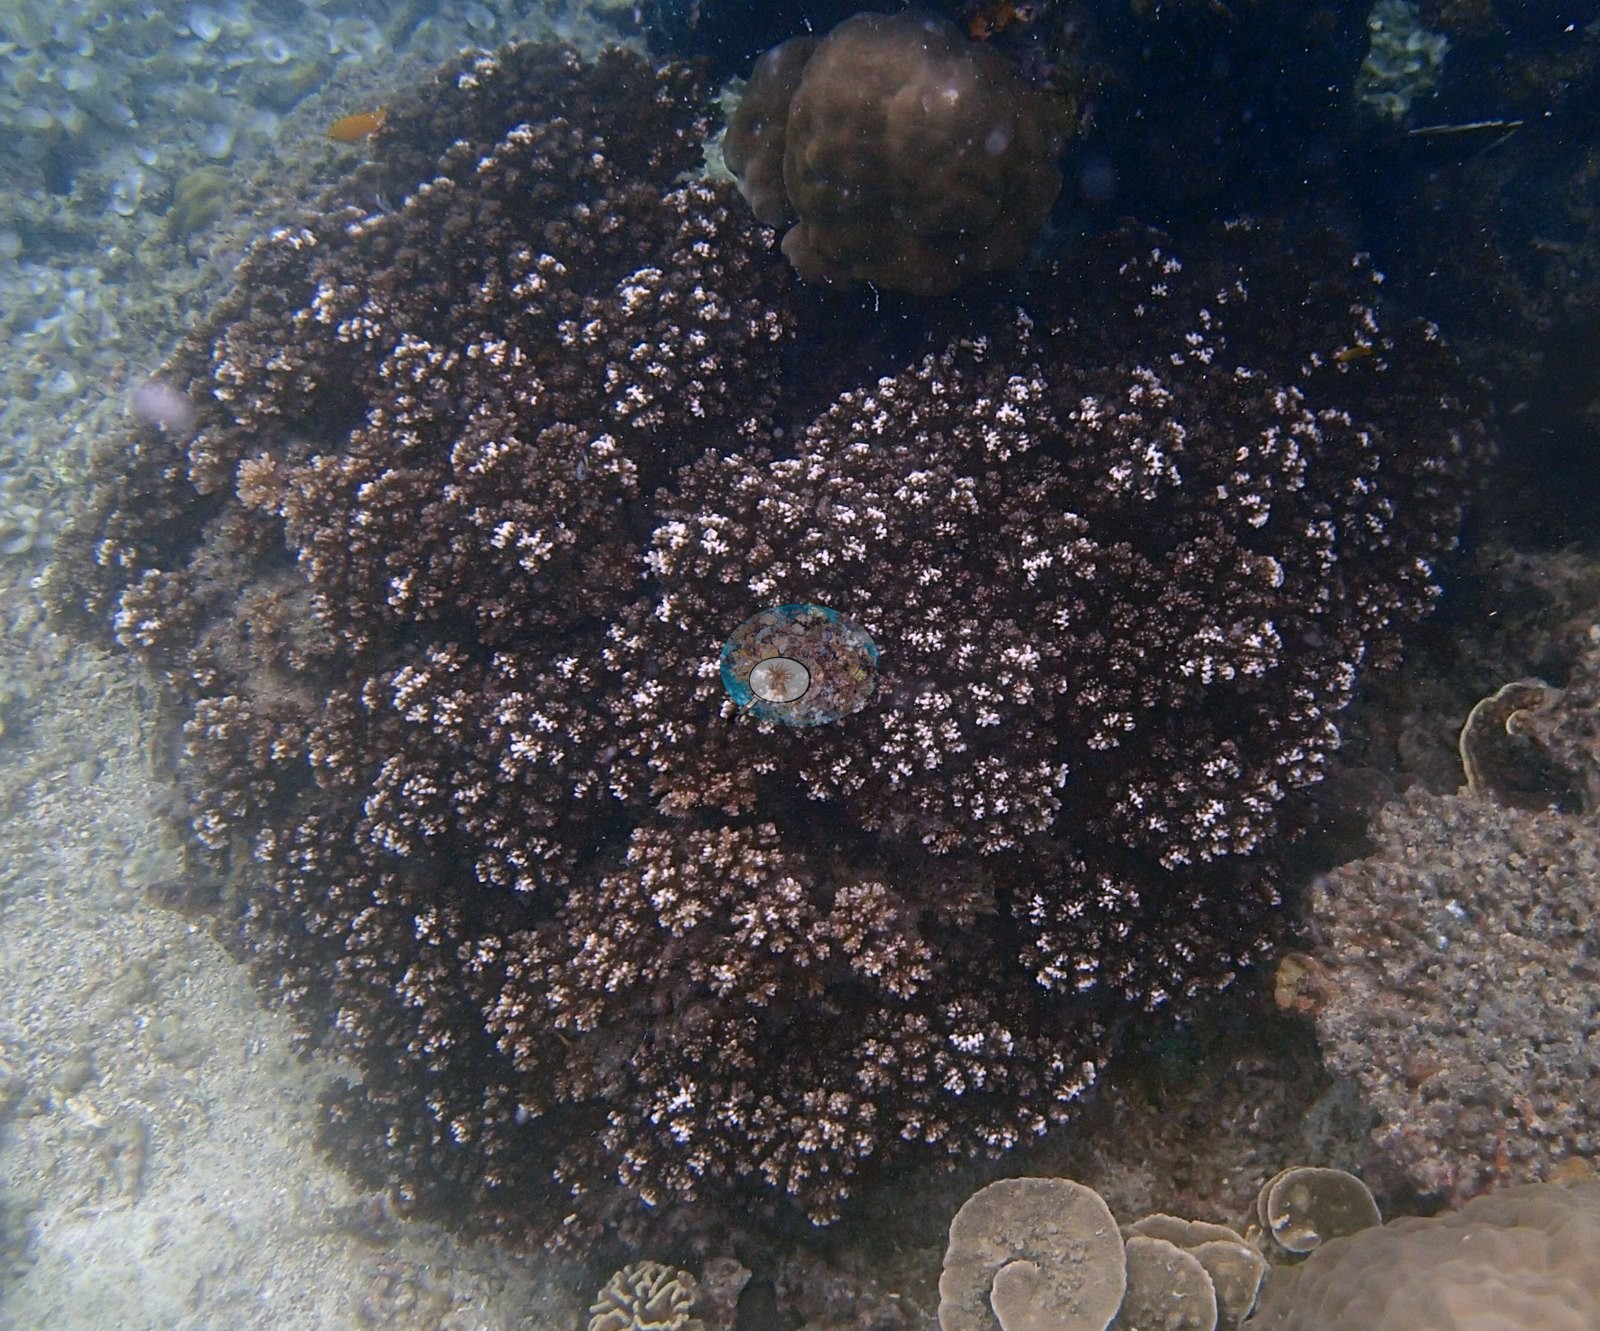
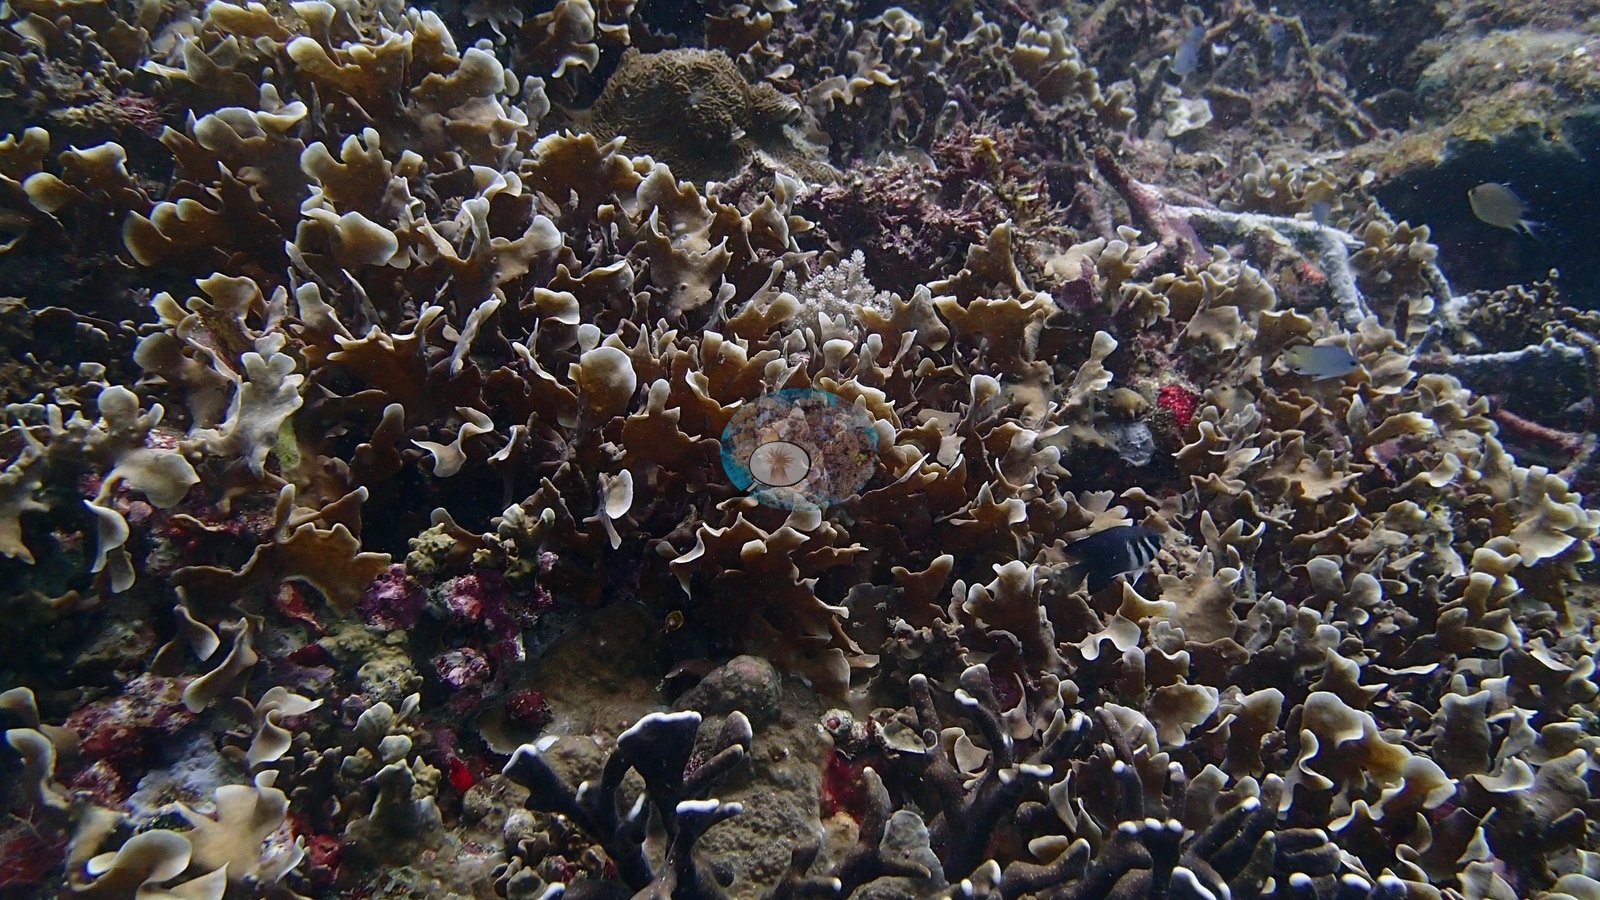
- Port Barton island-hopping stop 1: vast staghorn and tabulate Acropora thickets beside an unbroken pavement of violet-edged foliose plating coral, and the set's hero image.
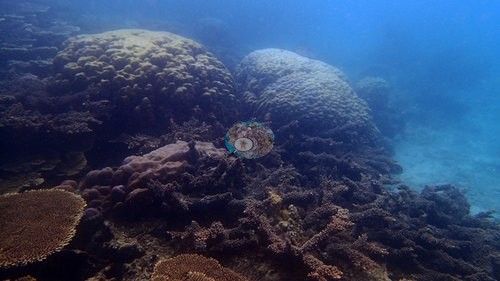 photo: Philippines - Port Barton, Palawan: island-hopping stop 1 (San Miguel area)
 - The highest photo-derived index in the set, 43.4%, at the second Port Barton island-hopping stop; the lowest, 14.7%, on the Taiei Maru wreck at Coron.
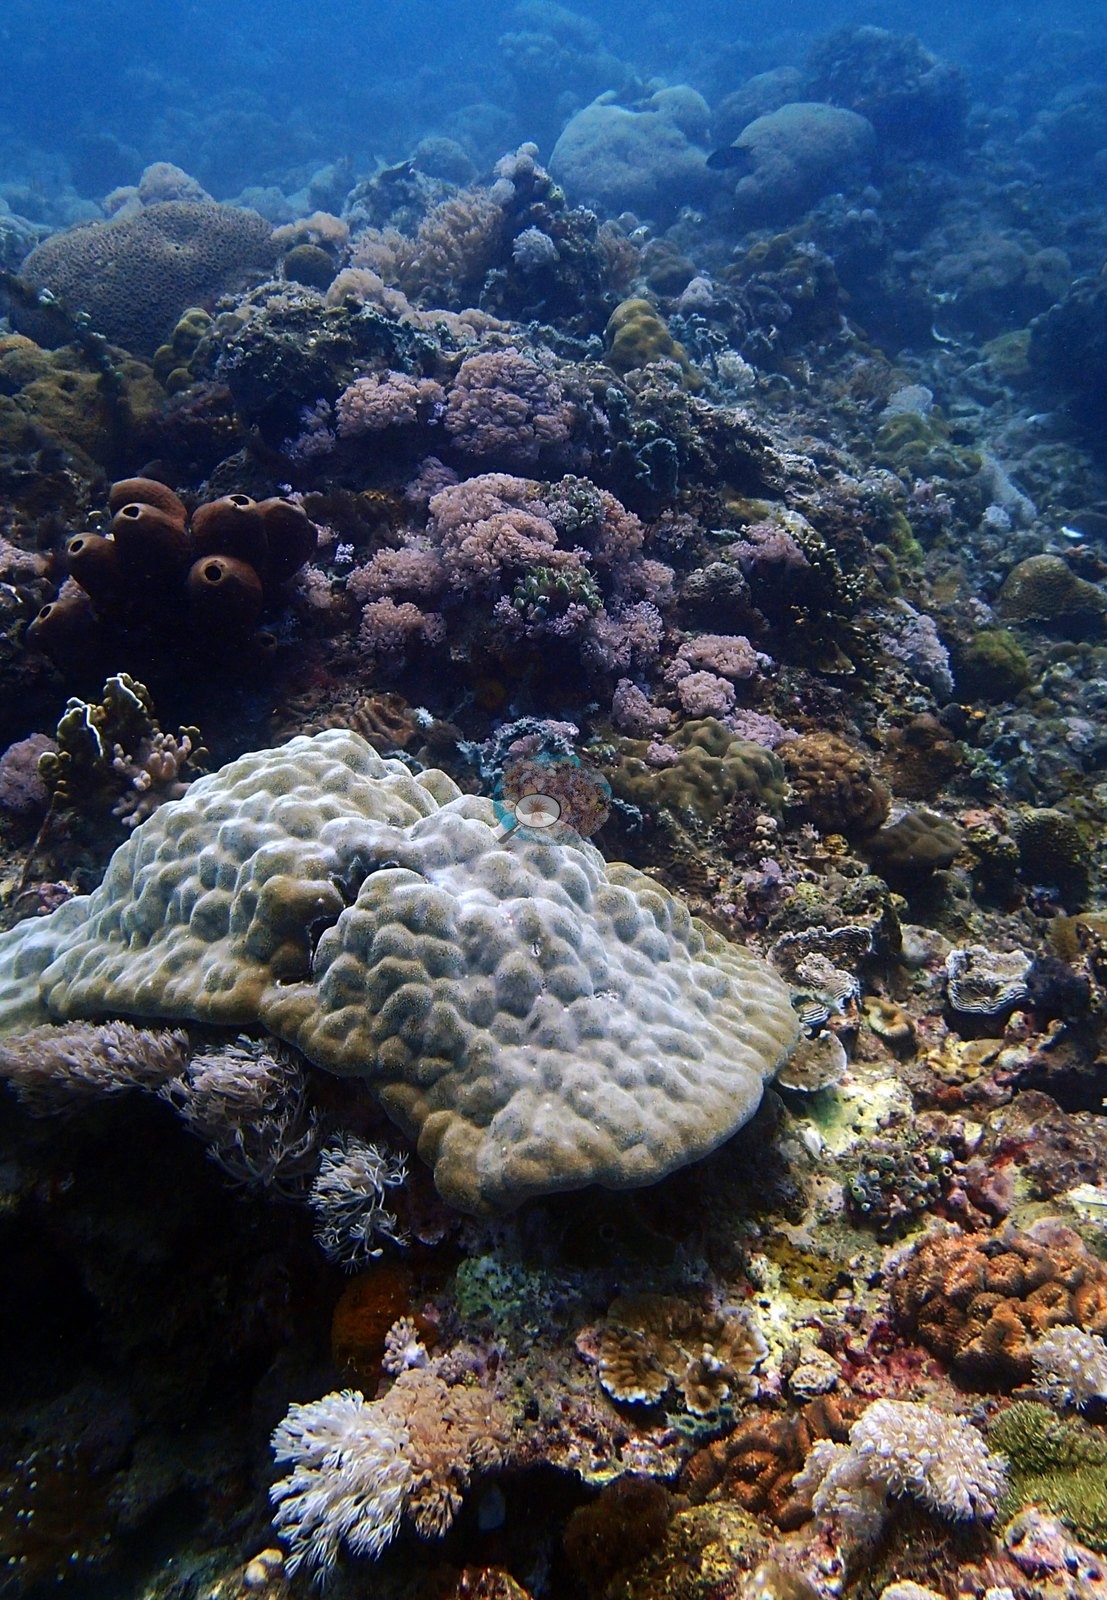
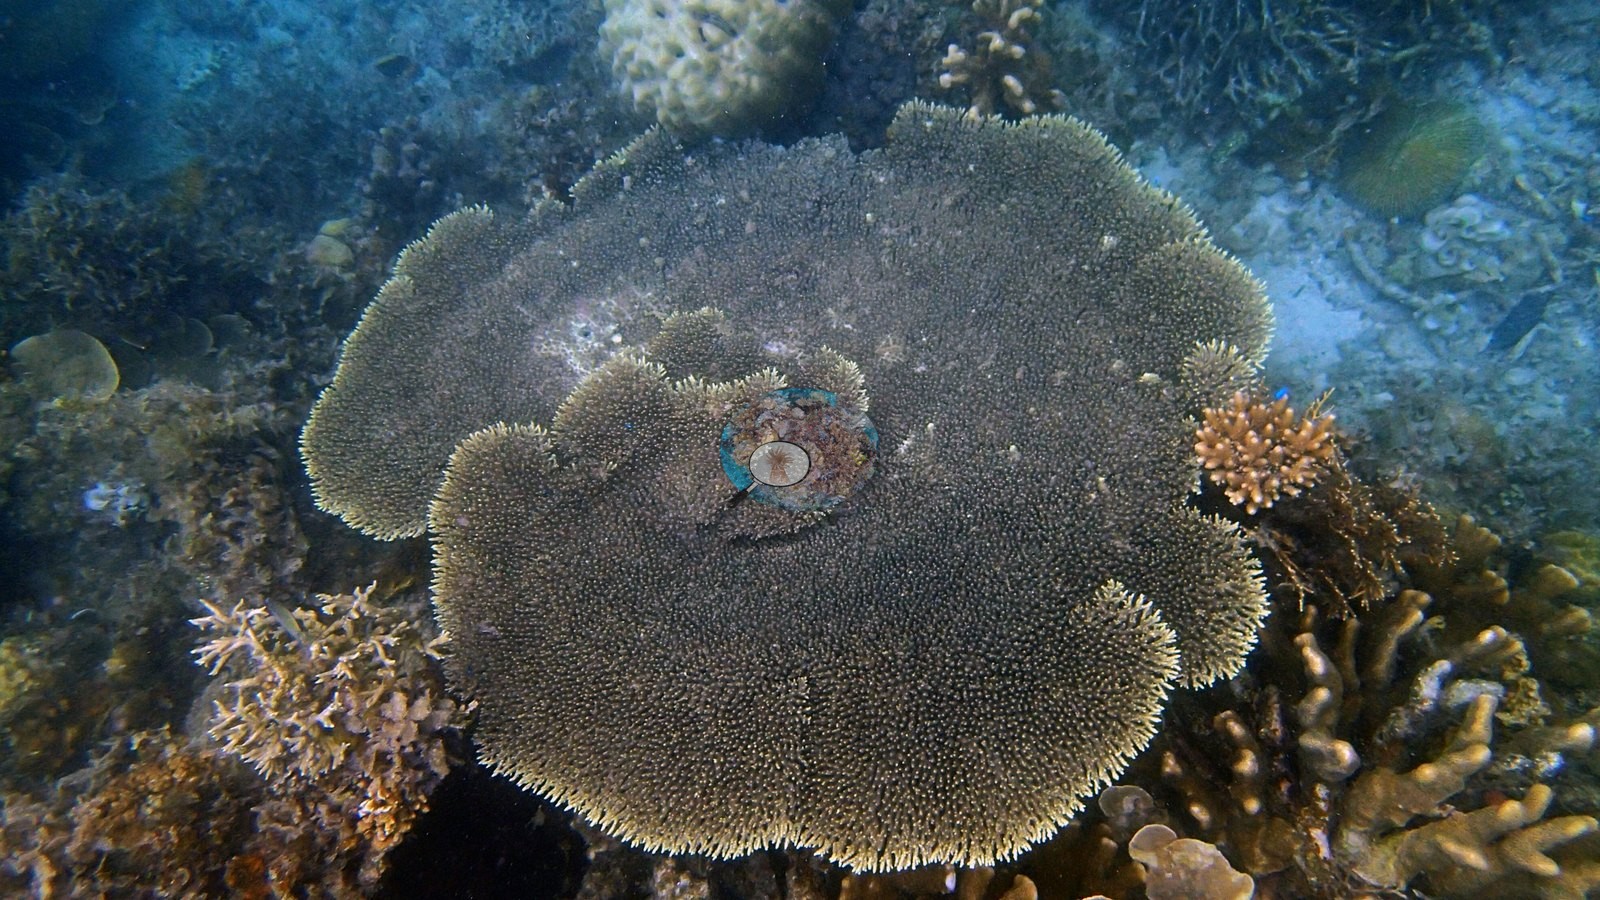
- Sombrero Island (Verde Island Passage): tabular Acropora plates meters across with columnar Porites.
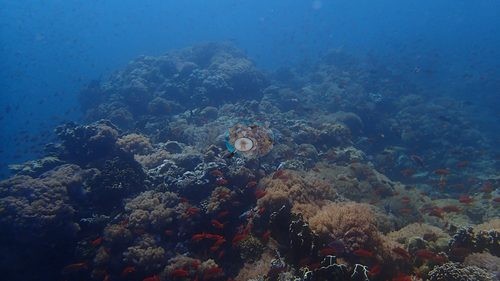 photo: Philippines - Verde Island Passage: Sombrero Island
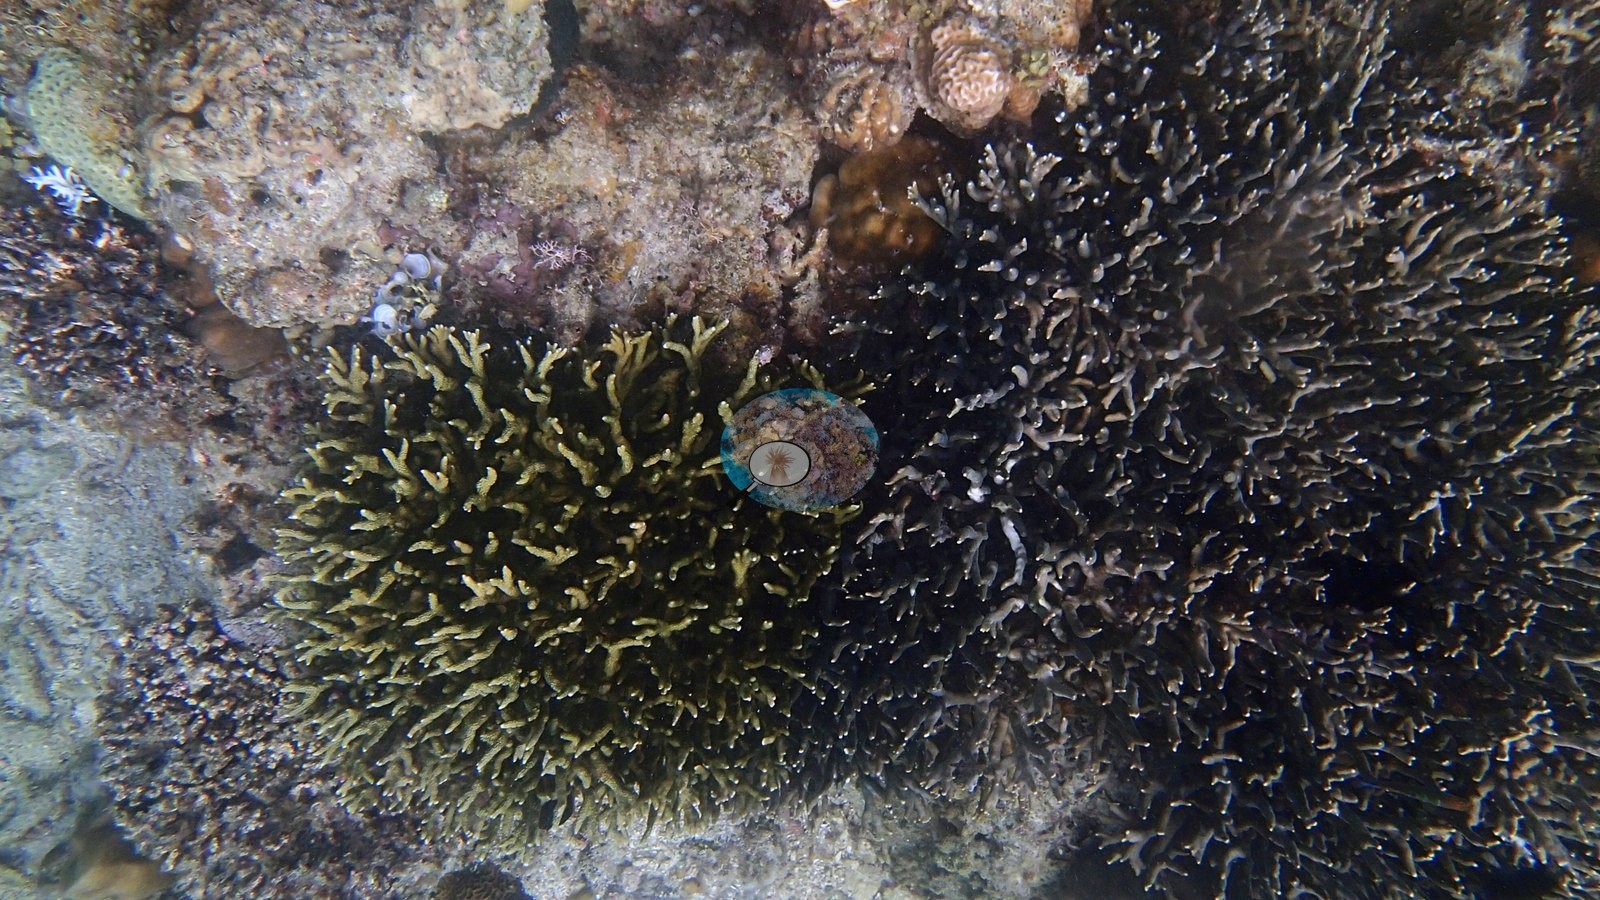
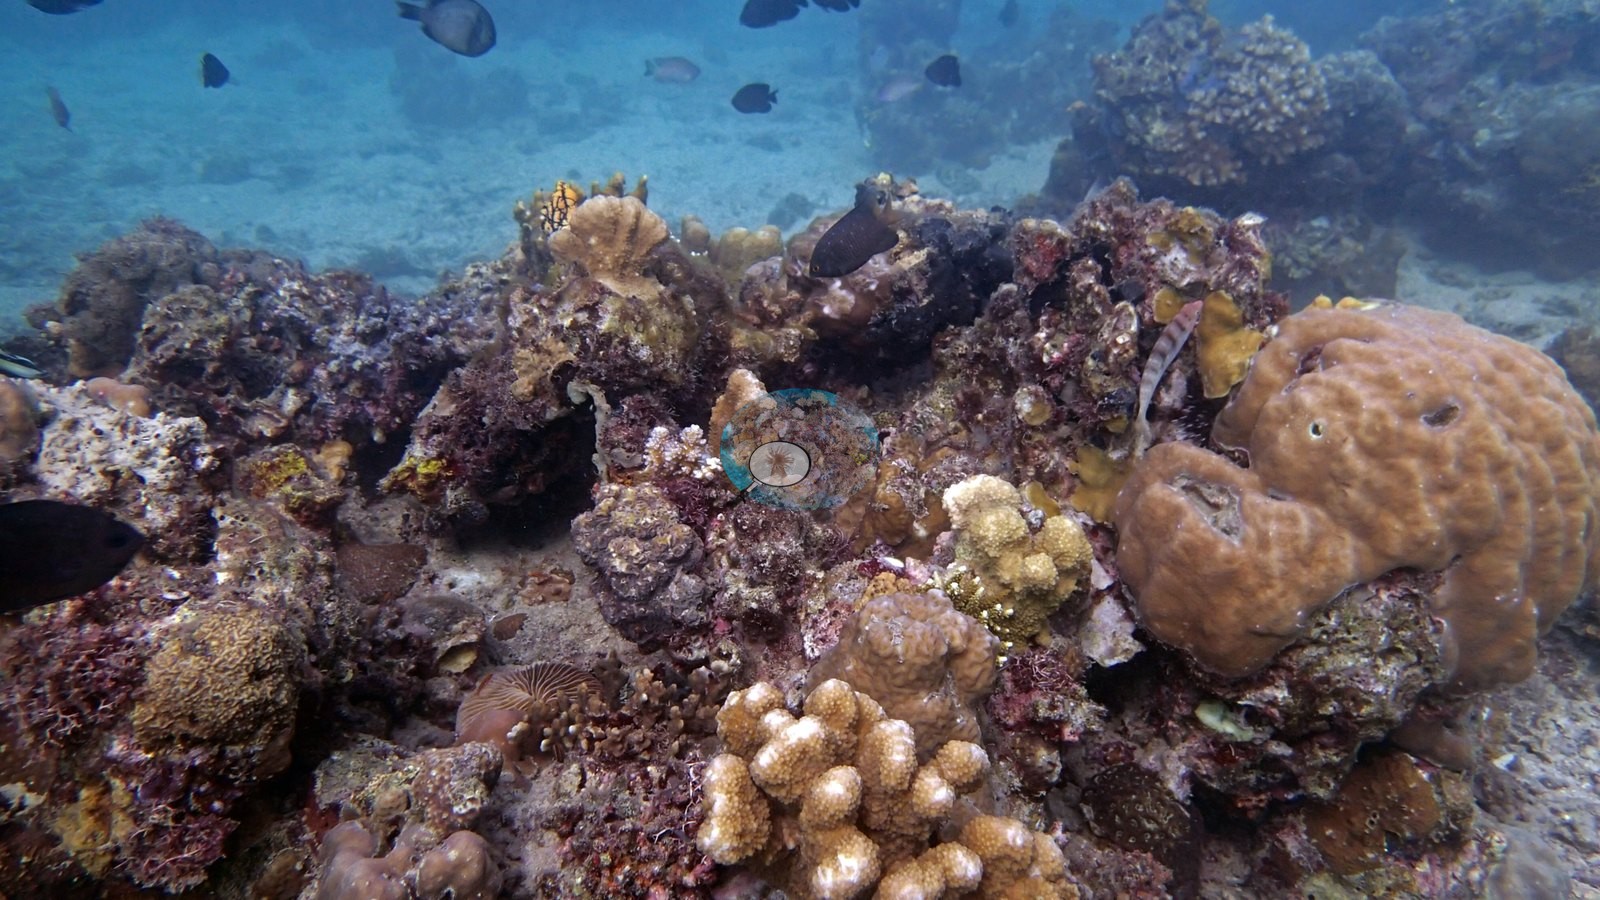
 - Abdens (El Nido): continuous fields of tabular Acropora, one table several meters across; Paglugaban Rocks, one of Anderson's favorite Philippine dives, for genus diversity on a rocky fore reef.
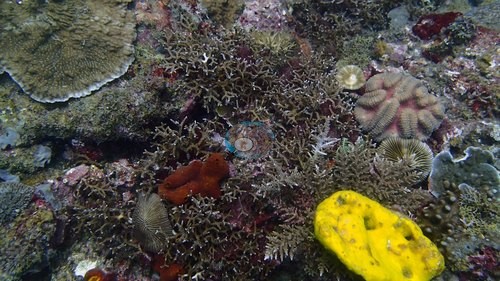 photo: Philippines - El Nido: Paglugaban Rocks (Bacuit Archipelago)
 - Talisay at Moalboal, the dive Anderson rated best of the February 2013 trip for coral, and the Balicasag Sanctuary wall, which he called the most coral he had seen on a single dive to that point.
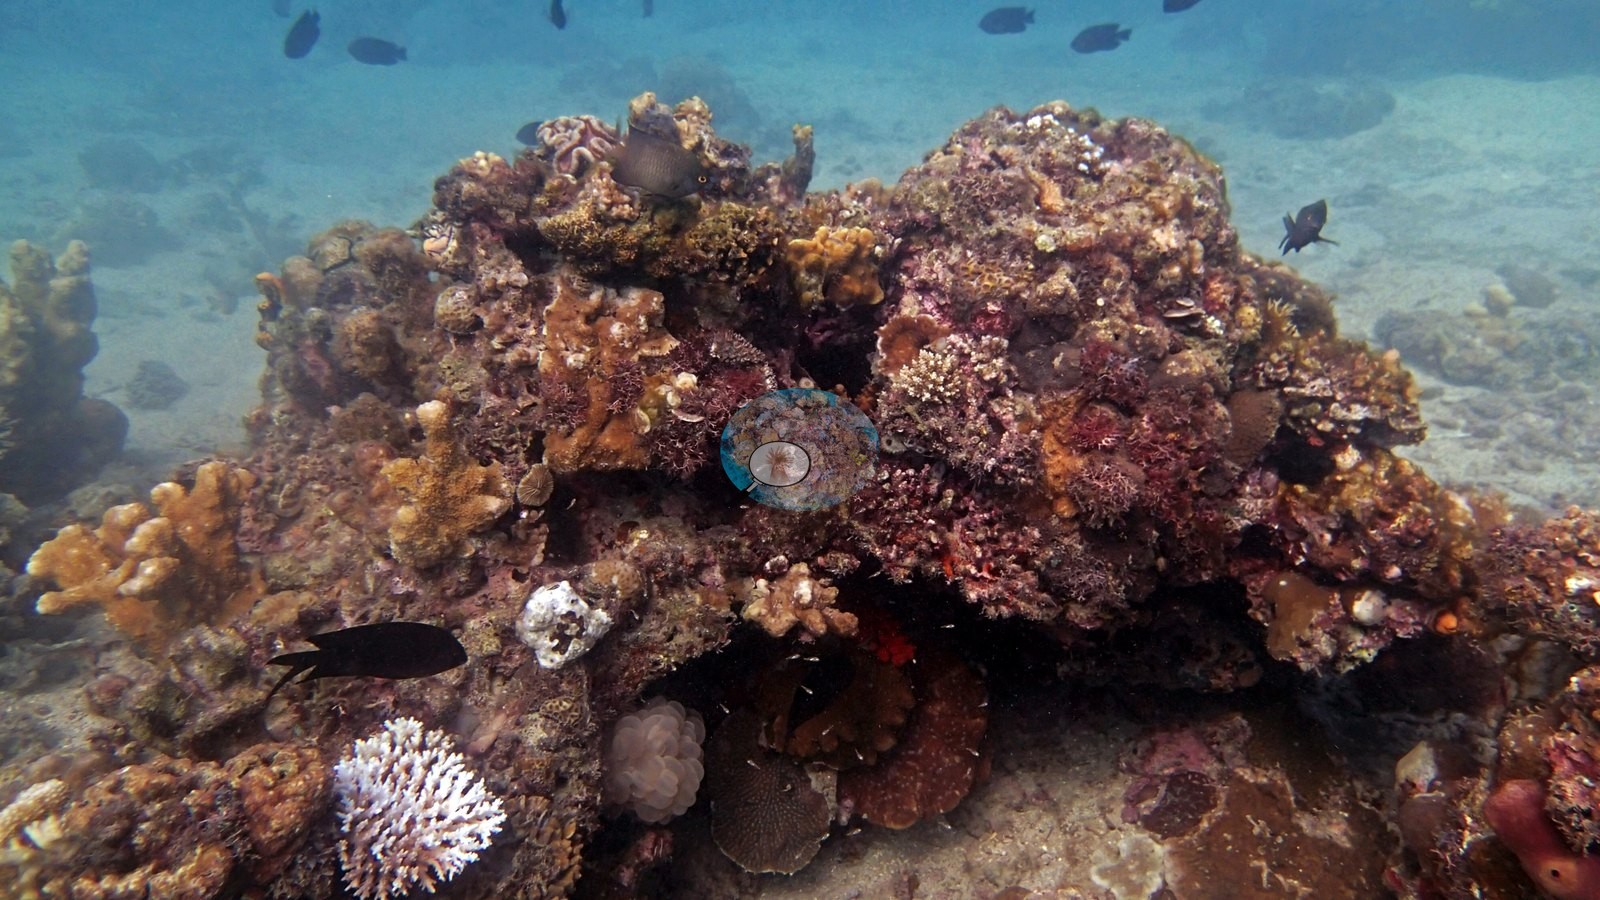
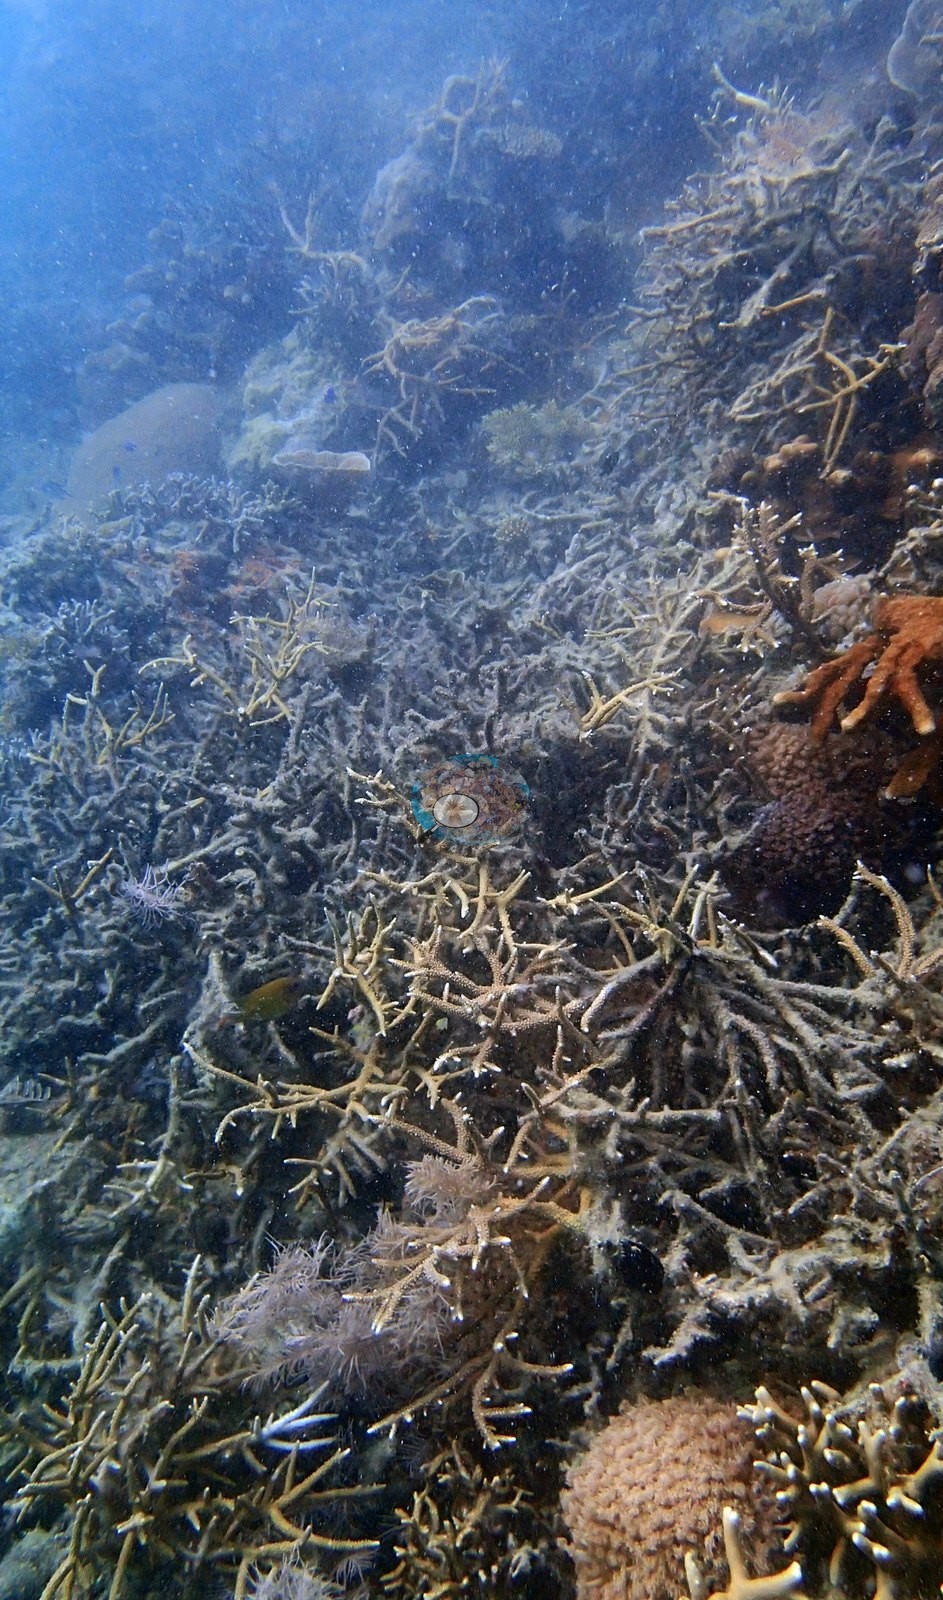
- Reef 1 near Port Barton town: extensive standing dead branching Acropora breaking to rubble, with small live recruits on the dead branches; one frame captioned 'pollution damaged reef'.
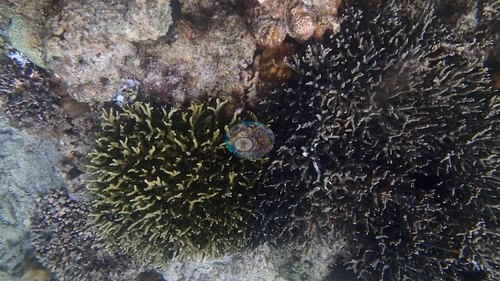 photo: Philippines - Port Barton, Palawan: Reef 1 (bay snorkel)
 - Two WWII wrecks at Coron, the Akikushima and Taiei Maru, colonized by Euphyllia, Plerogyra and foliose corals, and an intact Acropora table on a beam.
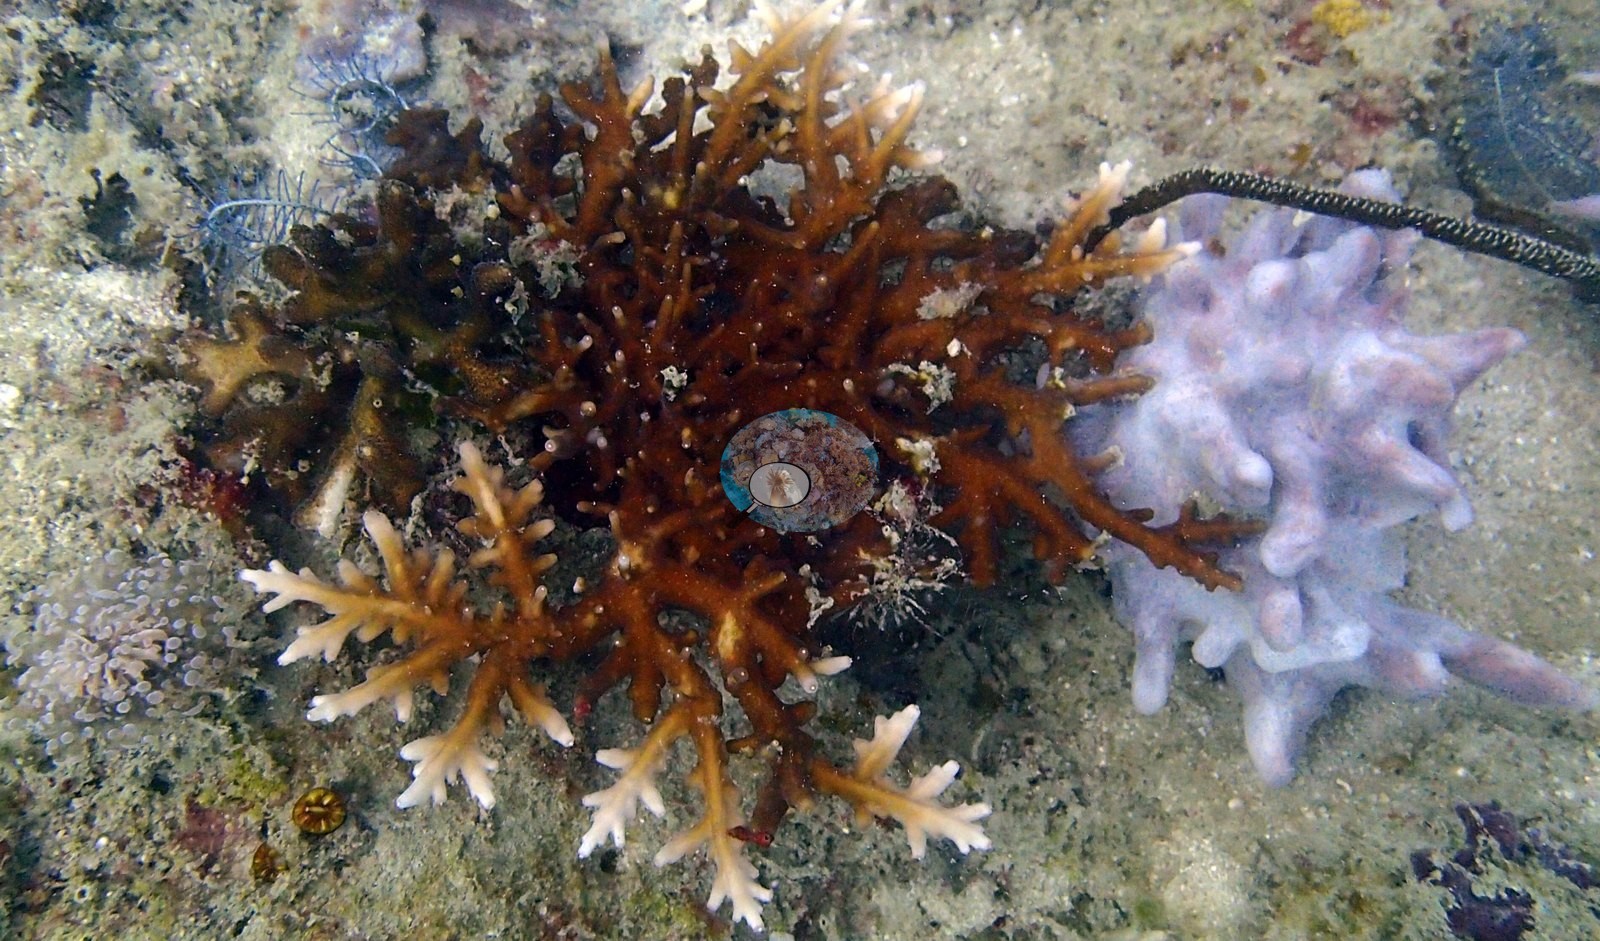
- A giant clam restocking garden across several size classes at the Dive and Trek sanctuary, and deployed coral settlement tiles at Monte Carlo Hotel.
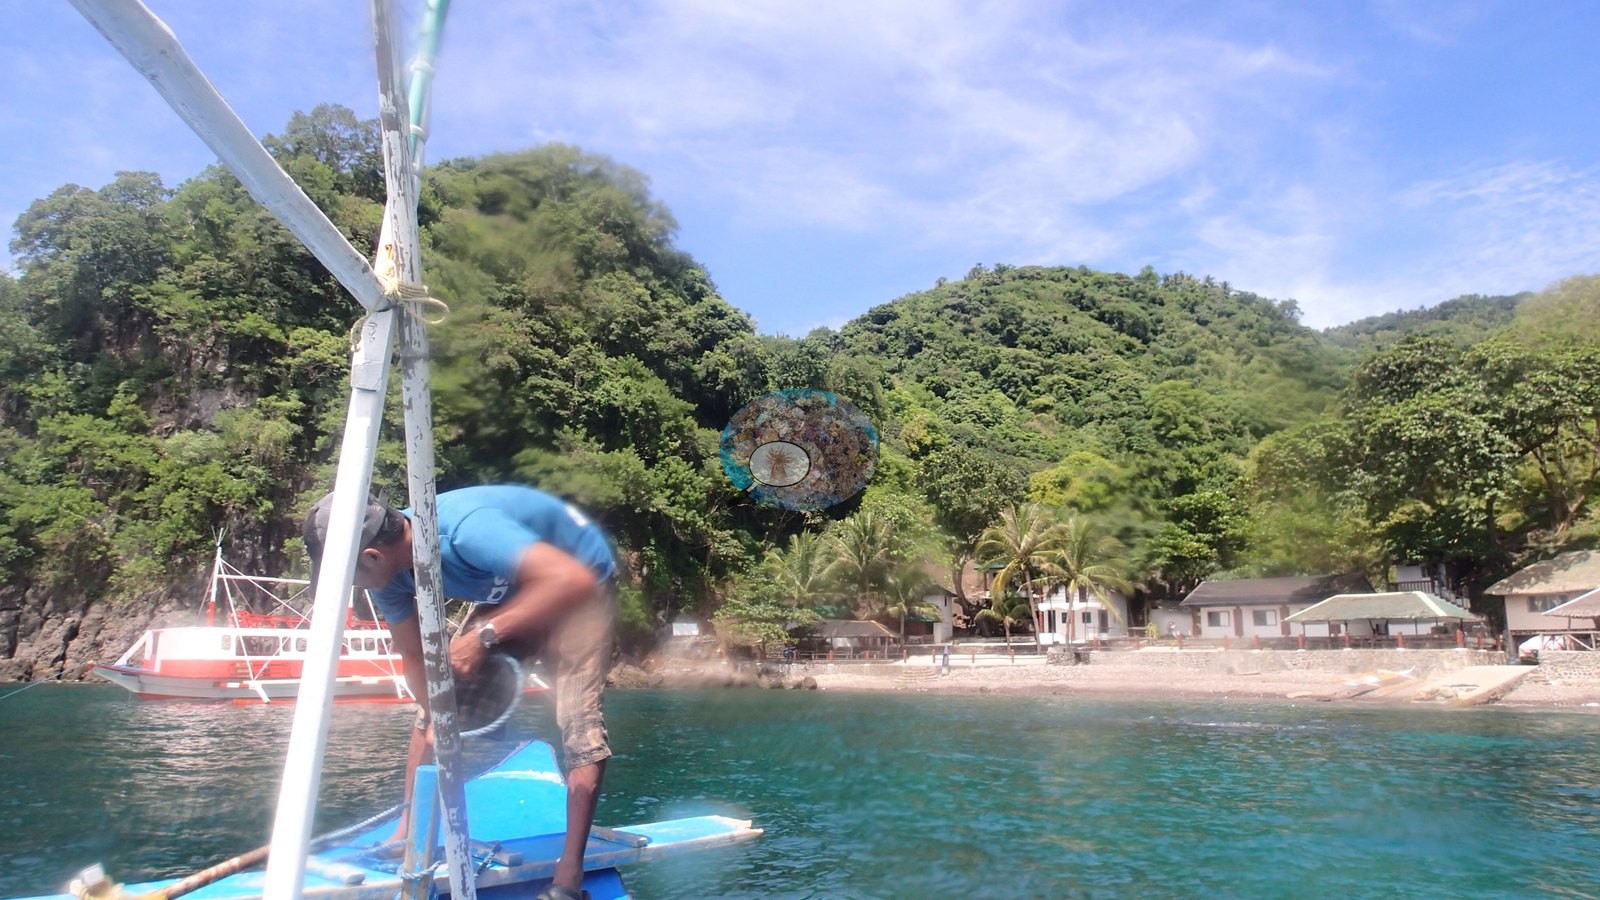
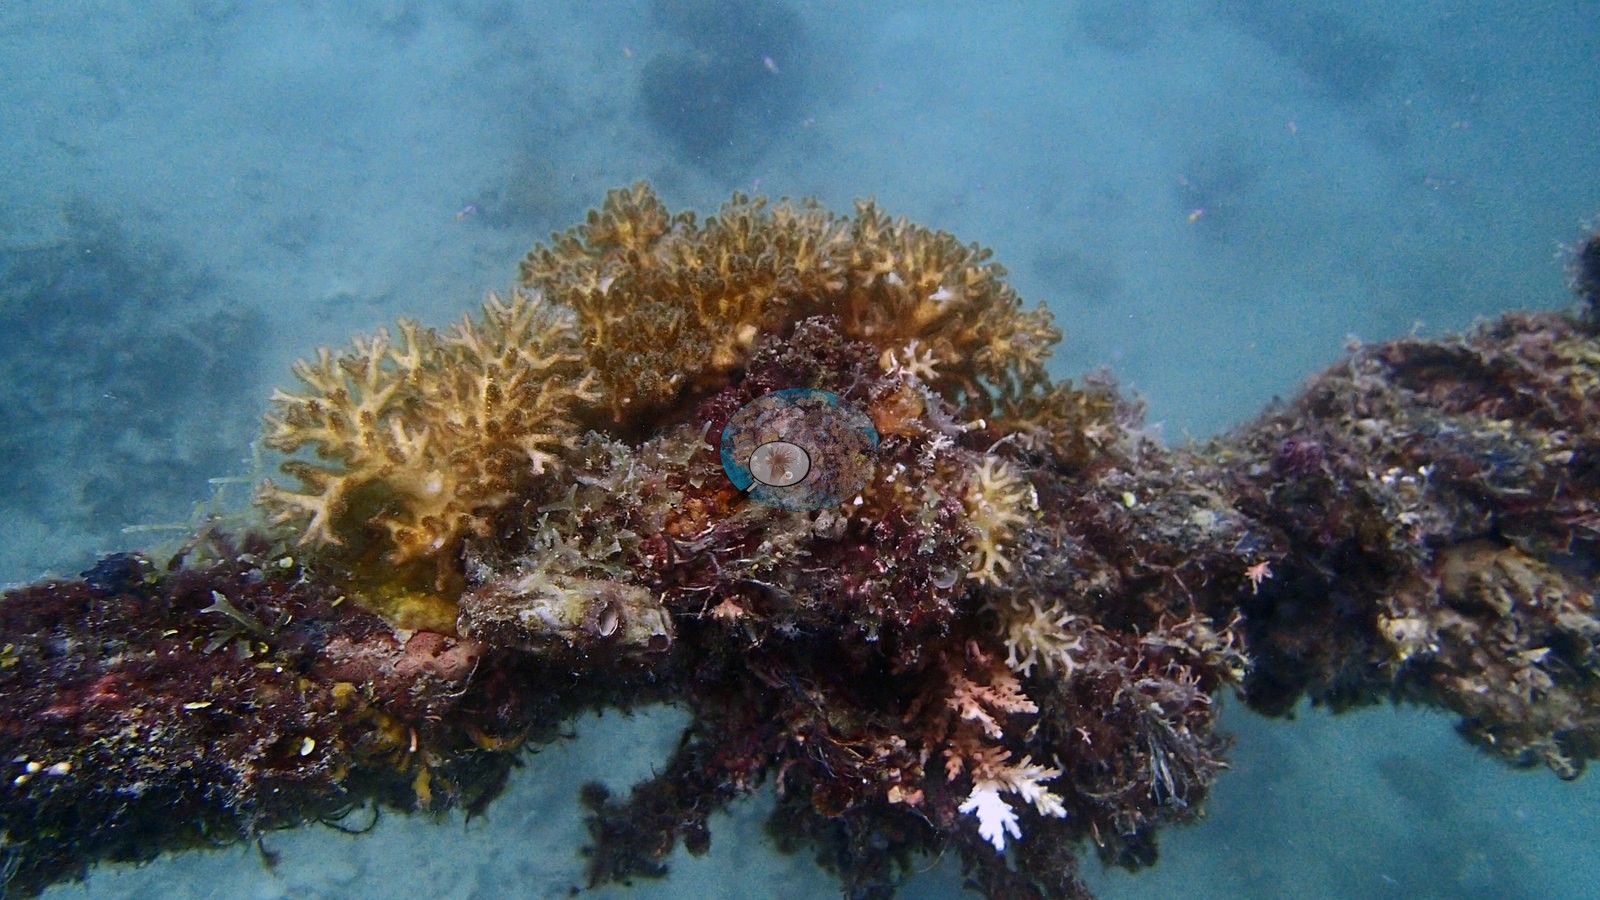
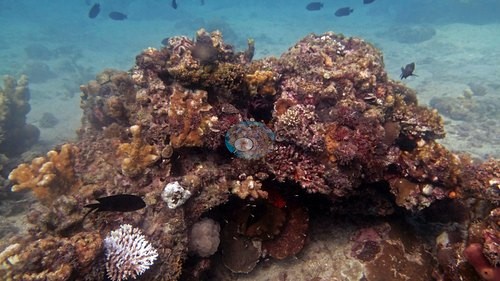 photo: Philippines - Anilao: Monte Carlo Hotel
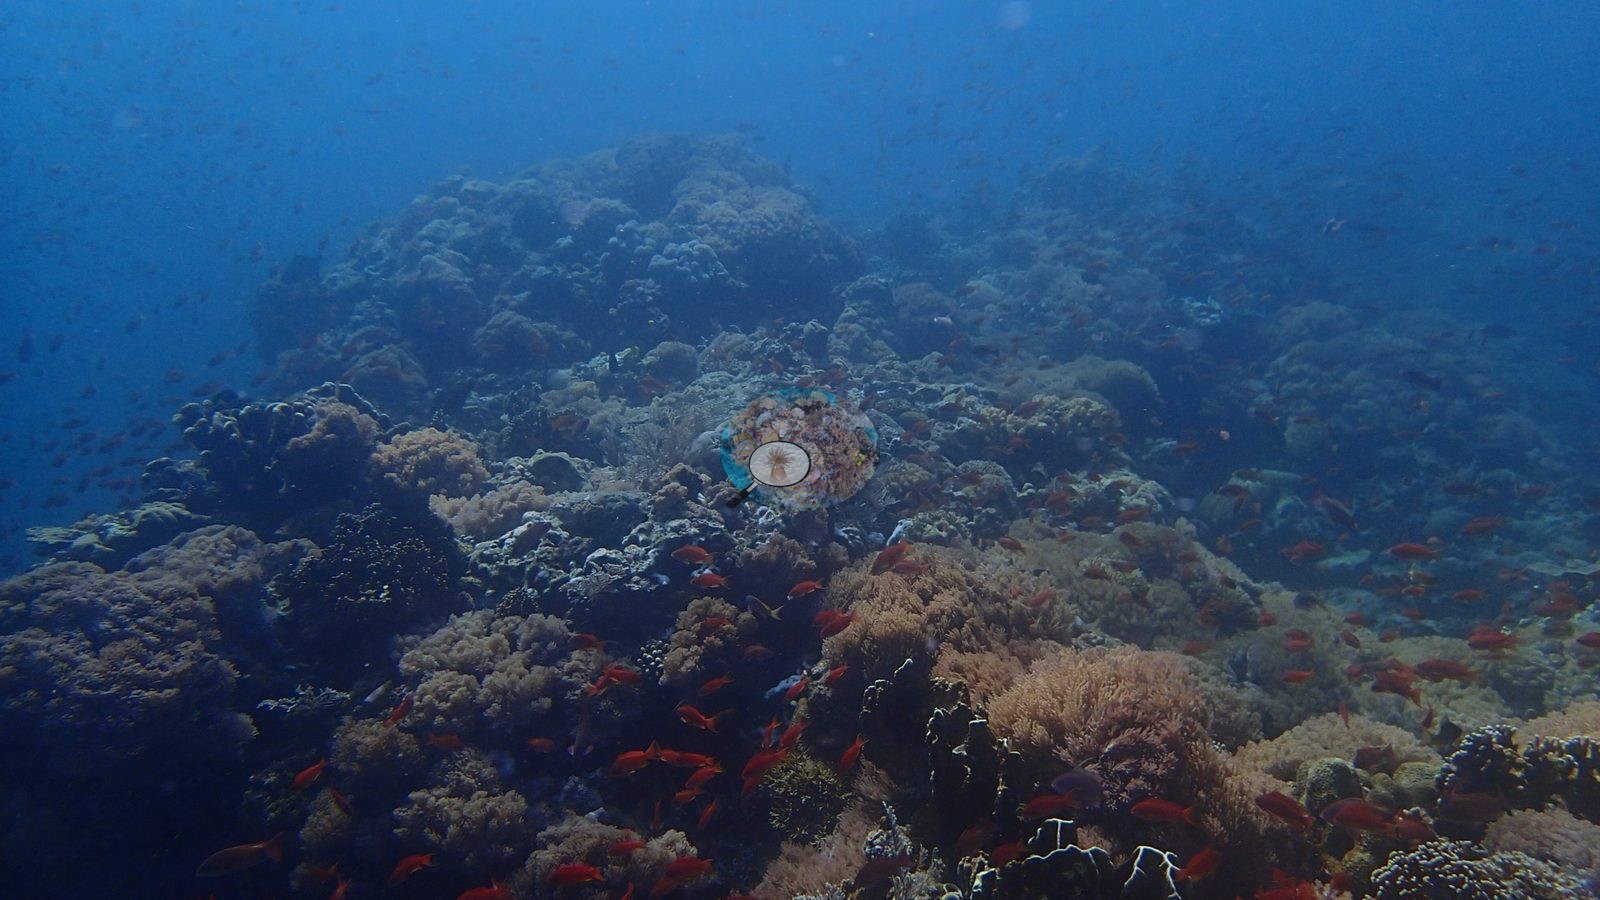
Notable observations (12)
- Philippines - Port Barton, Palawan: Reef 1 (bay snorkel): Old mortality: extensive standing dead branching Acropora, algal-colonized and breaking to rubble; one frame captioned 'pollution damaged reef' by Anderson. Small live recruits are growing on the dead branches.
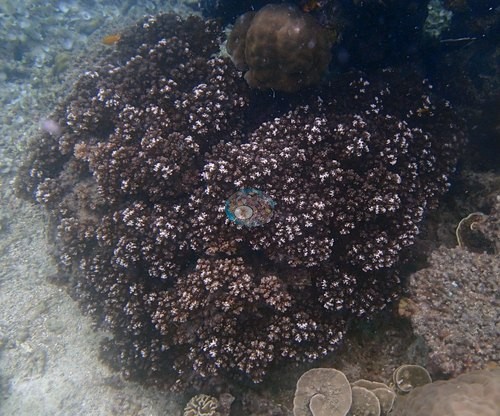
- Philippines - Anilao: Dive and Trek: Bleaching (localized): a stand of stark-white branching Acropora with architecture intact, indicating recent bleaching or very recent mortality; one large host anemone partially bleached.
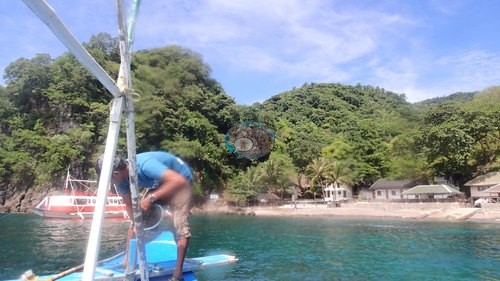
- Philippines - Anilao: Ligpo Island: Bleaching (localized): a host anemone carrying a conspicuous bleached white sector and one stark-white branching colony amid otherwise healthy growth; no site-wide signal.
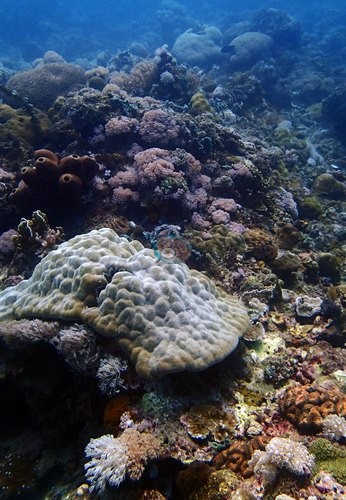
- Philippines - Anilao: Monte Carlo Hotel: Bleaching (single colony): one small branching colony with a chalk-white core and pigmented outer branches.
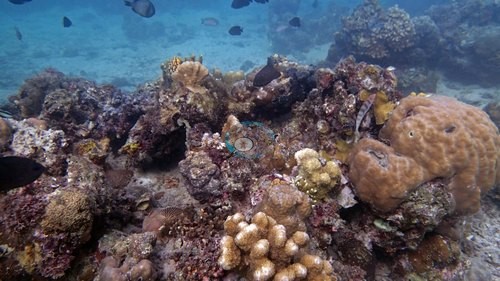
- Philippines - El Nido: Paglugaban Rocks (Bacuit Archipelago): Recent mortality: scattered stark-white patches on single colonies read as isolated recent-mortality spots, one large white plate consistent with recently dead skeleton, and broken branching framework; physical breakage, not disease, and no crown-of-thorns.
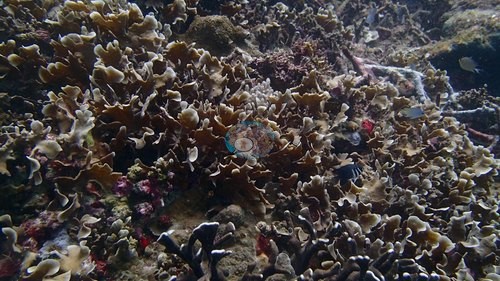
- Philippines - Coron: Coral Gardens, Busuanga: Localized white: four frames with a stark-white branch cluster, a pale lesion on one plate, two white pavement patches and one bare Acropora skeleton; no site-wide bleaching.
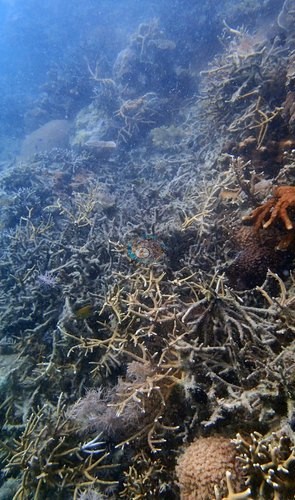
- Philippines - El Nido: Nat Nat (Bacuit Archipelago): A Seriatopora colony photographed and labeled dying; the lowest natural-reef index in Palawan at 17.2%.
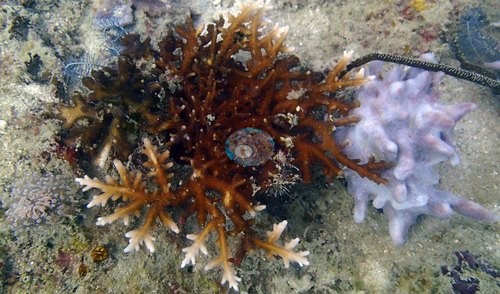
- Philippines - Port Barton, Palawan: island-hopping stop 2: Bleaching (single colony) and algal overgrowth: one small colony with partial, localized tissue bleaching, and fleshy brown macroalgae over rubble and dead framework, on the highest-index site in the set.
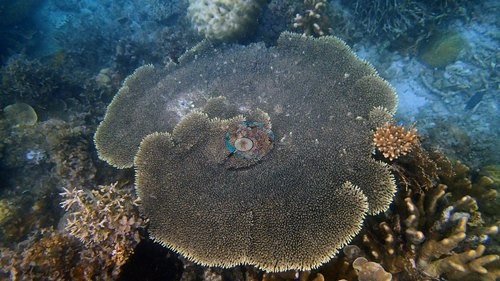
- Philippines - Port Barton, Palawan: Alberguin wreck: Paling: several colonies conspicuously pale (a cream pocilloporid, whitish Acropora, pale Favites); no lesions, tissue loss or crown-of-thorns.
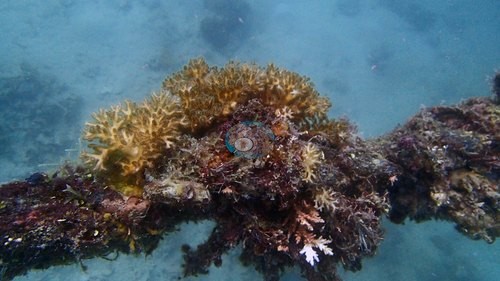
- Philippines - Alona Beach / Panglao (Bohol): Storm damage: tabular acroporids overturned at Arco Point by a strong typhoon about two months before the February 2013 dives (dive log).
- Philippines - Sipalay (Punta Ballo, Negros Occidental): Fishing: the area 'appears to have been severely over-fished', with very few large fish across either dive, despite pronounced spur-and-groove coral canyons (dive log).
- Philippines - Boracay: Nearshore 'algal bloom' / 'green algae!' over the shallow sand shelf off White Beach (Anderson's labels), a beachfront observation rather than the offshore reef. The Visayas page asks for this flag to be confirmed or dropped, because Anderson stated on 2026-09-17 that he has no Boracay photos.
Coral cover over time (pooled)
Sites in this region (26)
- Philippines - Alona Beach / Panglao (Bohol)
- Philippines - Anilao: Anilao Scuba Dive Center house reef (night dive)
- Philippines - Anilao: Dive and Trek — 29% coral cover
- Philippines - Anilao: Ligpo Island — 28% coral cover
- Philippines - Anilao: Monte Carlo Hotel — 22% coral cover
- Philippines - Apo Island (Negros)
- Philippines - Boracay
- Philippines - Cebu (Moalboal)
- Philippines - Coron: Akikushima (seaplane tender wreck), Busuanga — 18% coral cover
- Philippines - Coron: Coral Gardens, Busuanga — 31% coral cover
- Philippines - Coron: Green Lagoon (island-hopping snorkel) — 36% coral cover
- Philippines - Coron: Taiei Maru (oil tanker wreck), Busuanga — 15% coral cover
- Philippines - Coron: Twin Lagoon (island-hopping snorkel) — 23% coral cover
- Philippines - El Nido: Abdens (Bacuit Archipelago) — 18% coral cover
- Philippines - El Nido: Nat Nat (Bacuit Archipelago) — 17% coral cover
- Philippines - El Nido: Paglugaban Rocks (Bacuit Archipelago) — 29% coral cover
- Philippines - Mactan Island (Cebu)
- Philippines - Pescador Island (Moalboal, Cebu)
- Philippines - Port Barton, Palawan: Alberguin wreck — 29% coral cover
- Philippines - Port Barton, Palawan: island-hopping stop 1 (San Miguel area) — 38% coral cover
- Philippines - Port Barton, Palawan: island-hopping stop 2 — 43% coral cover
- Philippines - Port Barton, Palawan: Reef 1 (bay snorkel) — 39% coral cover
- Philippines - Sipalay (Punta Ballo, Negros Occidental)
- Philippines - Verde Island Passage: Beatriz Island (Beatrice Rock) — 19% coral cover
- Philippines - Verde Island Passage: Kirby's Rock — 26% coral cover
- Philippines - Verde Island Passage: Sombrero Island — 26% coral cover
Nearby external survey stations
149 independent survey records within 5 km of a site in this region (deduplicated across sites).
Show all 149 records
- Reef Check — 7th Comando Outside (2013): 4.4% hard coral cover, 1.65 km from Philippines - El Nido: Nat Nat (Bacuit Archipelago)
- Reef Check — 7th Comando Outside (2014): 7.5% hard coral cover, 1.65 km from Philippines - El Nido: Nat Nat (Bacuit Archipelago)
- Reef Check — 7th Comando Outside (2014): 5.9% hard coral cover, 1.65 km from Philippines - El Nido: Nat Nat (Bacuit Archipelago)
- Reef Check — Abdeen's Rock (2013): 42% hard coral cover, 2.69 km from Philippines - El Nido: Abdens (Bacuit Archipelago)
- Reef Check — Abdeen's Rock (2014): 61% hard coral cover, 2.69 km from Philippines - El Nido: Abdens (Bacuit Archipelago)
- Reef Check — Acacia Resort and Dive Center (2010): 58% hard coral cover, 4.05 km from Philippines - Anilao: Monte Carlo Hotel
- Reef Check — Acacia Resort and Dive Center (2012): 56% hard coral cover, 4.05 km from Philippines - Anilao: Monte Carlo Hotel
- Reef Check — Acacia Resort and Dive Center (2014): 56% hard coral cover, 4.05 km from Philippines - Anilao: Monte Carlo Hotel
- Reef Check — Acacia Resort and Dive Center (2017): 49% hard coral cover, 4.05 km from Philippines - Anilao: Monte Carlo Hotel
- Reef Check — Agus (2006): 18% hard coral cover, 3.13 km from Philippines - Mactan Island (Cebu)
- Reef Check — Agus (2007): 25% hard coral cover, 3.13 km from Philippines - Mactan Island (Cebu)
- Reef Check — Albaguen Island (1998): 24% hard coral cover, 1.40 km from Philippines - Port Barton, Palawan: Alberguin wreck
- Reef Check — Amores Beach Resort (2003): 27% hard coral cover, 4.28 km from Philippines - Mactan Island (Cebu)
- Reef Check — Apo Island Marine Reserve (1998): 61% hard coral cover, 0.18 km from Philippines - Apo Island (Negros)
- Reef Check — Apo Island Marine Reserve (1998): 34% hard coral cover, 0.18 km from Philippines - Apo Island (Negros)
- Reef Check — Apo Island Marine Reserve (1999): 43% hard coral cover, 0.18 km from Philippines - Apo Island (Negros)
- Reef Check — Apo Island Marine Reserve (2000): 35% hard coral cover, 0.18 km from Philippines - Apo Island (Negros)
- Reef Check — Apo Island Marine Reserve (2000): 44% hard coral cover, 0.29 km from Philippines - Apo Island (Negros)
- Reef Check — Apo Island Marine Reserve (2001): 12% hard coral cover, 0.18 km from Philippines - Apo Island (Negros)
- Reef Check — Apo Island Marine Reserve (2002): 29% hard coral cover, 0.18 km from Philippines - Apo Island (Negros)
- Reef Check — Apo Island Marine Reserve (2003): 50% hard coral cover, 0.18 km from Philippines - Apo Island (Negros)
- Reef Check — Arthur's Rock (2013): 36% hard coral cover, 1.78 km from Philippines - Anilao: Monte Carlo Hotel
- Reef Check — Bagalangit Koala (2010): 70% hard coral cover, 2.02 km from Philippines - Anilao: Monte Carlo Hotel
- Reef Check — Balabag Reef (2013): 18% hard coral cover, 1.55 km from Philippines - Boracay
- Reef Check — Balinghai Reef (2016): 50% hard coral cover, 2.22 km from Philippines - Boracay
- Reef Check — Banlot Tongo Basdiot (2005): 20% hard coral cover, 1.69 km from Philippines - Cebu (Moalboal)
- Reef Check — Banlot Tongo Basdiot (2005): 19% hard coral cover, 1.69 km from Philippines - Cebu (Moalboal)
- Reef Check — Banlot Tongo Basdiot (2007): 17% hard coral cover, 1.69 km from Philippines - Cebu (Moalboal)
- Reef Check — Barangay Talima 2 (2002): 17% hard coral cover, 3.43 km from Philippines - Mactan Island (Cebu)
- Reef Check — Baring (2004): 12% hard coral cover, 4.48 km from Philippines - Mactan Island (Cebu)
- Reef Check — Baring (2005): 13% hard coral cover, 4.48 km from Philippines - Mactan Island (Cebu)
- Reef Check — Baring (2006): 10% hard coral cover, 4.48 km from Philippines - Mactan Island (Cebu)
- Reef Check — Baring (2007): 11% hard coral cover, 4.48 km from Philippines - Mactan Island (Cebu)
- Reef Check — Baring, Olango Island (2004): 5.6% hard coral cover, 4.56 km from Philippines - Mactan Island (Cebu)
- Reef Check — Basdiot (North) (2006): 56% hard coral cover, 2.18 km from Philippines - Cebu (Moalboal)
- Reef Check — Basdiot (North) (2007): 51% hard coral cover, 2.28 km from Philippines - Cebu (Moalboal)
- Reef Check — Blue Water (2002): 36% hard coral cover, 2.24 km from Philippines - Mactan Island (Cebu)
- Reef Check — Blue Water (2003): 32% hard coral cover, 2.24 km from Philippines - Mactan Island (Cebu)
- Reef Check — Blue Water (2017): 11% hard coral cover, 2.24 km from Philippines - Mactan Island (Cebu)
- Reef Check — Bukal (2013): 34% hard coral cover, 2.60 km from Philippines - El Nido: Nat Nat (Bacuit Archipelago)
- Reef Check — Bukal (2014): 34% hard coral cover, 2.60 km from Philippines - El Nido: Nat Nat (Bacuit Archipelago)
- Reef Check — Buyong (2002): 33% hard coral cover, 2.18 km from Philippines - Mactan Island (Cebu)
- Reef Check — Buyong (2003): 40% hard coral cover, 2.55 km from Philippines - Mactan Island (Cebu)
- Reef Check — Buyong (2004): 24% hard coral cover, 2.55 km from Philippines - Mactan Island (Cebu)
- Reef Check — Buyong (2006): 29% hard coral cover, 2.55 km from Philippines - Mactan Island (Cebu)
- Reef Check — Buyong (2007): 42% hard coral cover, 2.55 km from Philippines - Mactan Island (Cebu)
- Reef Check — CYC East Reef (2013): 73% hard coral cover, 3.30 km from Philippines - Coron: Green Lagoon (island-hopping snorkel)
- Reef Check — CYC East Reef (2014): 50% hard coral cover, 3.30 km from Philippines - Coron: Green Lagoon (island-hopping snorkel)
- Reef Check — CYC East Reef (2015): 34% hard coral cover, 3.30 km from Philippines - Coron: Green Lagoon (island-hopping snorkel)
- Reef Check — CYC West Reef (2013): 66% hard coral cover, 3.59 km from Philippines - Coron: Green Lagoon (island-hopping snorkel)
- Reef Check — CYC West Reef (2014): 30% hard coral cover, 3.59 km from Philippines - Coron: Green Lagoon (island-hopping snorkel)
- Reef Check — CYC West Reef (2015): 28% hard coral cover, 3.59 km from Philippines - Coron: Green Lagoon (island-hopping snorkel)
- Reef Check — Caalan marine protected area (MPA) A (2013): 36% hard coral cover, 1.79 km from Philippines - El Nido: Nat Nat (Bacuit Archipelago)
- Reef Check — Caalan MPA A (2013): 42% hard coral cover, 1.79 km from Philippines - El Nido: Nat Nat (Bacuit Archipelago)
- Reef Check — Caalan MPA A (2014): 49% hard coral cover, 1.79 km from Philippines - El Nido: Nat Nat (Bacuit Archipelago)
- Reef Check — Caalan MPA B (2013): 45% hard coral cover, 1.27 km from Philippines - El Nido: Nat Nat (Bacuit Archipelago)
- Reef Check — Caalan MPA B (2014): 29% hard coral cover, 1.27 km from Philippines - El Nido: Nat Nat (Bacuit Archipelago)
- Reef Check — Caalan MPA B (2014): 37% hard coral cover, 1.27 km from Philippines - El Nido: Nat Nat (Bacuit Archipelago)
- Reef Check — Coral Reef Resort (Barangay Agus) (2003): 24% hard coral cover, 3.34 km from Philippines - Mactan Island (Cebu)
- Reef Check — Costabella (2002): 27% hard coral cover, 2.17 km from Philippines - Mactan Island (Cebu)
- Reef Check — Dive and Trek Marine Sanctuary (2014): 70% hard coral cover, 2.22 km from Philippines - Anilao: Ligpo Island
- Reef Check — Exotic Island (2019): 33% hard coral cover, 0.90 km from Philippines - Port Barton, Palawan: Alberguin wreck
- Reef Check — German Island (2019): 16% hard coral cover, 4.05 km from Philippines - Port Barton, Palawan: Alberguin wreck
- Reef Check — Hilton (2006): 7.2% hard coral cover, 4.49 km from Philippines - Mactan Island (Cebu)
- Reef Check — Hilton (2007): 15% hard coral cover, 4.49 km from Philippines - Mactan Island (Cebu)
- Reef Check — Inner Layag Layag Reef (2014): 64% hard coral cover, 1.72 km from Philippines - Verde Island Passage: Sombrero Island
- Reef Check — Inner Layag Layag Reef (2014): 64% hard coral cover, 1.72 km from Philippines - Verde Island Passage: Sombrero Island
- Reef Check — Inside Talima MPA Site 1 (2004): 9.4% hard coral cover, 3.50 km from Philippines - Mactan Island (Cebu)
- Reef Check — Inside Talima MPA Site 1 (2005): 11% hard coral cover, 3.50 km from Philippines - Mactan Island (Cebu)
- Reef Check — Inside Talima MPA Site 2 (2004): 14% hard coral cover, 3.69 km from Philippines - Mactan Island (Cebu)
- Reef Check — Inside Talima MPA Site 2 (2005): 11% hard coral cover, 3.69 km from Philippines - Mactan Island (Cebu)
- Reef Check — Ipil MPA (Inside) Brgy. Buena Suerte (2013): 22% hard coral cover, 1.26 km from Philippines - El Nido: Nat Nat (Bacuit Archipelago)
- Reef Check — Ipil MPA (Inside) Brgy. Buena Suerte (2013): 23% hard coral cover, 1.26 km from Philippines - El Nido: Nat Nat (Bacuit Archipelago)
- Reef Check — Ipil MPA (Inside) Brgy. Buena Suerte (2014): 24% hard coral cover, 1.26 km from Philippines - El Nido: Nat Nat (Bacuit Archipelago)
- Reef Check — Kalingaw Beach Resort (Barangay Marigondon) (2003): 33% hard coral cover, 3.95 km from Philippines - Mactan Island (Cebu)
- Reef Check — Koala, Bagalangit (2010): 70% hard coral cover, 2.40 km from Philippines - Anilao: Monte Carlo Hotel
- Reef Check — Koala, Bagalangit (2011): 72% hard coral cover, 2.40 km from Philippines - Anilao: Monte Carlo Hotel
- Reef Check — Koala, Bagalangit (2013): 60% hard coral cover, 2.40 km from Philippines - Anilao: Monte Carlo Hotel
- Reef Check — Koala, Bagalangit (2017): 39% hard coral cover, 2.40 km from Philippines - Anilao: Monte Carlo Hotel
- Reef Check — Kontiki (2002): 42% hard coral cover, 2.58 km from Philippines - Mactan Island (Cebu)
- Reef Check — Kontiki (2003): 30% hard coral cover, 2.79 km from Philippines - Mactan Island (Cebu)
- Reef Check — Kontiki (2004): 33% hard coral cover, 2.79 km from Philippines - Mactan Island (Cebu)
- Reef Check — Kontiki (2005): 23% hard coral cover, 2.79 km from Philippines - Mactan Island (Cebu)
- Reef Check — Kontiki (2006): 21% hard coral cover, 2.79 km from Philippines - Mactan Island (Cebu)
- Reef Check — Kontiki (2007): 32% hard coral cover, 2.79 km from Philippines - Mactan Island (Cebu)
- Reef Check — Ligaya Bantong Buhay MPA (2017): 56% hard coral cover, 3.50 km from Philippines - Anilao: Monte Carlo Hotel
- Reef Check — Maitre MPA (Inside) (2013): 28% hard coral cover, 4.86 km from Philippines - El Nido: Nat Nat (Bacuit Archipelago)
- Reef Check — Maitre MPA (Inside) (2014): 33% hard coral cover, 4.86 km from Philippines - El Nido: Nat Nat (Bacuit Archipelago)
- Reef Check — Maitre MPA (Inside) (2015): 24% hard coral cover, 4.86 km from Philippines - El Nido: Nat Nat (Bacuit Archipelago)
- Reef Check — Mantaray Reef (1998): 34% hard coral cover, 3.91 km from Philippines - Port Barton, Palawan: Alberguin wreck
- Reef Check — Maribago Bluewater USC Site (2004): 37% hard coral cover, 2.37 km from Philippines - Mactan Island (Cebu)
- Reef Check — Marigondon (2007): 9.7% hard coral cover, 4.27 km from Philippines - Mactan Island (Cebu)
- Reef Check — Palm Beach Resort (2003): 34% hard coral cover, 3.86 km from Philippines - Mactan Island (Cebu)
- Reef Check — Paraiso Reef (1998): 31% hard coral cover, 0.88 km from Philippines - Port Barton, Palawan: Alberguin wreck
- Reef Check — Parker Resort (2003): 36% hard coral cover, 4.54 km from Philippines - Mactan Island (Cebu)
- Reef Check — Pescador SE (2012): 32% hard coral cover, 2.90 km from Philippines - Pescador Island (Moalboal, Cebu)
- Reef Check — Poblacion East (2005): 29% hard coral cover, 2.50 km from Philippines - Cebu (Moalboal)
- Reef Check — Poblacion East (2006): 28% hard coral cover, 2.50 km from Philippines - Cebu (Moalboal)
- Reef Check — Poblacion East (2007): 32% hard coral cover, 1.91 km from Philippines - Cebu (Moalboal)
- Reef Check — Poblacion West (2005): 21% hard coral cover, 1.98 km from Philippines - Cebu (Moalboal)
- Reef Check — Poblacion West (2006): 21% hard coral cover, 2.91 km from Philippines - Pescador Island (Moalboal, Cebu)
- Reef Check — Poblacion West (2007): 38% hard coral cover, 2.54 km from Philippines - Cebu (Moalboal)
- Reef Check — Portulano Marine Sanctuary (2014): 57% hard coral cover, 1.10 km from Philippines - Anilao: Ligpo Island
- Reef Check — Riddle Point (2018): 22% hard coral cover, 1.24 km from Philippines - Port Barton, Palawan: Alberguin wreck
- Reef Check — Saavedra Site 1 (2005): 44% hard coral cover, 2.81 km from Philippines - Cebu (Moalboal)
- Reef Check — Saavedra Site 2 (2005): 41% hard coral cover, 2.82 km from Philippines - Cebu (Moalboal)
- Reef Check — San Teodoro (2010): 27% hard coral cover, 1.76 km from Philippines - Anilao: Monte Carlo Hotel
- Reef Check — San Vicente (2006): 8.8% hard coral cover, 1.63 km from Philippines - Mactan Island (Cebu)
- Reef Check — San Vicente (2006): 24% hard coral cover, 1.63 km from Philippines - Mactan Island (Cebu)
- Reef Check — San Vicente (2007): 31% hard coral cover, 1.63 km from Philippines - Mactan Island (Cebu)
- Reef Check — San Vicente Site 1 (2003): 17% hard coral cover, 1.48 km from Philippines - Mactan Island (Cebu)
- Reef Check — San Vicente Site 2 (2003): 49% hard coral cover, 2.03 km from Philippines - Mactan Island (Cebu)
- Reef Check — Shangri-La (2003): 15% hard coral cover, 4.11 km from Philippines - Mactan Island (Cebu)
- Reef Check — Shangri-La (2004): 19% hard coral cover, 4.11 km from Philippines - Mactan Island (Cebu)
- Reef Check — Shangri-La (2006): 9.7% hard coral cover, 4.11 km from Philippines - Mactan Island (Cebu)
- Reef Check — Shangri-La (2007): 26% hard coral cover, 4.11 km from Philippines - Mactan Island (Cebu)
- Reef Check — Shangri-La Hotel Cebu, Marine Sanctuary (2017): 20% hard coral cover, 4.65 km from Philippines - Mactan Island (Cebu)
- Reef Check — Siete Pecados Islands (2004): 46% hard coral cover, 2.99 km from Philippines - Coron: Coral Gardens, Busuanga
- Reef Check — Sta. Rosa (2006): 2.8% hard coral cover, 1.84 km from Philippines - Mactan Island (Cebu)
- Reef Check — Sta. Rosa (2007): 4.4% hard coral cover, 1.84 km from Philippines - Mactan Island (Cebu)
- Reef Check — Sta. Rosa (2007): 3.6% hard coral cover, 1.84 km from Philippines - Mactan Island (Cebu)
- Reef Check — Talima (2006): 13% hard coral cover, 3.37 km from Philippines - Mactan Island (Cebu)
- Reef Check — Talima (2007): 9.4% hard coral cover, 3.49 km from Philippines - Mactan Island (Cebu)
- Reef Check — Talima D1 (2003): 7.5% hard coral cover, 3.43 km from Philippines - Mactan Island (Cebu)
- Reef Check — Talima D1 (2004): 15% hard coral cover, 3.43 km from Philippines - Mactan Island (Cebu)
- Reef Check — Talima Marine Sanctuary (2006): 11% hard coral cover, 3.94 km from Philippines - Mactan Island (Cebu)
- Reef Check — Tambuli (2002): 17% hard coral cover, 2.42 km from Philippines - Mactan Island (Cebu)
- Reef Check — Tambuli (2003): 21% hard coral cover, 2.42 km from Philippines - Mactan Island (Cebu)
- Reef Check — Tambuli (2004): 10% hard coral cover, 2.55 km from Philippines - Mactan Island (Cebu)
- Reef Check — Tambuli (2005): 12% hard coral cover, 2.55 km from Philippines - Mactan Island (Cebu)
- Reef Check — Tambuli (2006): 13% hard coral cover, 2.55 km from Philippines - Mactan Island (Cebu)
- Reef Check — Tambuli (2017): 17% hard coral cover, 2.42 km from Philippines - Mactan Island (Cebu)
- Reef Check — Tambuli Reef (2001): 27% hard coral cover, 2.42 km from Philippines - Mactan Island (Cebu)
- Reef Check — Tingloy - Poblacion Reef (2014): 89% hard coral cover, 2.40 km from Philippines - Verde Island Passage: Beatriz Island (Beatrice Rock)
- Reef Check — Tingo (2006): 7.8% hard coral cover, 4.12 km from Philippines - Mactan Island (Cebu)
- Reef Check — Tomonoy (2005): 14% hard coral cover, 3.45 km from Philippines - Cebu (Moalboal)
- Reef Check — Tomonoy (2006): 23% hard coral cover, 3.45 km from Philippines - Cebu (Moalboal)
- Reef Check — Tomonoy (2007): 31% hard coral cover, 3.45 km from Philippines - Cebu (Moalboal)
- Reef Check — Tongo (2006): 12% hard coral cover, 1.91 km from Philippines - Cebu (Moalboal)
- Reef Check — Twin Rocks (2010): 20% hard coral cover, 2.96 km from Philippines - Anilao: Anilao Scuba Dive Center house reef (night dive)
- Reef Check — Twin Rocks (2011): 34% hard coral cover, 2.96 km from Philippines - Anilao: Anilao Scuba Dive Center house reef (night dive)
- Reef Check — Twin Rocks (2014): 30% hard coral cover, 2.96 km from Philippines - Anilao: Anilao Scuba Dive Center house reef (night dive)
- Reef Check — Twin Rocks (2017): 19% hard coral cover, 2.96 km from Philippines - Anilao: Anilao Scuba Dive Center house reef (night dive)
- Reef Check — VISTAMAR Resort (2006): 31% hard coral cover, 3.28 km from Philippines - Mactan Island (Cebu)
- Reef Check — VISTAMAR Resort (2017): 19% hard coral cover, 3.28 km from Philippines - Mactan Island (Cebu)
- Reef Check — Vistamar (2006): 8.4% hard coral cover, 3.34 km from Philippines - Mactan Island (Cebu)
- Reef Check — Vistamar (2007): 11% hard coral cover, 3.34 km from Philippines - Mactan Island (Cebu)
- Reef Check — Vistamar Area (2003): 8.1% hard coral cover, 3.08 km from Philippines - Mactan Island (Cebu)
- WCS Philippines via MERMAID* — Katipanan Reef (2023): 14% hard coral cover, 0.60 km from Philippines - Apo Island (Negros)
All images from Coral Reef Diagnostics. Data are from Coral Reef Diagnostics and Reef Check Foundation.
© Coral Reef Diagnostics.