
Philippines - El Nido: Nat Nat (Bacuit Archipelago)

Part of the regional summaries: Philippines - Palawan and Philippines
More info
Western Philippines (NOAA CRW virtual station) · Palawan/North Borneo ecoregion mean=4.0°C-heating weeksA murky, rough-conditions dive at Nat turned up an uncommon Anacropora colony and a large pale Plerogyra bubble coral, but the clearest condition note is a Seriatopora colony photographed and labeled dying. Cover estimates disagree, roughly 15-19%, averaging 17%.
Six independent survey stations shown with the program’s logo — click one to see how far it is from this site.
18 of these 50 photographs are shown beside the text that discusses them under "Site description" below.
Site description
Setting
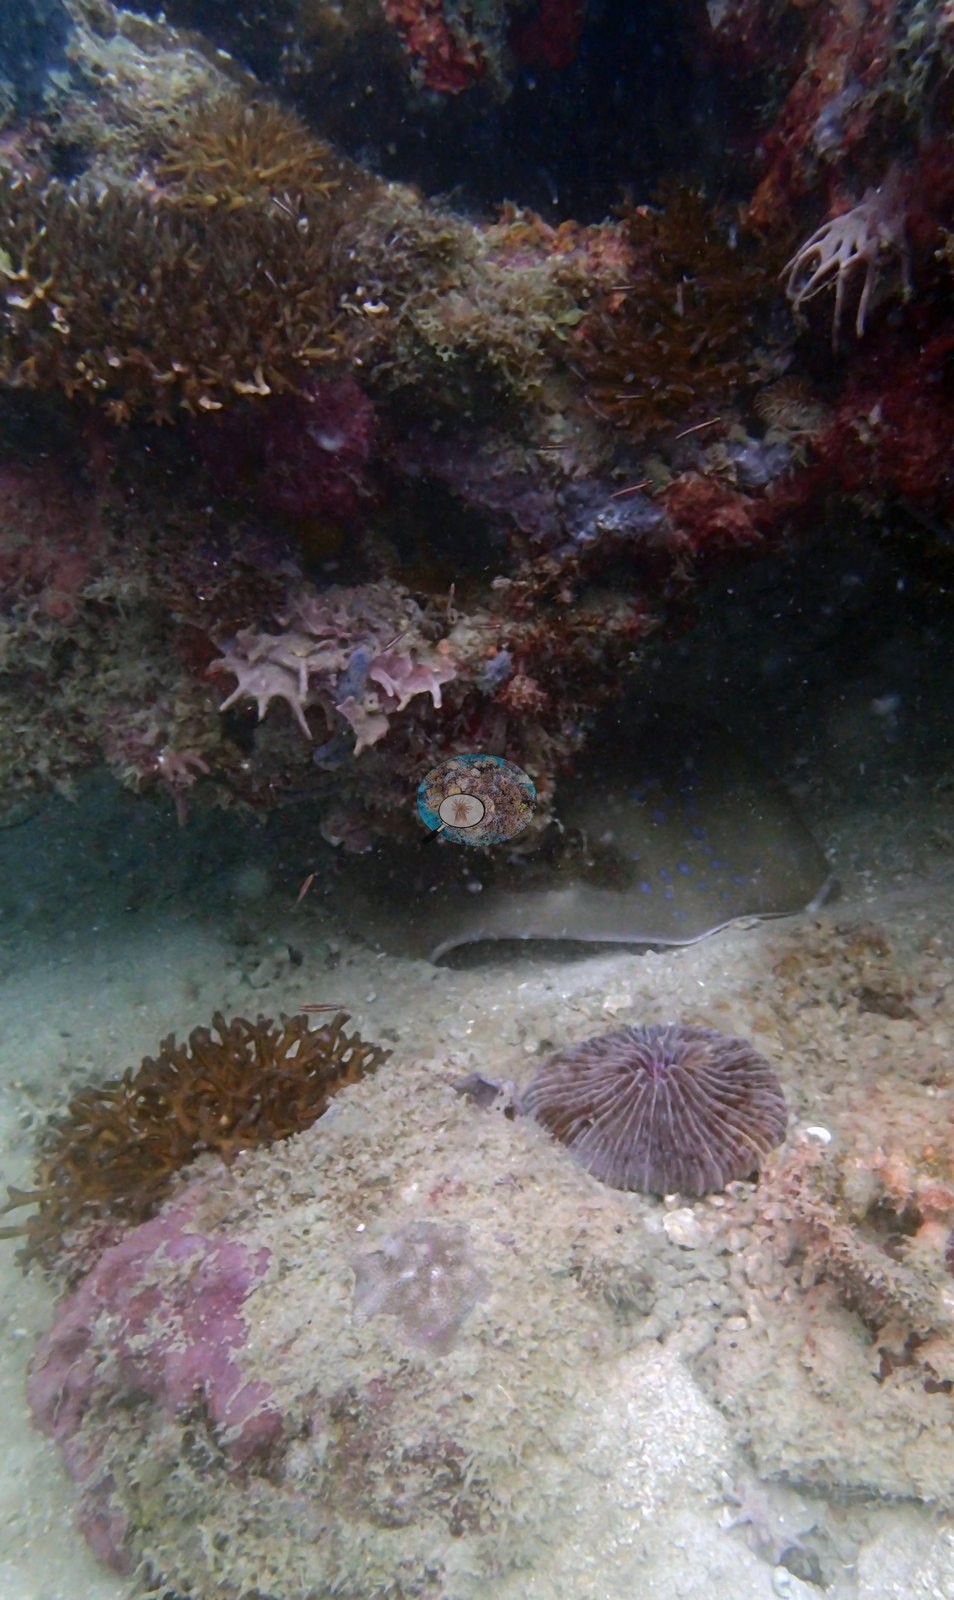
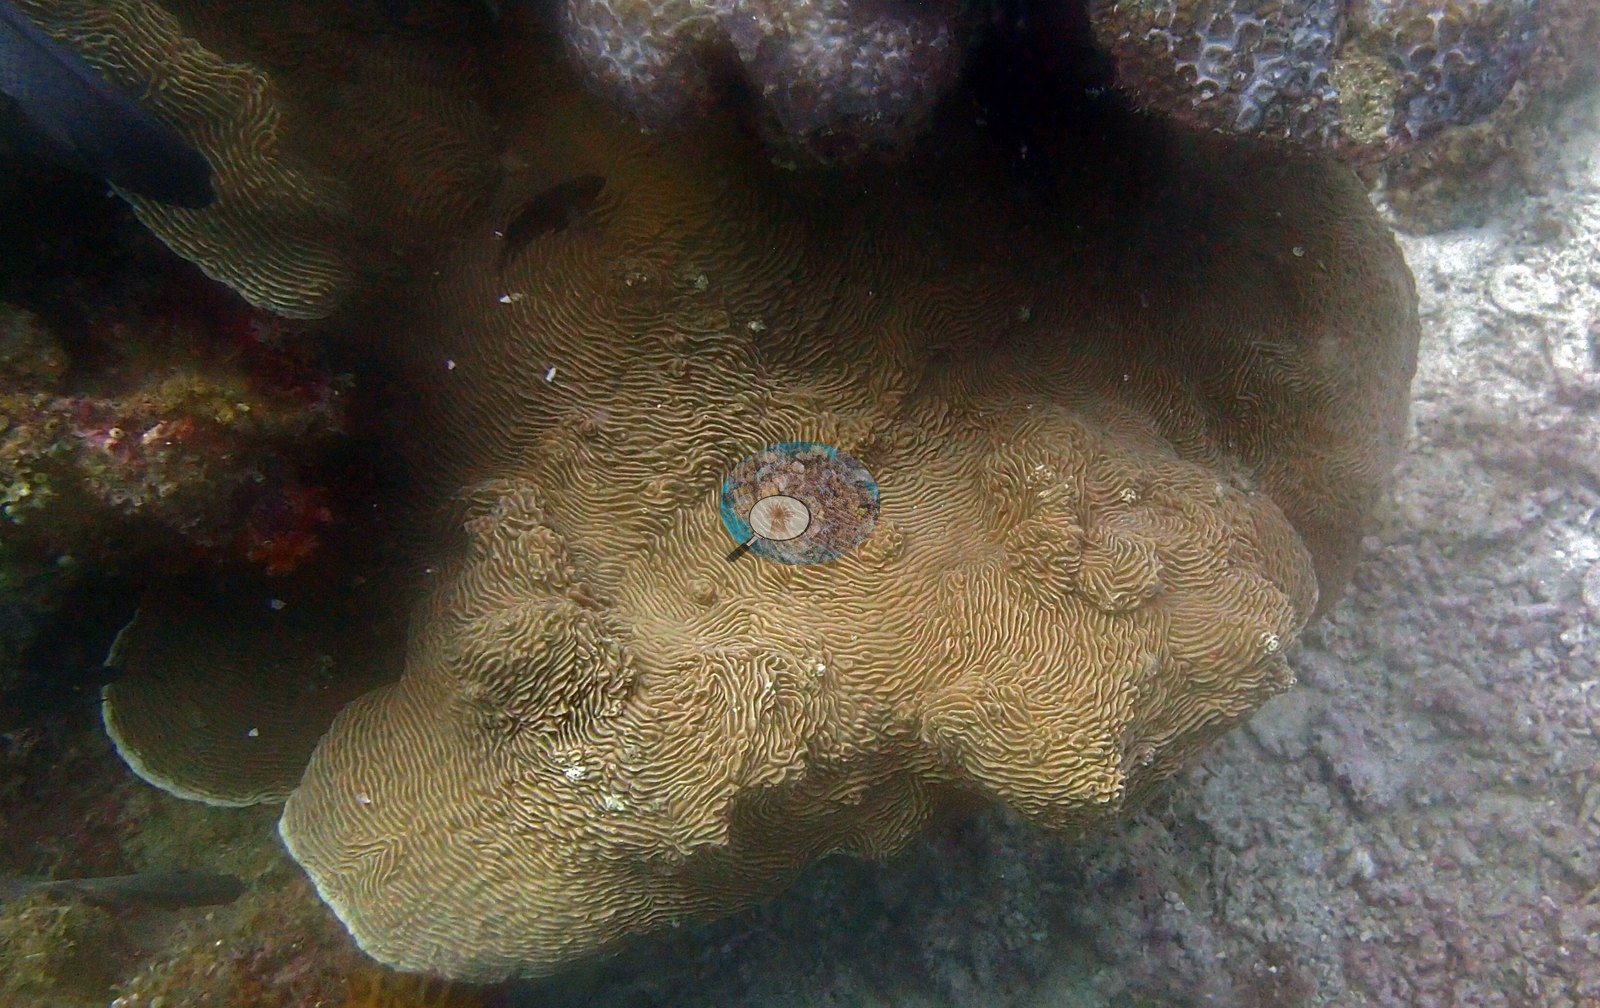
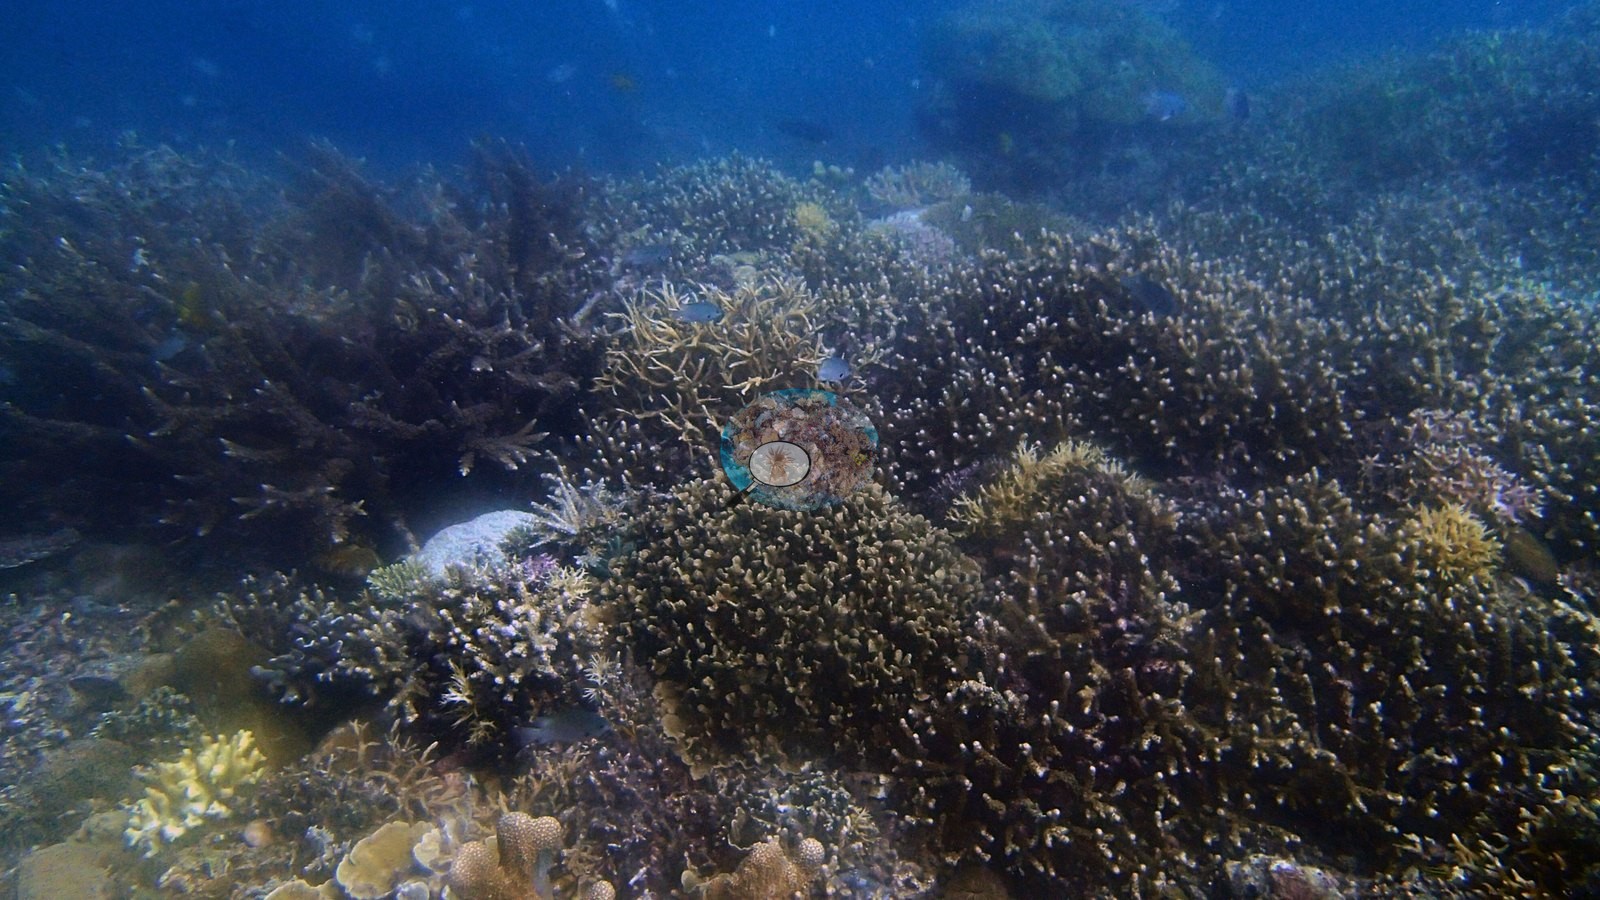
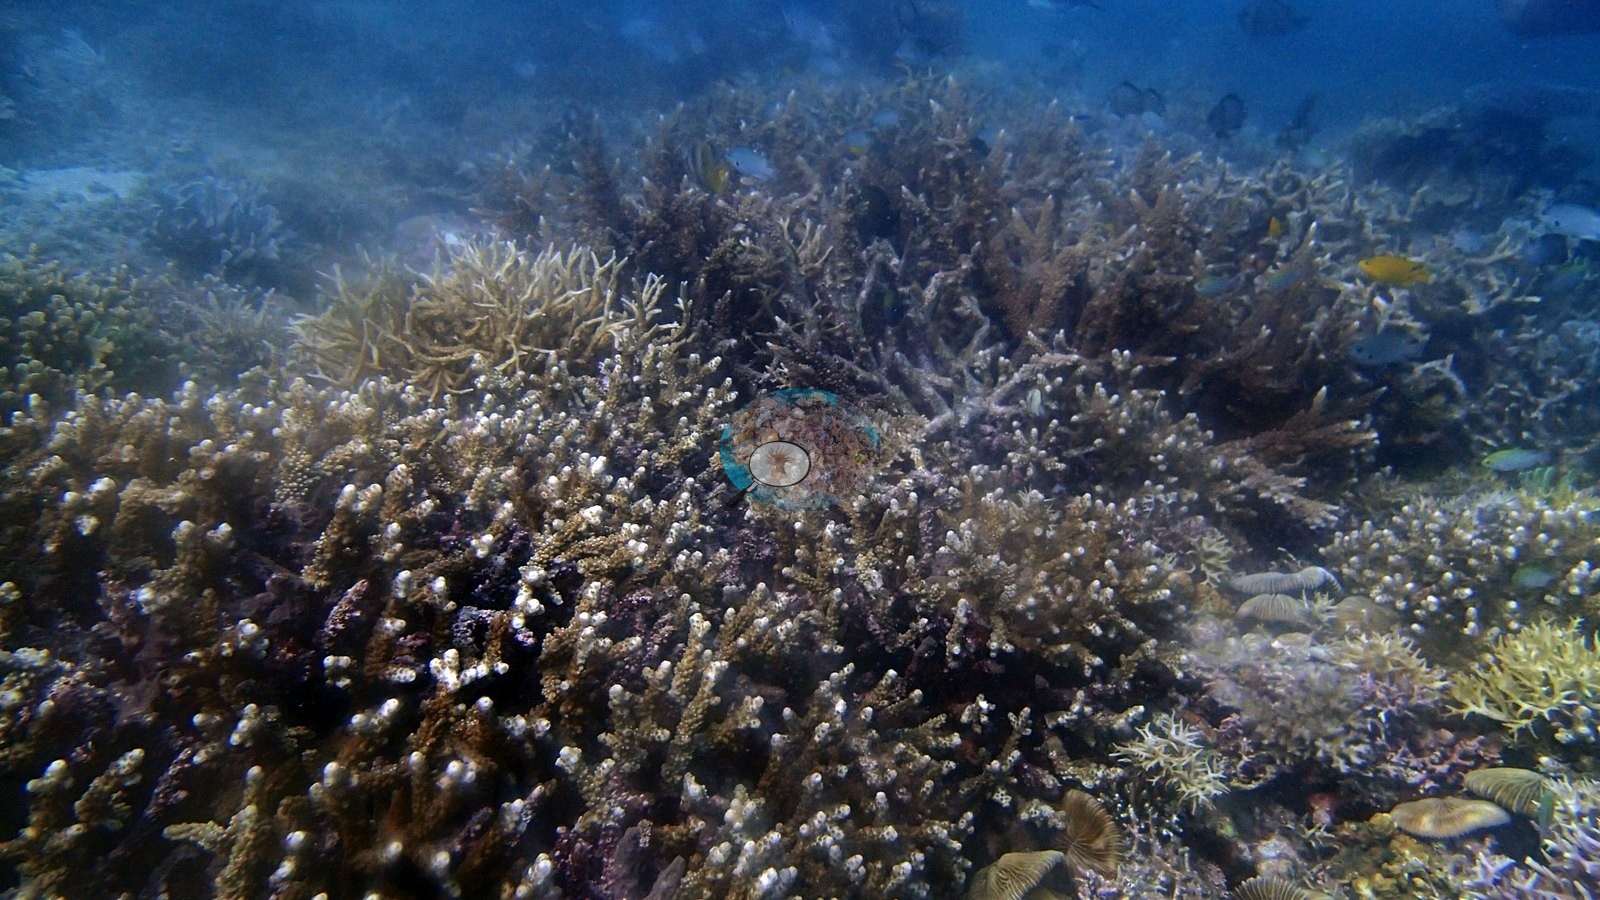
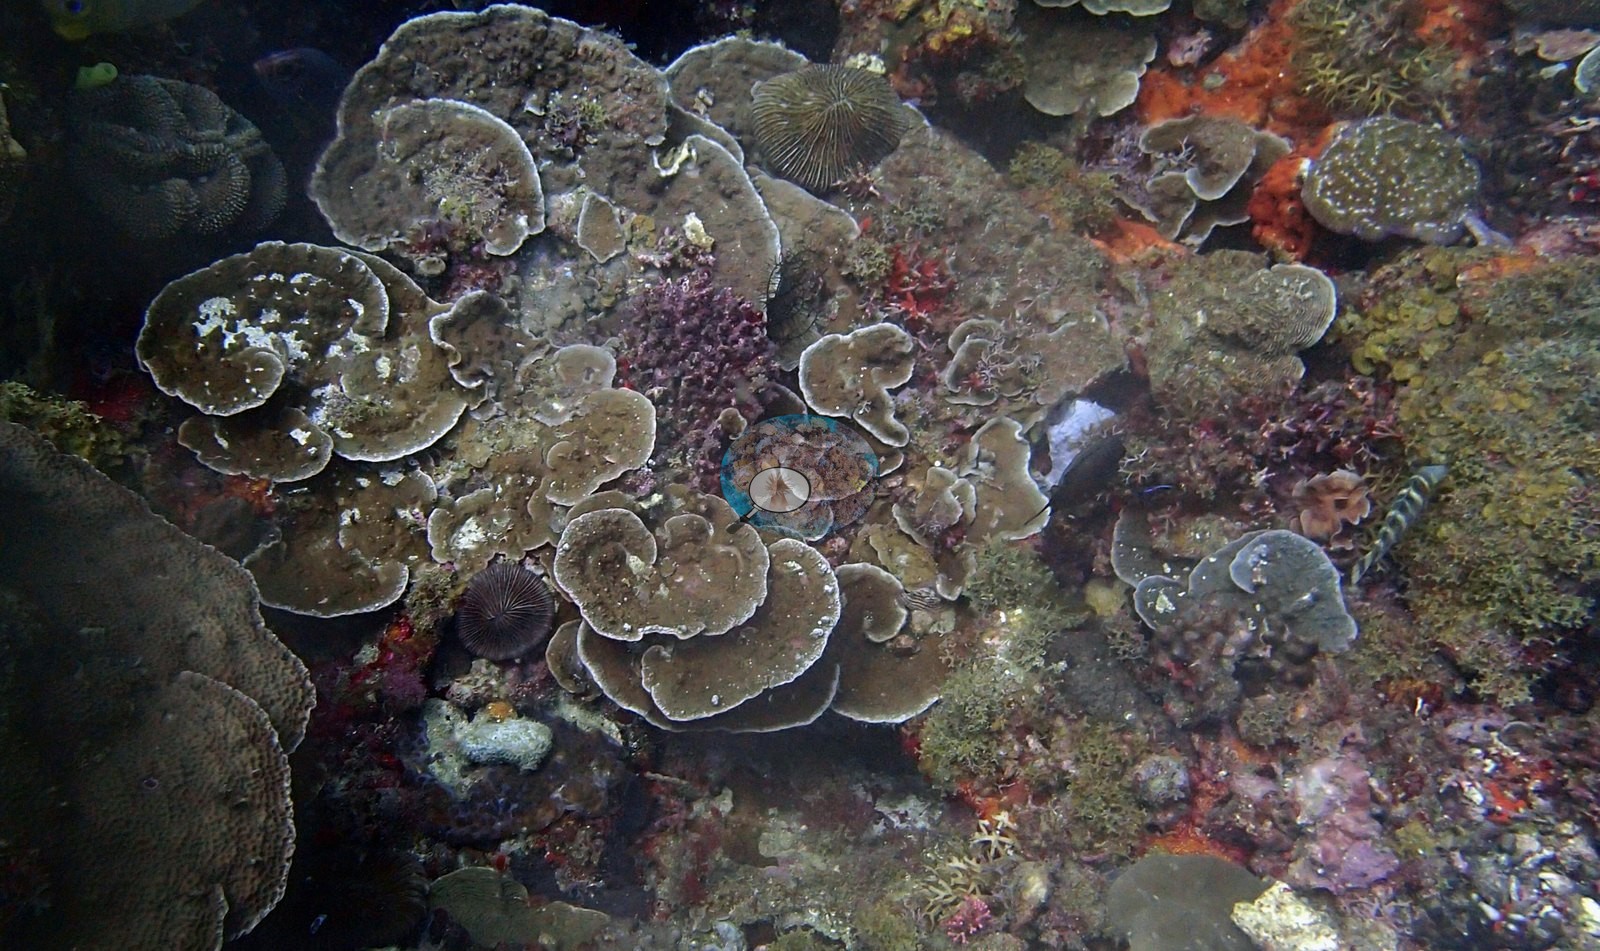
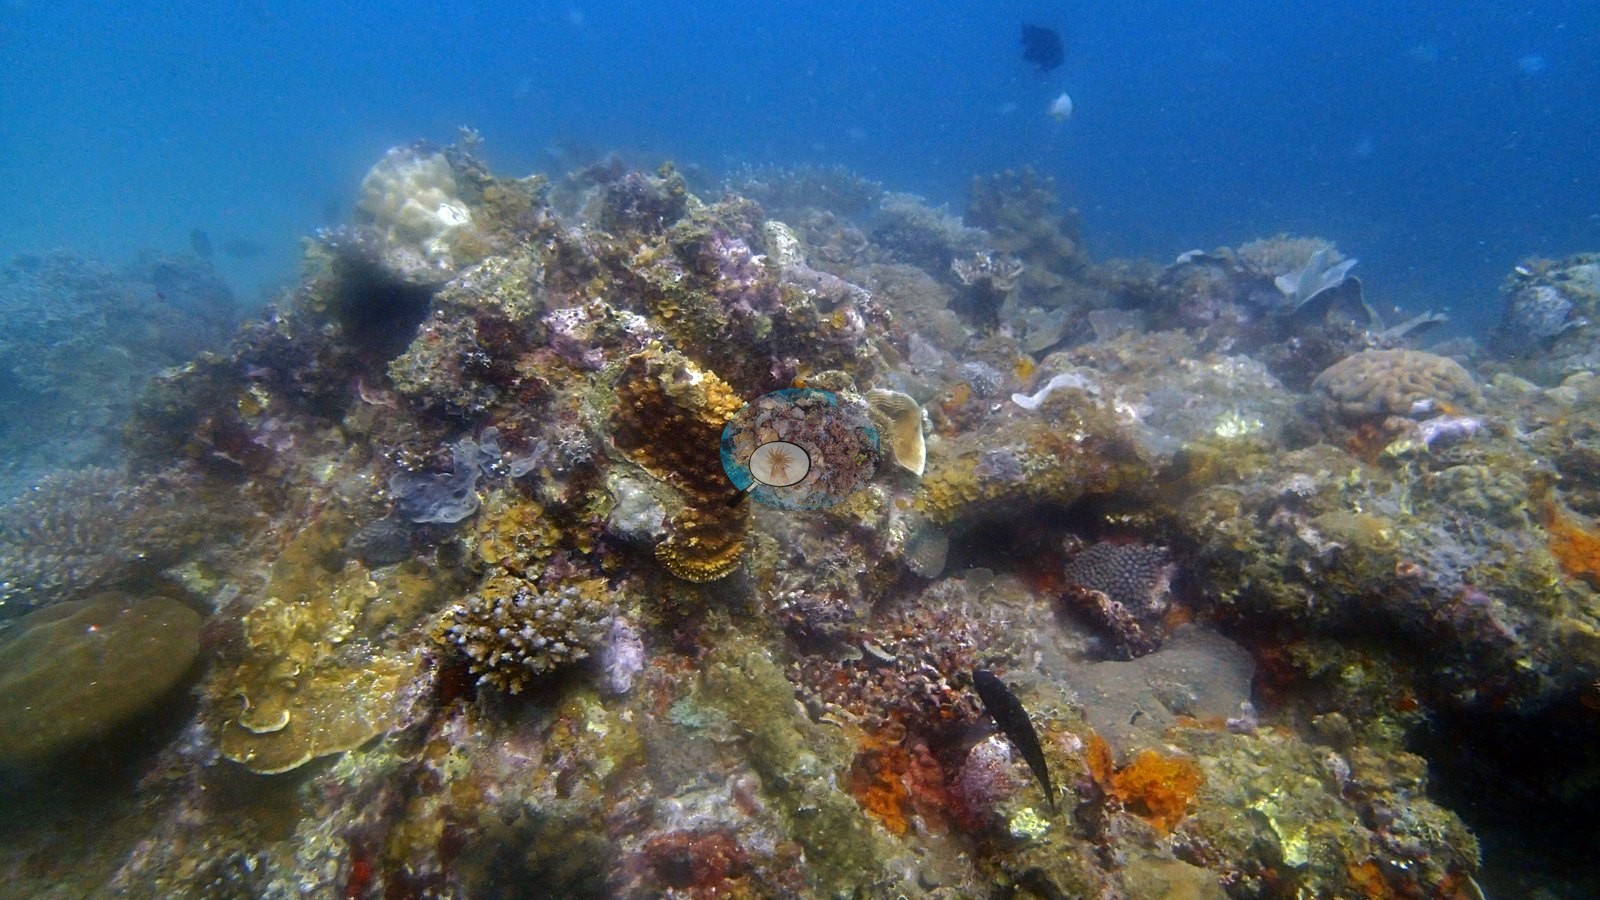
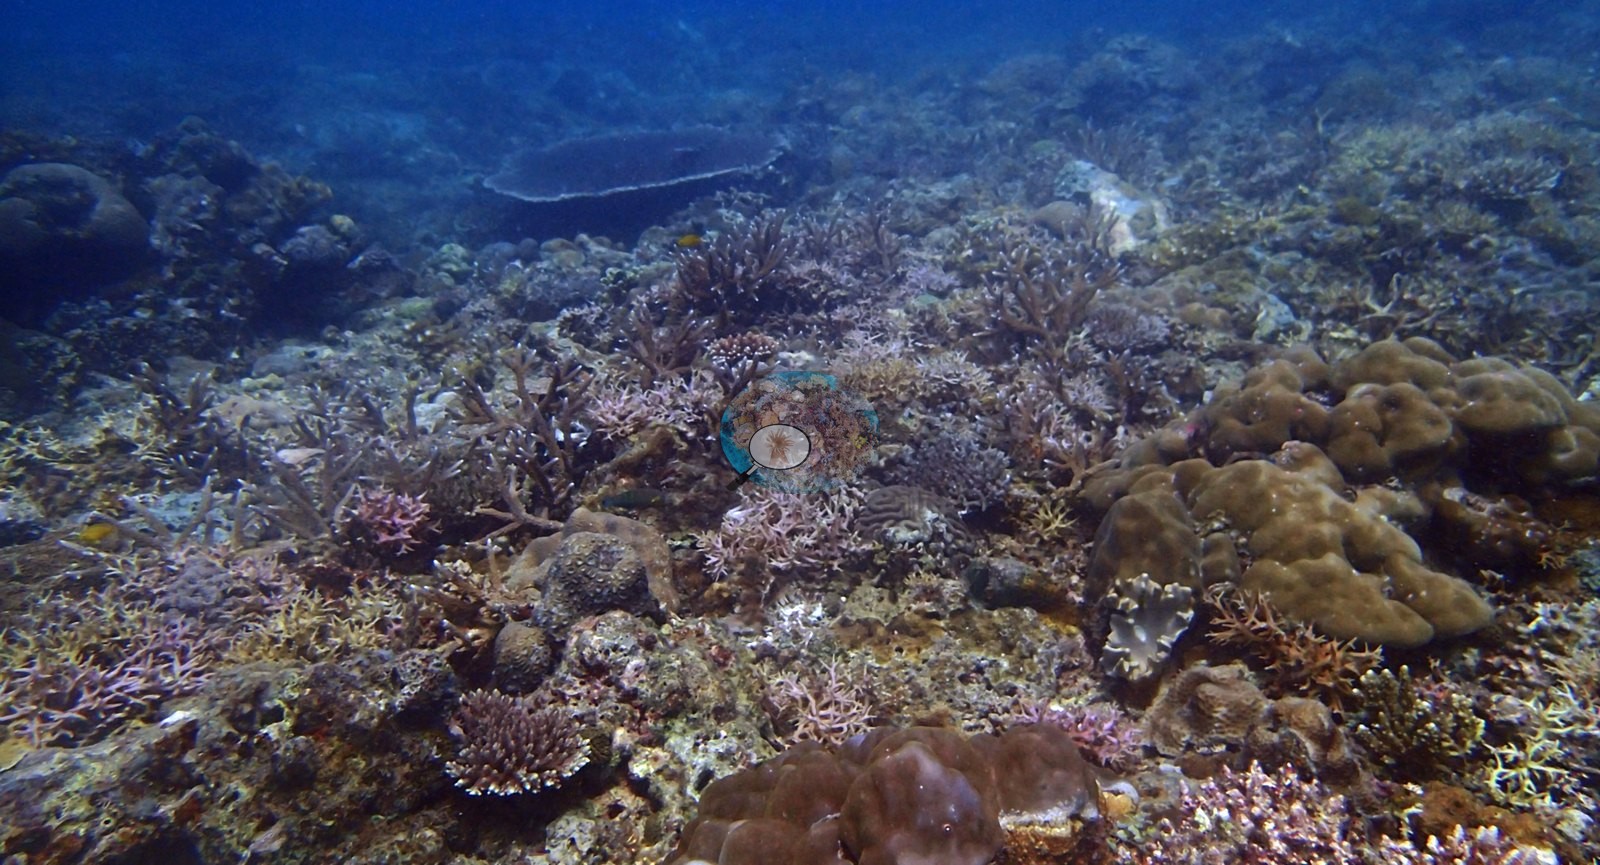
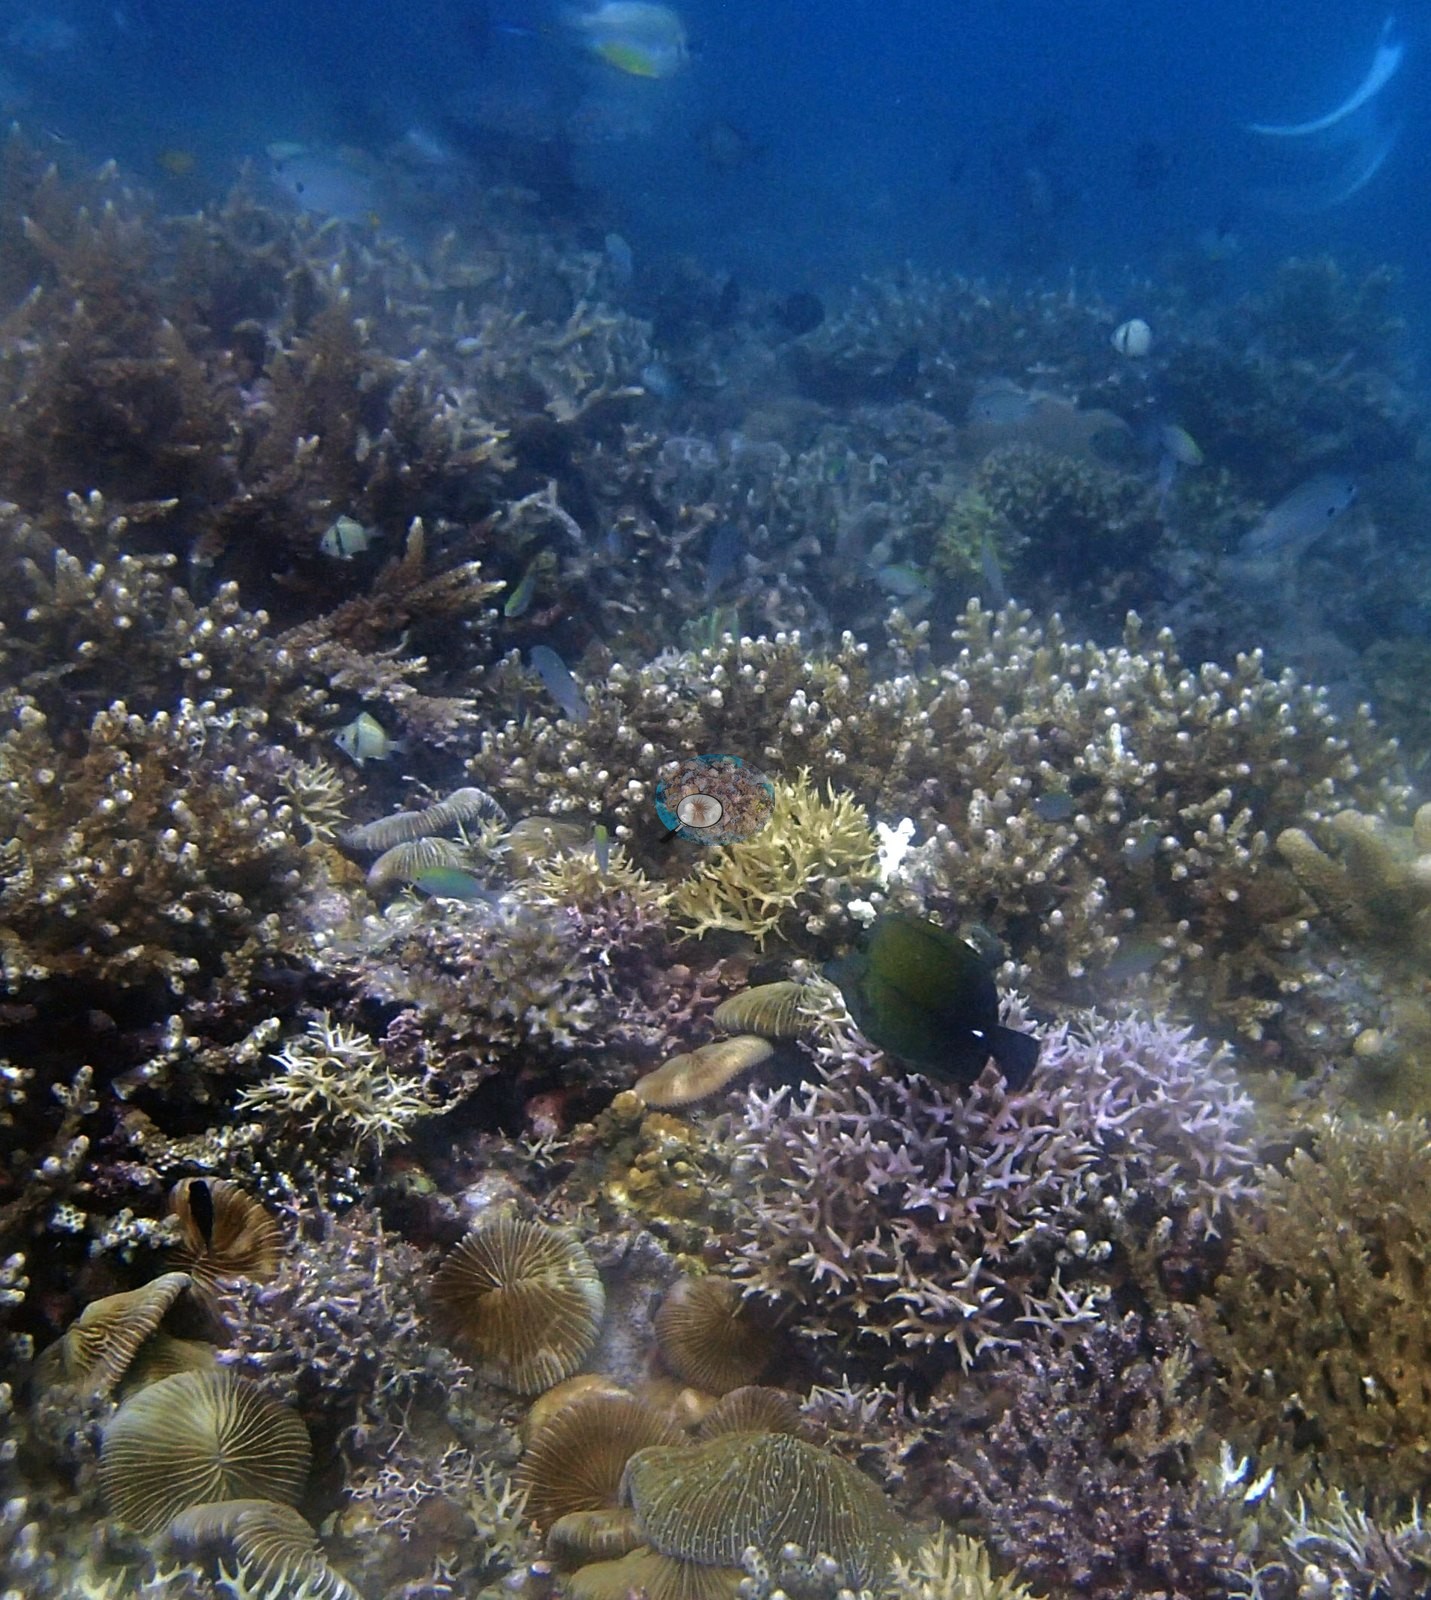
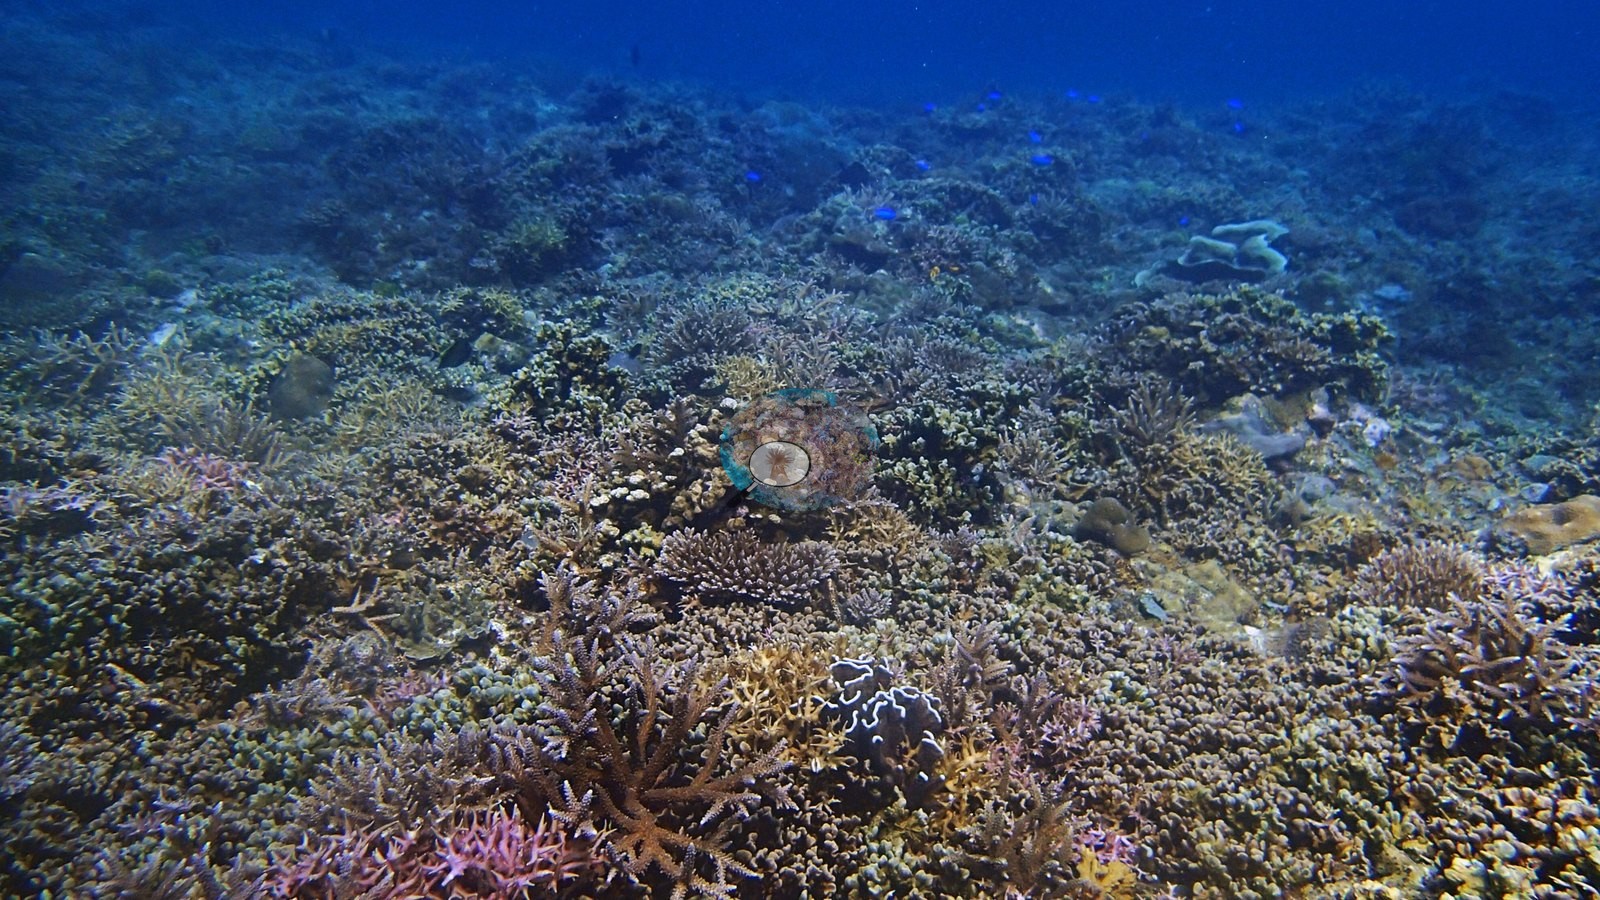
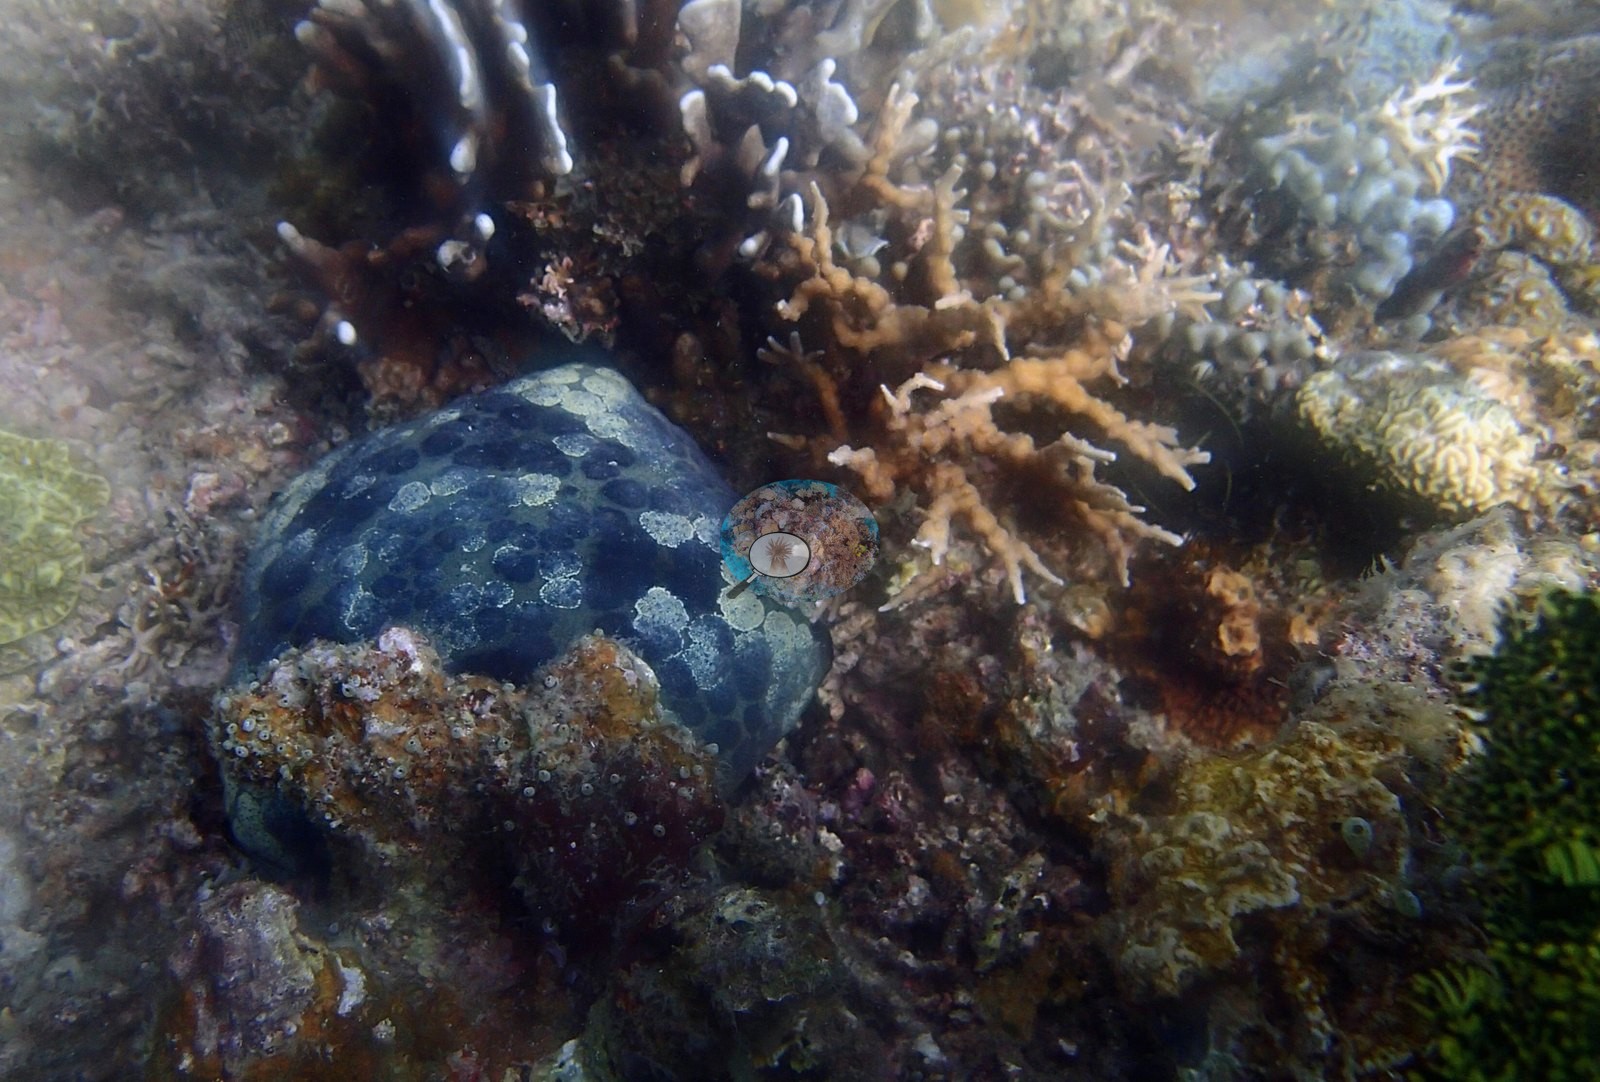
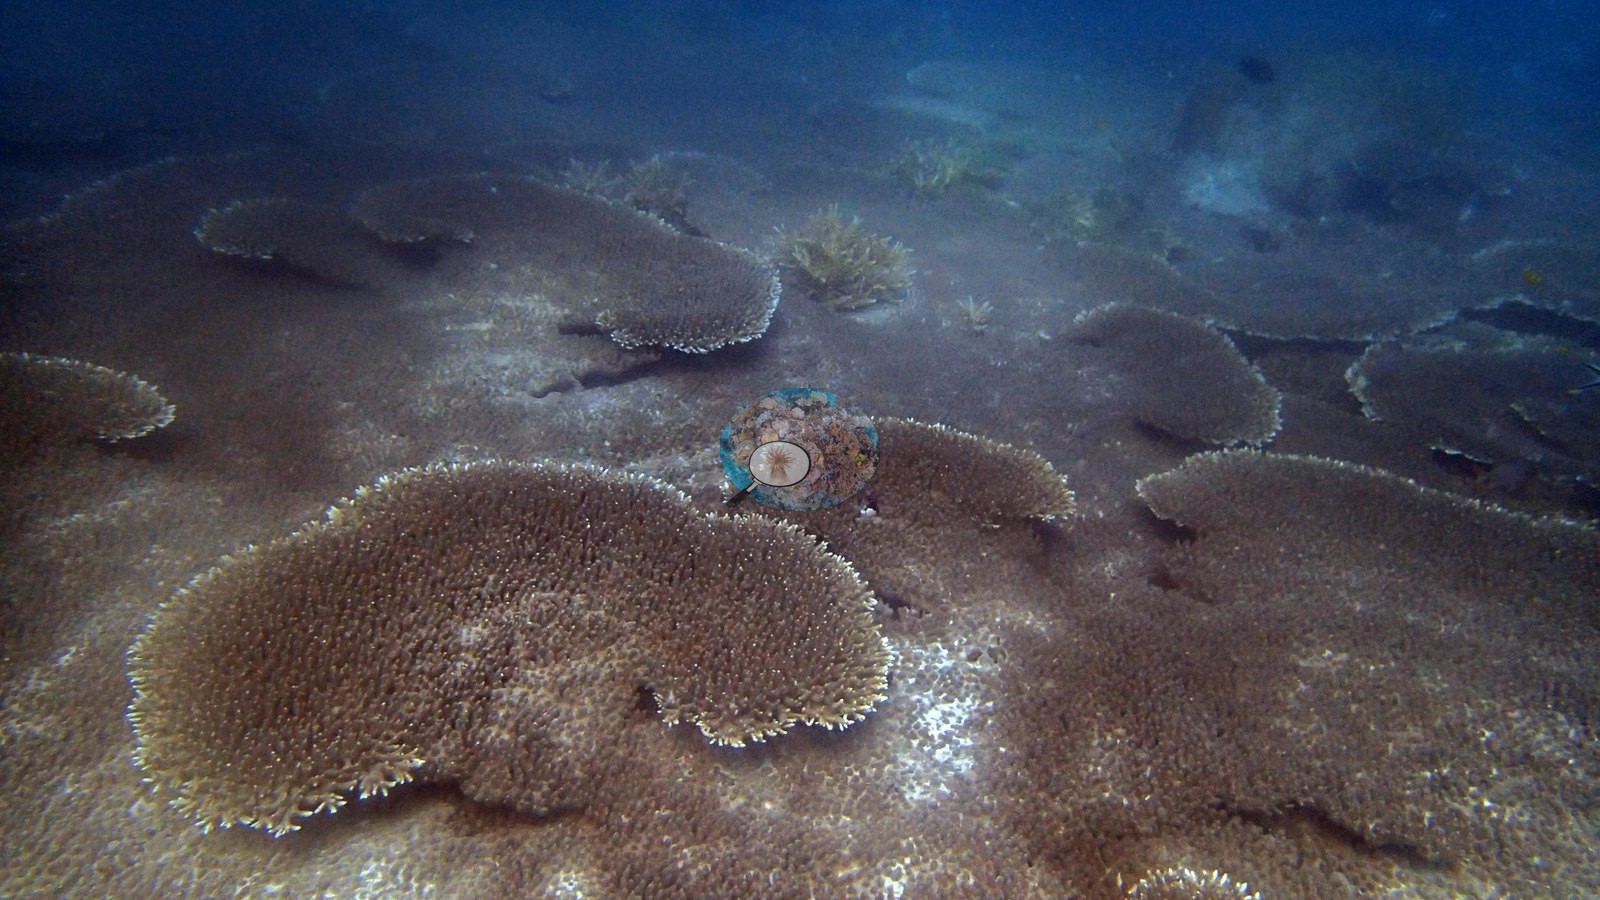
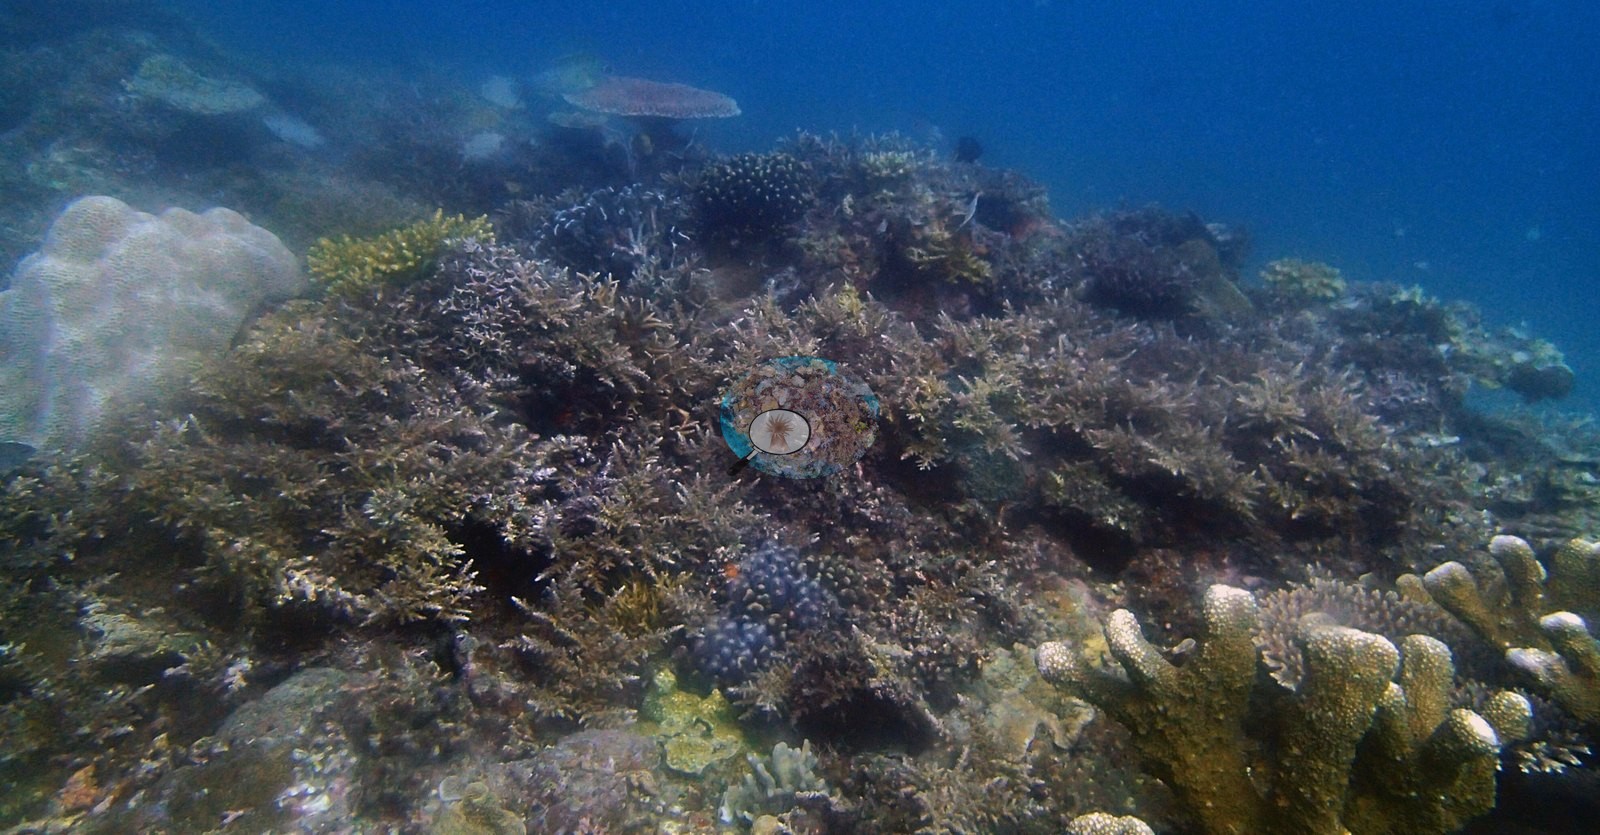
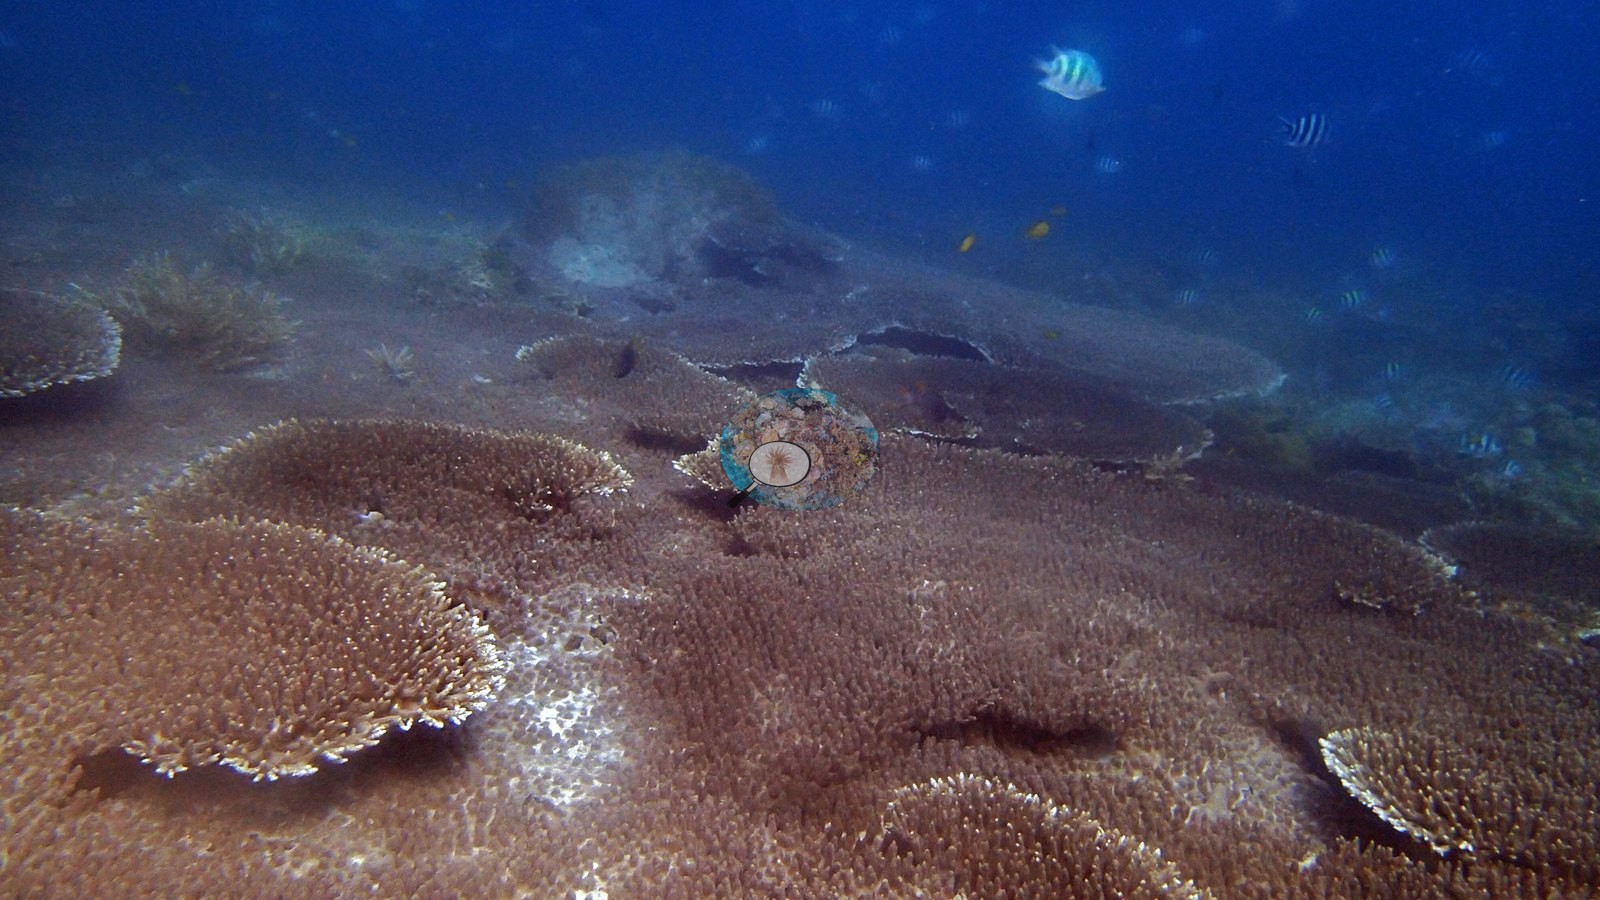
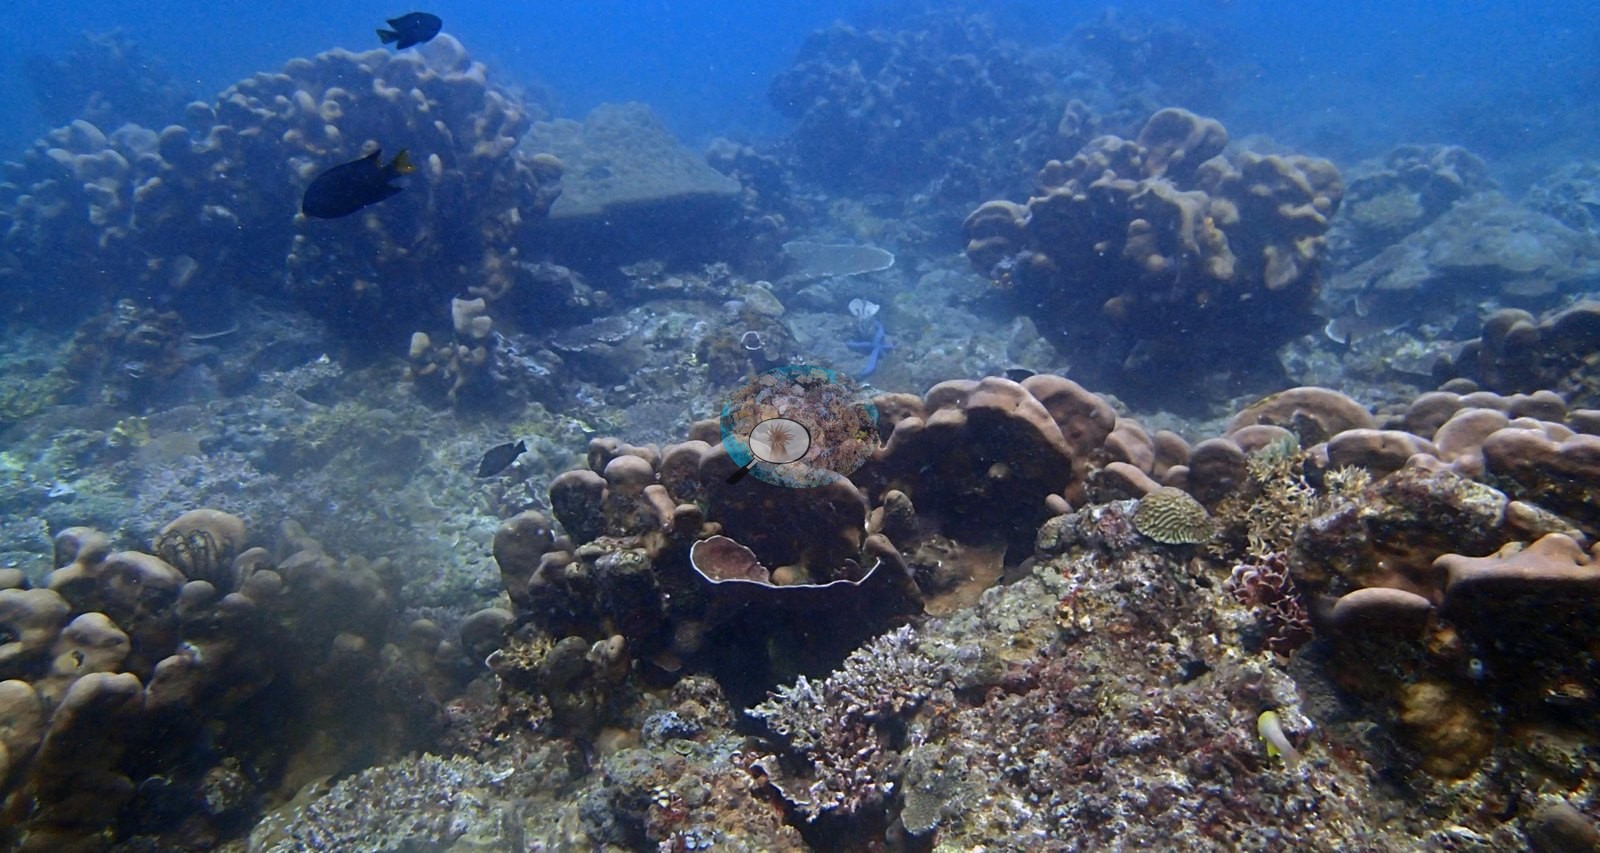
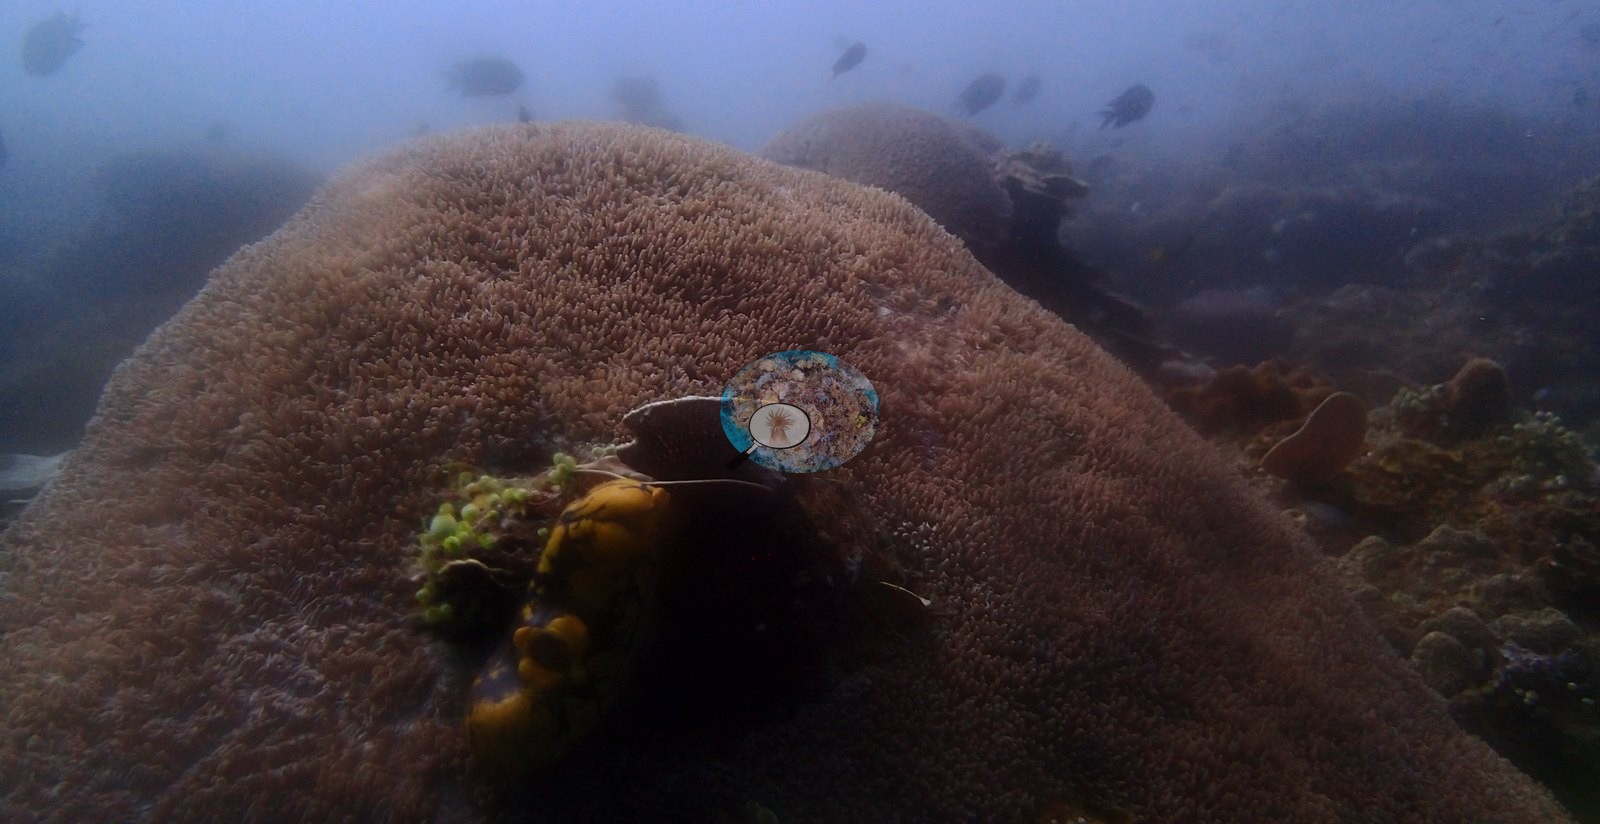
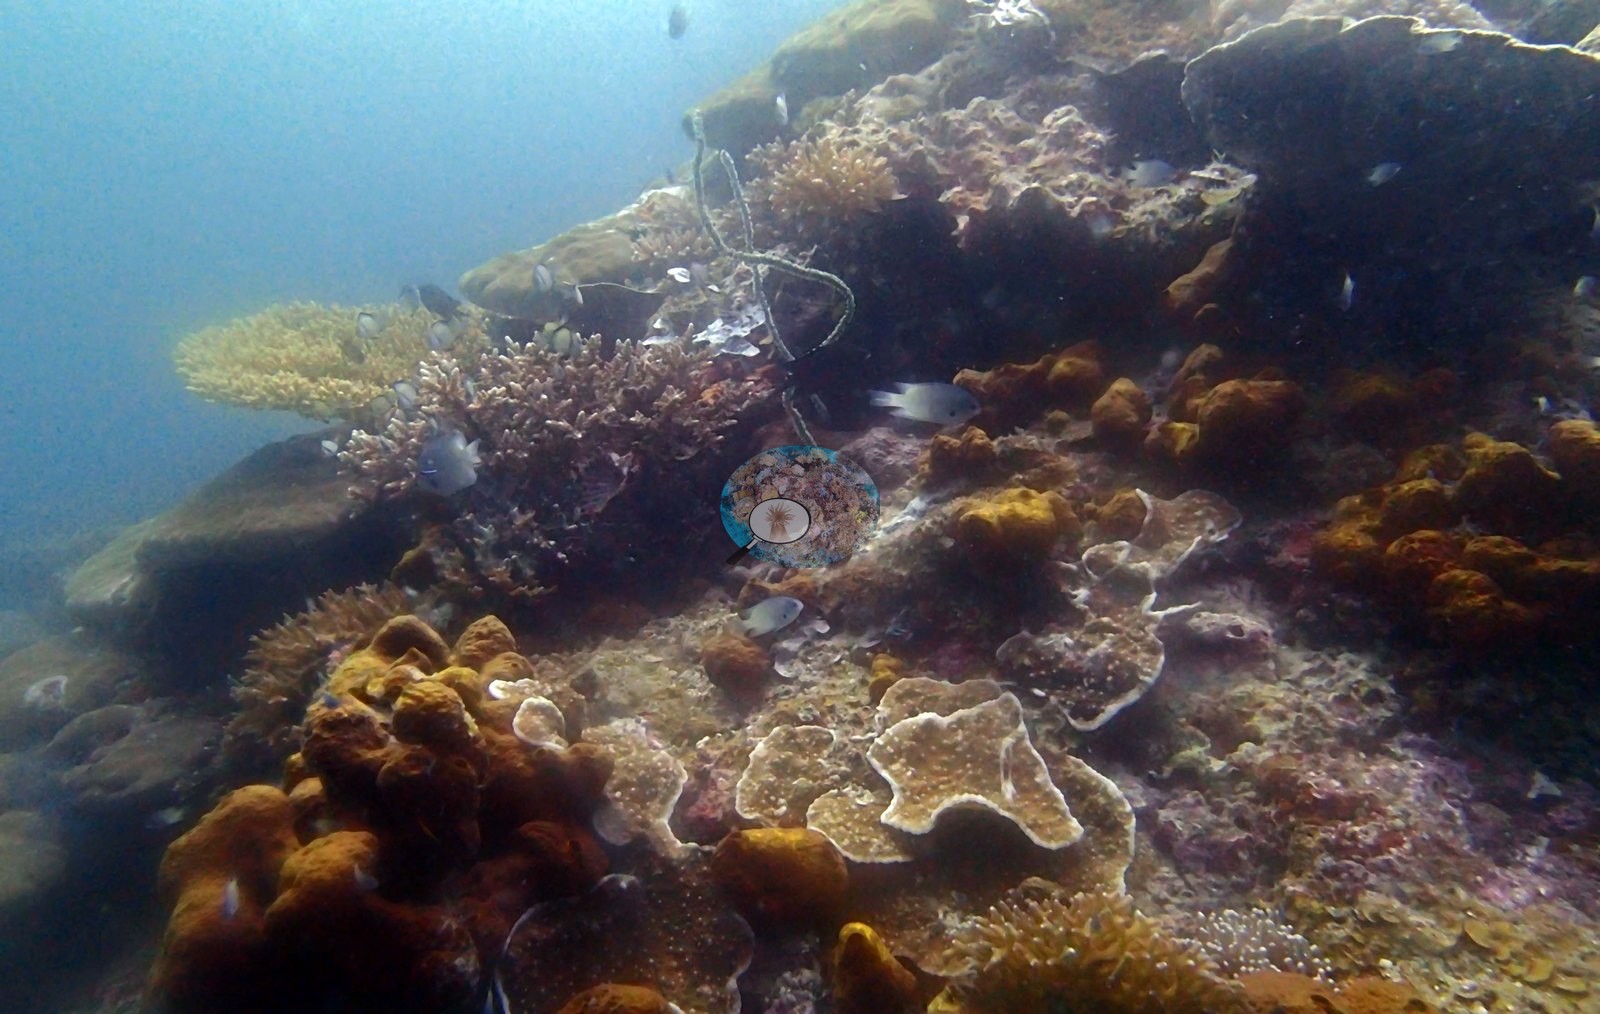
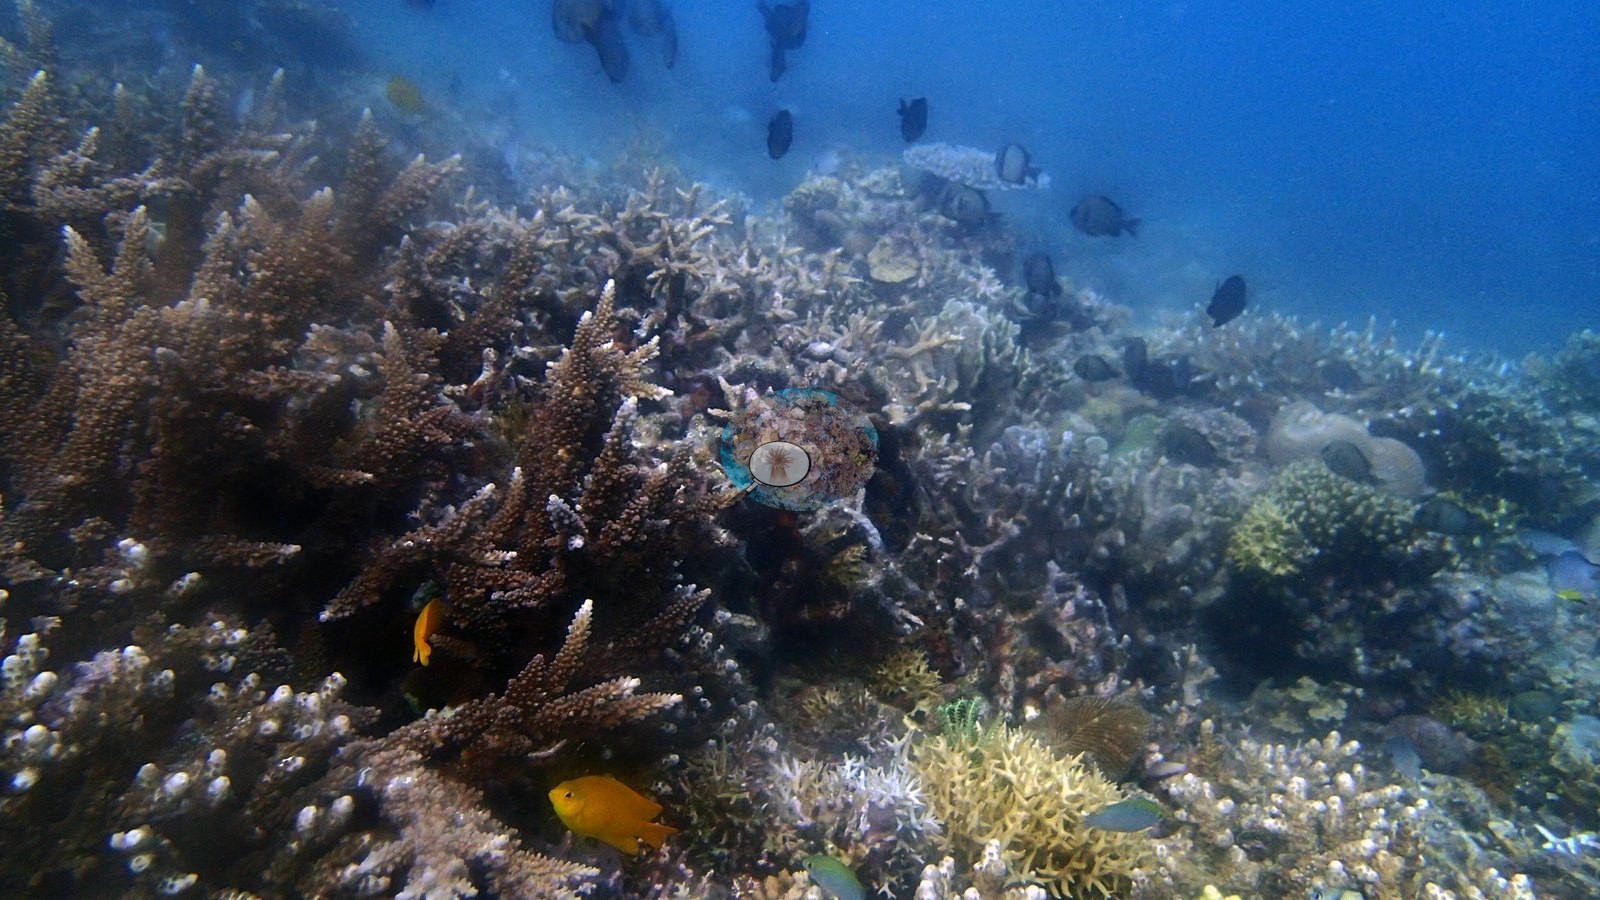
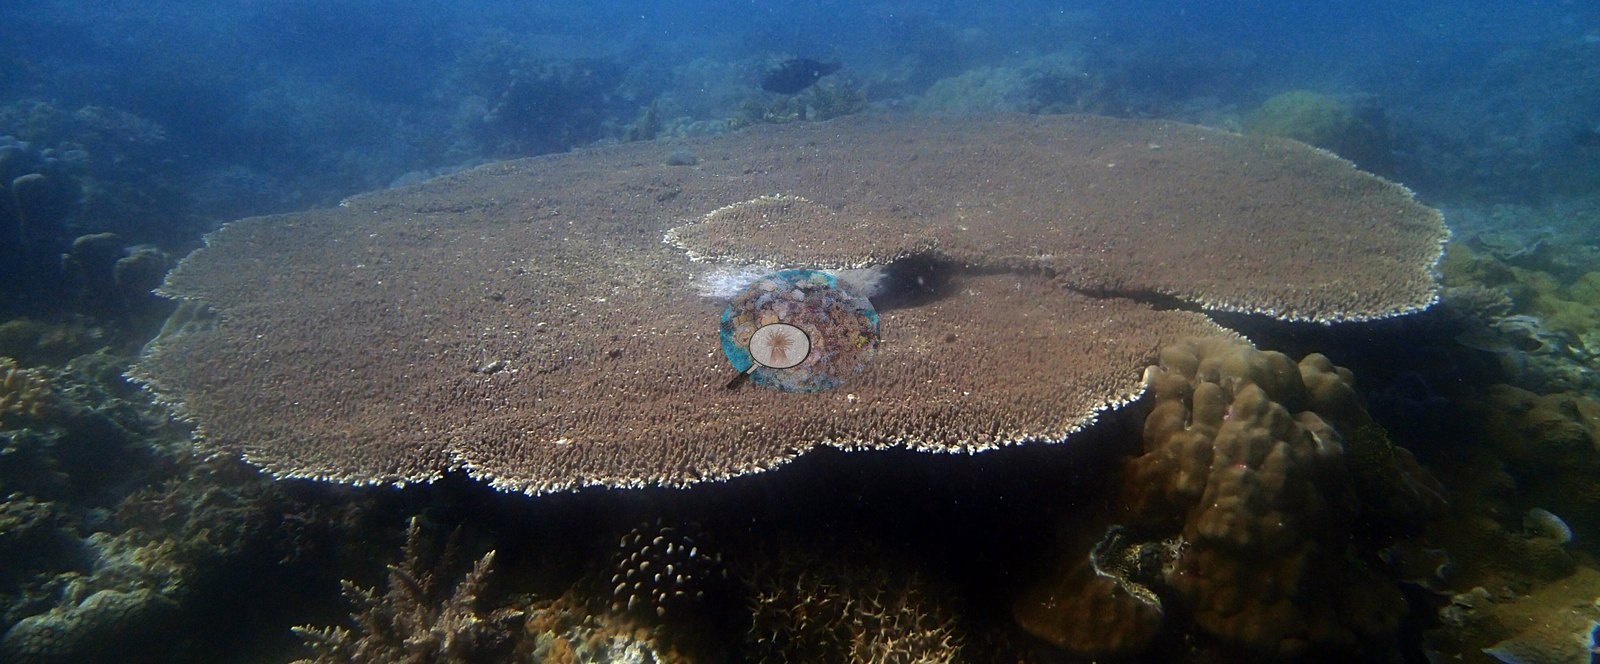
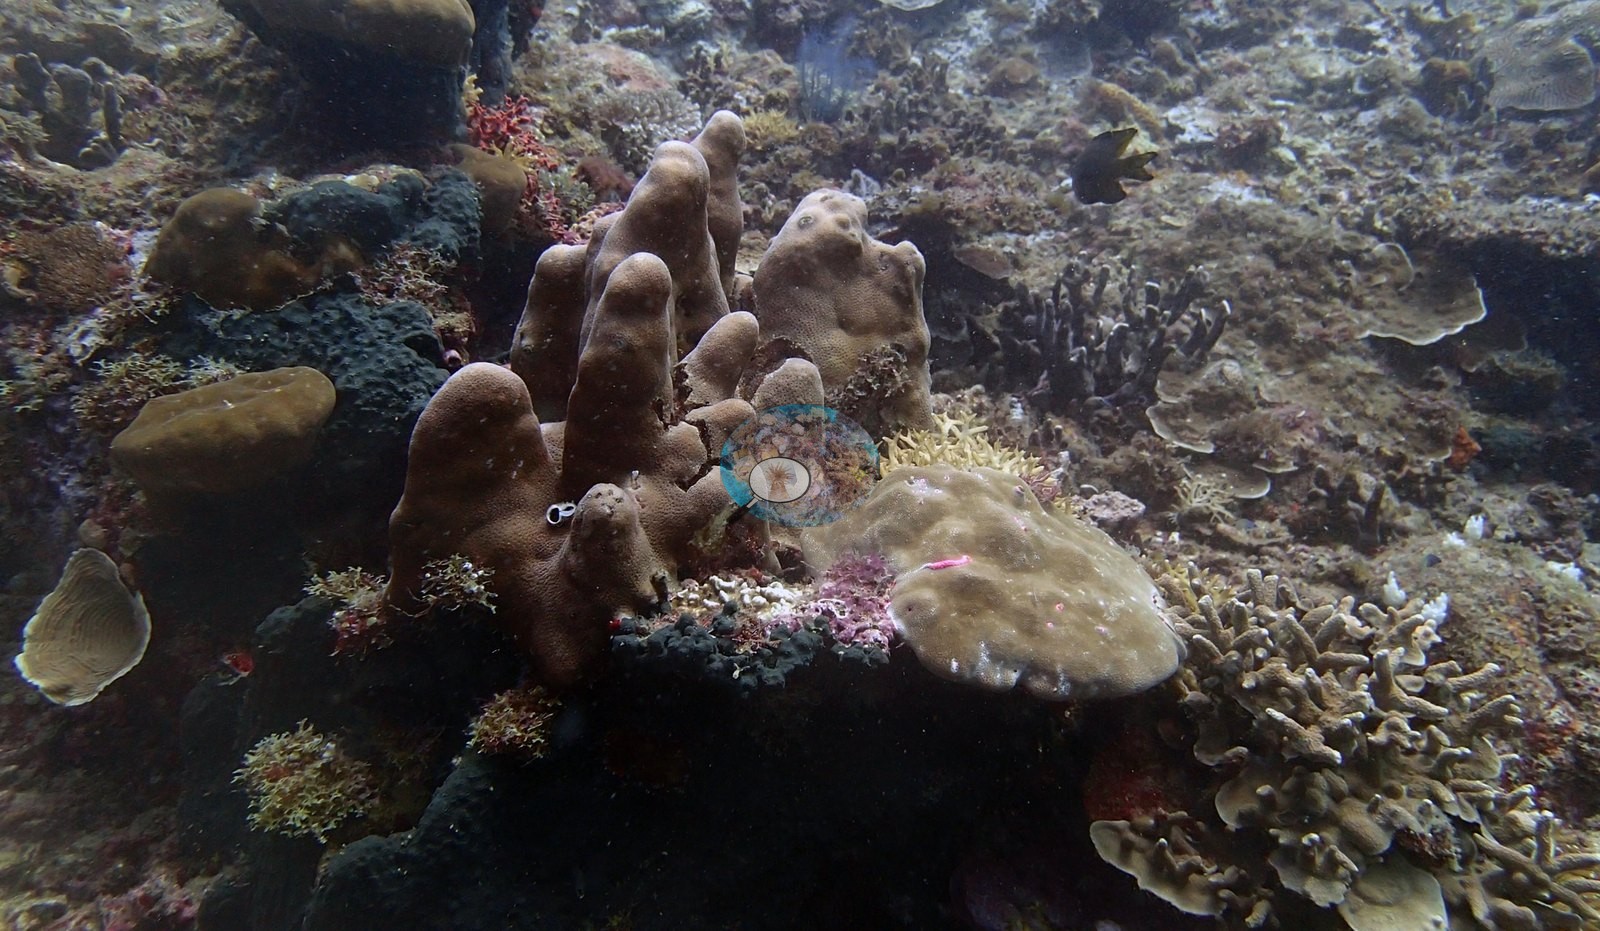
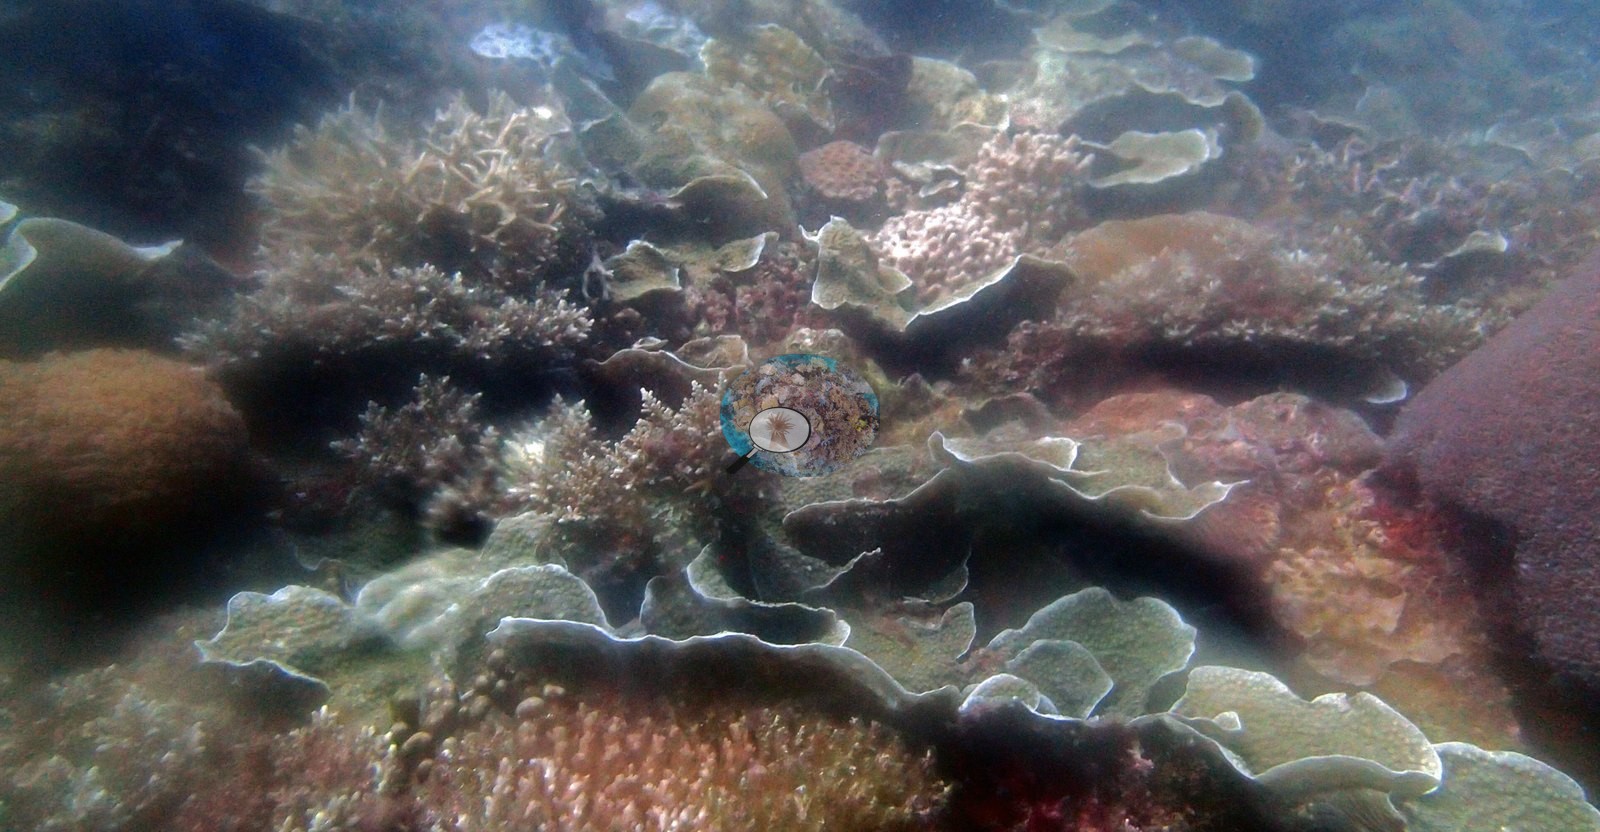
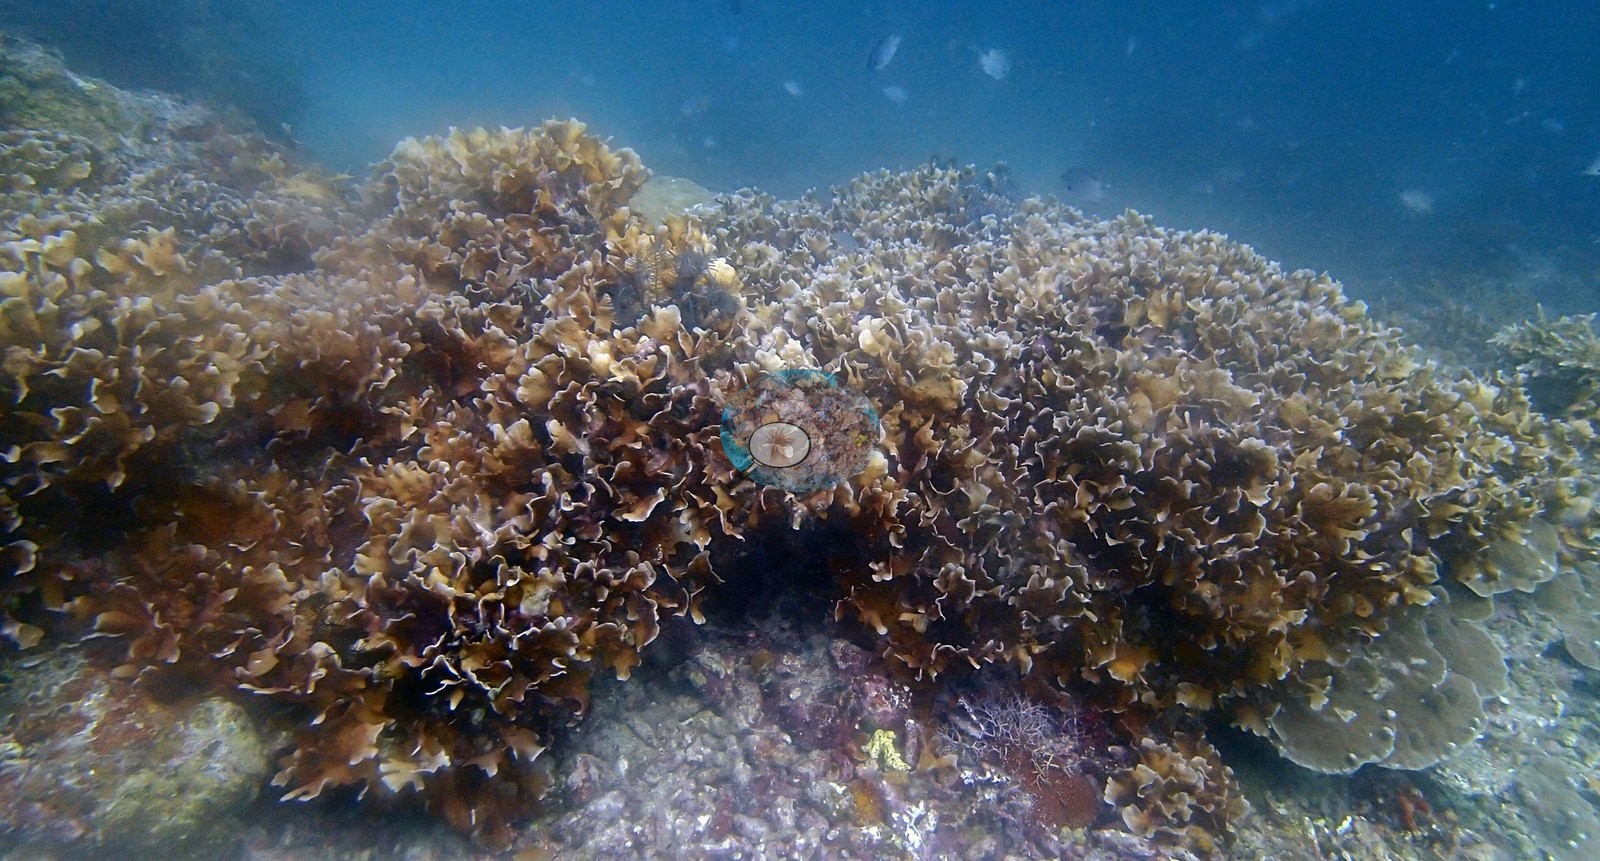
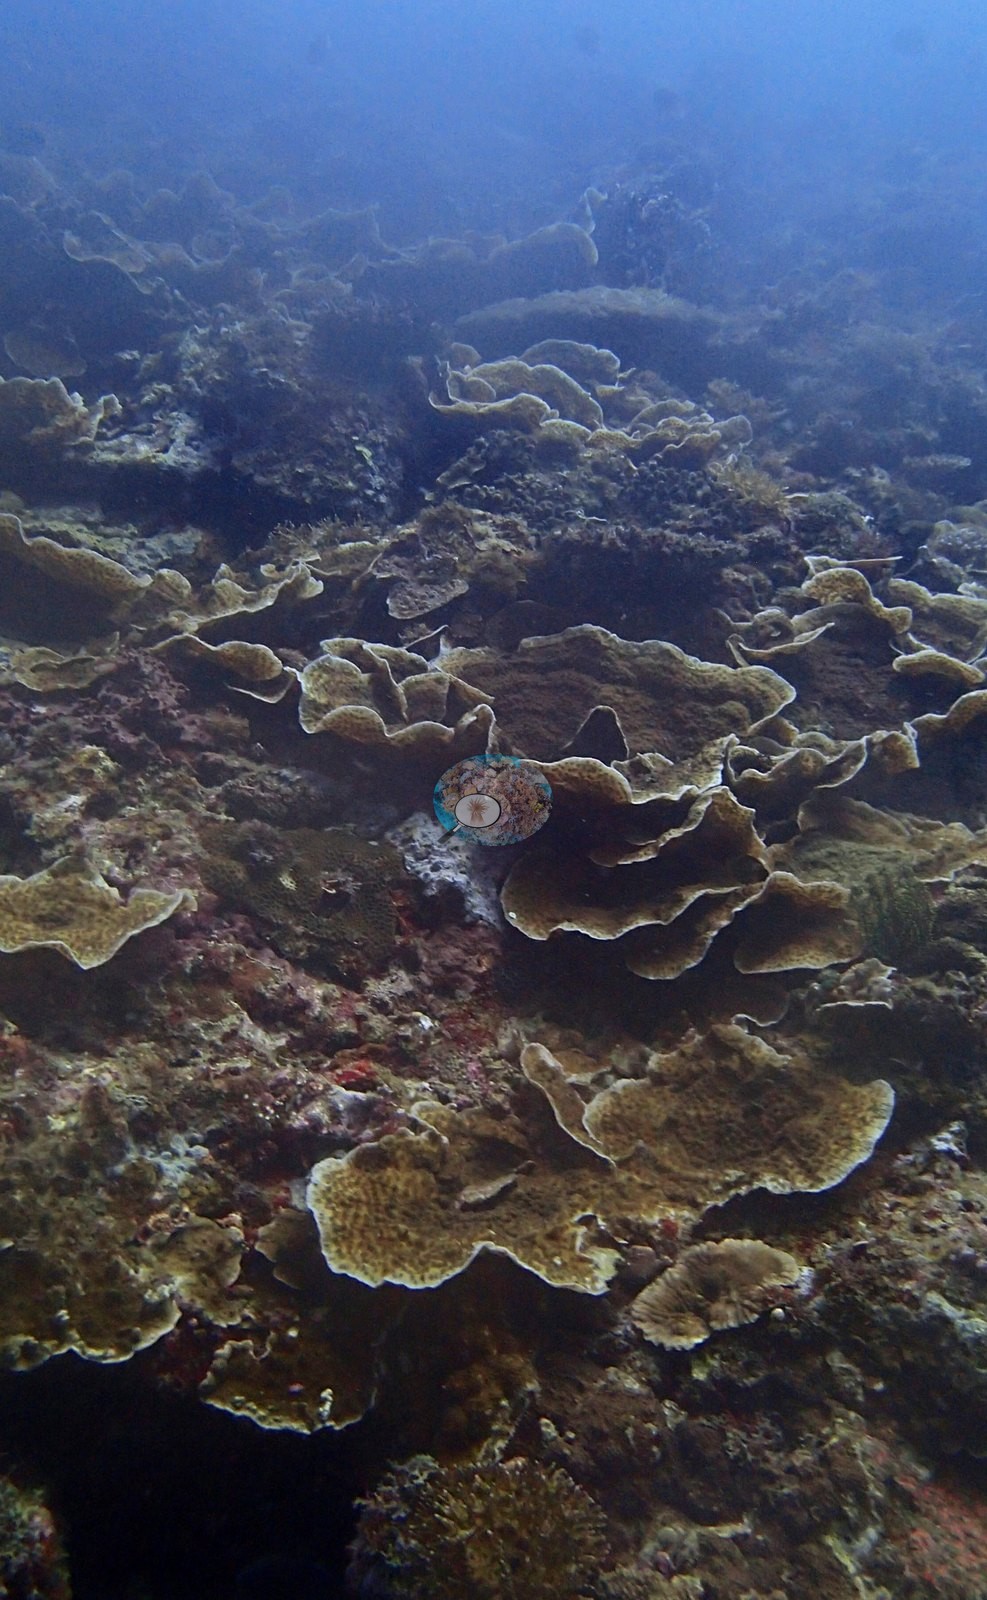
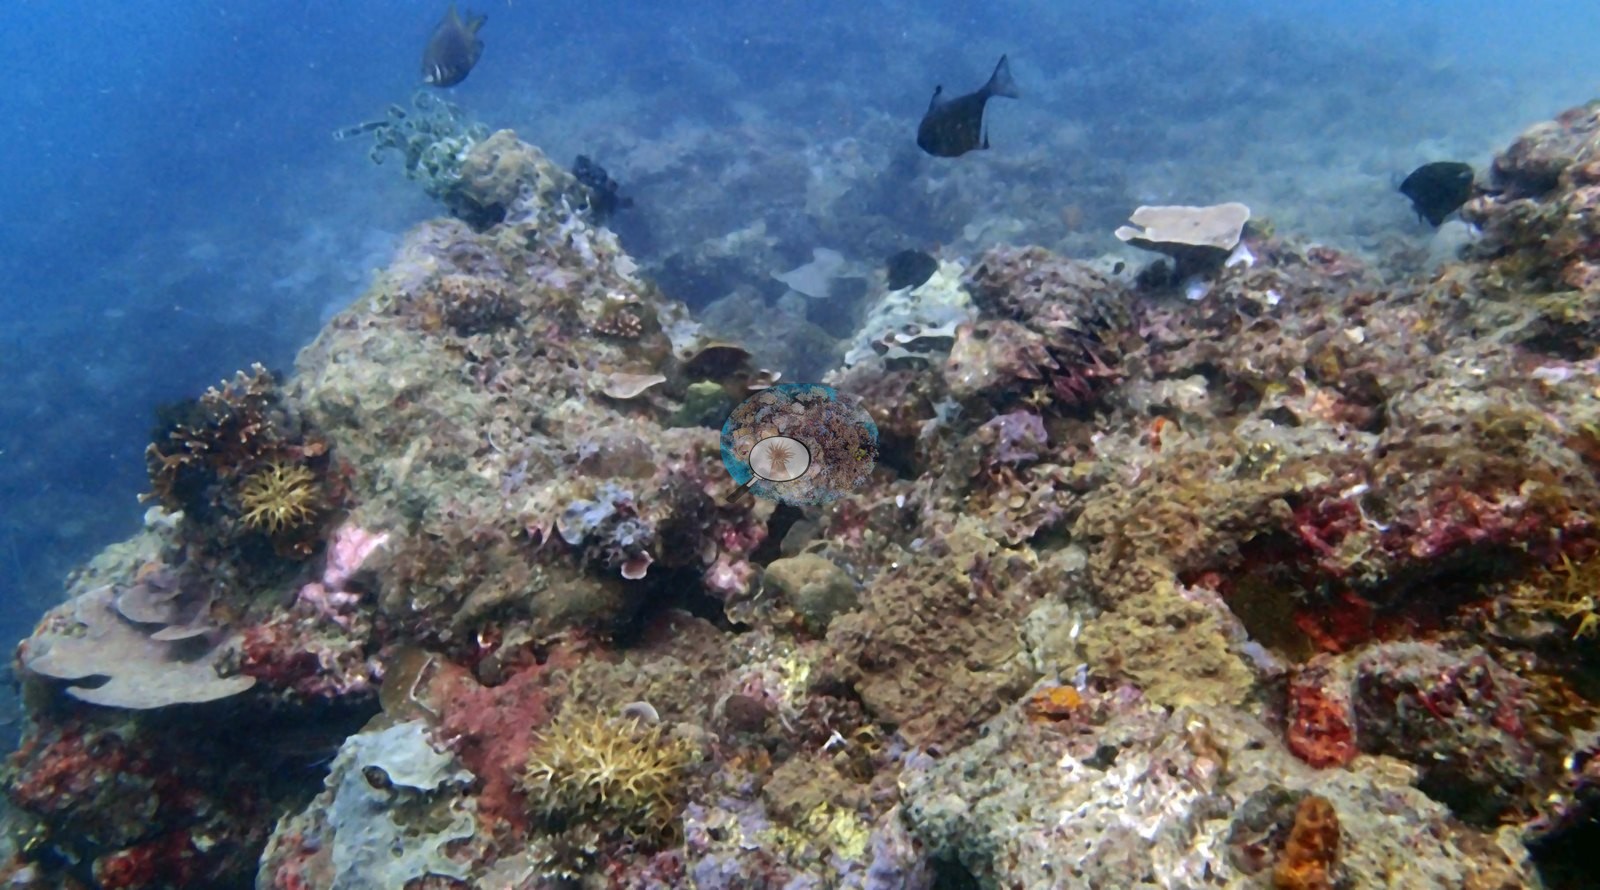
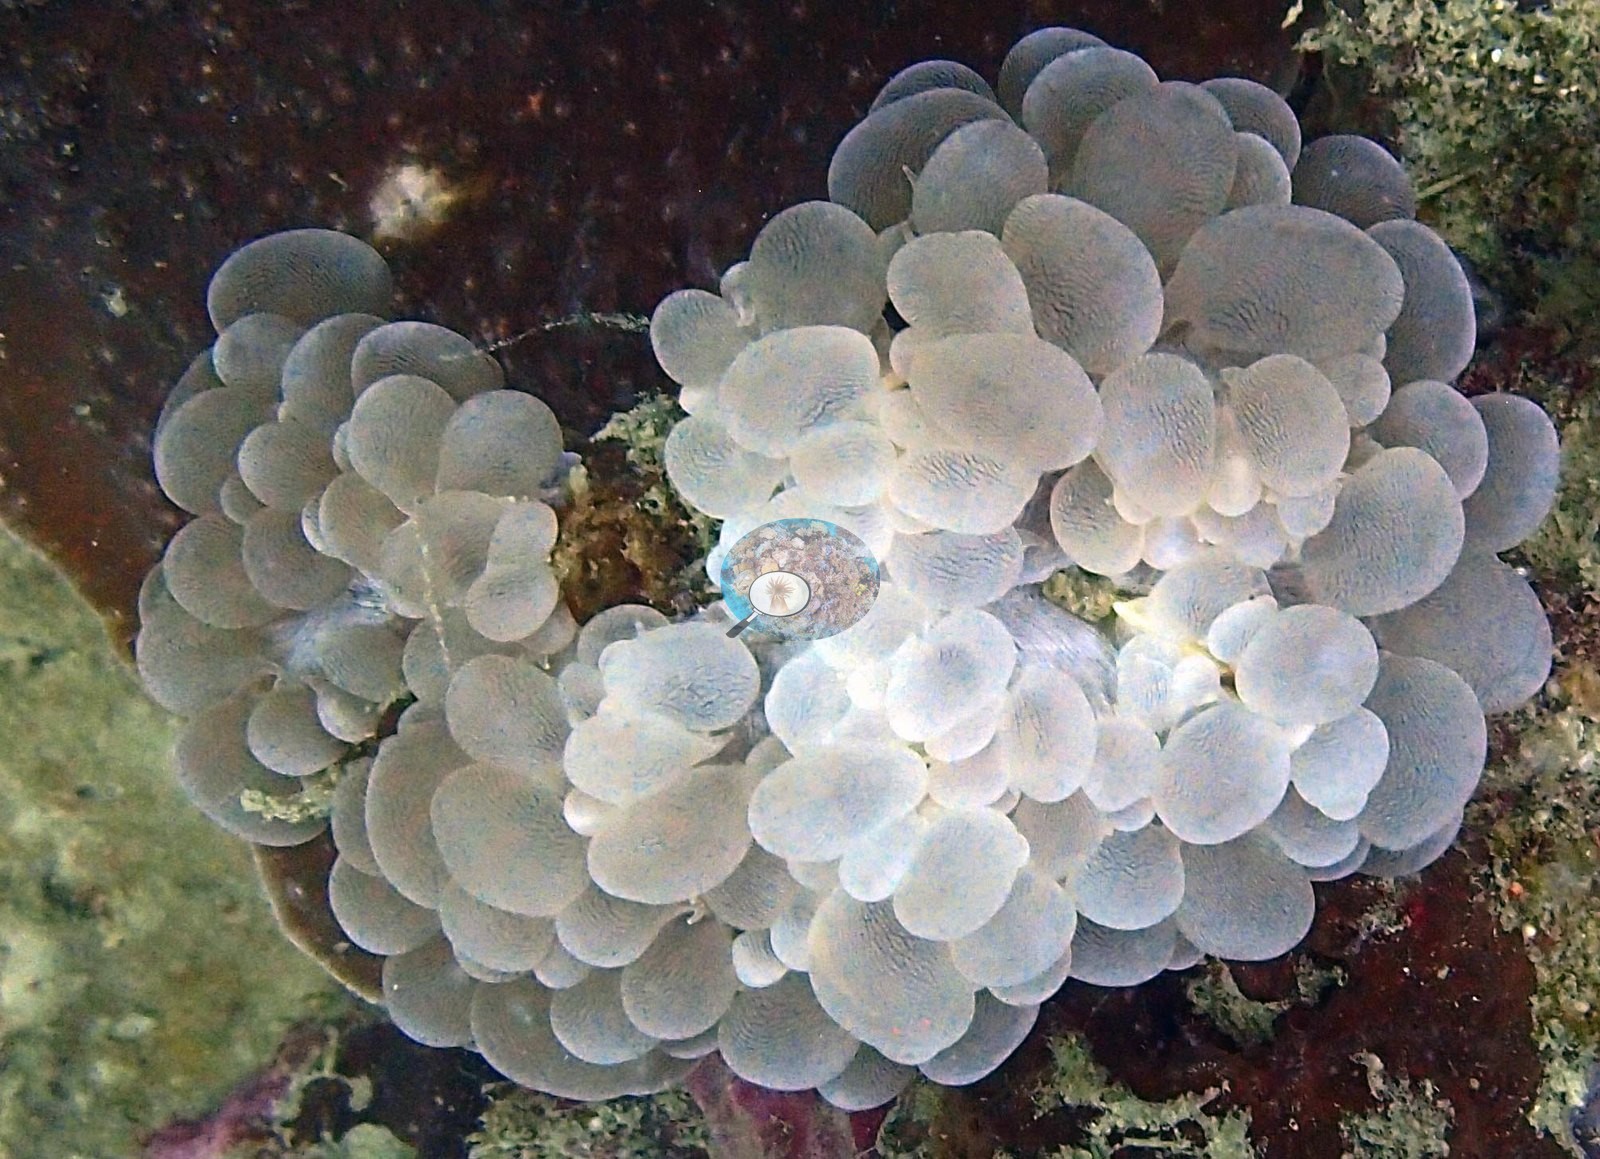
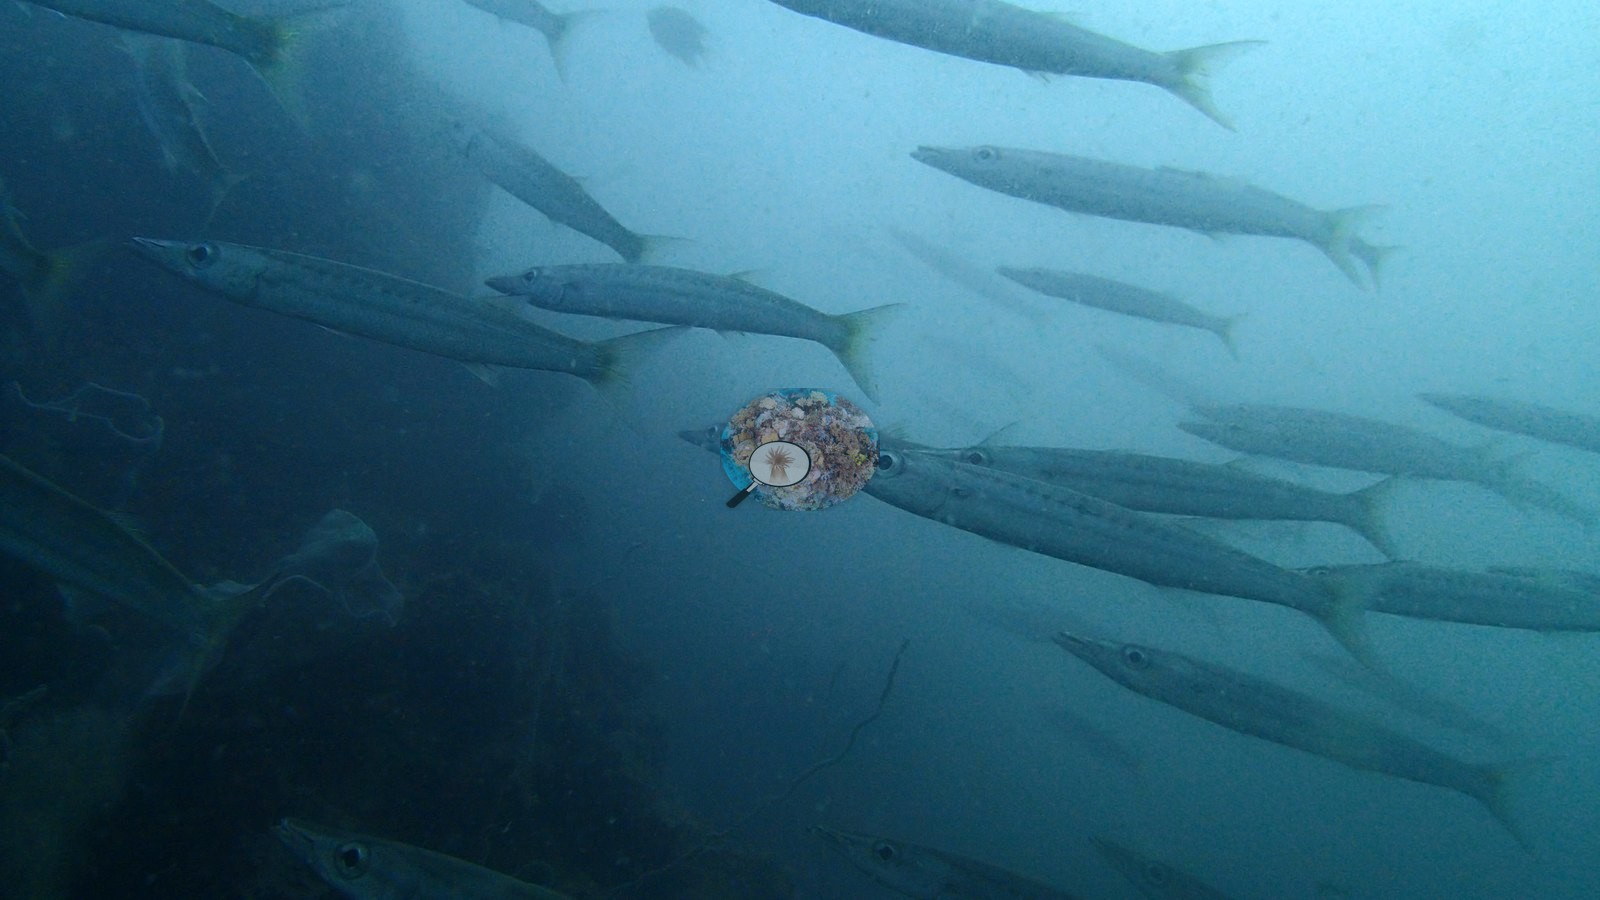
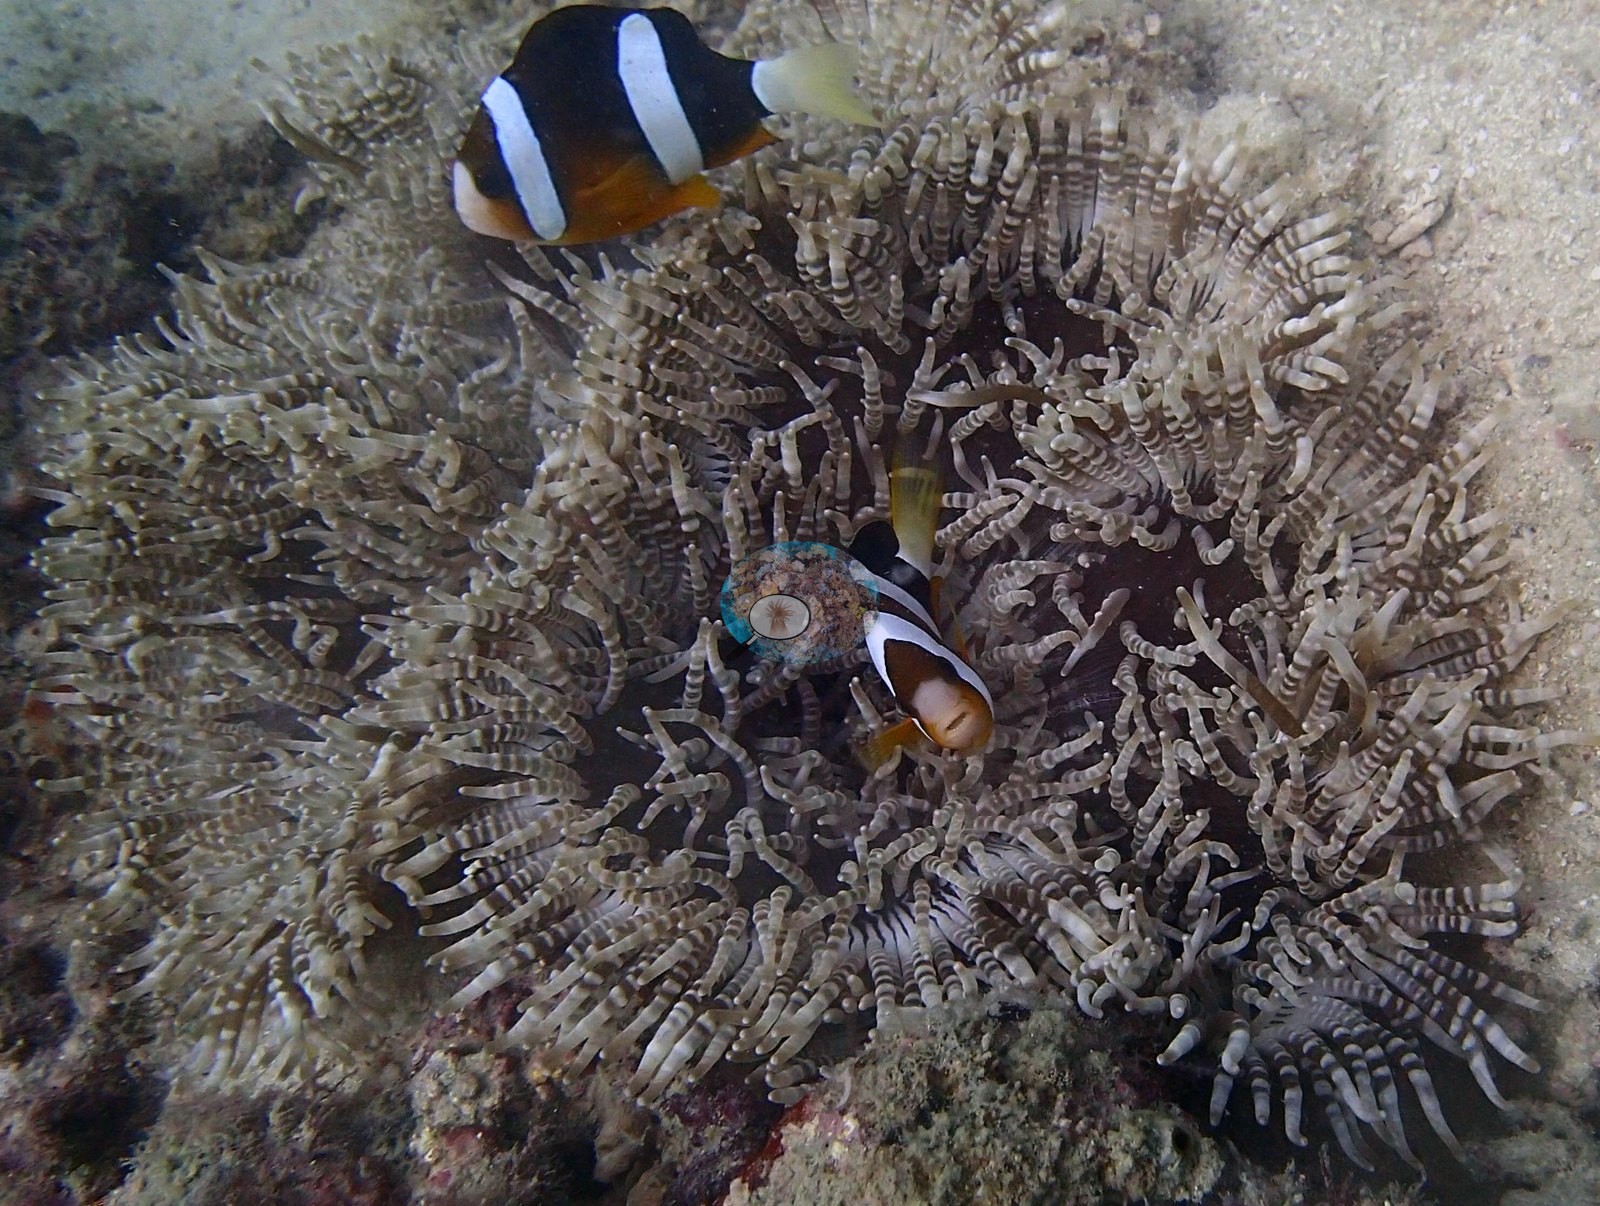
Conditions were poor and Anderson said so in his own filenames - bad viz, inky depths, rough weather - which is worth carrying into any reading of these photographs (e.g., Image 2, Image 4).
General benthic features
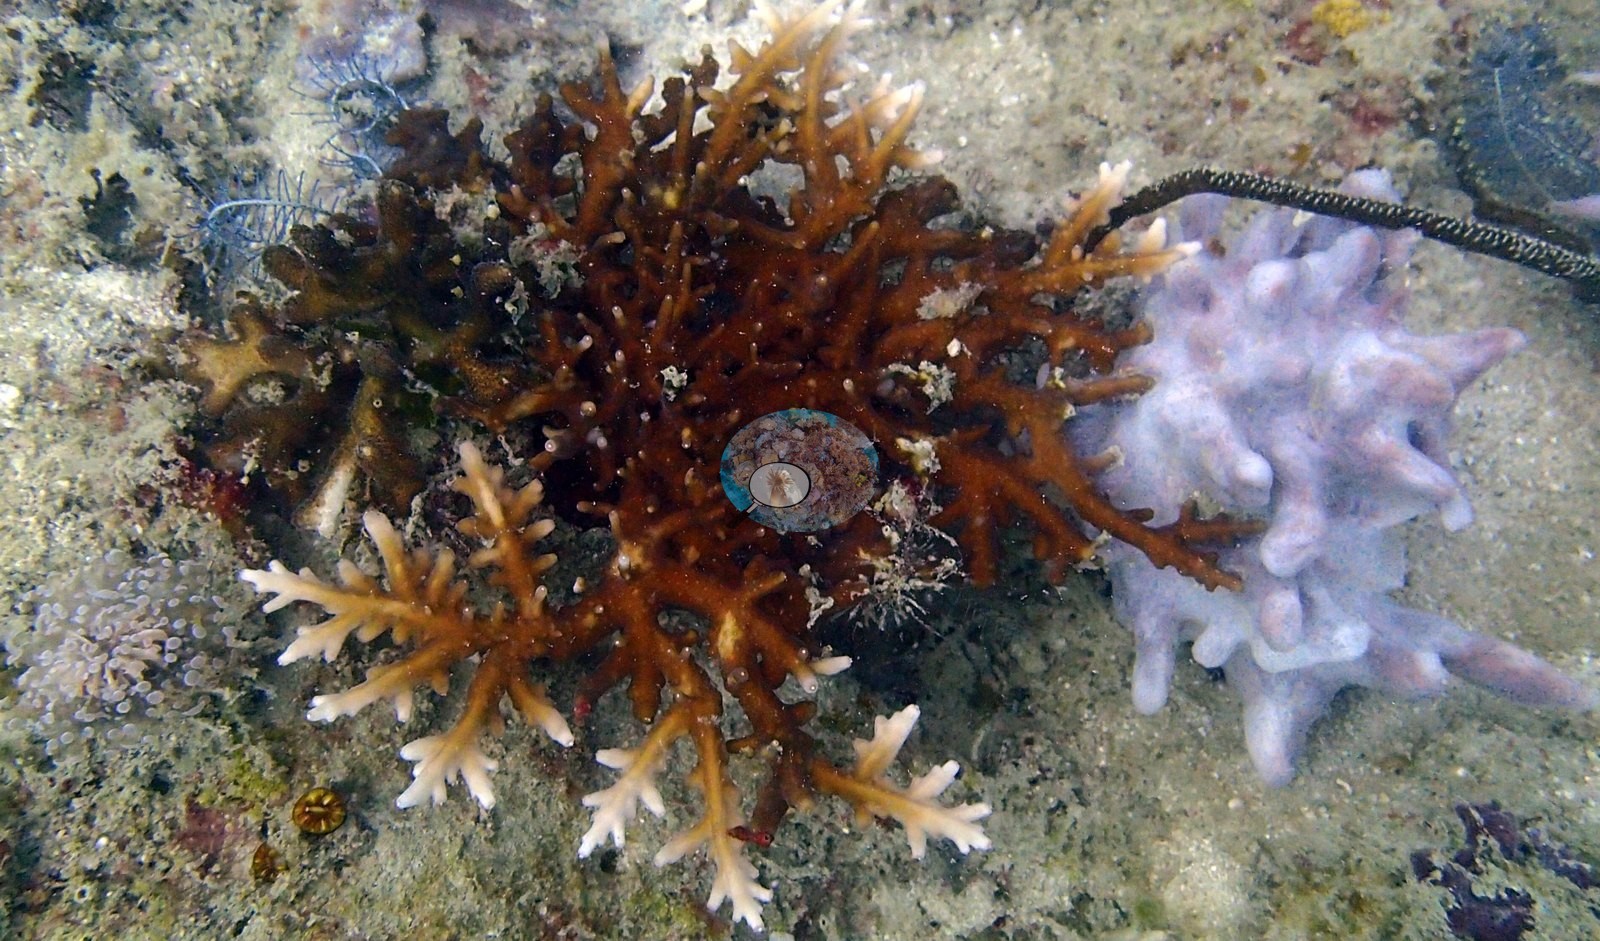
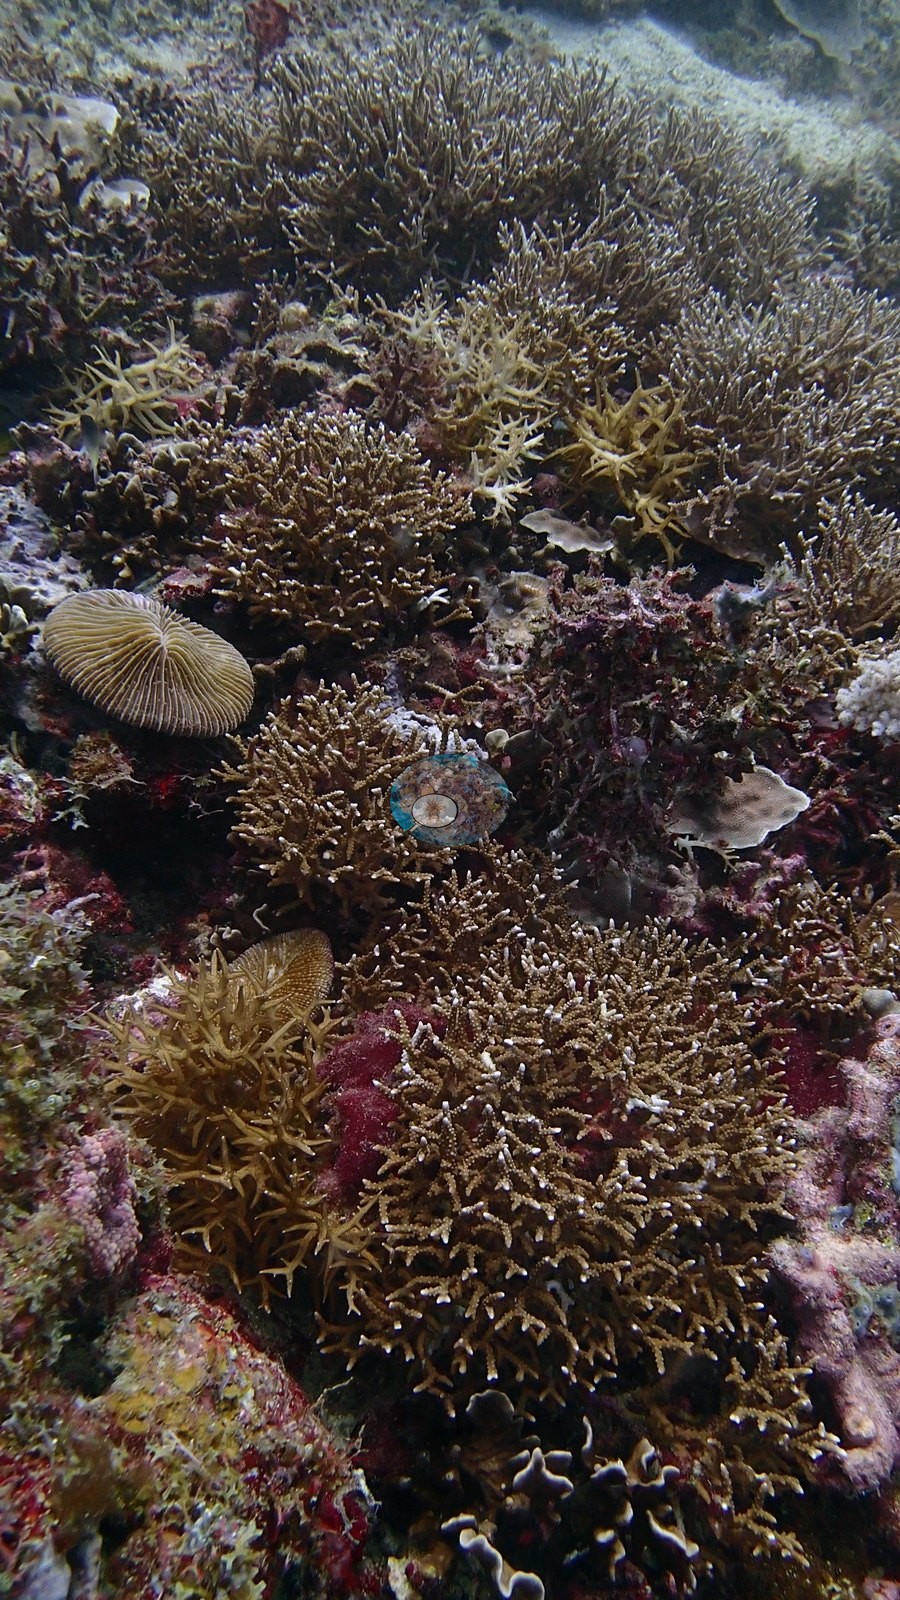
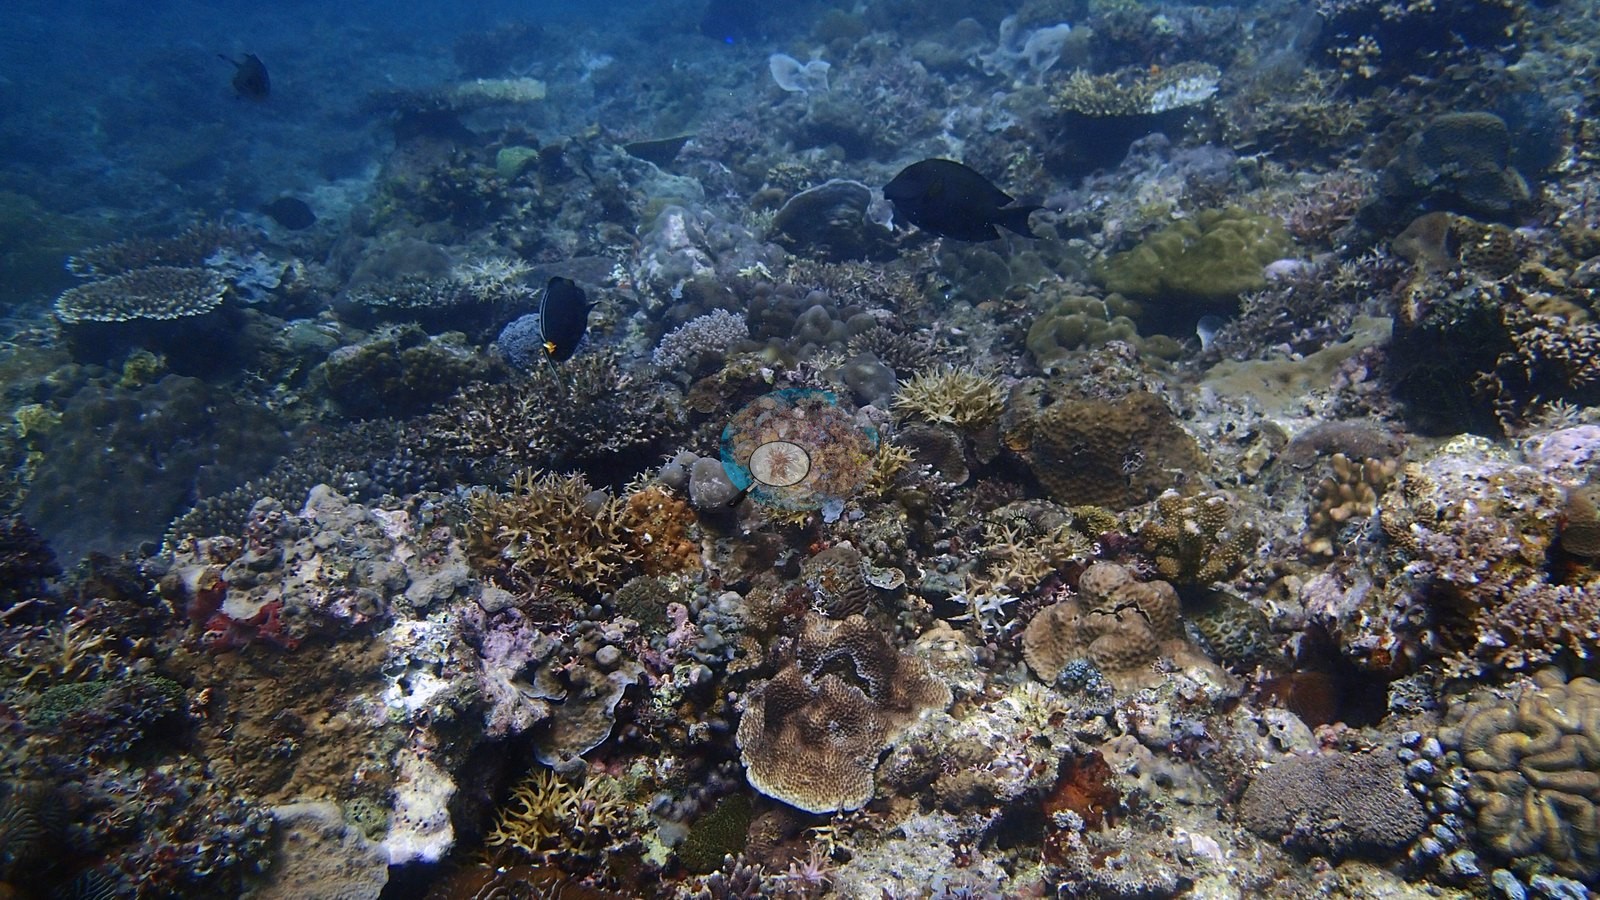
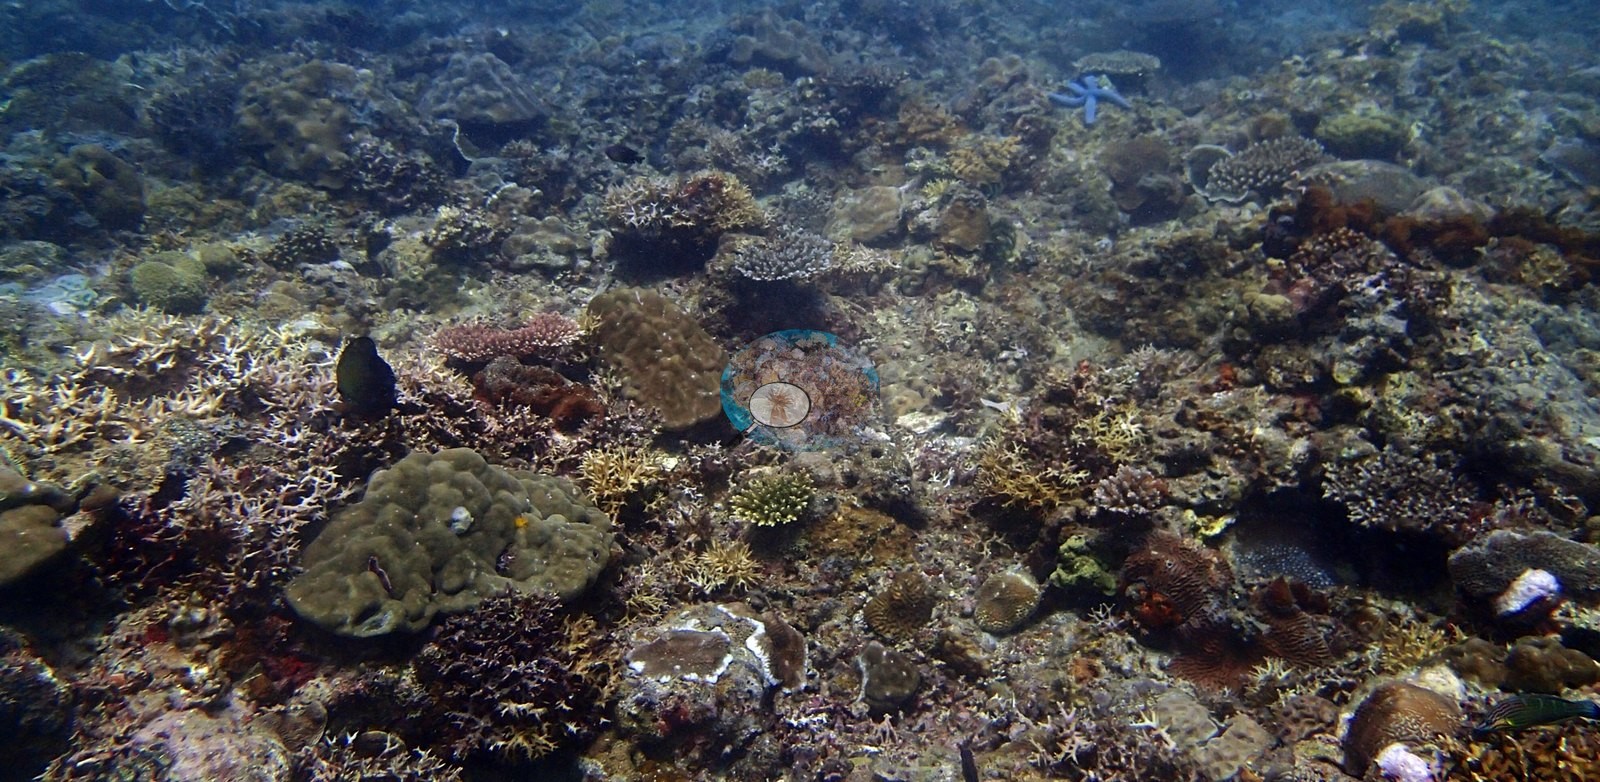
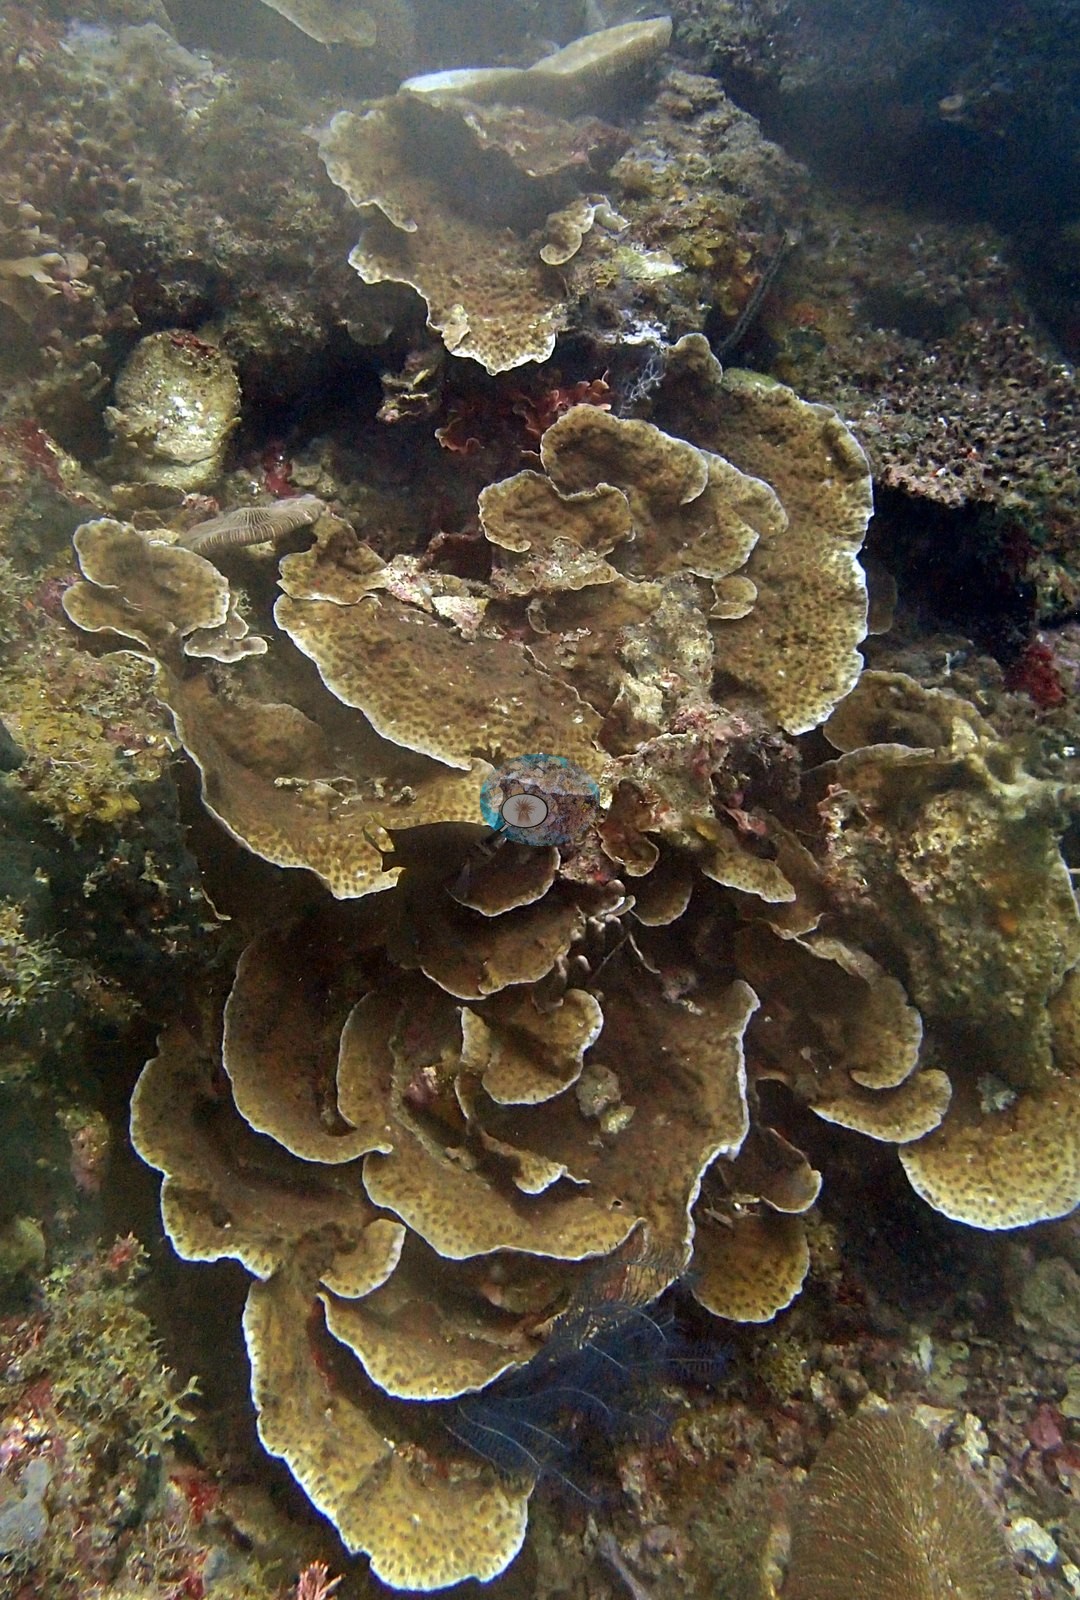
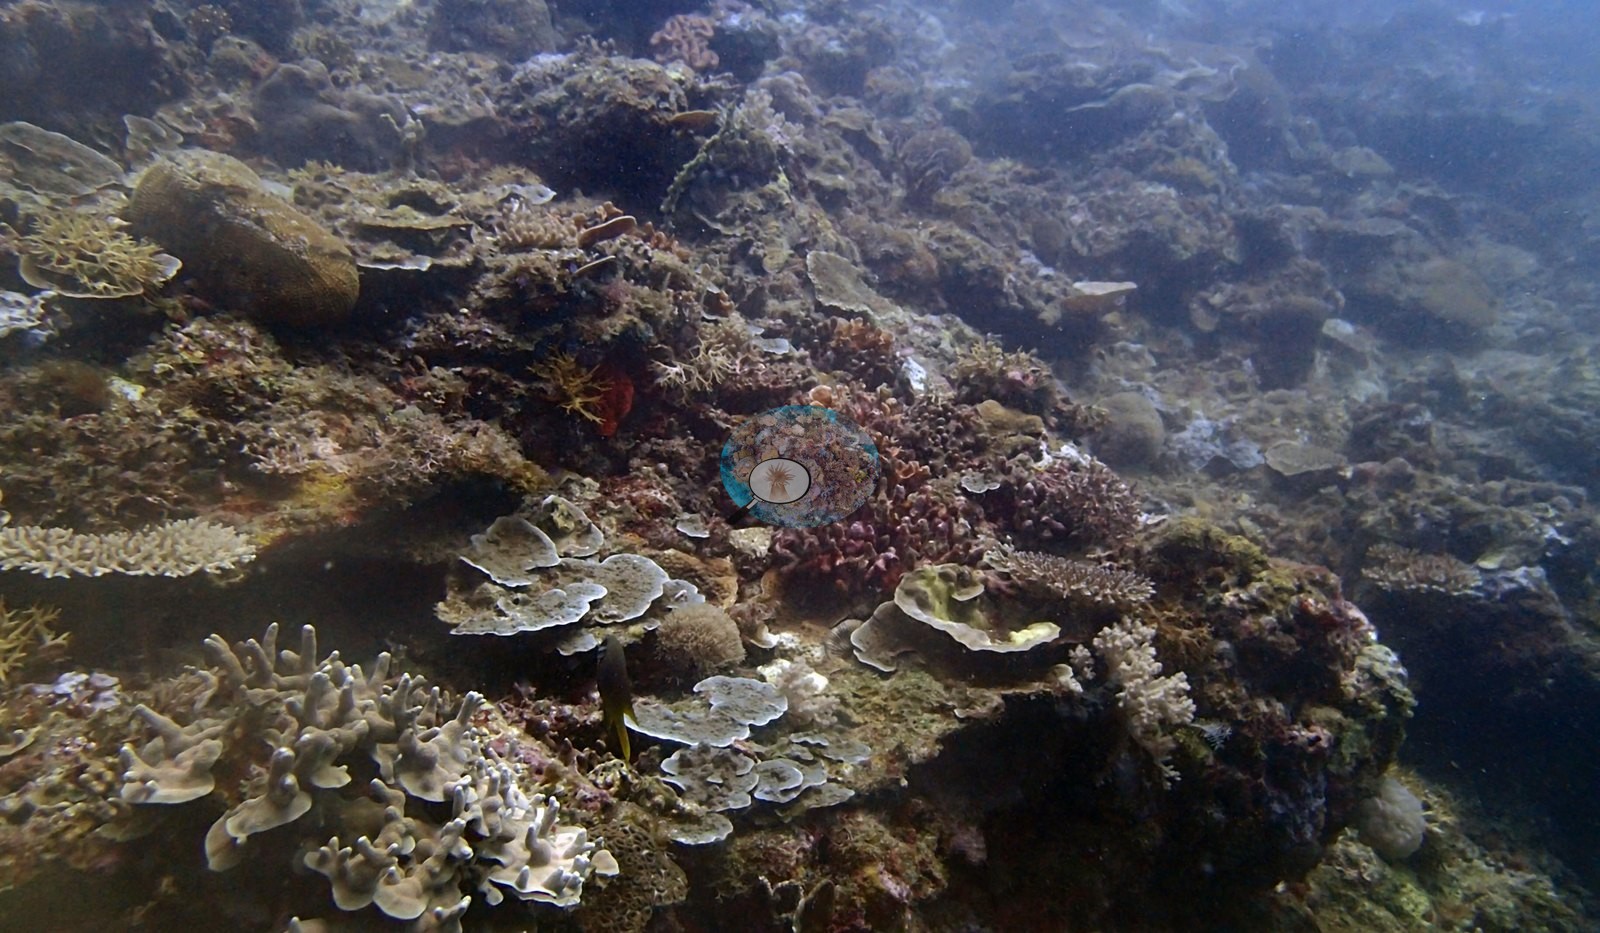
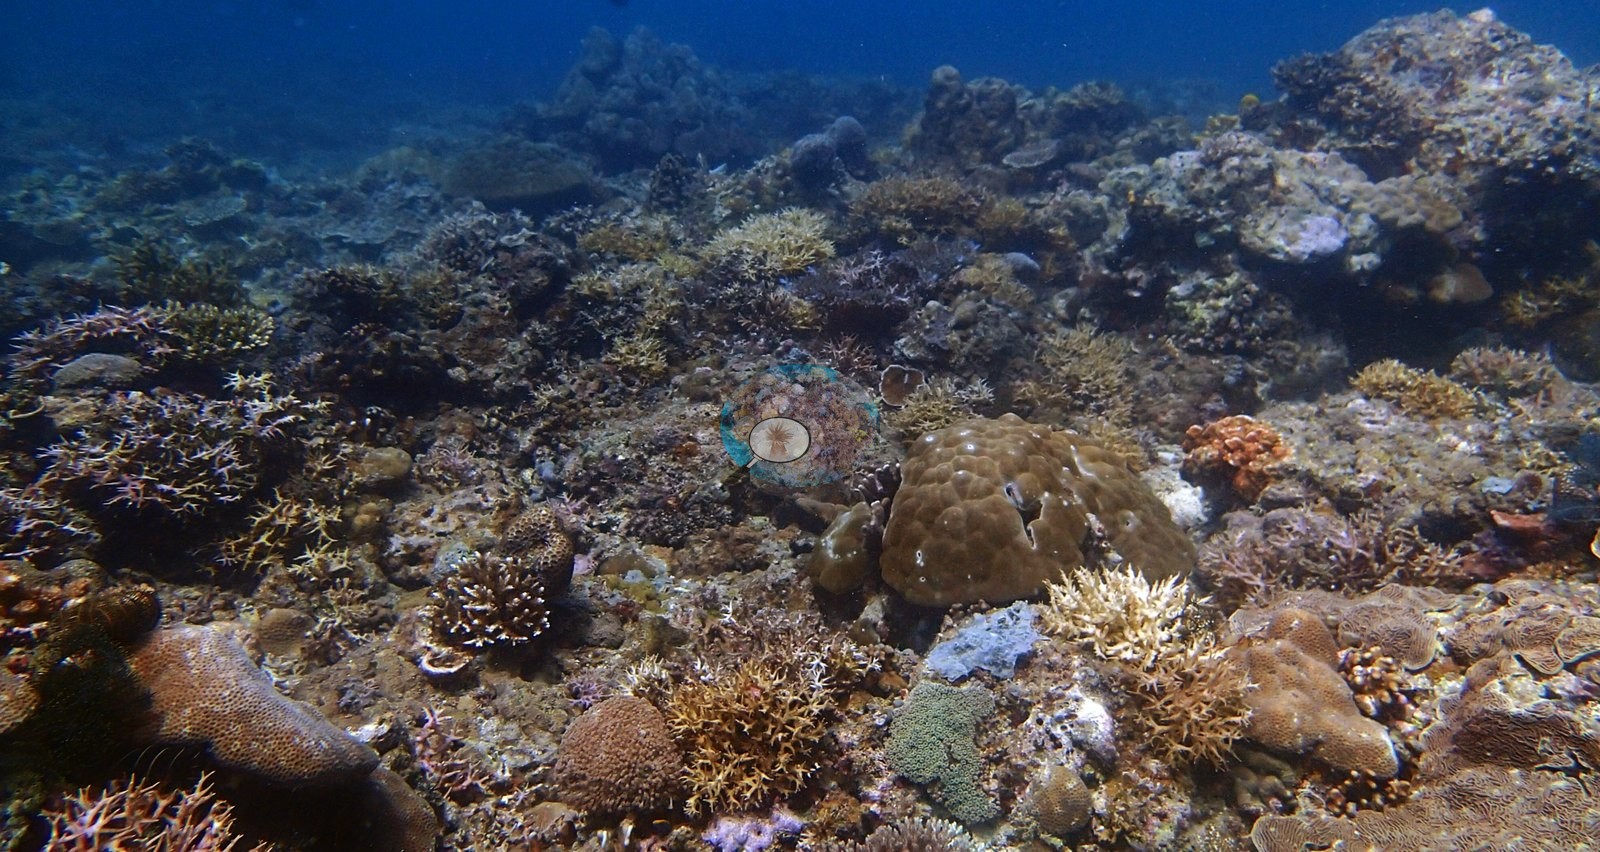
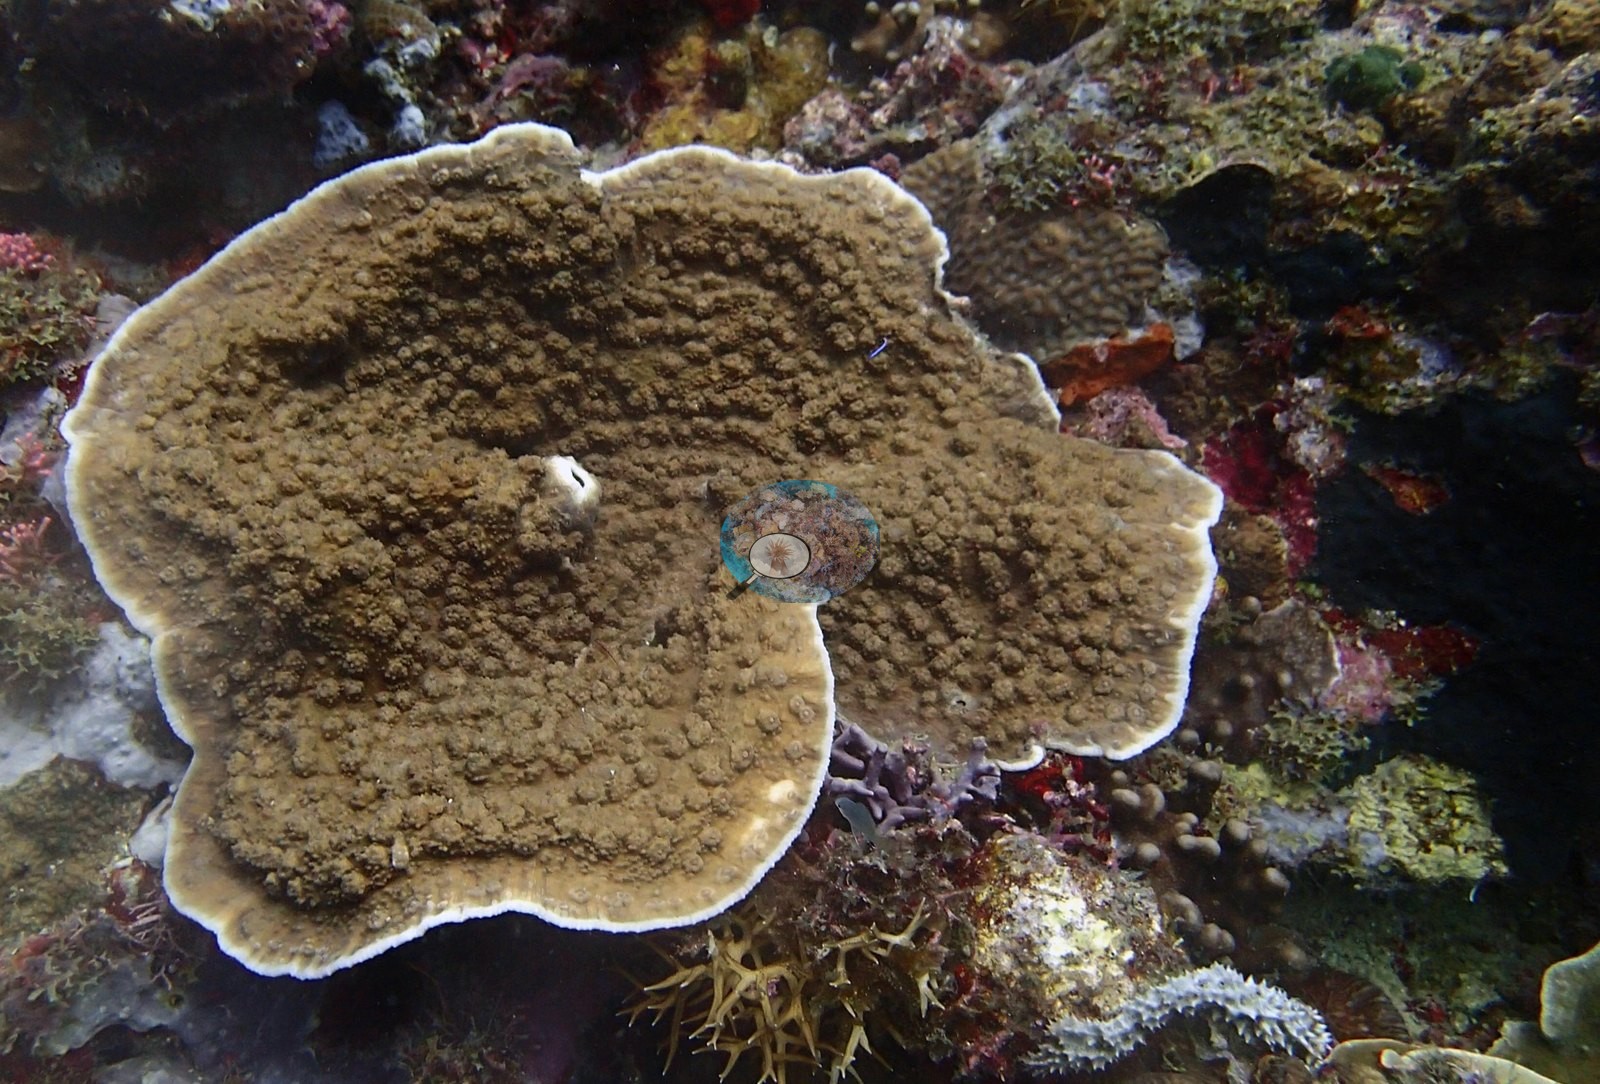
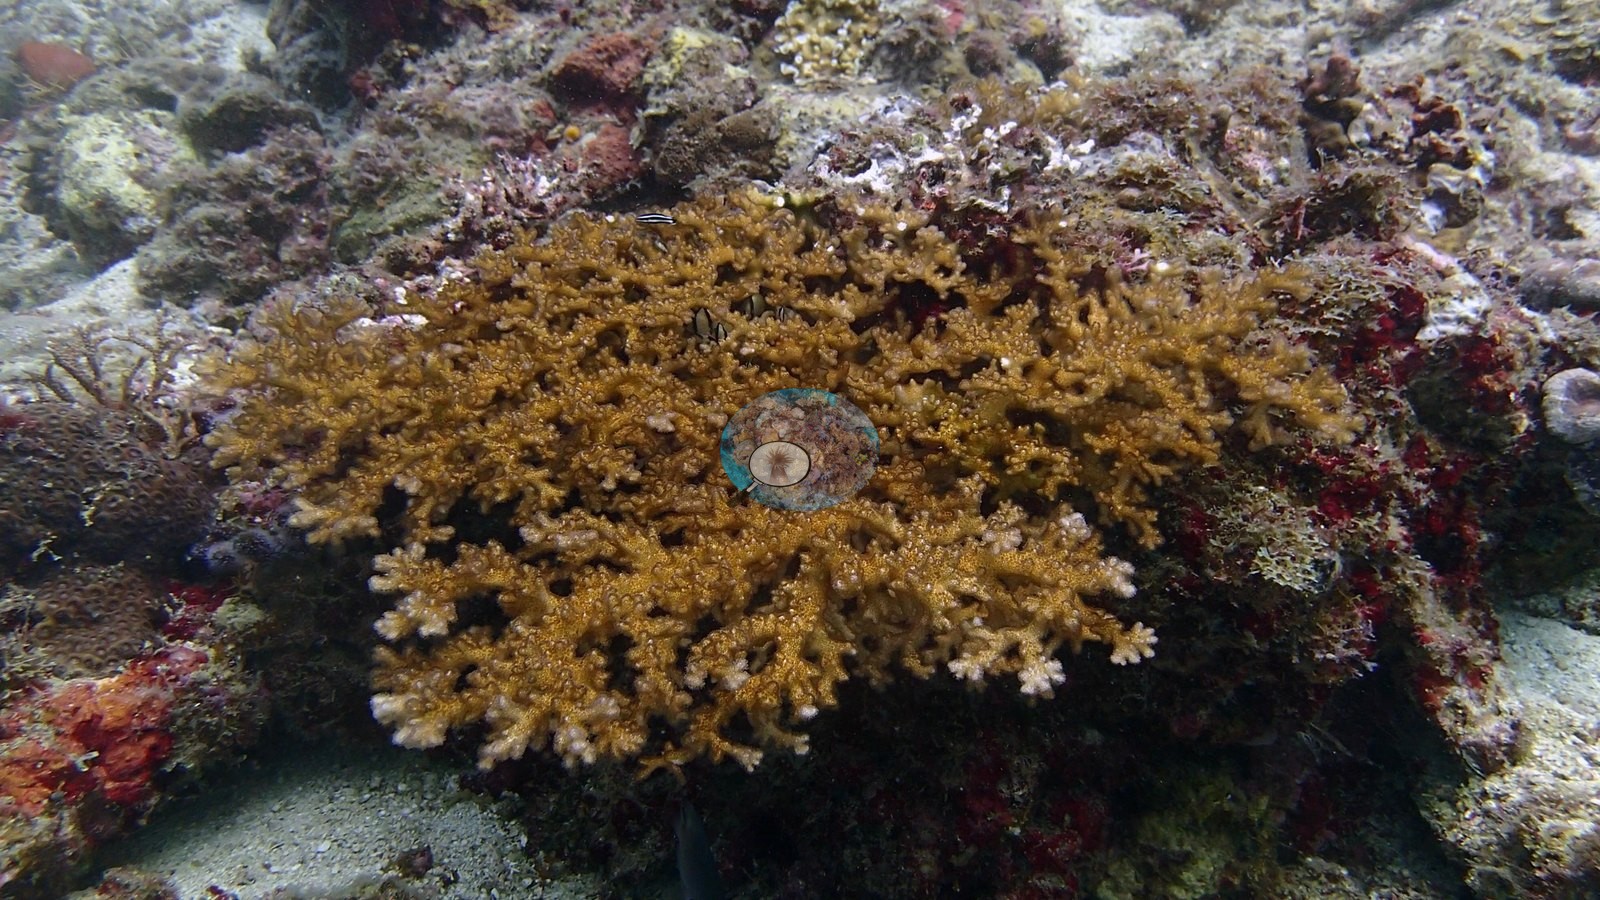
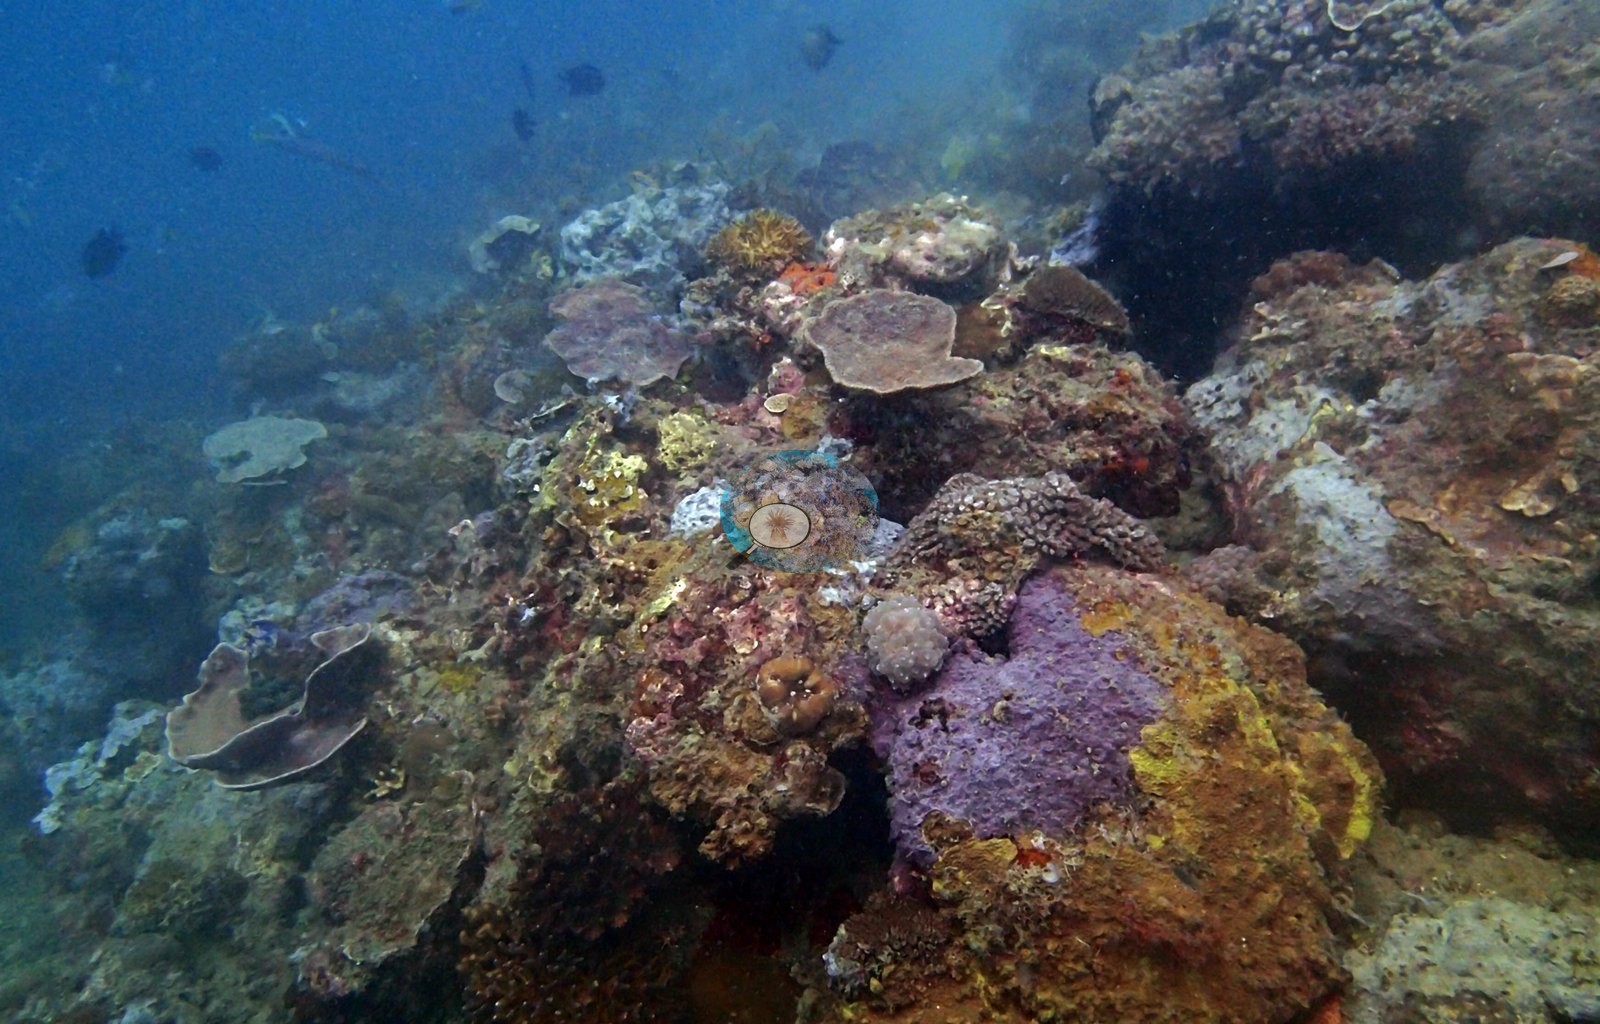
The corals he singled out are the interesting part: Anacropora, an uncommon genus and a worthwhile record; a large pale Plerogyra bubble coral; and Seriatopora photographed twice, the second frame labeled explicitly as a dying colony, which stands as the clearest condition observation at this site (e.g., Image 1, Image 5, Image 6, Image 11).
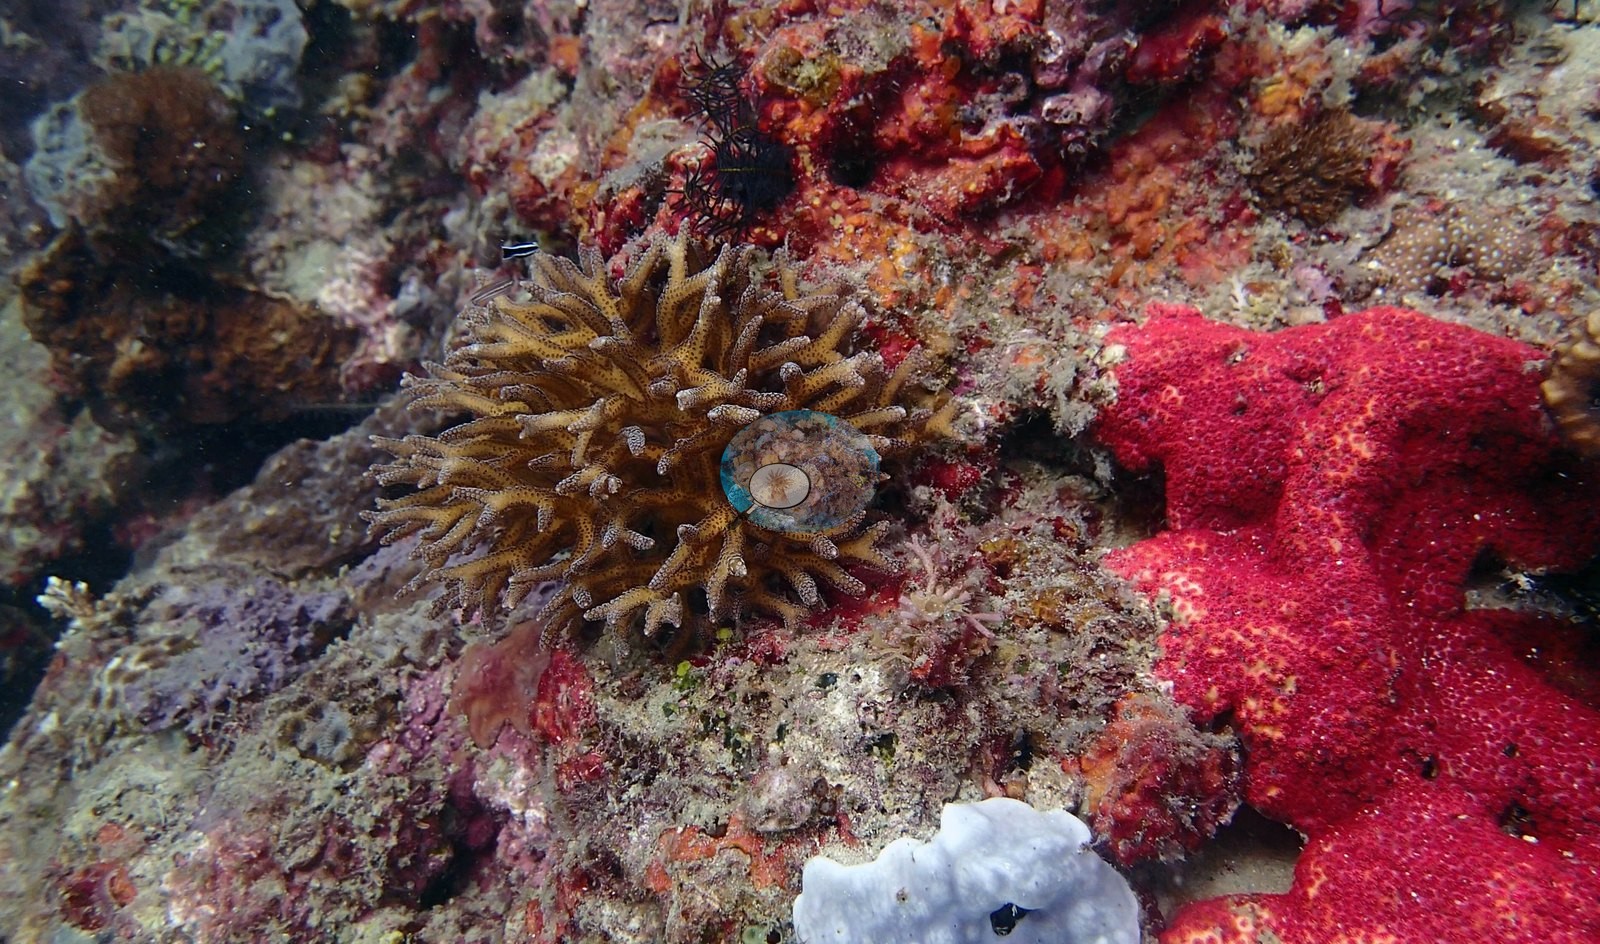
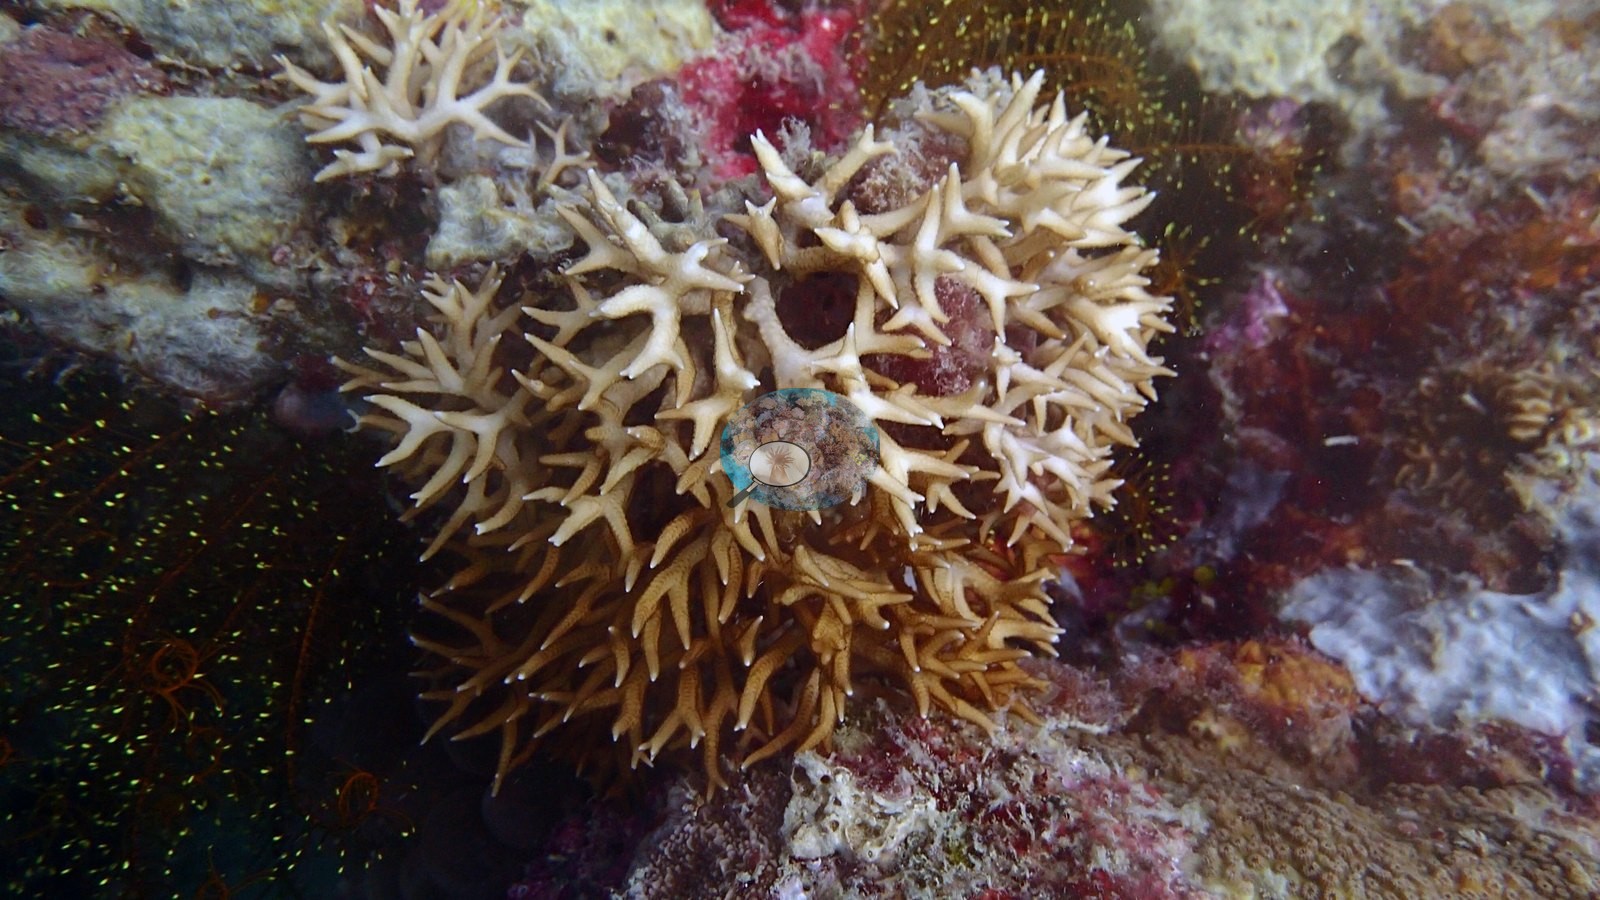
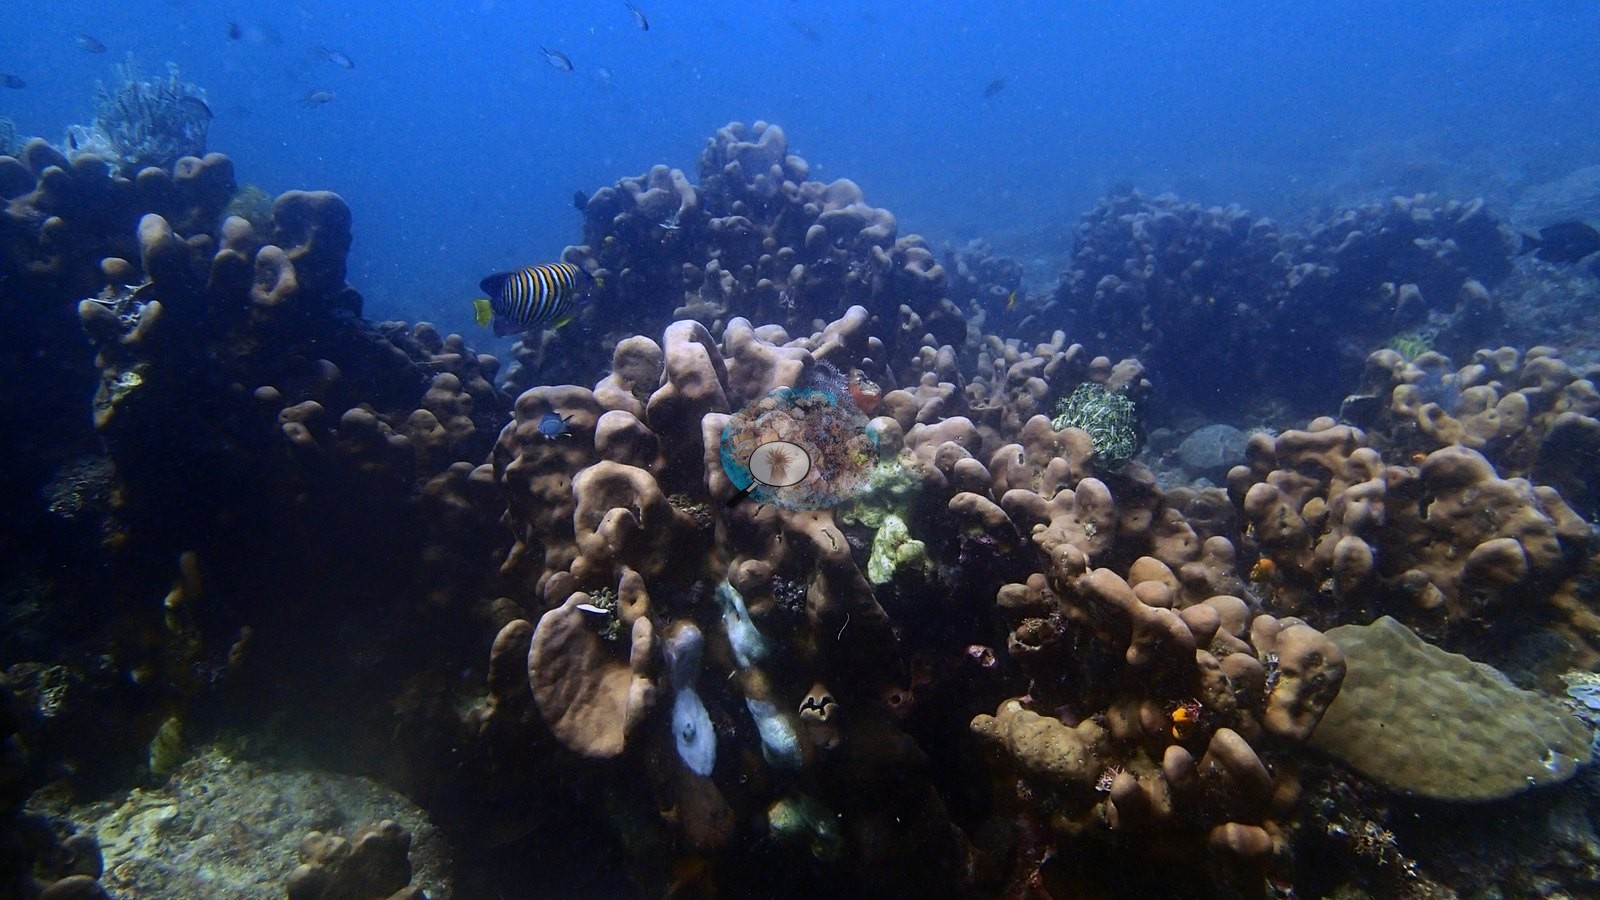
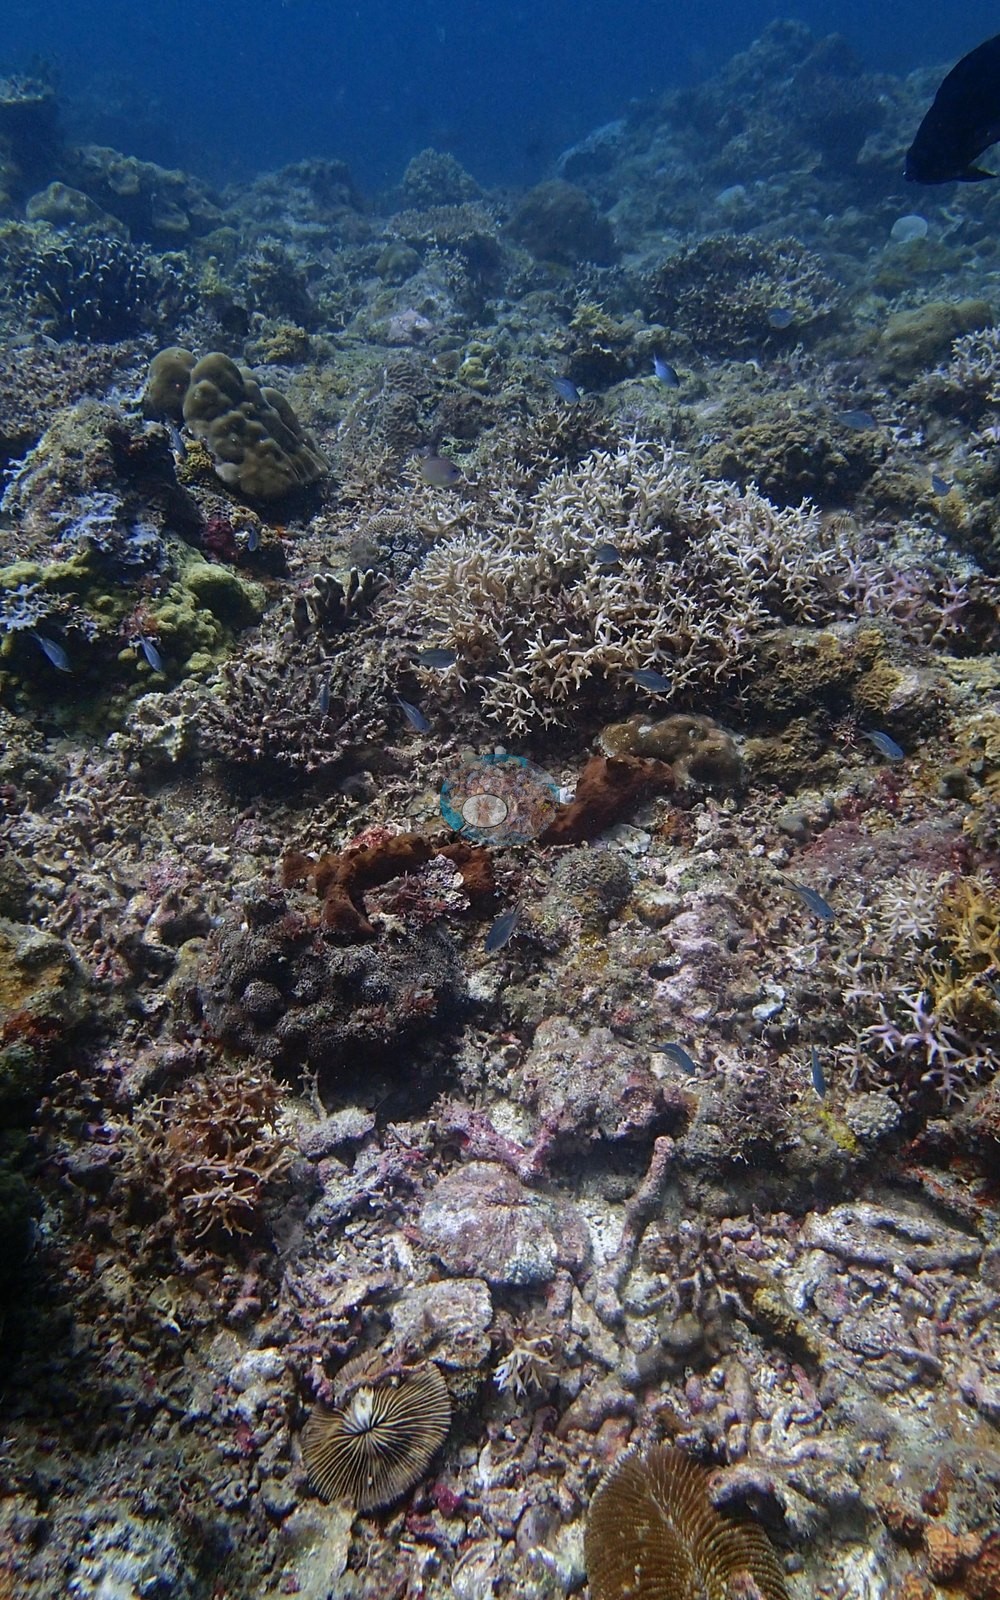
Around them are encrusting and massive colonies, foliose plates, and vivid red and pink encrusting sponges (e.g., Image 3, Image 7).
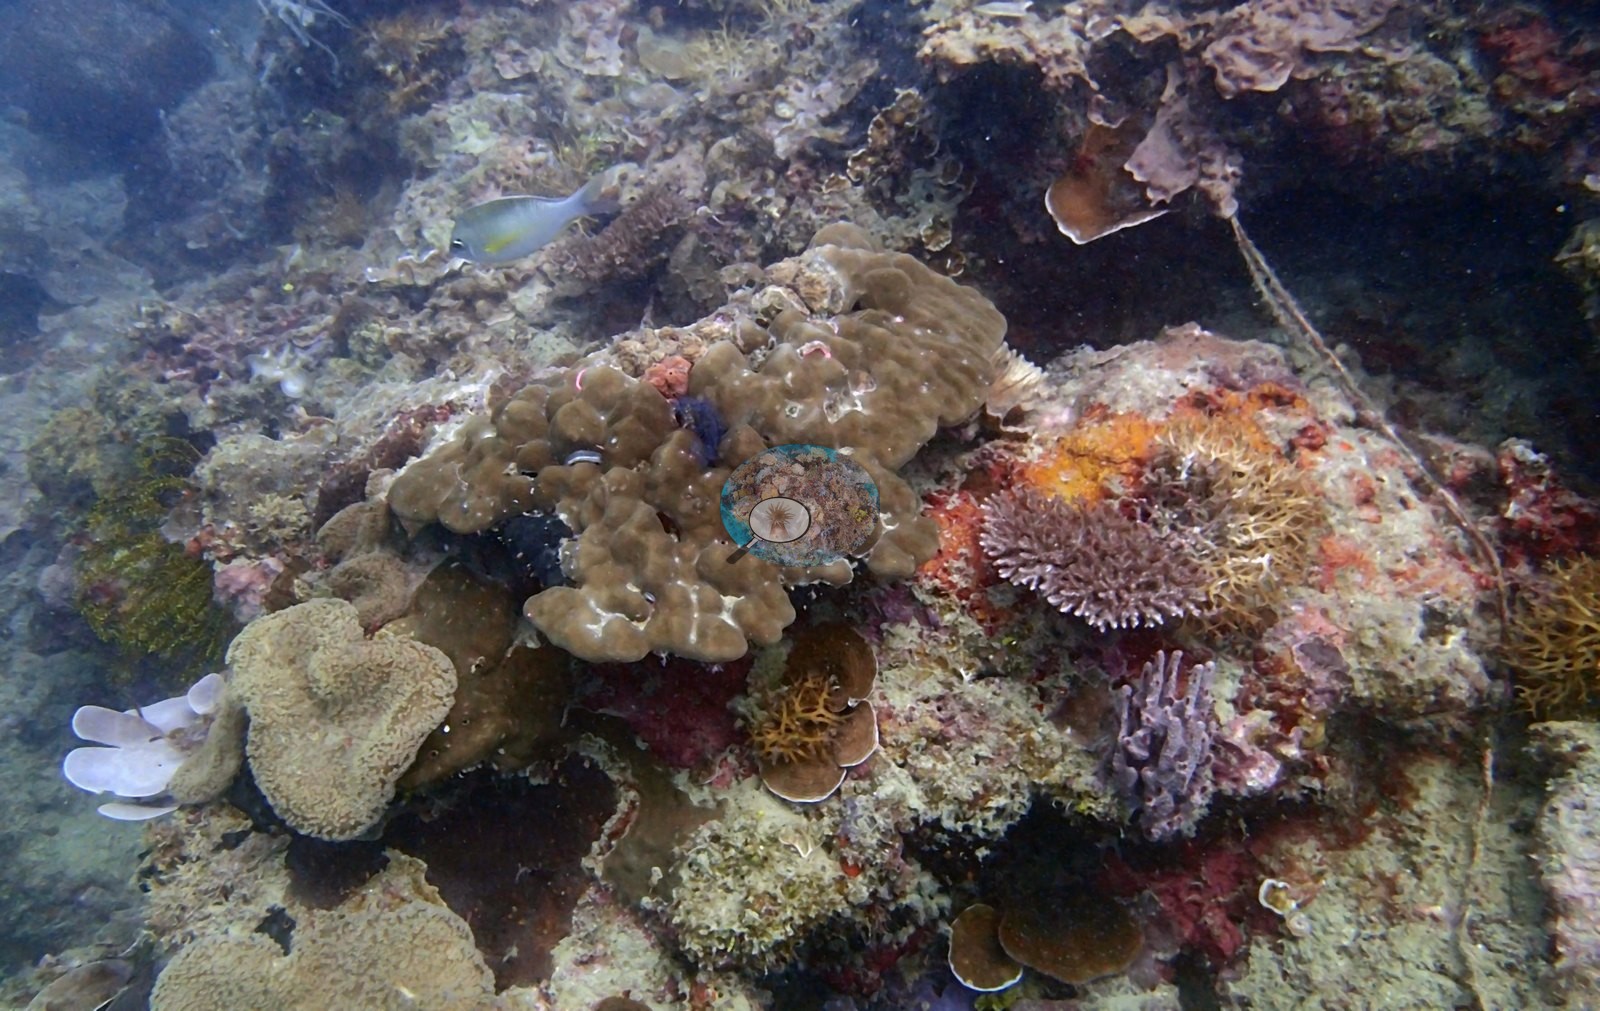
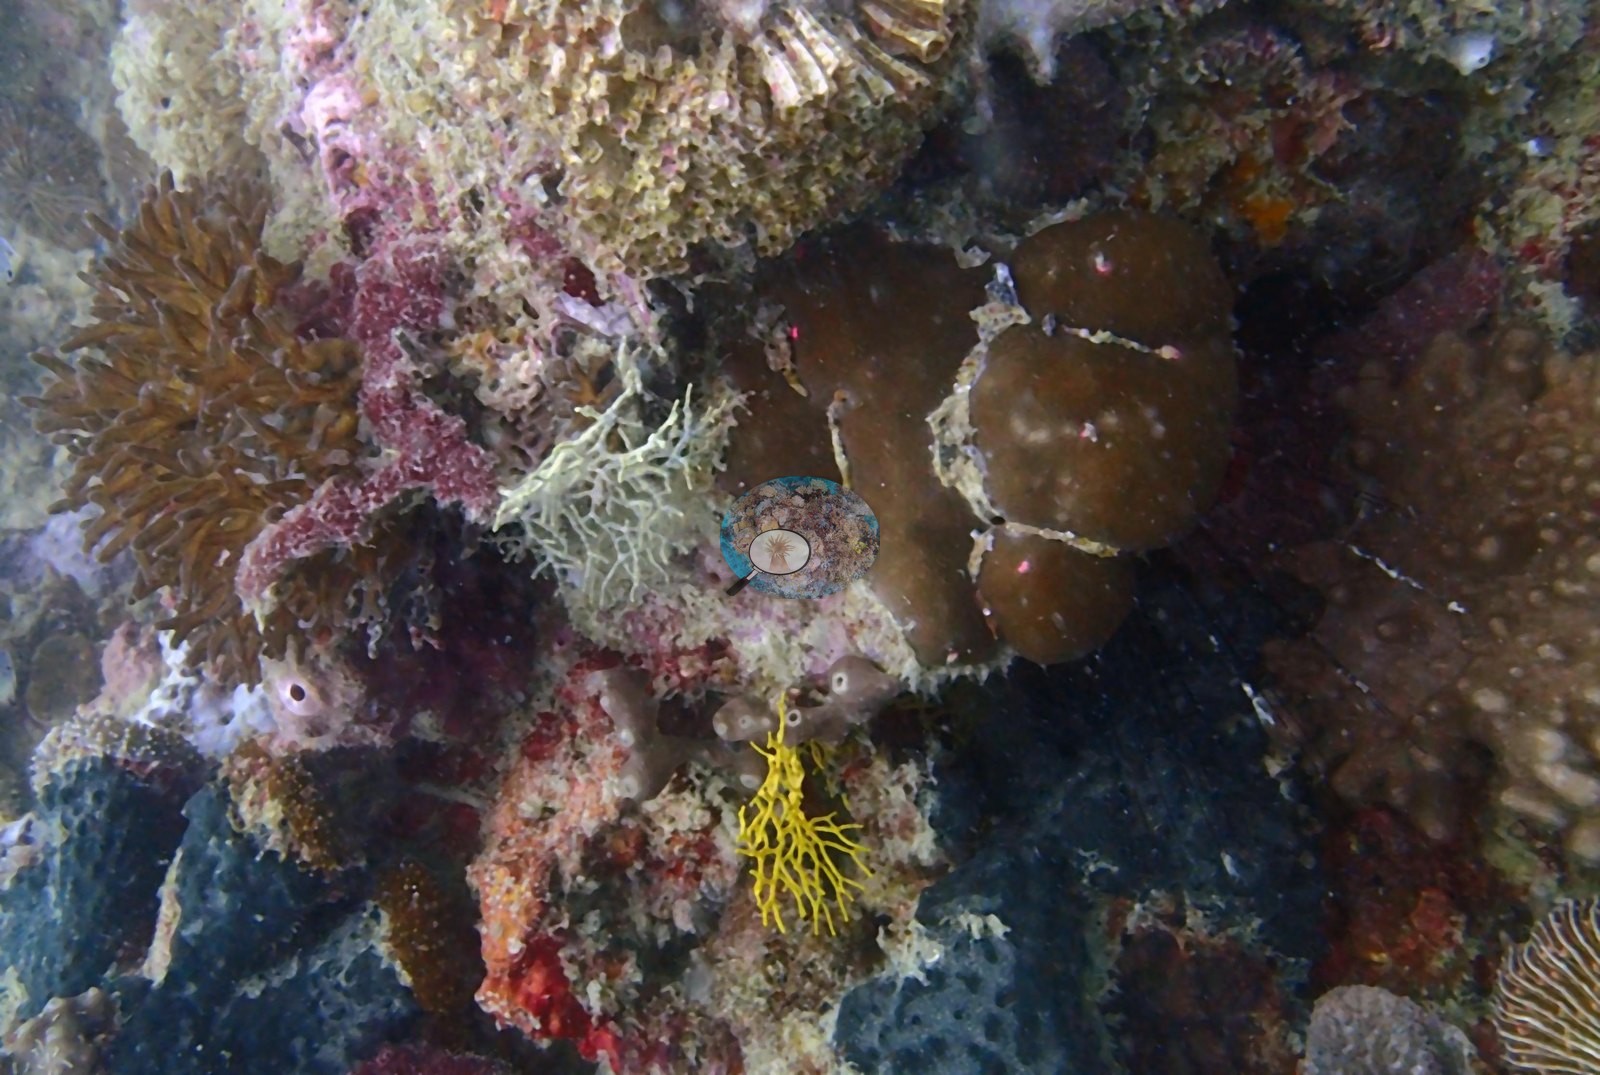
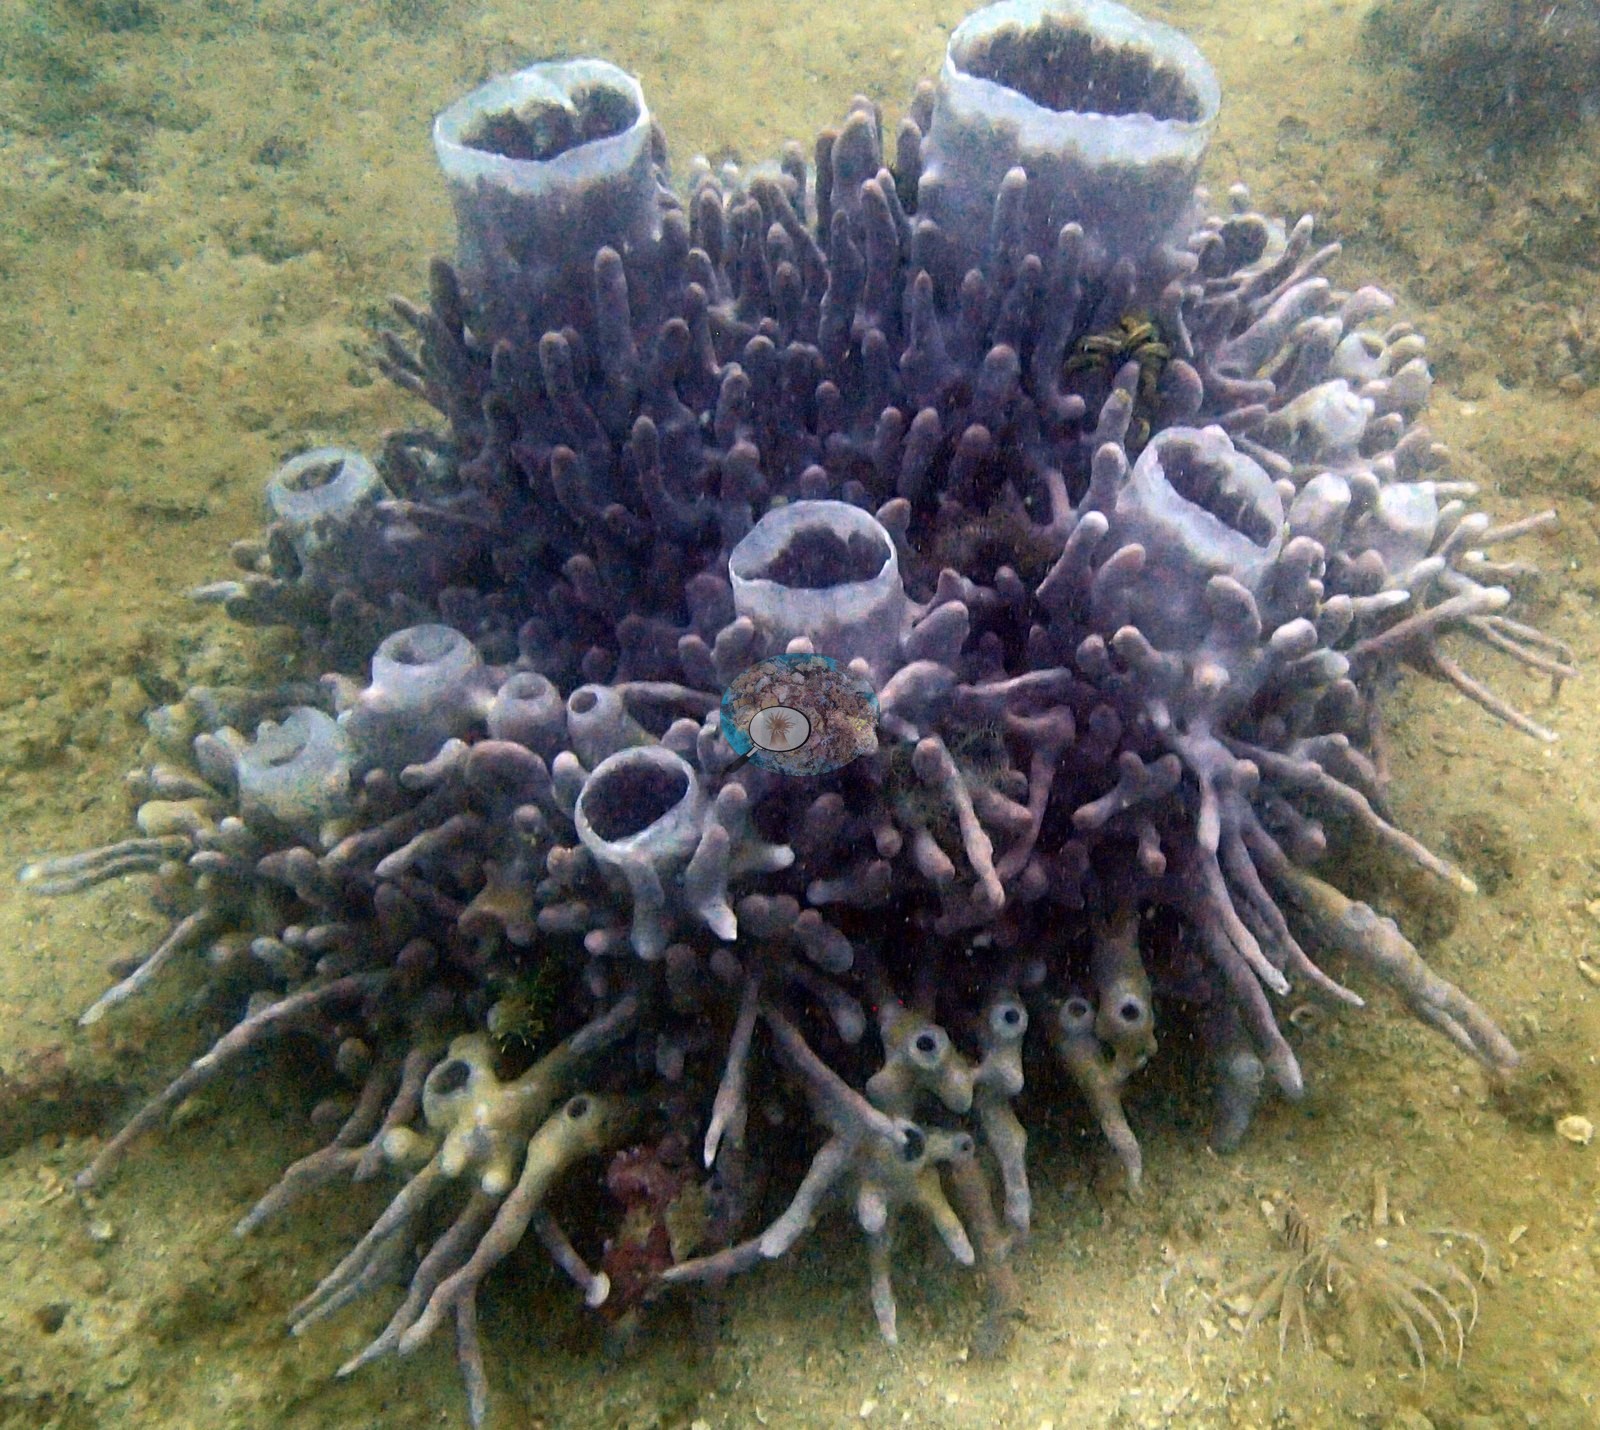
A distinctive lavender-gray cluster of tube sponges standing on open sand rounds out the benthos (e.g., Image 19).
Coral cover
This dive carries a cover figure for the first time, recovered by splitting the pooled 305-frame "bacuit_archipelago" computer vision collection back into its source folders. That collection is not a site: it merges all three El Nido dives with a separate 23 January island-hopping day and 164 mostly topside frames, so its published 19.7 percent DINOv3 / 15.0 percent CoralSCOP row must never be hung on any one pin. The 22 frames that are actually this dive give DINOv3 19.2 percent hard coral (440 points, 95 percent CI 15.2-23.2), or 19.7 percent (95 percent CI 15.4-24.1) across the 19 underwater frames alone. CoralSCOP has since been run over the whole dive: all 22 frames give a computer vision mean of 31.3 percent (median=36.8, range=0.3–71%). That supersedes the single-frame 15.3 percent this site was written against, and it lands well above the 19.2 percent DINOv3 figure this site still carries - a 12-point spread, in the direction the method's known bias predicts. The two models fail differently. CoralSCOP computer vision reads high on low-cover reefs - a median=1.68x a co-located diver survey, 4.6x at worst - and masks sponge and soft coral as readily as stony coral. DINOv3 is strong in-domain (6-class macro-F1 0.62) but degrades on unseen reefs, with cross-domain point accuracy of 0.17-0.25; here it returned 18.9 percent hard coral for a topside photograph of the boat, and its highest-scoring frame in the entire dive is one he labeled "dying Seri" at 42.5 percent. Coral cover: 17% — photo-derived, and the two methods broadly agree (19% vs 15%). Two independent computer vision passes were run over Anderson's own frames: a DINOv3 calibrated point classifier reads 19.2% and a CoralSCOP computer vision reads 15.3%, a spread of 3.9 percentage points. The map publishes a single figure so sites can be sorted against one another, but the honest statement of what is known here is the 15–19% range: the two products have different denominators and should not be treated as one measurement.
Stressors
No crown-of-thorns starfish (COTS) or other corallivores evident.
Fish and other fauna
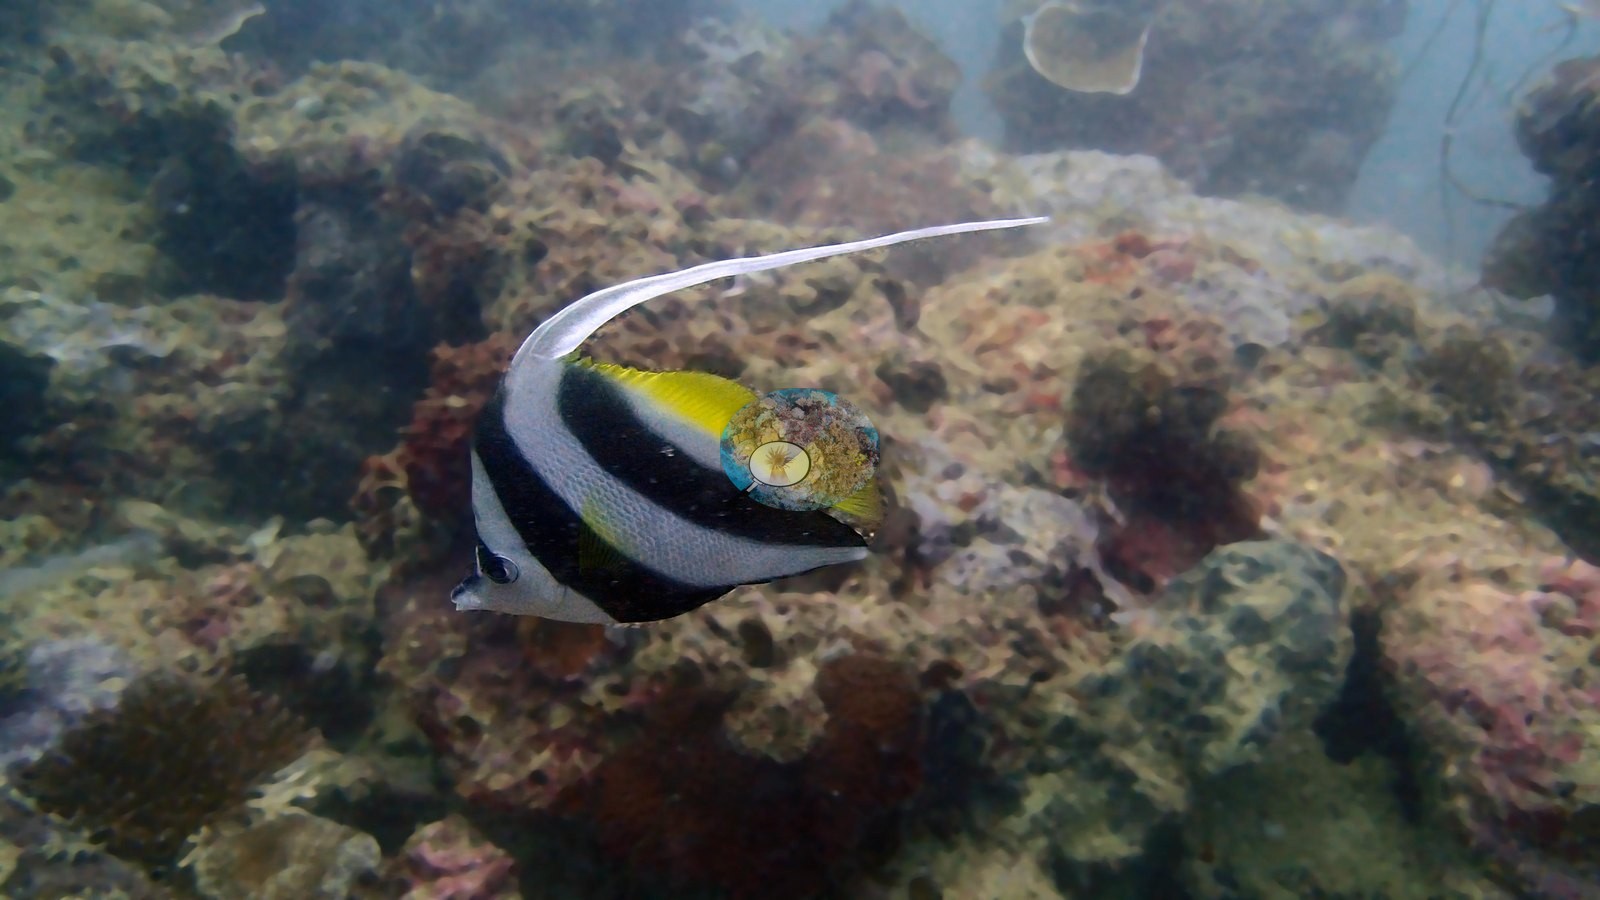
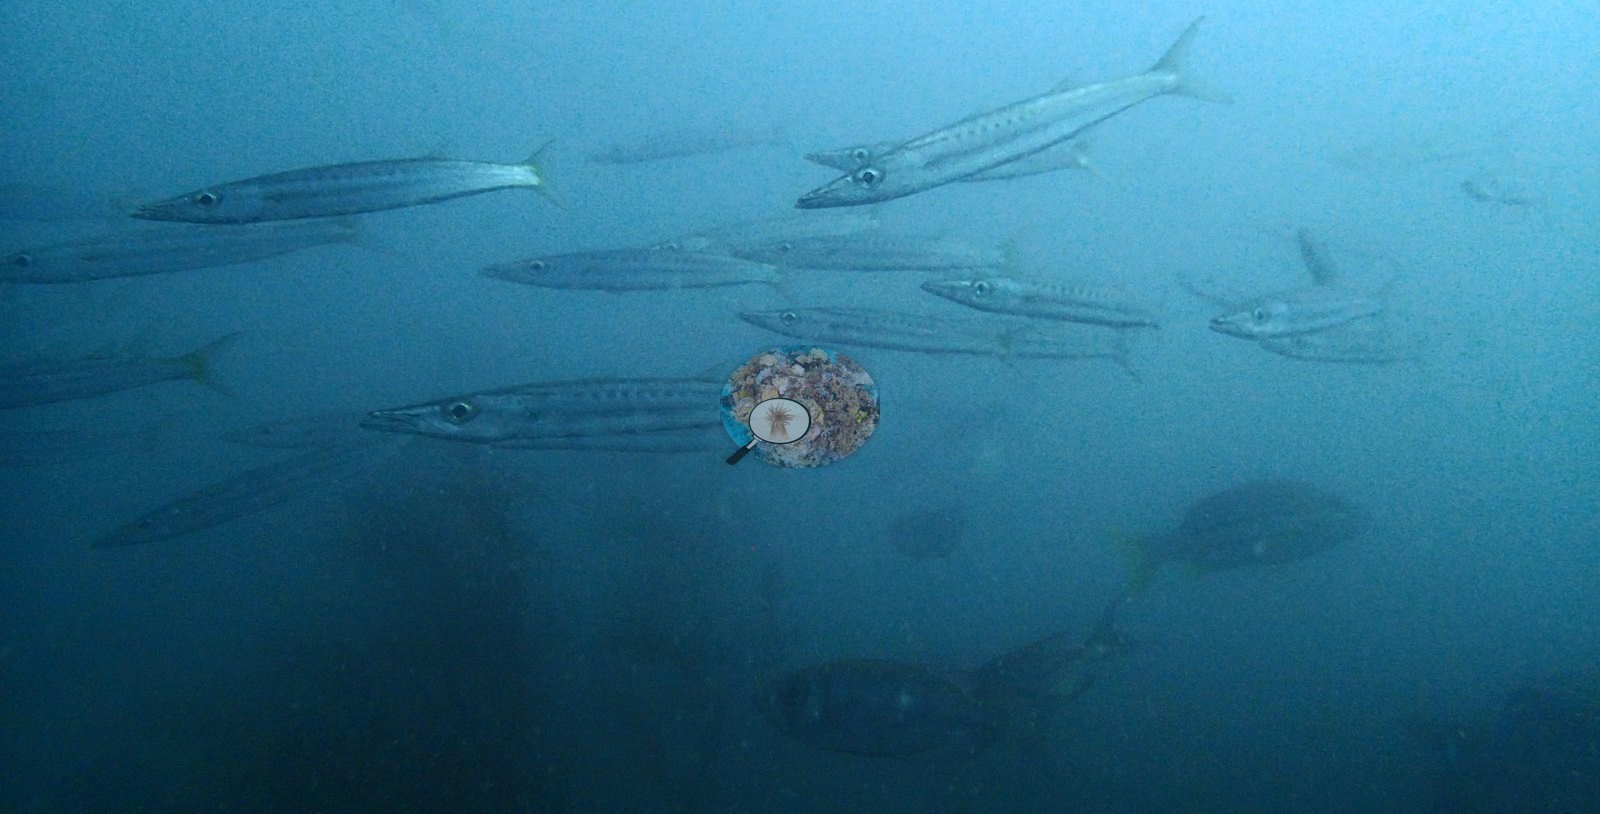
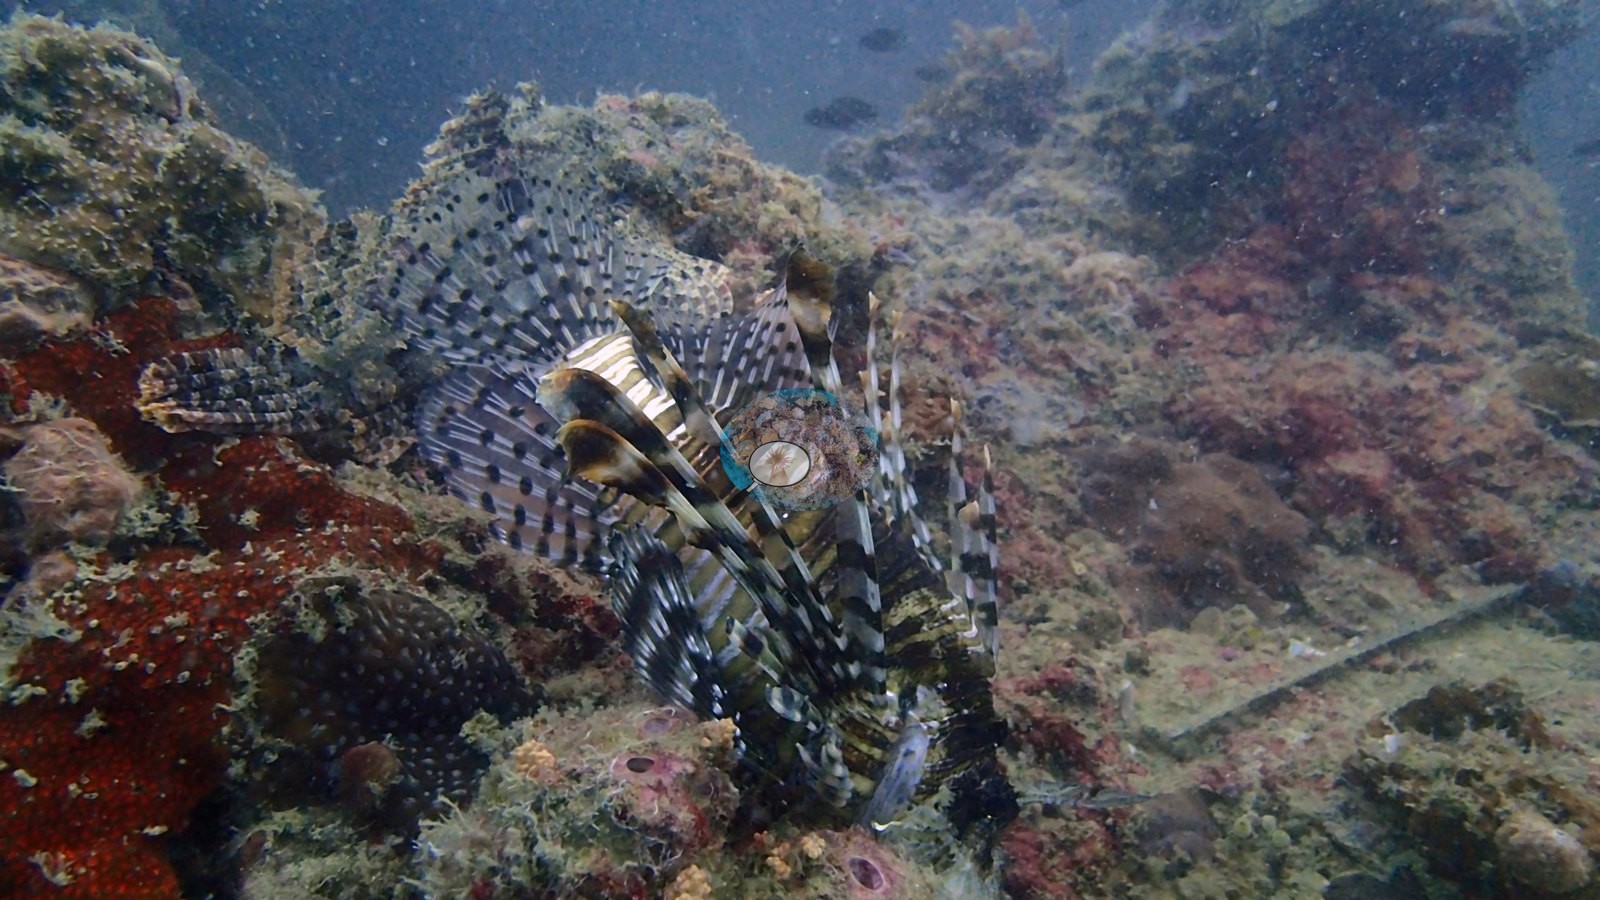
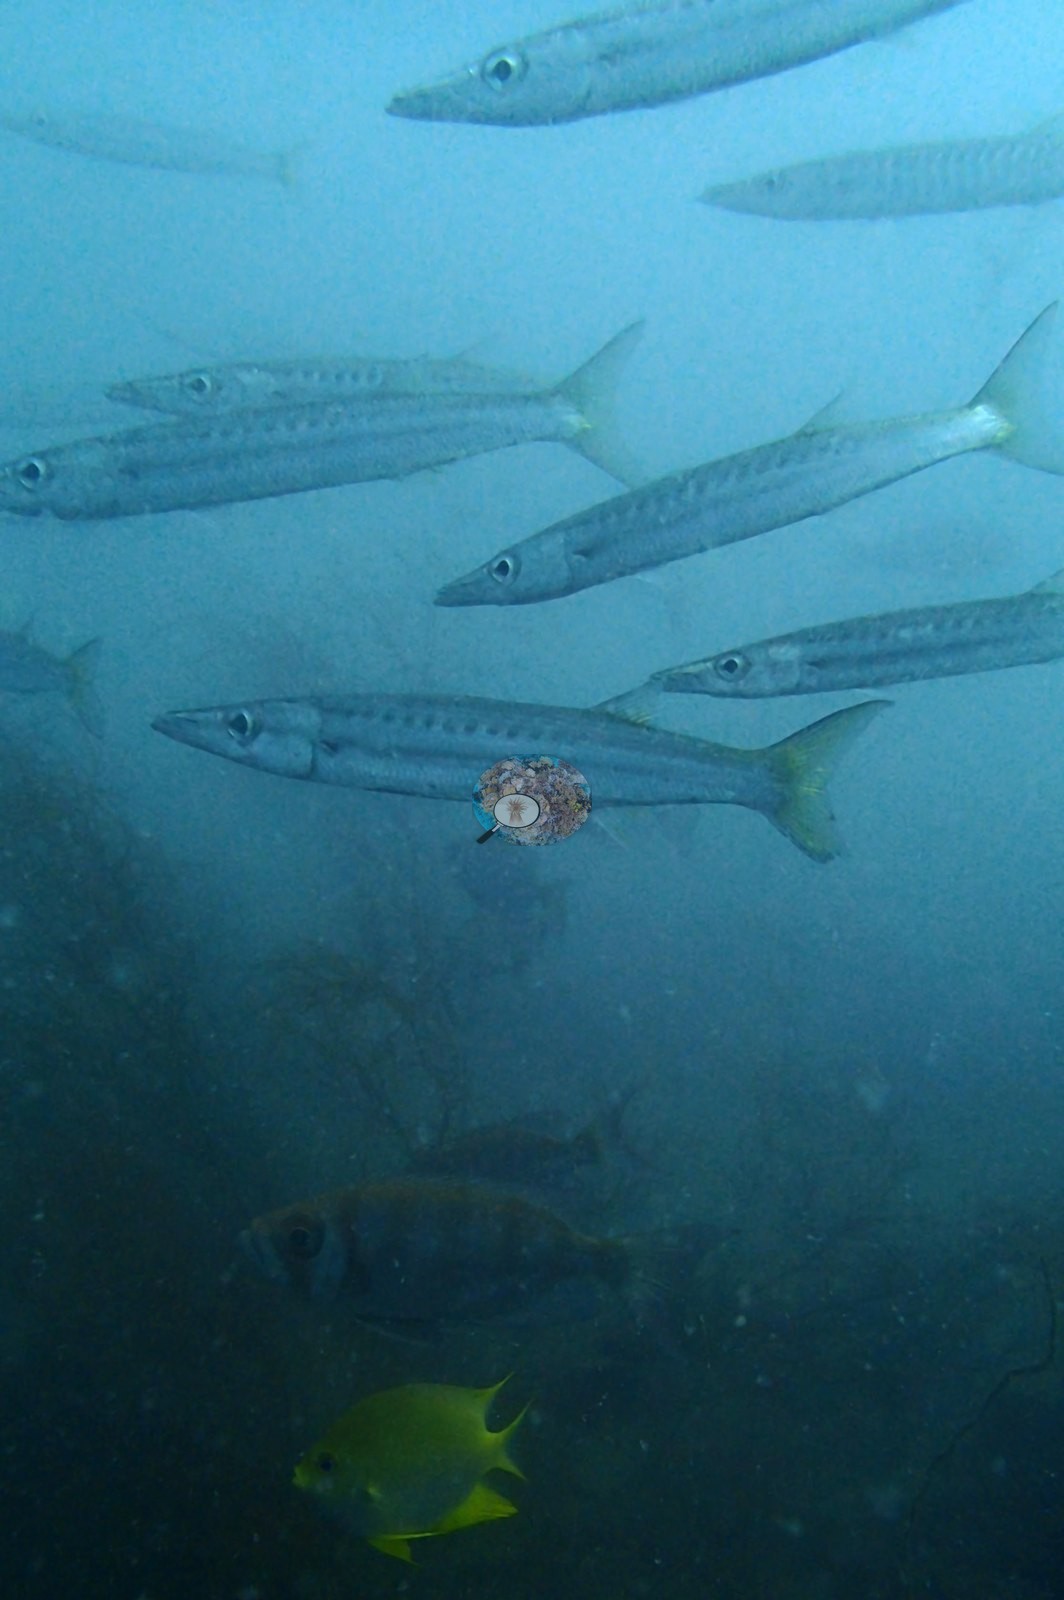
The fish and invertebrate list is varied for a short, murky dive: a school of big-eye barracuda with smaller barracuda alongside, a blue-spotted stingray on the sand, a lionfish, a bannerfish, and a very large host anemone with its anemonefish (e.g., Image 8, Image 10, Image 12, Image 13, Image 14, Image 18).
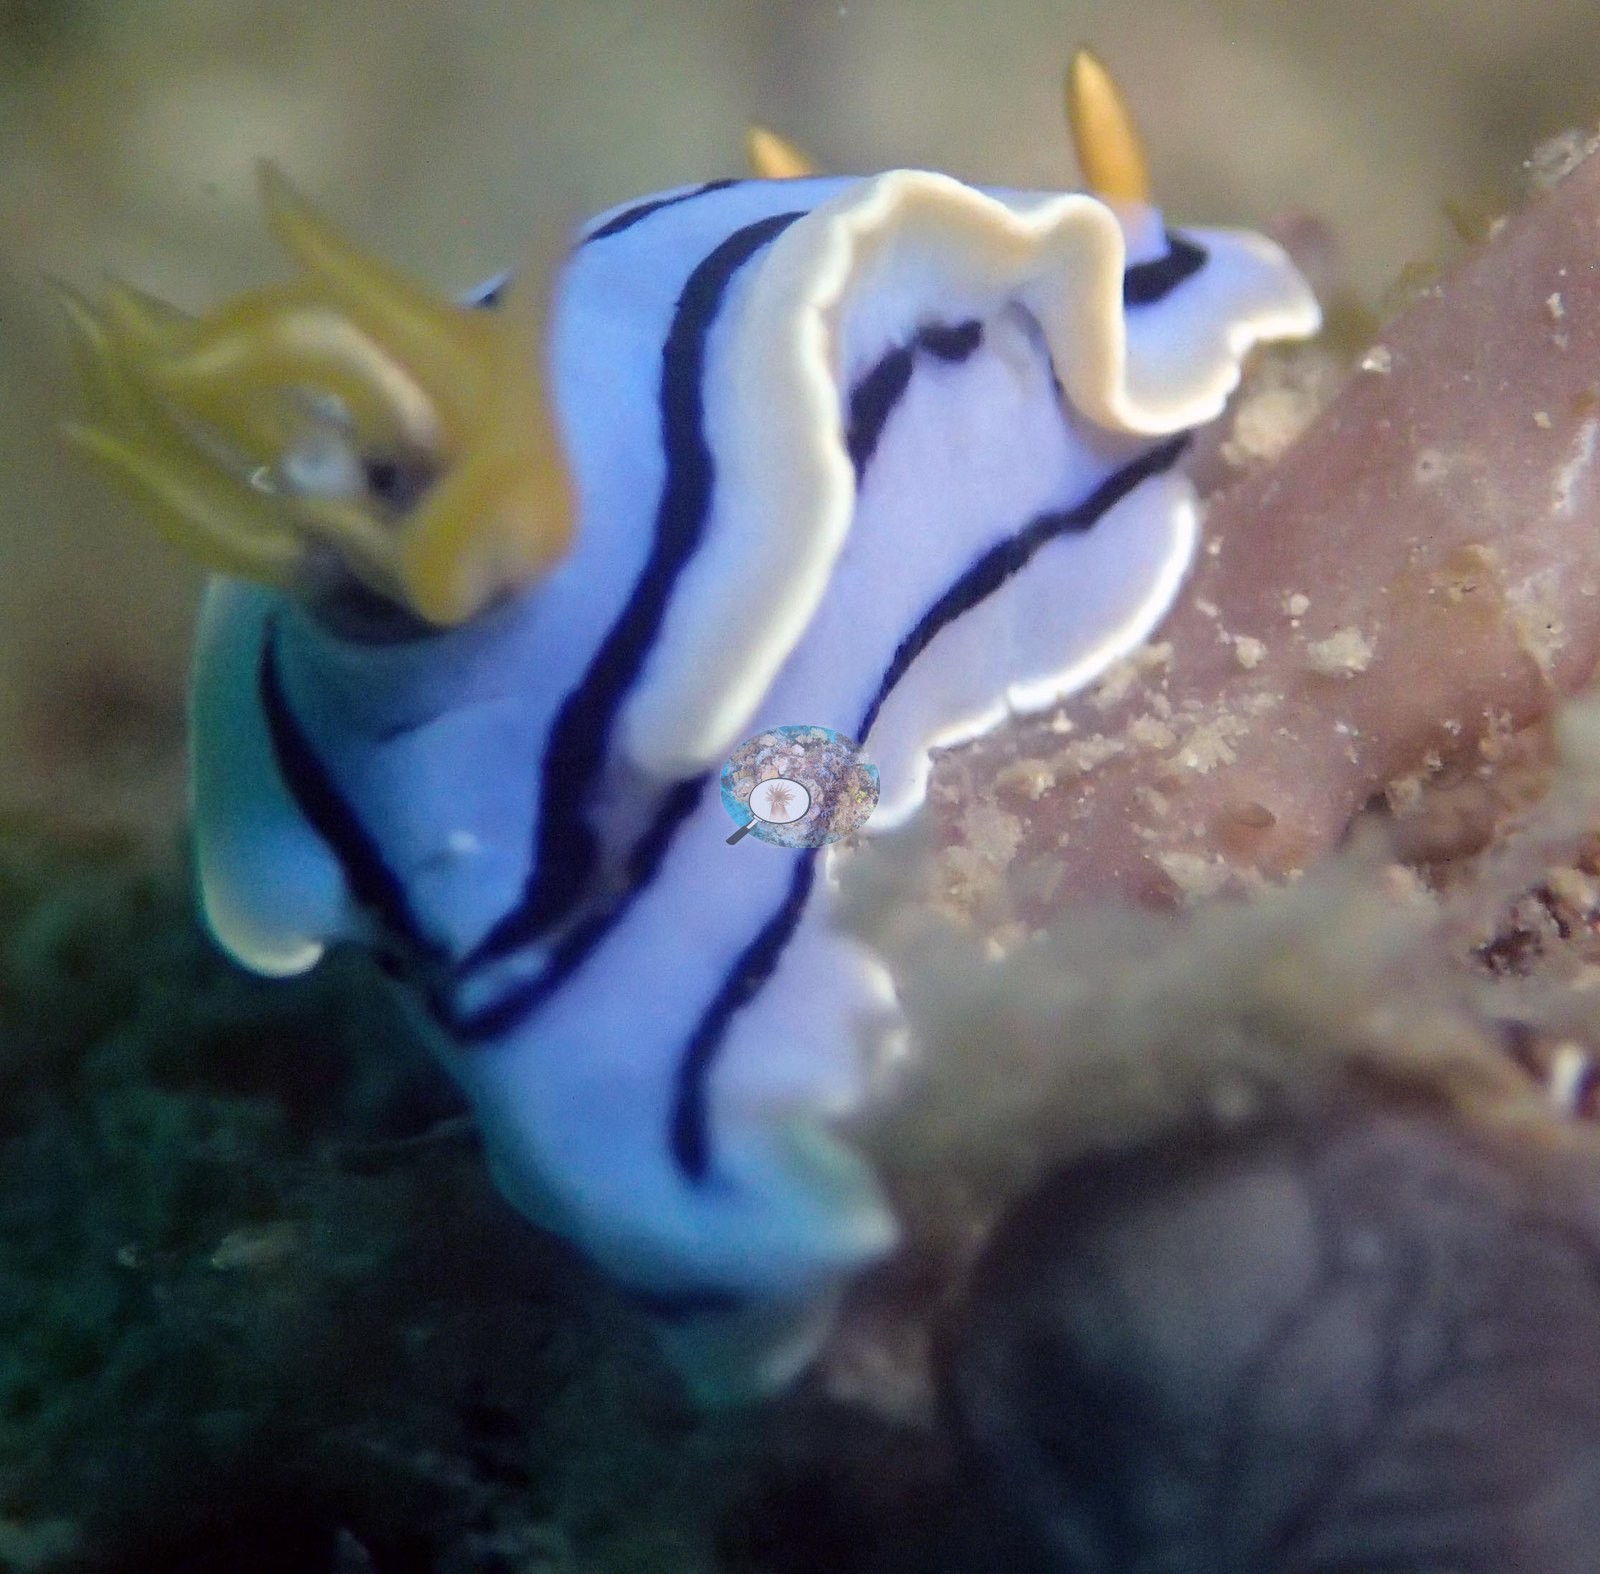
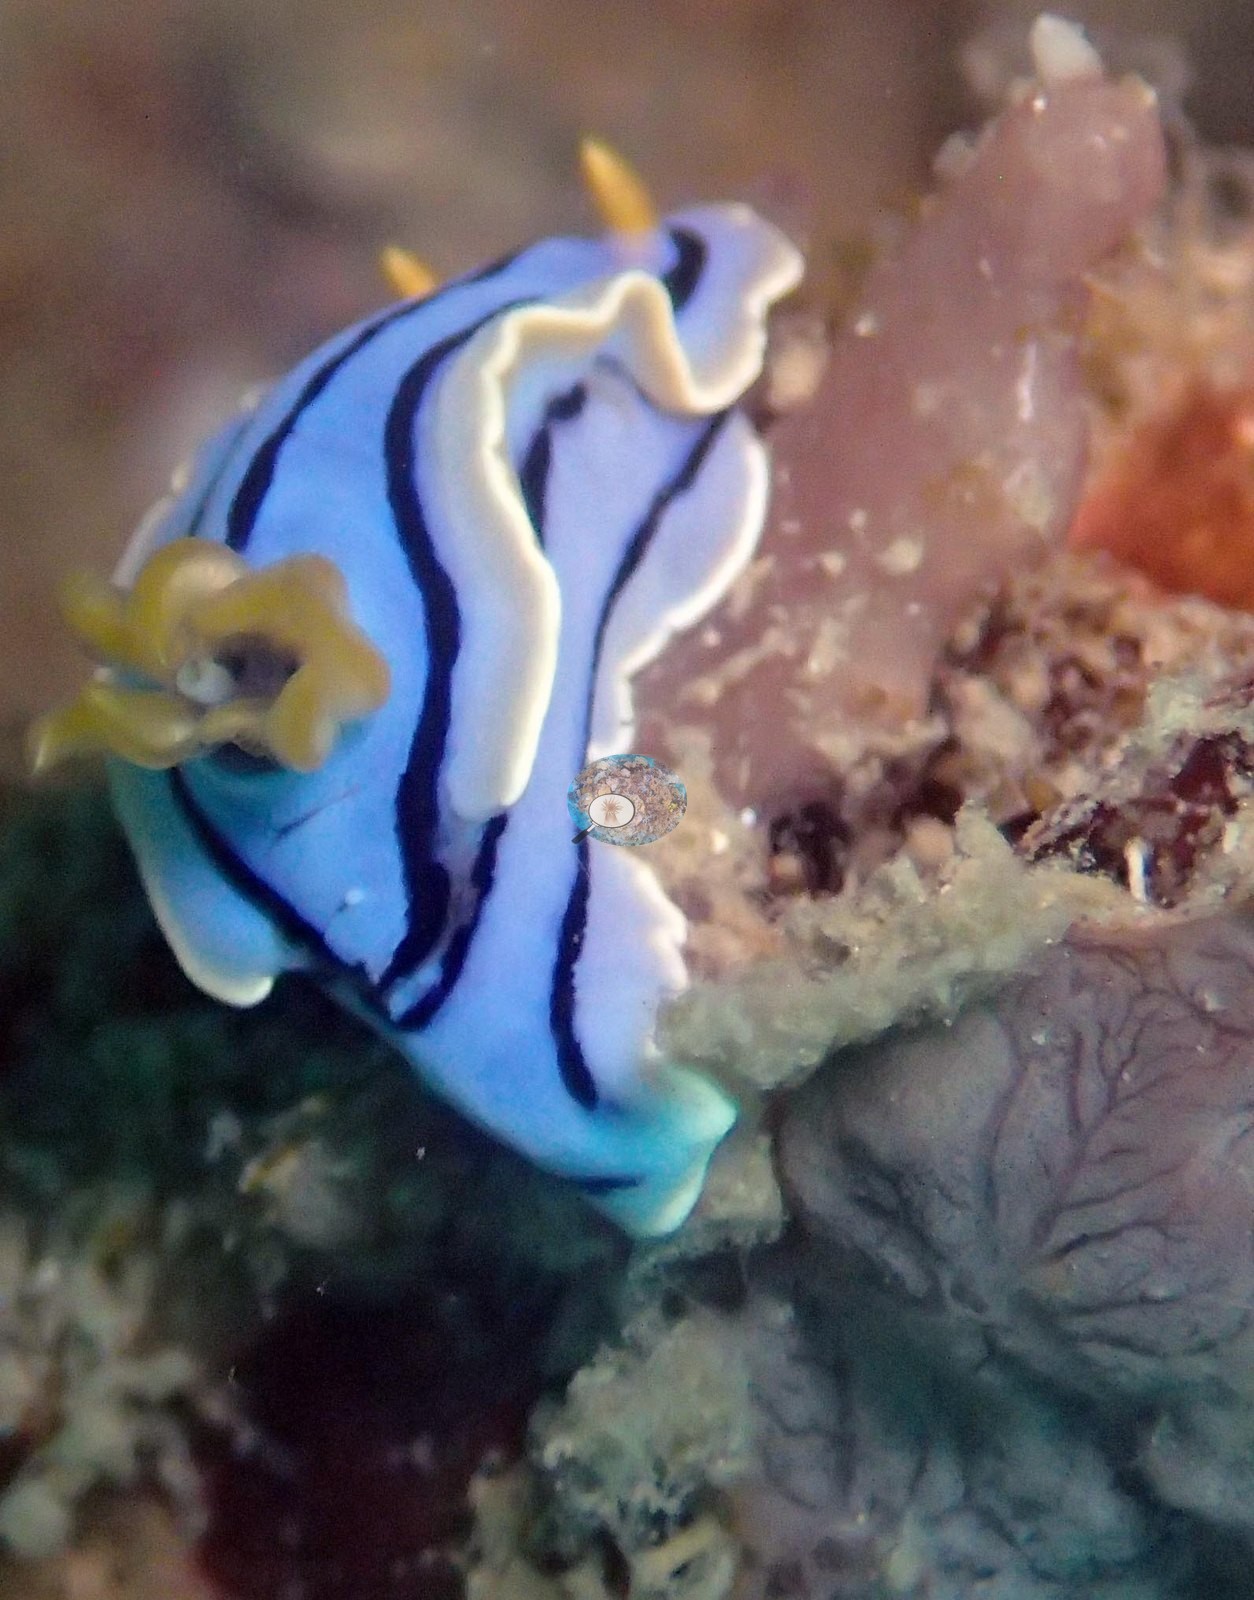
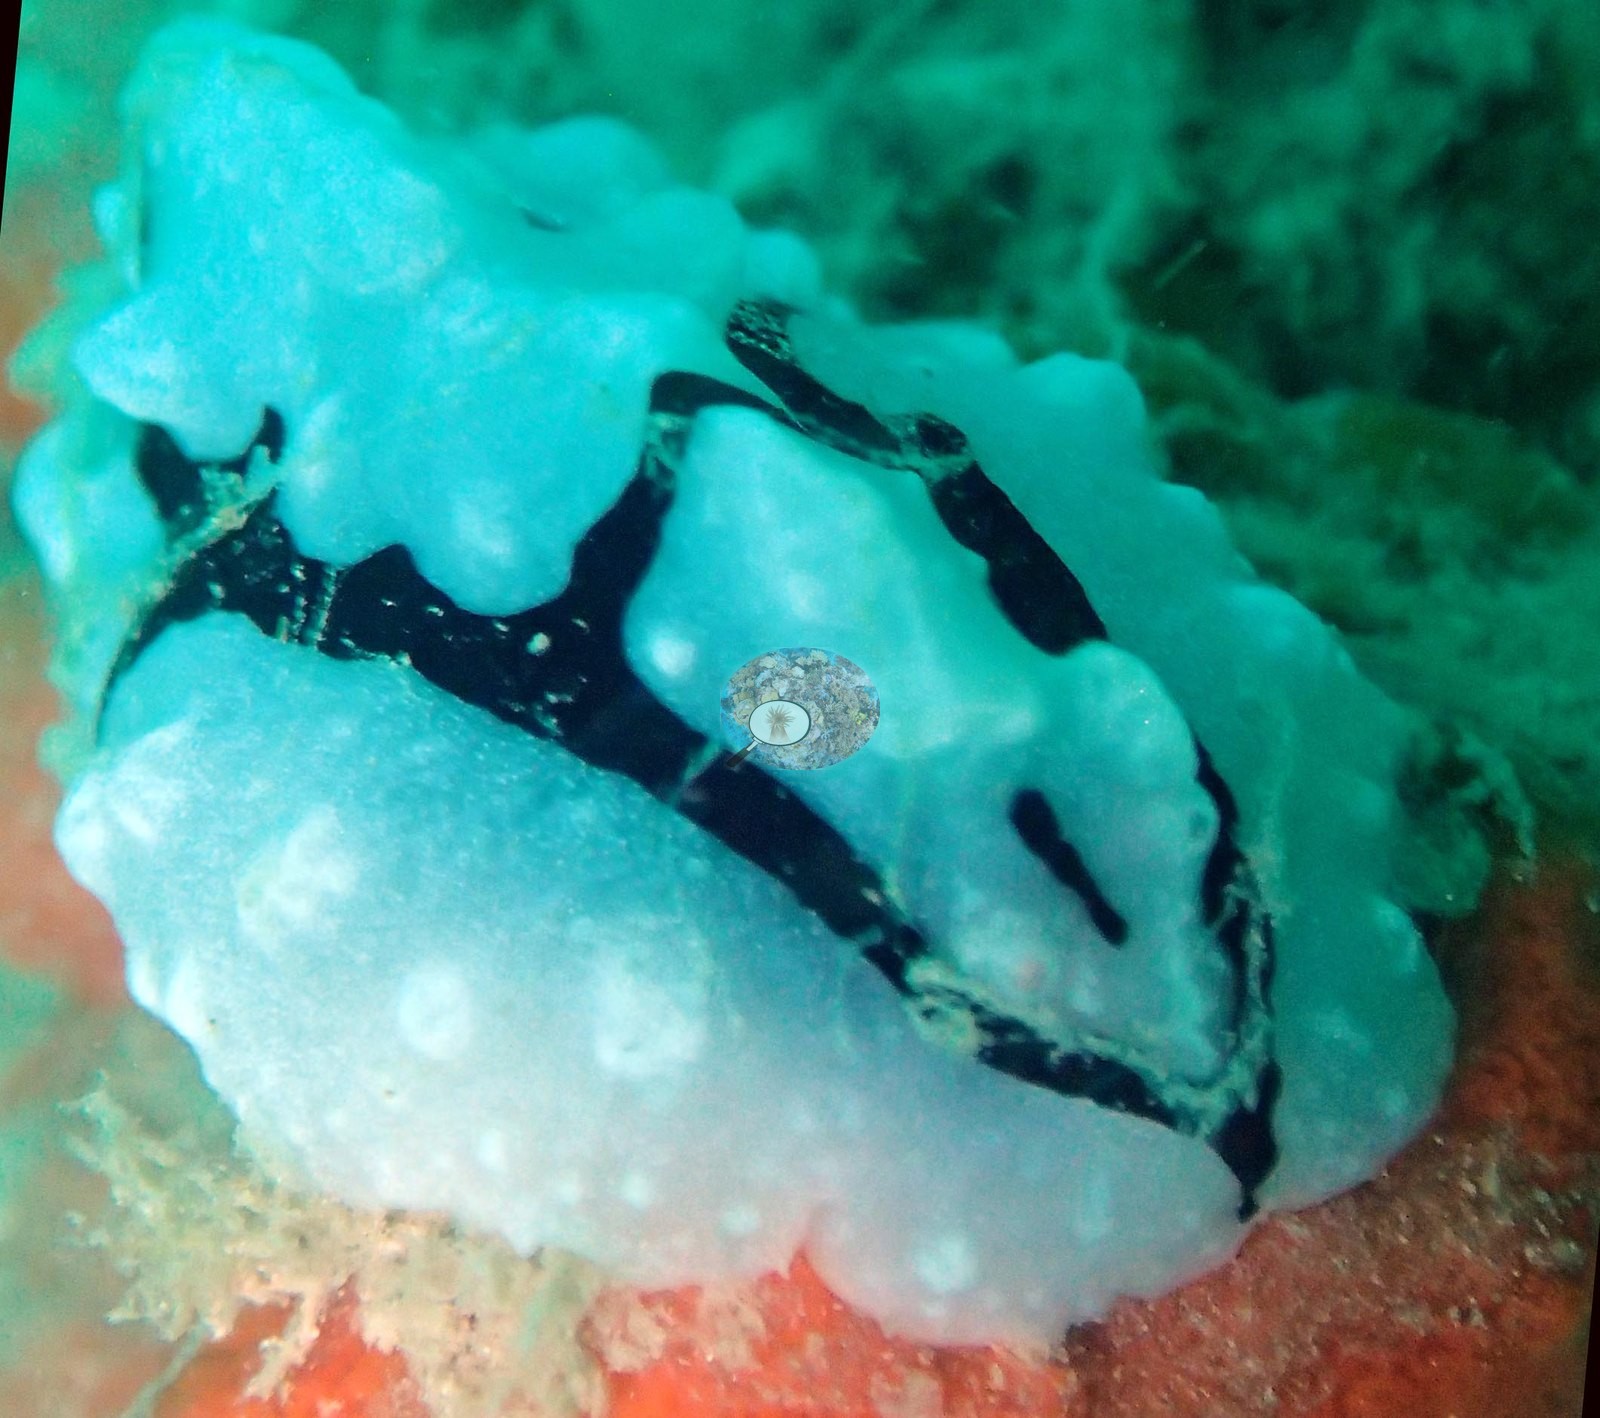
Three frames record chromodorid nudibranchs - blue and white bodies ruled with black lines, with yellow-orange rhinophores and gills (e.g., Image 15, Image 16, Image 17).
Comparisons with other data
No independent survey was made at this exact site; the nearest ones are listed in the table below.
Dive record
The first of three Bacuit Archipelago dives on 24 January 2017, in at 09:54 by bangka beneath the limestone karst, 62 minutes to a maximum of 24.1 m (mean 13.1 m) at 27.2 C; all 22 frames in the dive folder were reviewed, three of them topside.
CV model comparison
More info
As of September 2026 no computer-vision method estimates coral cover accurately on new images, so treat this as indicative rather than a measurement; it is revised as the methods improve.More info
The published figure is the mean of the two methods.| Method | Hard-coral cover (%) |
|---|---|
| In-house DINOv3 | 19.2 |
| CoralSCOP | 15.3 |
| Mean (± SD) | 17.2 ± 2.8 |
| Range | 15.3–19.2 |
Mean ± SD and range are across the computer-vision methods shown.
Independent surveys nearby
 Dr. Coral (CRD)
Within 5 km, 6 independent survey stations recorded hard coral cover in 13 surveys between 2013 and 2015. Of the 6 stations surveyed in more than one year, 1 declined, 1 increased, and 4 changed by less than 5 percentage points between their first and latest surveys. The longest record, Maitre MPA (Inside) (Reef Check, 4.86 km away), went from 28% in 2013 to 24% in 2015. The most recent nearby survey is from 2015, so these values predate recent heat stress. This site's own estimate (17%) sits within the range of these surveys (4.4–49%); the methods differ, so the comparison is context, not a like-for-like test.
Collected by other programs using different methods (Reef Check uses point-intercept transects), so these are context for the figures above, not a like-for-like comparison. Where a station was surveyed more than once the range is shown. Station names are not dive-site names.
| Agency | Site / location | Date | Hard coral cover (%) | Distance | Link |
|---|---|---|---|---|---|
| Reef Check | Ipil MPA (Inside) Brgy. Buena Suerte | 2013–2014 | 22–24% (2 surveys) | 1.26 km | — |
| Reef Check | Caalan MPA B | 2013–2014 | 29–45% (2 surveys) | 1.27 km | — |
| Reef Check | 7th Comando Outside | 2013–2014 | 4.4–7.5% (2 surveys) | 1.65 km | — |
| Reef Check | Caalan MPA A | 2013–2014 | 36–49% (2 surveys) | 1.79 km | — |
| Reef Check | Bukal | 2013–2014 | 34% (2 surveys) | 2.60 km | — |
| Reef Check | Maitre MPA (Inside) | 2013–2015 | 24–33% (3 surveys) | 4.86 km | — |
Data & links
All images from Coral Reef Diagnostics. Data are from Coral Reef Diagnostics and the organizations named in the data-sources table above.
© Coral Reef Diagnostics.