
Philippines - Verde Island Passage: Beatriz Island (Beatrice Rock)

Part of the regional summaries: Philippines - Luzon and Philippines
More info
Central Philippines (NOAA CRW virtual station) · Eastern Philippines ecoregion mean=7.5°C-heating weeksBeatriz (Beatrice Rock) is a submerged boulder complex defined by very large barrel sponges, black coral bushes, and gorgonian fans rather than hard coral, though tabular Acropora and Porites are present. A tuberculate animal matching a Bargibant's pygmy seahorse was photographed on a matching gorgonian - probable, per Anderson's own filenames, though unconfirmed at review resolution. No site-wide bleaching. Cover estimate is roughly 18-20%, averaging 18.9%.
Ang Beatriz (Beatrice Rock) ay isang lubog na kumpol ng malalaking bato na nakikilala sa napakalalaking barrel sponge, mga palumpong ng itim na koral, at mga pamaypay na gorgonian sa halip na matigas na koral, bagaman naroroon din ang tabular na Acropora at Porites. Isang hayop na may mga tubercle na tugma sa Bargibant's pygmy seahorse ang nakuhanan ng larawan sa isang katugmang gorgonian - malamang, ayon sa sariling mga pangalan ng file ni Anderson, ngunit hindi nakumpirma sa resolusyon ng pagsusuri. Walang pamumuti sa buong lugar.
Salin ng buod na ito gamit ang AI; ang Ingles ang opisyal na bersyon. Translated from the site’s shorter map summary.
Seven independent survey stations shown with the program’s logo — click one to see how far it is from this site.
Four other CRD dive sites within 5 km shown in orange — click a marker to open its page.
Site description
Setting
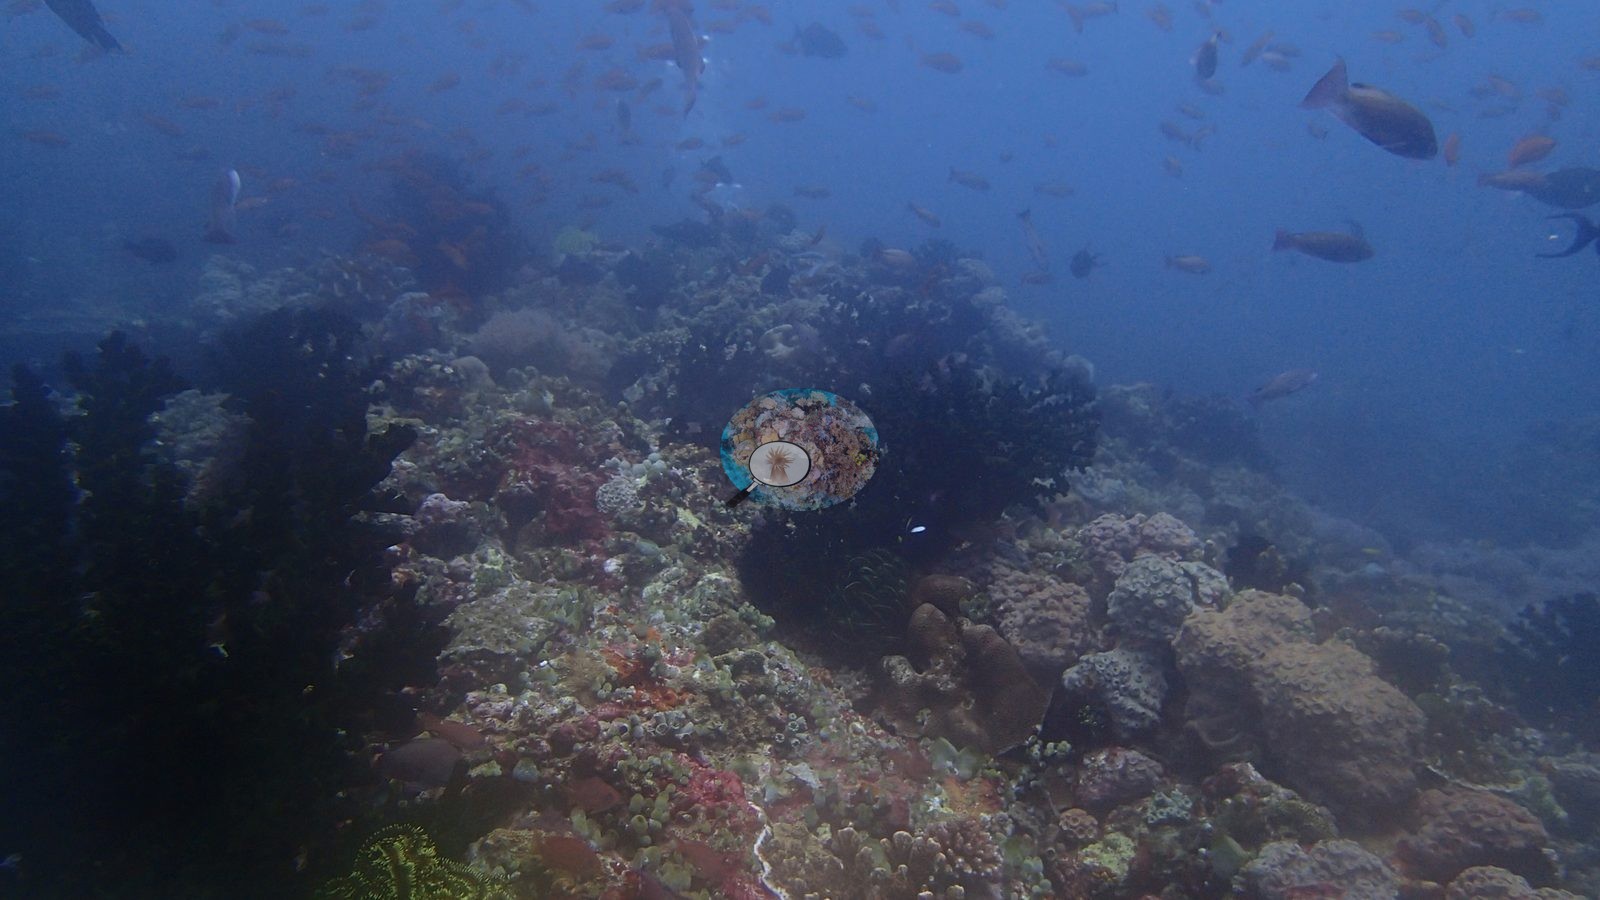
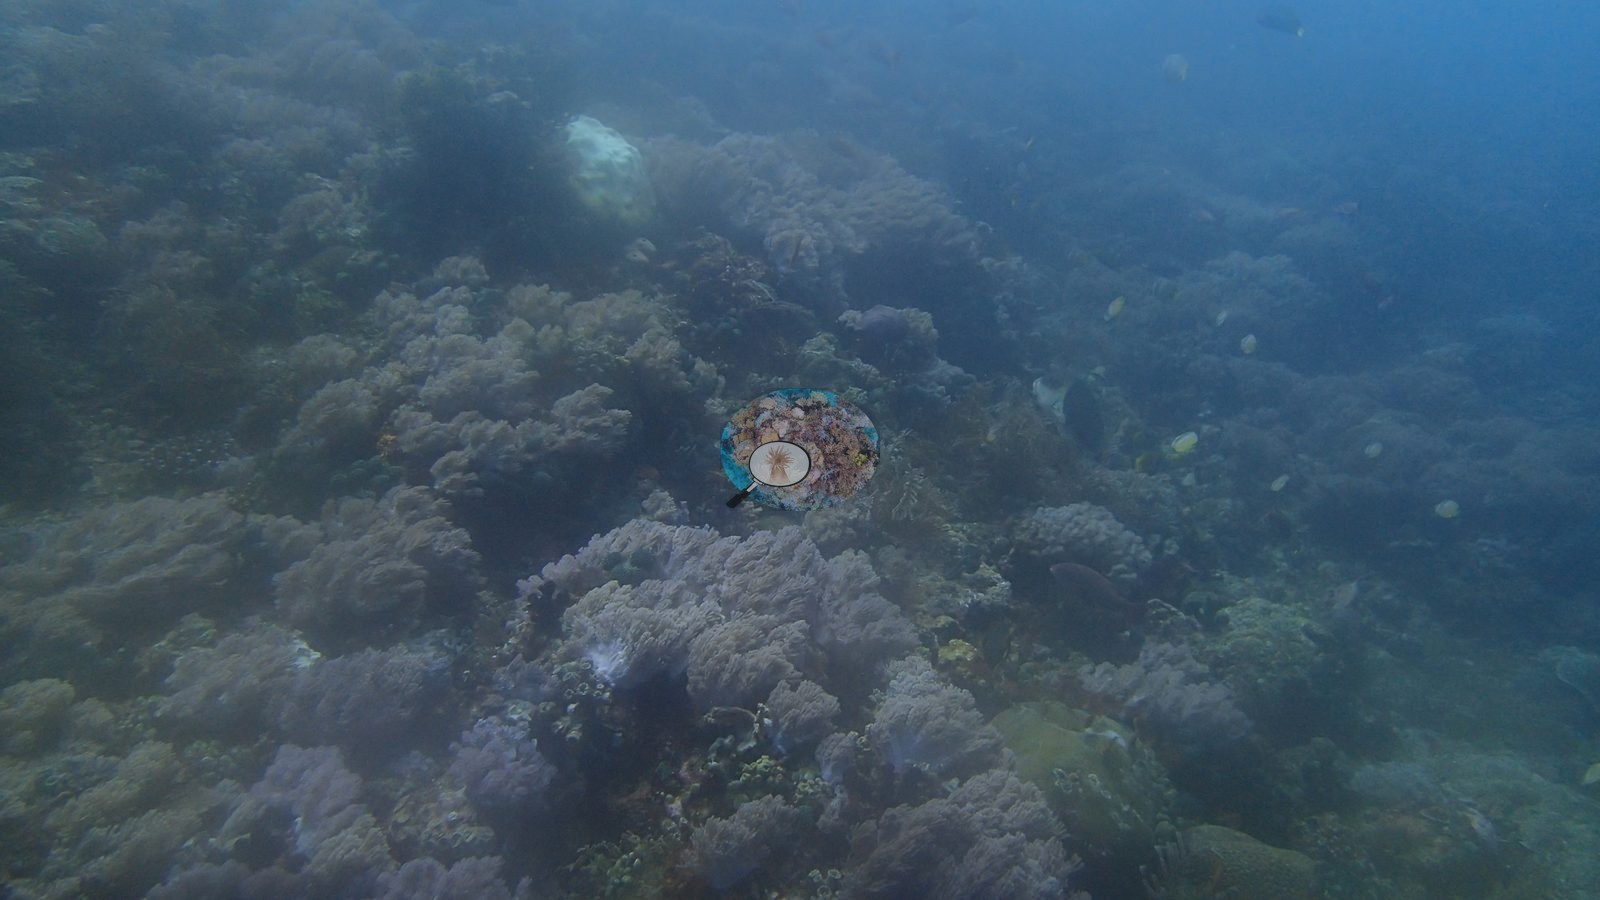
Beatriz - Beatrice Rock - is a submerged boulder complex of massive rounded outcrops with steep faces, overhangs, and swim-through gaps, photographed in noticeably poorer visibility than Kirby's Rock, with many hazy blue-green frames on the deeper flanks (e.g., Image 3, Image 4).
General benthic features
Barrel sponges define the site: Xestospongia testudinaria recurs through the wide-angle frames as very large individuals, several of them taller than a diver. Hard coral is present but subordinate - tabular Acropora, massive Porites, and foliose plates - while the visible biomass is sponge, soft coral, and crinoid. Black coral bushes, large gorgonian sea fans, a big orange elephant-ear sponge, brilliant red and magenta encrusting sponges and coralline, a large yellow soft-coral mass, blue Linckia sea stars, and crinoids in yellow, green, and black fill the rock.
Coral cover
Cover comes from two computer vision methods, neither preferred. DINOv3 point classification gives 18.1% hard coral (95% CI 13.9-22.3) from all 76 frames and 1,520 points - the lowest and the least precise of the seven sites, its interval 8.4 points wide. CoralSCOP computer vision, its full run now finished, gives 19.7% across all 76 frames (median=16.2%, bootstrap 95% CI 16.8-22.9), against the 21.7% from the 20-frame subset the map's 19.9% was built on. The published spread is 3.6 points and the completed run closes it to 1.6, but the agreement is shallow: CoralSCOP's single highest frame, PA011274 at 60.7%, is the striped eel catfish school segmented as six large masks, and two more of its top six, PA011280 and PA011282, are barrel-sponge portraits at 53.5% and 48.2%. The two models fail differently. CoralSCOP computer vision reads high on low-cover reefs - a median=1.68x a co-located Reef Check diver survey, 4.6x at worst - and it masks sponges, soft coral, and dense fish as readily as stony coral. DINOv3 is strong in-domain (6-class macro-F1 0.62, hard coral recall 0.82) but collapses off-domain: cross-domain point accuracy 0.17-0.25, ceiling near 35-50%, and on topside frames elsewhere in this trip it still returned around 18% hard coral for photographs with no benthos in them - a floor close to this site's entire figure. Neither is a diver survey or a transect; both are provisional and a better model will supersede them. Coral cover: 19% — photo-derived, and the two methods broadly agree (18% vs 20%). Two independent computer vision passes over all 76 of Anderson's frames from this dive give a DINOv3 calibrated point classifier reading of 18.1% (95% CI 14–22%, block bootstrap) and a CoralSCOP computer vision of 19.7%, a spread of 1.6 percentage points. The map publishes their mean so sites can be ranked against one another, but the 18–20% range is the honest statement of what is known here: the two products have different denominators and should not be collapsed into one measurement. A better coral-cover model than CoralSCOP and DINOv3 may exist, and Anderson is looking for it -- this figure will be regenerated if he finds one.
Stressors
There is no site-wide bleaching signal.
Fish and other fauna
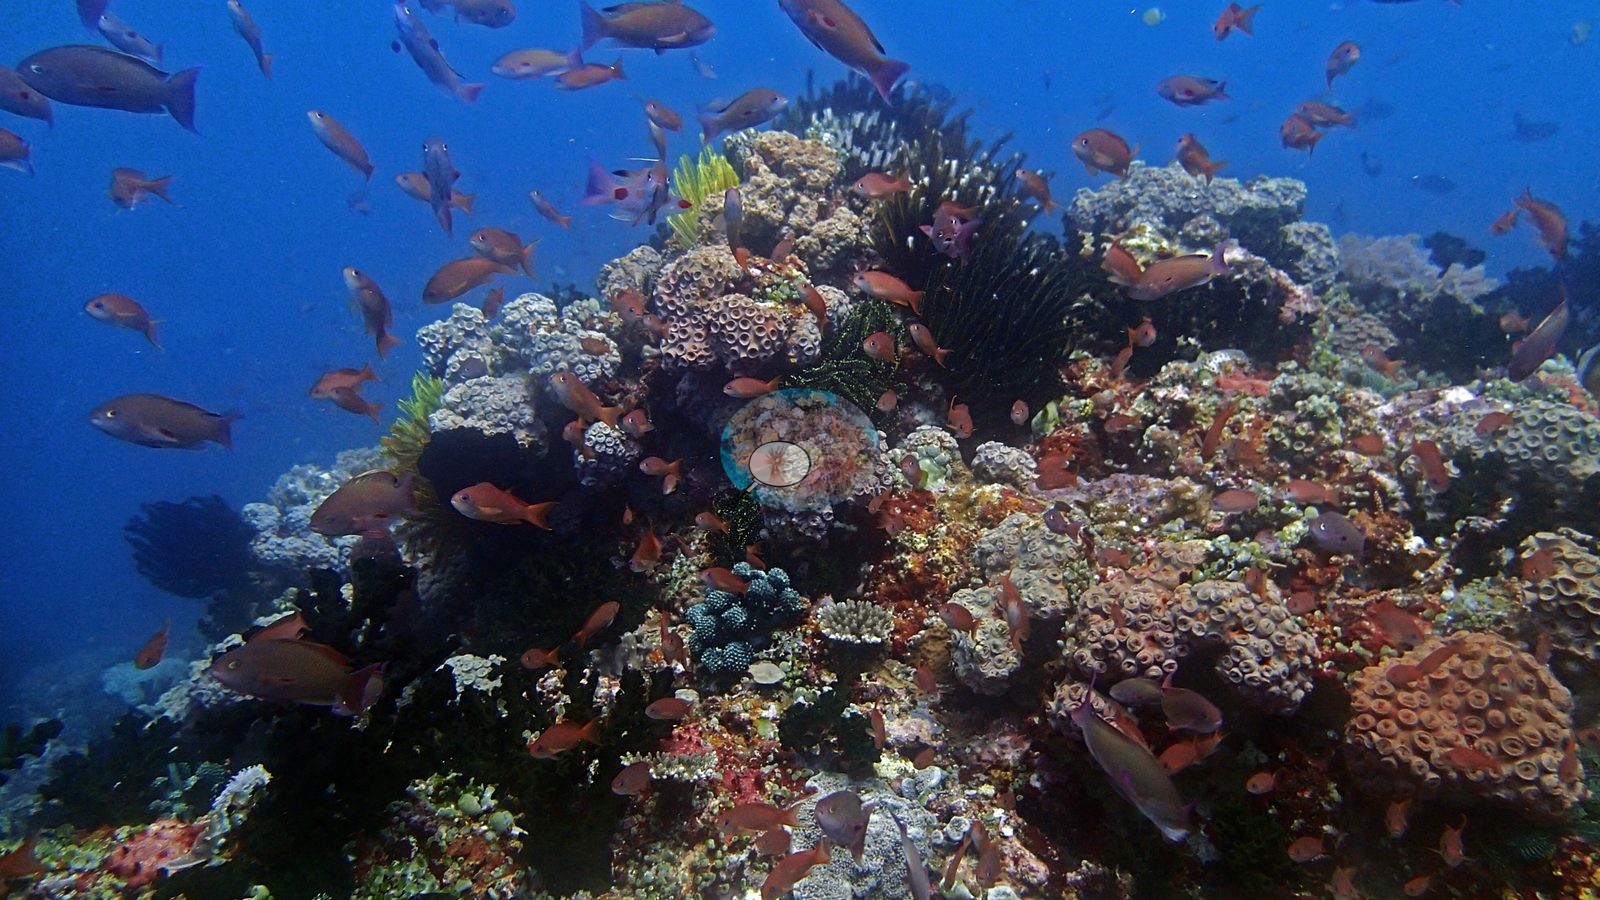
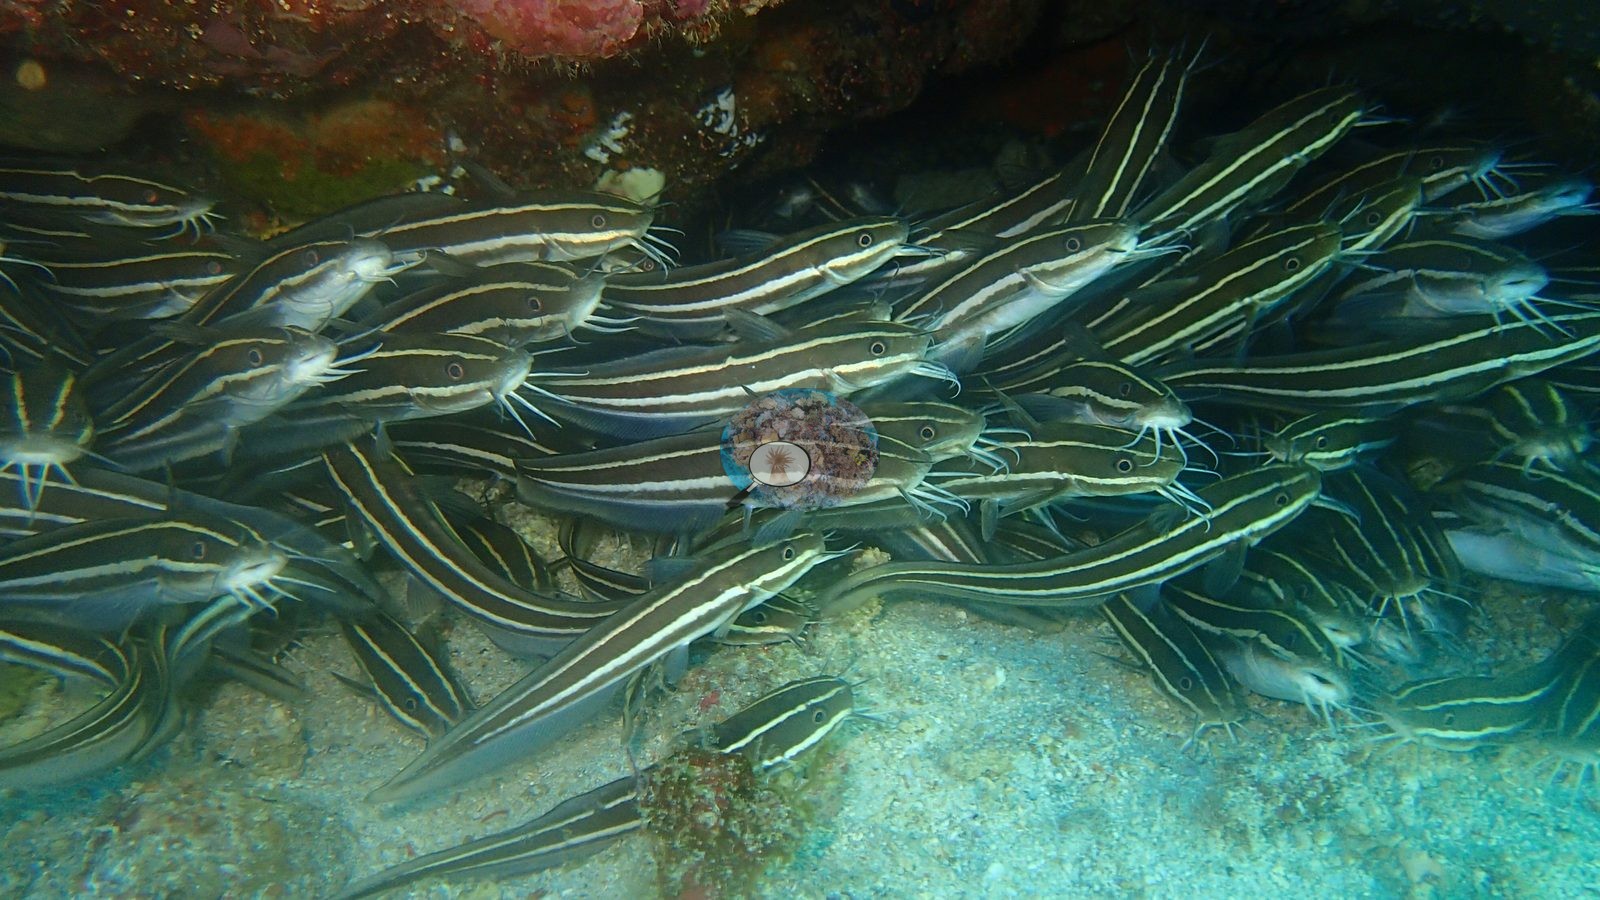
Anthias cloud every high point (e.g., Image 1), a tight writhing school of striped eel catfish (Plotosus lineatus) crosses the sand (e.g., Image 2), and lionfish and scorpionfish rest on the rubble.
Two frames show a small heavily tuberculate animal matched in color and texture to the knobbly pink-and-white gorgonian it sits on - the classic presentation of a Bargibant's pygmy seahorse, and Anilao is a known locality for it. This is still called probable rather than confirmed at review resolution and deserves a full-resolution check, but Anderson's own top-level trip folder carries three files named for pygmy seahorses, so the identification is his and predates this review.
Comparisons with other data
No independent survey was made at this exact site; the nearest ones are listed in the table below.
Dive record
The second dive of the Verde Island Passage day, 1 October 2016; all 76 available frames were reviewed.
CV model comparison
More info
As of September 2026 no computer-vision method estimates coral cover accurately on new images, so treat this as indicative rather than a measurement; it is revised as the methods improve.More info
The published figure is the mean of the two methods.| Method | Hard-coral cover (%) |
|---|---|
| In-house DINOv3 | 18.1 |
| CoralSCOP | 19.7 |
| Mean (± SD) | 18.9 ± 1.1 |
| Range | 18.1–19.7 |
Mean ± SD and range are across the computer-vision methods shown.
Independent surveys nearby
 Dr. Coral (CRD)
Within 5 km, 7 independent survey stations recorded hard coral cover in 19 surveys between 2010 and 2017. Of the 2 stations surveyed in more than one year, 1 declined and 1 changed by less than 5 percentage points between their first and latest surveys. The longest record, Twin Rocks (Reef Check, 3.70 km away), went from 20% in 2010 to 19% in 2017. The most recent nearby survey is from 2017, so these values predate recent heat stress. This site's own estimate (19%) sits within the range of these surveys (19–70%, excluding 2 best-patch values above 70% that are not a site mean); the methods differ, so the comparison is context, not a like-for-like test.
Collected by other programs using different methods (Reef Check uses point-intercept transects), so these are context for the figures above, not a like-for-like comparison. Where a station was surveyed more than once the range is shown. Station names are not dive-site names. Values marked best patch exceed 70%: surveyors usually chose the richest area, so they are not site means.
| Agency | Site / location | Date | Hard coral cover (%) | Distance | Link |
|---|---|---|---|---|---|
| Reef Check | San Teodoro | 2010 | 27% | 3.26 km | — |
| Reef Check | Twin Rocks | 2010–2017 | 19–34% (4 surveys) | 3.70 km | — |
| Reef Check | Bagalangit Koala | 2010 | 70% | 3.96 km | — |
| Reef Check | Koala, Bagalangit | 2010–2017 | 39–72% (9 surveys) best patch | 4.37 km | — |
| Reef Check | Arthur's Rock | 2013 | 36% (2 surveys) | 3.50 km | — |
| Reef Check | Inner Layag Layag Reef | 2014 | 64% | 1.73 km | — |
| Reef Check | Tingloy - Poblacion Reef | 2014 | 89% best patch | 2.40 km | — |
Data & links
All images from Coral Reef Diagnostics. Data are from Coral Reef Diagnostics and the organizations named in the data-sources table above.
© Coral Reef Diagnostics.