
Philippines - Verde Island Passage: Sombrero Island

Part of the regional summaries: Philippines - Luzon and Philippines
More info
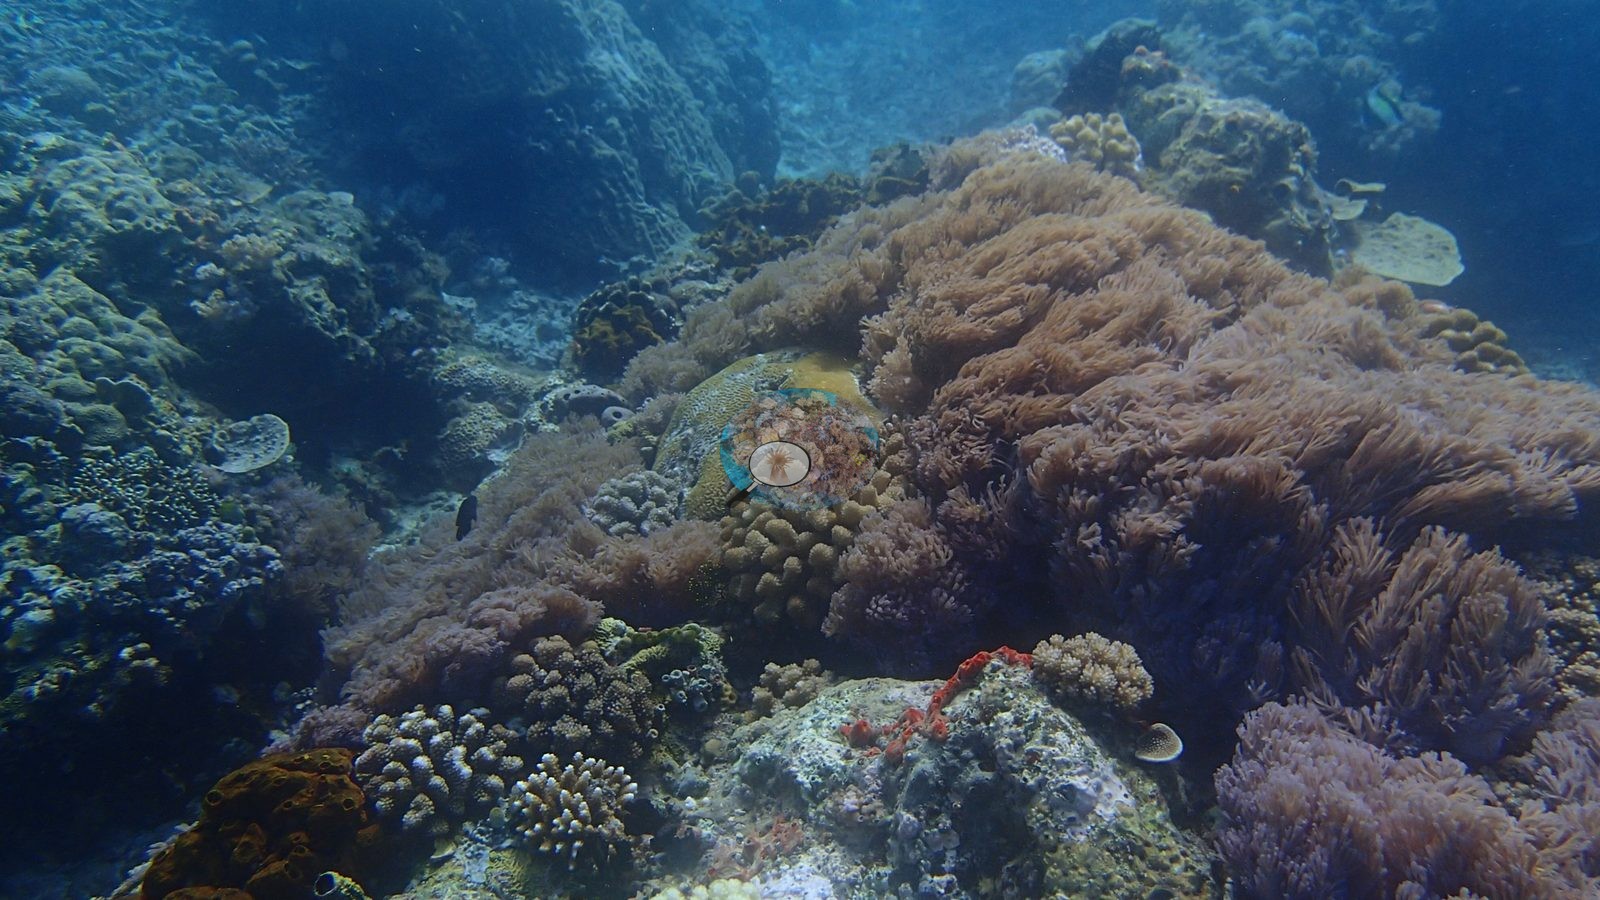
Central Philippines (NOAA CRW virtual station) · Eastern Philippines ecoregion mean=7.5°C-heating weeksSombrero Island is the best-developed reef of the trip, with near-continuous coral cover including enormous tabular Acropora plates meters across, columnar Porites, and walls draped in soft coral and crinoids. The reef reads healthy with no site-wide bleaching. Cover estimate is roughly 25-27%, the highest of the group.
Ang Sombrero Island ang pinakamaunlad na bahura sa buong biyahe, na may halos tuloy-tuloy na saklaw ng koral kabilang ang napakalalaking tabular na plato ng Acropora na ilang metro ang lapad, mga haliging Porites, at mga pader na nababalutan ng malambot na koral at crinoid. Mukhang malusog ang bahura at walang pamumuti sa buong lugar. Ang tantiya ng saklaw ay humigit-kumulang 25-27%, ang pinakamataas sa pangkat.
Salin ng buod na ito gamit ang AI; ang Ingles ang opisyal na bersyon.
Three independent survey stations shown with the program’s logo — click one to see how far it is from this site.
Four other CRD dive sites within 5 km shown in orange — click a marker to open its page.
4 of these 46 photographs are shown beside the text that discusses them under "Site description" below.
Site description
General benthic features
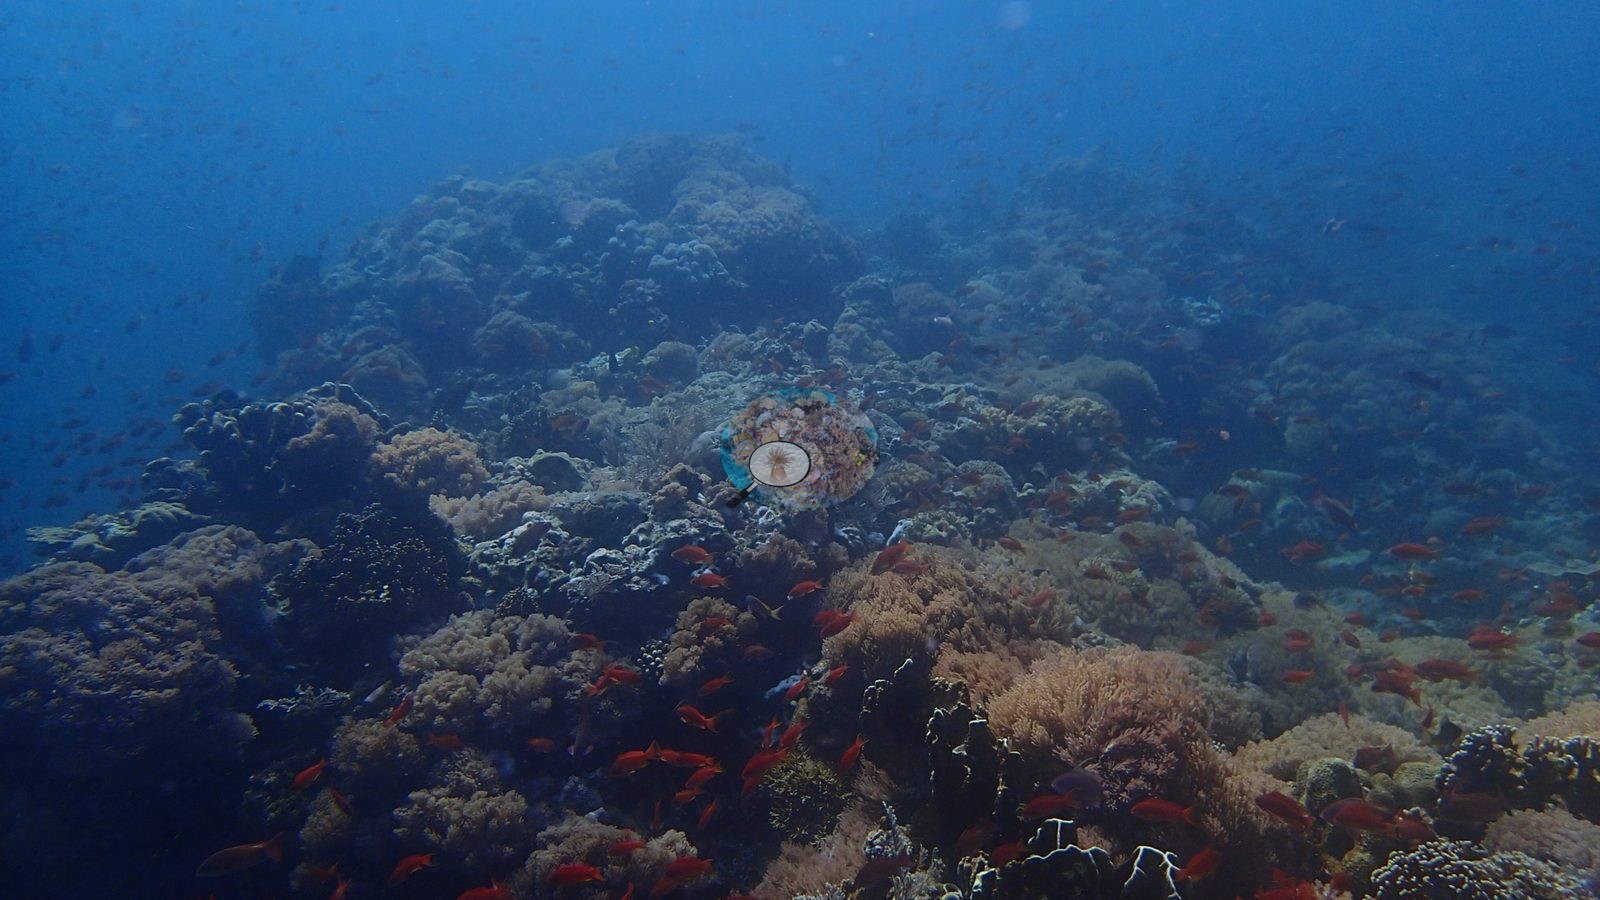
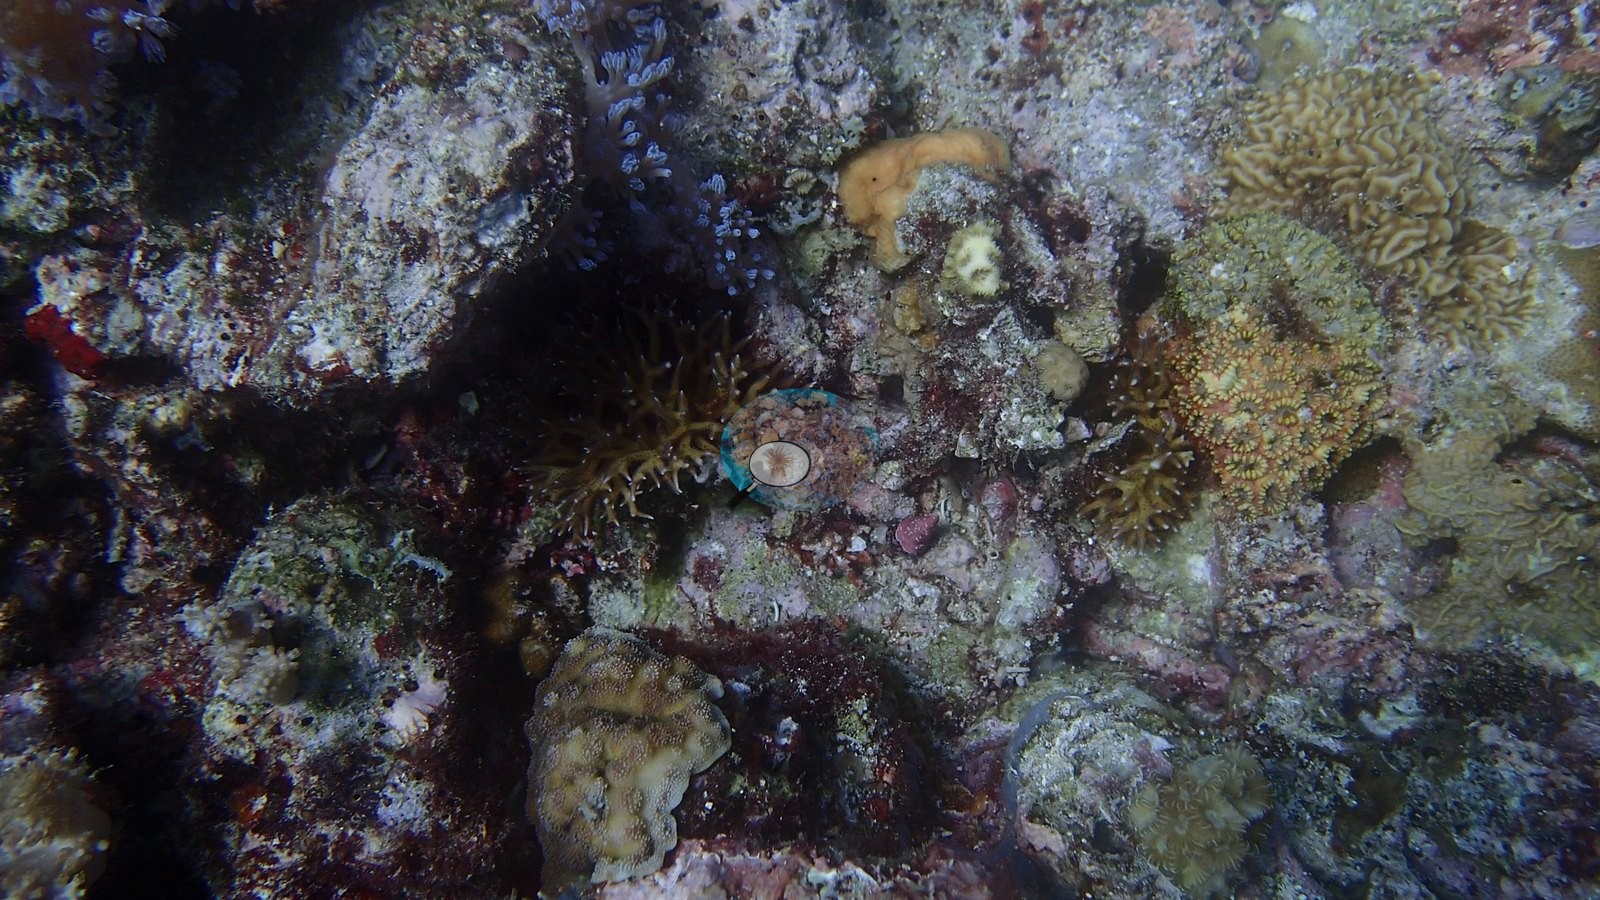
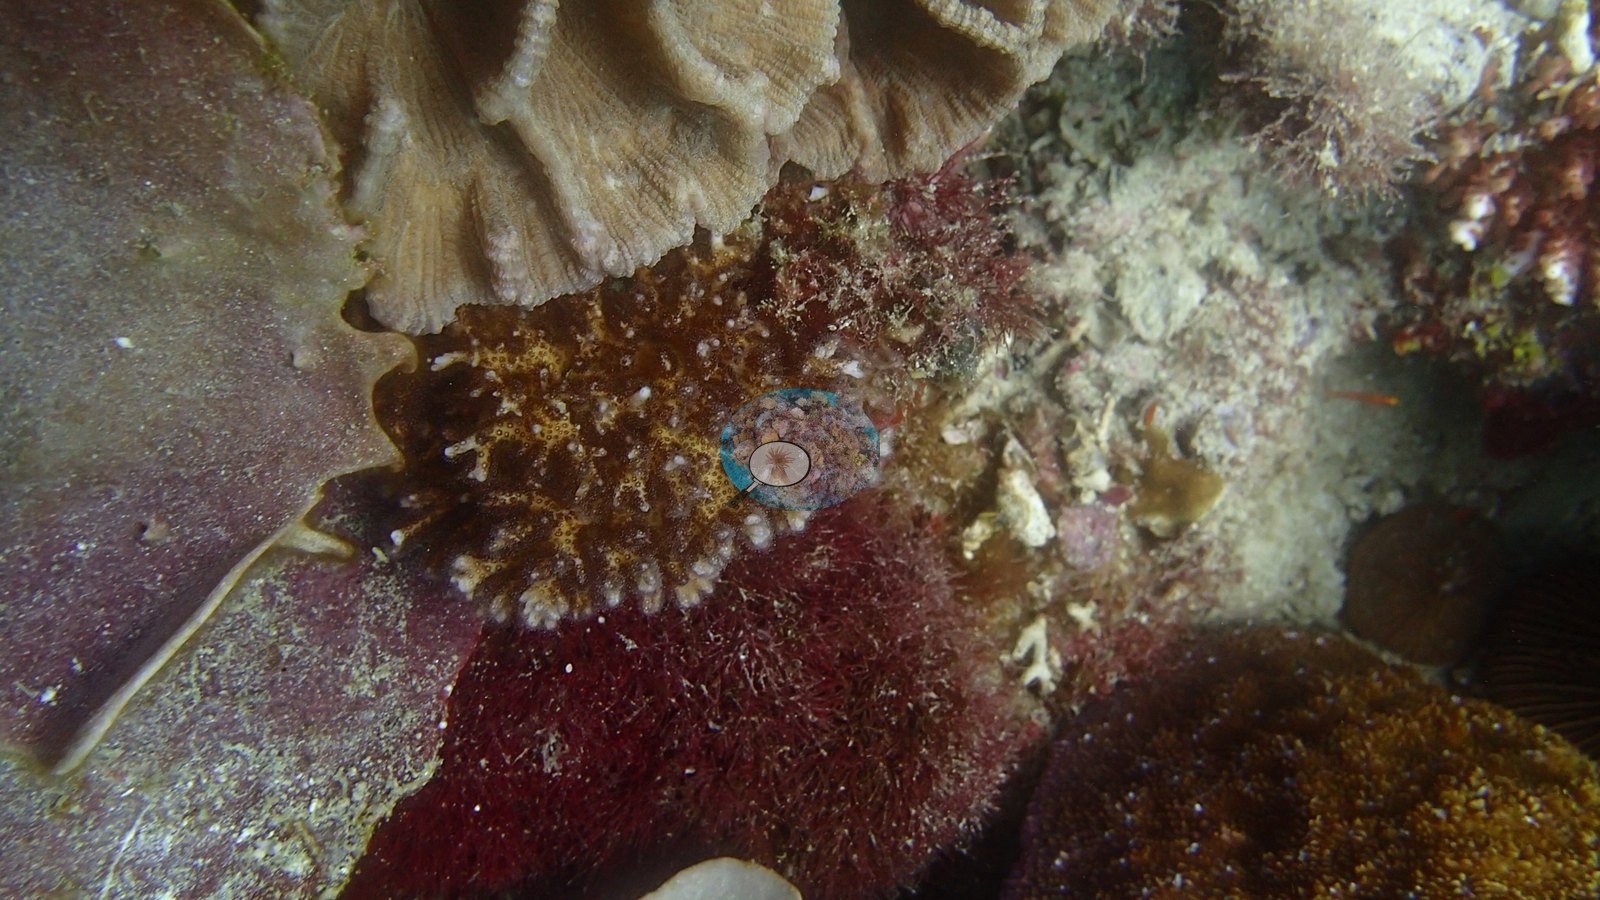
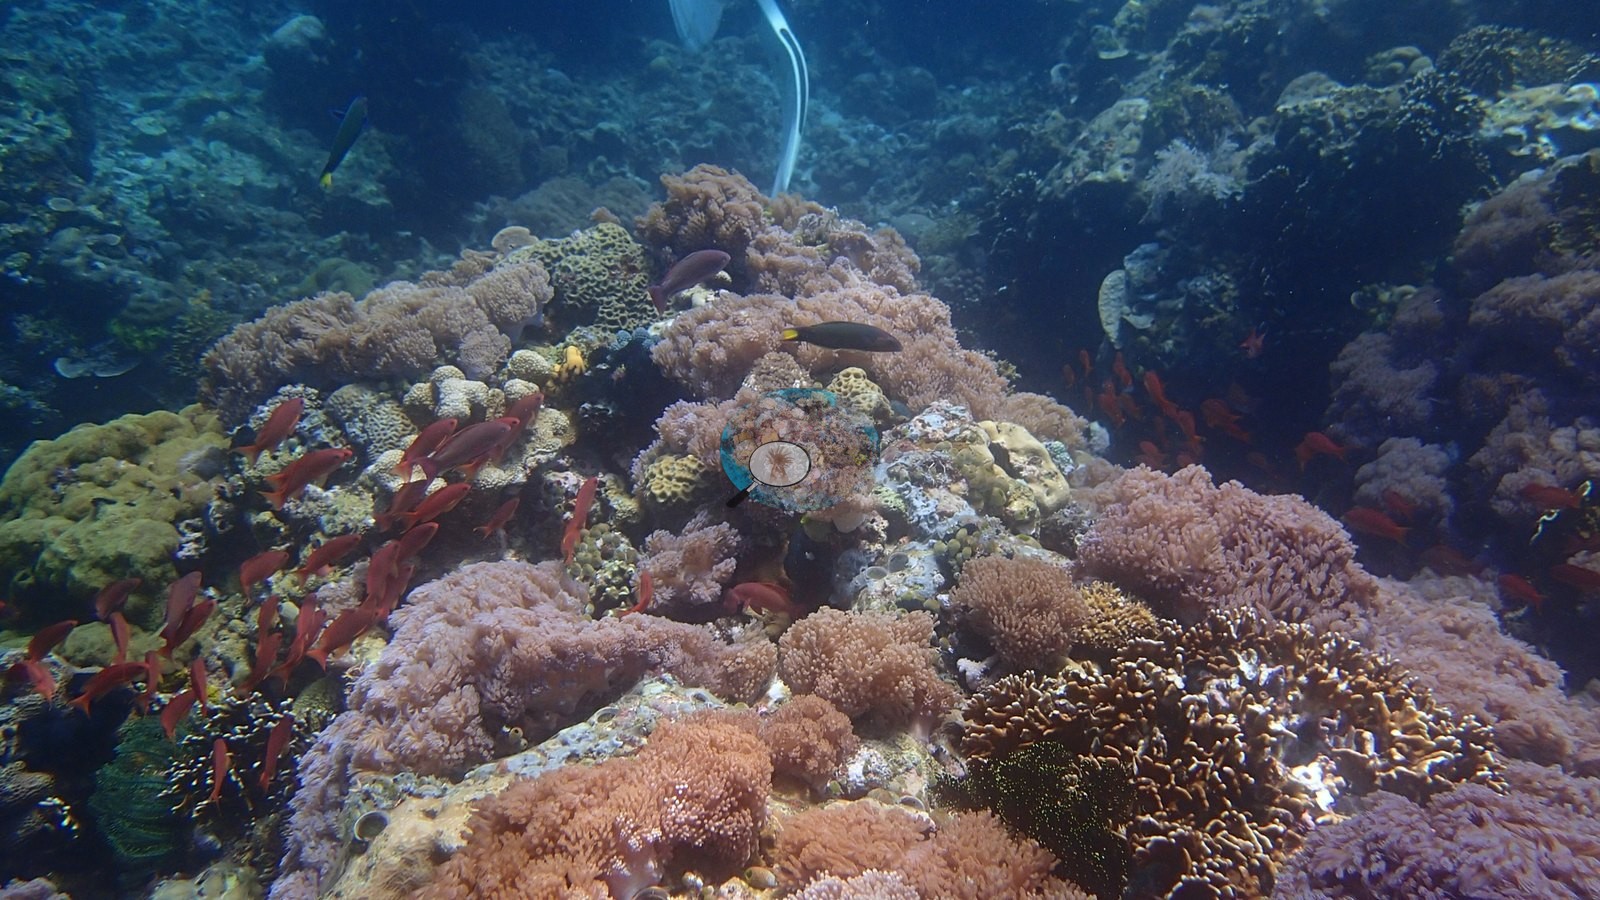
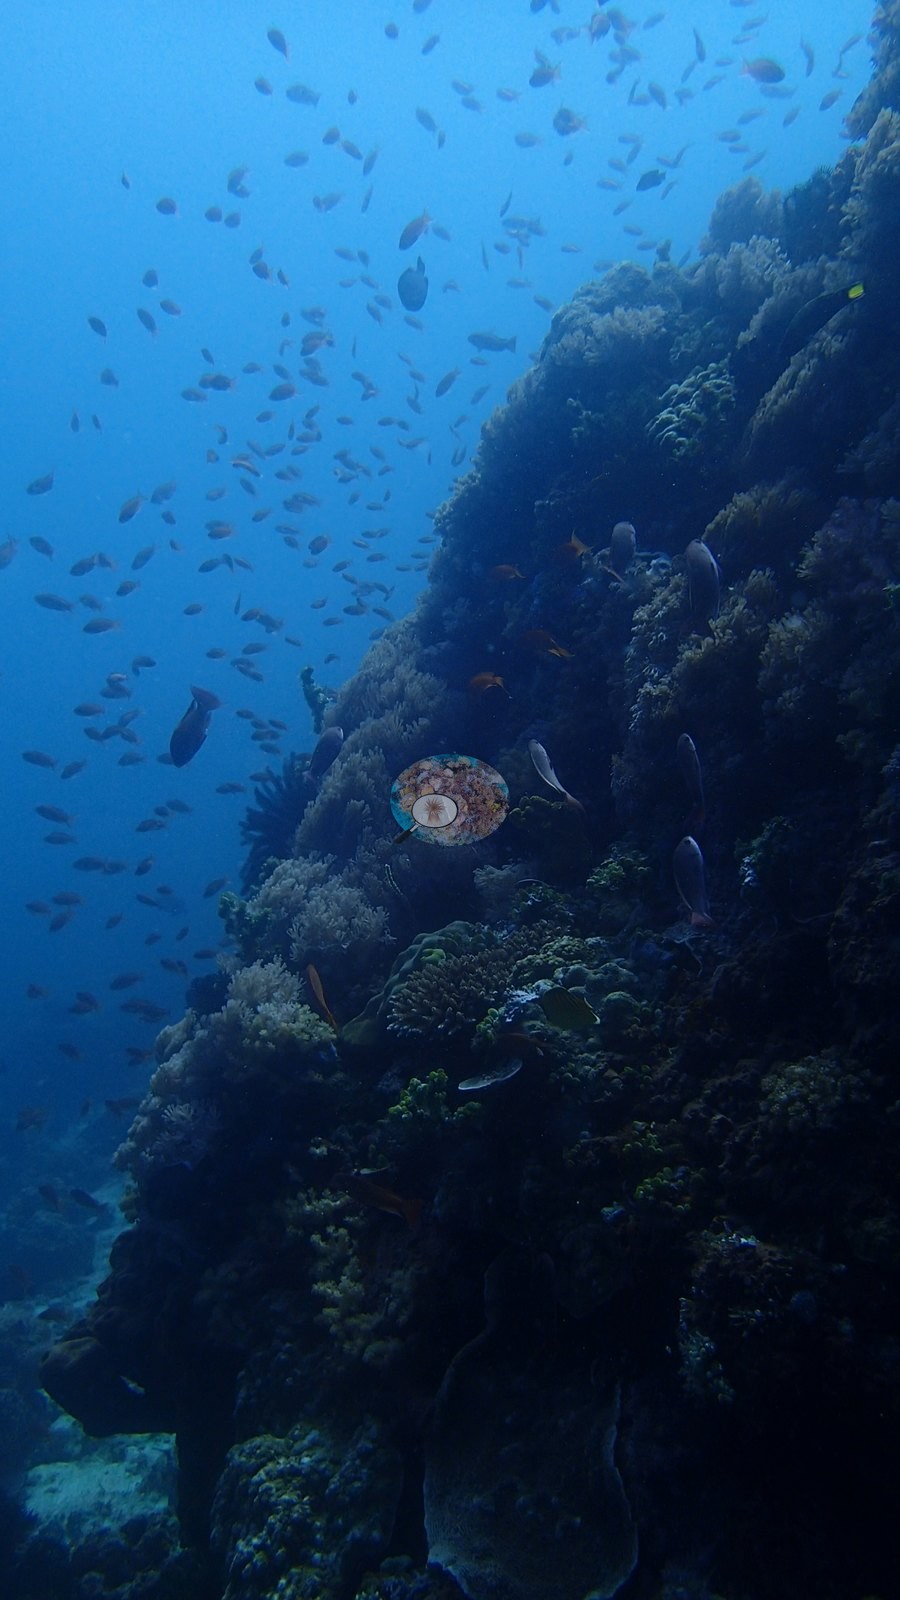
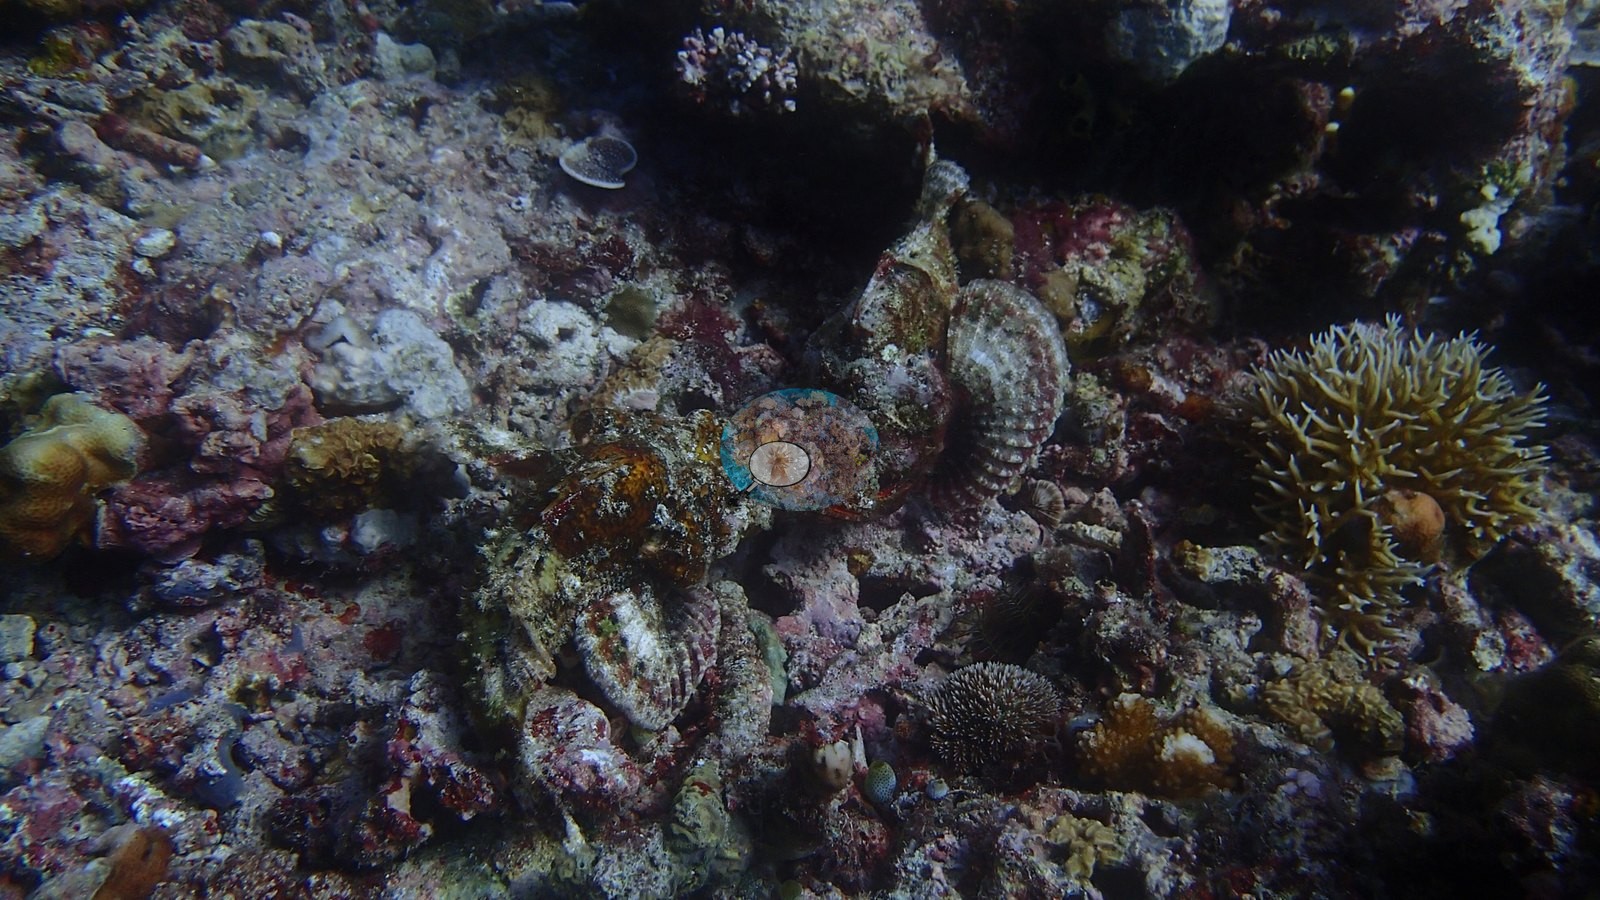
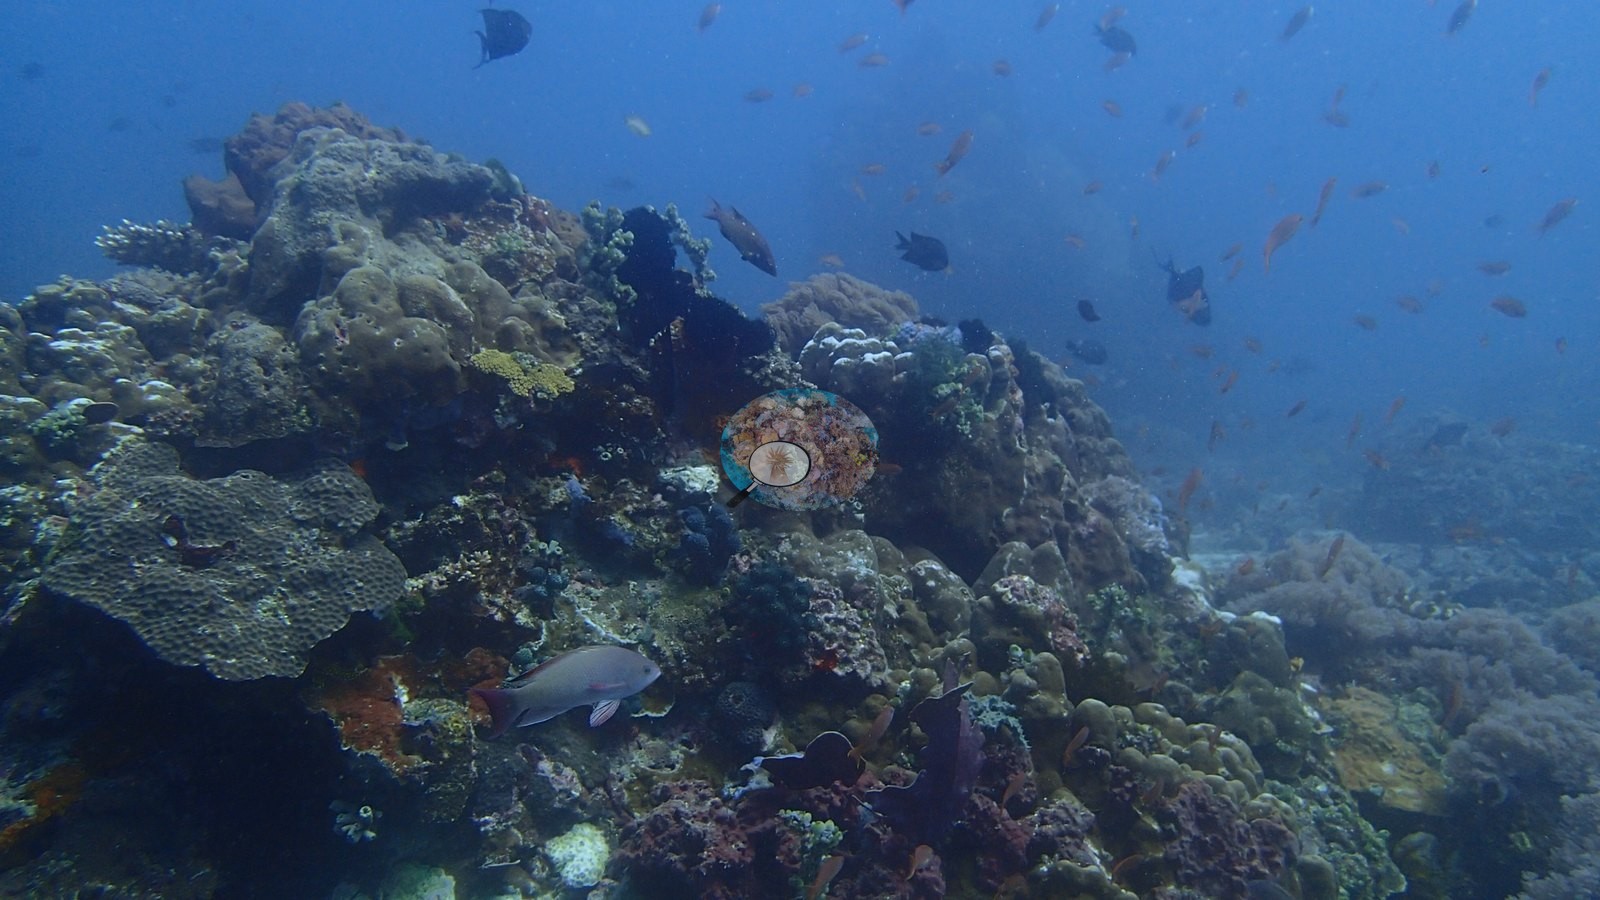
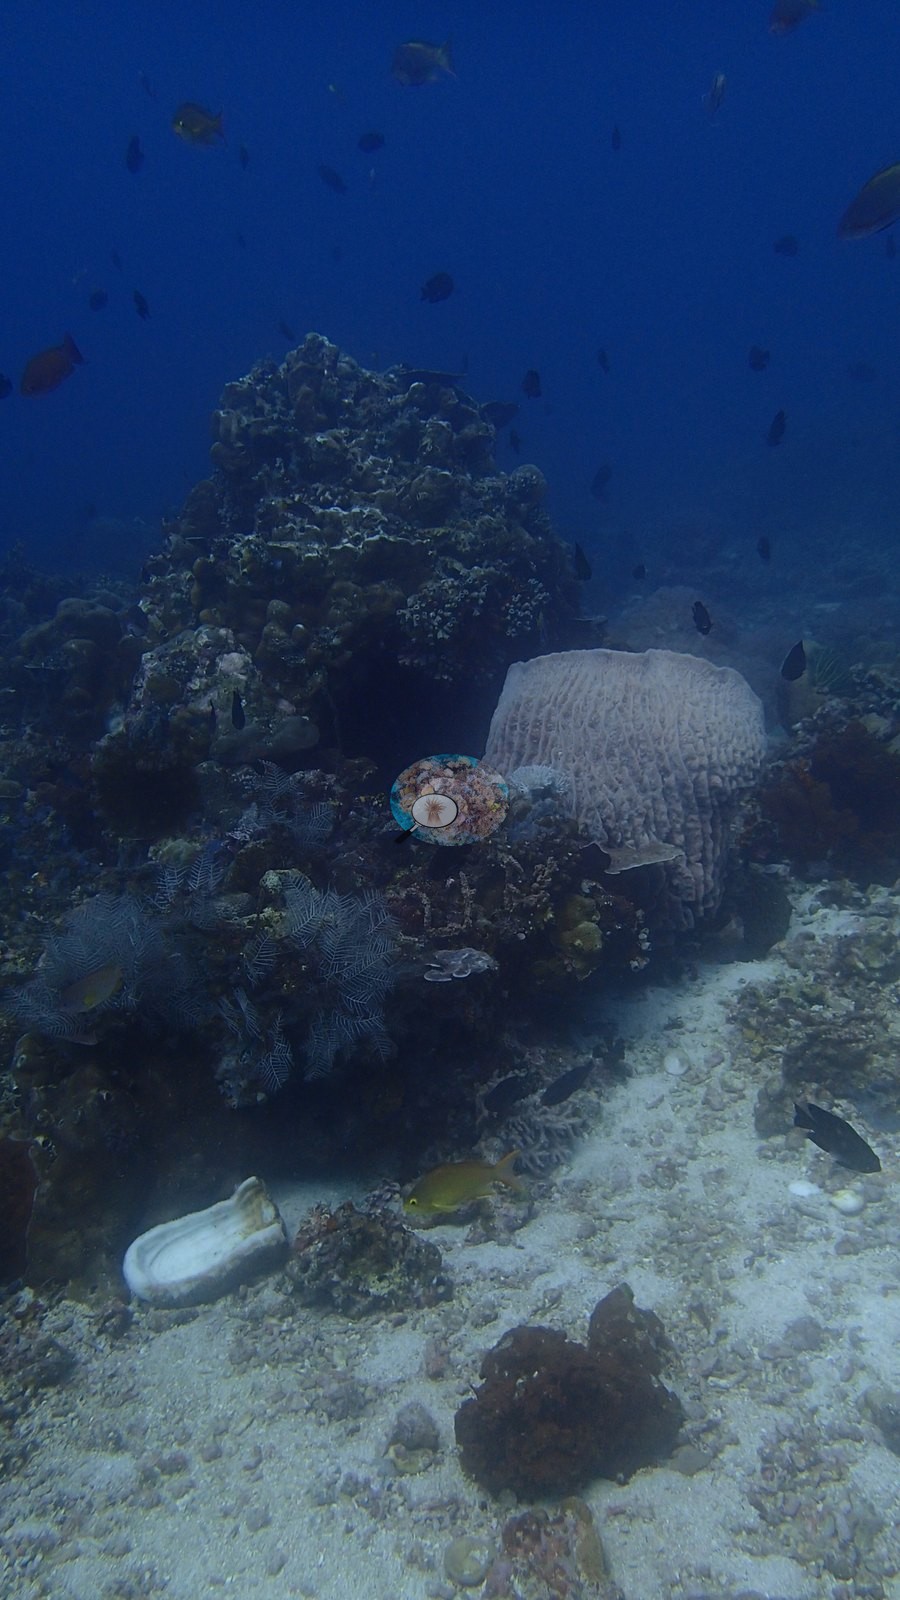
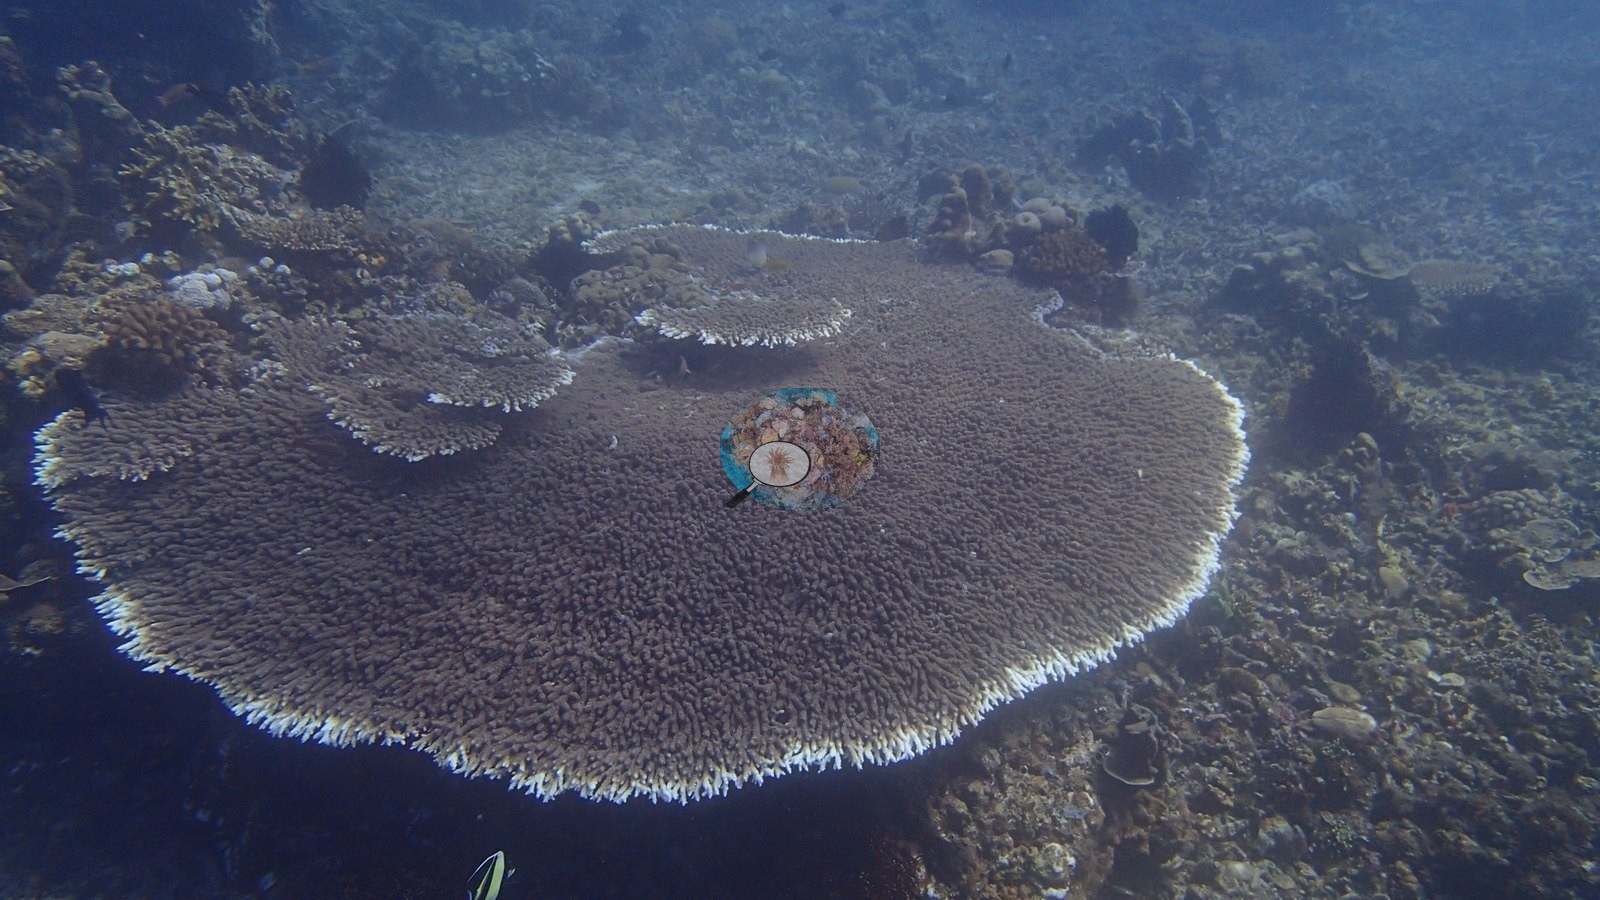
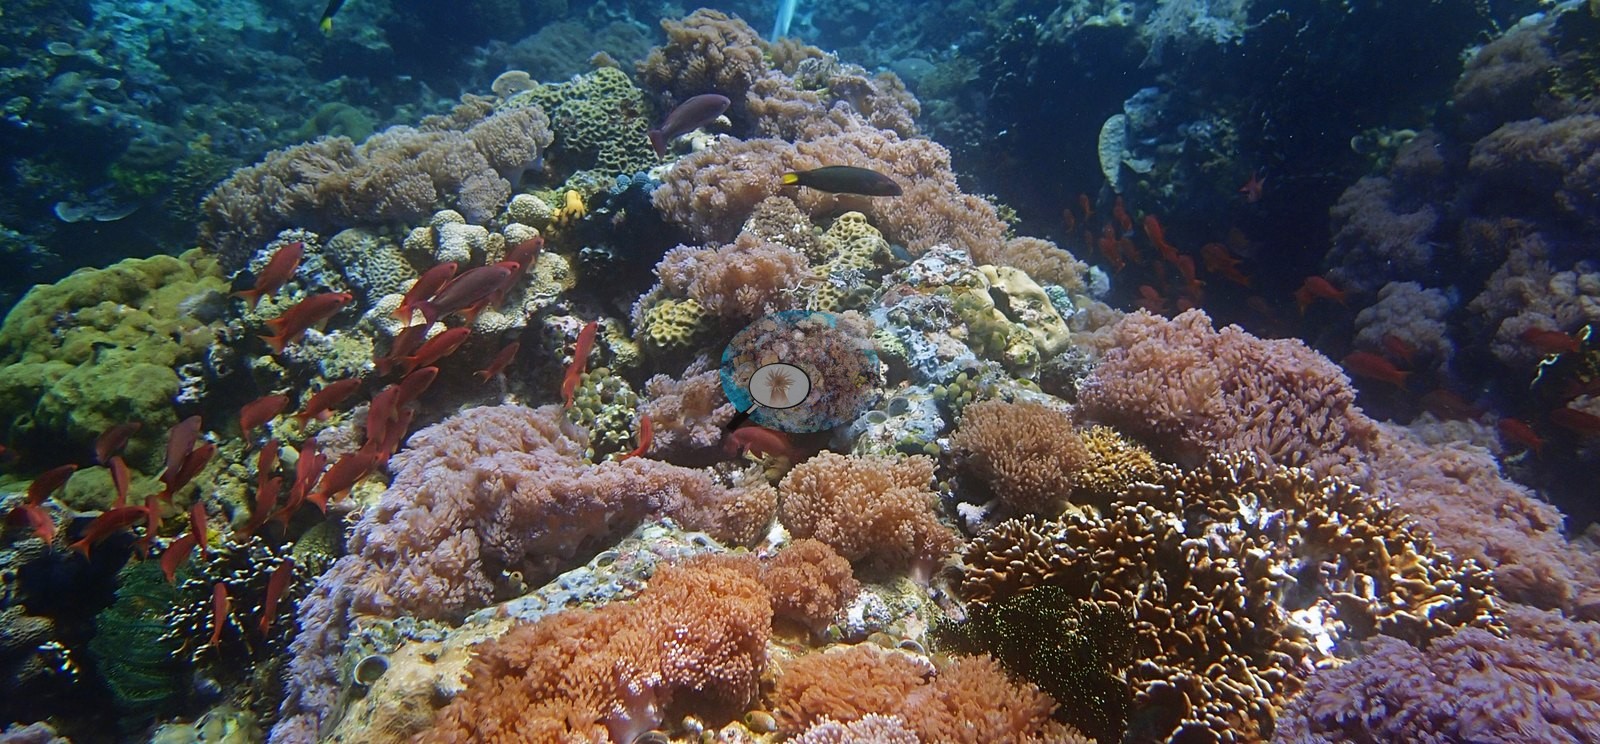
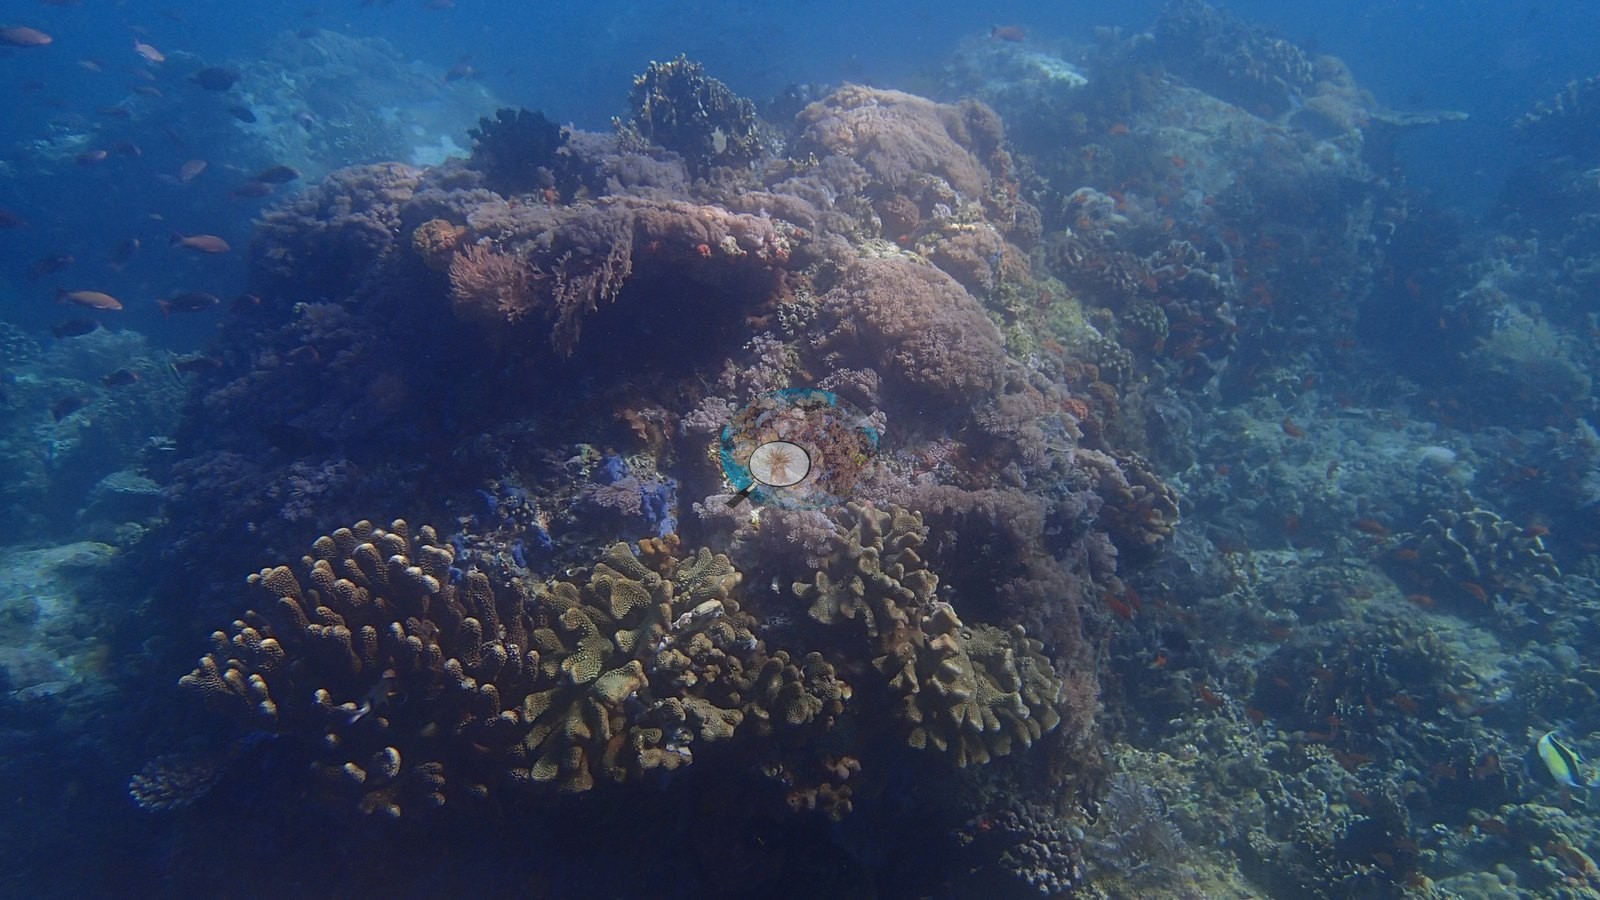
Sombrero Island carries the highest hard coral cover in the set, with wide-angle frames showing near-continuous coral over the ridge tops (e.g., Image 1).
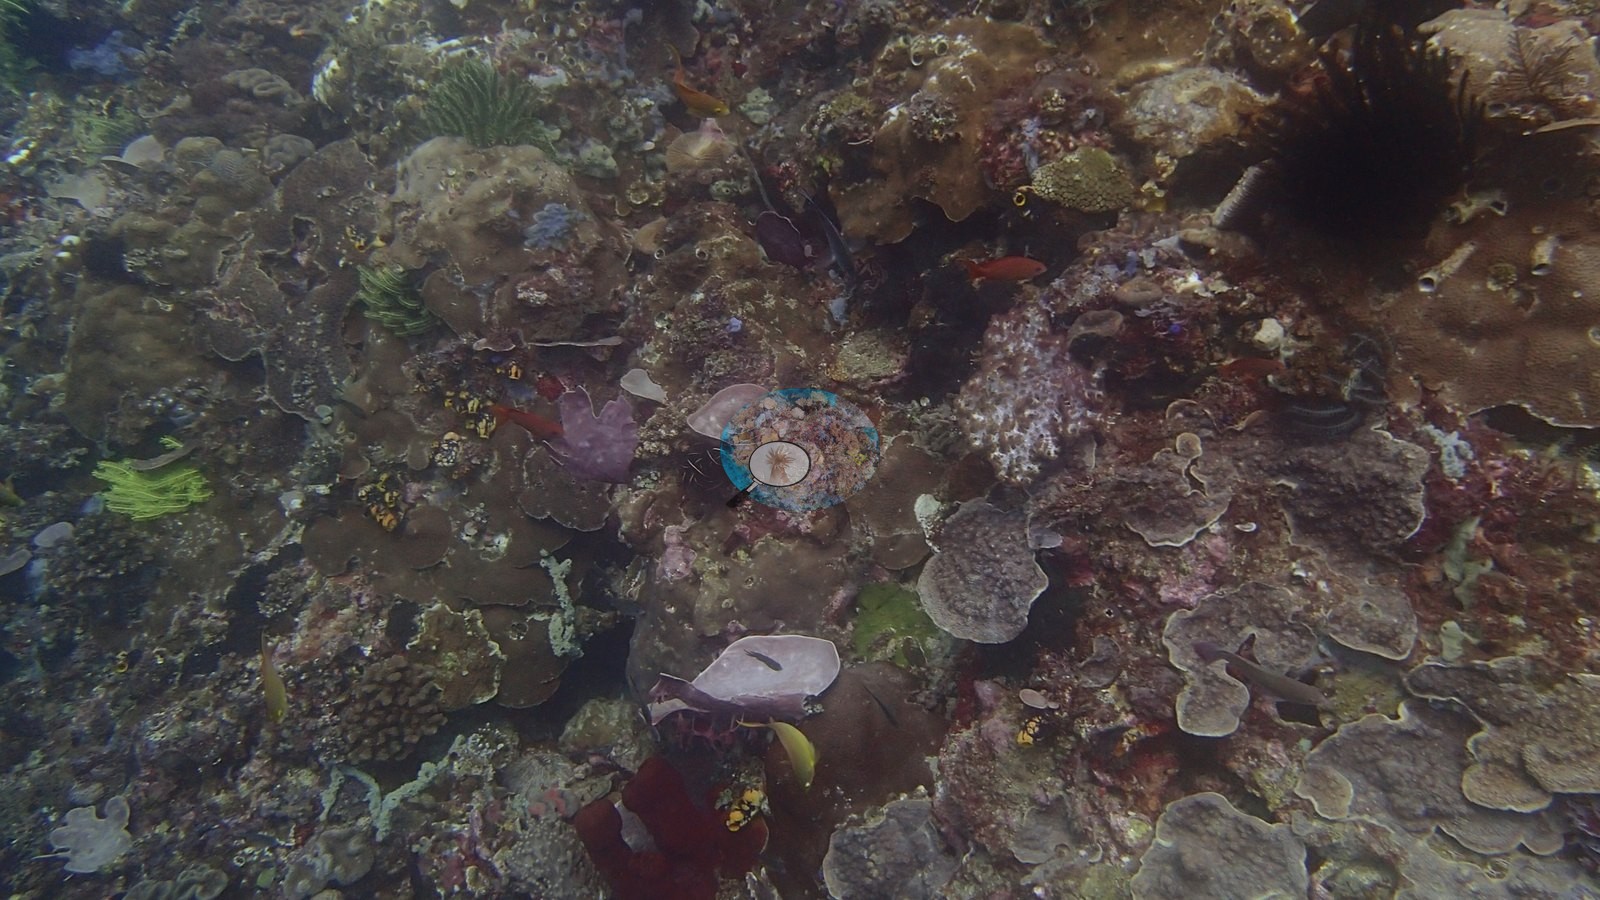
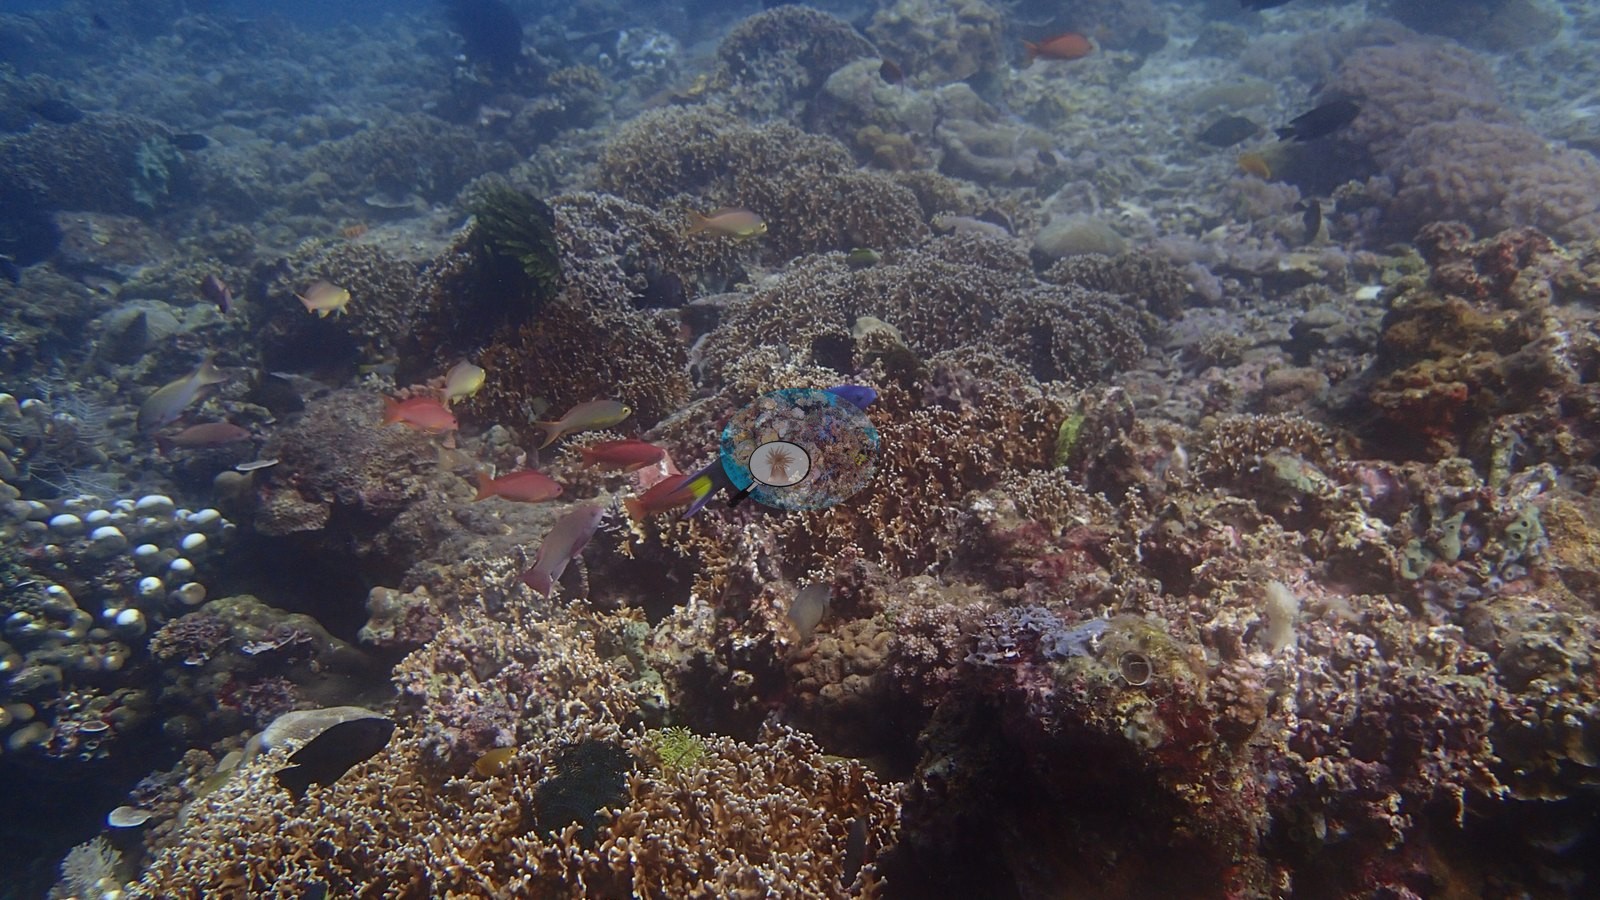
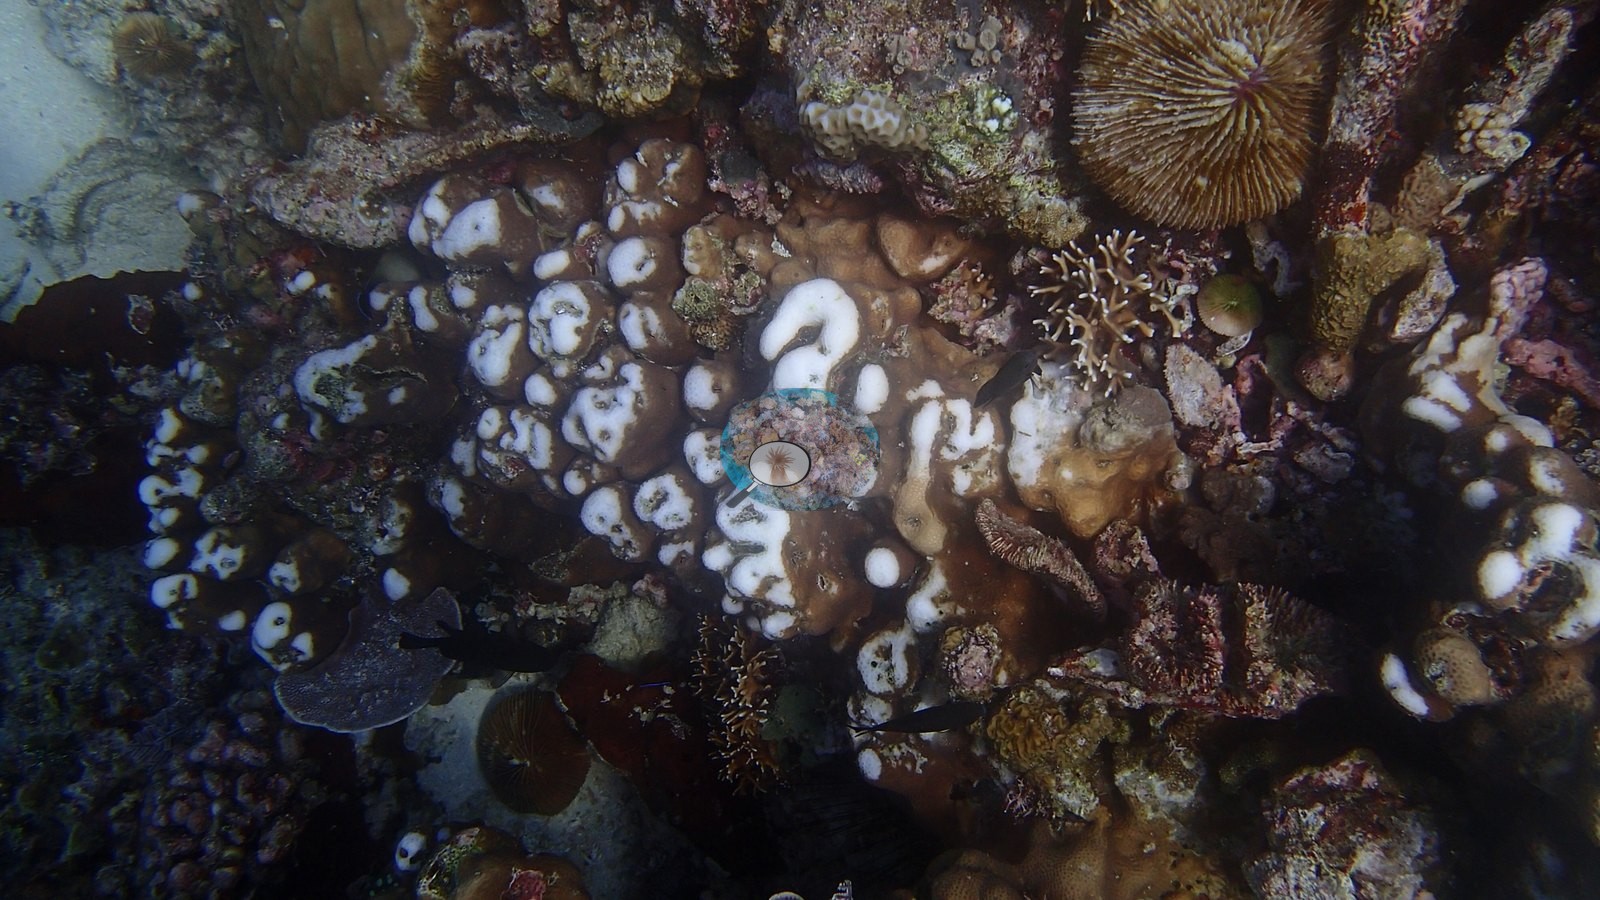
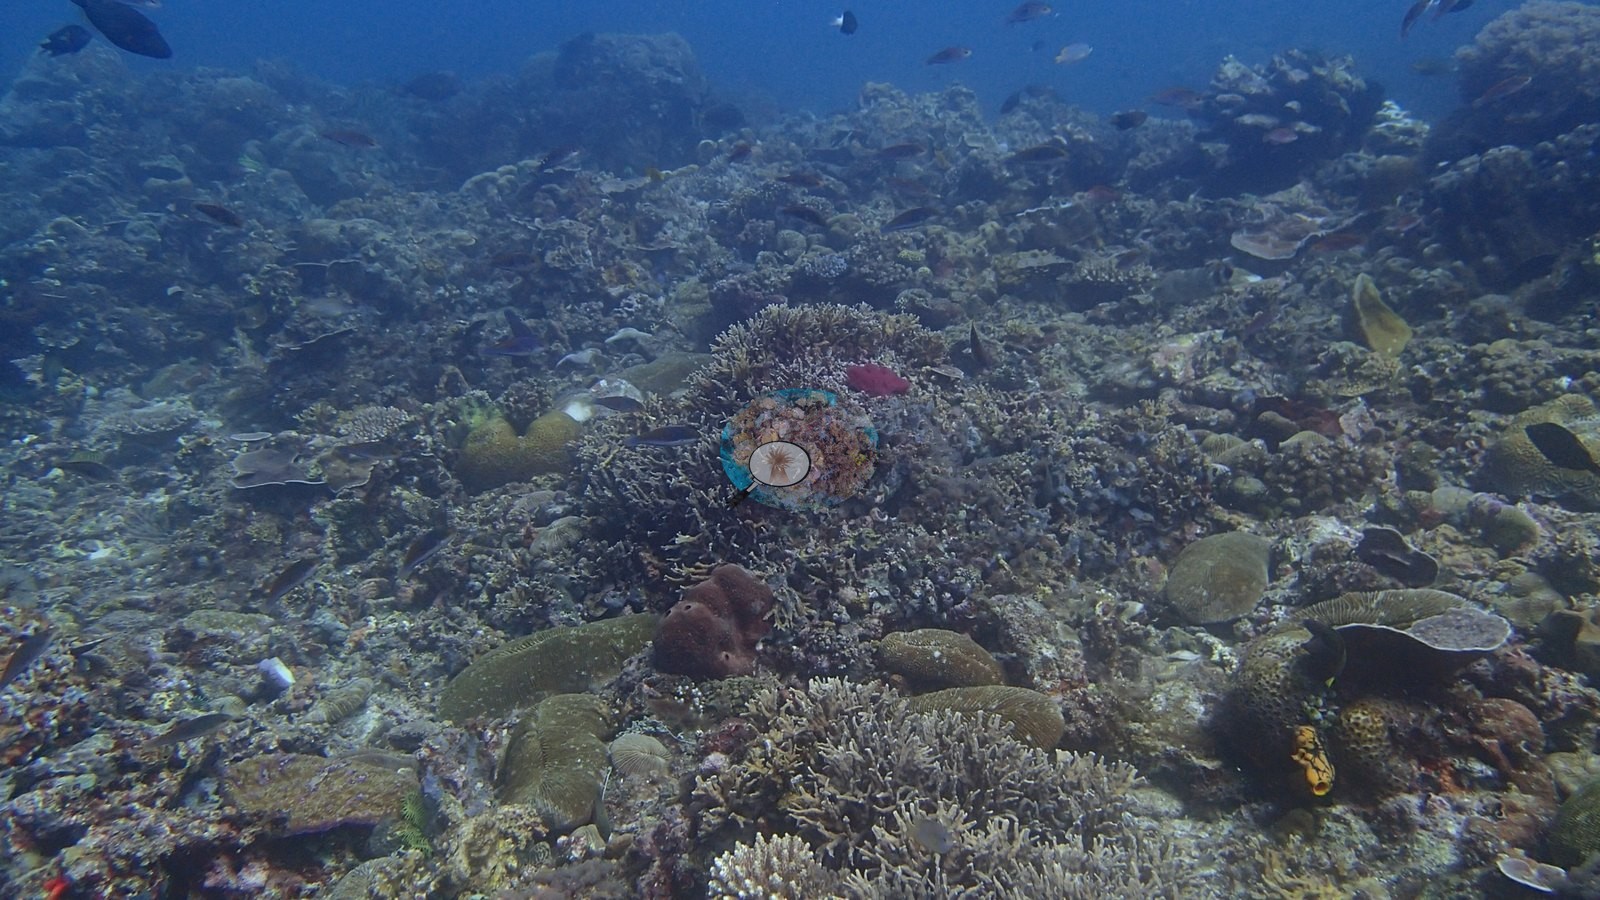
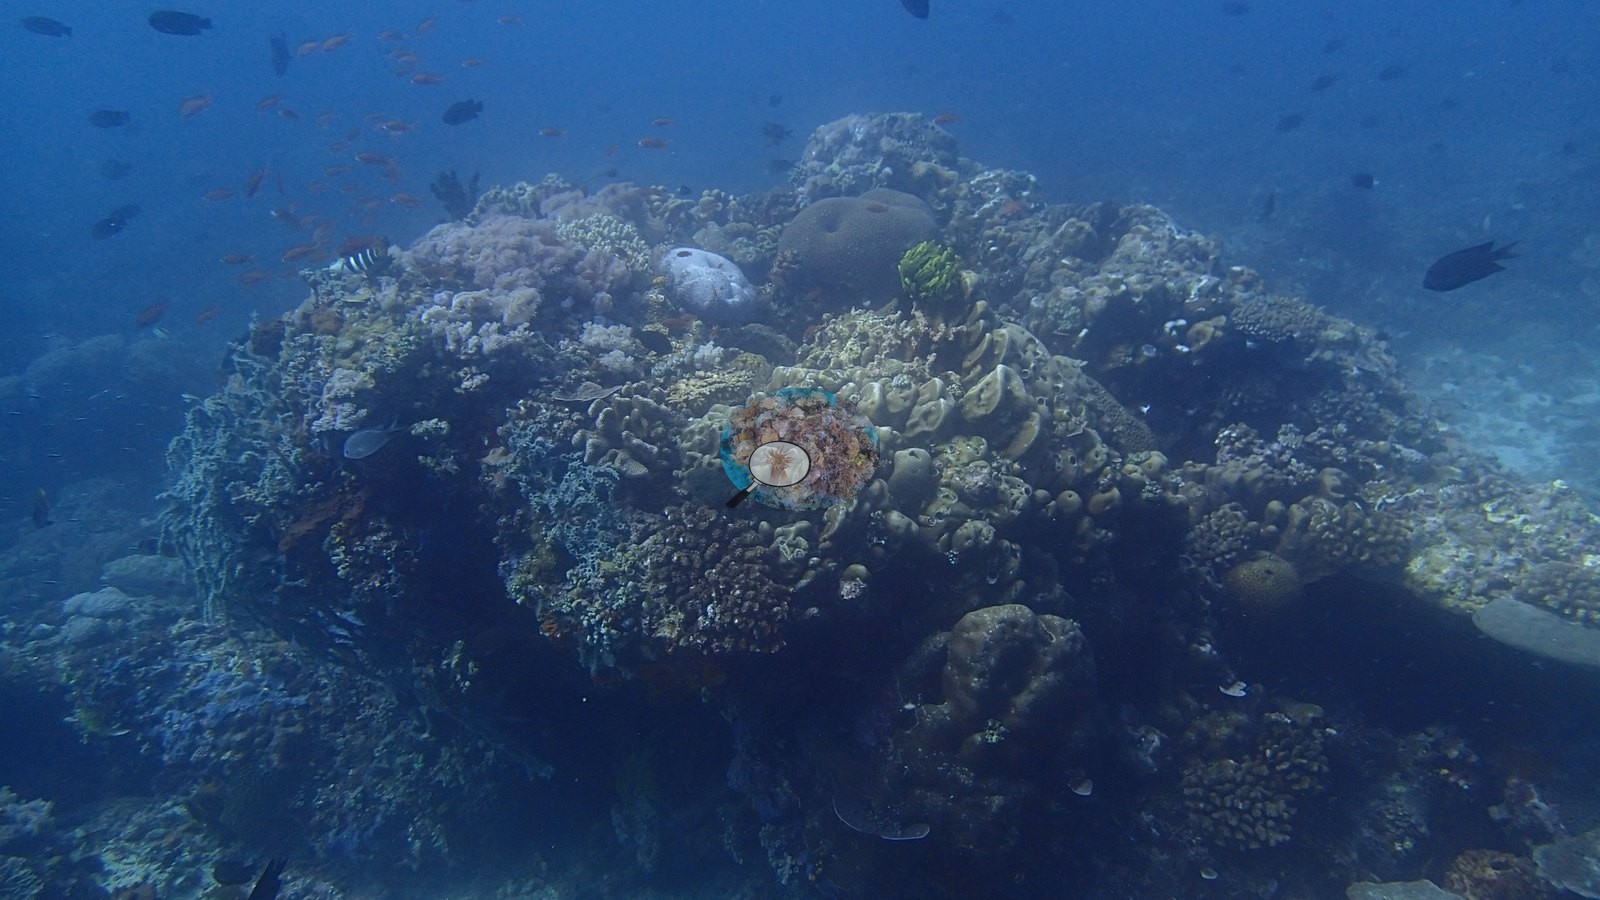
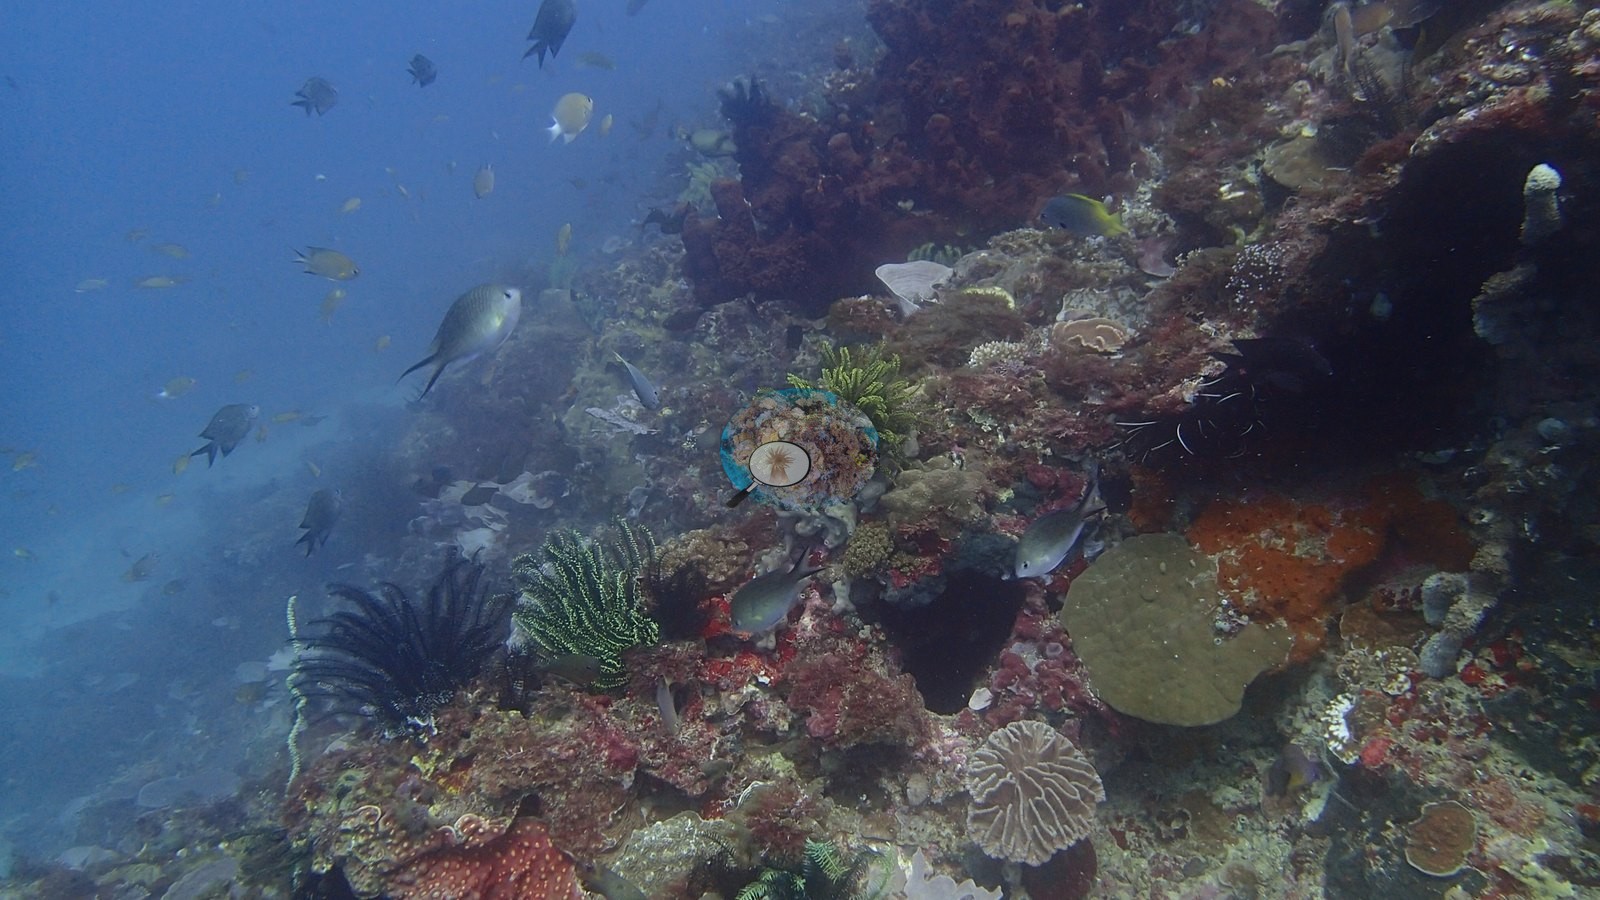
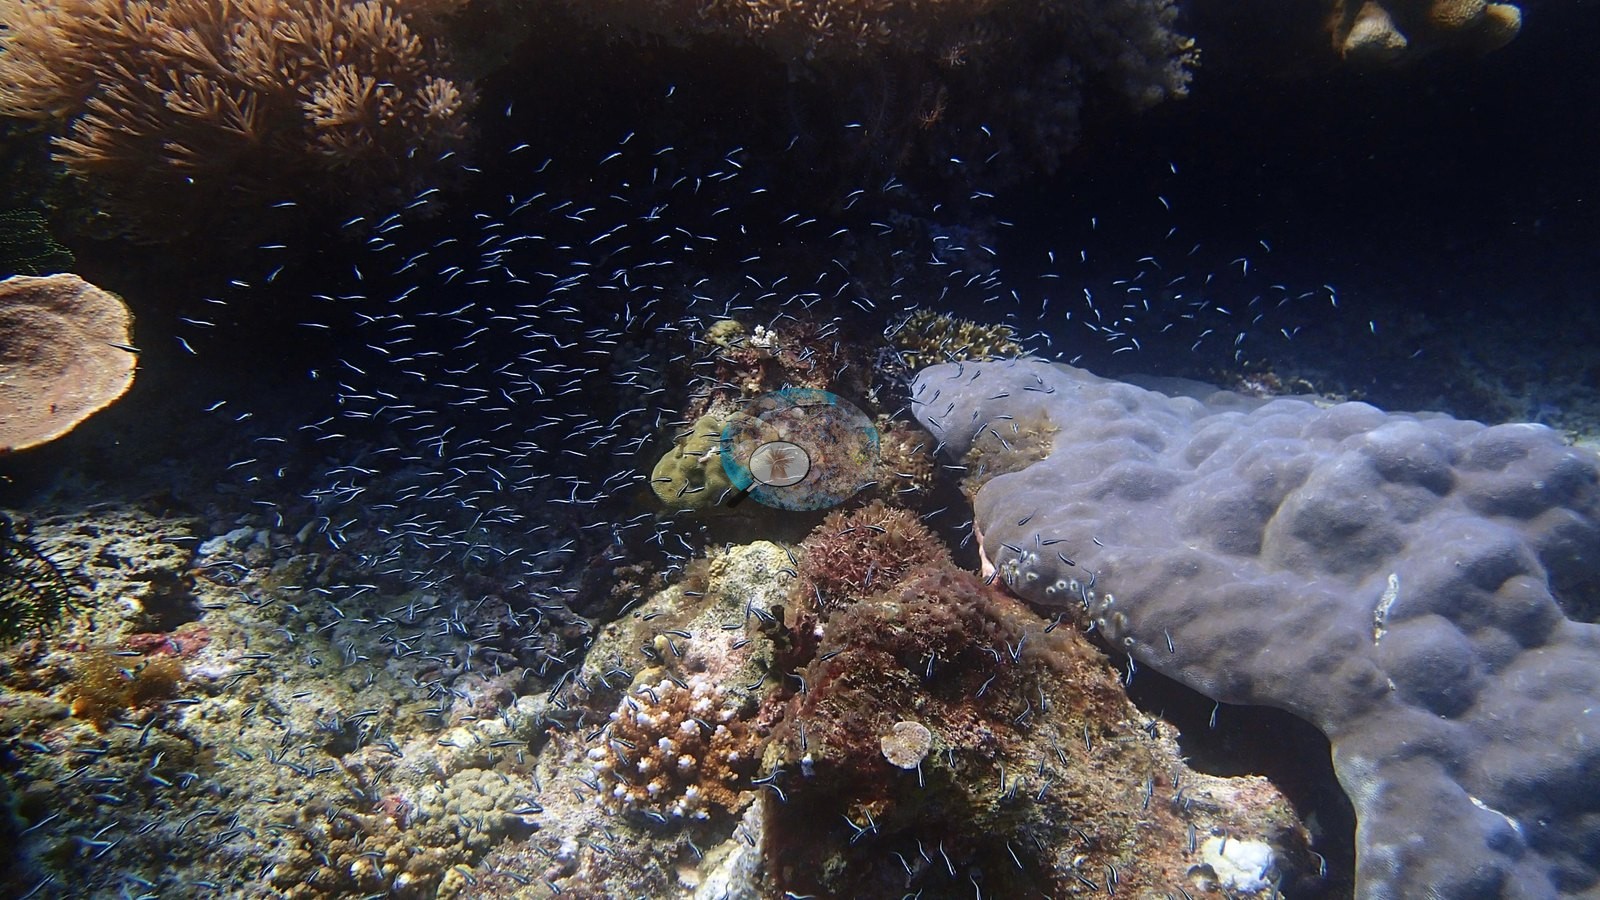
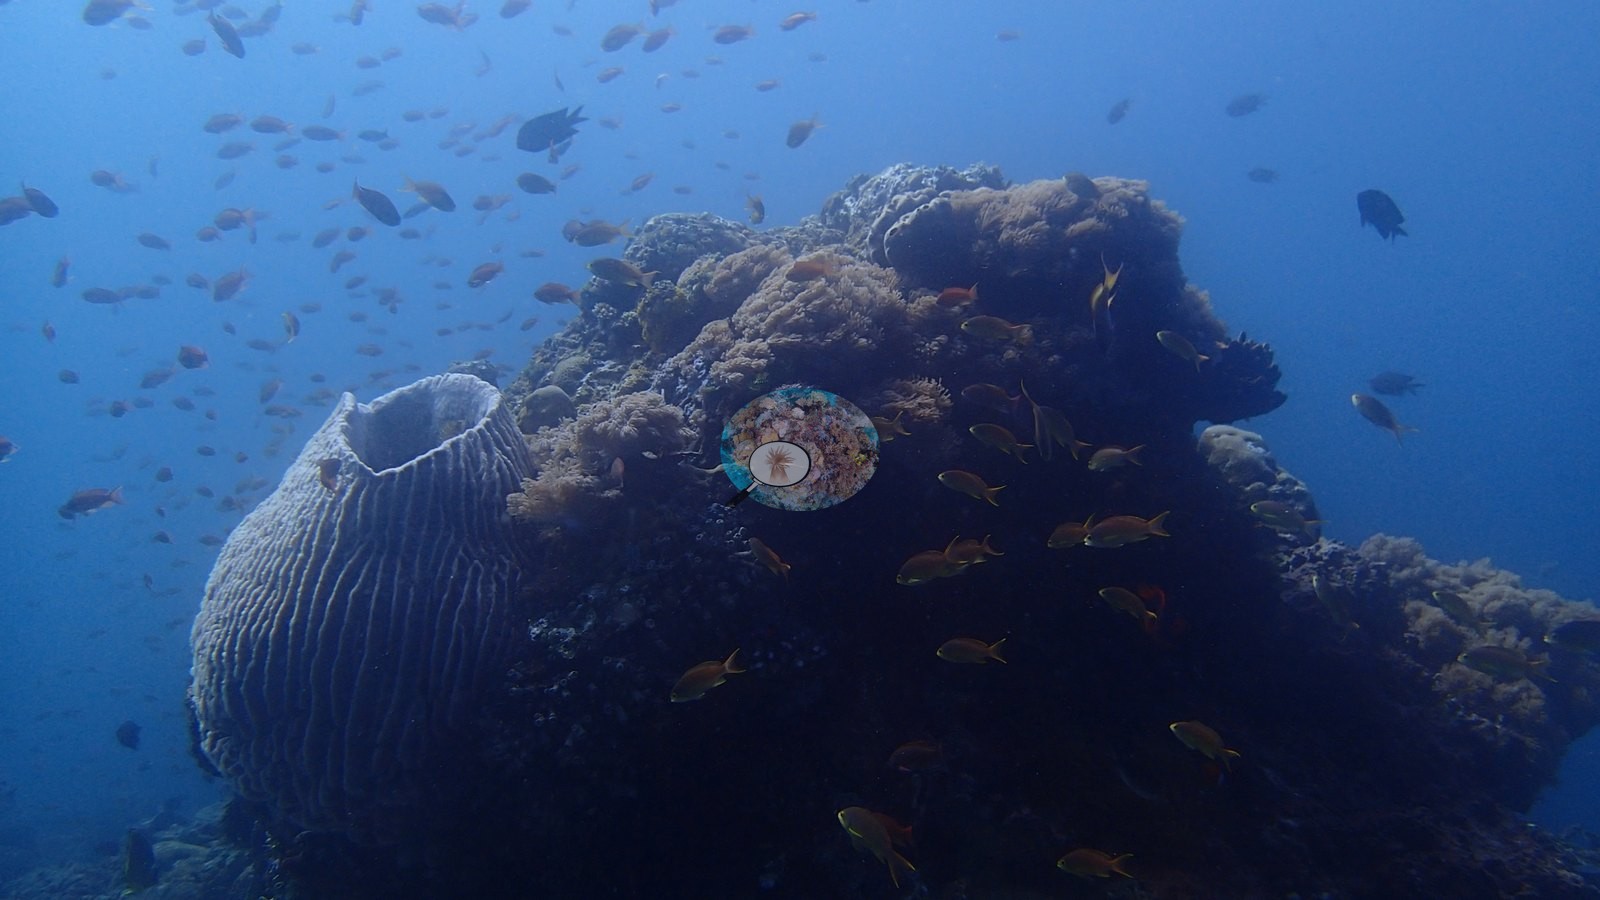
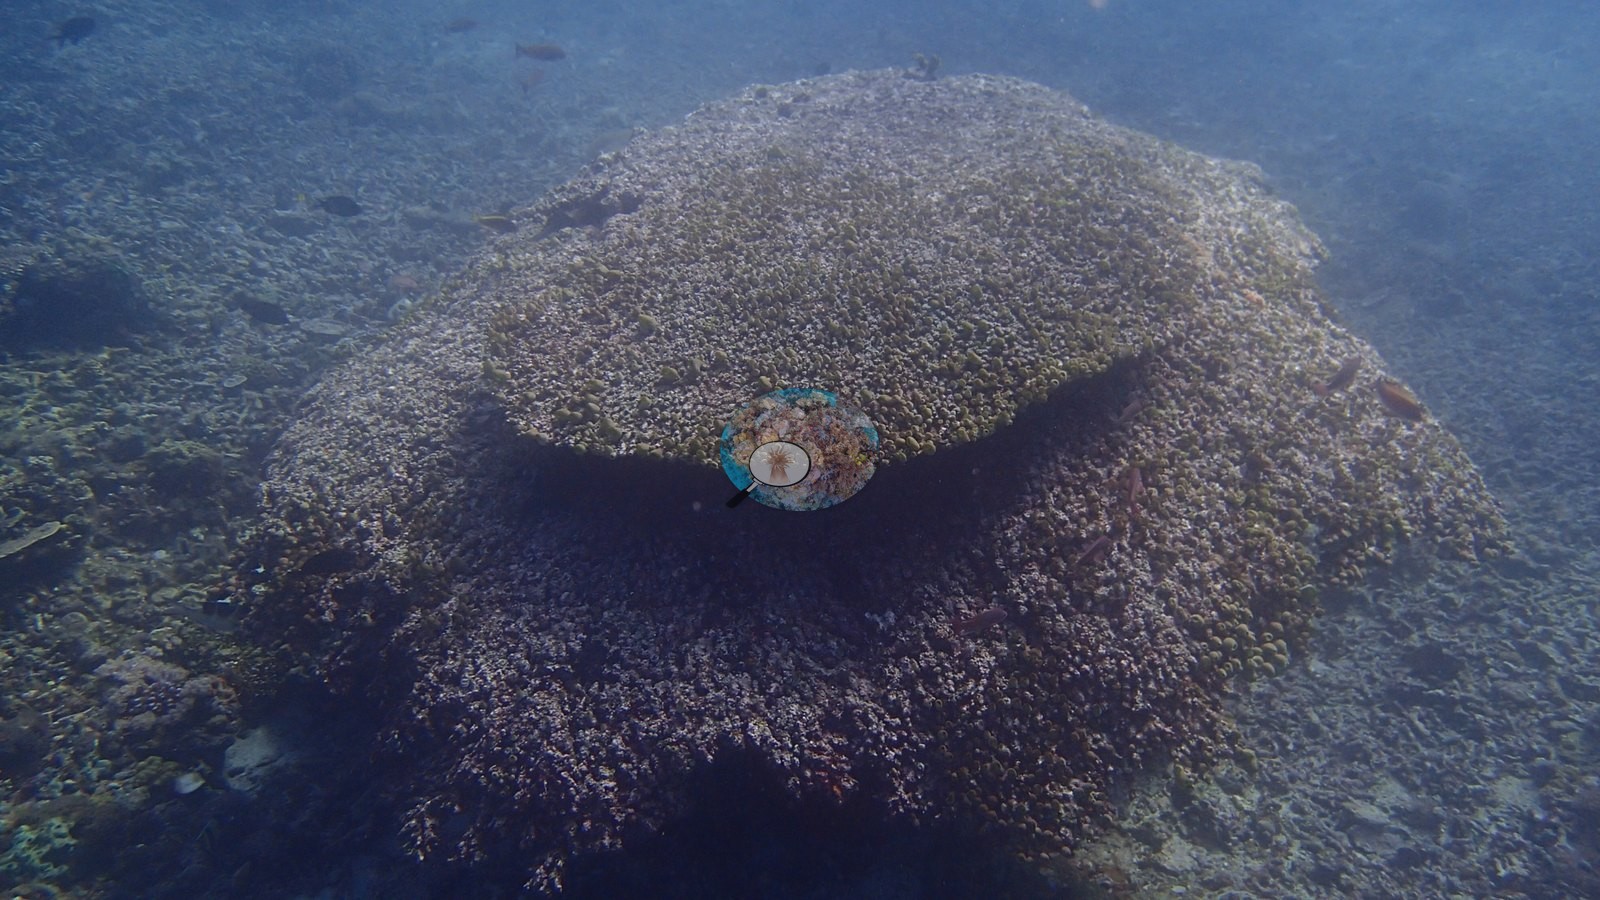
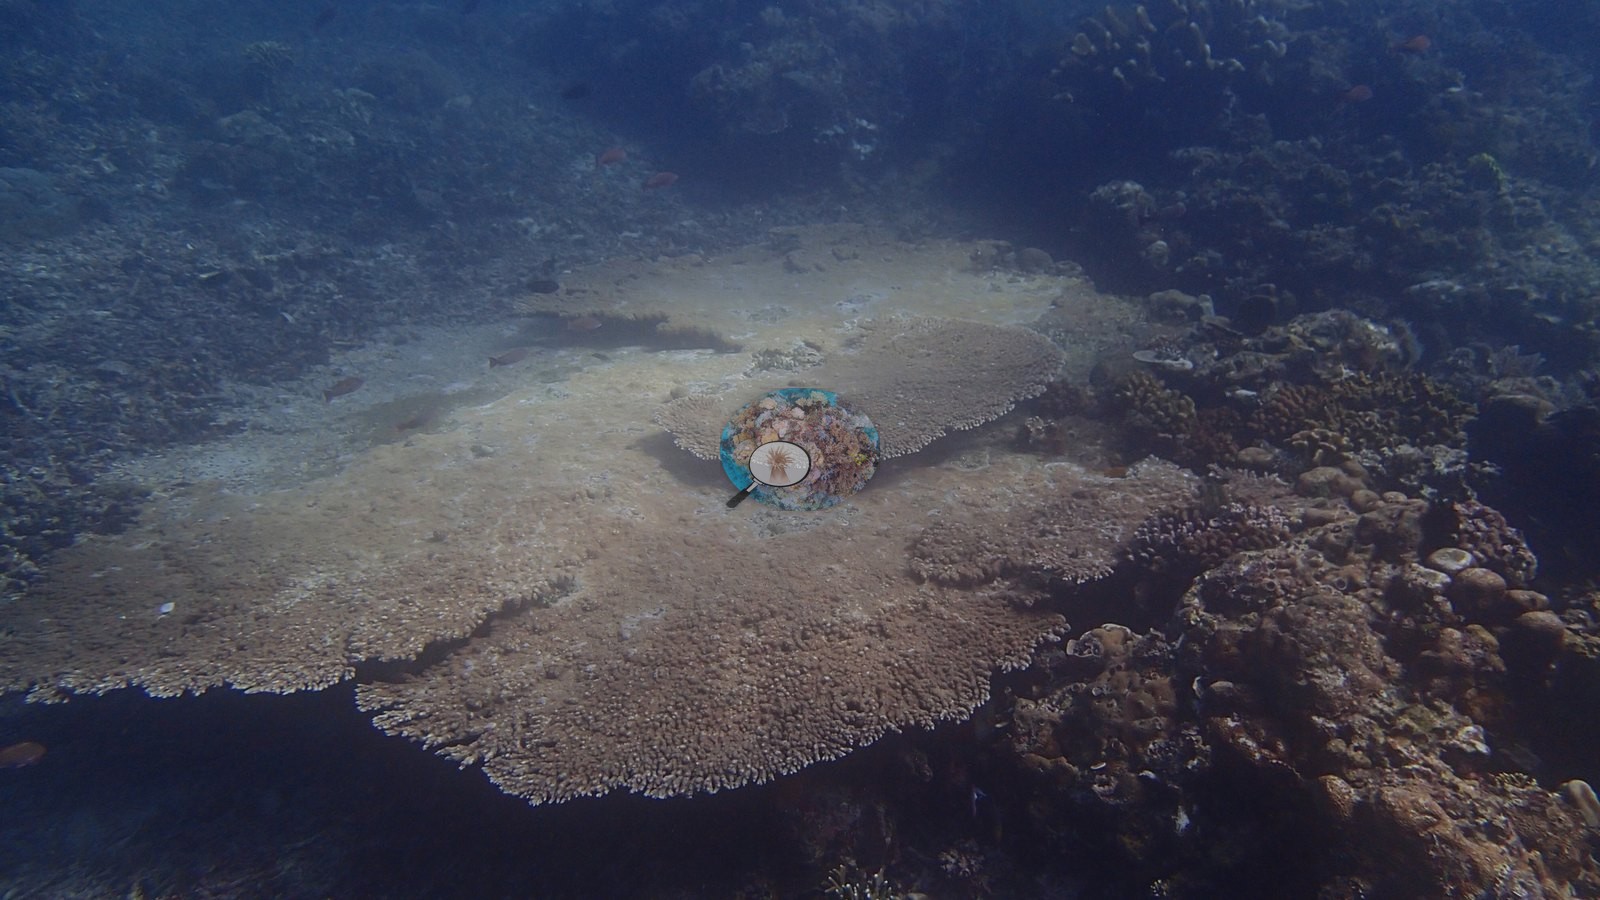
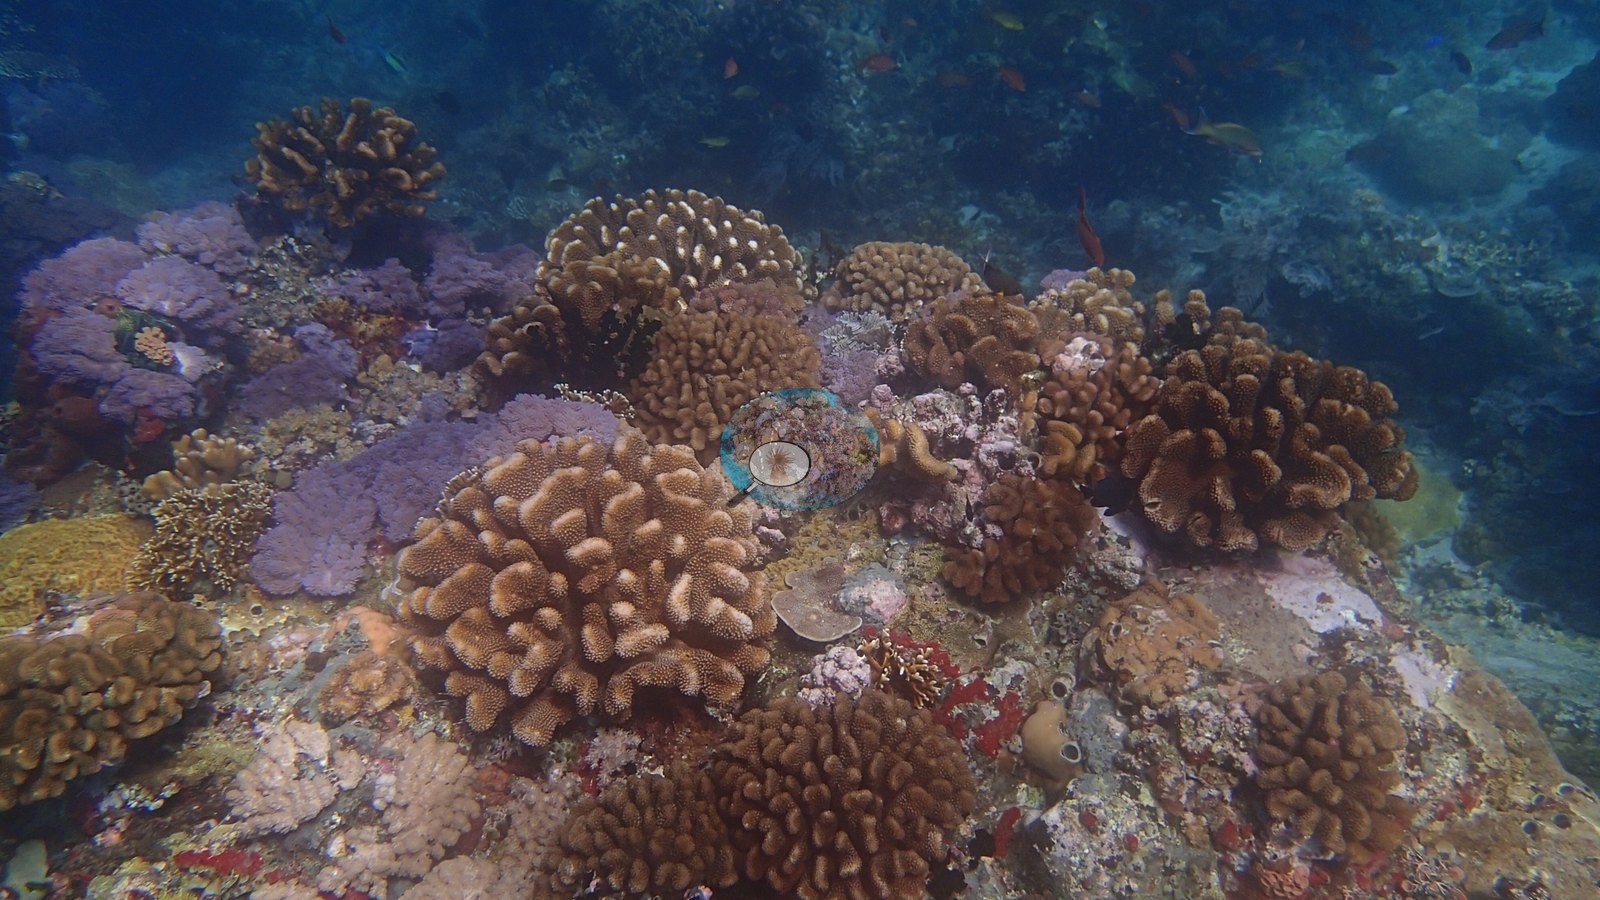
Enormous tabular Acropora dominate - several plates meters across with clean pale growing margins, and one very large pyramidal plate structure standing clear of the slope. Around them are extensive columnar and massive Porites, corymbose and branching Acropora, Pocillopora, and Stylophora, foliose, and encrusting plates, brain corals, fungiids, and Euphyllia (e.g., Image 2).
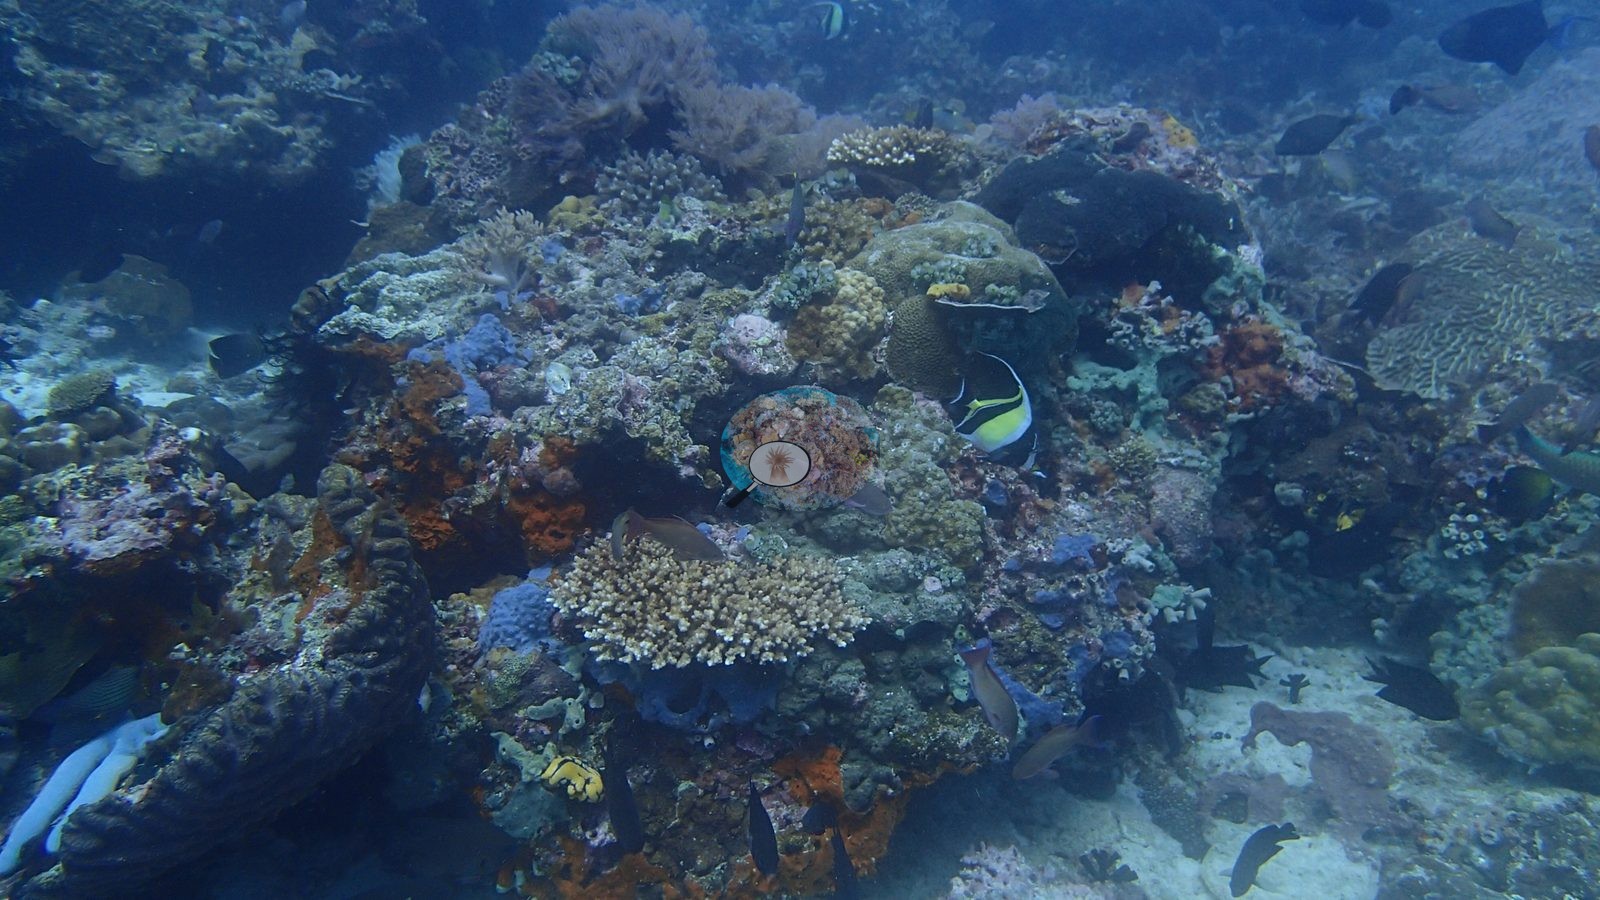
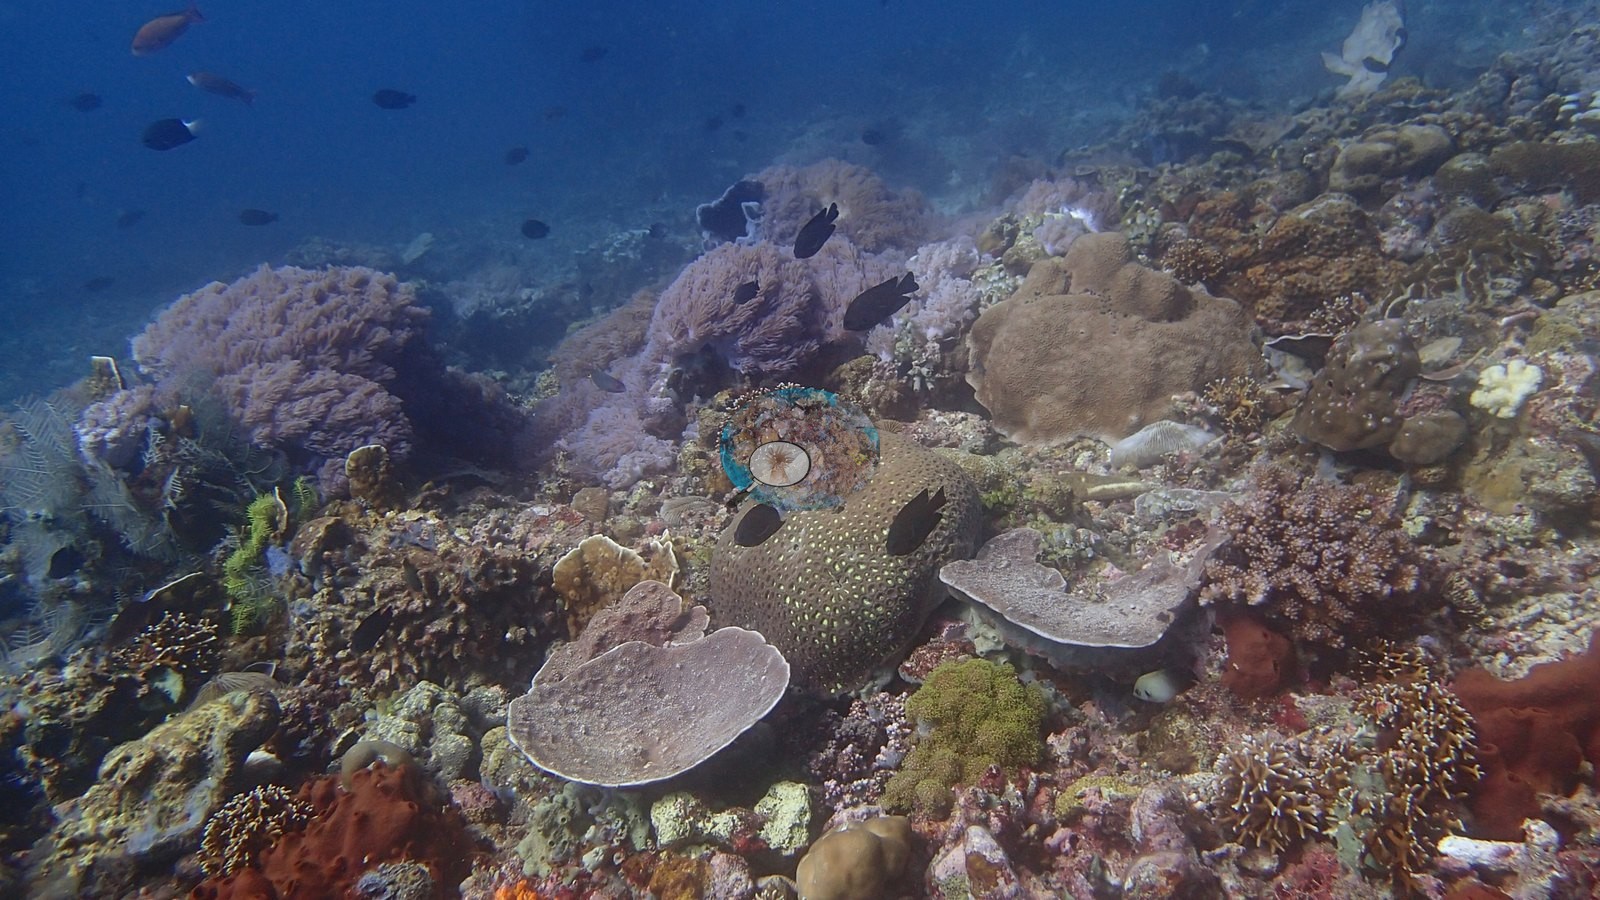
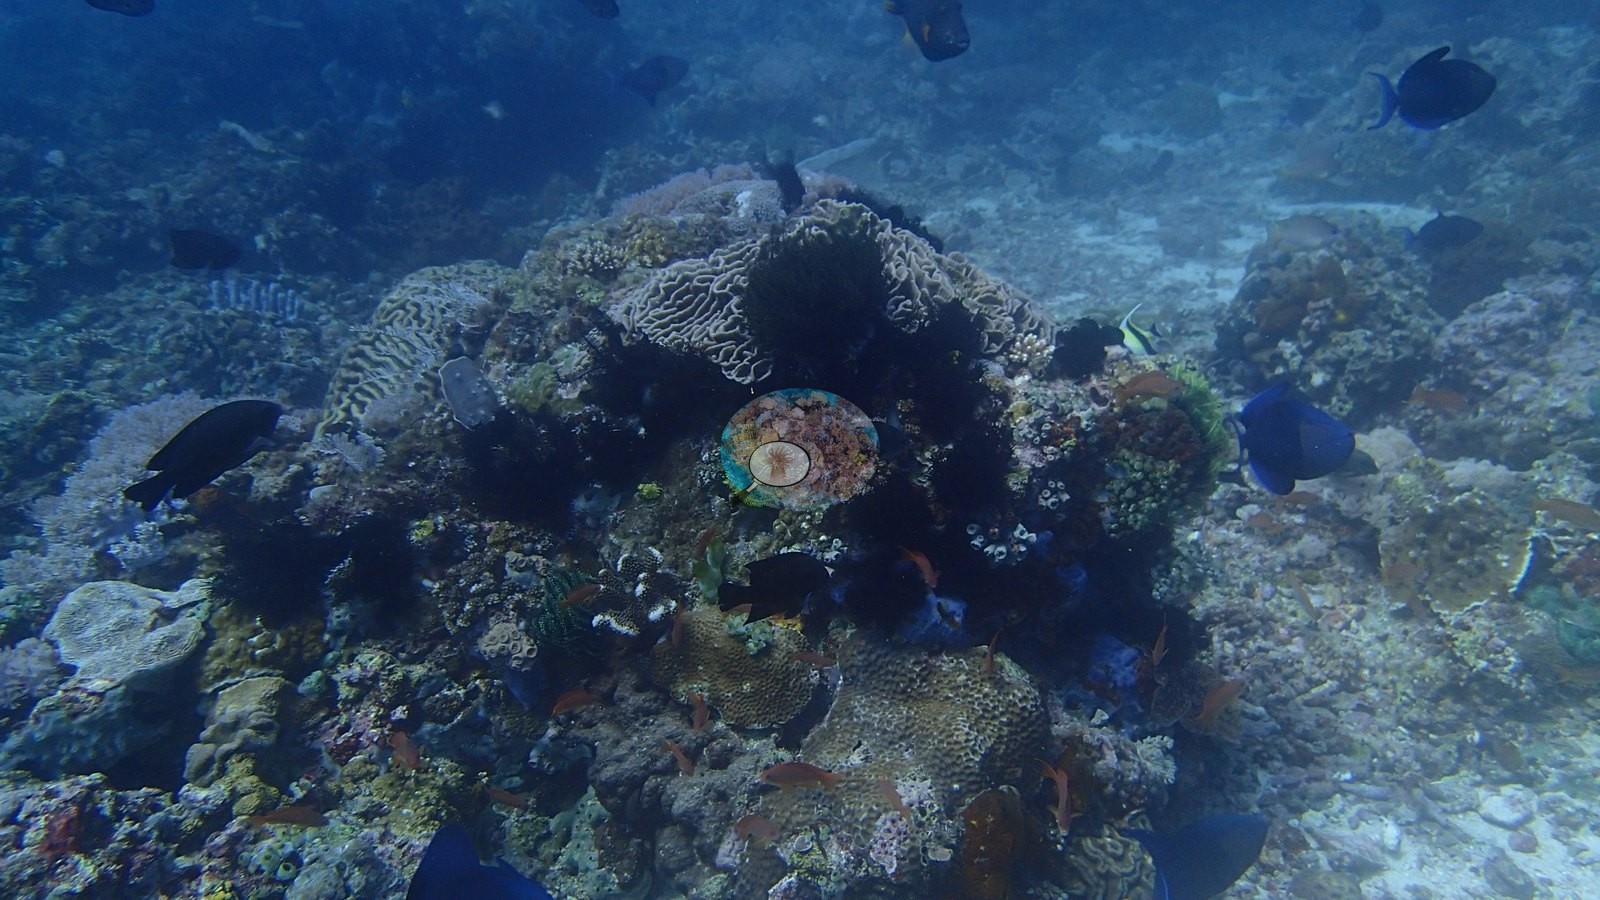
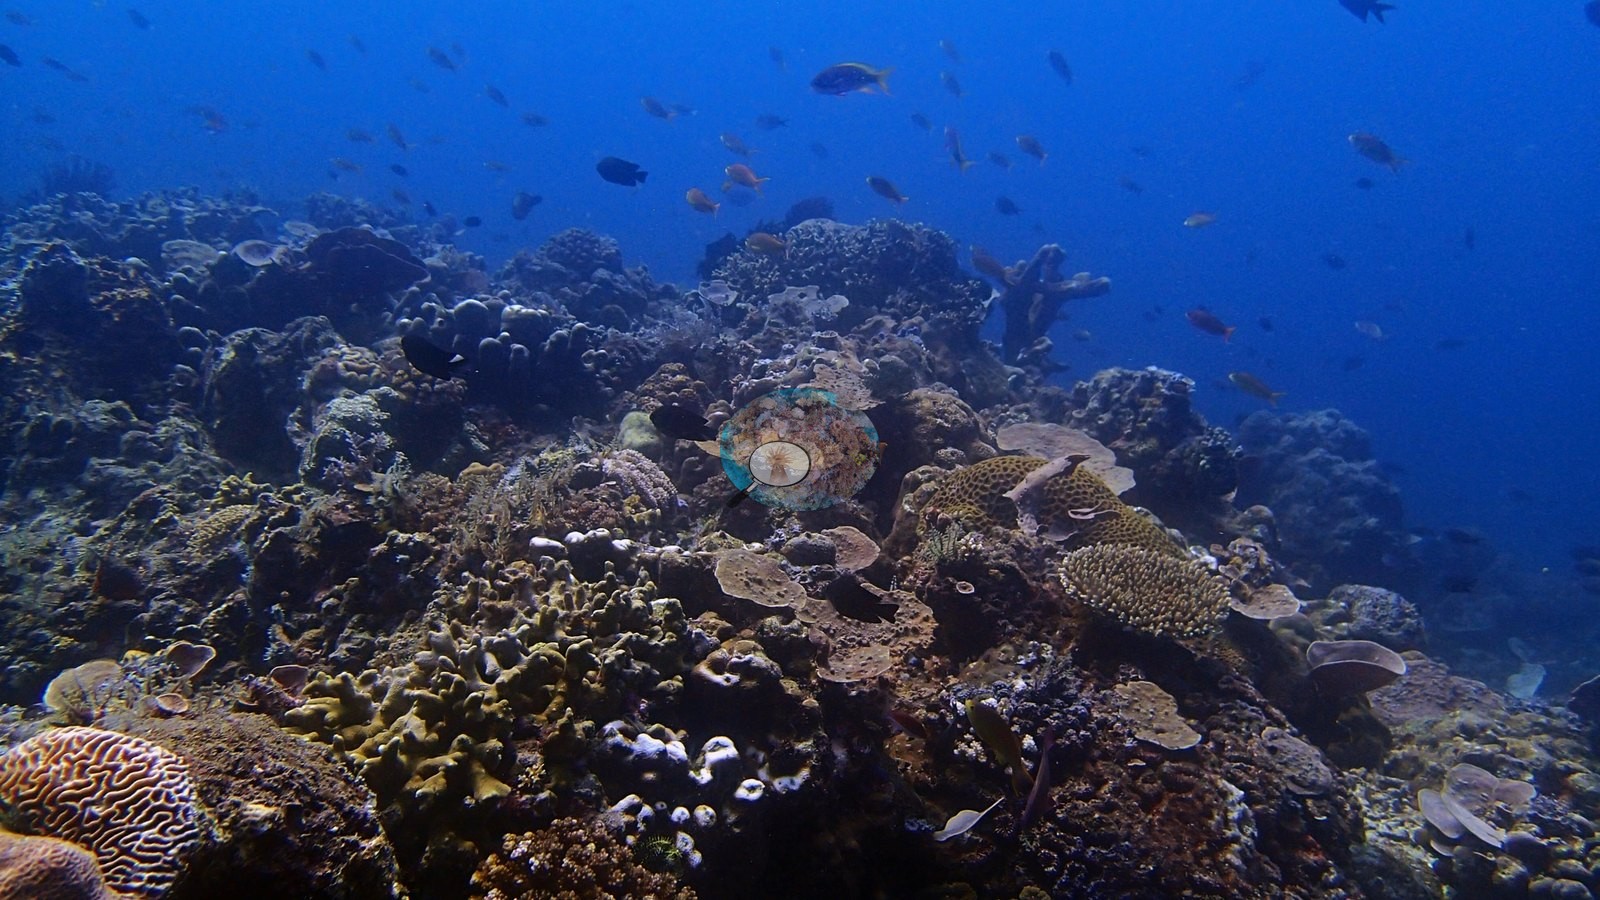
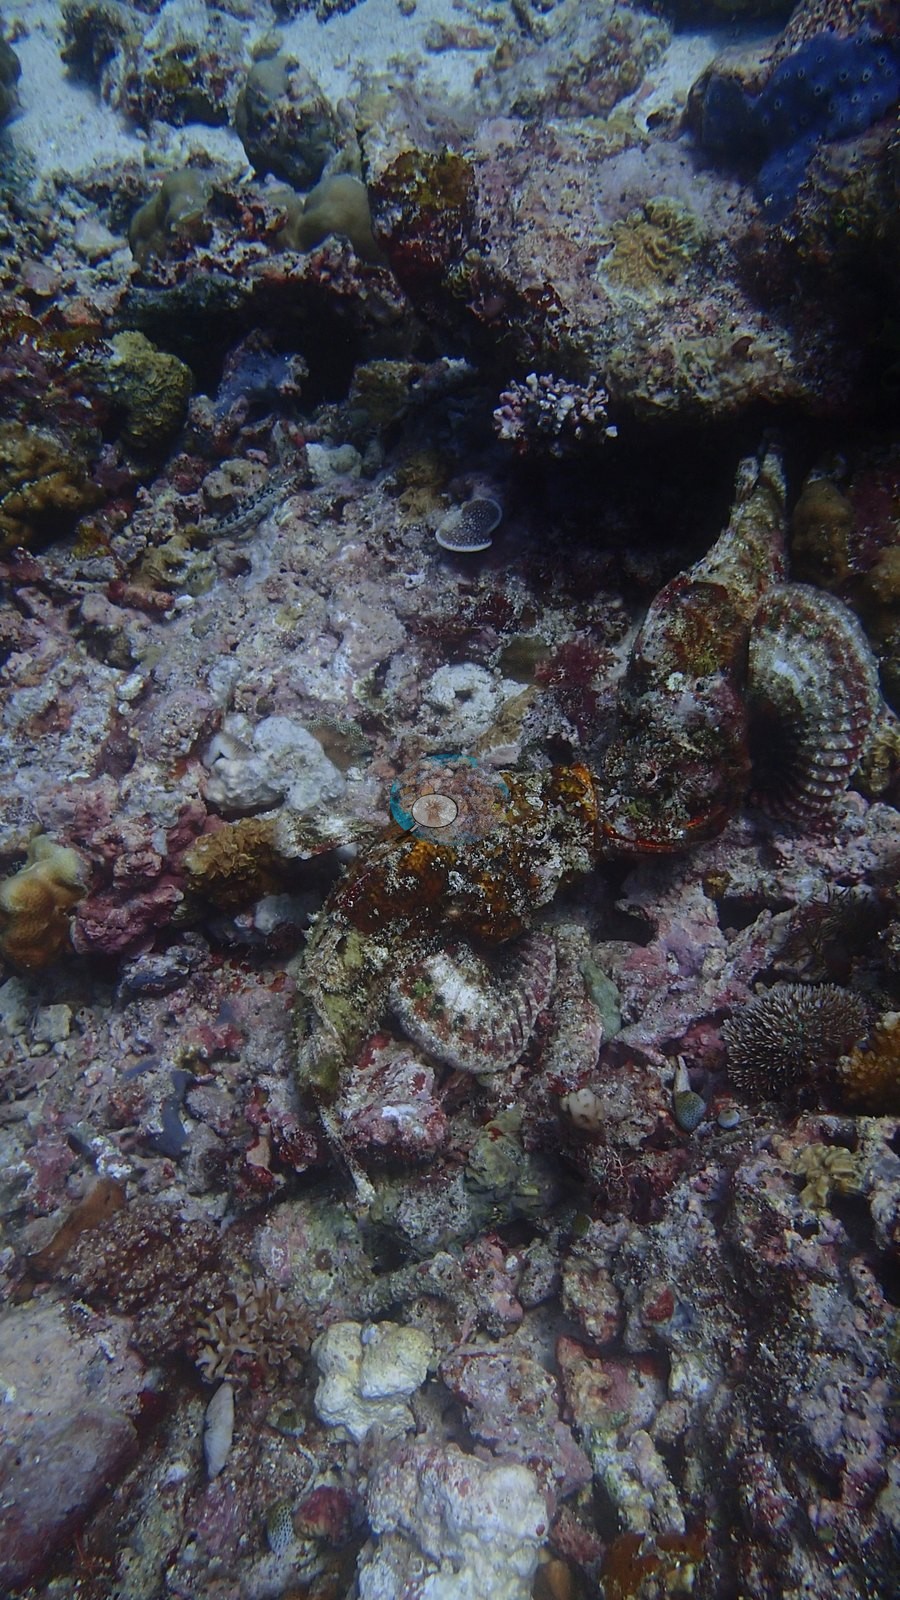
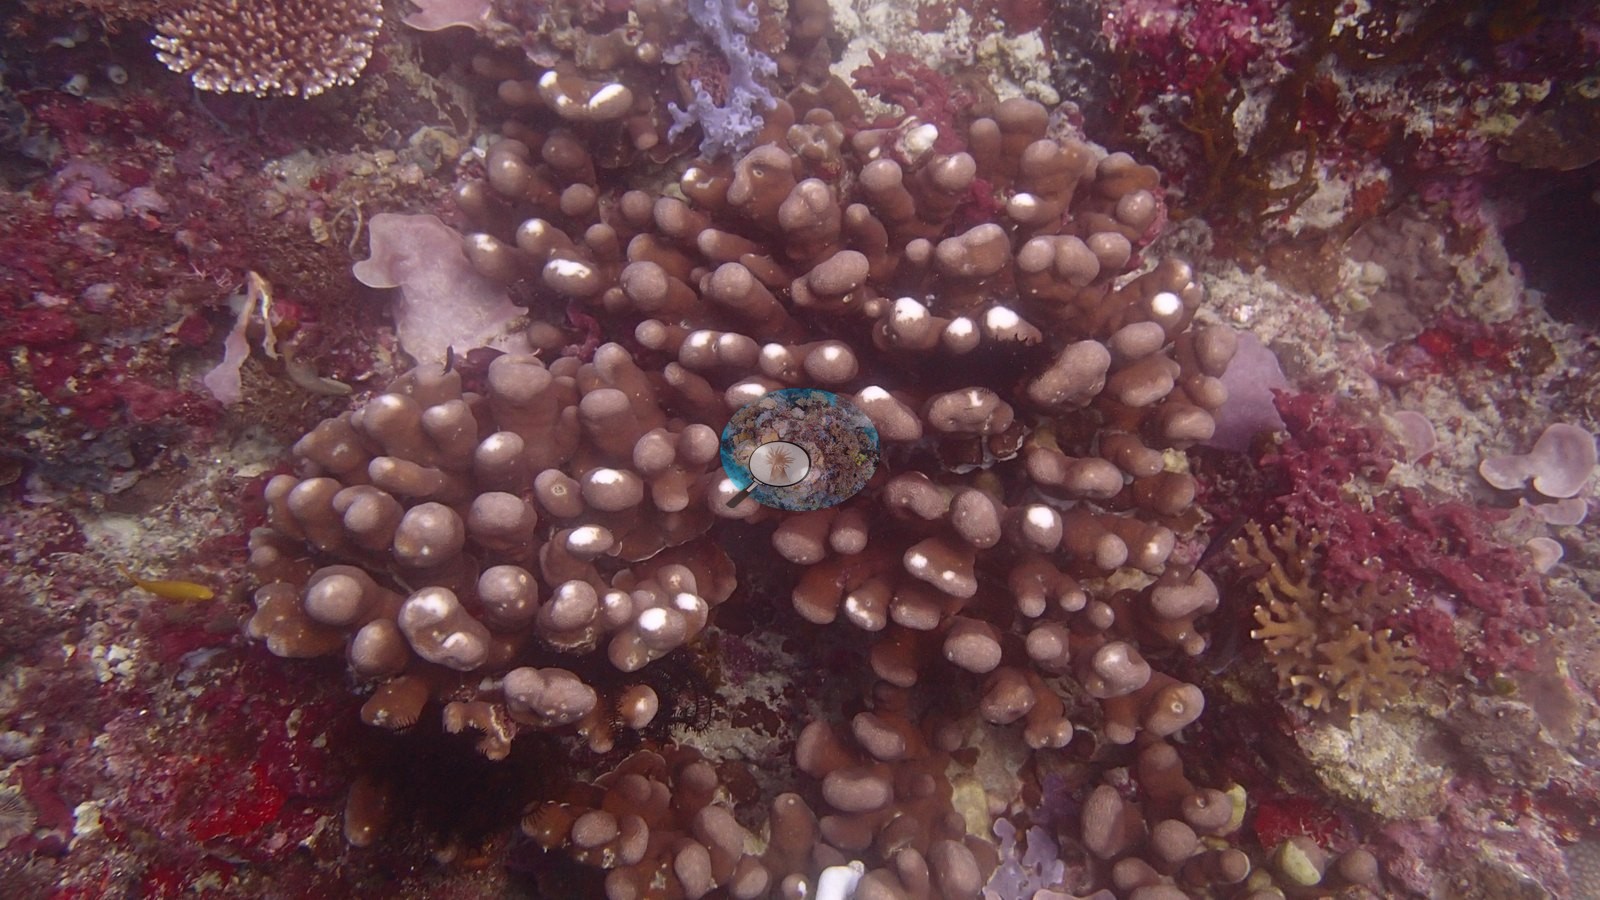
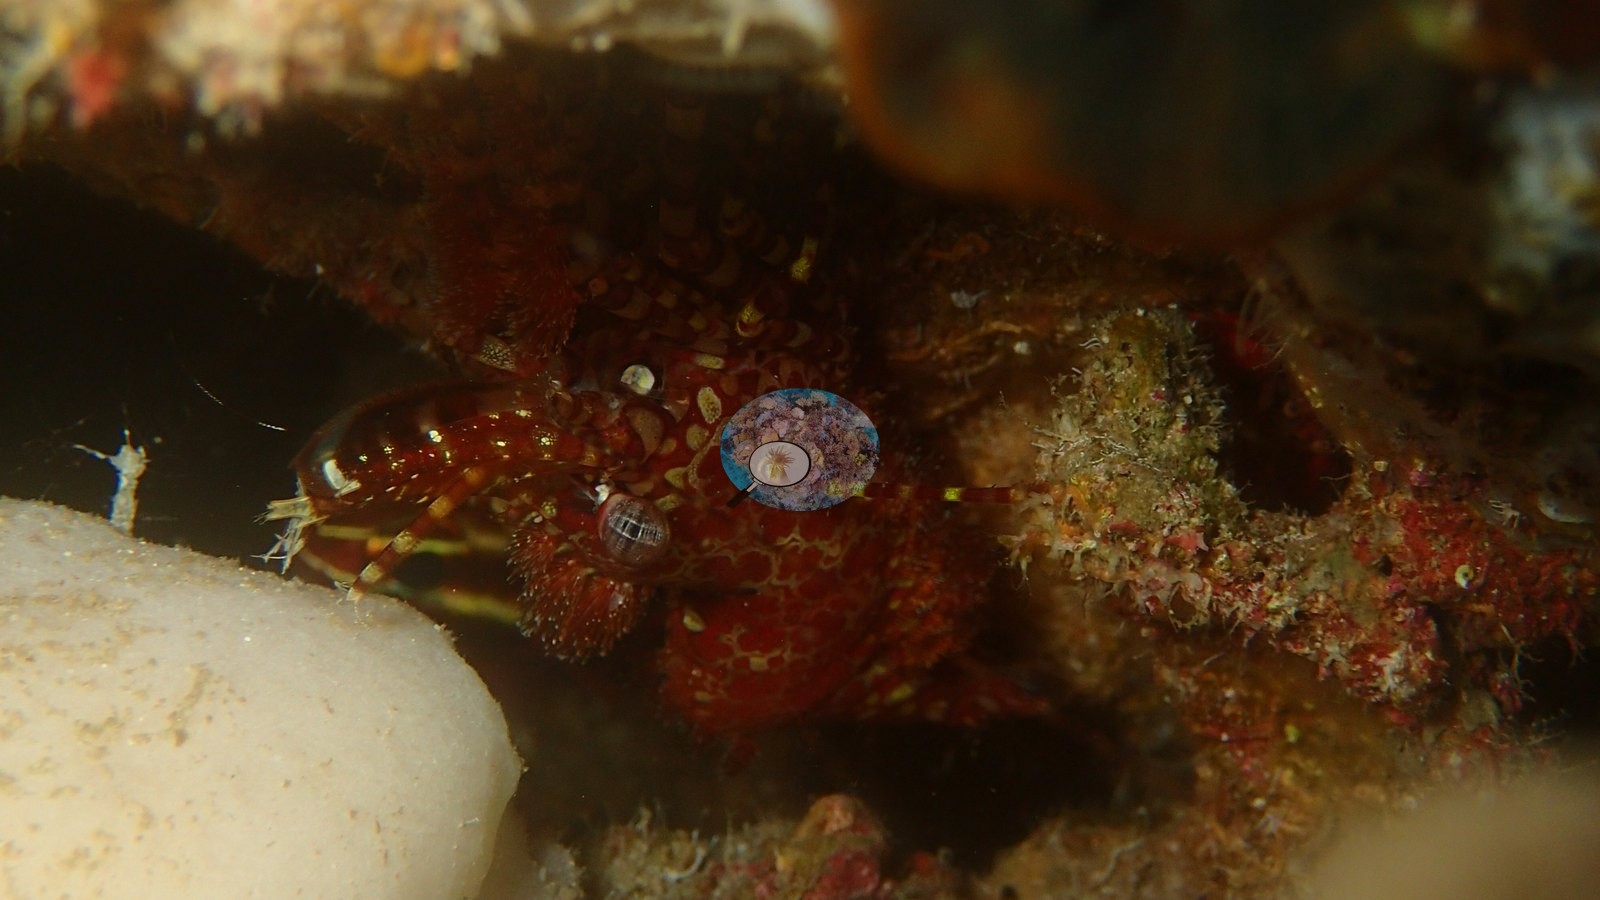
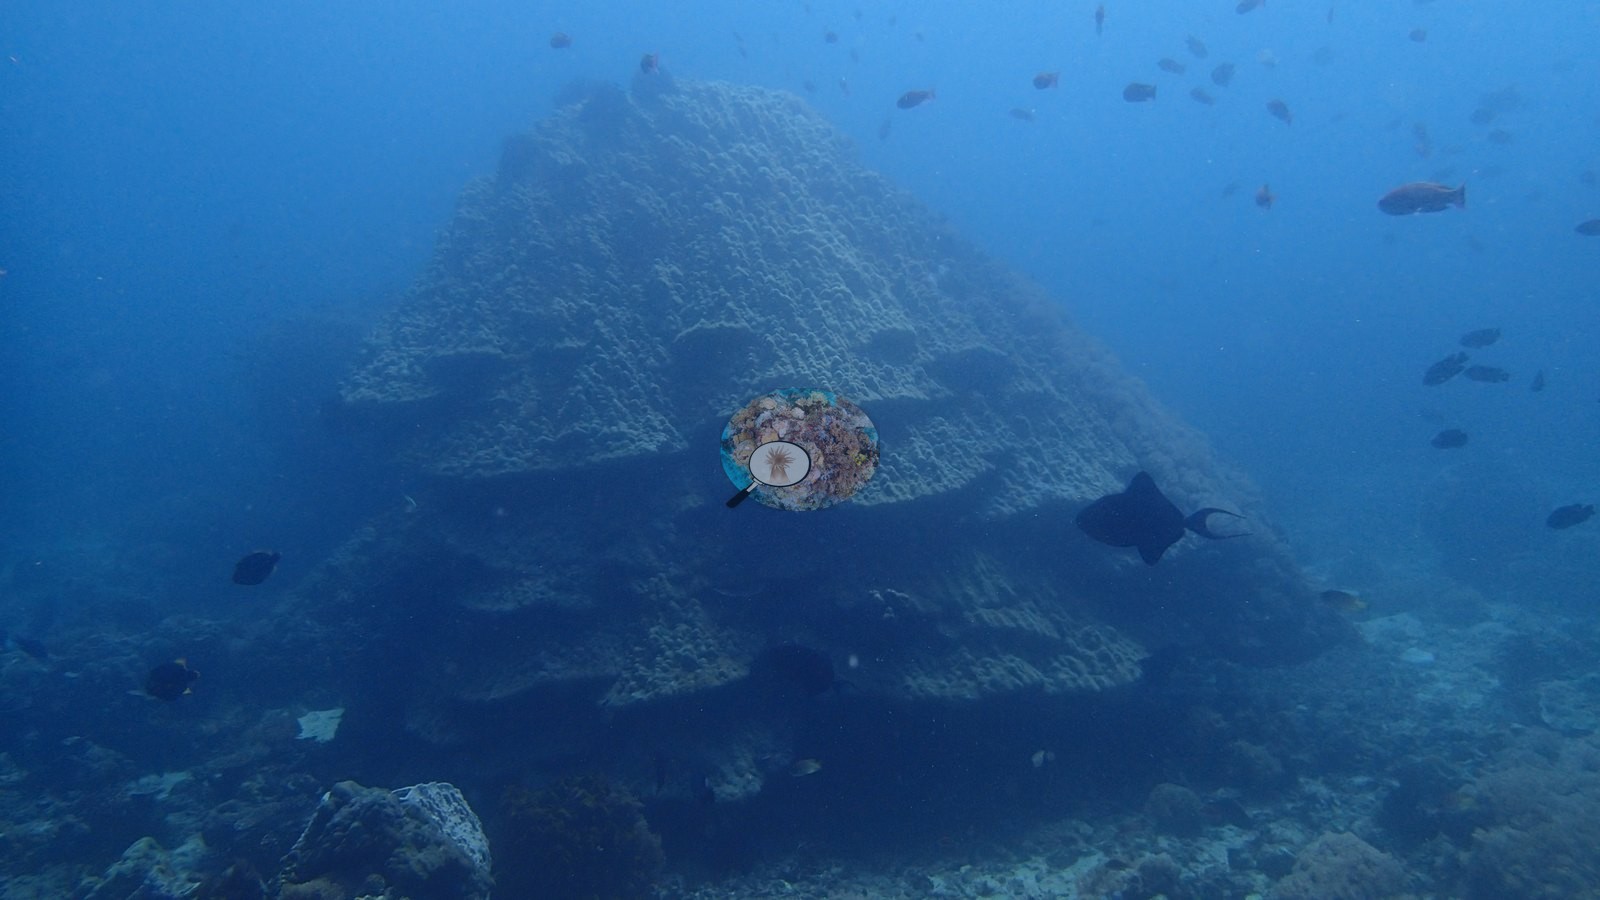
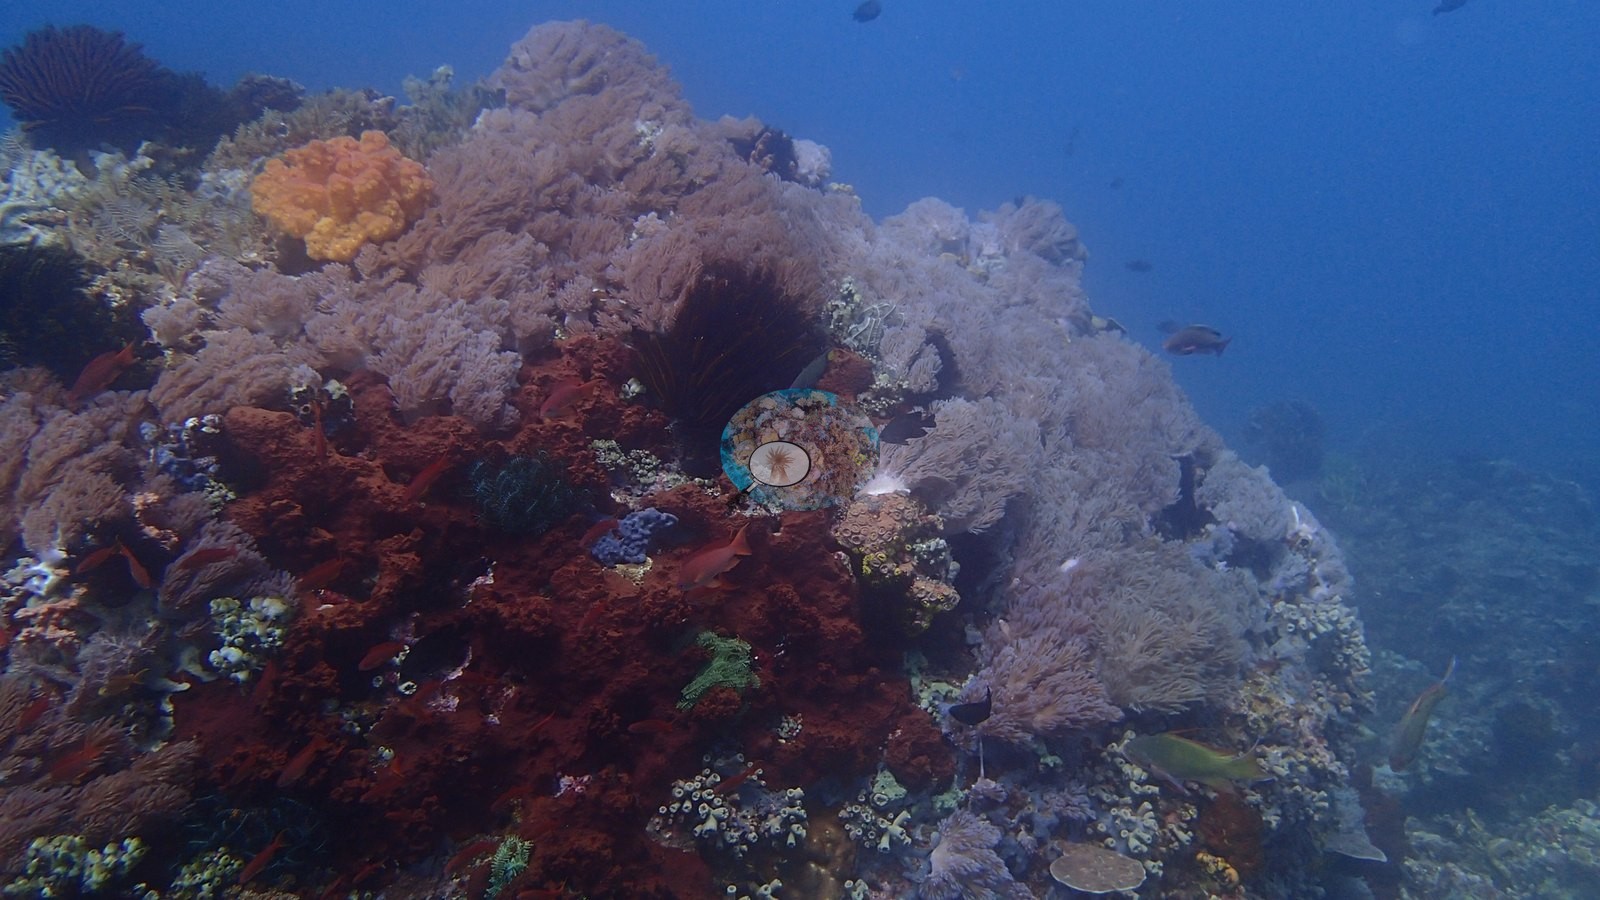
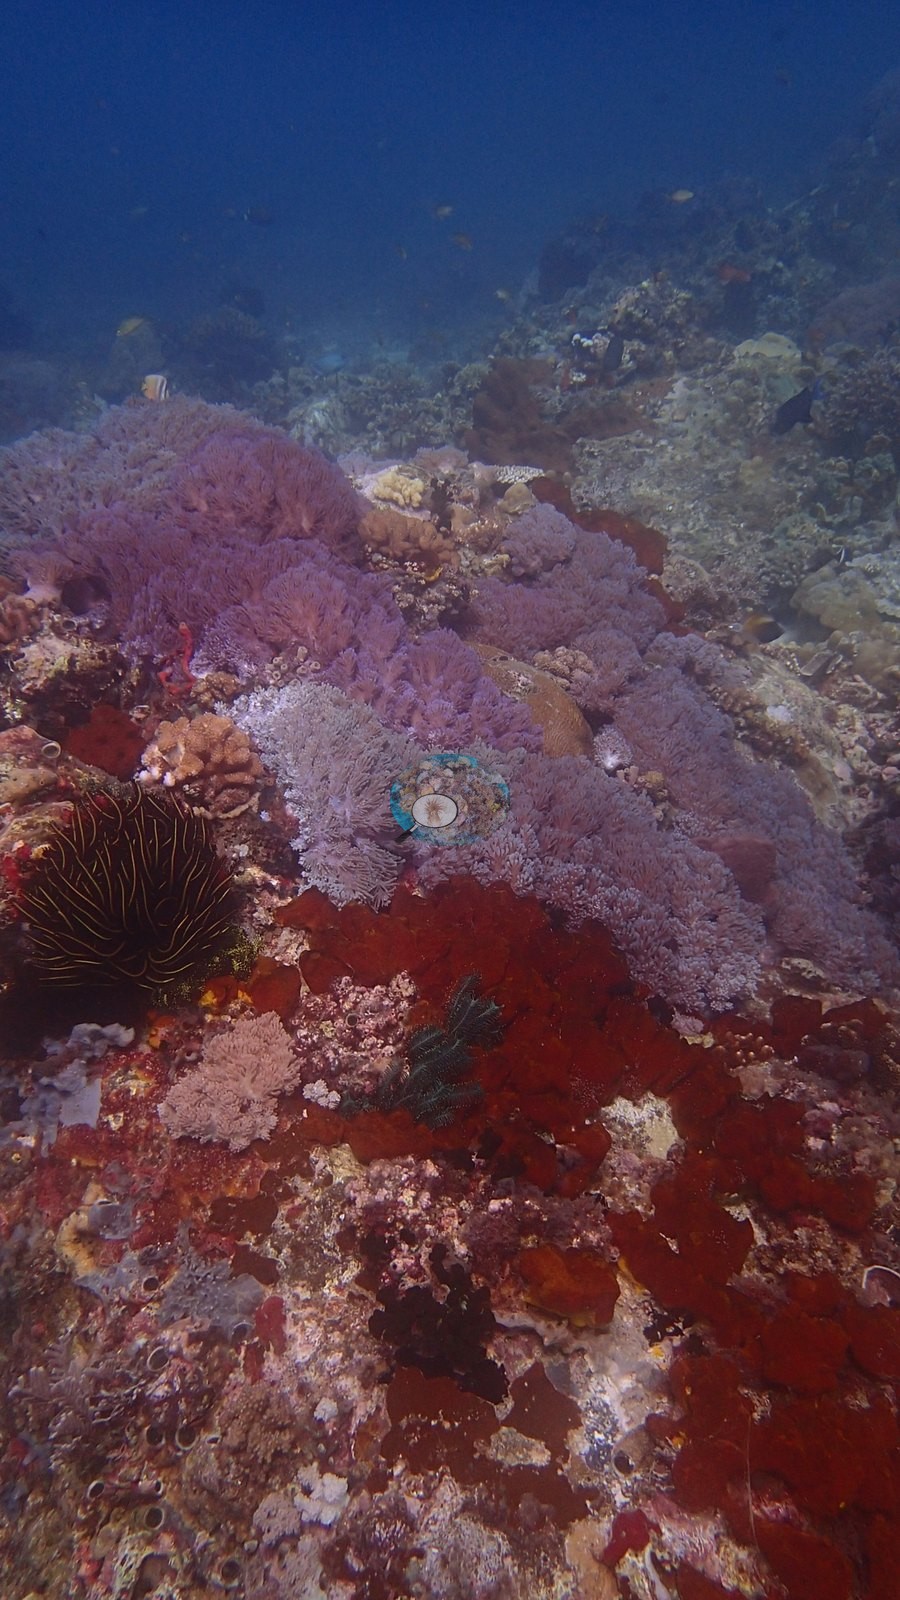
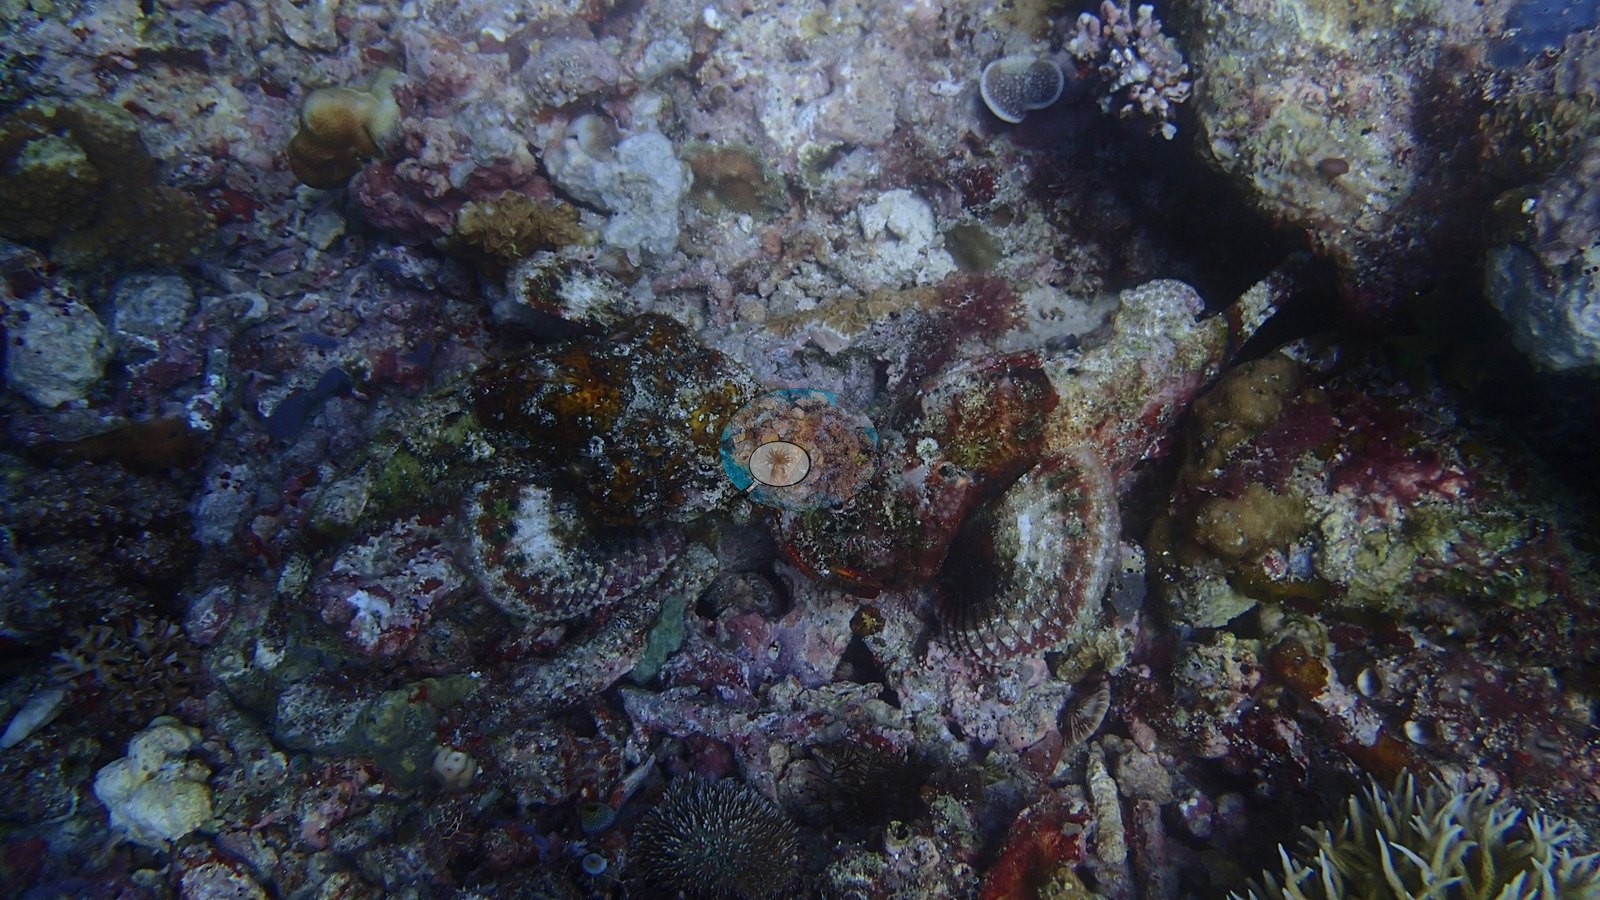
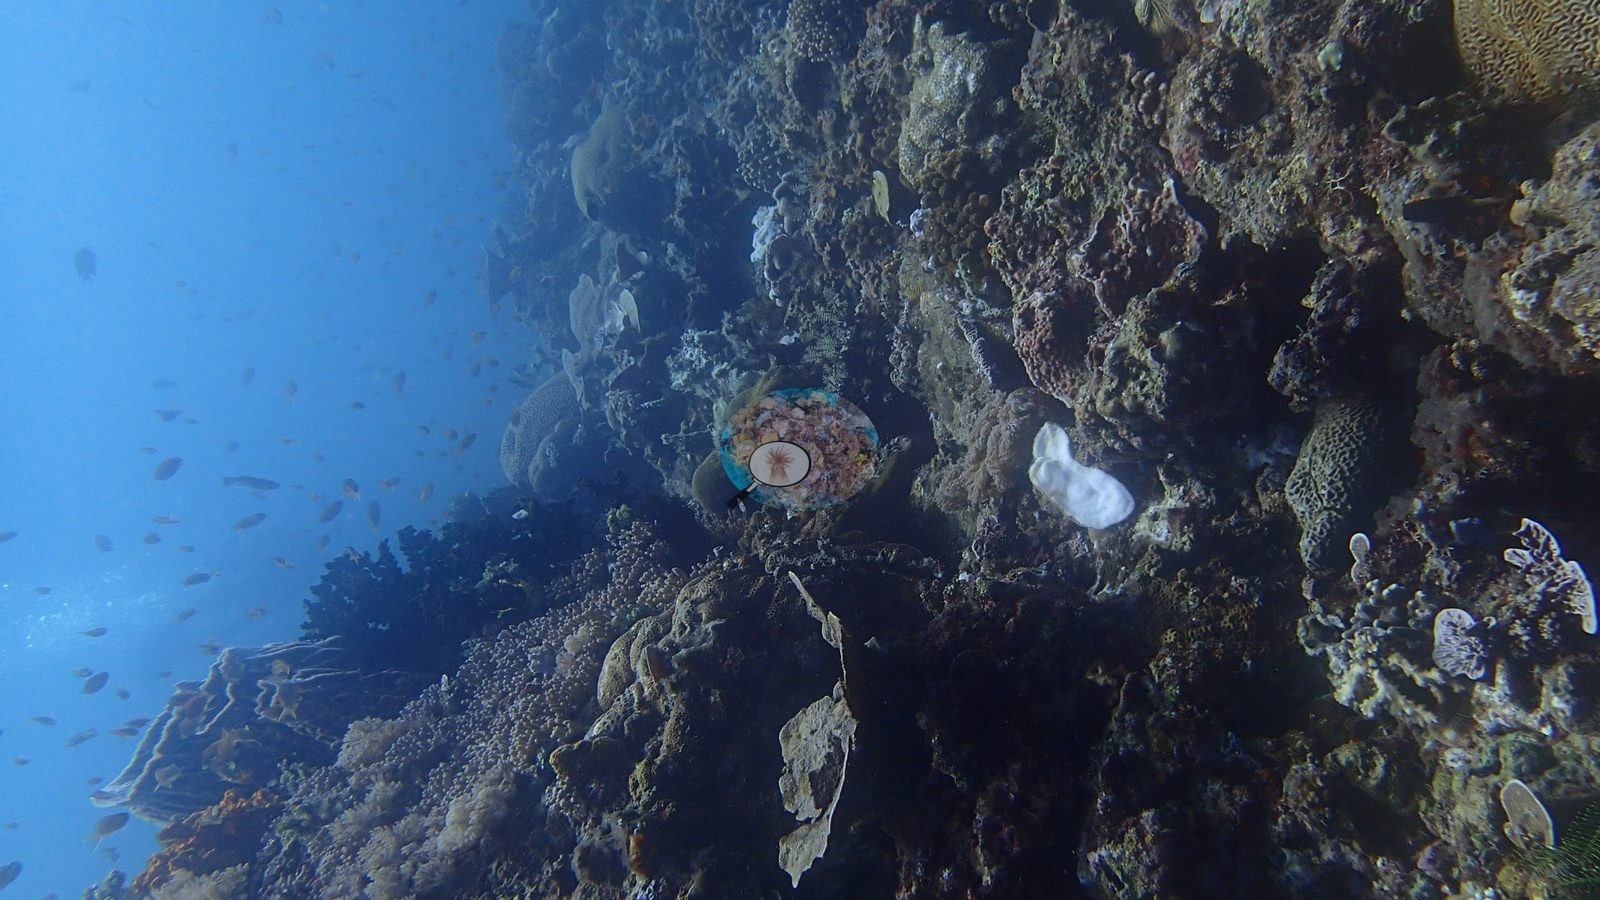
Crinoids in green, yellow, and black are abundant, and whole walls are draped in red, pink, and orange soft corals and encrusting sponges; a barrel sponge, blue and orange encrusting sponges, yellow Polycarpa-type tunicates on massive Porites, and a giant clam with a mottled white mantle round out the benthos (e.g., Image 4).
Coral cover
Cover comes from two computer vision methods, neither preferred. DINOv3 point classification gives 25.1% hard coral (95% CI 22.9-27.4) from all 52 frames and 1,040 points. CoralSCOP computer vision, its full run now finished, gives 27.2% across all 52 frames (median=25.0%, bootstrap 95% CI 23.7-30.8), against the 24.0% from the 20-frame subset the map's 24.6% was built on. The published spread is 1.2 points; the completed run widens it to 2.1 and lifts CoralSCOP to the very edge of the DINOv3 interval, so the two still agree, but only just. Unusually for this group, the agreement is earned rather than coincidental in the wide-angle frames: PA011358 scores 53.1% by CoralSCOP from 59 separate colony masks and 38.4% by DINOv3, which is what a genuinely coral-dominated frame looks like to both models. The exception is CoralSCOP's single highest image, PA011383 at 66.6% from only nine masks, a close-range crinoid and soft-coral tangle rather than a coral field, and the site's smallest frame count - 52 against 94 at Ligpo - makes its mean the least well sampled of the six scored dives. The two models fail differently. CoralSCOP computer vision reads high on low-cover reefs - a median=1.68x a co-located Reef Check diver survey, 4.6x at worst - and it masks soft coral and sponge as readily as stony coral. DINOv3 is strong in-domain (6-class macro-F1 0.62, hard coral recall 0.82) but collapses off-domain: cross-domain point accuracy 0.17-0.25, ceiling near 35-50%, and across these frames the two models correlate at only r = 0.28. Neither is a diver survey or a transect; both are provisional and a better model will supersede them. Coral cover: 26% — photo-derived, and the two methods broadly agree (25% vs 27%). Two independent computer vision passes over all 52 of Anderson's frames from this dive give a DINOv3 calibrated point classifier reading of 25.1% (95% CI 23–28%, block bootstrap) and a CoralSCOP computer vision of 27.2%, a spread of 2.1 percentage points. The map publishes their mean so sites can be ranked against one another, but the 25–27% range is the honest statement of what is known here: the two products have different denominators and should not be collapsed into one measurement. Anderson is still evaluating other computer vision models for coral-cover work and plans to regenerate this CoralSCOP and DINOv3 figure once he finds one that performs better.
Stressors
The reef reads healthy: the pale margins on the big tables are growing edge rather than bleaching, and there is no site-wide bleaching signal, only background turf and rubble.
Fish and other fauna
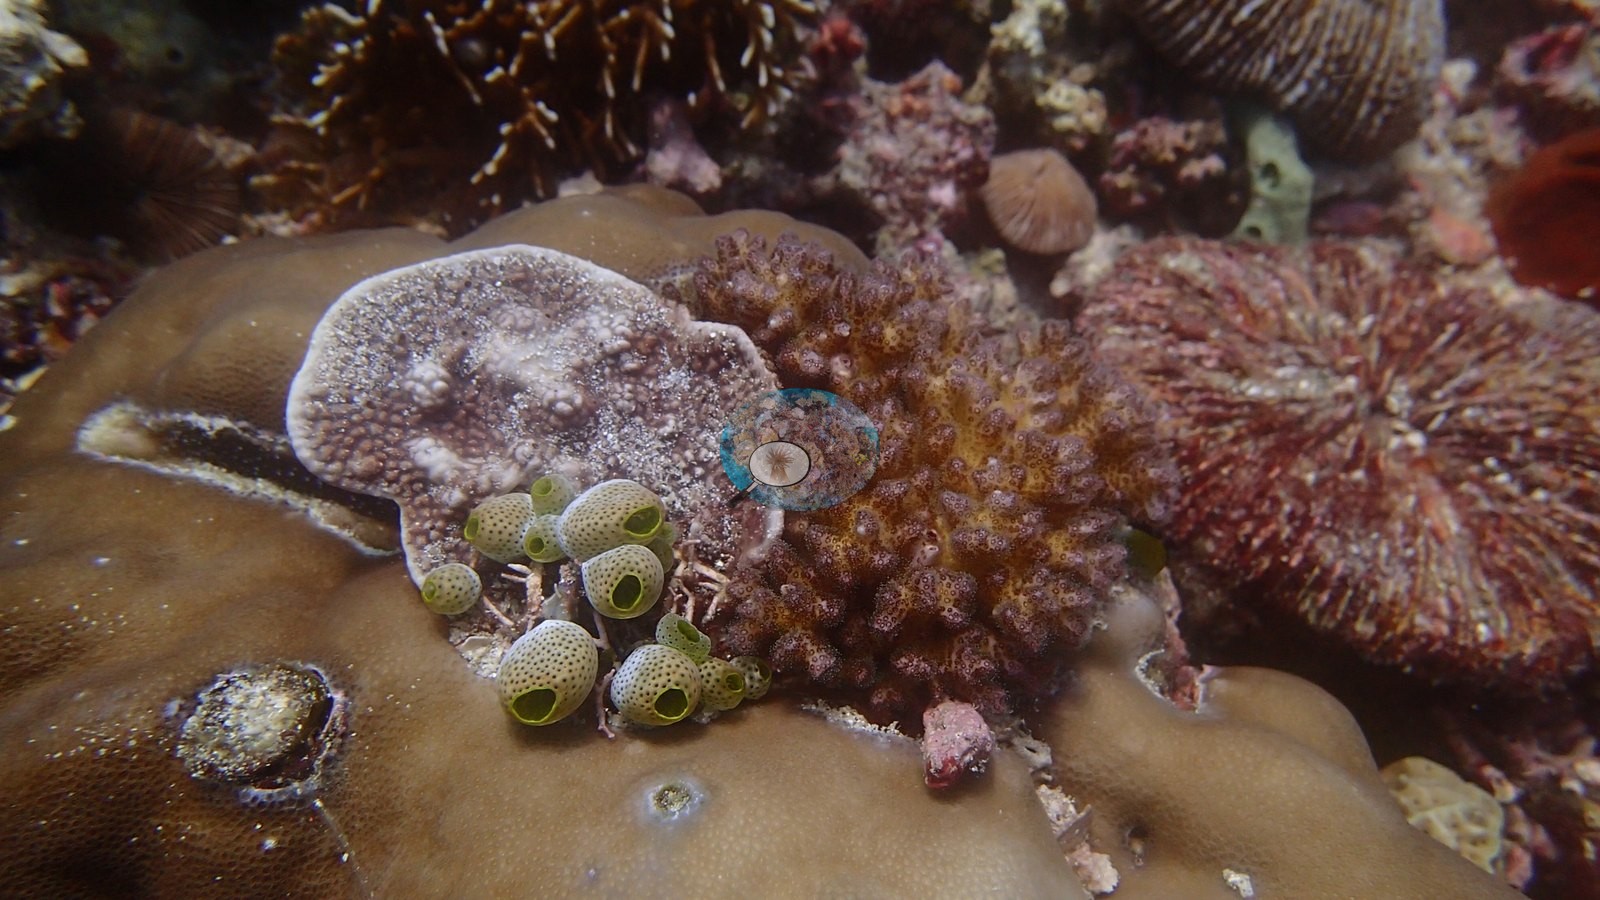
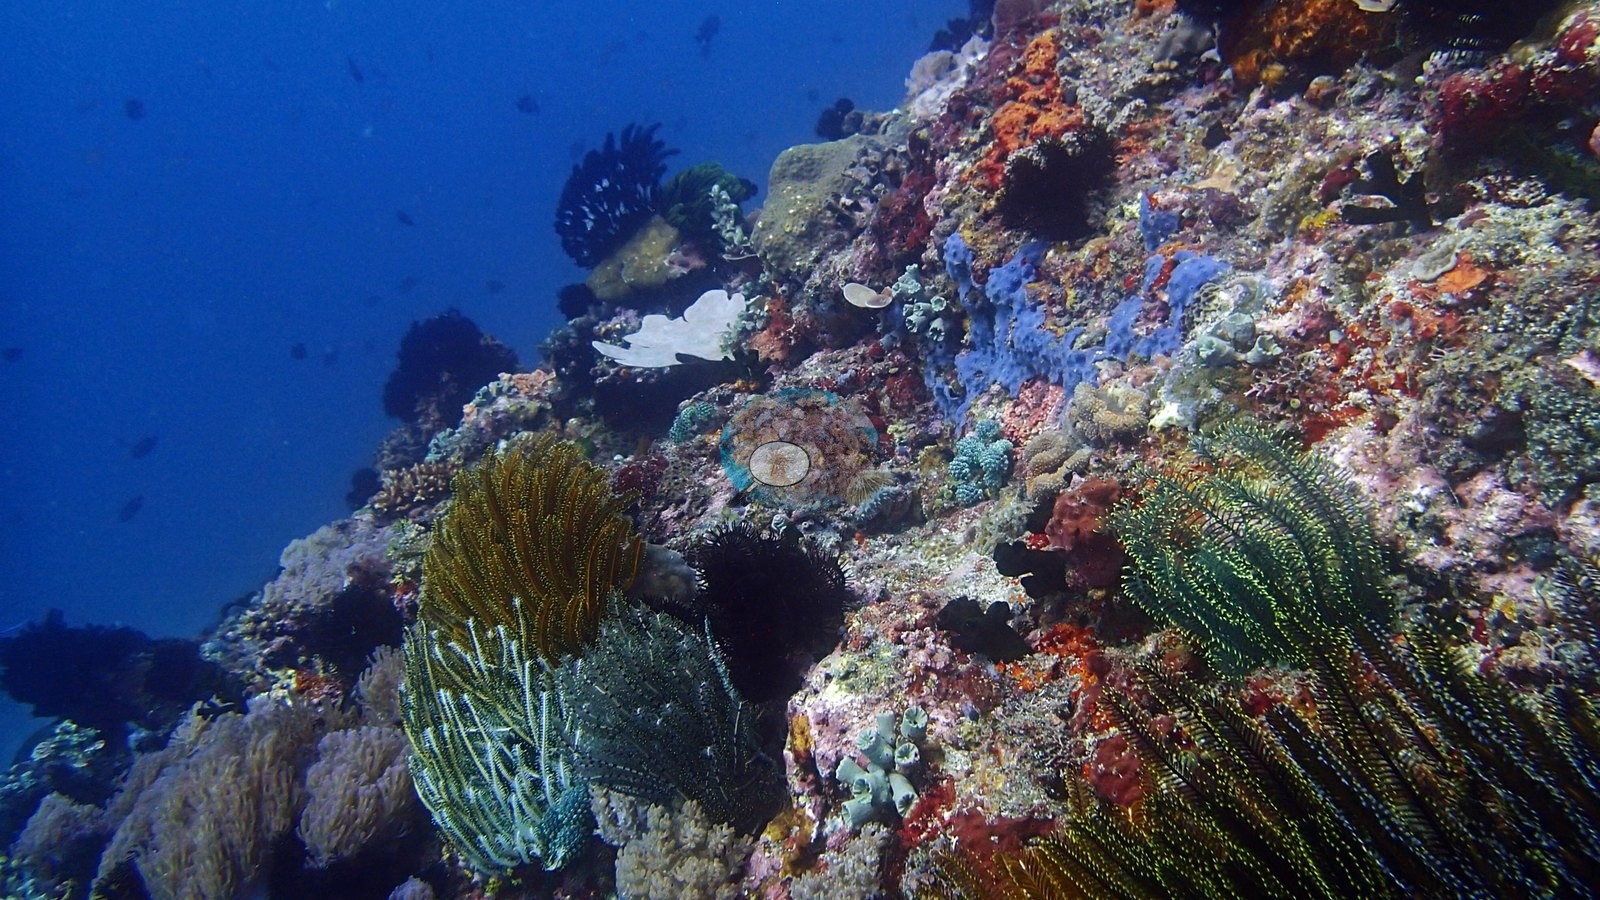
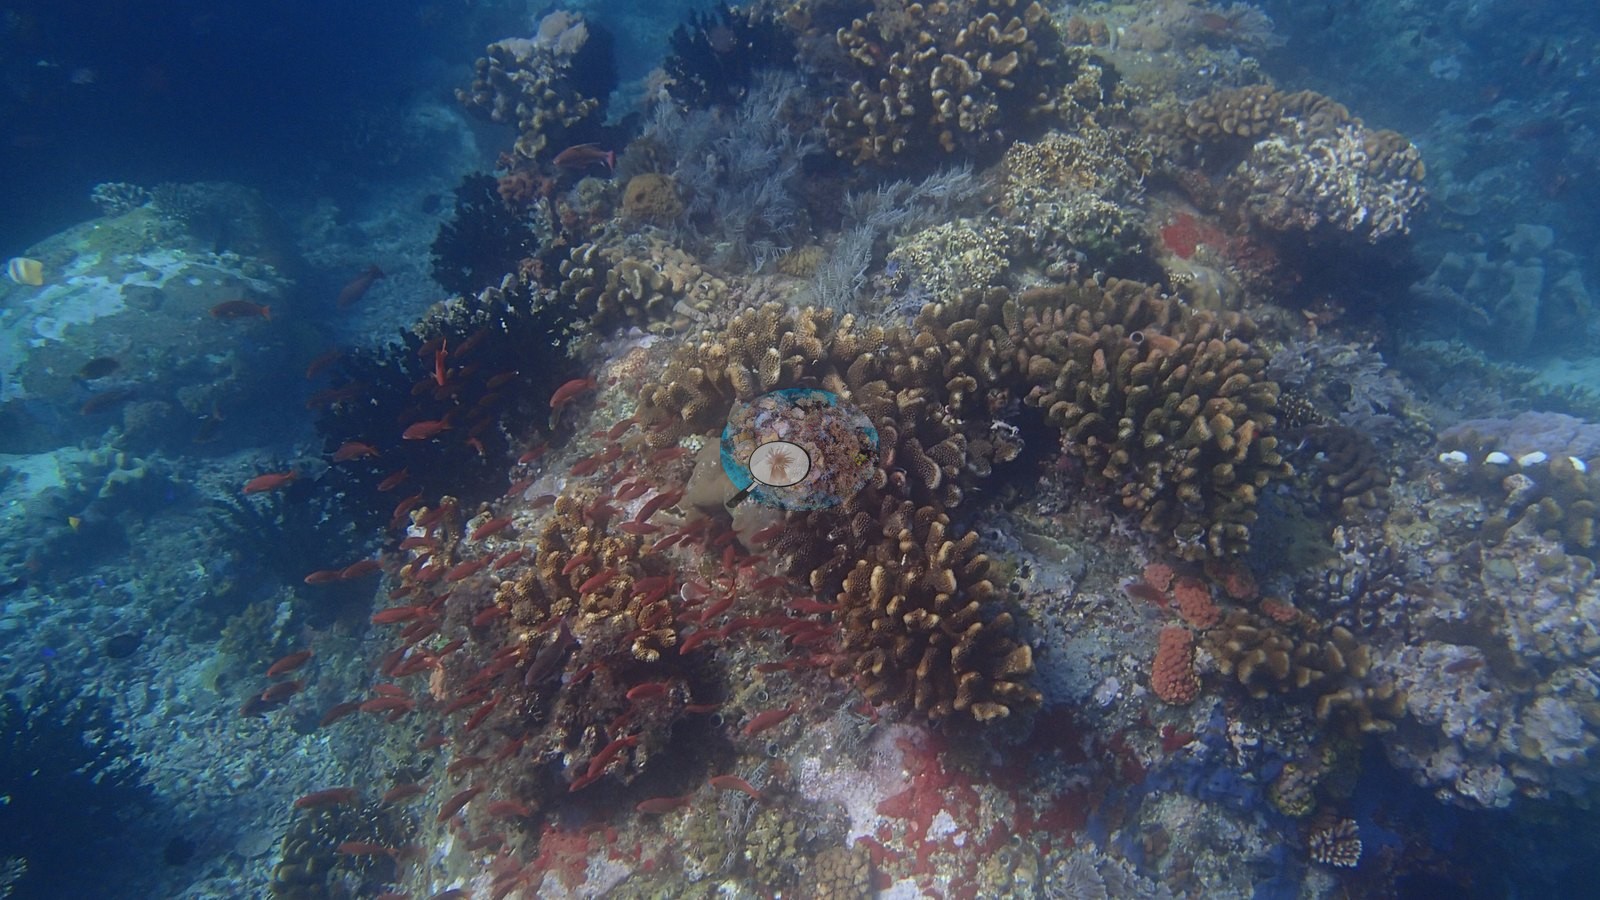
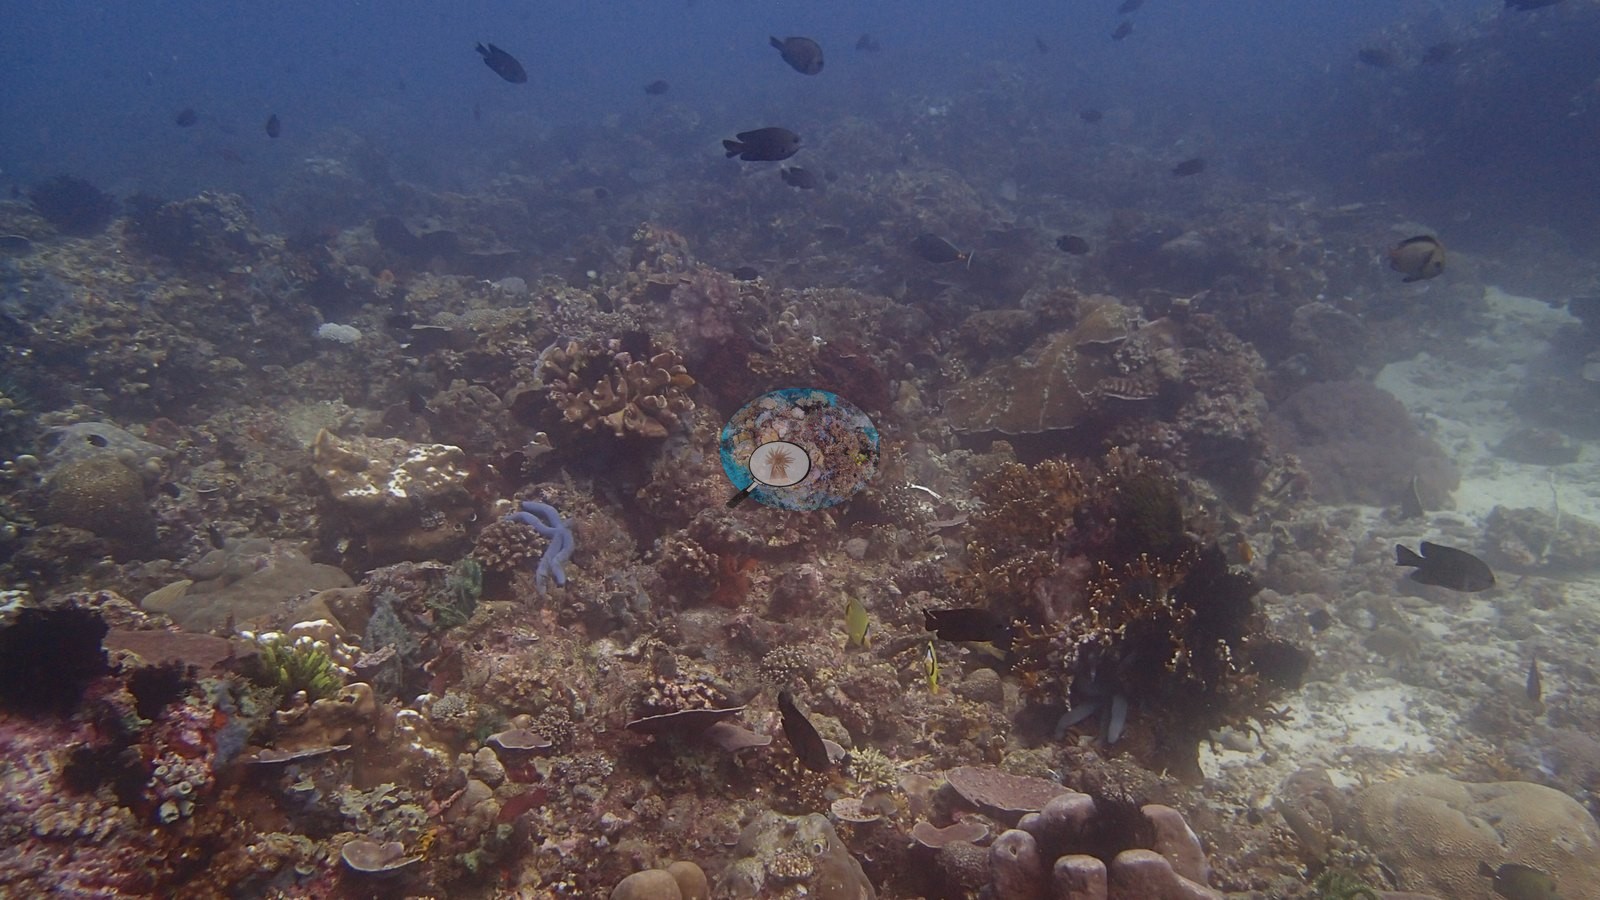
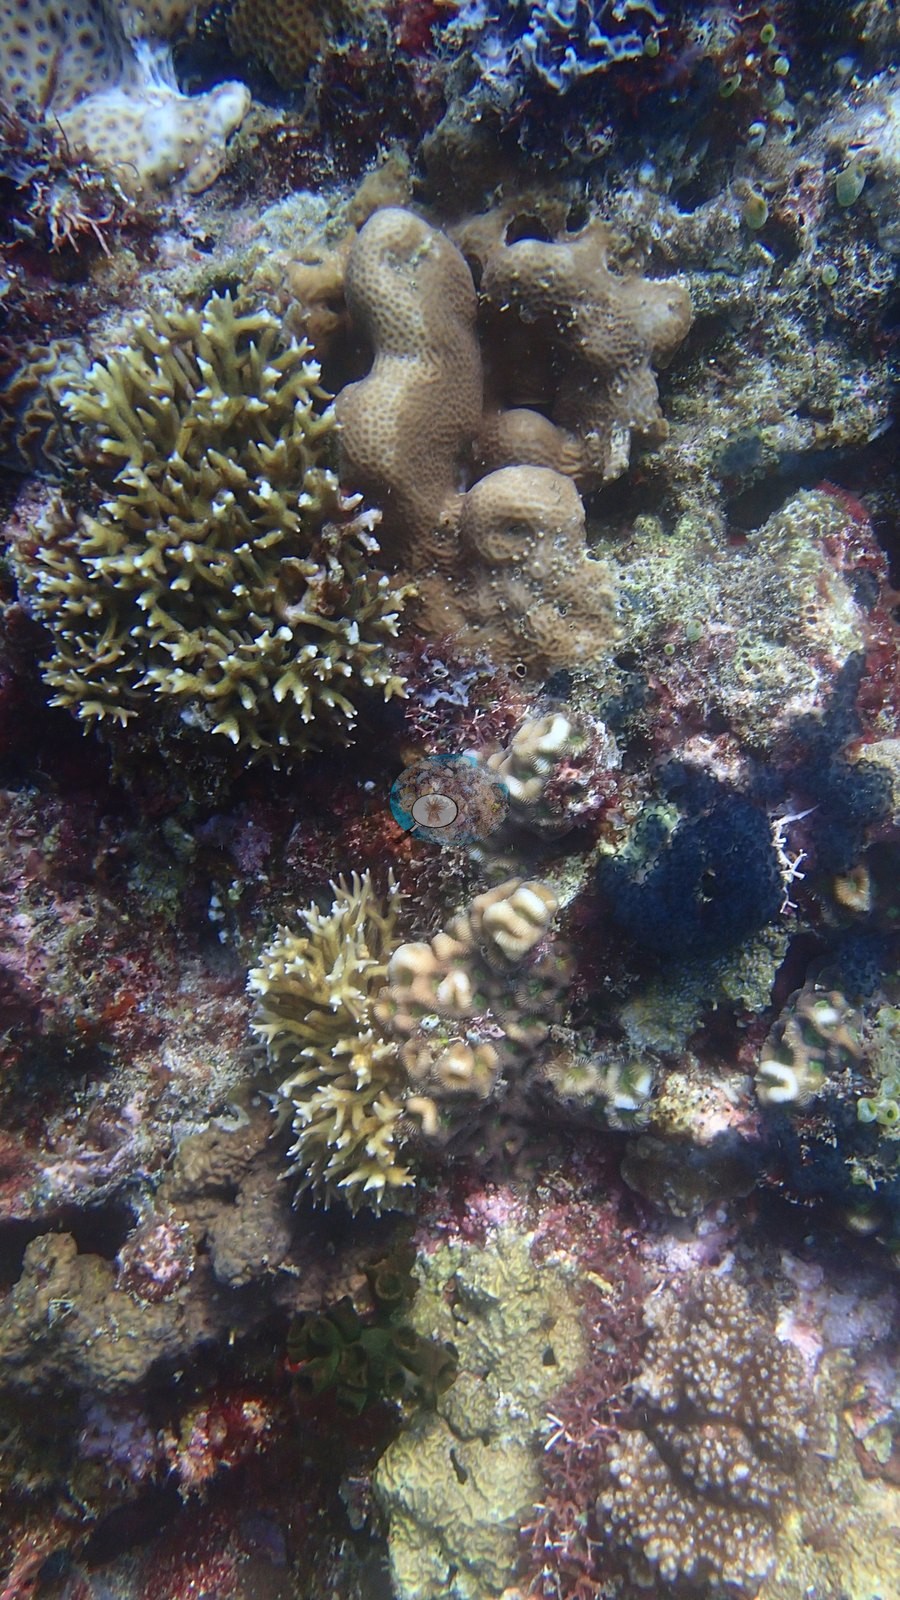
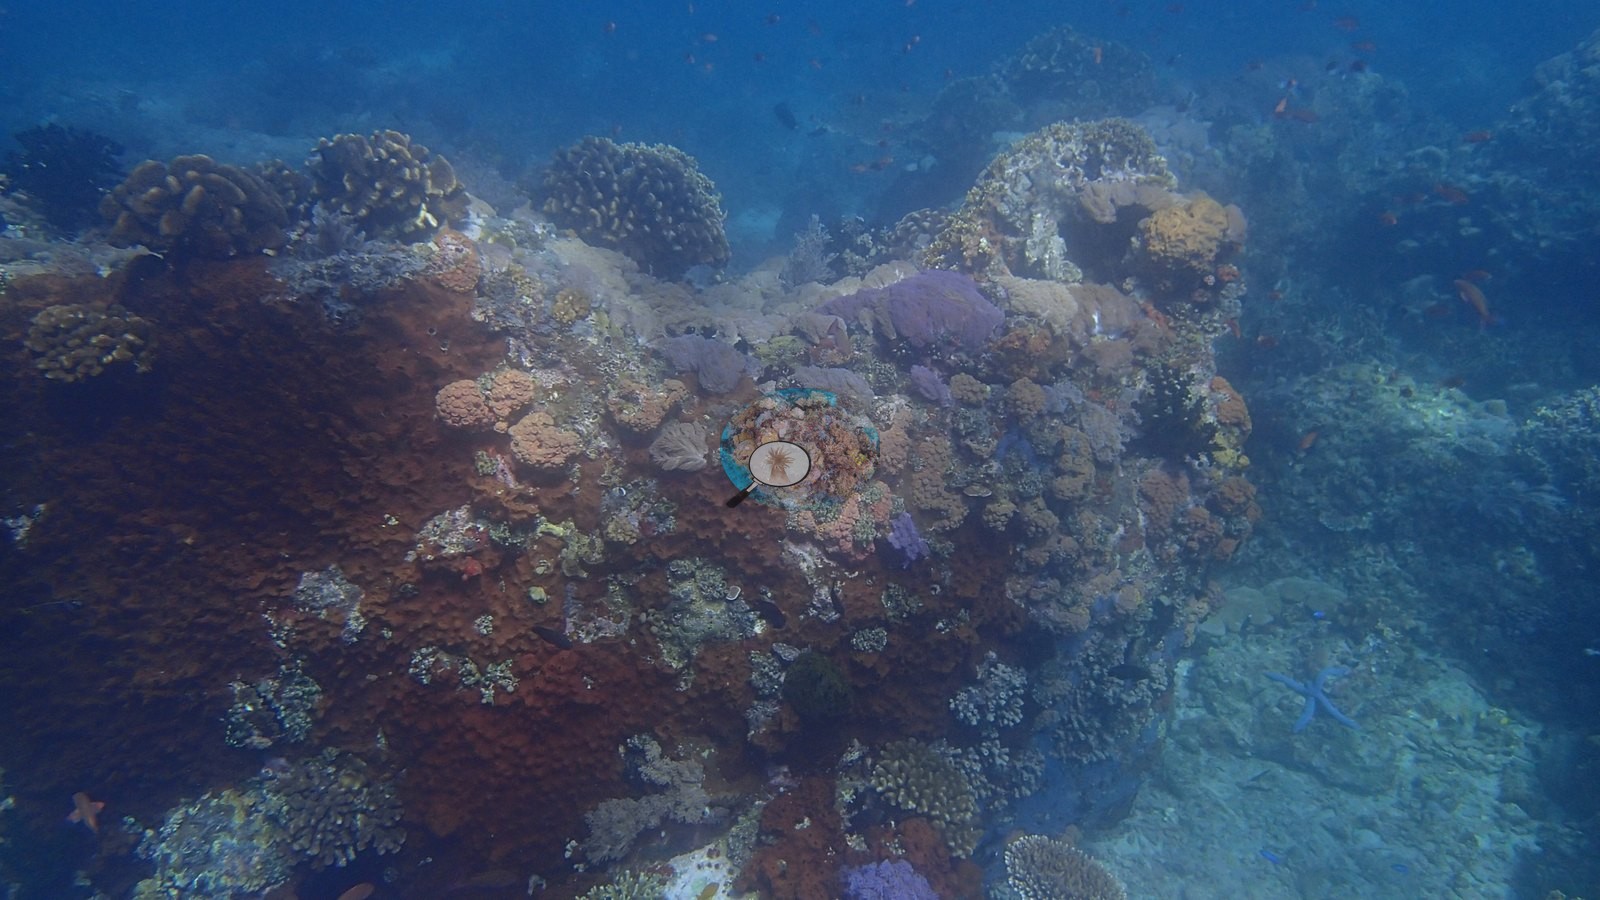
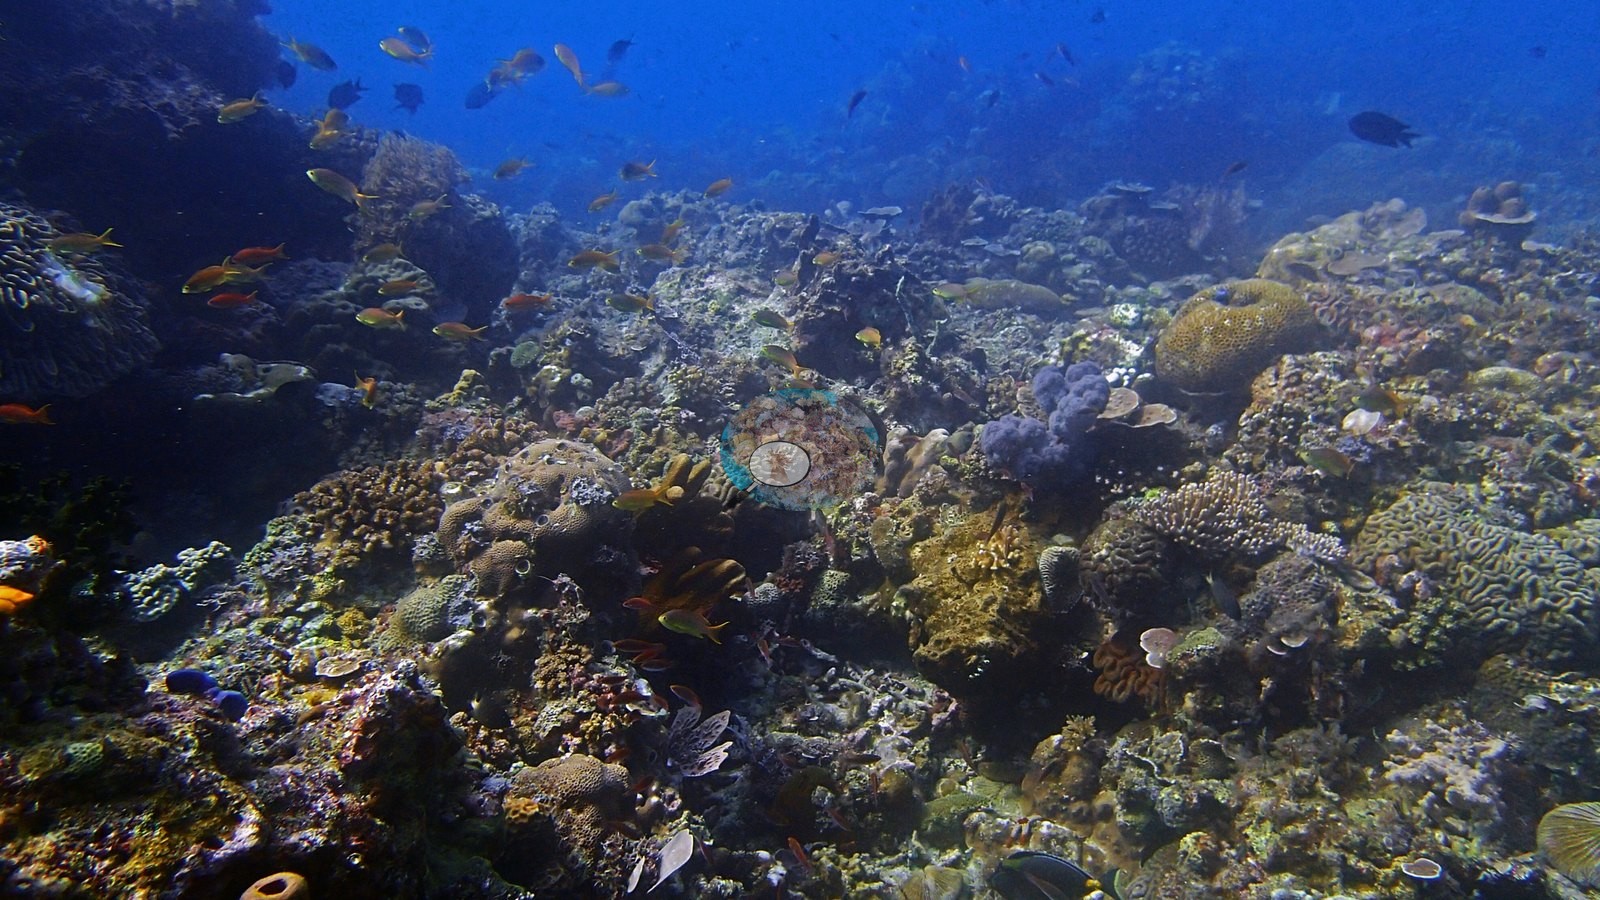
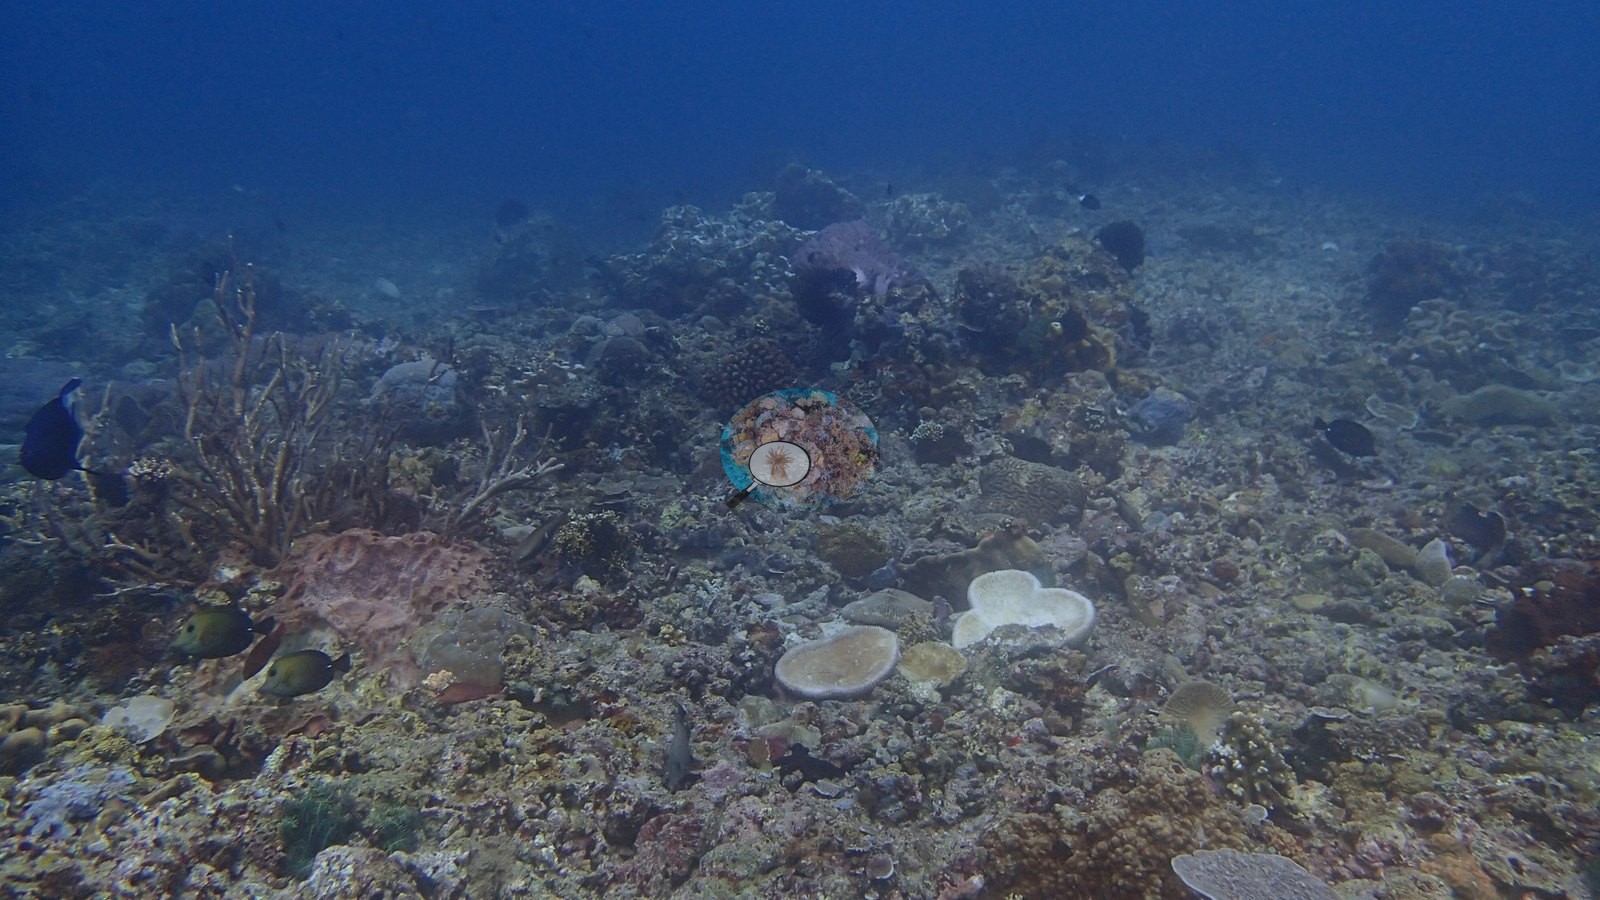
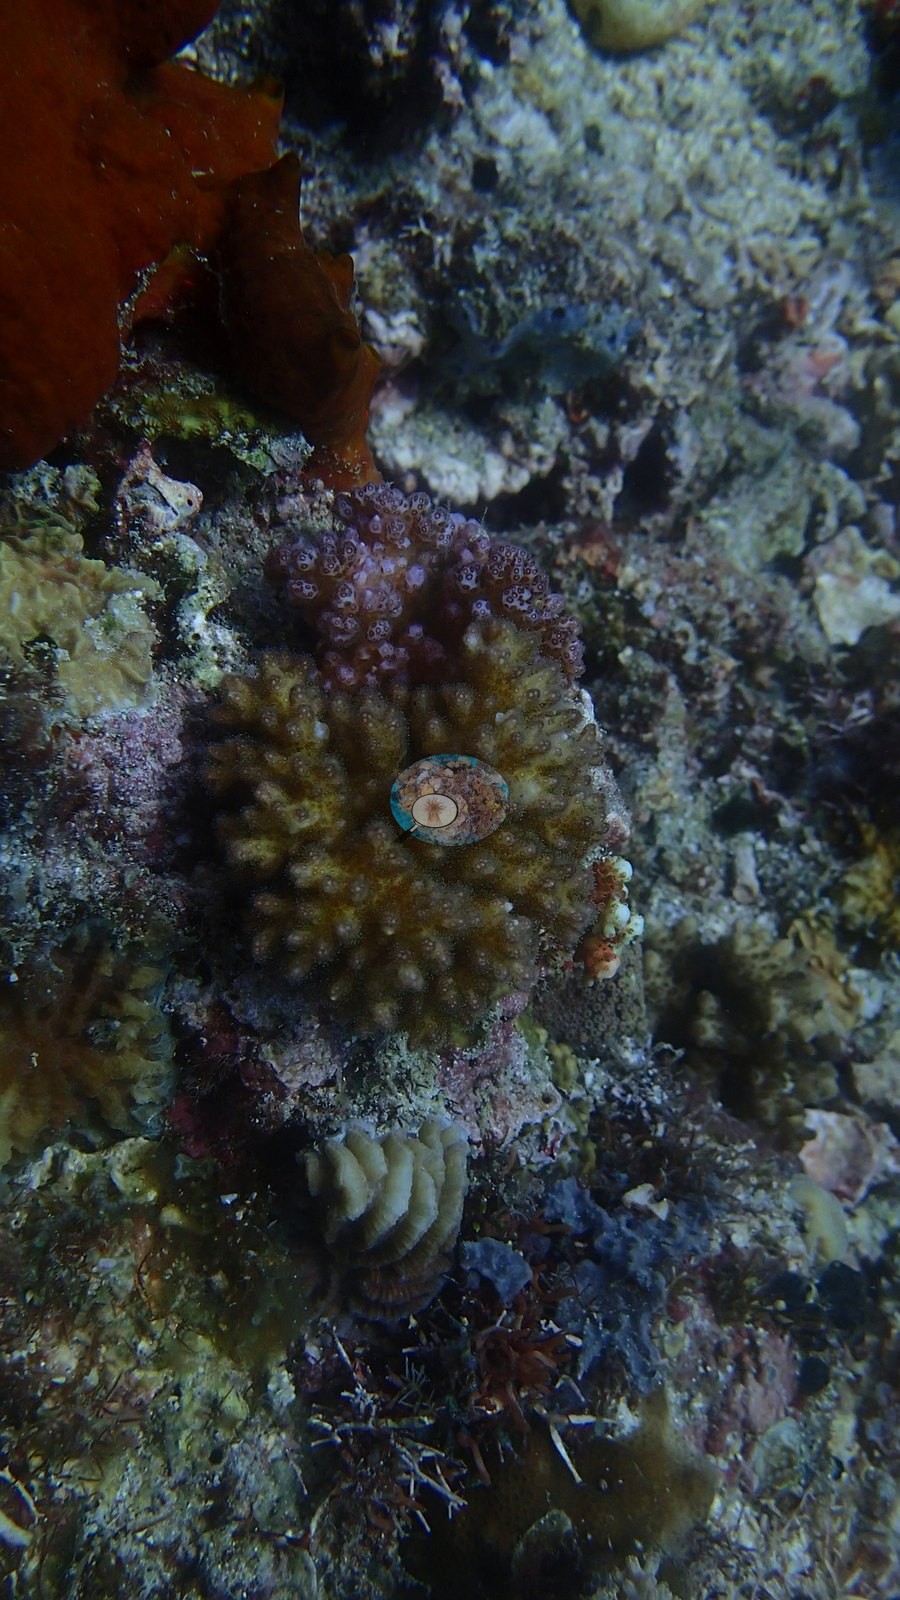
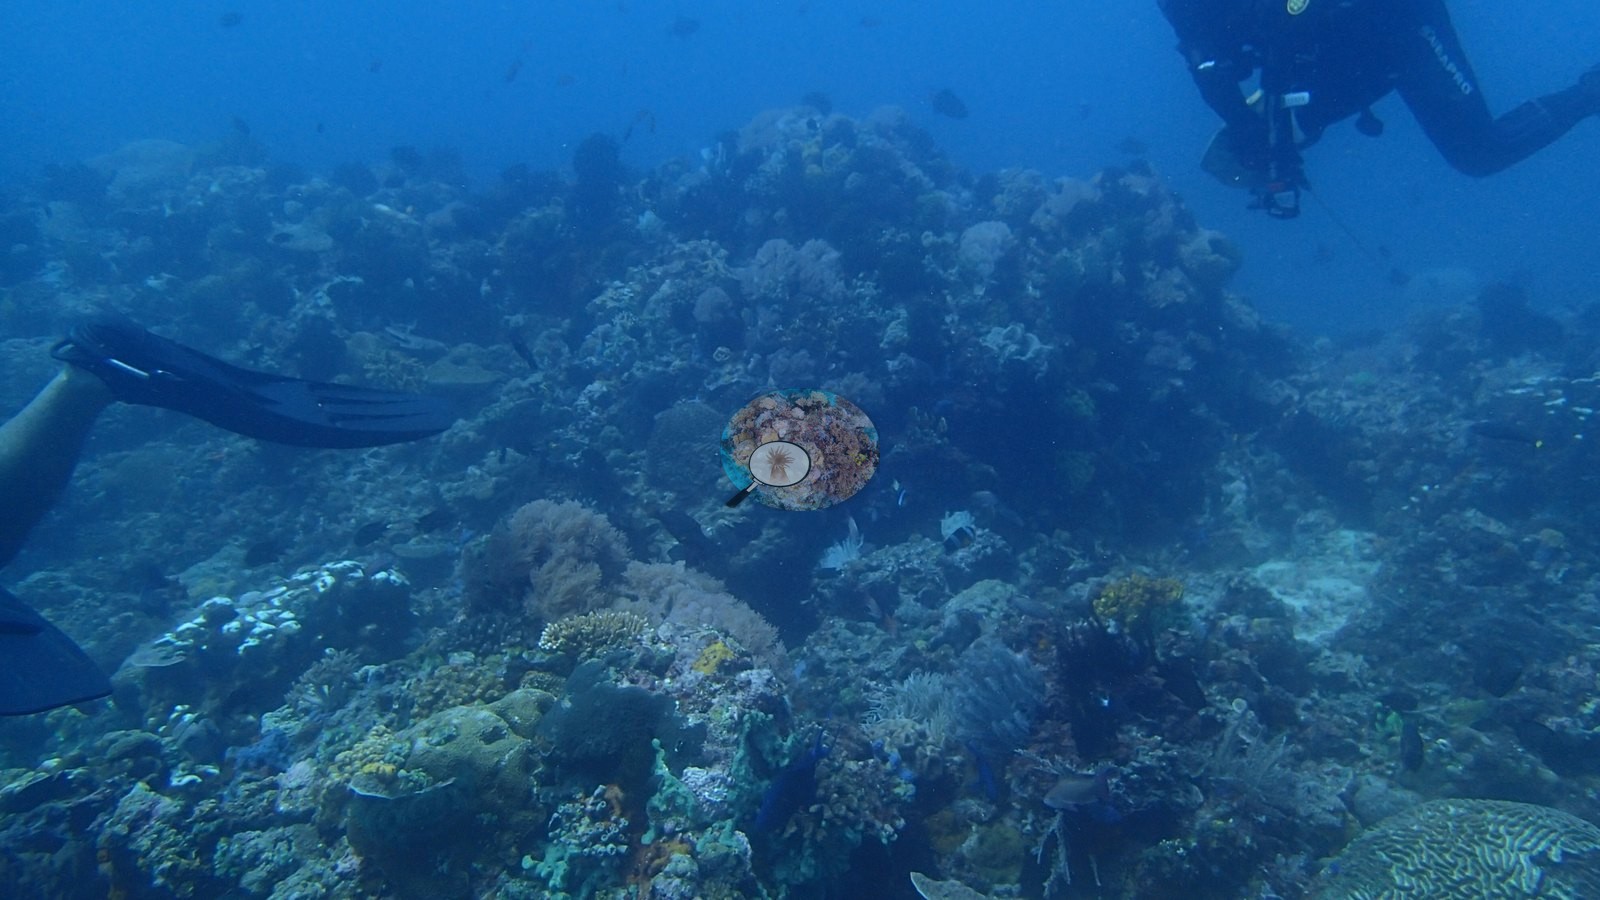
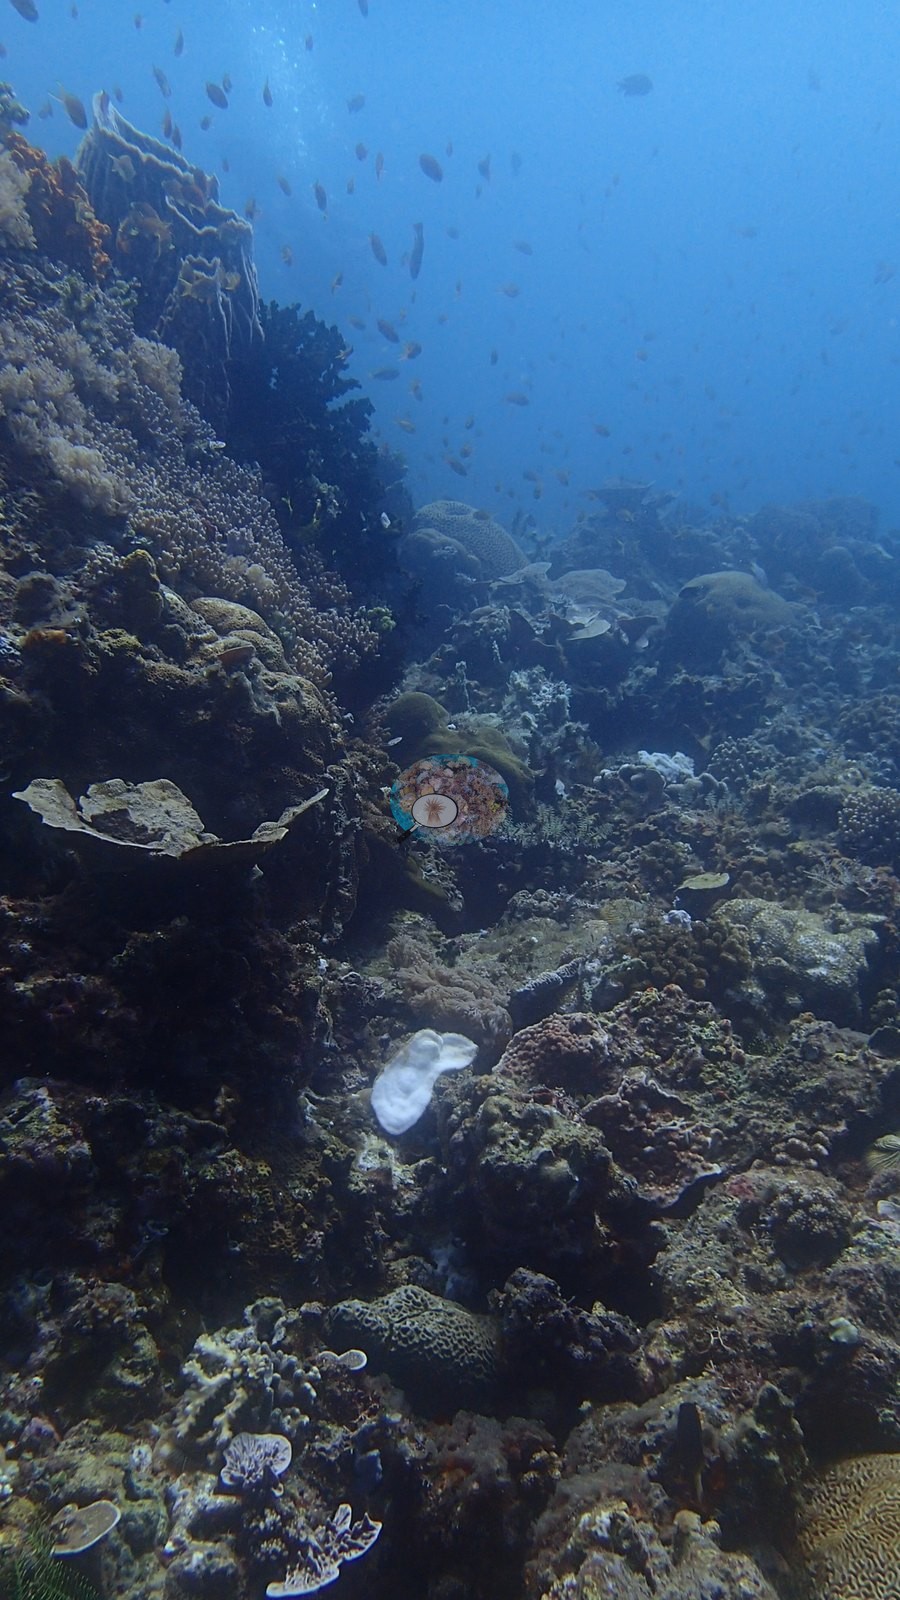
Dense silverside and glassfish shoals shelter against the framework, with anthias, damselfish, butterflyfishes, moorish idols, and a large grouper or sweetlips at an overhang (e.g., Image 3).
Comparisons with other data
No independent survey was made at this exact site; the nearest ones are listed in the table below.
Dive record
The final dive of the 2016 Philippines trip, on 1 October, and the best-developed reef of the seven Anilao and Verde Island Passage sites; all 52 available frames were reviewed.
CV model comparison
More info
As of September 2026 no computer-vision method estimates coral cover accurately on new images, so treat this as indicative rather than a measurement; it is revised as the methods improve.More info
The published figure is the mean of the two methods.| Method | Hard-coral cover (%) |
|---|---|
| In-house DINOv3 | 25.1 |
| CoralSCOP | 27.2 |
| Mean (± SD) | 26.1 ± 1.5 |
| Range | 25.1–27.2 |
Mean ± SD and range are across the computer-vision methods shown.
Independent surveys nearby
 Dr. Coral (CRD)
Within 5 km, 3 independent survey stations recorded hard coral cover in 4 surveys between 2010 and 2014. The most recent nearby survey is from 2014, so these values predate recent heat stress. This site's own estimate (26%) sits 10.1 points below the range of these surveys (36–70%); the methods differ, so the comparison is context, not a like-for-like test.
Collected by other programs using different methods (Reef Check uses point-intercept transects), so these are context for the figures above, not a like-for-like comparison. Where a station was surveyed more than once the range is shown. Station names are not dive-site names.
| Agency | Site / location | Date | Hard coral cover (%) | Distance | Link |
|---|---|---|---|---|---|
| Reef Check | Bagalangit Koala | 2010 | 70% | 4.91 km | — |
| Reef Check | Arthur's Rock | 2013 | 36% (2 surveys) | 4.99 km | — |
| Reef Check | Inner Layag Layag Reef | 2014 | 64% | 1.72 km | — |
Data & links
All images from Coral Reef Diagnostics. Data are from Coral Reef Diagnostics and the organizations named in the data-sources table above.
© Coral Reef Diagnostics.