
Philippines - El Nido: Abdens (Bacuit Archipelago)

Part of the regional summaries: Philippines - Palawan and Philippines
More info
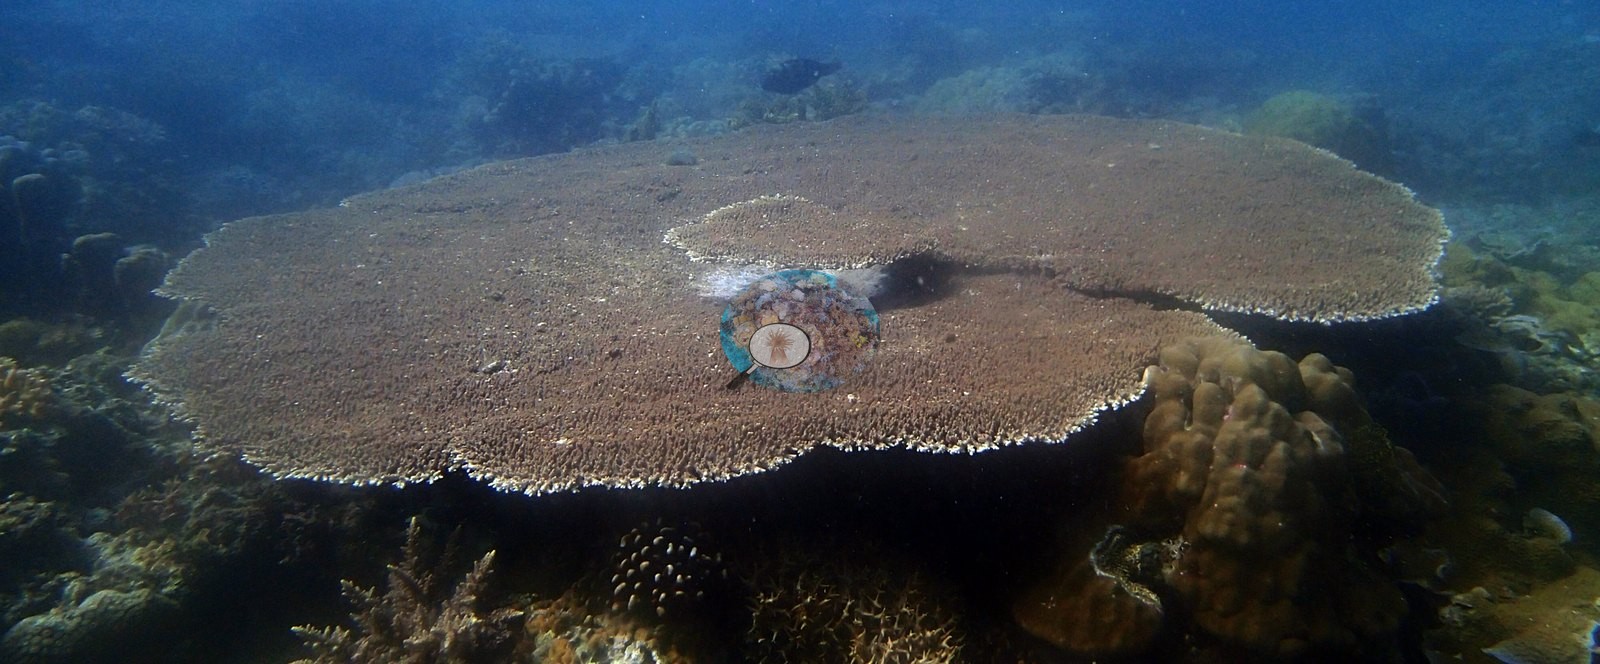
Western Philippines (NOAA CRW virtual station) · Palawan/North Borneo ecoregion mean=4.0°C-heating weeksAbdens is Acropora country, with broad continuous fields of tabular plates culminating in one magnificent table several meters across, plus dense branching thickets, Porites domes, and brain corals. The reef reads healthy, with pale margins reflecting growth rather than bleaching. Cover estimate is roughly 12-23%, averaging 18%.
One independent survey station shown with the program’s logo — click one to see how far it is from this site.
Site description
Setting
The topside frame shows the Bacuit karst rising straight out of the sea behind the boat.
General benthic features
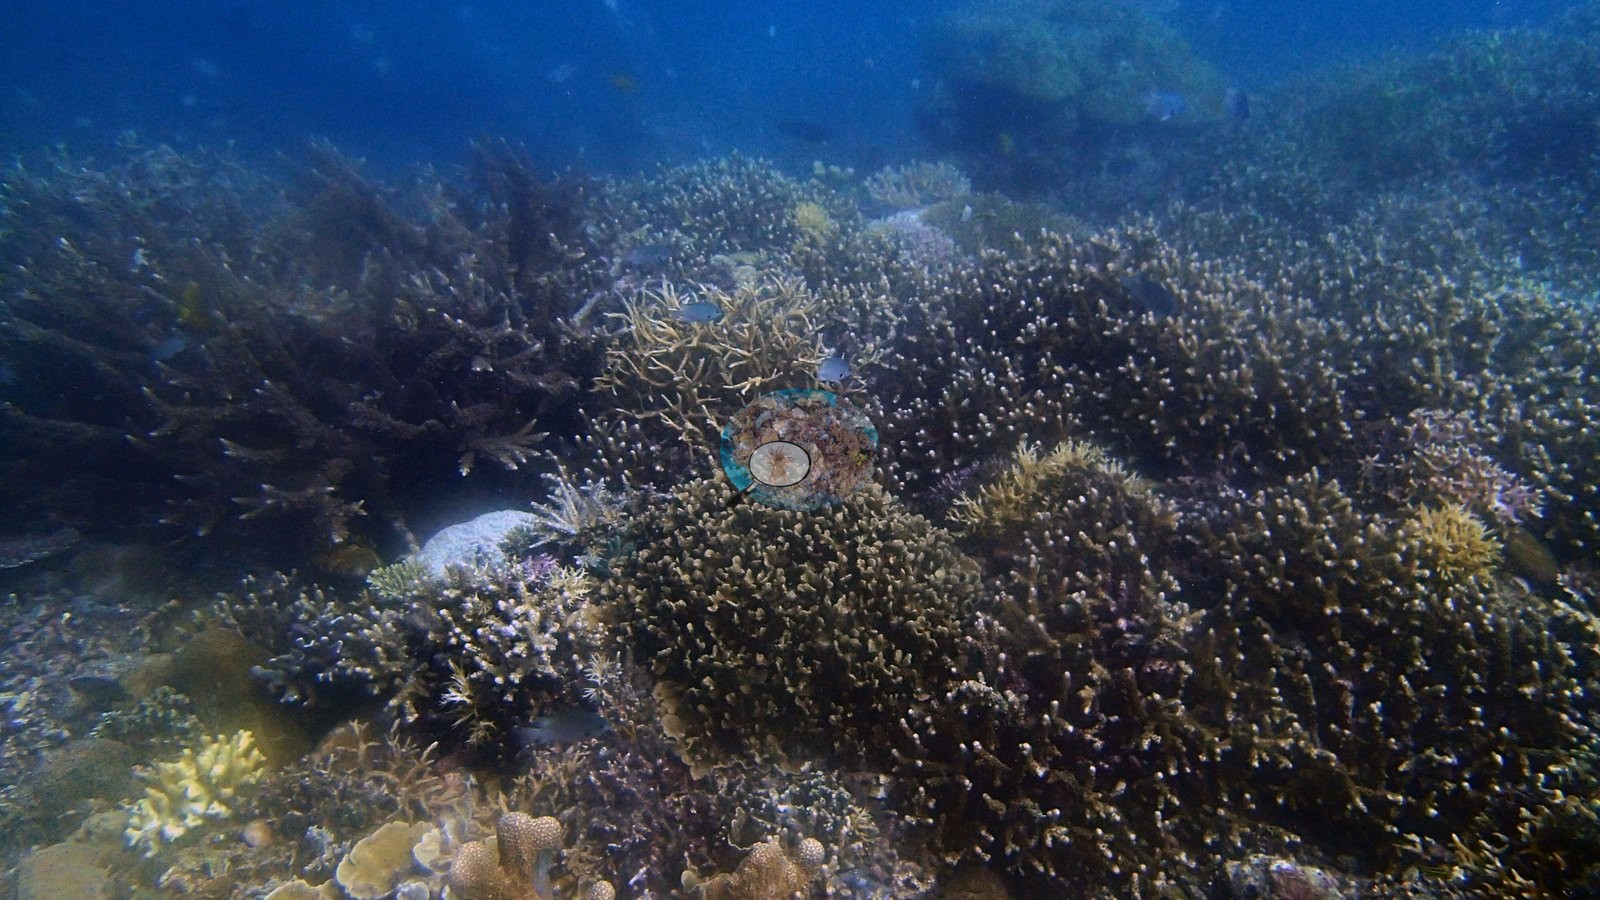
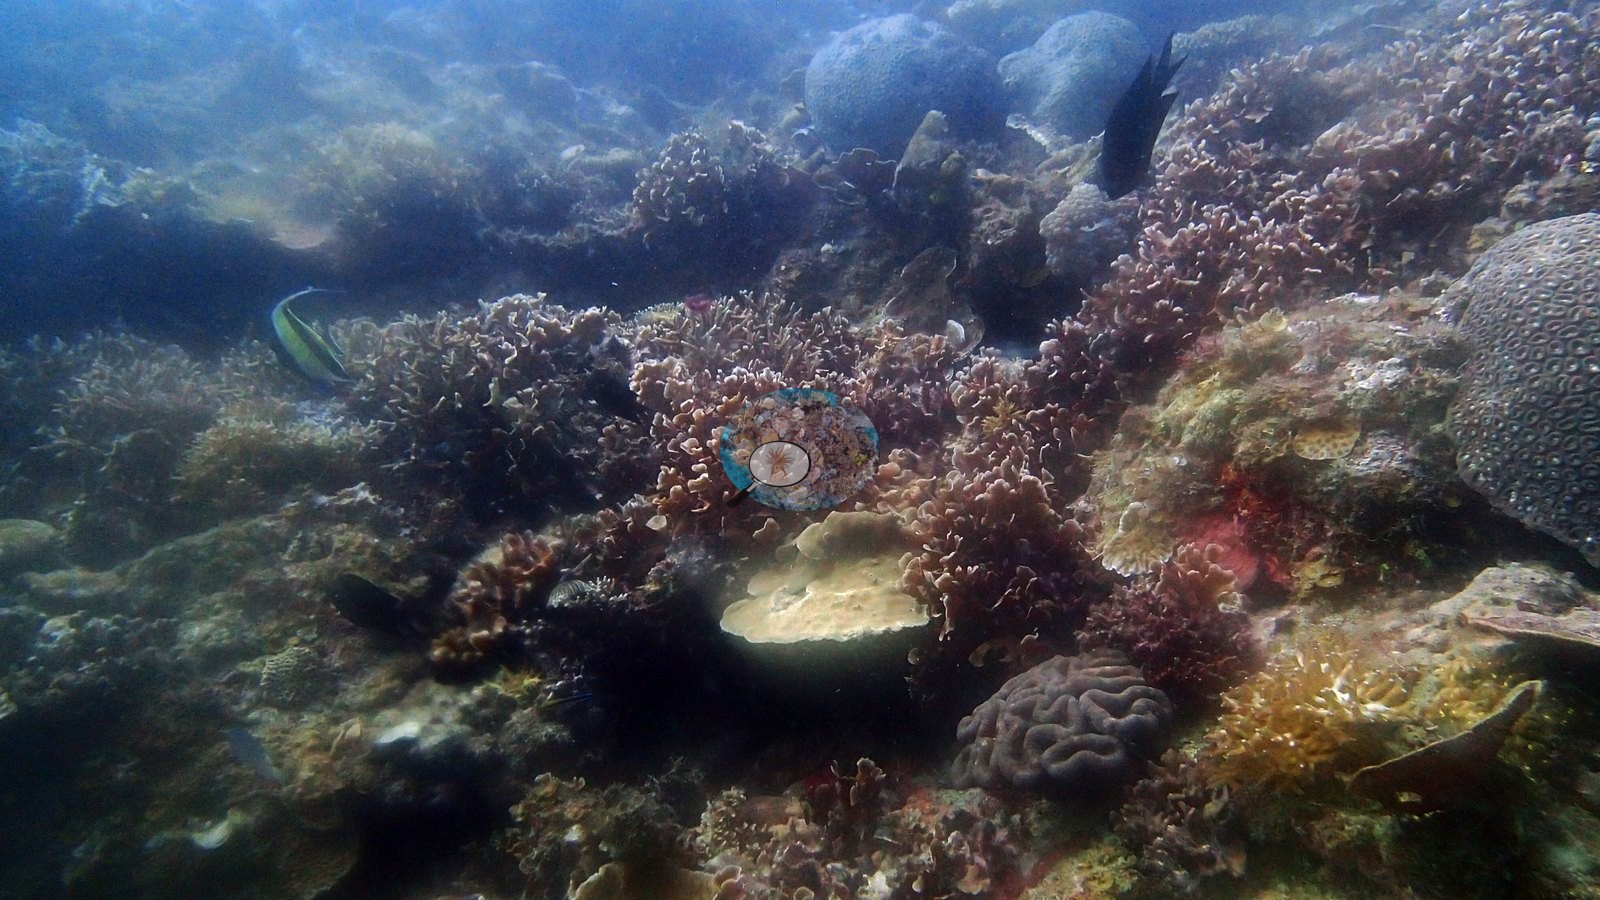
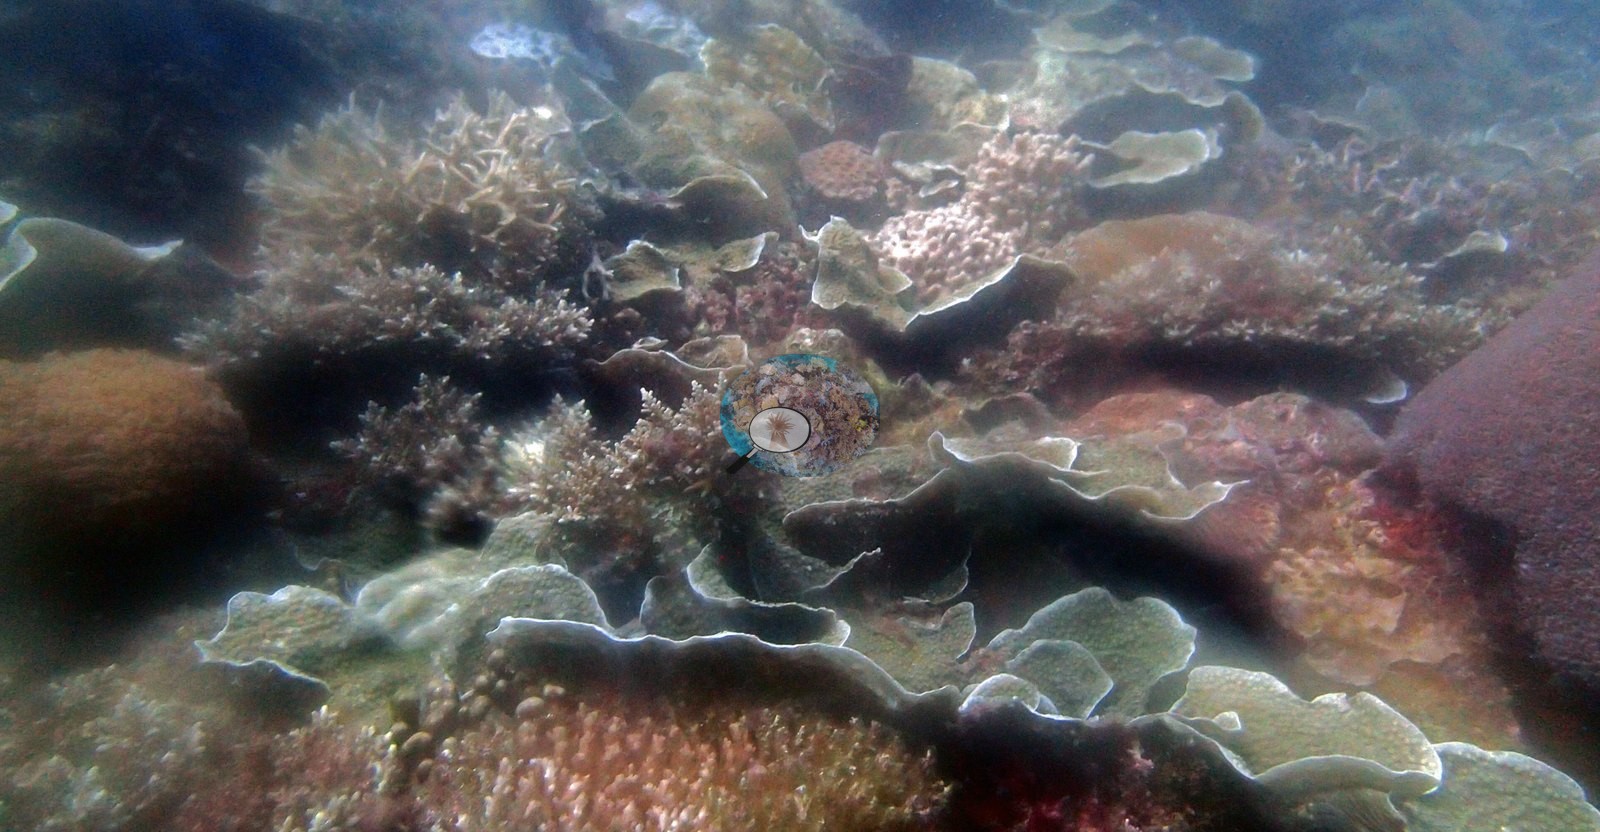
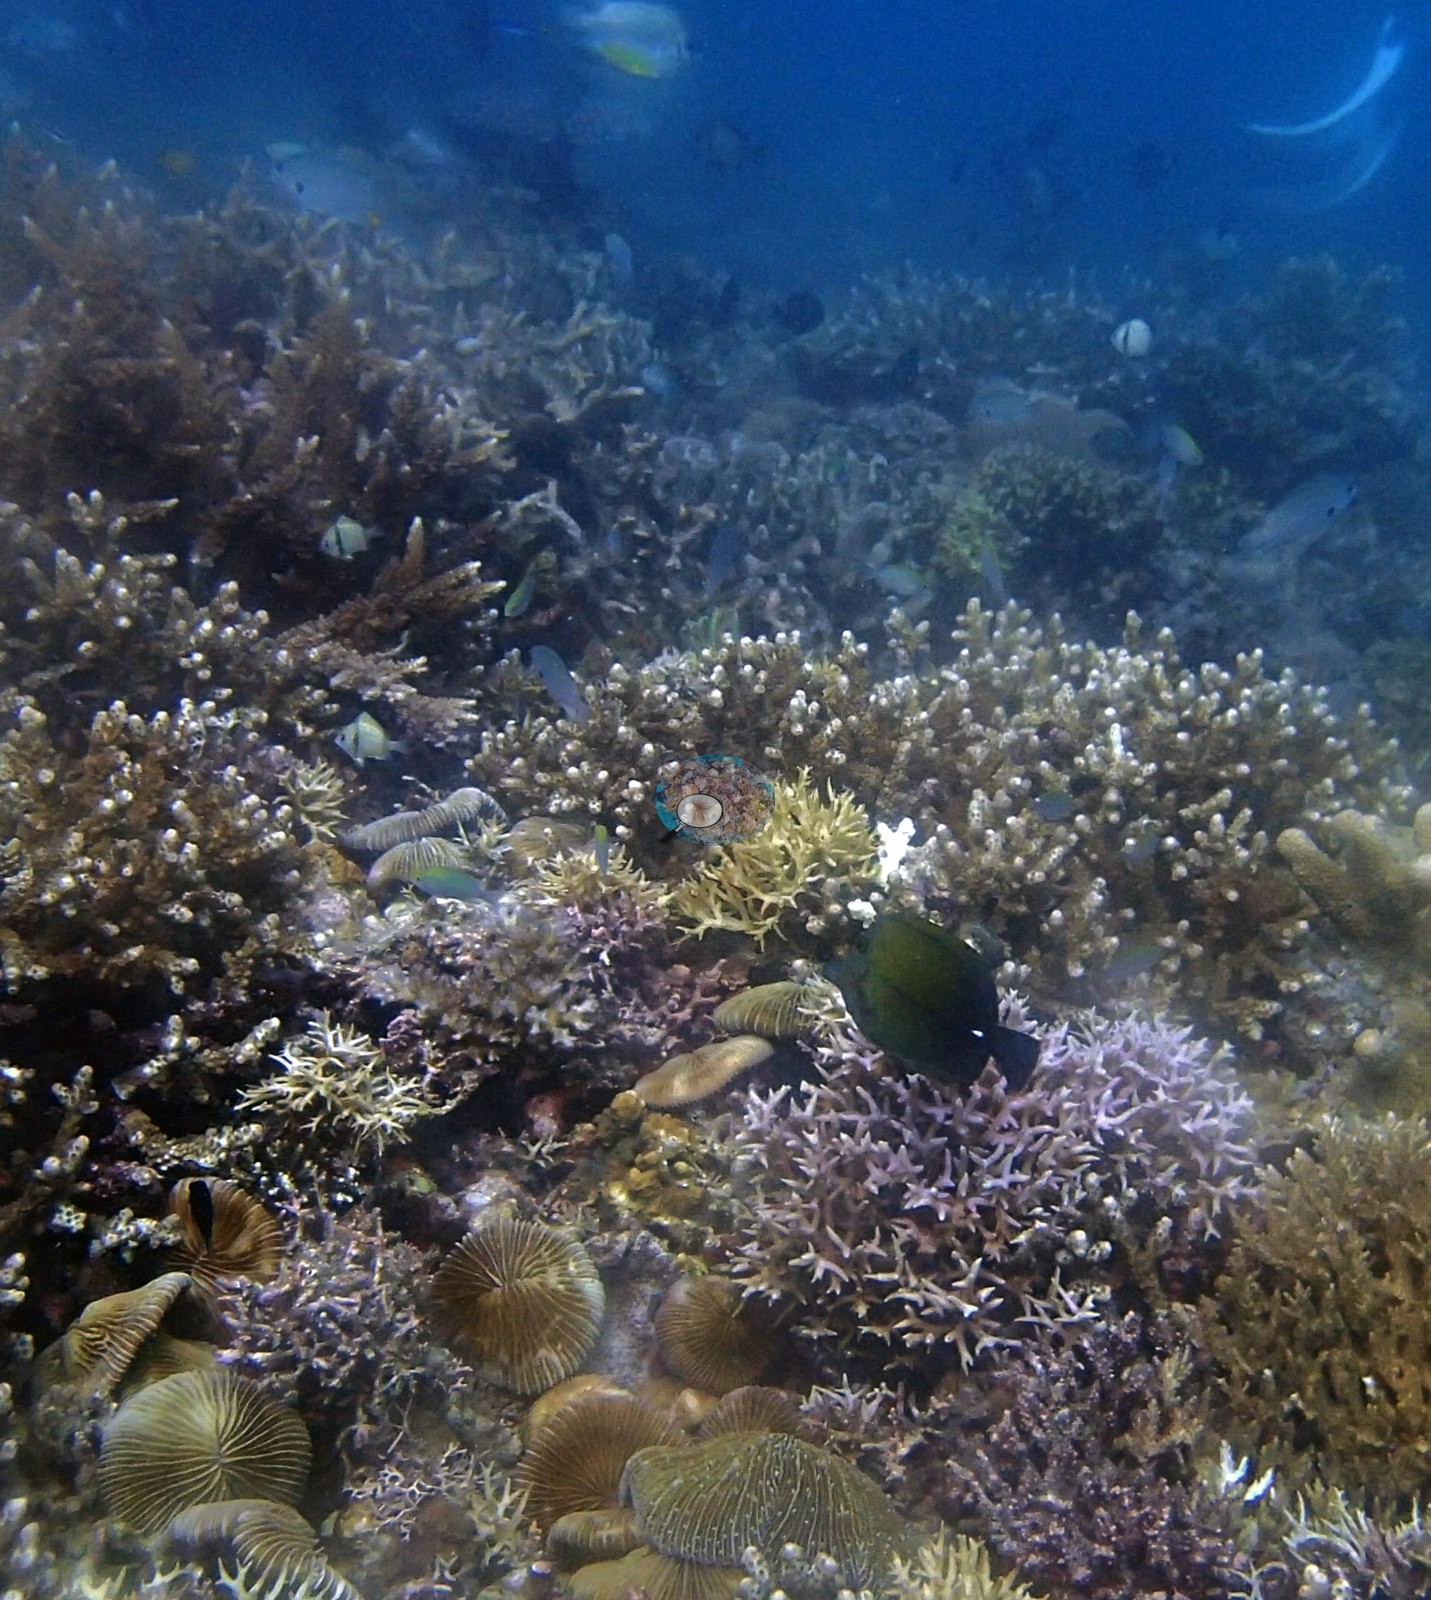
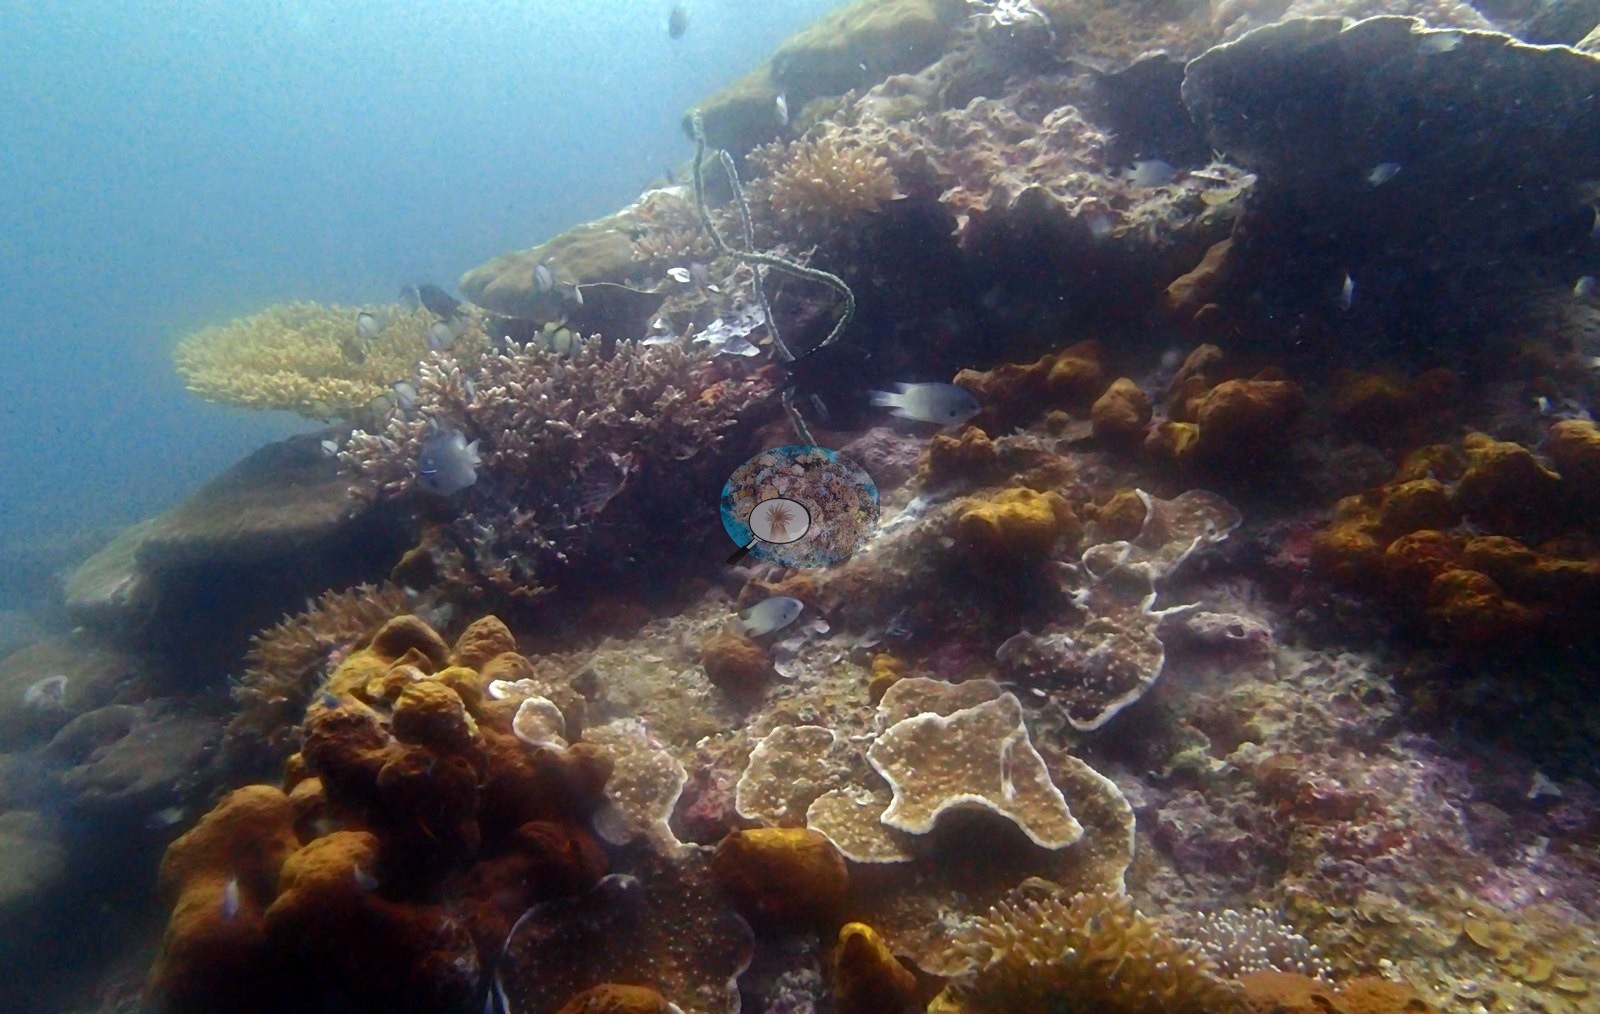
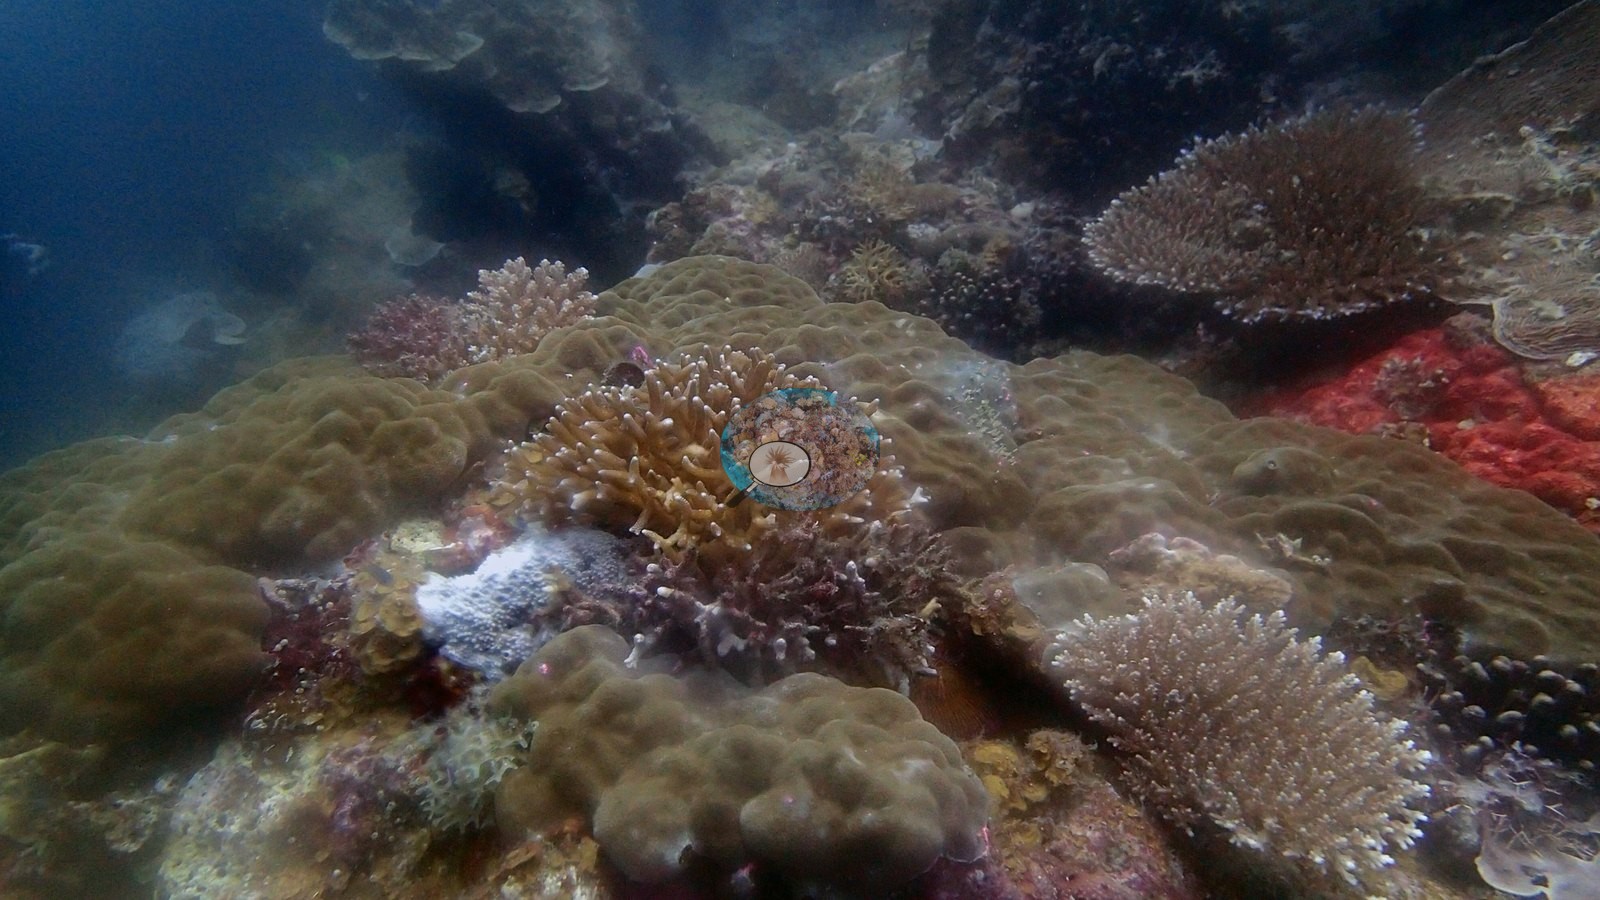
Abdens is Acropora country. Broad fields of tabular Acropora cover the substrate almost continuously - overlapping brown plates with clean pale growing margins - culminating in one magnificent isolated table several meters across that Anderson photographed and named in its own right (e.g., Image 3, Image 4, Image 5, Image 20).
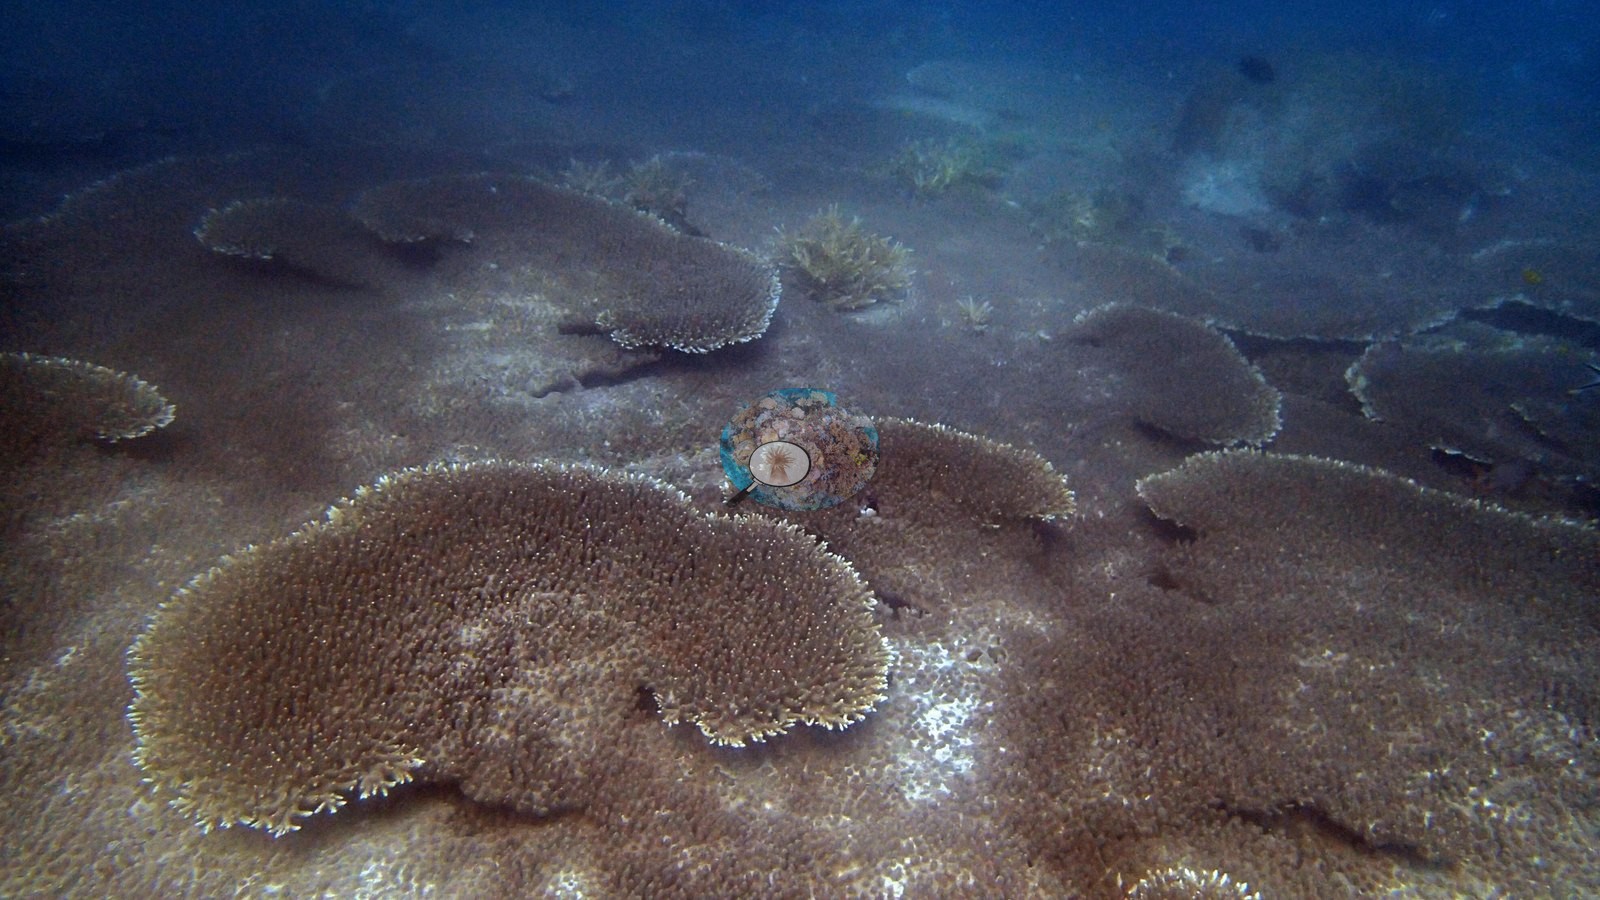
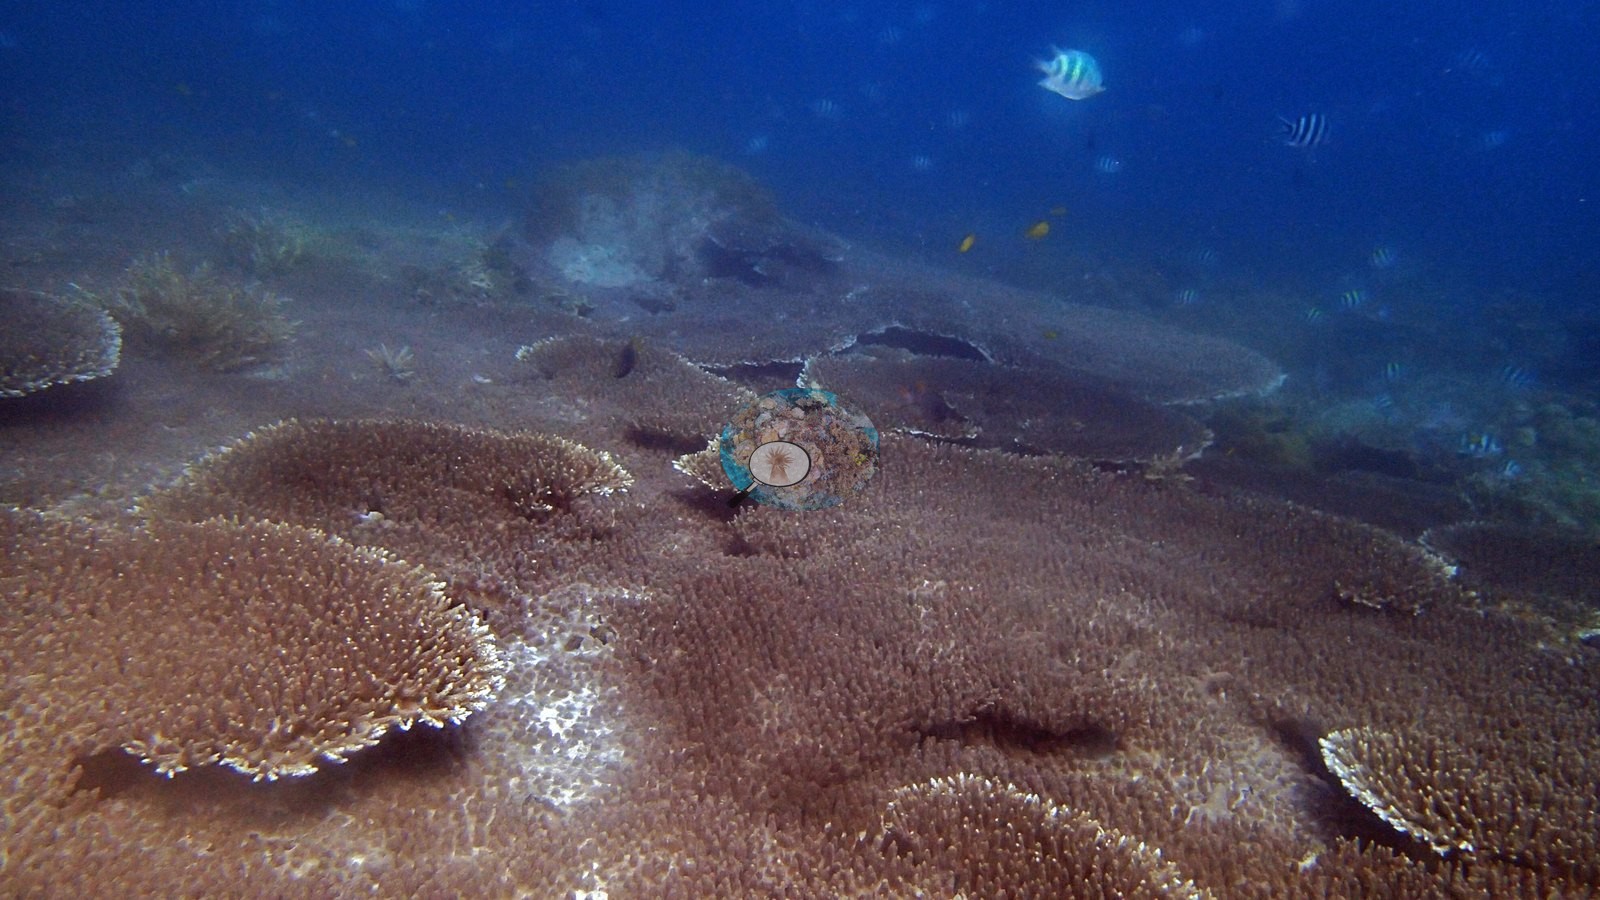
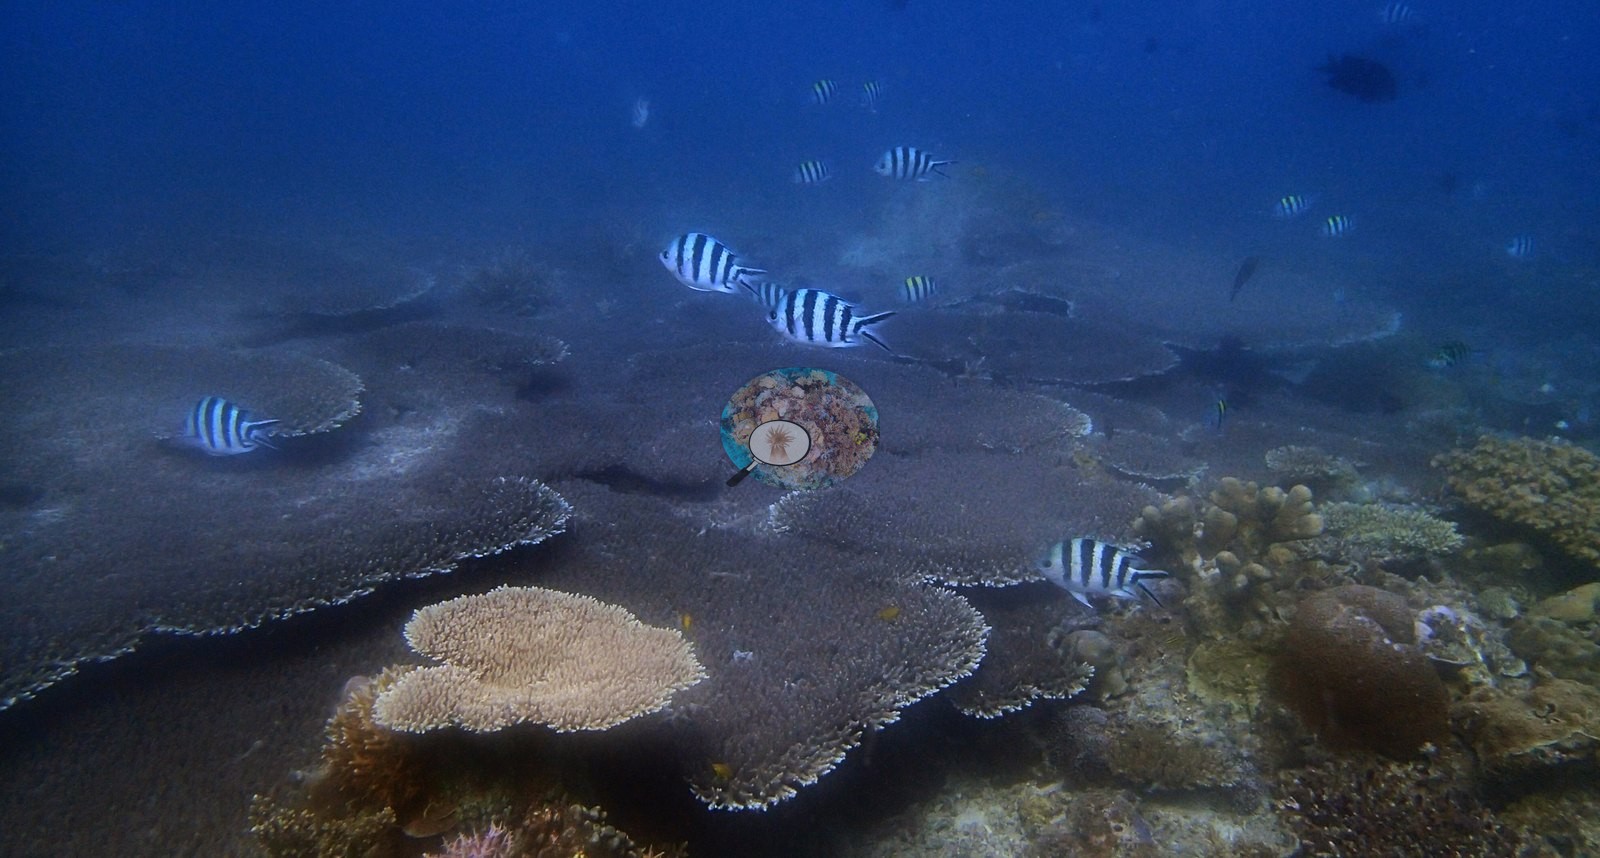
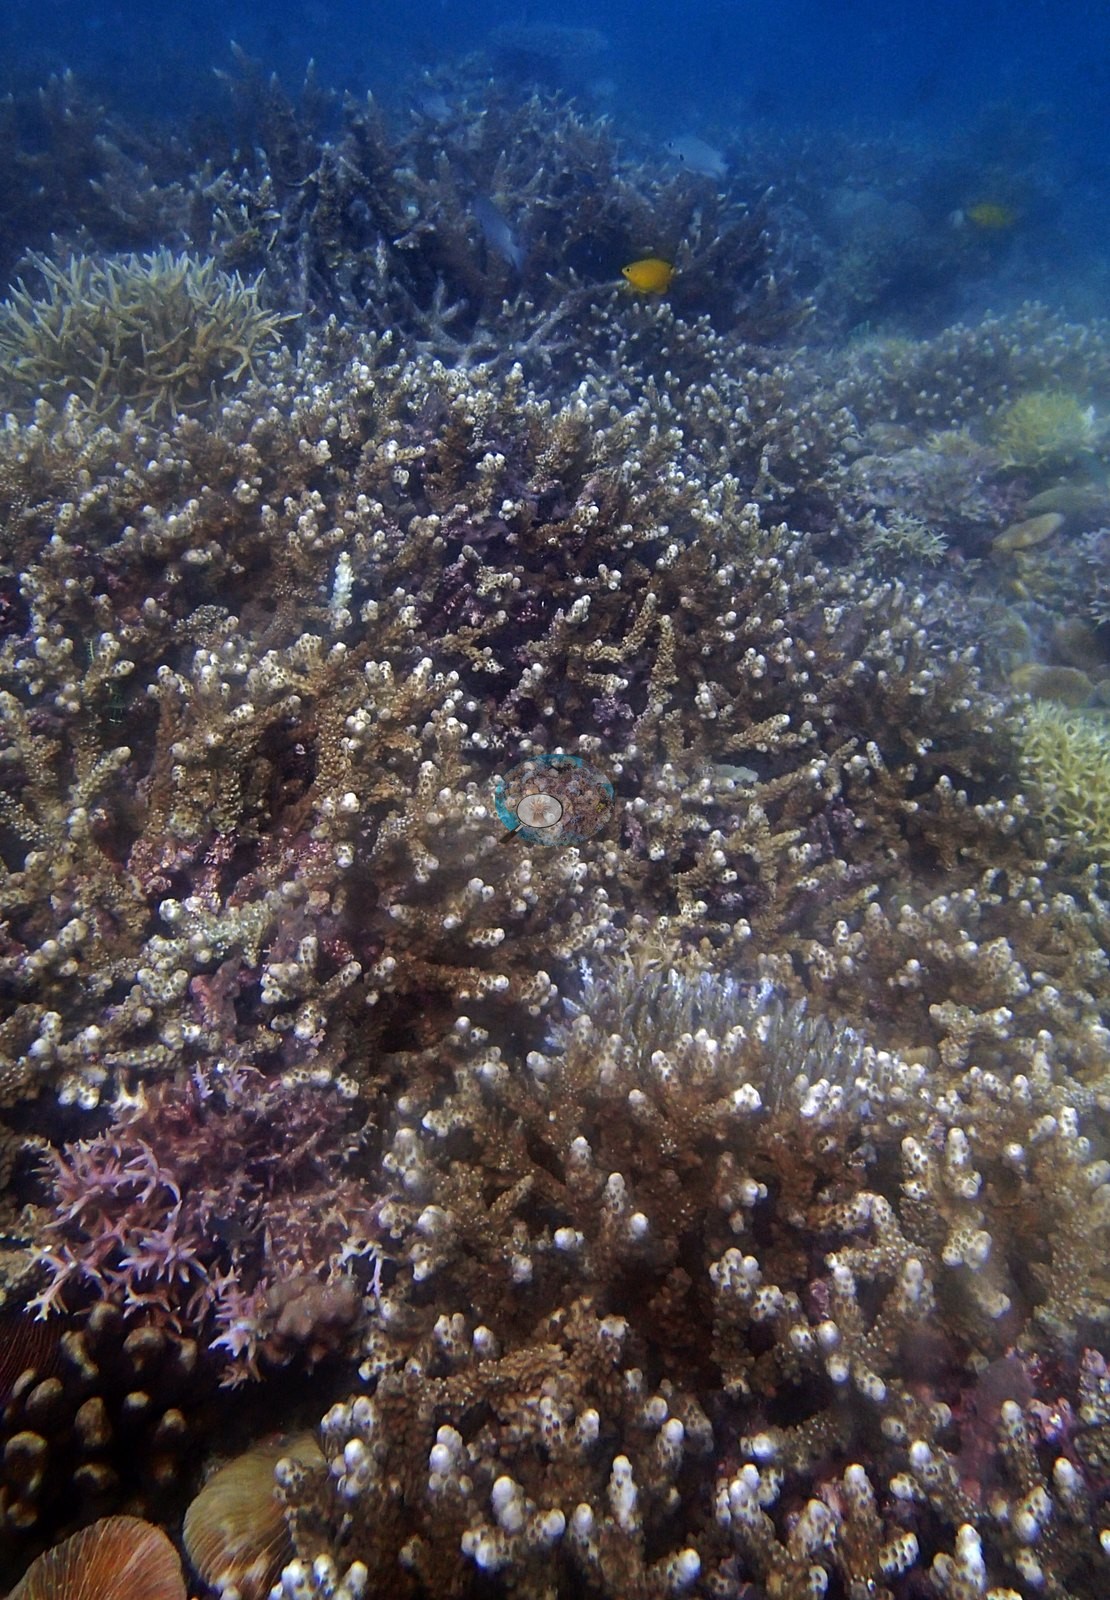
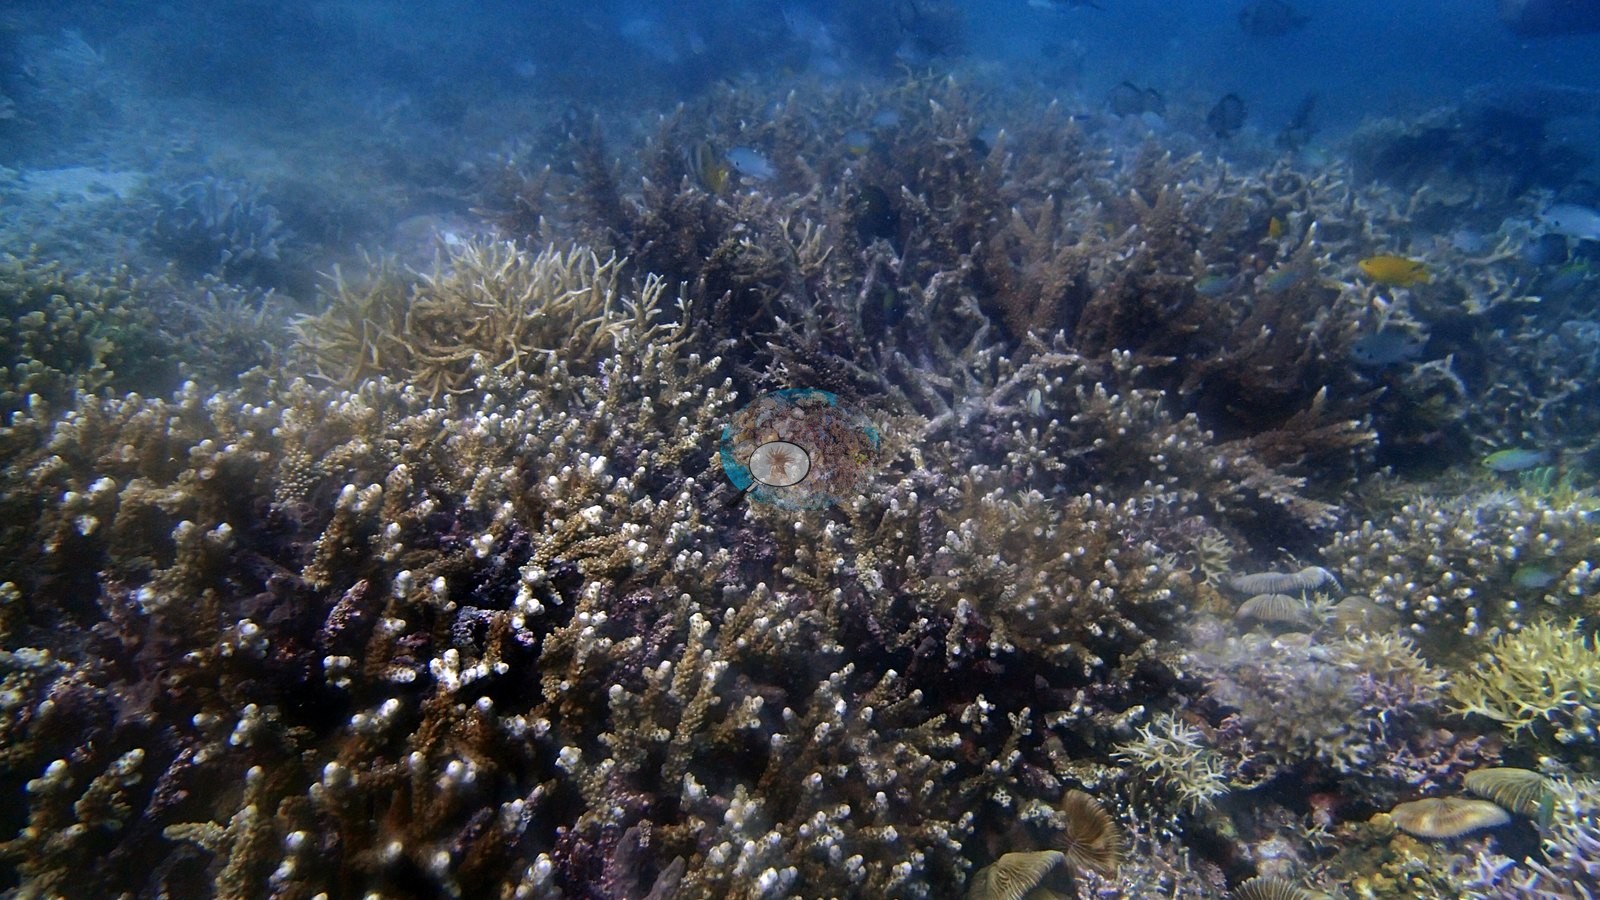
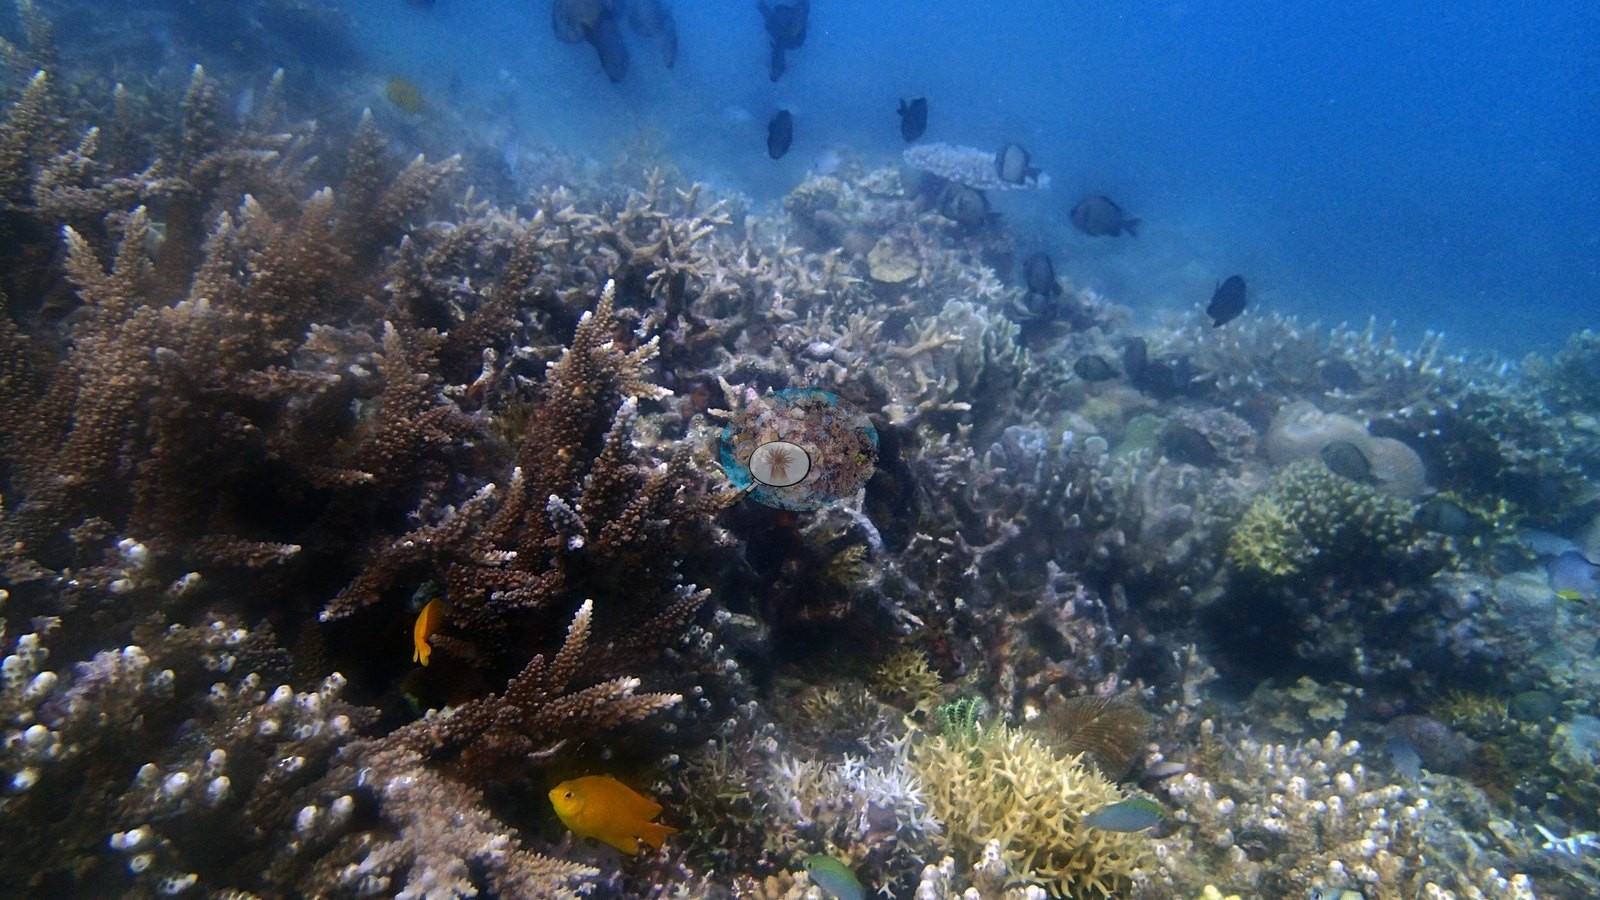
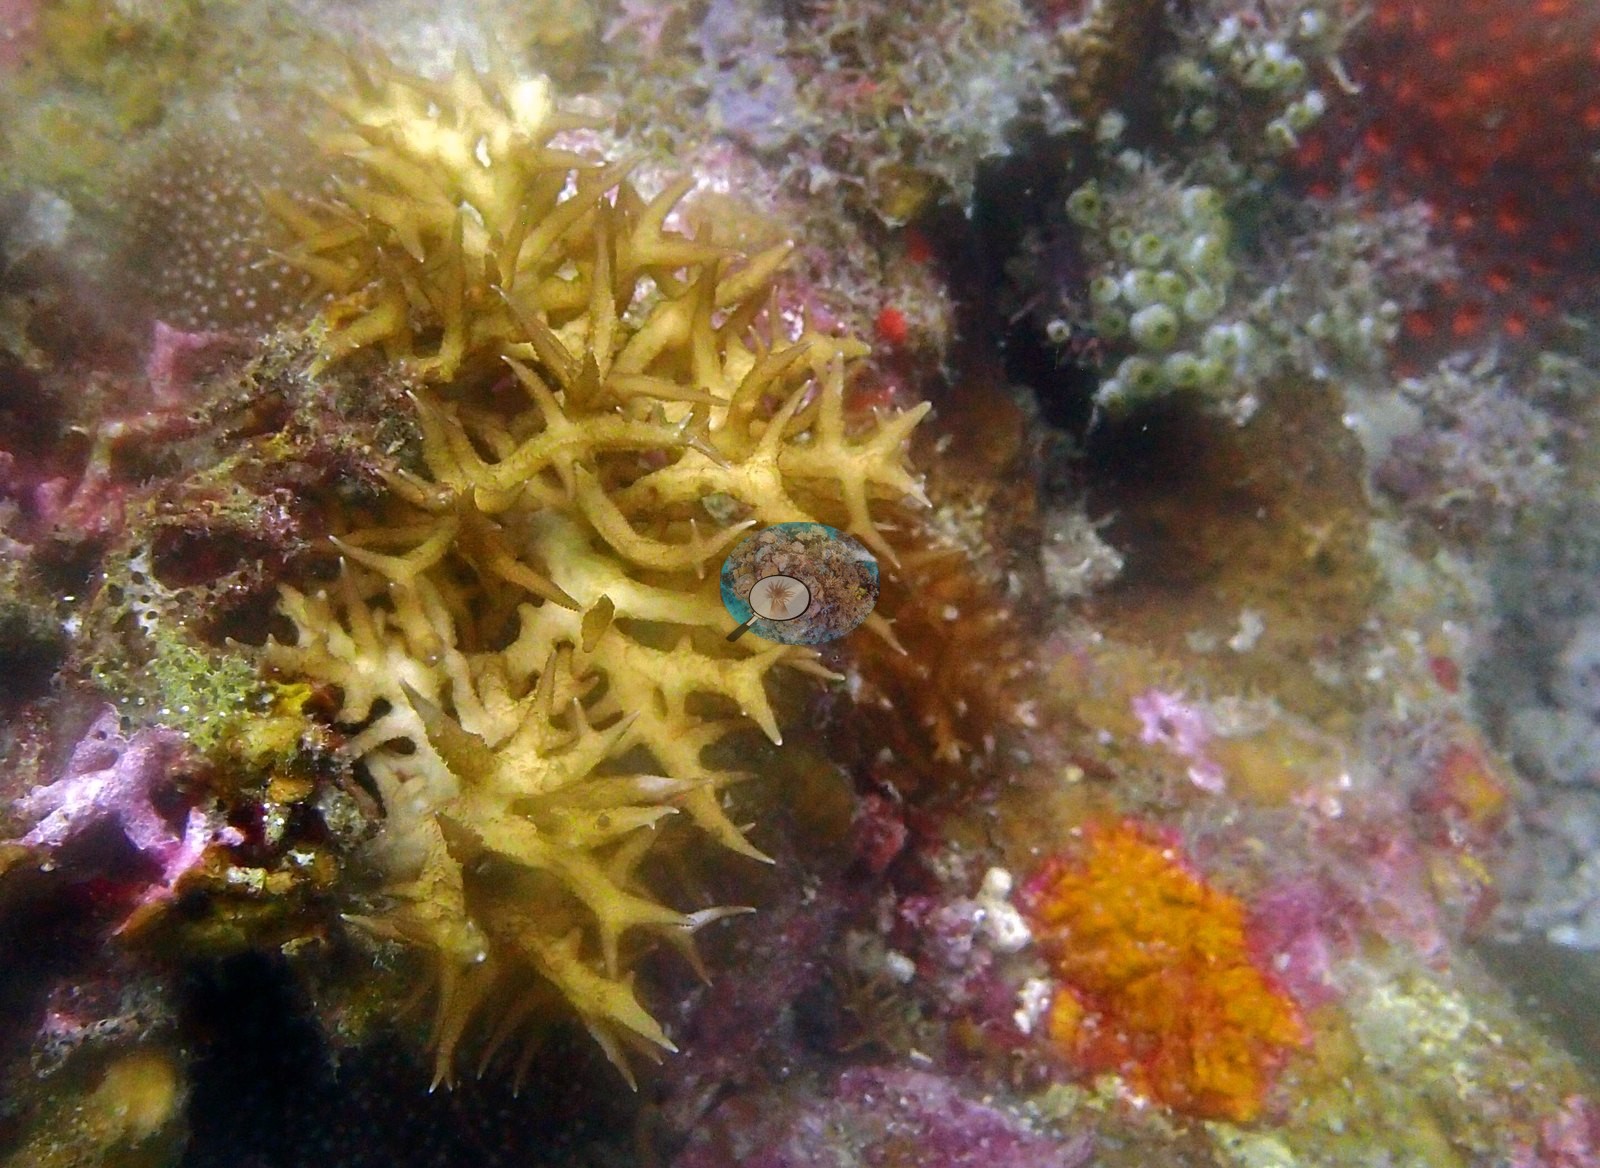
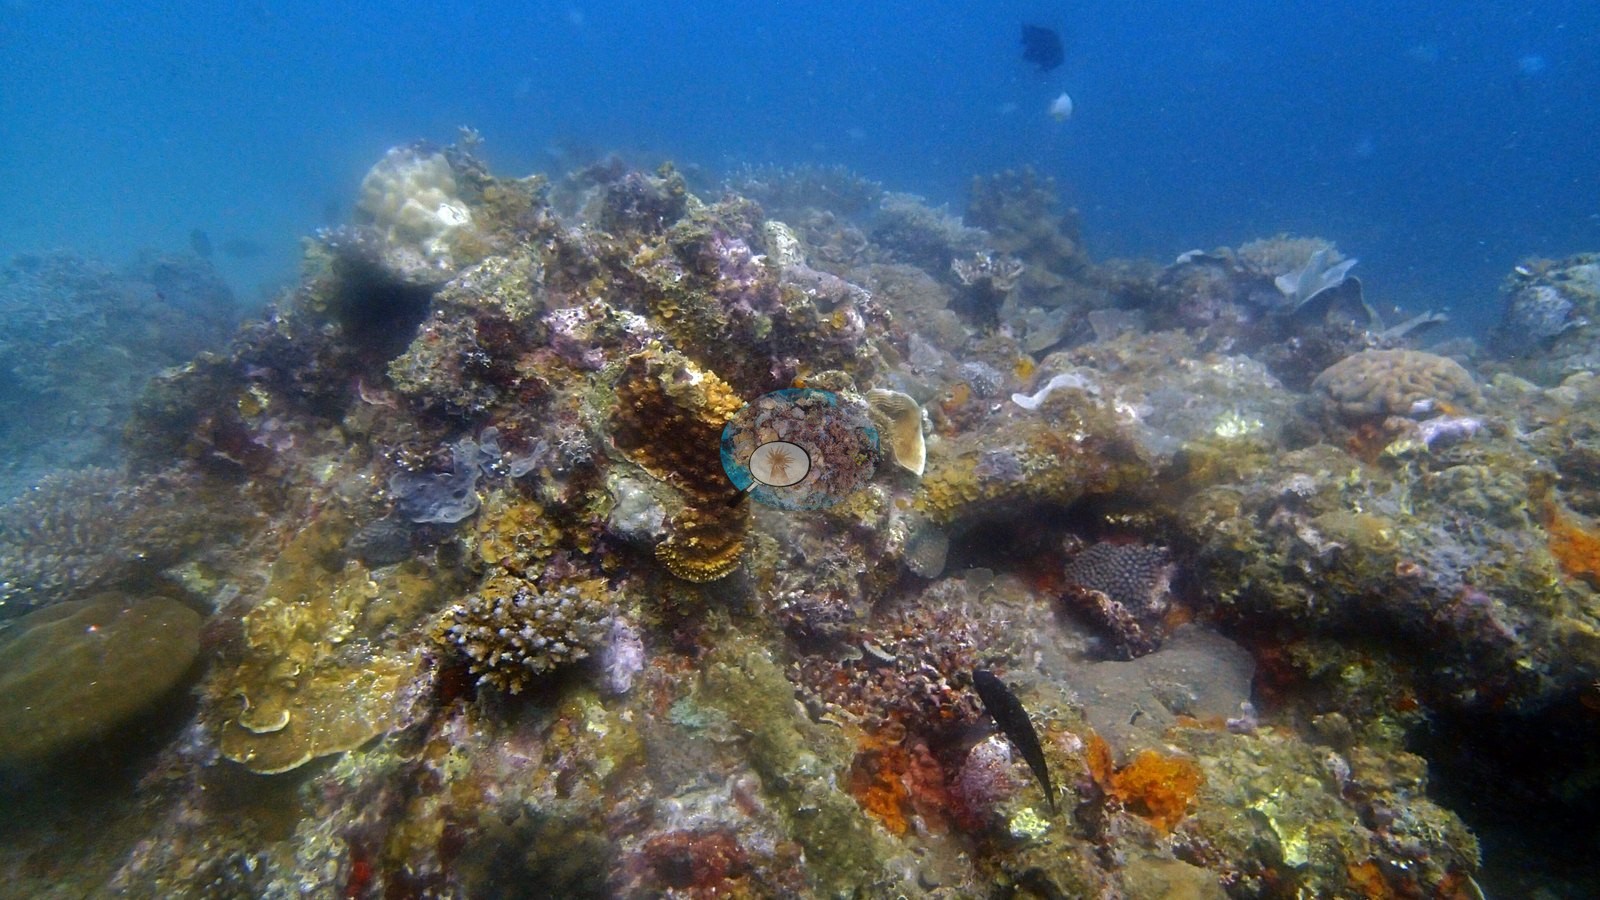
Between and around the tables are dense branching and staghorn Acropora thickets, massive Porites domes, maze-patterned Platygyra brain corals, foliose and plating colonies, and yellow Seriatopora (e.g., Image 1, Image 6, Image 8, Image 9, Image 10, Image 12, Image 13, Image 16, Image 17, Image 18, Image 19).
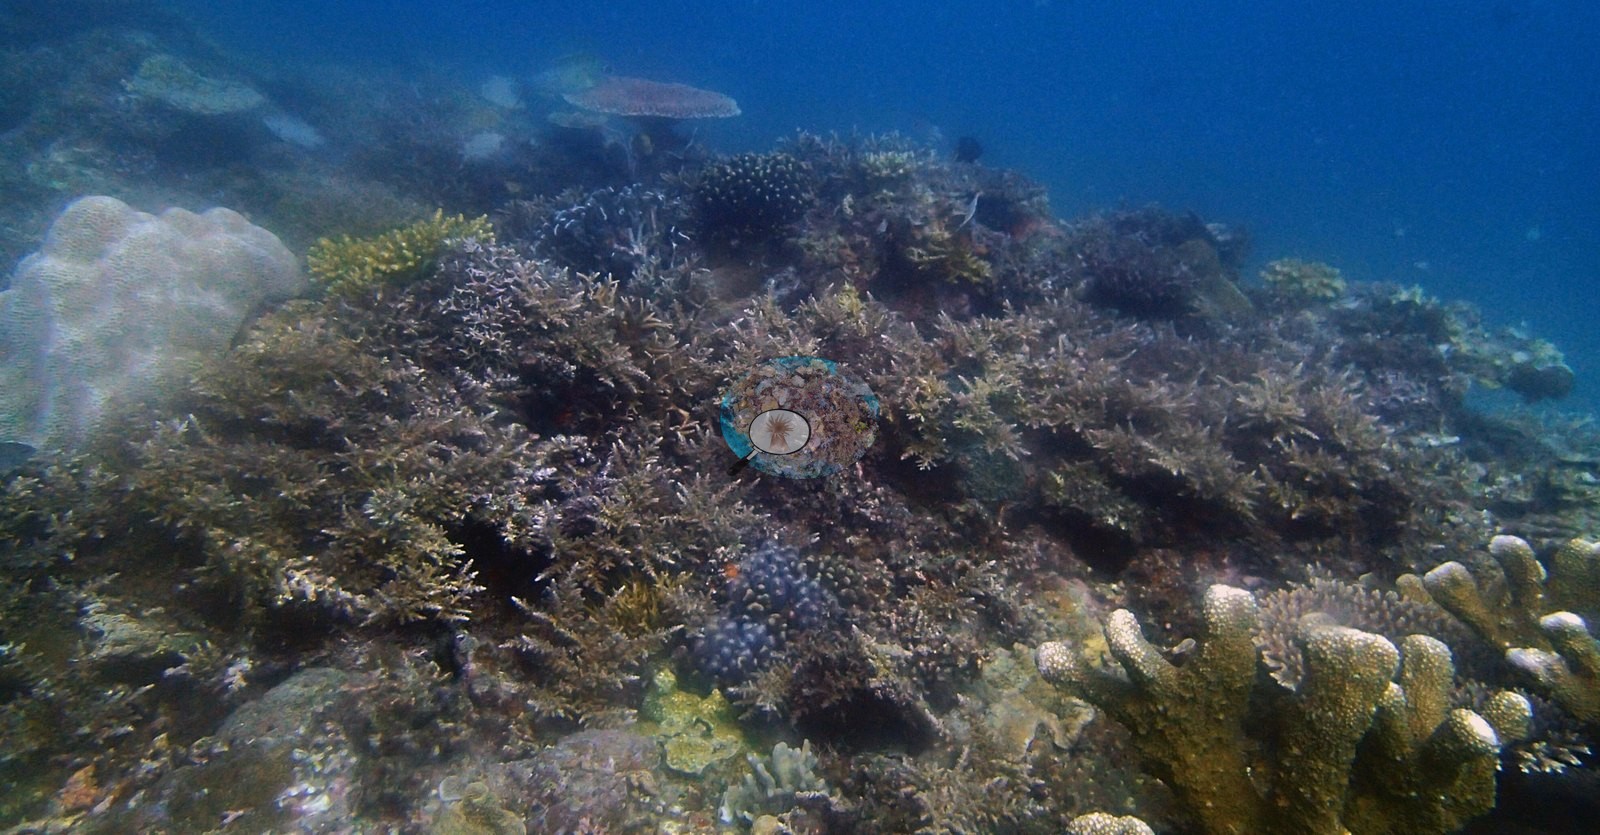
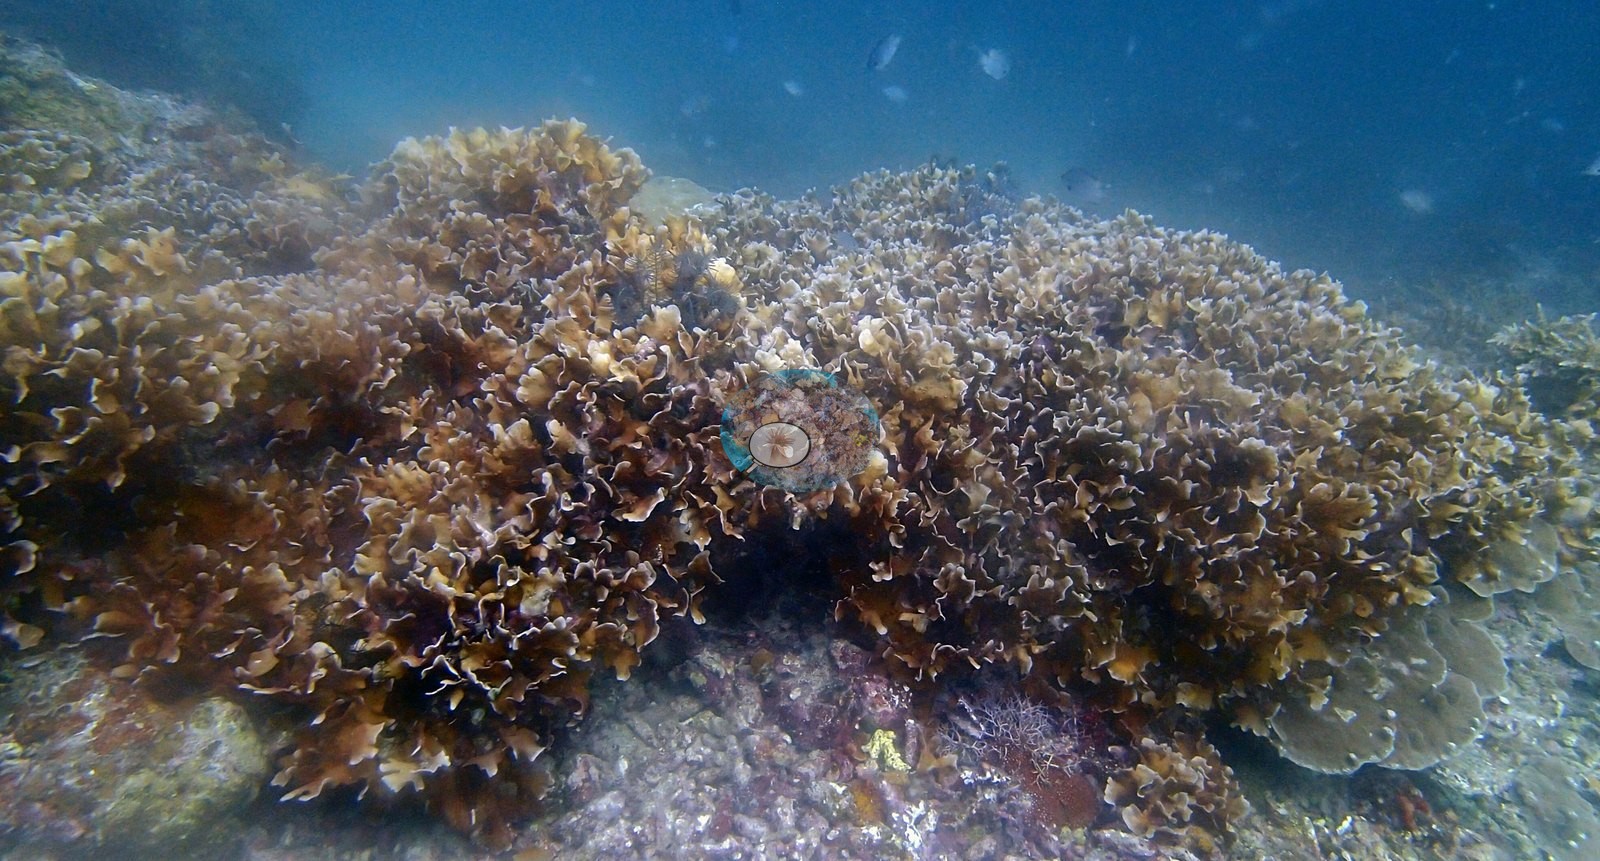
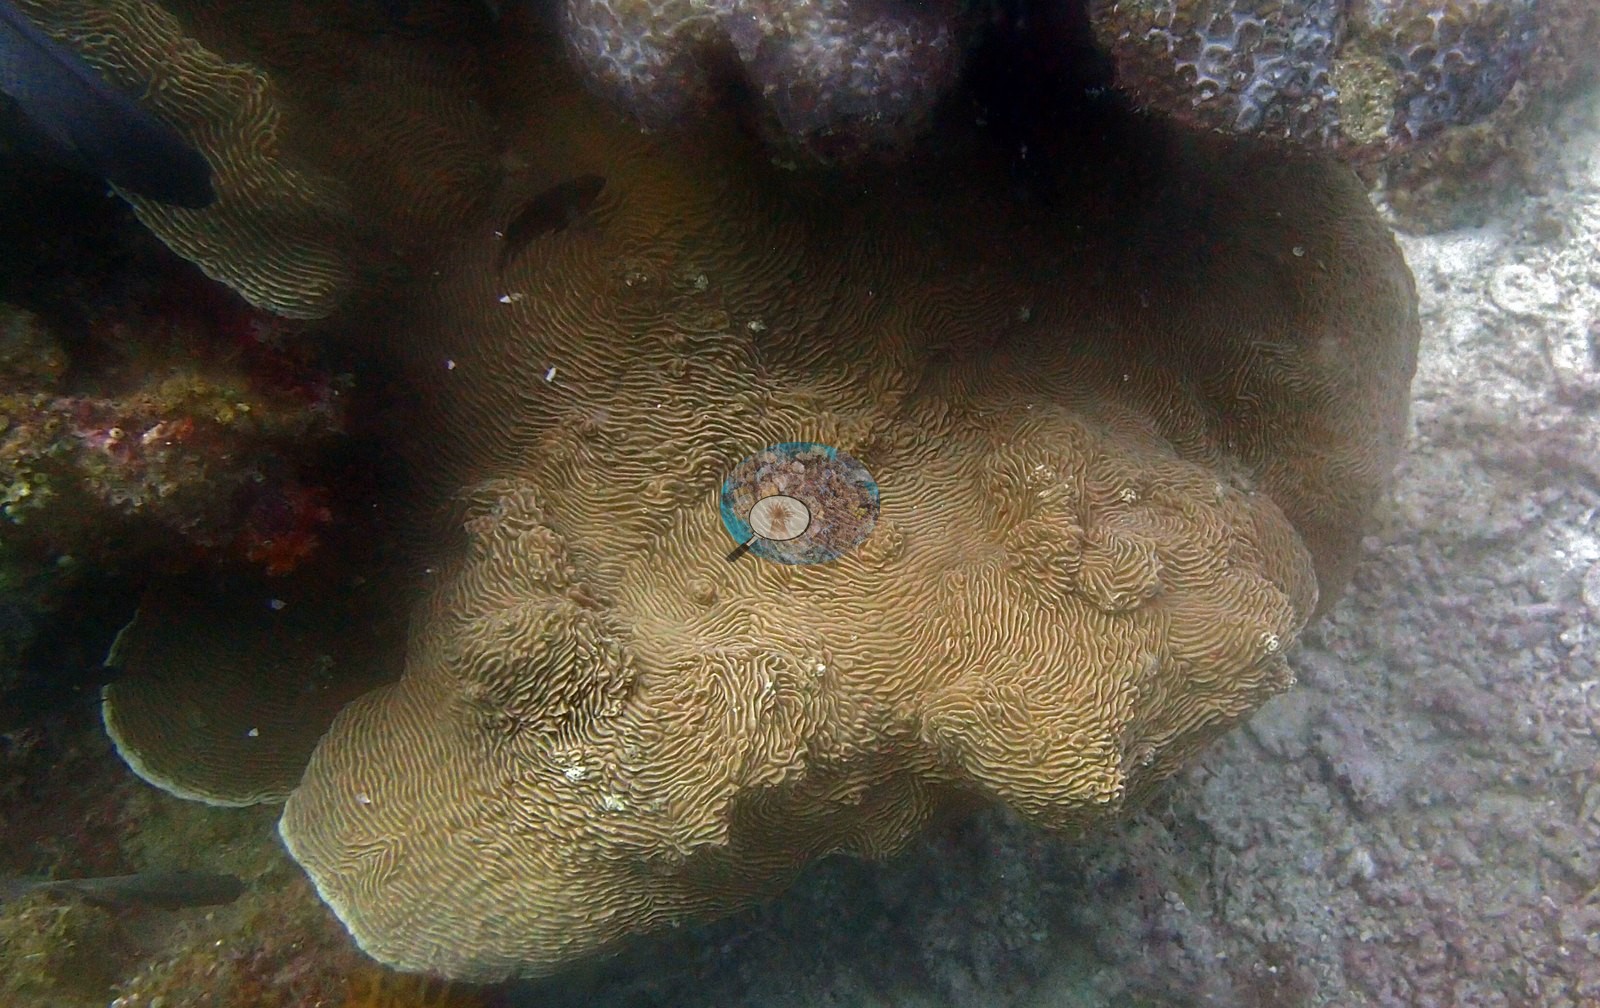
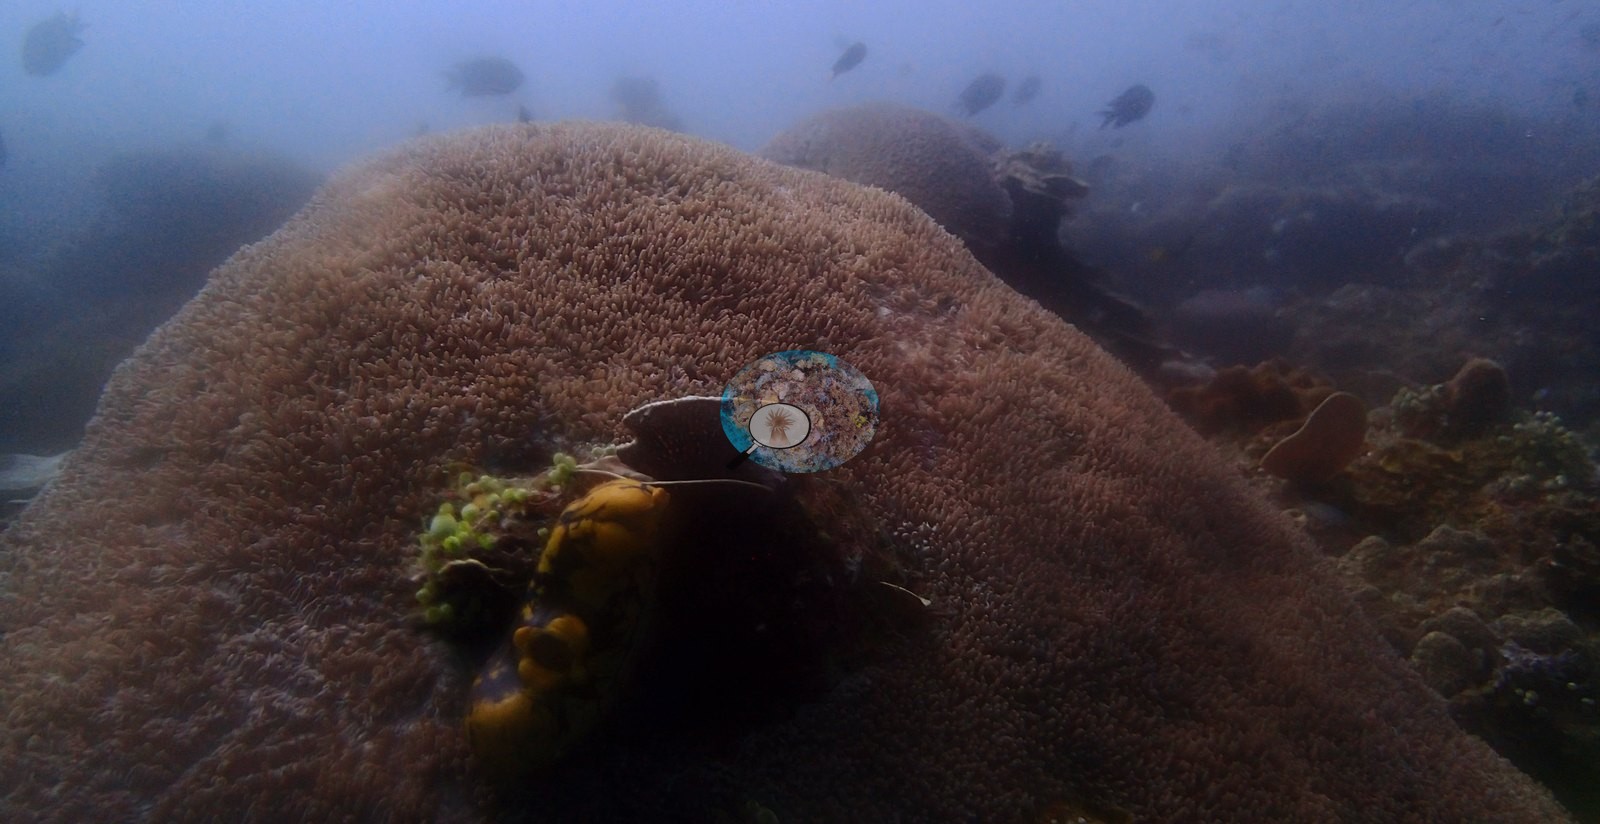
Coral cover
This dive now carries a cover figure, recovered by splitting the pooled 305-frame "bacuit_archipelago" computer vision collection back into its source folders; it merges all three El Nido dives with a separate 23 January island-hopping day, so its published row cannot be hung on any one pin. The 21 frames that are actually this dive give DINOv3 22.8 percent hard coral (420 points, 95 percent CI 20.3-25.3, frame range=11–32%), or 23.4 percent (95 percent CI 21.1-25.8) over the 20 underwater frames alone. CoralSCOP has since been run over the whole dive: all 21 frames give a computer vision mean of 32.8 percent (median=33.6, range=1.9–63%). The single frame this site was written against, at 12.2 percent, turns out to have been among the lowest in the set. The spread against DINOv3's 22.8 percent can now be assessed properly: 10 points, with CoralSCOP high. Read Abdens as roughly 12-26 percent, provisionally. Two flags. First, the photographic read that this is the best reef of the El Nido three is not confirmed: DINOv3 puts Paglugaban Rocks higher, 27.2 percent against 22.8 here, with the two confidence intervals barely touching. Second, the frame-level values are unusually flat - every underwater frame falls between 11.6 and 31.9 percent, and the frame of the meters-wide Acropora table that is the visual centerpiece of the dive scores 25.6 percent, barely above the site mean. The two fail differently: CoralSCOP computer vision reads high on low-cover reefs (median=1.68x a co-located diver survey, 4.6x at worst) and masks sponge and soft coral as readily as stony coral, while DINOv3 is strong in-domain (6-class macro-F1 0.62) but degrades on unseen reefs to 0.17-0.25 cross-domain point accuracy. Coral cover: 18% — photo-derived, and the two methods disagree by 10.6 pp; treat cover as a range (12–23%). Two independent computer vision passes were run over Anderson's own frames: a DINOv3 calibrated point classifier reads 22.8% and a CoralSCOP computer vision reads 12.2%, a spread of 10.6 percentage points. The map publishes a single figure so sites can be sorted against one another, but the honest statement of what is known here is the 12–23% range: the two products have different denominators and should not be treated as one measurement. He is actively comparing CoralSCOP and DINOv3 against newer CV models and will swap in an updated figure here once a more reliable model is found.
Stressors
The reef reads healthy: the pale margins on the tables are growing edge, not bleaching, and one small white patch on a single colony is the only ambiguous spot in the set - not a site-level signal. No crown-of-thorns starfish (COTS) or other corallivores evident.
Fish and other fauna
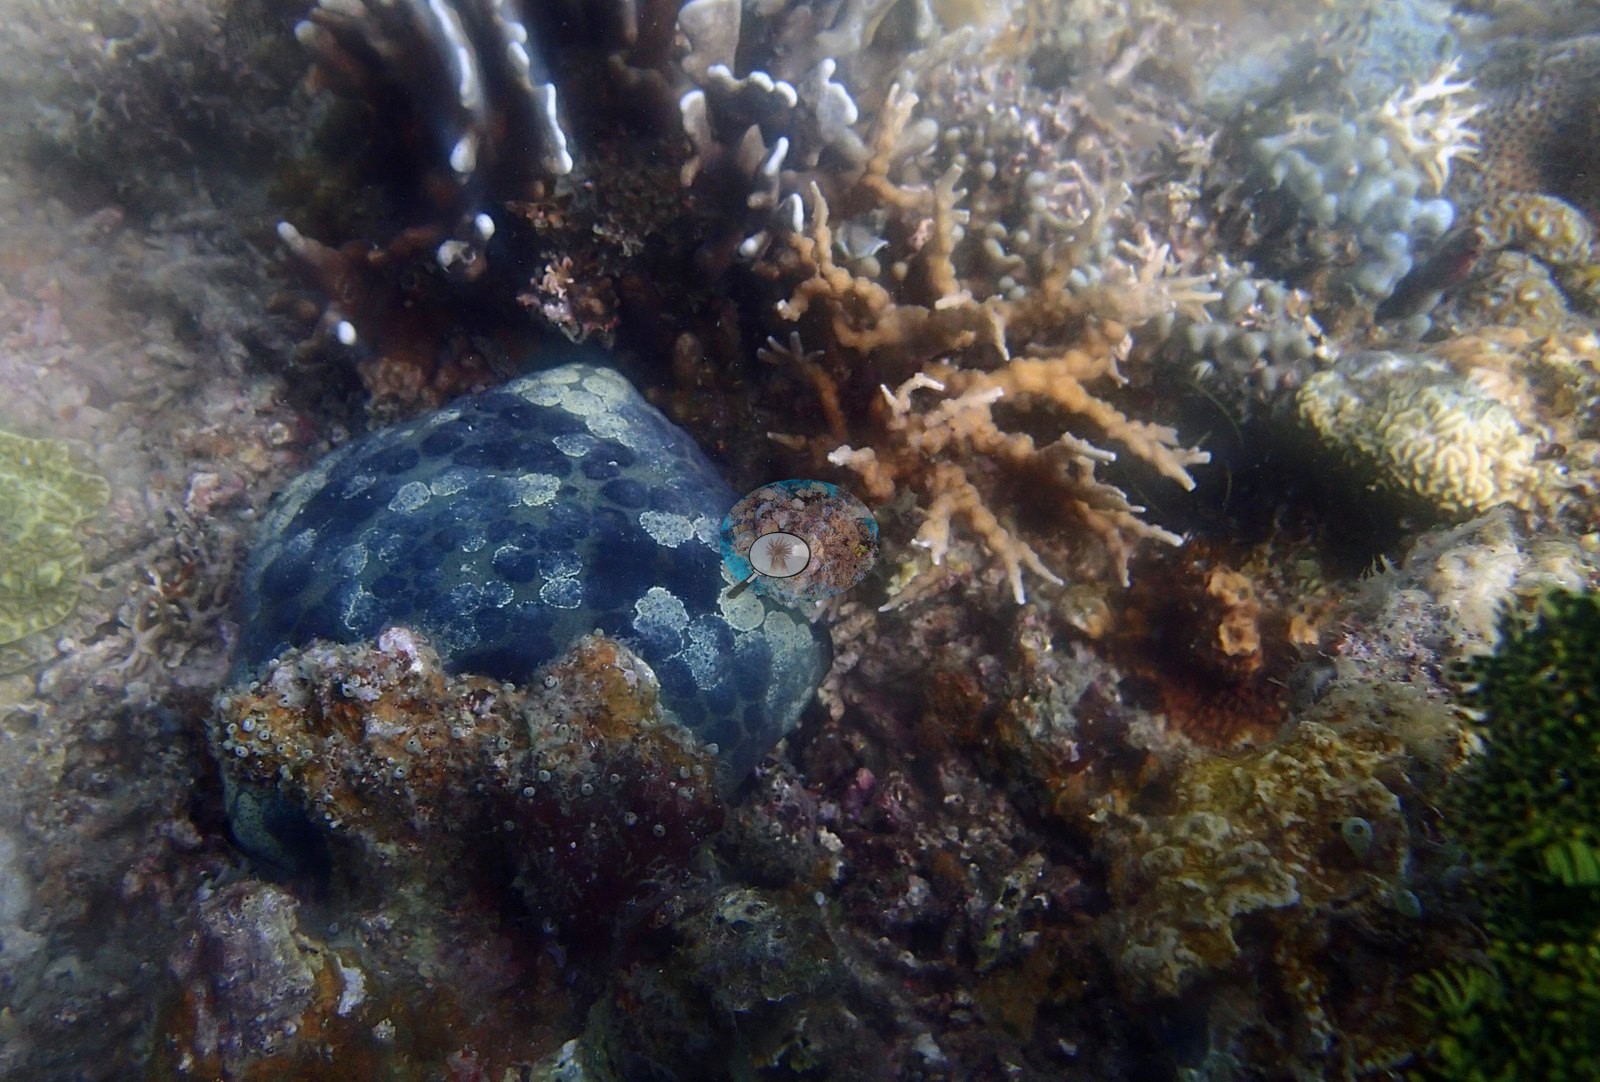
The pincushion sea star Culcita novaeguineae appears in its own frame, identified by Anderson himself, and sergeant majors and damselfishes work the water above the plates, with orange and red encrusting sponges filling the gaps (e.g., Image 2, Image 7, Image 11, Image 14, Image 15).
Comparisons with other data
No independent survey was made at this exact site; the nearest ones are listed in the table below.
Dive record
The third and final Bacuit Archipelago dive of 24 January 2017, in at 14:37 for 63 minutes to a maximum of 20.1 m (mean 11.6 m) at 26.7 C; all 21 frames were reviewed, one of them topside.
CV model comparison
More info
As of September 2026 no computer-vision method estimates coral cover accurately on new images, so treat this as indicative rather than a measurement; it is revised as the methods improve.More info
The published figure is the mean of the two methods.| Method | Hard-coral cover (%) |
|---|---|
| In-house DINOv3 | 22.8 |
| CoralSCOP | 12.2 |
| Mean (± SD) | 17.5 ± 7.5 |
| Range | 12.2–22.8 |
Mean ± SD and range are across the computer-vision methods shown.
Independent surveys nearby
 Dr. Coral (CRD)
Within 5 km, 1 independent survey station recorded hard coral cover in 4 surveys between 2013 and 2014. Of the 1 station surveyed in more than one year, 1 increased between their first and latest surveys. The longest record, Abdeen's Rock (Reef Check, 2.69 km away), went from 42% in 2013 to 61% in 2014. The most recent nearby survey is from 2014, so these values predate recent heat stress. This site's own estimate (18%) sits 24.1 points below the range of these surveys (42–61%); the methods differ, so the comparison is context, not a like-for-like test.
Collected by other programs using different methods (Reef Check uses point-intercept transects), so these are context for the figures above, not a like-for-like comparison. Where a station was surveyed more than once the range is shown. Station names are not dive-site names.
| Agency | Site / location | Date | Hard coral cover (%) | Distance | Link |
|---|---|---|---|---|---|
| Reef Check | Abdeen's Rock | 2013–2014 | 42–61% (4 surveys) | 2.69 km | — |
Data & links
All images from Coral Reef Diagnostics. Data are from Coral Reef Diagnostics and the organizations named in the data-sources table above.
© Coral Reef Diagnostics.