
Philippines - Coron: Twin Lagoon (island-hopping snorkel)

Part of the regional summaries: Philippines - Palawan and Philippines
More info
Western Philippines (NOAA CRW virtual station) · Palawan/North Borneo ecoregion mean=4.0°C-heating weeksTwin Lagoon is a snorkel stop among the karst lagoons of Coron Island's south coast, where shallow coral, including bird's-nest, and cauliflower-type branching corals, grows on the lagoon walls and floor. It was photographed only briefly on a 2017 island-hopping day.
Three independent survey stations shown with the program’s logo — click one to see how far it is from this site.
Two other CRD dive sites within 5 km shown in orange — click a marker to open its page.
5 of these 7 photographs are shown beside the text that discusses them under "Site description" below.
Site description
Setting
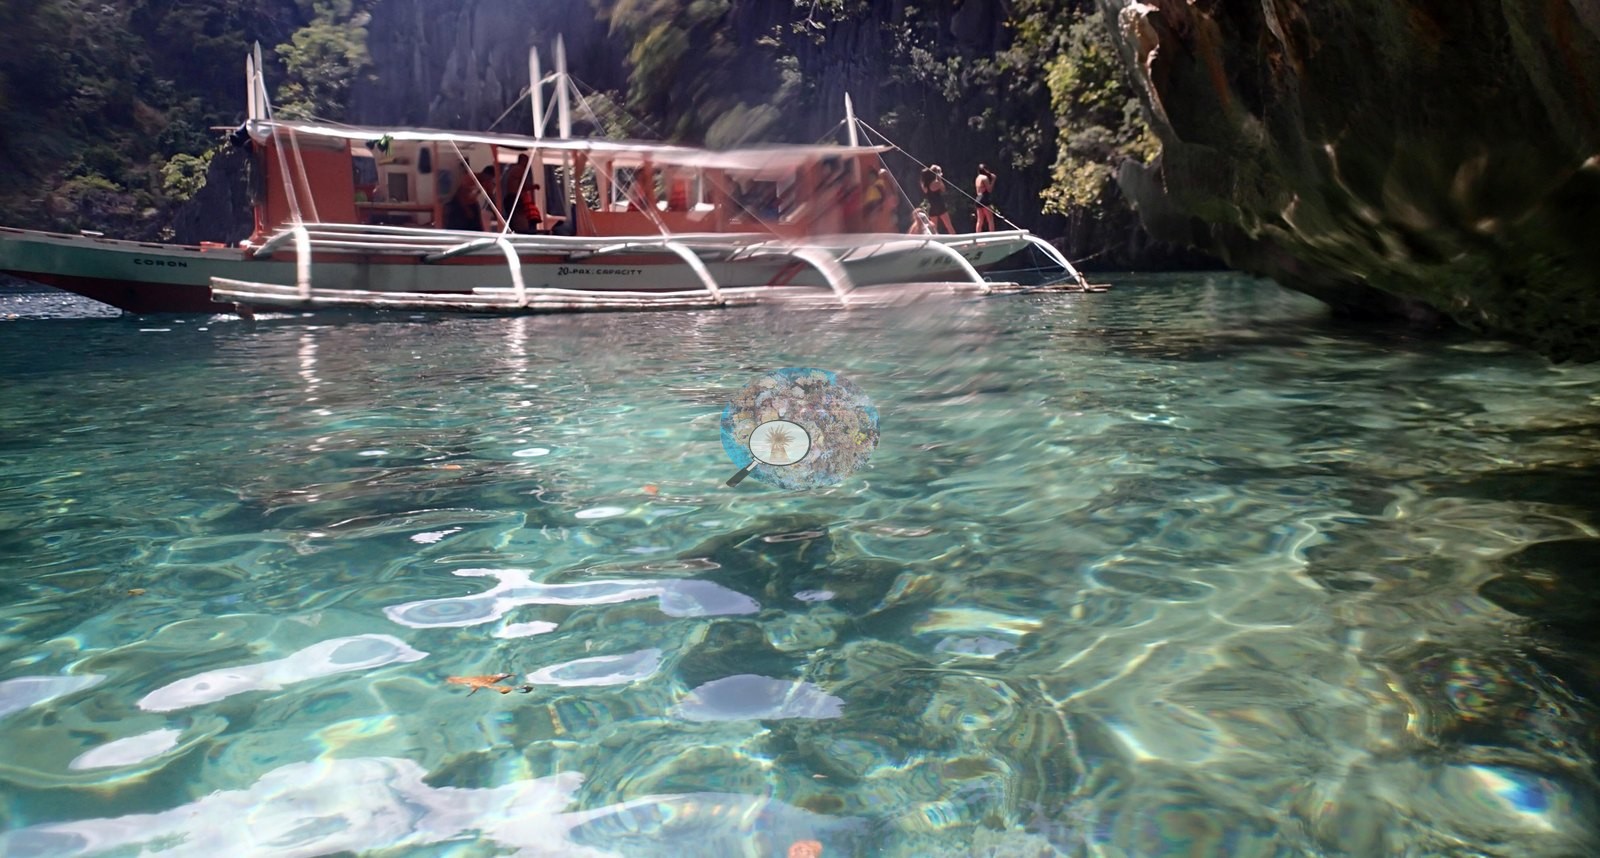
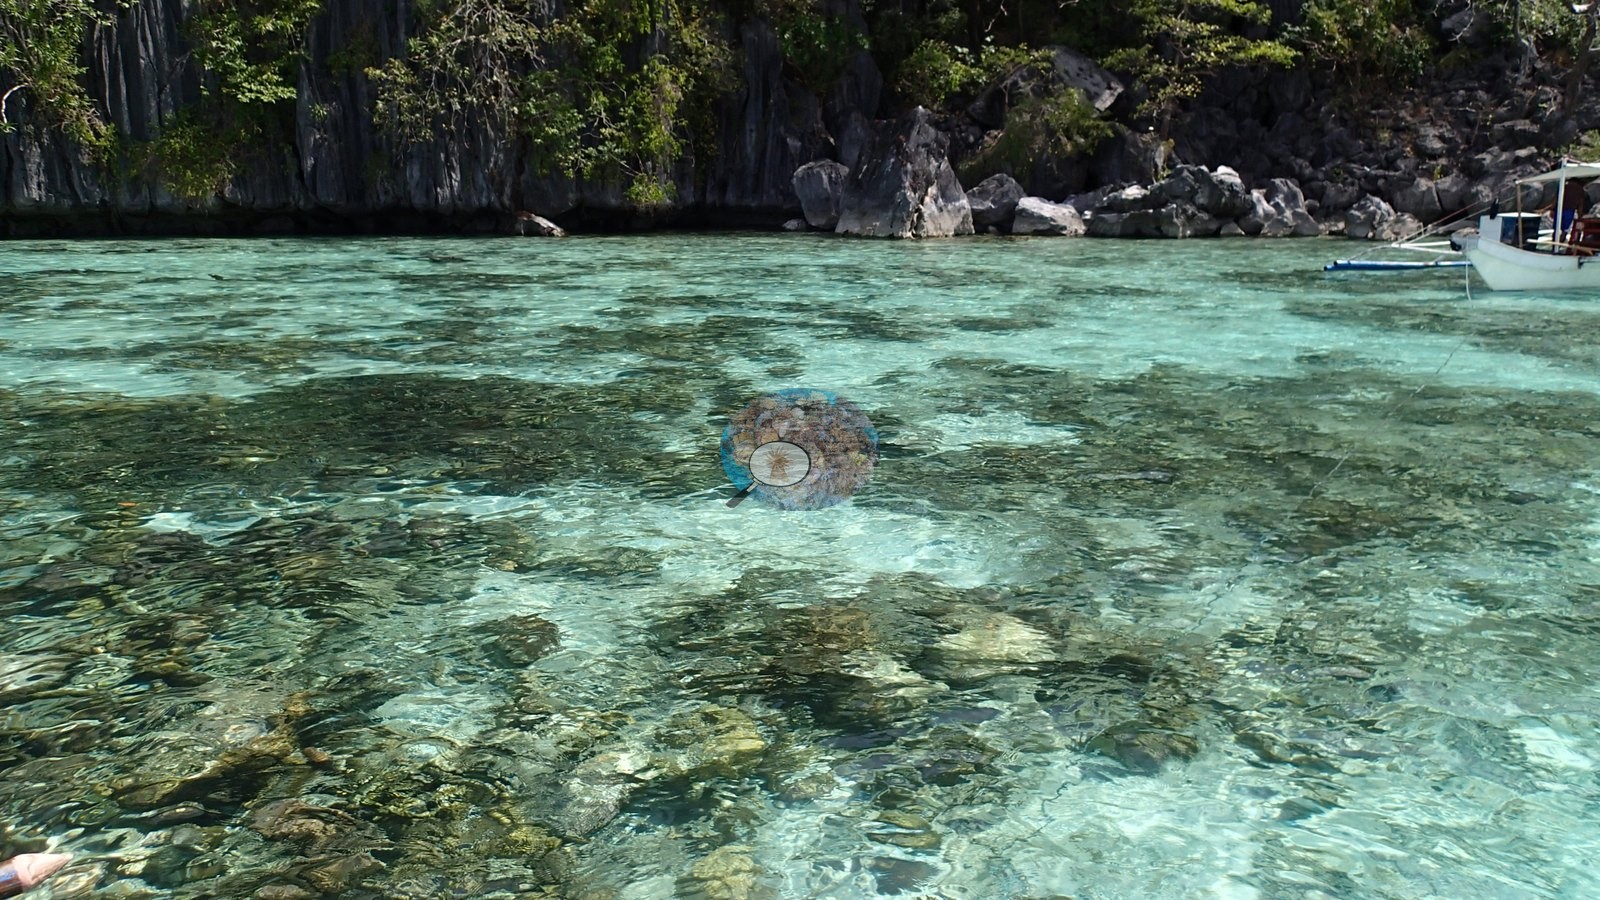
Twin Lagoon, Coron Island, Palawan — a snorkel stop on the island-hopping day of 28 January 2017, in the karst lagoons on Coron's south coast.
General benthic features
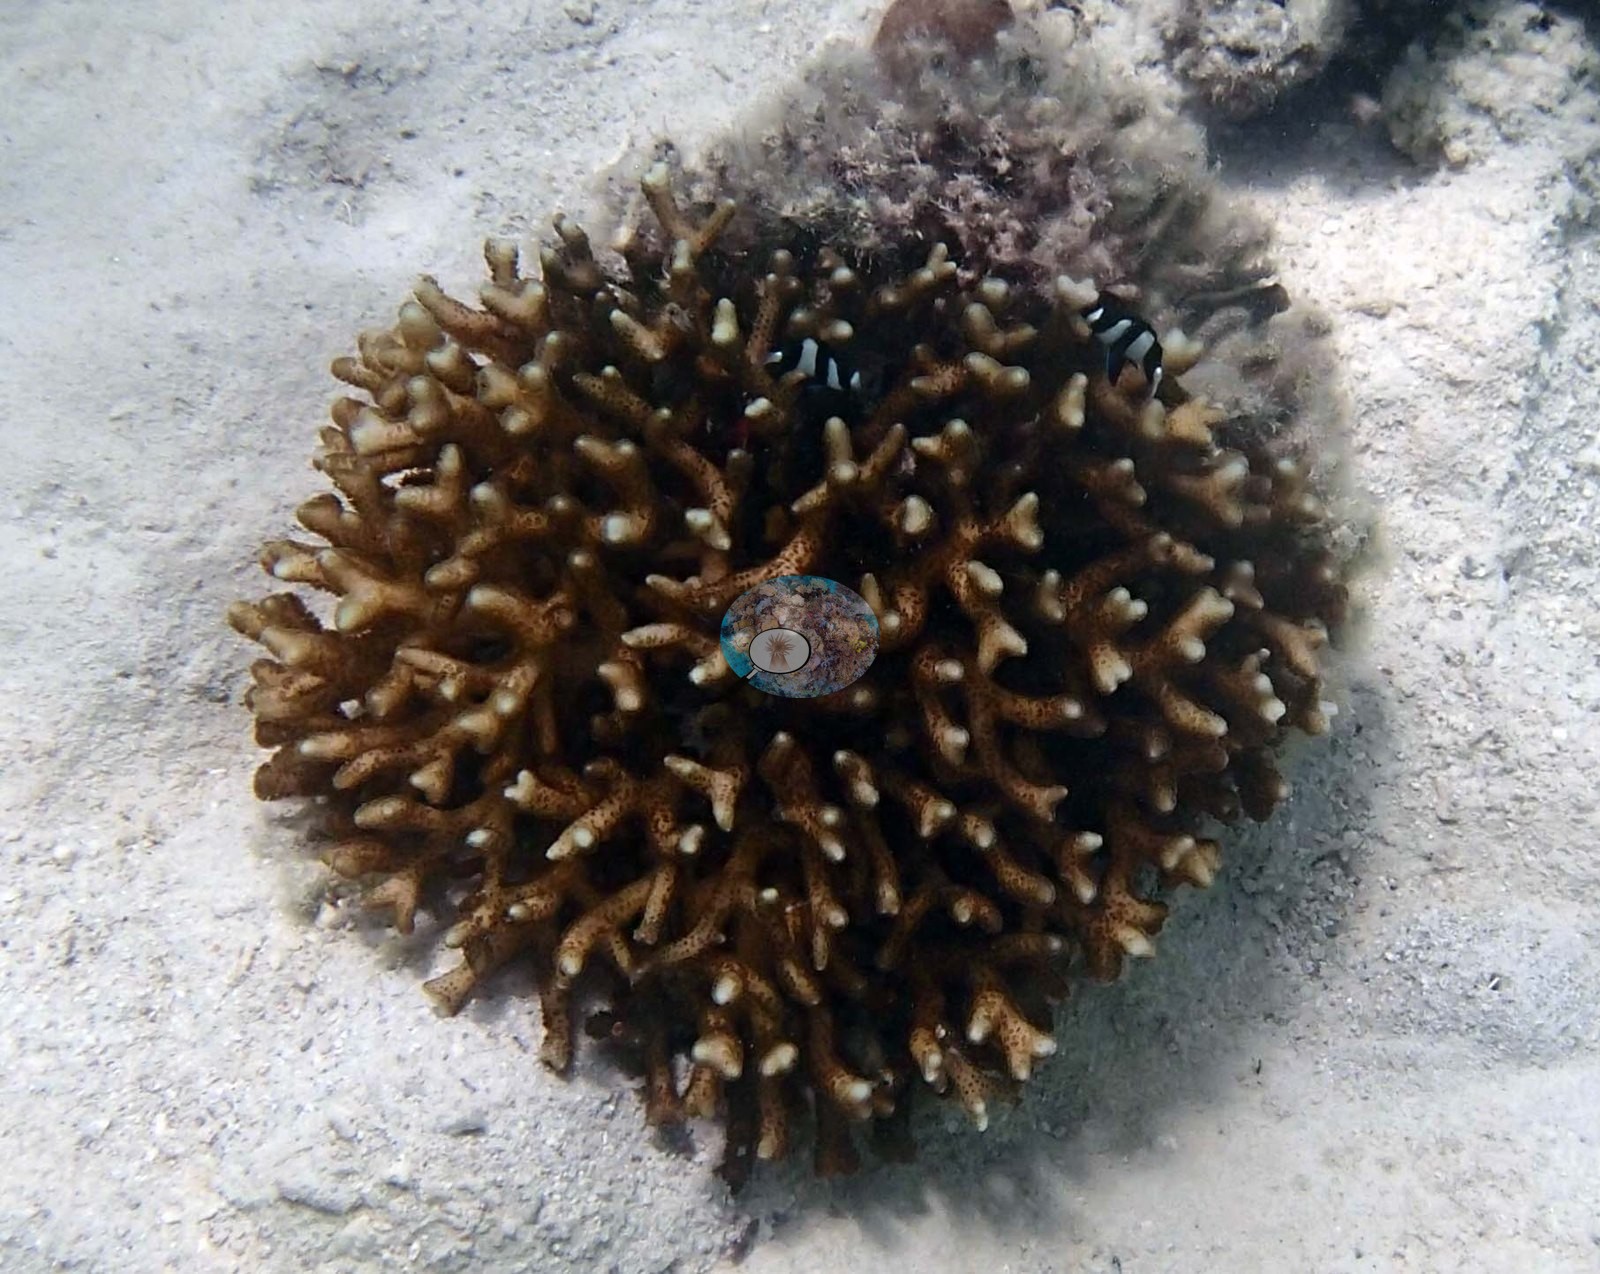
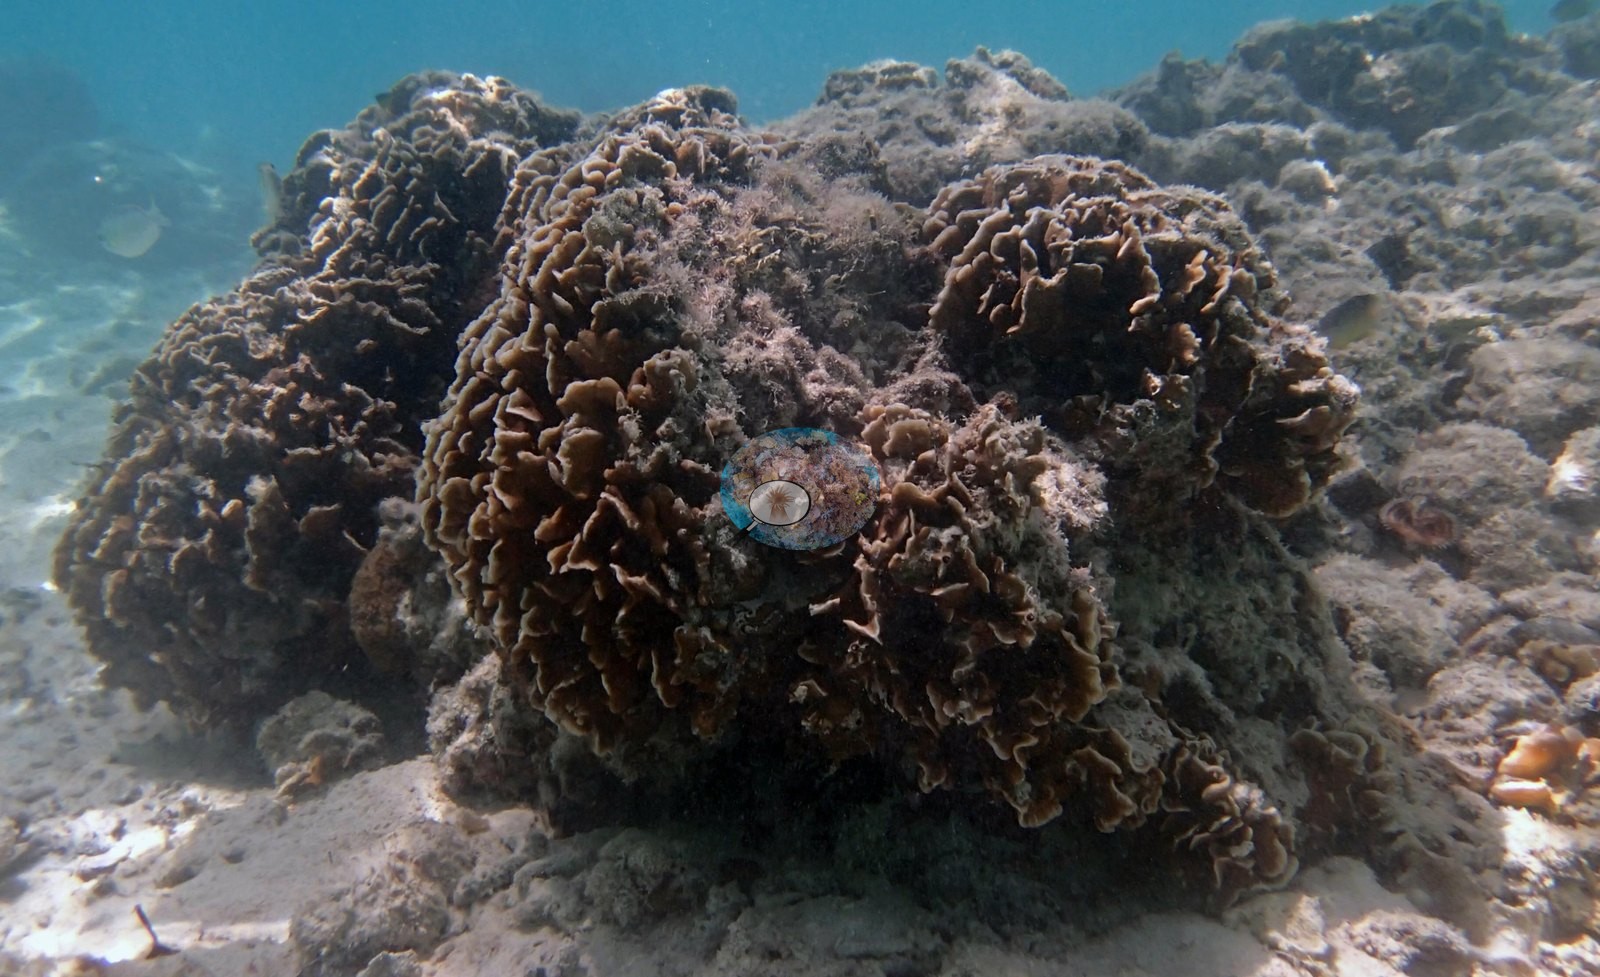
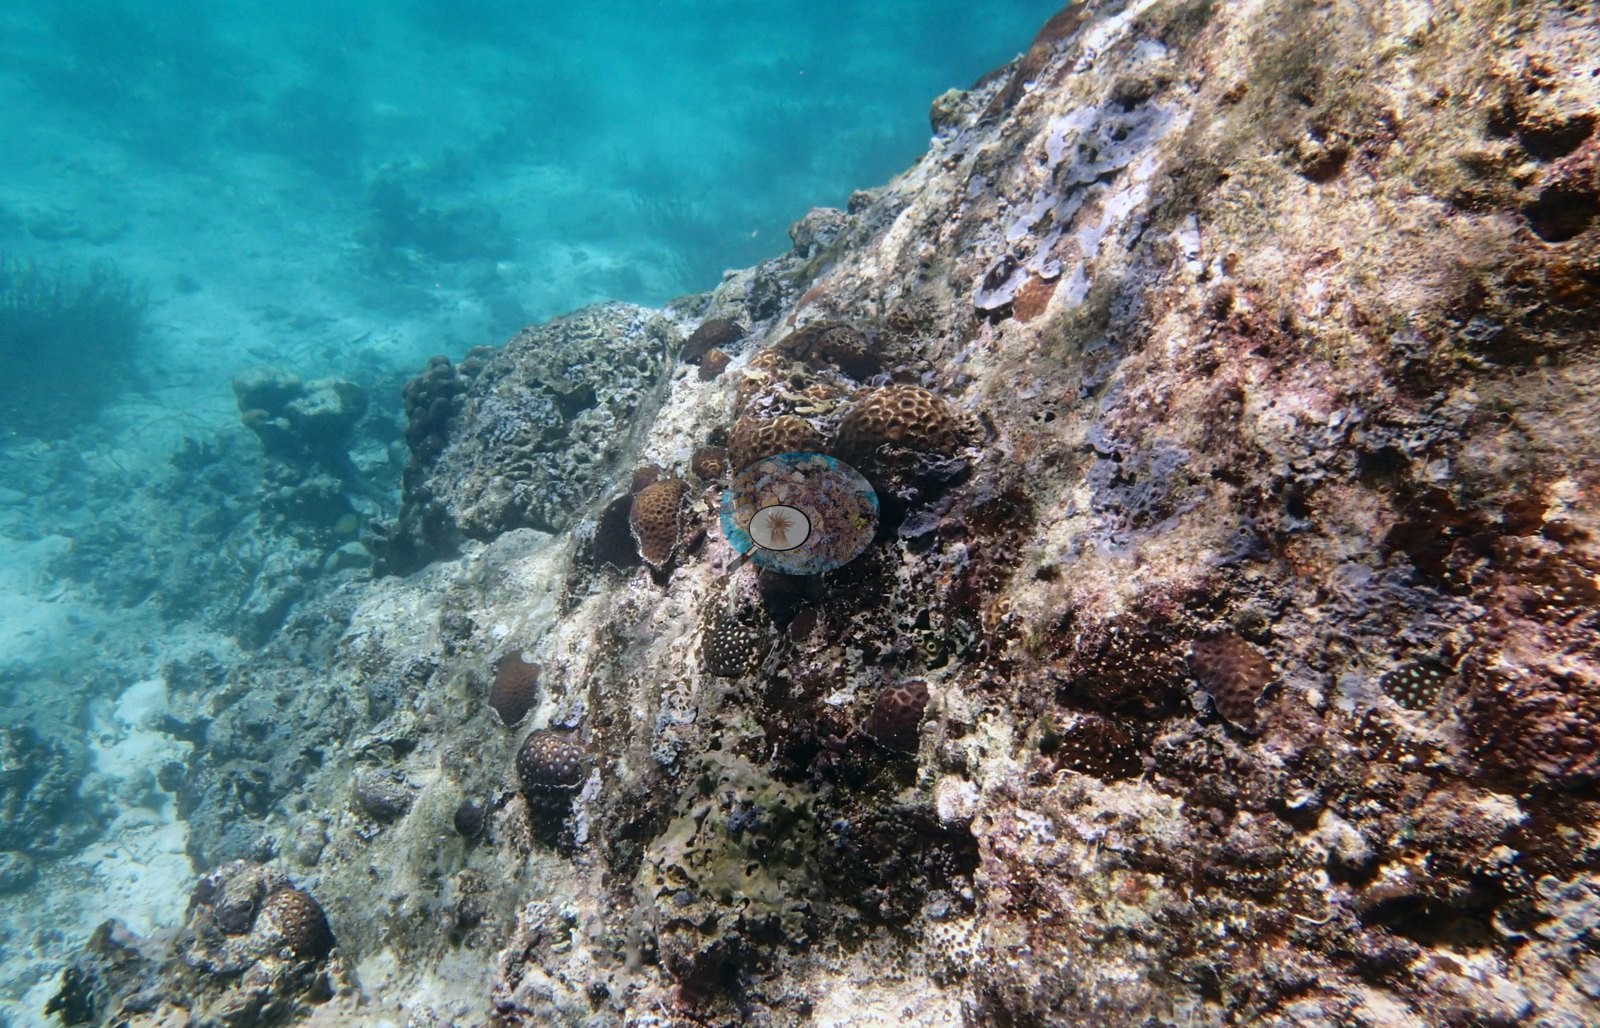
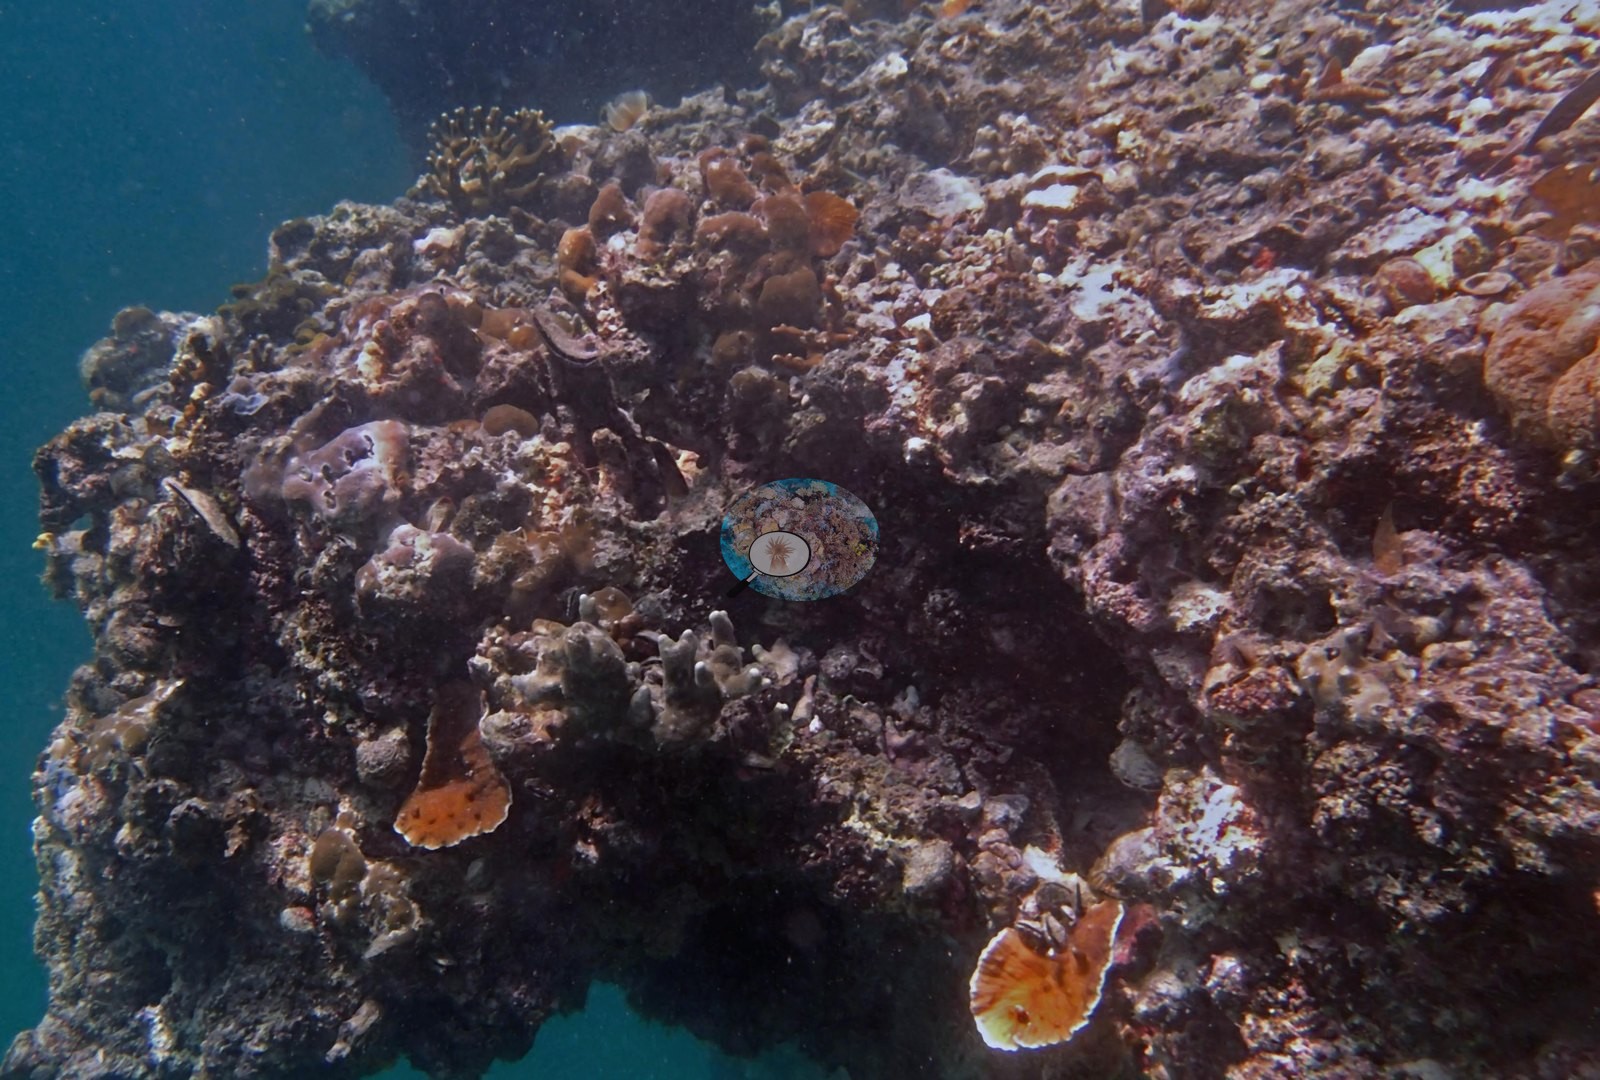
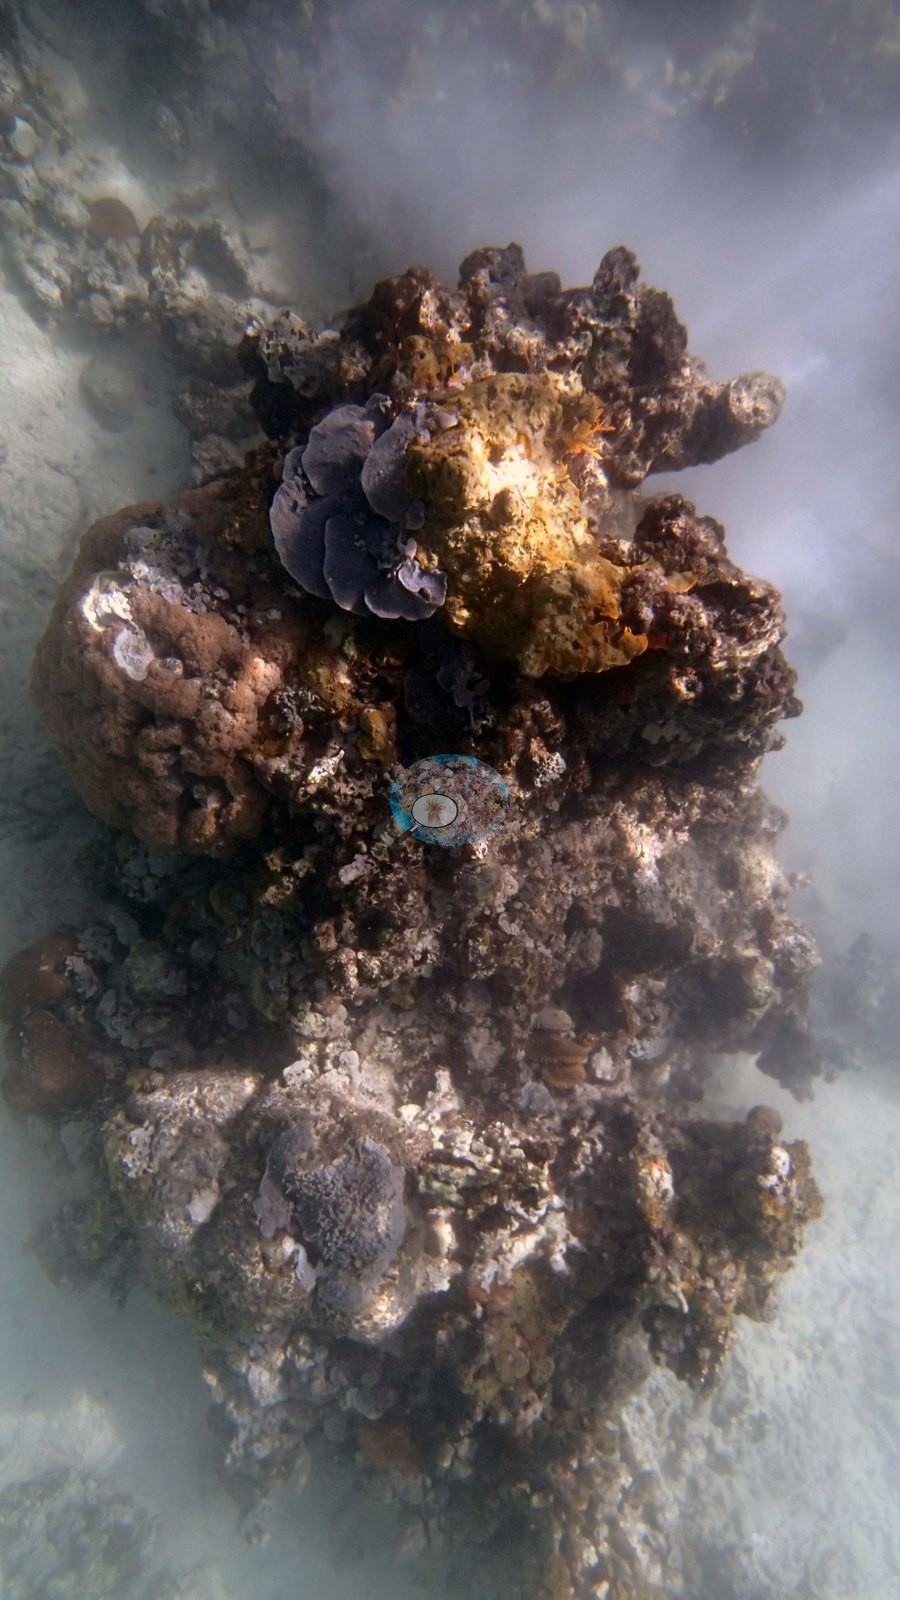
Shallow coral grows on the lagoon walls and floor, with Seriatopora and Pocillopora acuta among the frames (e.g., Image 1, Image 2, Image 4, Image 5, Image 7).
Coral cover
Unlike the Coron wreck and El Nido pins nearby, this stop has no DINOv3 pass of its own, so the figure rests on a single method with nothing to cross-check it. Coral cover: 23% — a single-method photographic index. The figure is a CoralSCOP computer vision over 8 frames of Anderson's own photographs, with no second method to cross-check it. CoralSCOP sums retained mask fractions with overlaps possible and segments coral-shaped objects rather than living tissue, so it scores standing dead skeleton as coral and does not measure cover the way a transect does. Against independent point-count surveys it reads high, and the bias is ADDITIVE rather than multiplicative: against 273,968 Catlin Seaview photoquadrats within 2 km of these pins, the relationship is close to his value = their value + about 18 percentage points, with the index appearing to have a floor near 15-20% - it does not report near-zero even where a 50-point count finds 1.0-3.0%. Read a low figure here as an upper bound and a near-zero reef as unresolved, not as the number shown. Anderson considers this CoralSCOP and DINOv3 figure a work in progress and will replace it as soon as a better coral-cover CV model turns up.
Stressors
No crown-of-thorns starfish (COTS) or other corallivores evident.
Comparisons with other data
No independent survey was made at this exact site; the nearest ones are listed in the table below.
Other notes
Position is from the photographs' own GPS (8 frames), not an estimate.
Coral cover: method notes
Independent surveys nearby
 Dr. Coral (CRD)
Within 5 km, 3 independent survey stations recorded hard coral cover in 7 surveys between 2004 and 2015. Of the 2 stations surveyed in more than one year, 2 declined between their first and latest surveys. The longest record, CYC East Reef (Reef Check, 3.60 km away), went from 73% (best patch) in 2013 to 34% in 2015. The most recent nearby survey is from 2015, so these values predate recent heat stress. This site's own estimate (23%) is indistinguishable from the range of these surveys (28–66%, excluding 1 best-patch value above 70% that is not a site mean): the 4.4-point gap is inside the ±7 percentage-point noise between methods; the methods differ, so the comparison is context, not a like-for-like test.
Collected by other programs using different methods (Reef Check uses point-intercept transects), so these are context for the figures above, not a like-for-like comparison. Where a station was surveyed more than once the range is shown. Station names are not dive-site names. Values marked best patch exceed 70%: surveyors usually chose the richest area, so they are not site means.
| Agency | Site / location | Date | Hard coral cover (%) | Distance | Link |
|---|---|---|---|---|---|
| Reef Check | Siete Pecados Islands | 2004 | 46% | 4.50 km | — |
| Reef Check | CYC East Reef | 2013–2015 | 34–73% (3 surveys) best patch | 3.60 km | — |
| Reef Check | CYC West Reef | 2013–2015 | 28–66% (3 surveys) | 3.97 km | — |
Data & links
All images from Coral Reef Diagnostics. Data are from Coral Reef Diagnostics and the organizations named in the data-sources table above.
© Coral Reef Diagnostics.