
Philippines - Coron: Coral Gardens, Busuanga

Part of the regional summaries: Philippines - Palawan and Philippines
More info
Western Philippines (NOAA CRW virtual station) · Palawan/North Borneo ecoregion mean=4.0°C-heating weeksCoral Gardens is the only true reef of the Coron day, dominated by overlapping foliose and plating corals including Pachyseris (elephant-skin coral) interleaved with staghorn Acropora thickets and brain corals - high genus richness with no site-wide bleaching, despite persistently poor visibility. Cover estimate is roughly 26-35%, averaging 31%.
Three independent survey stations shown with the program’s logo — click one to see how far it is from this site.
One other CRD dive site within 5 km shown in orange — click a marker to open its page.
24 of these 25 photographs are shown beside the text that discusses them under "Site description" below.
Site description
Setting
Visibility was poor throughout; he labeled a frame terrible viz, which should temper any quantitative read of these photographs.
General benthic features
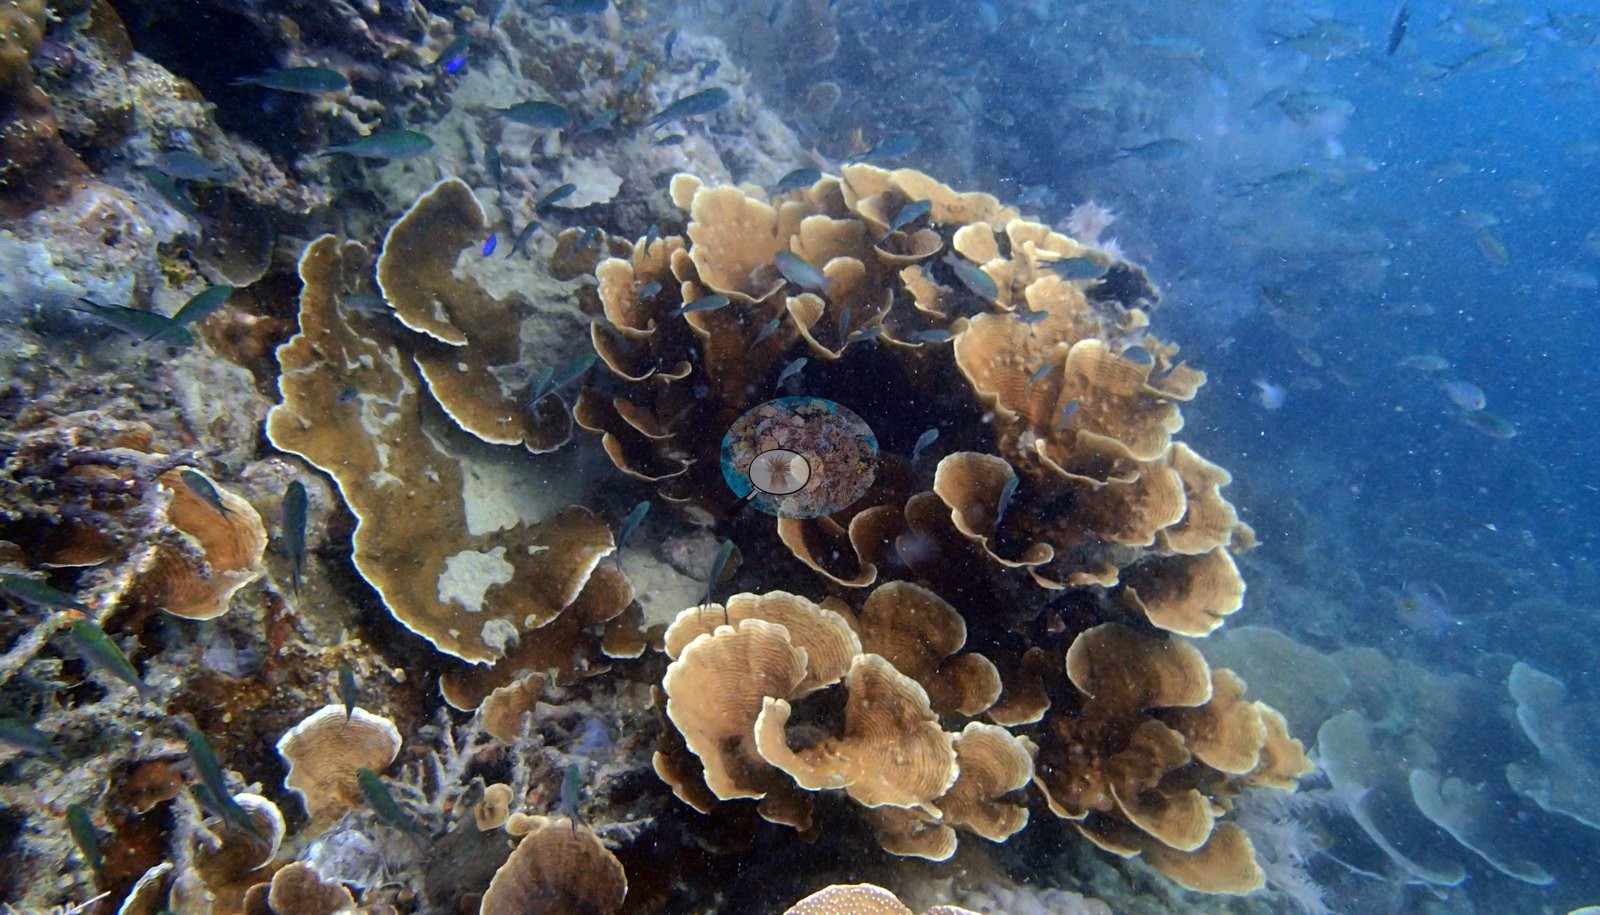
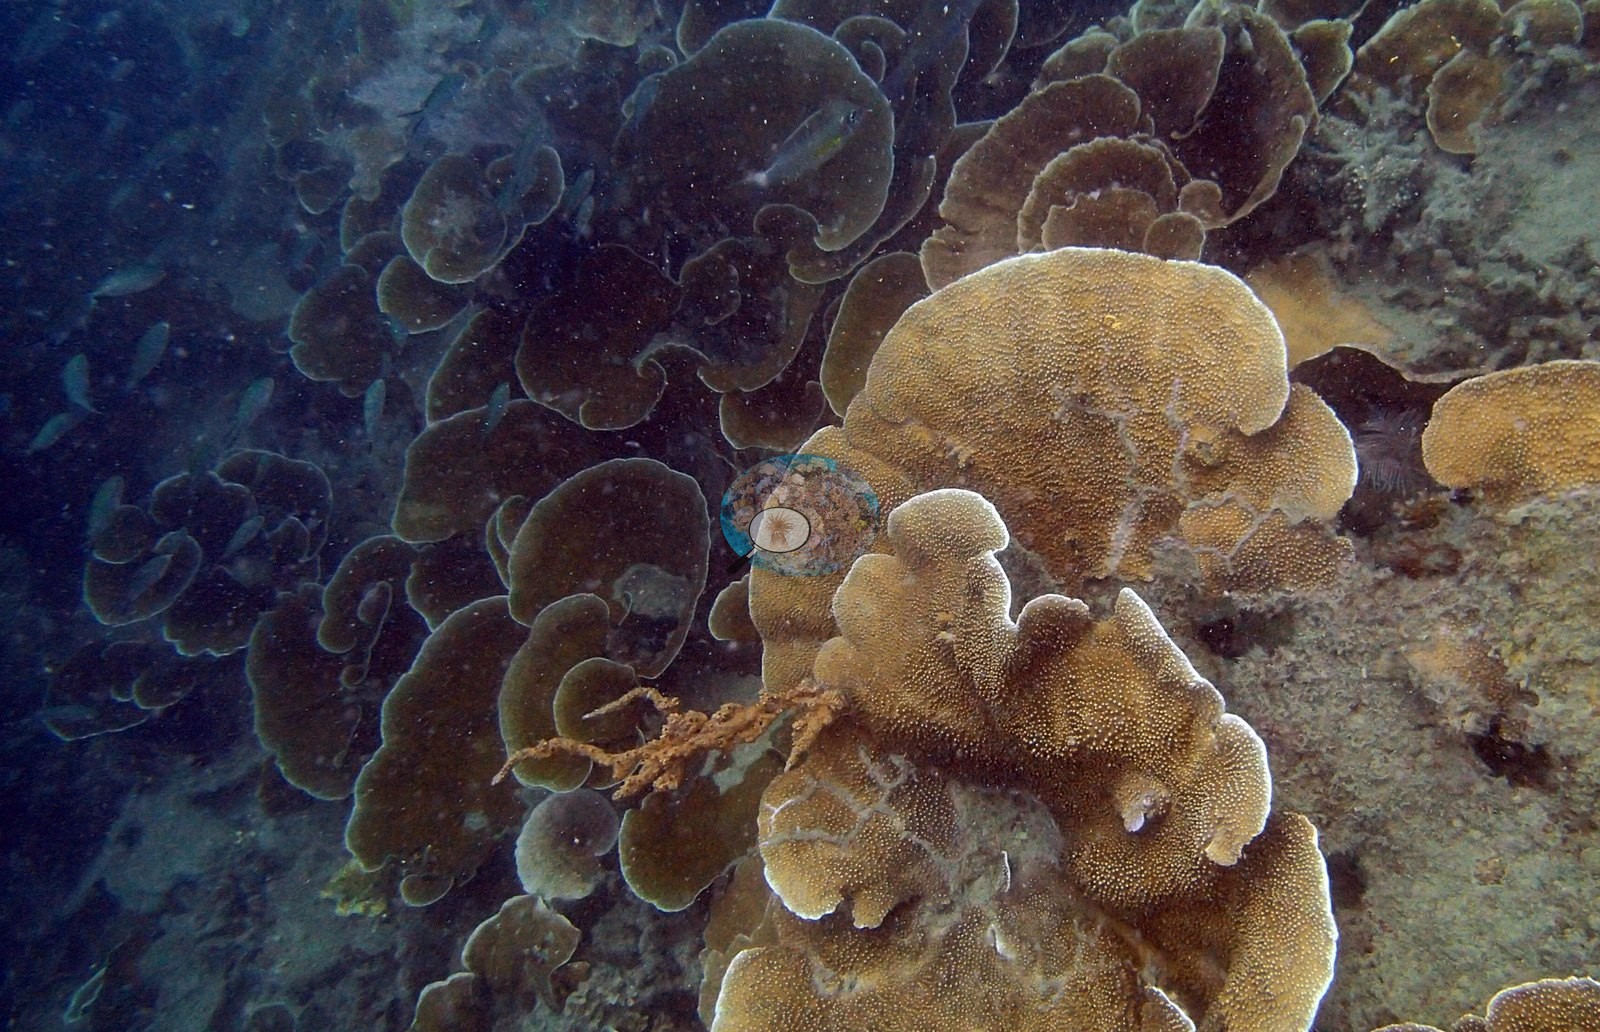
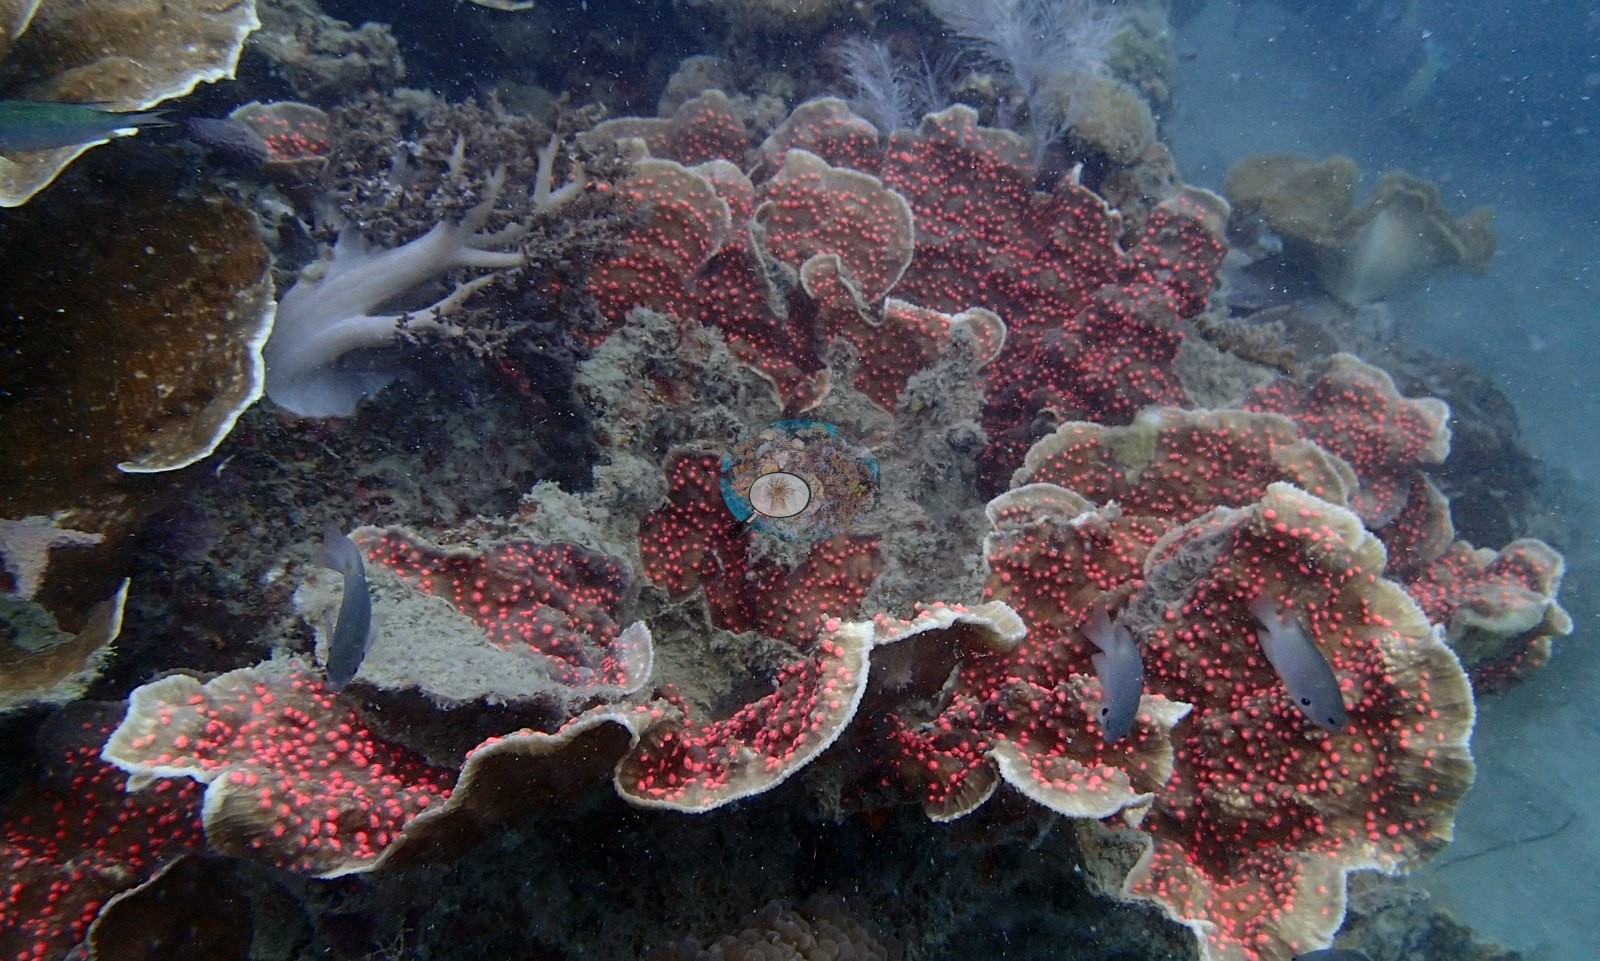
Coral Gardens is dominated by foliose and plating corals on a scale that fills nearly every wide-angle frame: overlapping whorls, scrolls, and shelves in tan, cream, and chocolate, most with clean pale growing margins, and among them colonies whose fine concentric ridging marks them as Pachyseris, the elephant-skin coral (e.g., Image 4, Image 5, Image 6, Image 7, Image 8, Image 9, Image 12, Image 14, Image 18, Image 22).
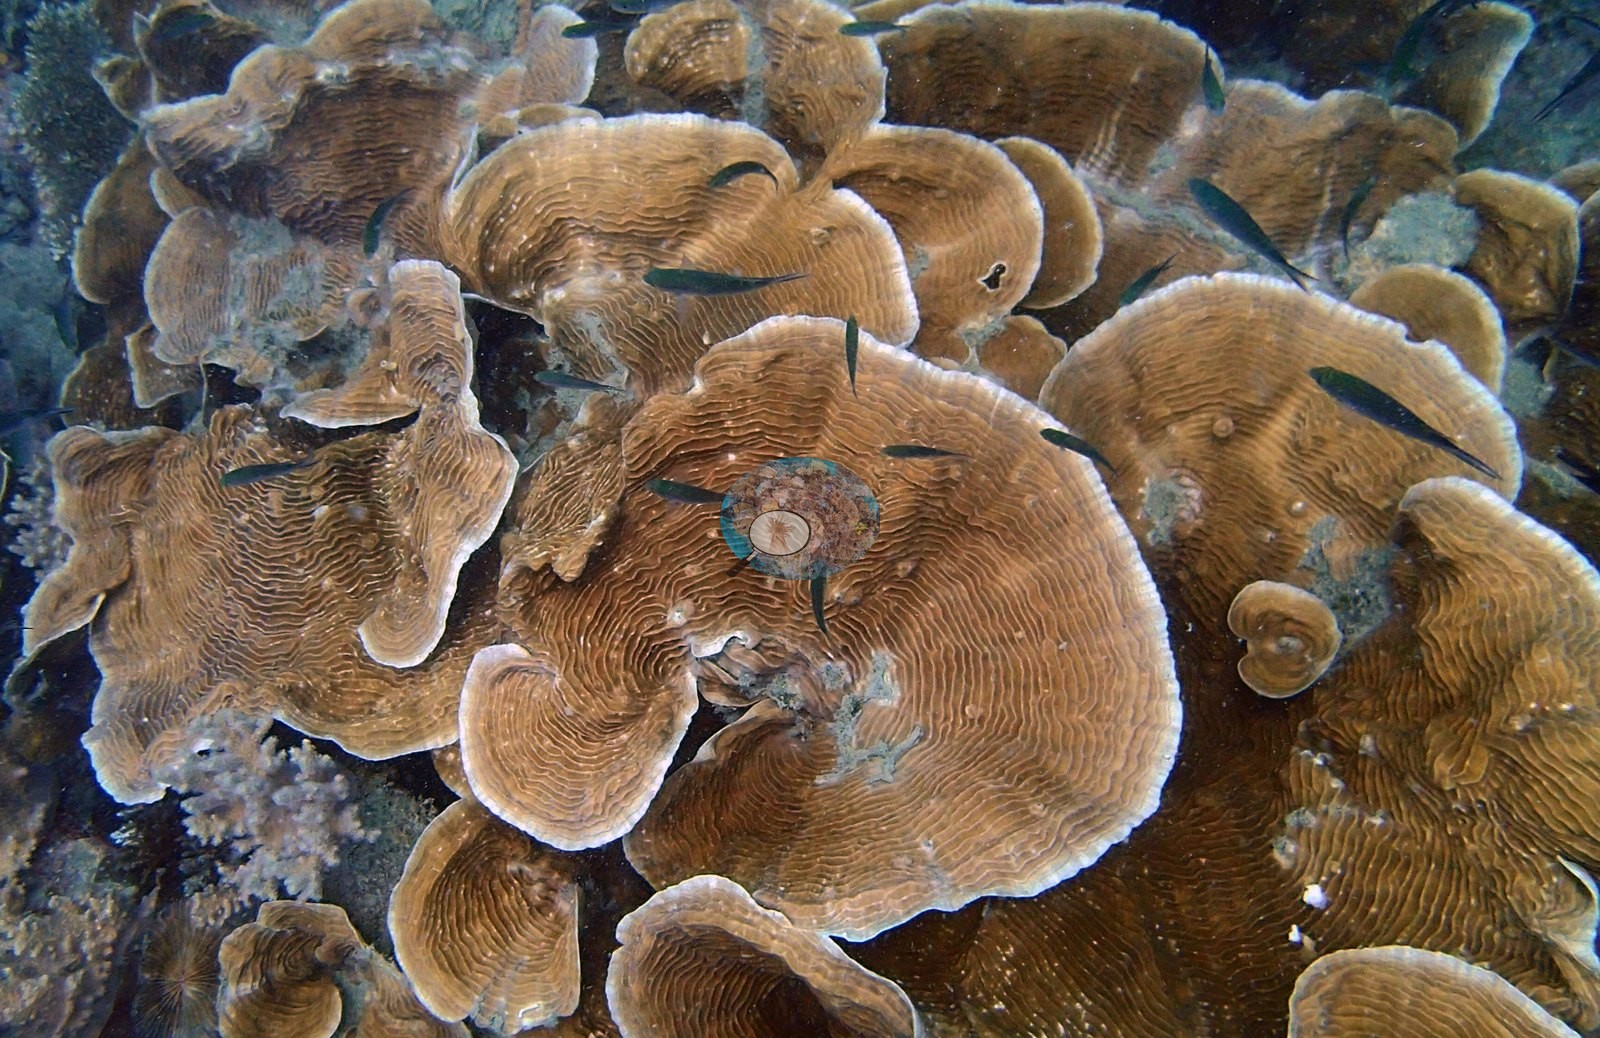
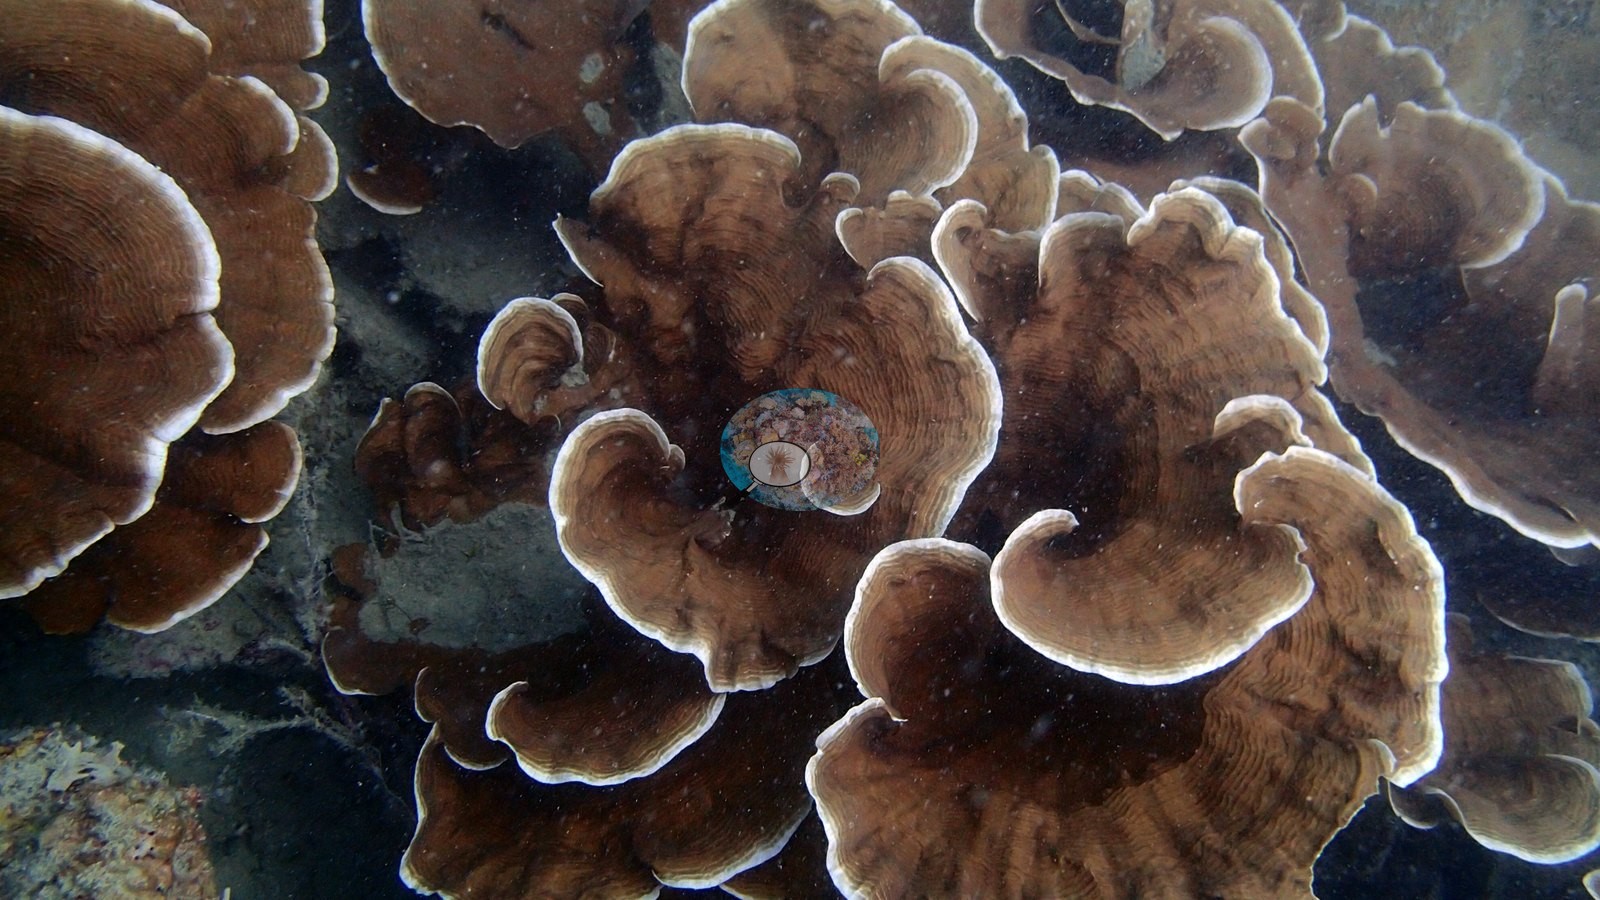
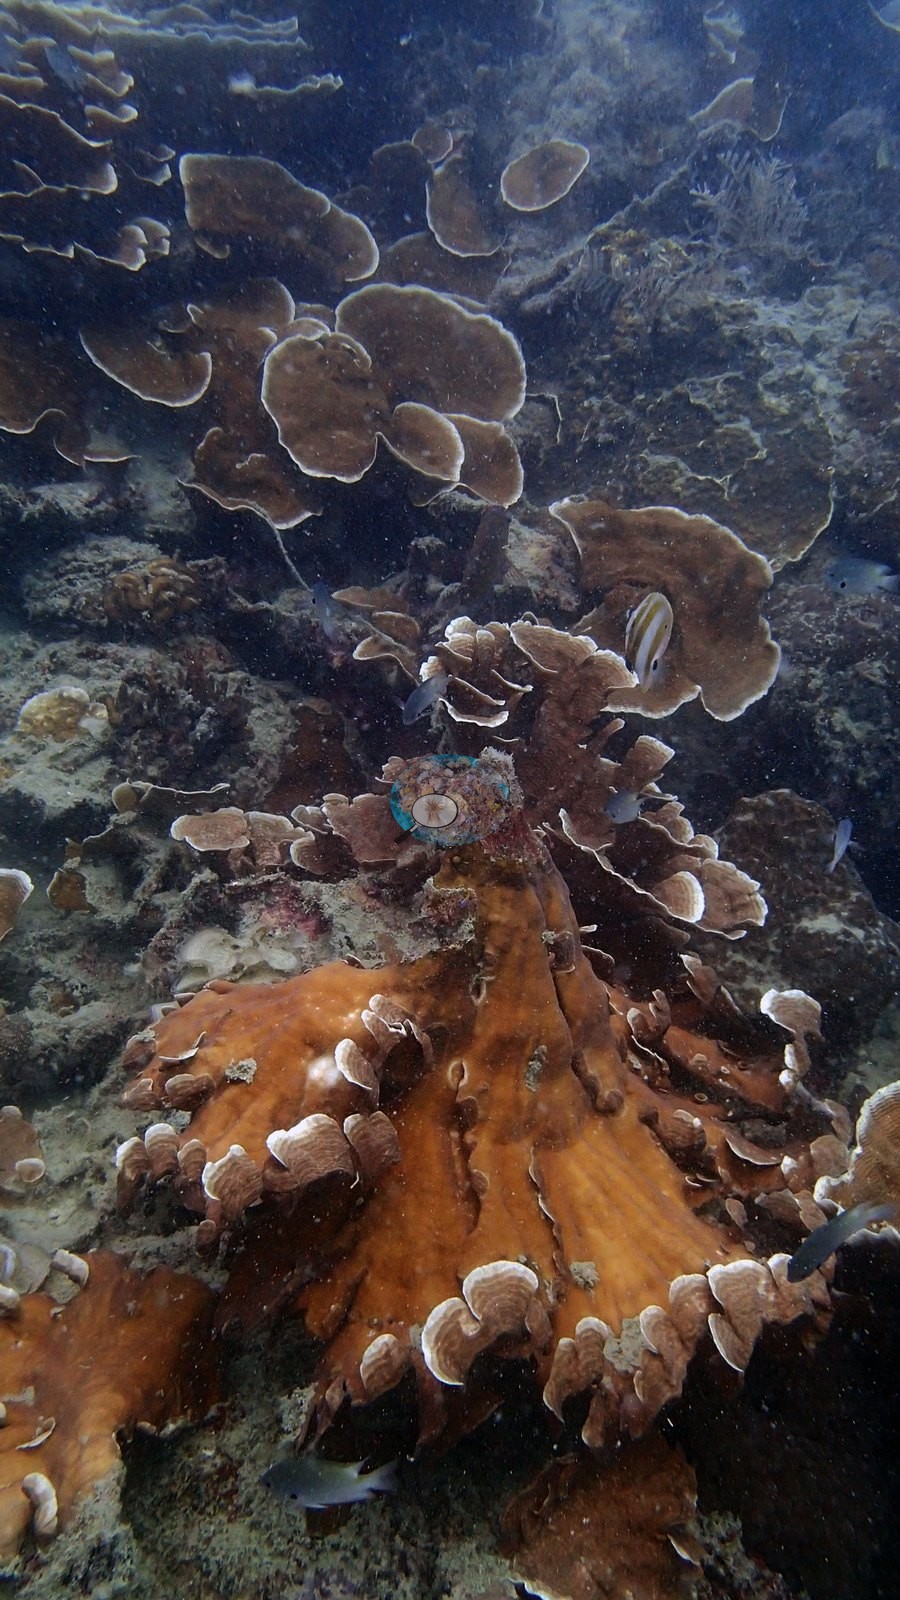
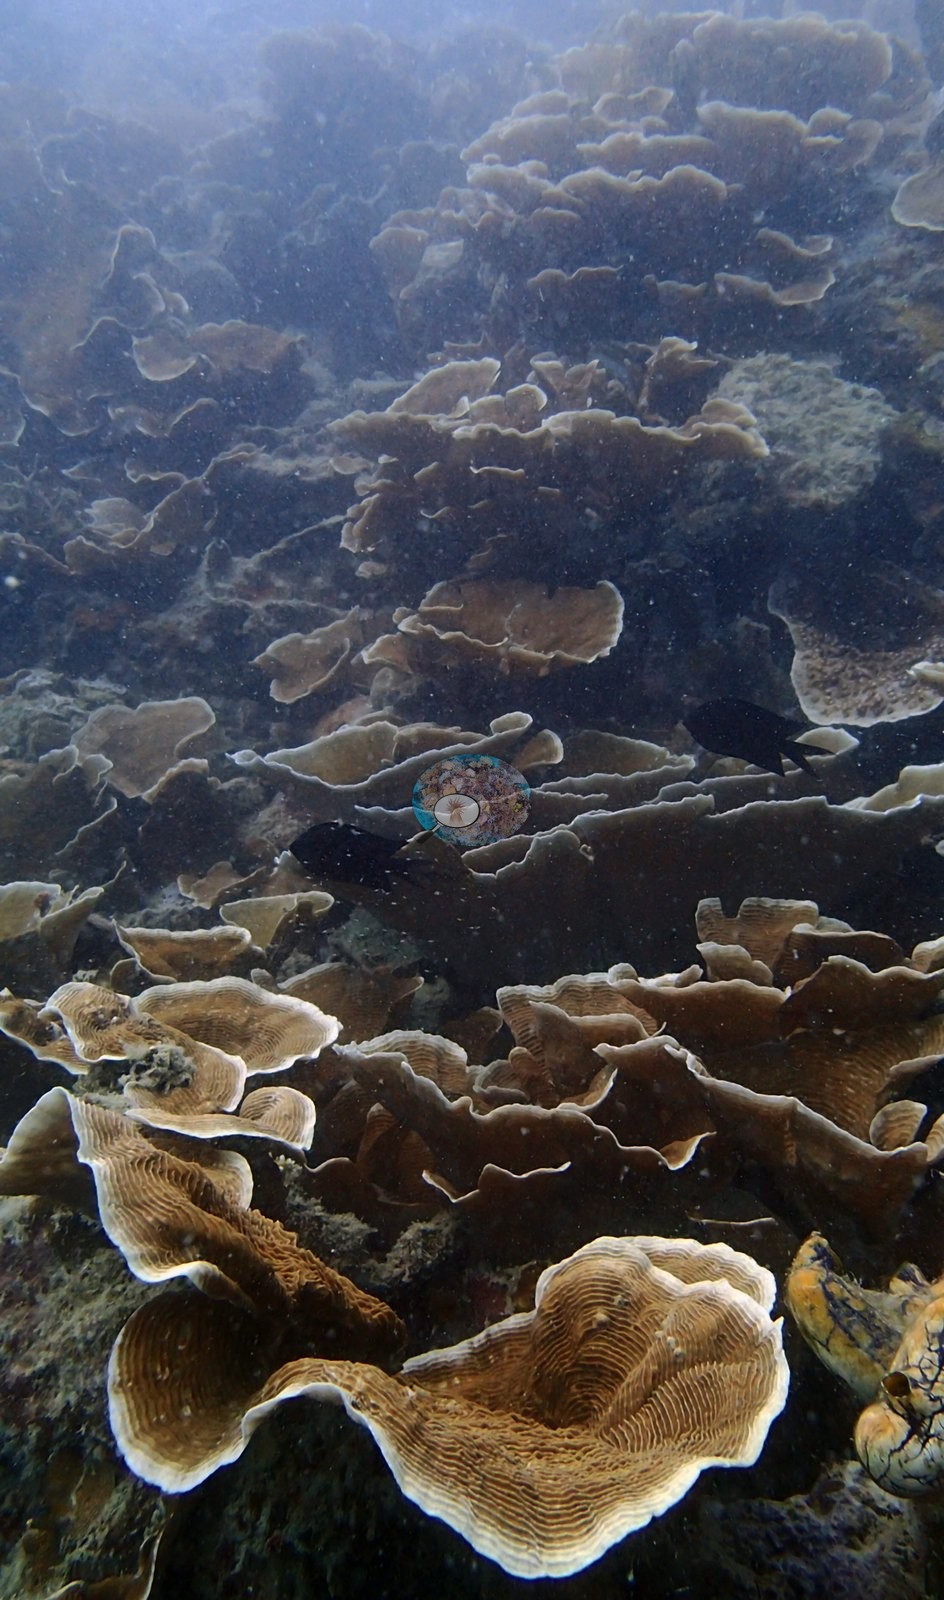
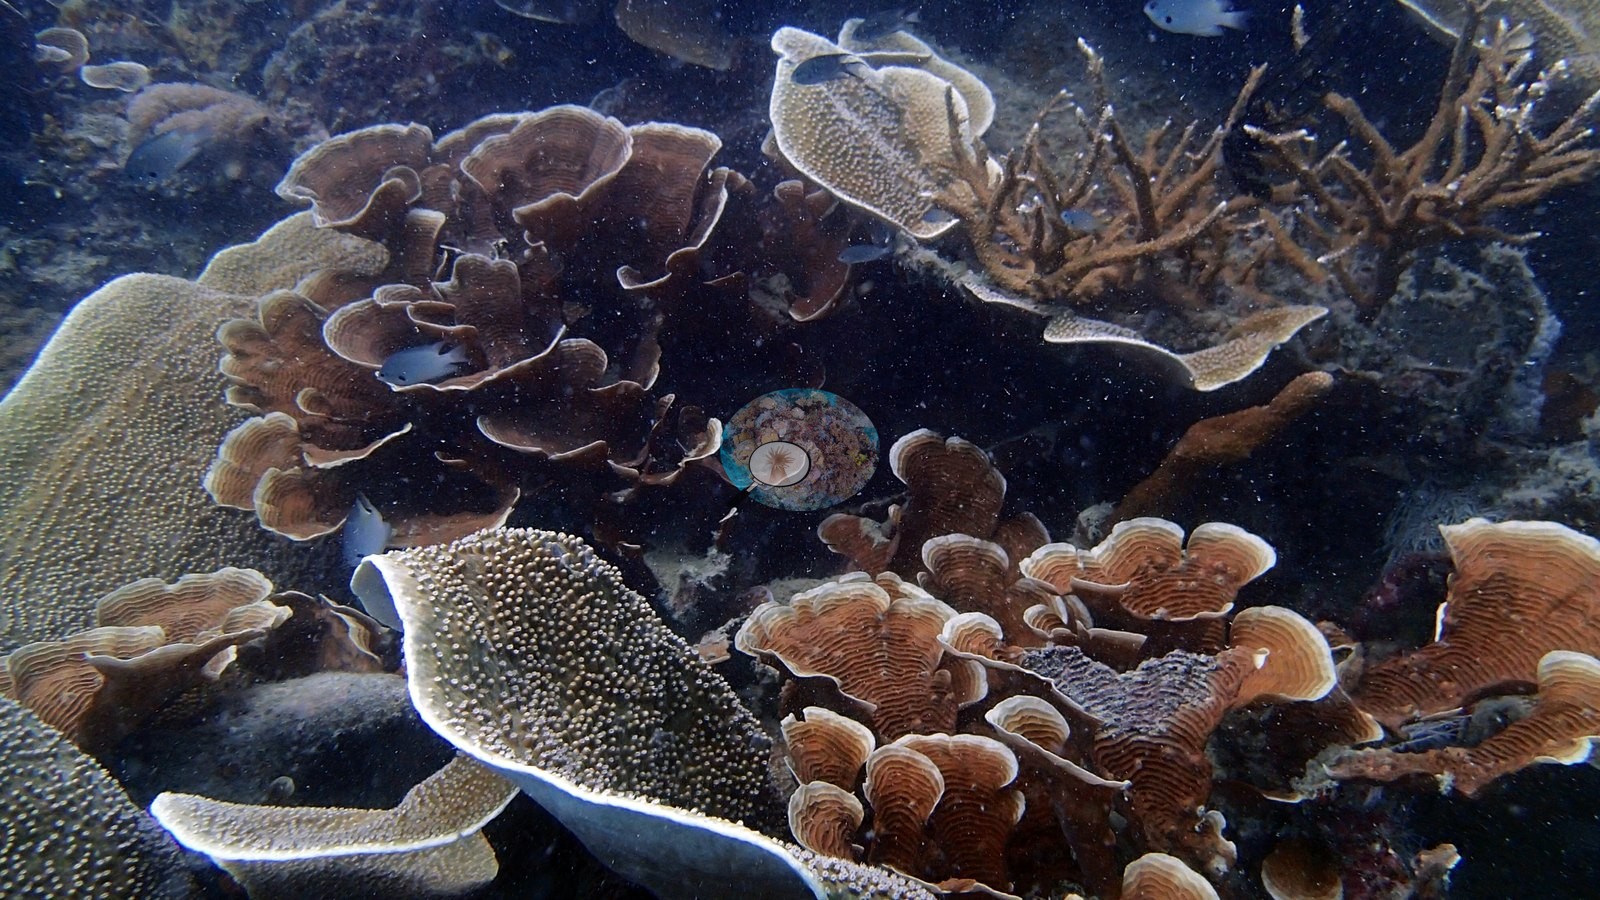
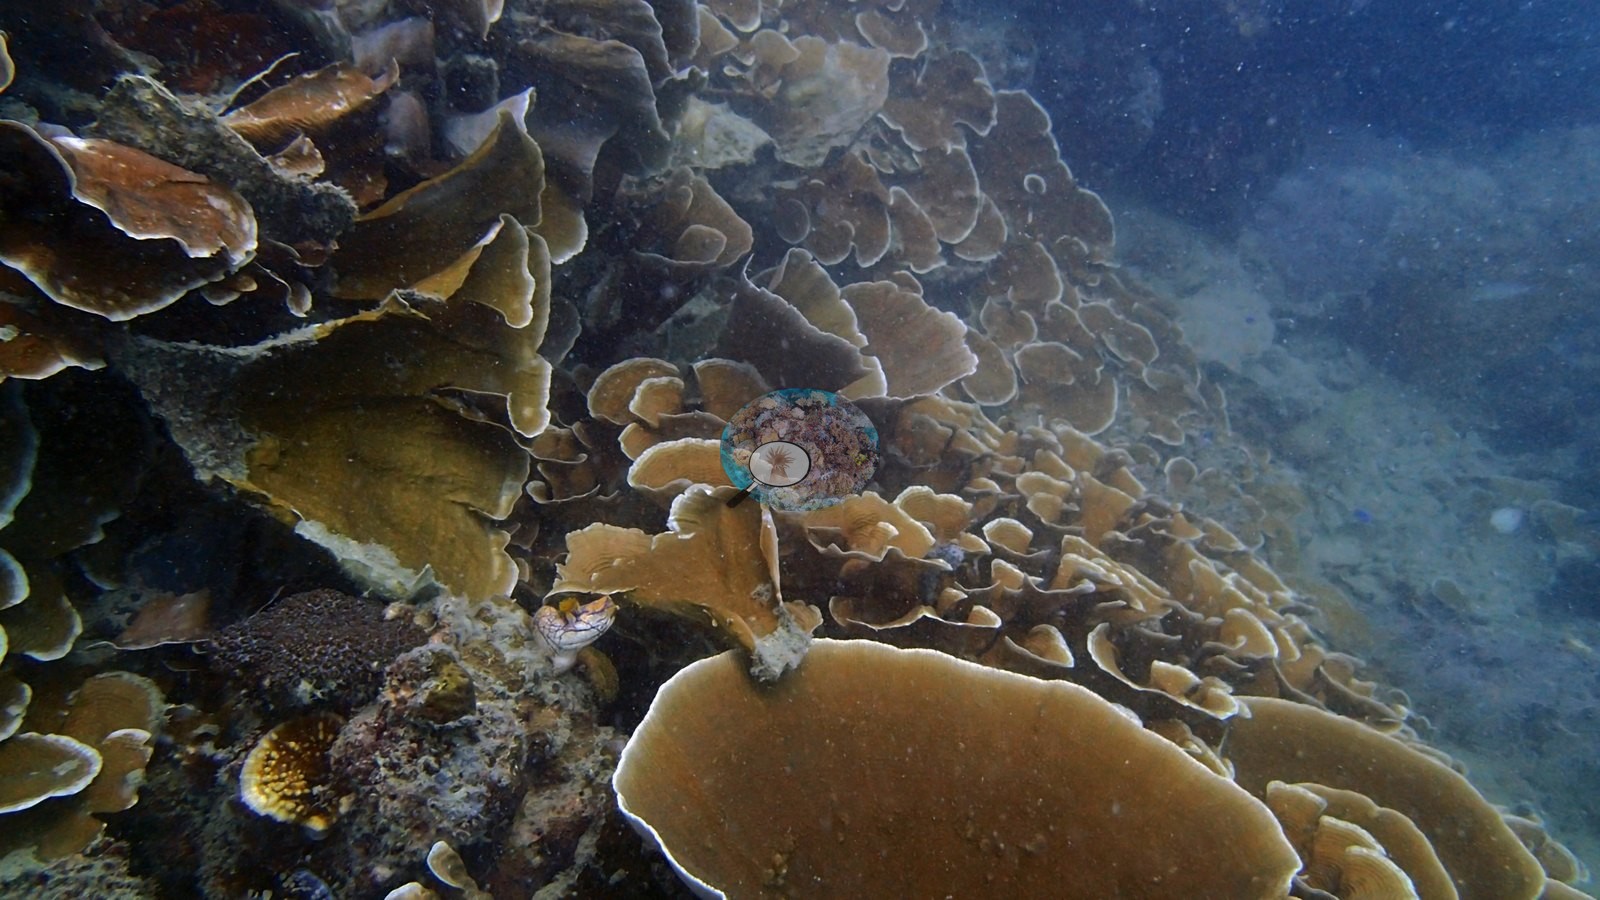
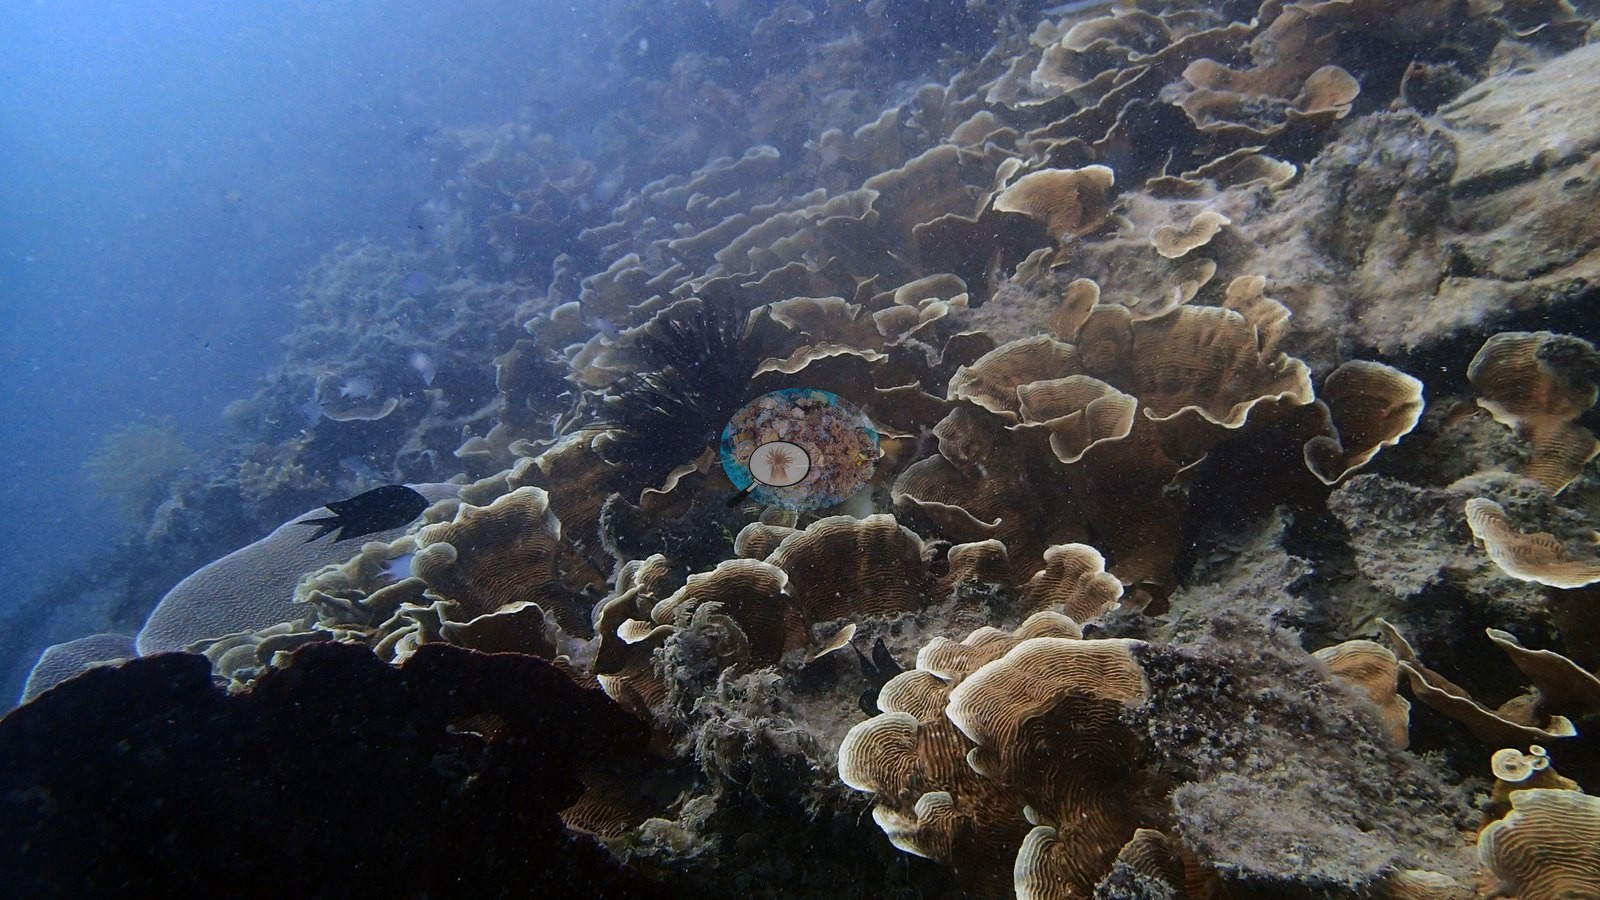
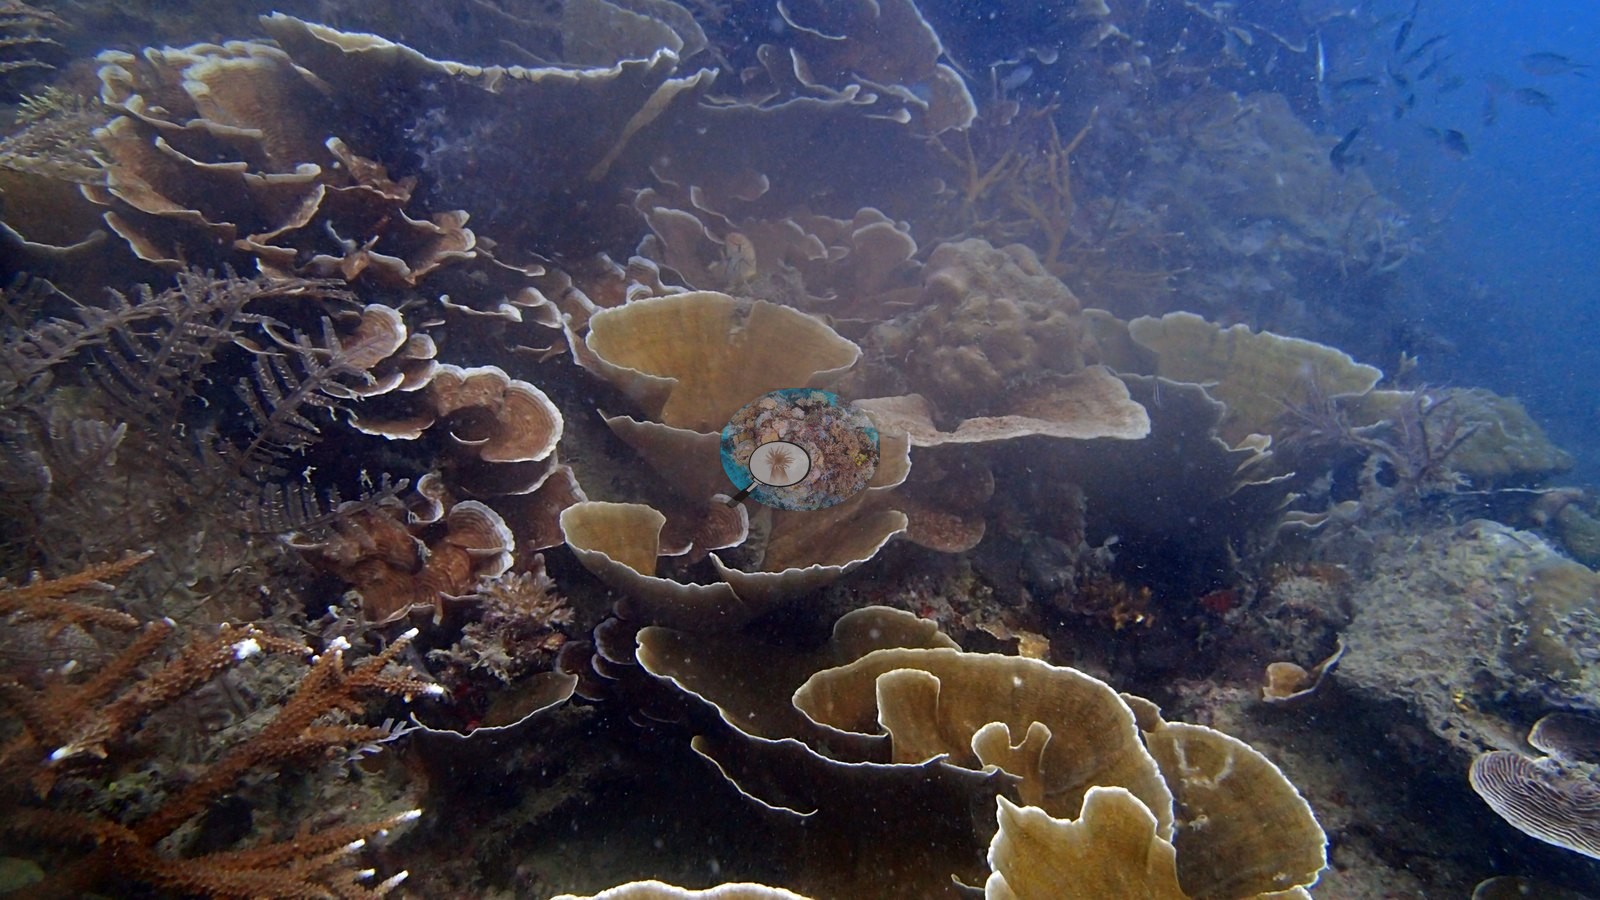
One stand of plates is speckled a striking pink-red - dense pink-red polyps against pale skeleton (e.g., Image 11).
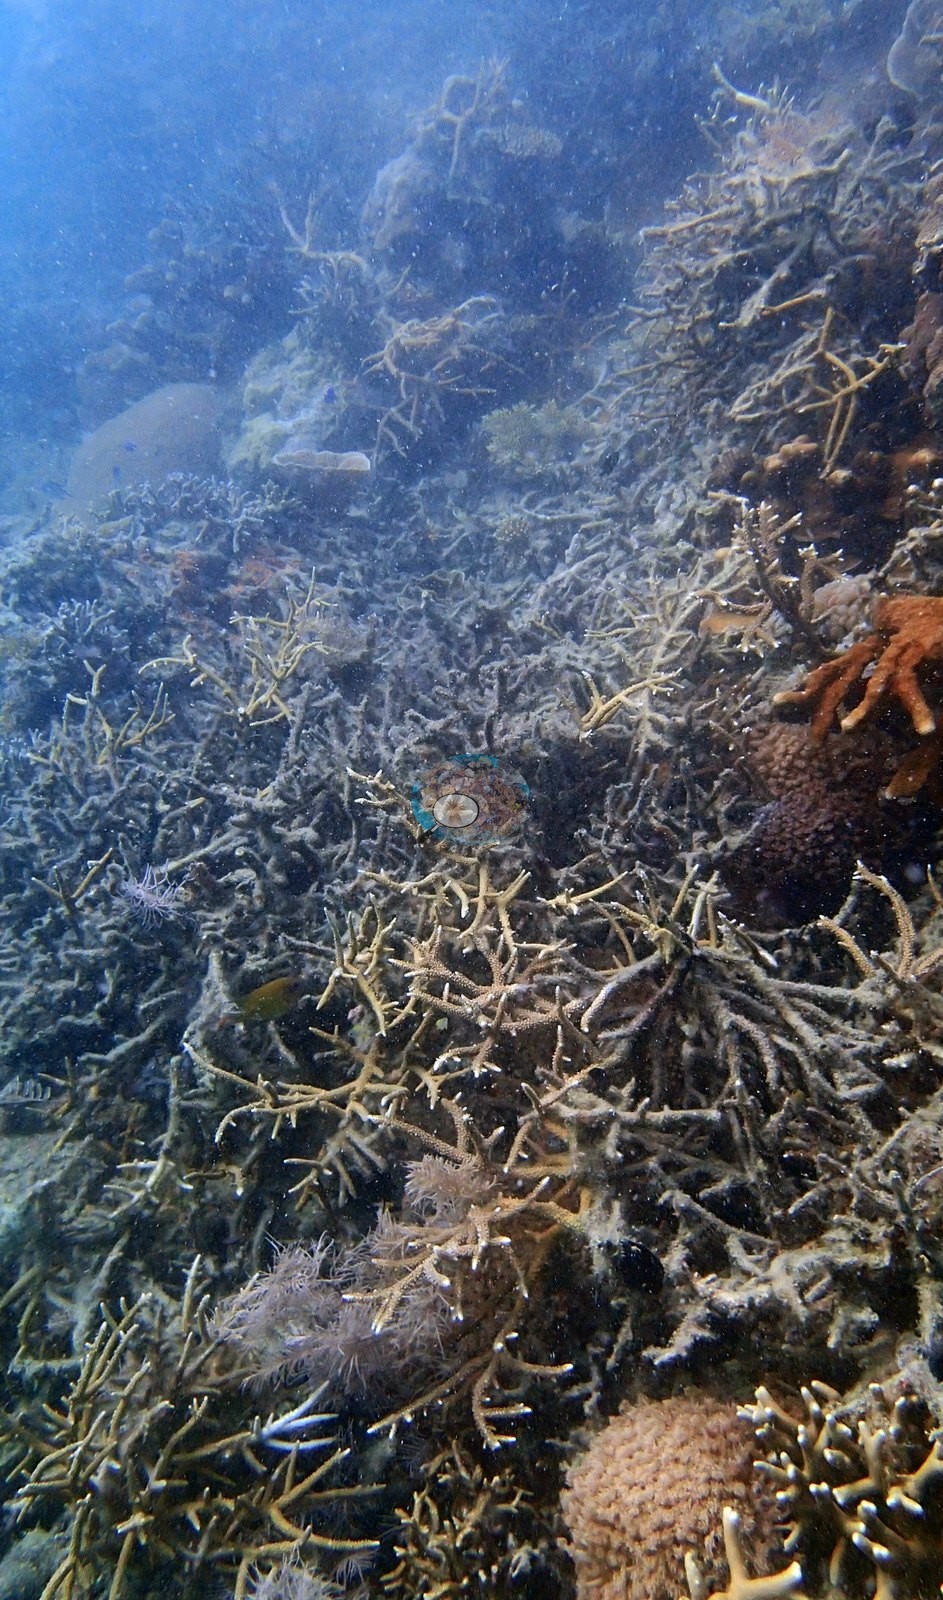
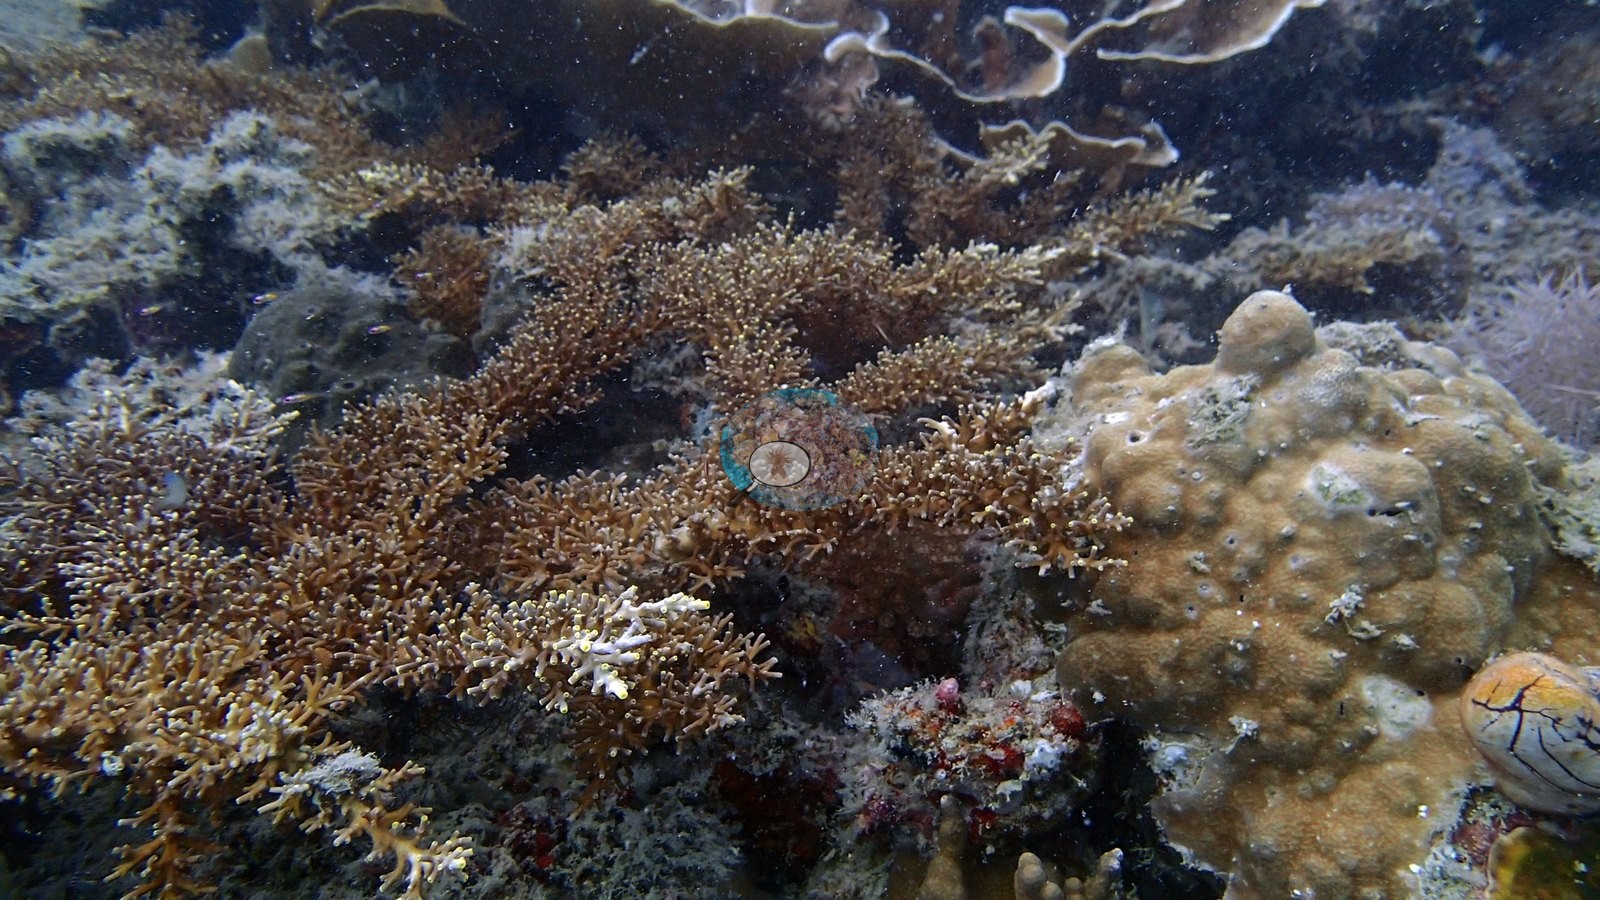
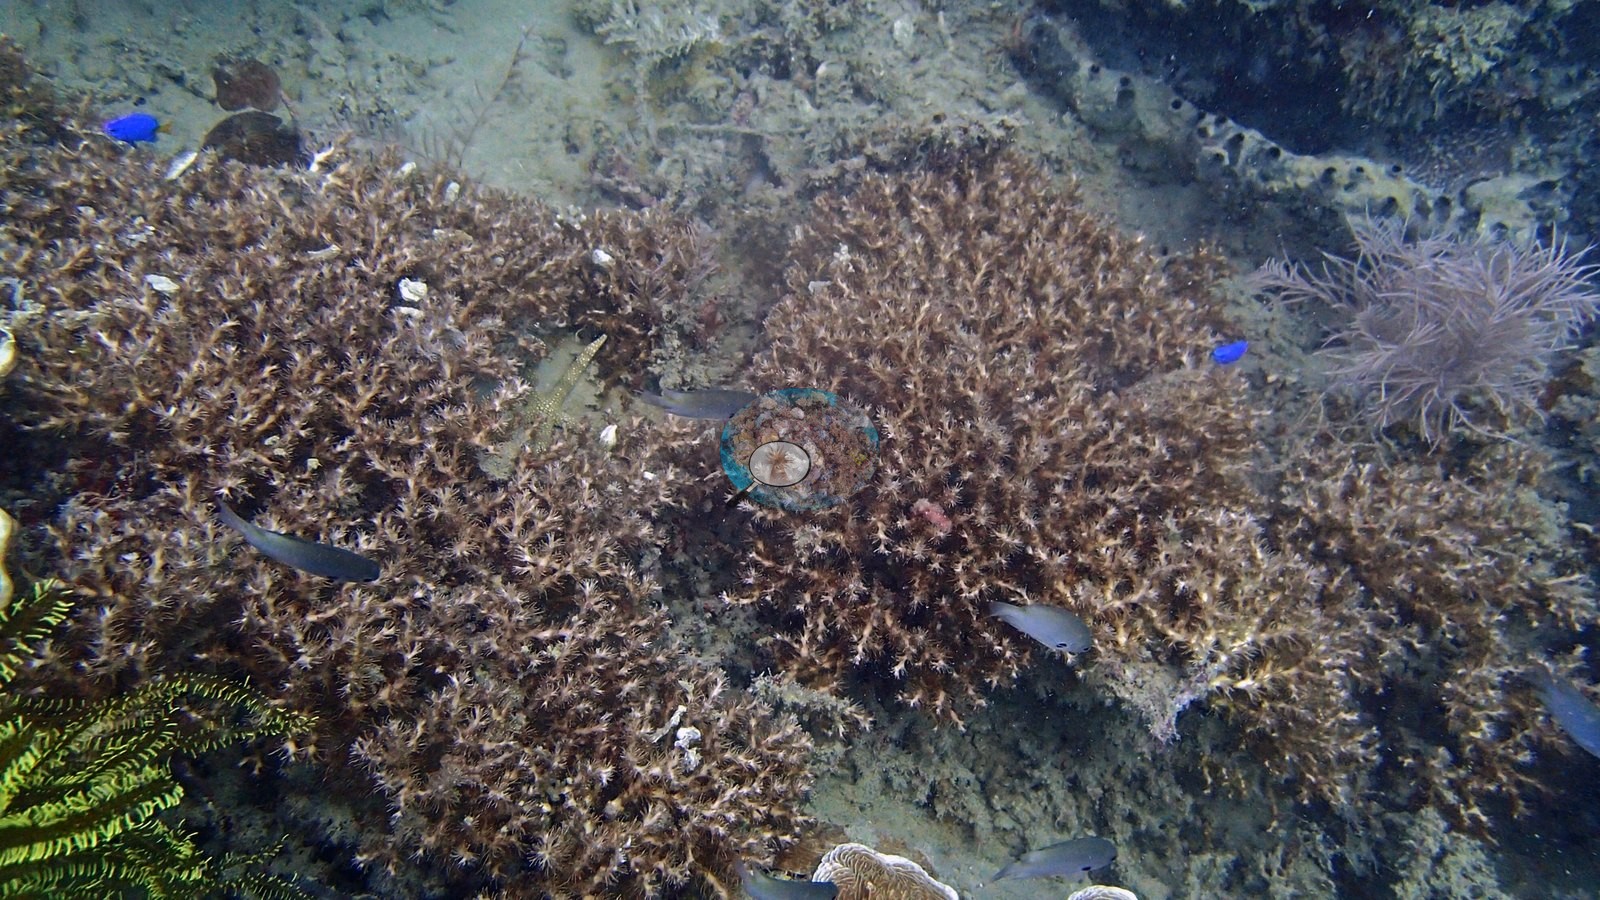
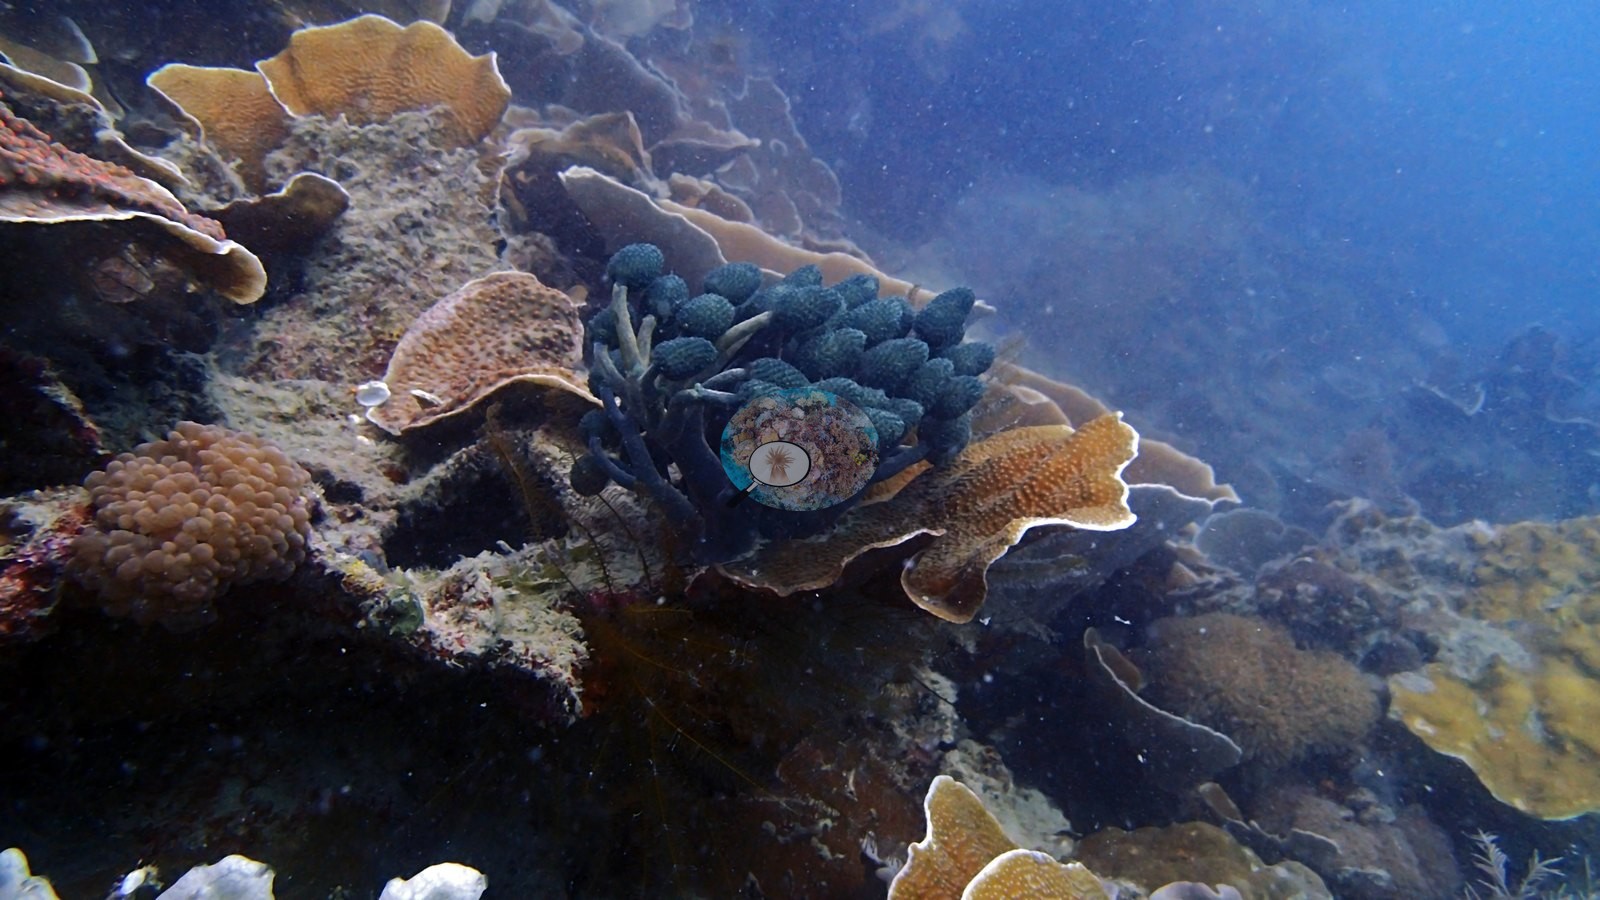
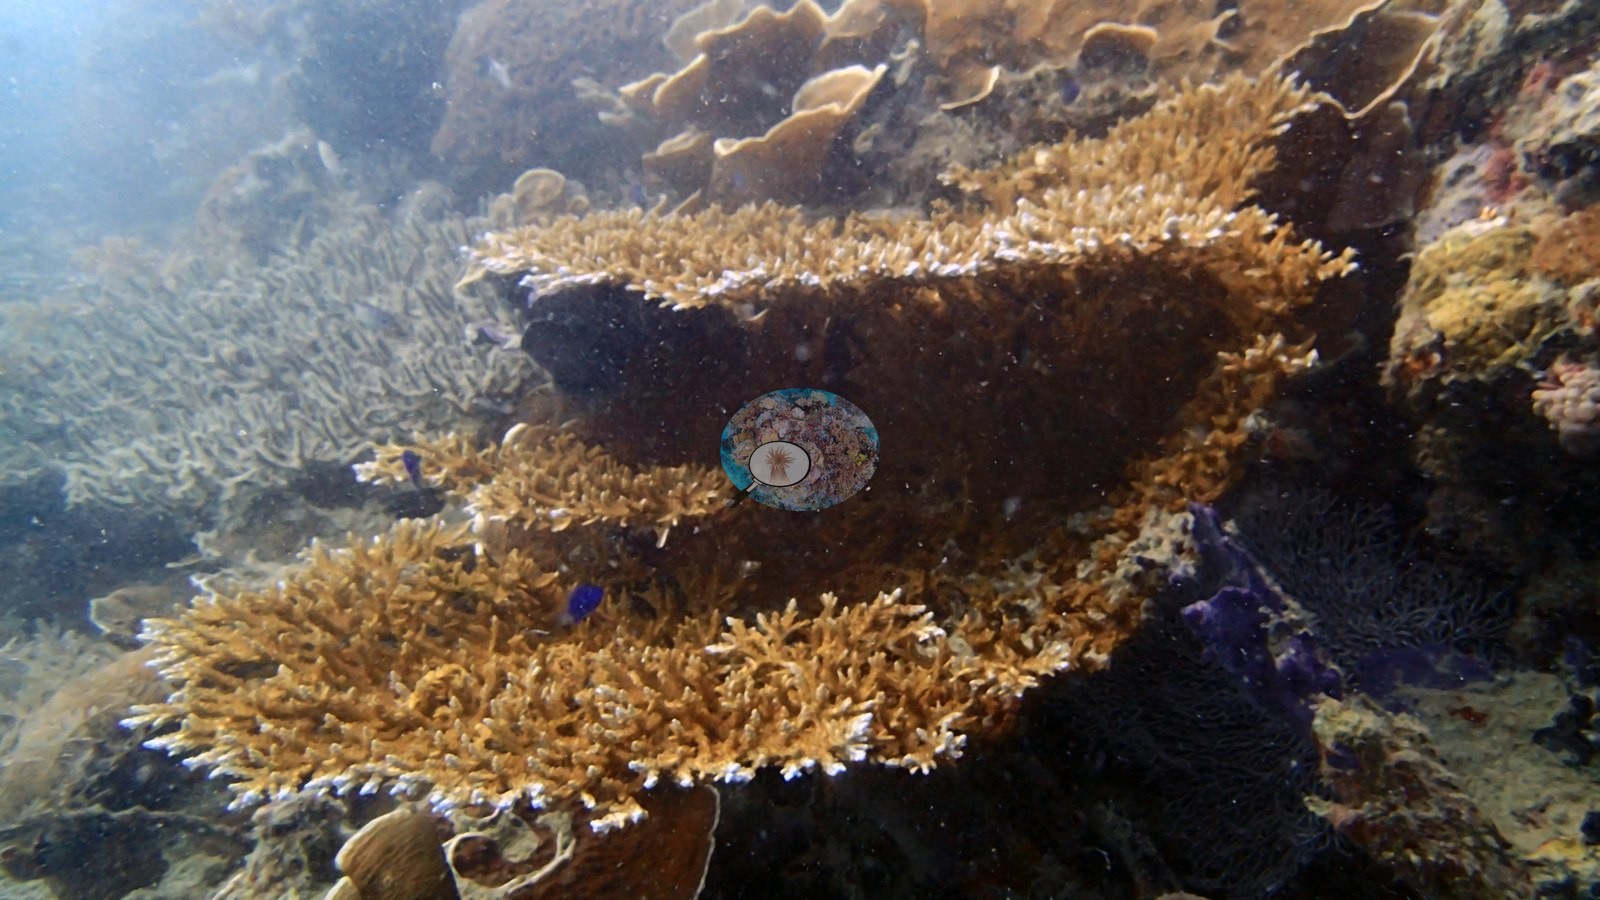
Interleaved with the plate carpet are branching and staghorn Acropora thickets, tiers of tabulate Acropora tables, brain corals, a fleshy lobed Lobophyllia-type cluster, encrusting colonies, a blue-green soft-coral bouquet, orange soft corals, crinoids, and a large gorgonian sea fan (e.g., Image 1, Image 2, Image 13, Image 15, Image 16, Image 17, Image 19, Image 20, Image 21, Image 23, Image 24, Image 25).
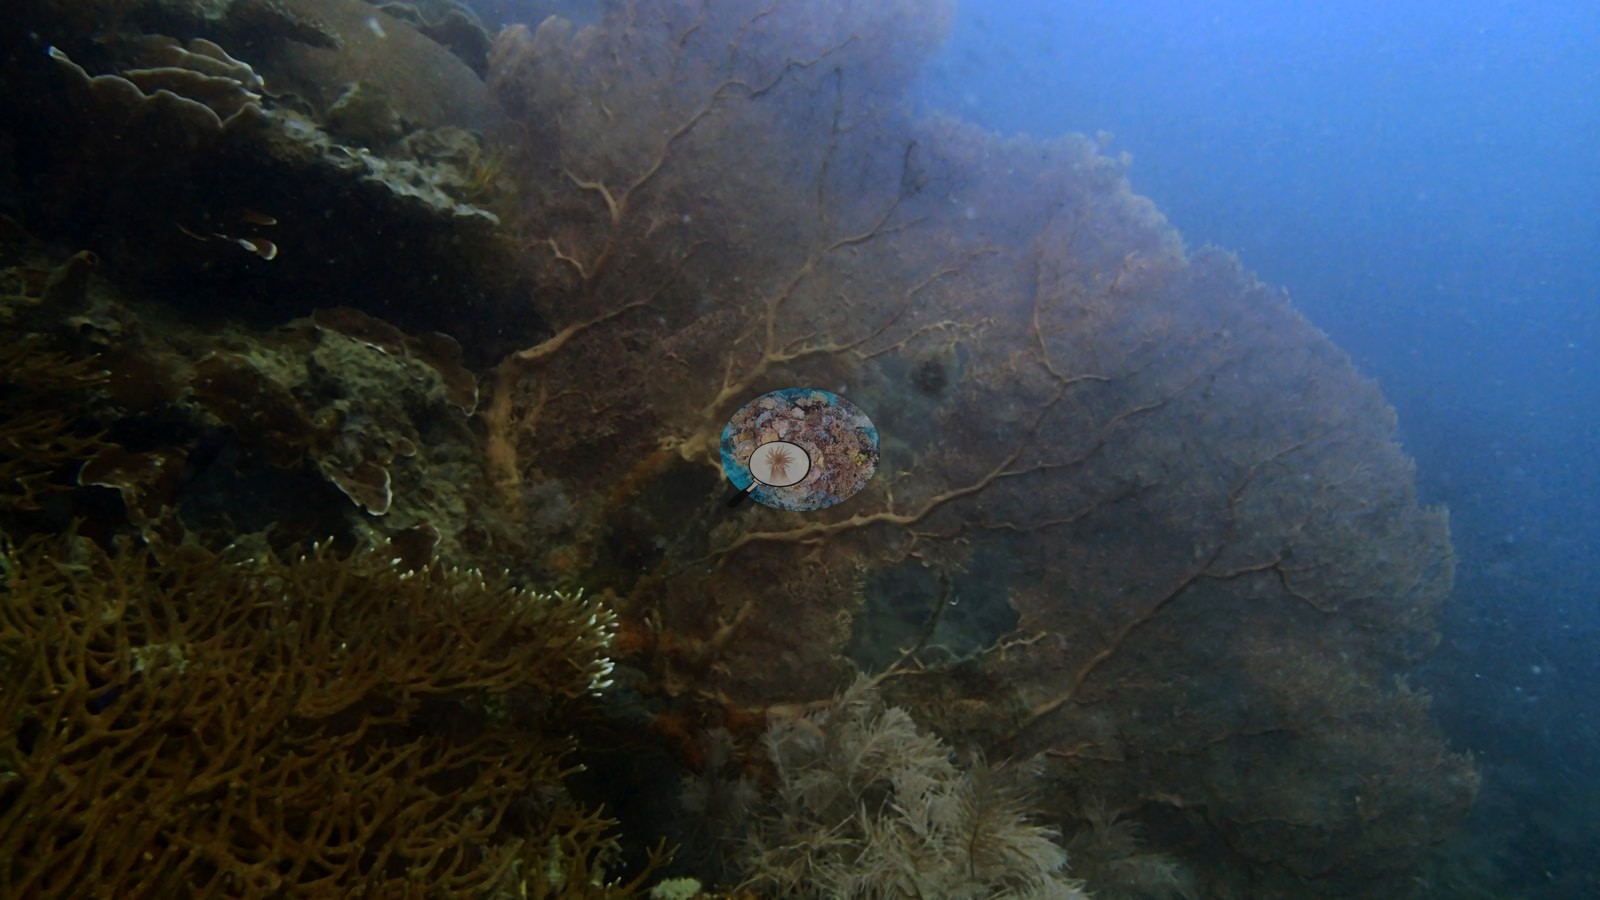
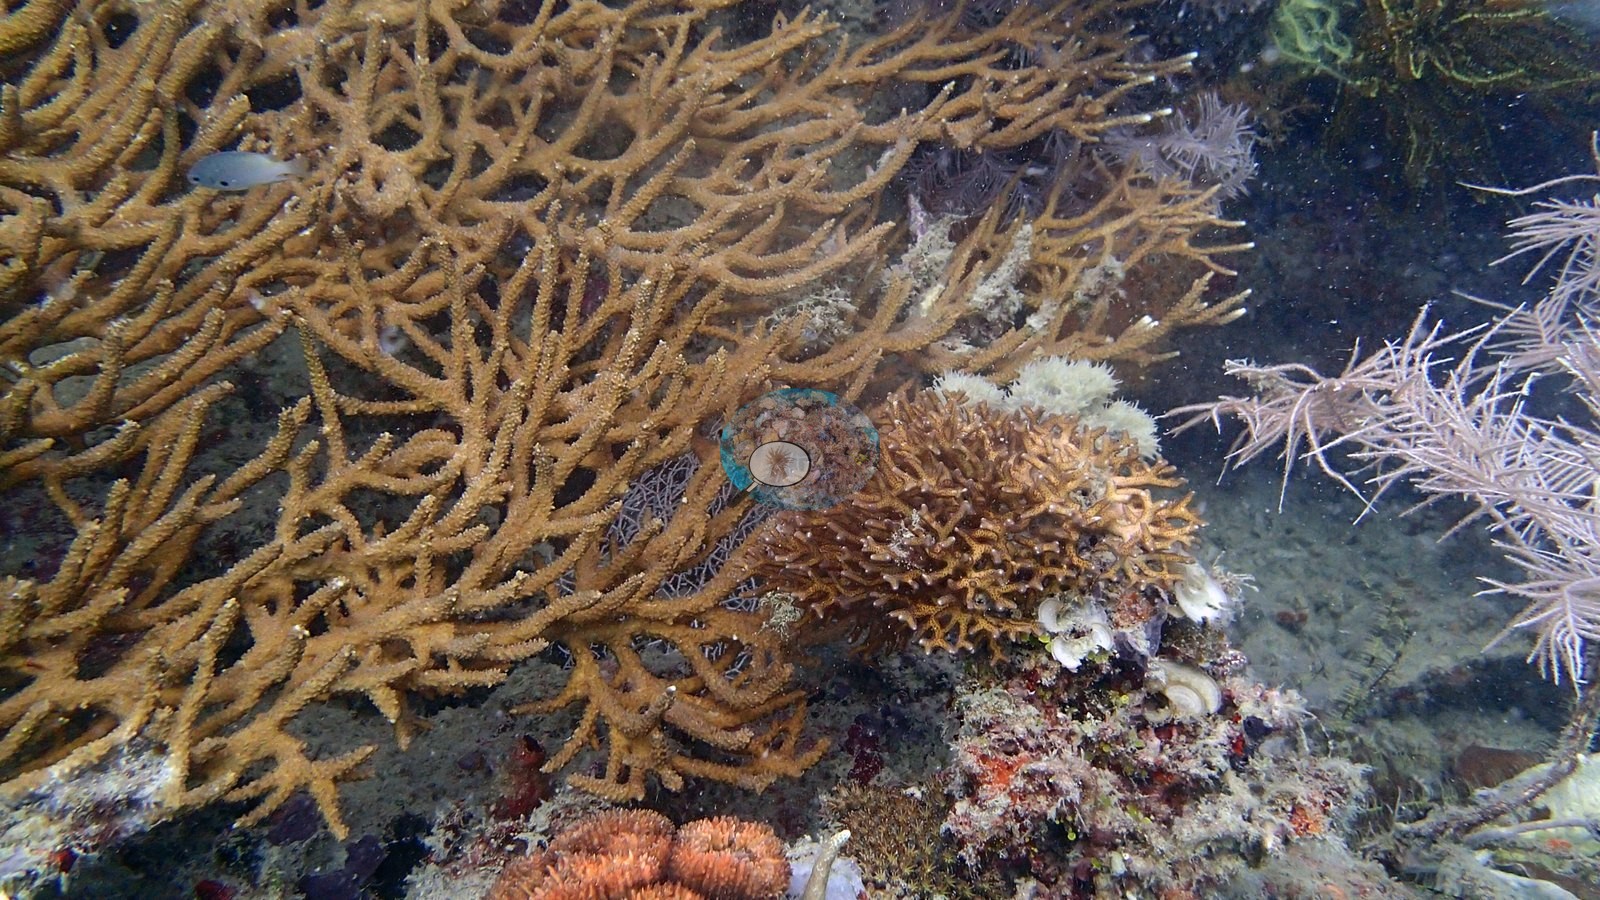
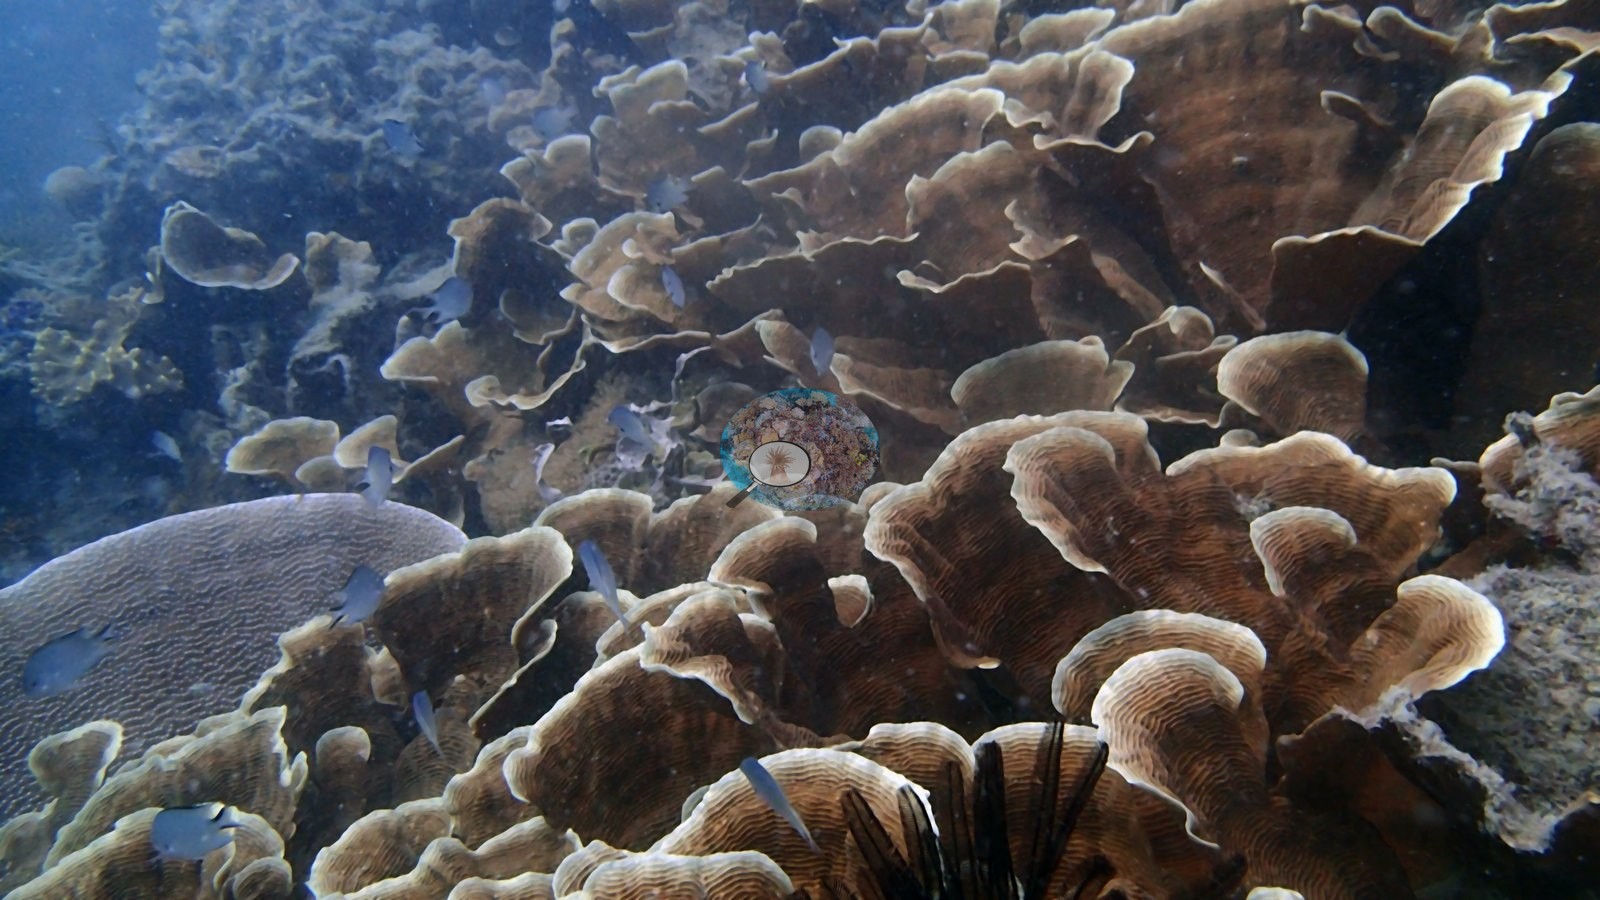
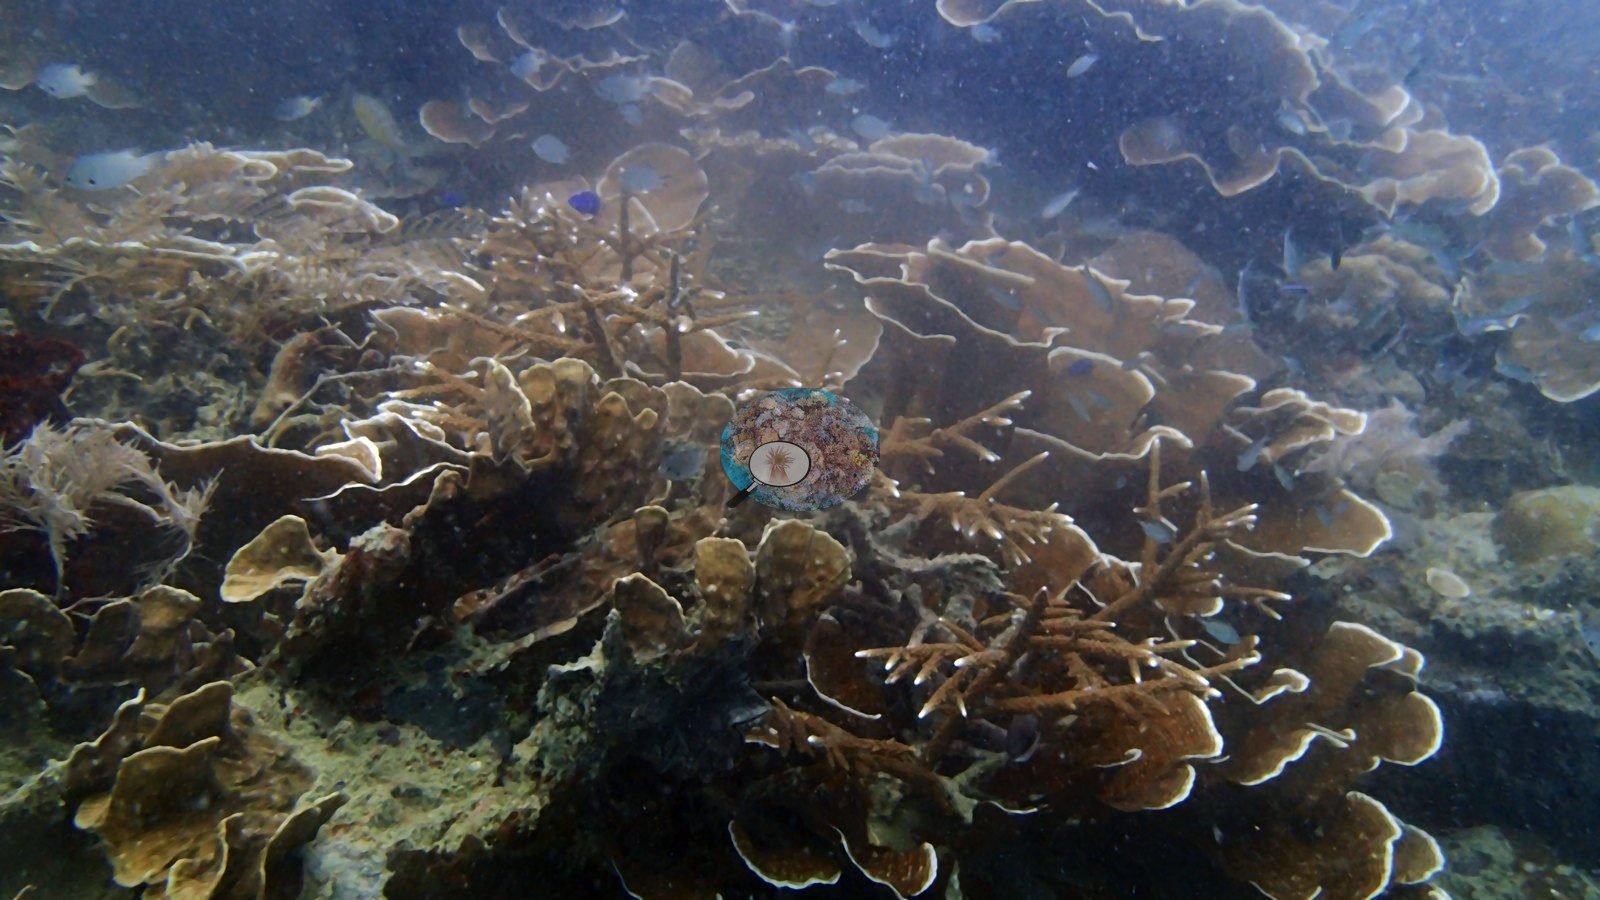
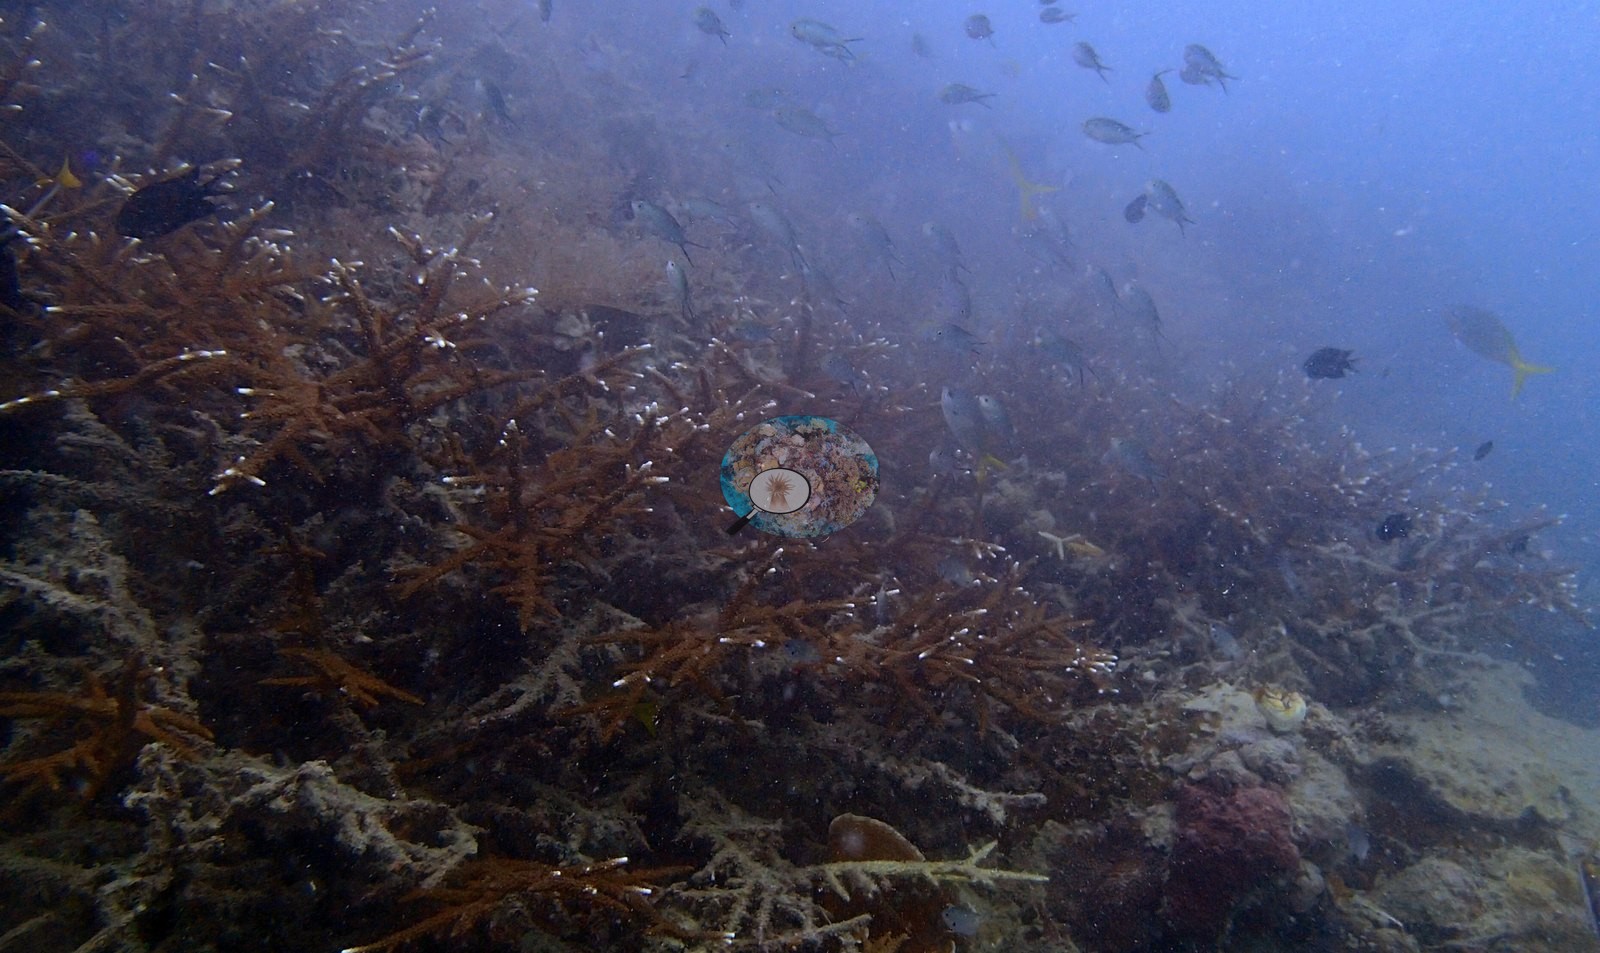
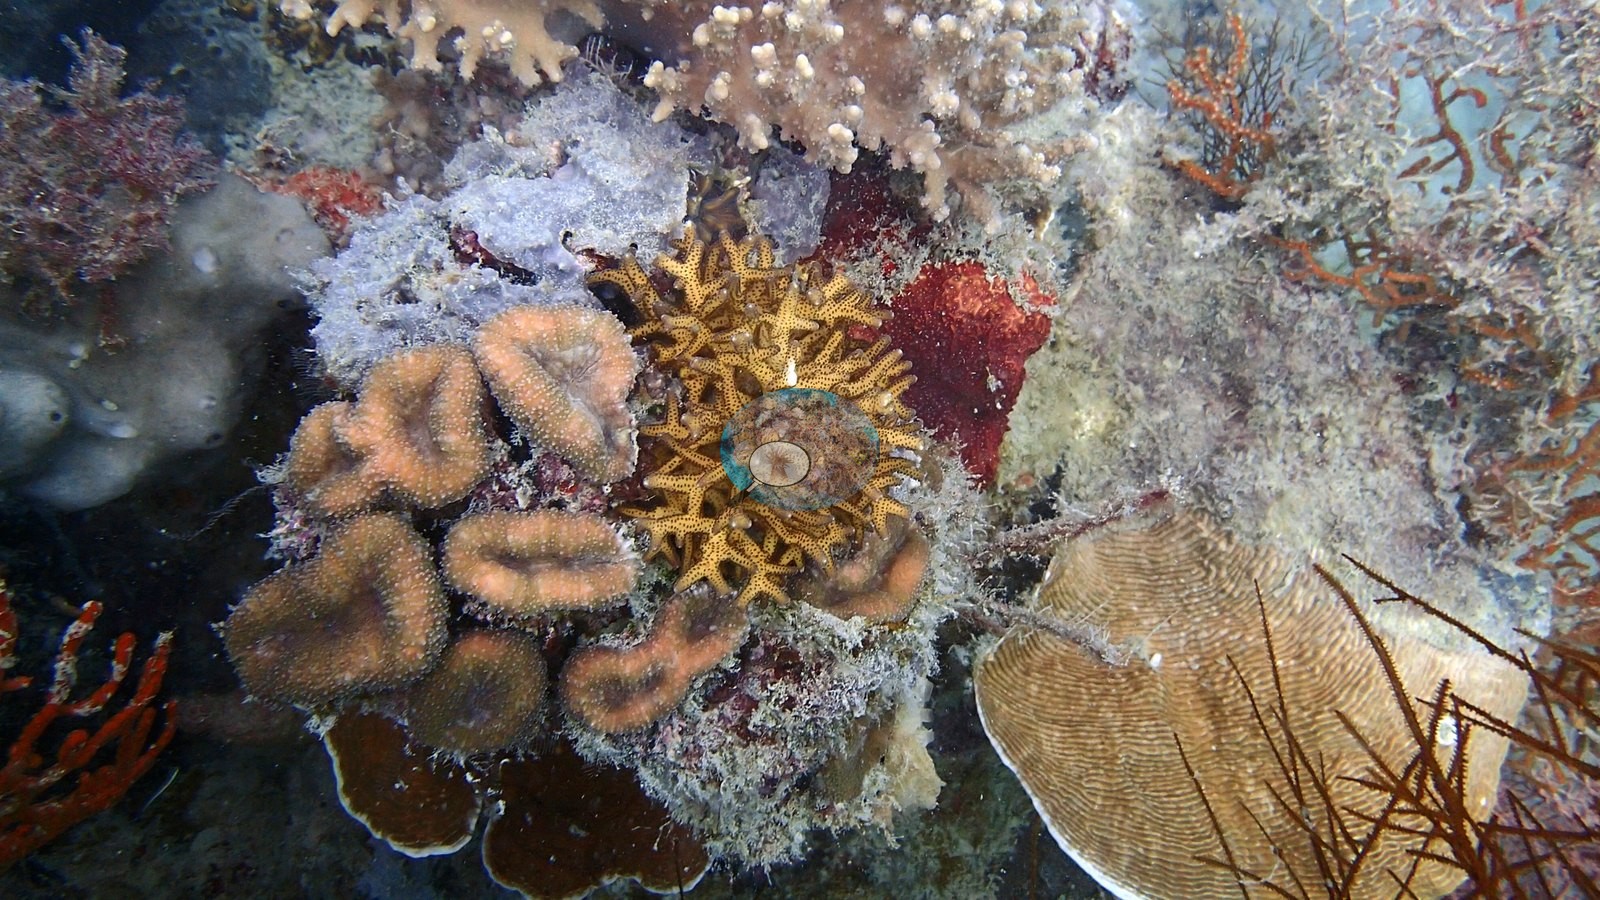
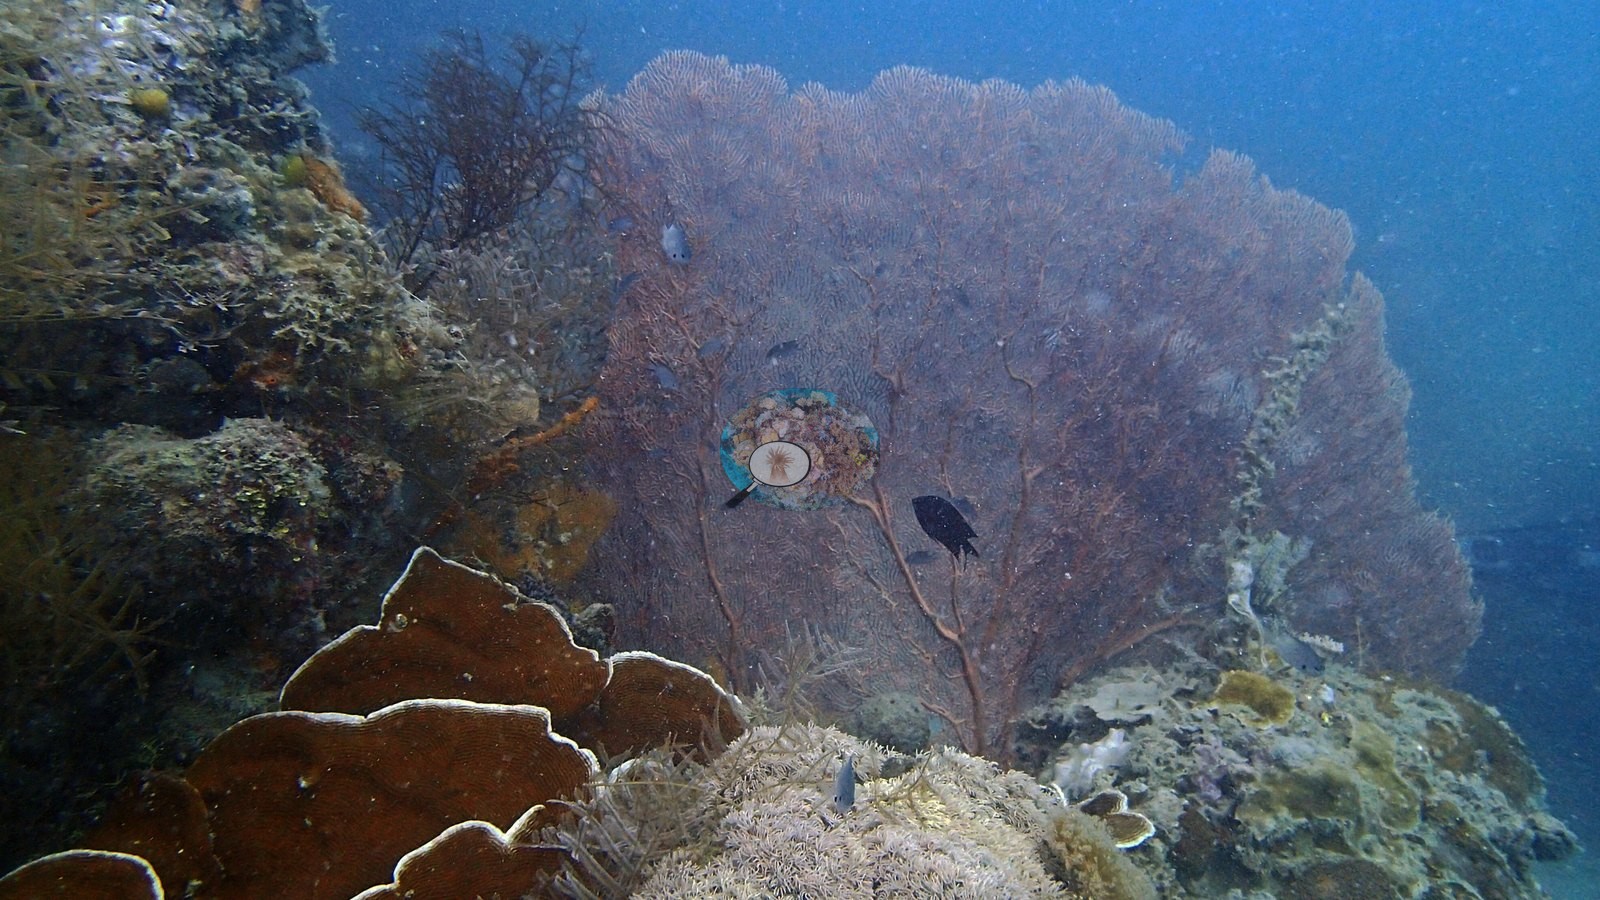
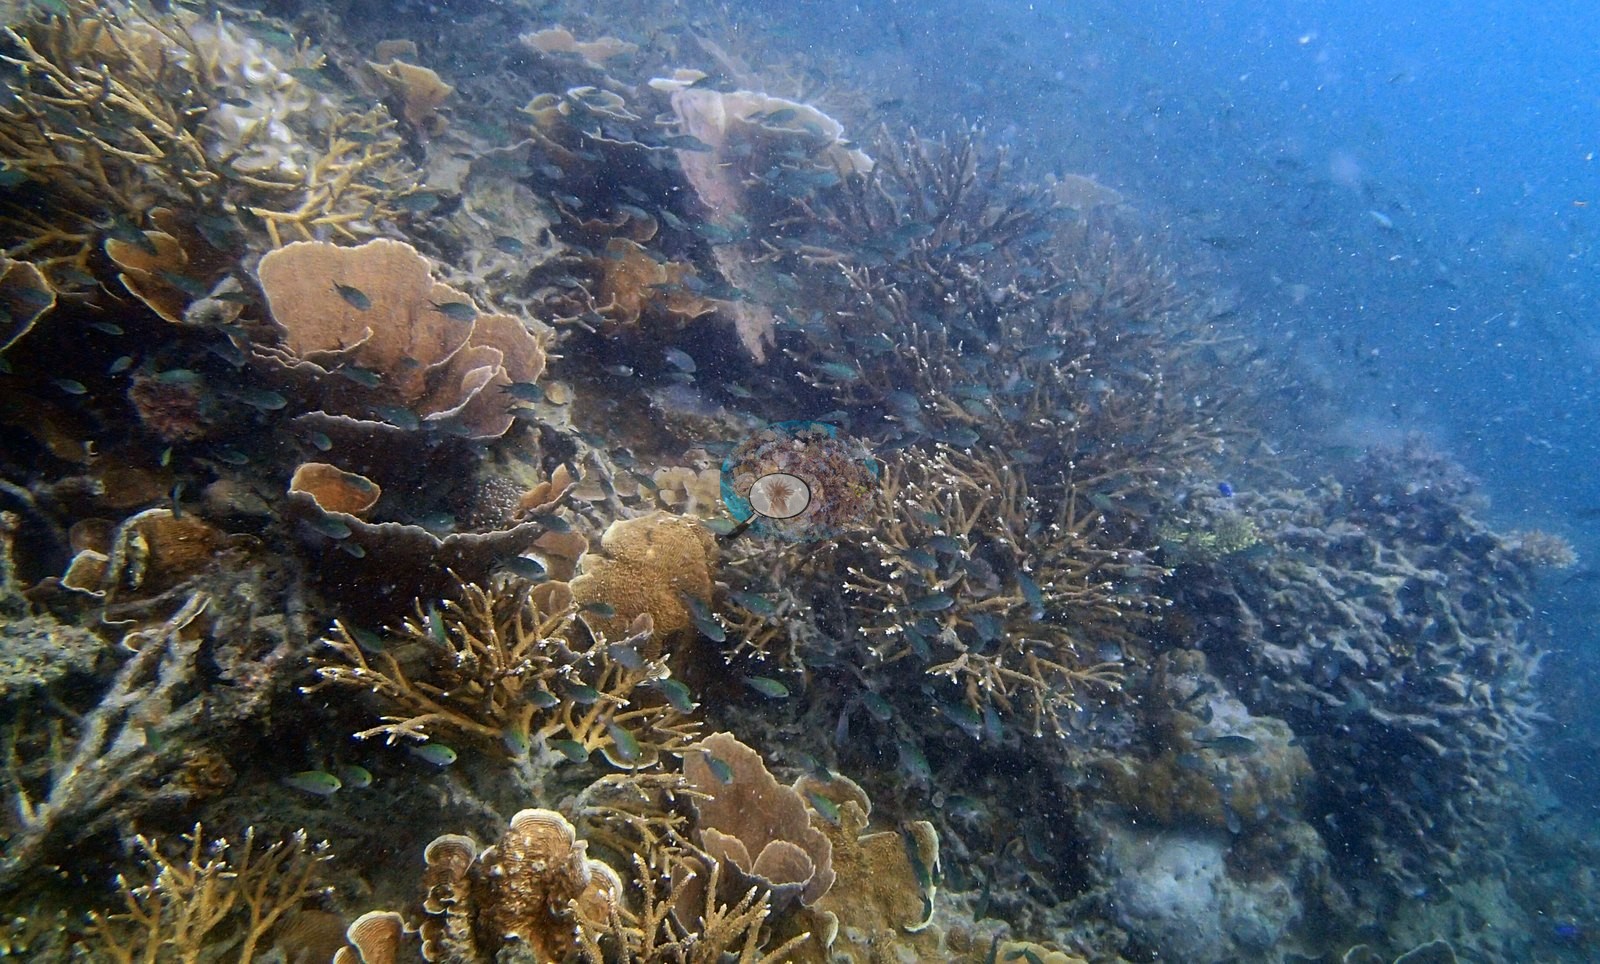
Anderson named three corals in his own filenames - Galaxea, Seriatopora, and Pocillopora acuta - an unusually specific and useful record; his Galaxea frames show colonies carpeting a sediment-veneered pavement. Genus richness is high.
Coral cover
Cover comes from two computer vision methods, neither preferred. DINOv3 point classification gives 35.1% hard coral from all 25 frames and 500 points (95% interval 32.6-37.6). CoralSCOP computer vision gives 25.6% from the 20 frames it scored; five were not returned. The spread is 9.5 points, widest of the three Coron sites, and the honest range is 26-35%. The frames explain it, and in the direction opposite to the wrecks: CoralSCOP scores the continuous plate carpets low - 11.7% on one frame, 12.8% on another, where DINOv3 reads 78.5% and 69.7% - because an unbroken sheet of plates offers a segmenter no colony edges, while it scores discrete objects high: 32.0% on a gorgonian sea fan, which is not stony coral. The two models fail differently. CoralSCOP computer vision reads high on low-cover reefs - a median=1.68x a co-located Reef Check diver survey, 4.6x at worst - but here it reads low, on high continuous cover. DINOv3 is strong in-domain (6-class macro-F1 0.62, hard coral recall 0.82) but collapses off-domain: cross-domain point accuracy 0.17-0.25, ceiling near 35-50% - and its 35.1% sits at that ceiling, so it may be a floor, not a value. Coral cover: 31% — photo-derived, and the two methods differ by 9.2 pp (35% vs 26%). This site's figure is the mean of two independent computer vision passes over Anderson's own frames: a DINOv3 calibrated point classifier reads 35.1% and a CoralSCOP computer vision reads 25.6%, a spread of 9.5 percentage points. The map publishes the mean so sites can be sorted against one another, but the honest statement of what is known here is the 26–35% range: the two products have different denominators and should not be treated as one measurement. Anderson is not done searching for a better coral-cover model than CoralSCOP and DINOv3, and this figure will be recalculated the moment he finds one.
Stressors
The reef reads healthy with no site-wide bleaching signal, though four frames carry localized white: a stark-white branch cluster, a pale lesion on one plate, two white pavement patches, and one bare Acropora skeleton. No crown-of-thorns starfish (COTS) or other corallivores evident.
Fish and other fauna
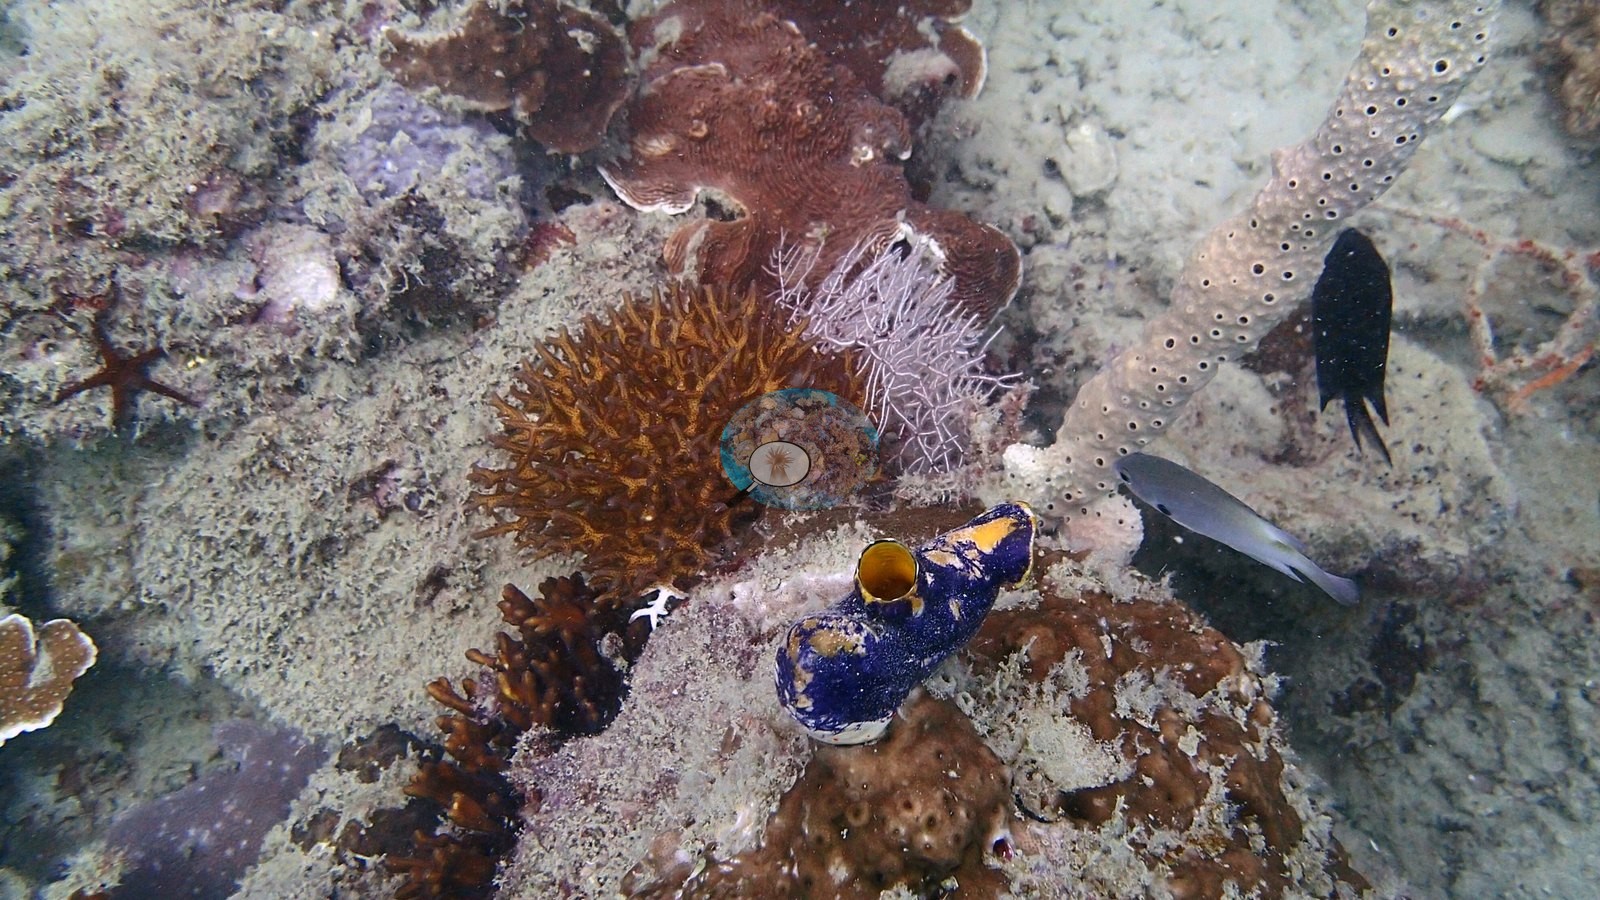
The blue and yellow animal logged as a chromodorid nudibranch reads at this resolution as a Polycarpa aurata ascidian - blue body, orange-yellow siphon rims - and is flagged for a closer check; a spotted synaptid sea cucumber shares the frame (e.g., Image 3).
Comparisons with other data
No independent survey was made at this exact site; the nearest ones are listed in the table below.
Dive record
The third dive of 27 January 2017 and the only true reef of the Coron day - shallowest of the three at around 15 m, and the one with a real benthic signal; all 25 available frames were reviewed.
CV model comparison
More info
As of September 2026 no computer-vision method estimates coral cover accurately on new images, so treat this as indicative rather than a measurement; it is revised as the methods improve.More info
The published figure is the mean of the two methods.| Method | Hard-coral cover (%) |
|---|---|
| In-house DINOv3 | 35.1 |
| CoralSCOP | 25.9 |
| Mean (± SD) | 30.5 ± 6.5 |
| Range | 25.9–35.1 |
Mean ± SD and range are across the computer-vision methods shown.
Independent surveys nearby
 Dr. Coral (CRD)
Within 5 km, 3 independent survey stations recorded hard coral cover in 7 surveys between 2004 and 2015. Of the 2 stations surveyed in more than one year, 2 declined between their first and latest surveys. The longest record, CYC East Reef (Reef Check, 3.77 km away), went from 73% (best patch) in 2013 to 34% in 2015. The most recent nearby survey is from 2015, so these values predate recent heat stress. This site's own estimate (31%) sits within the range of these surveys (28–66%, excluding 1 best-patch value above 70% that is not a site mean); the methods differ, so the comparison is context, not a like-for-like test.
Collected by other programs using different methods (Reef Check uses point-intercept transects), so these are context for the figures above, not a like-for-like comparison. Where a station was surveyed more than once the range is shown. Station names are not dive-site names. Values marked best patch exceed 70%: surveyors usually chose the richest area, so they are not site means.
| Agency | Site / location | Date | Hard coral cover (%) | Distance | Link |
|---|---|---|---|---|---|
| Reef Check | Siete Pecados Islands | 2004 | 46% | 2.99 km | — |
| Reef Check | CYC East Reef | 2013–2015 | 34–73% (3 surveys) best patch | 3.77 km | — |
| Reef Check | CYC West Reef | 2013–2015 | 28–66% (3 surveys) | 4.16 km | — |
Data & links
All images from Coral Reef Diagnostics. Data are from Coral Reef Diagnostics and the organizations named in the data-sources table above.
© Coral Reef Diagnostics.